Article

Chilling and Heat Accumulation of Fruit and Nut Trees and Flower Bud Vulnerability to Early Spring Low Temperatures in New Mexico: Meteorological Approach

1
Department of Plant and Environmental Sciences, Agricultural Science Center at Farmington, New Mexico State University, P.O. Box 1018, Farmington, NM 87499, USA
2
Biological and Agricultural Engineering Department, Kansas State University, 1016 Seaton Hall 920 N. 17th St., Manhattan, KS 66506, USA
3
Department of Plant and Environmental Science, Agricultural Science Center at Tucumcari, New Mexico State University, Tucumcari, NM 88401, USA
4
Biological Systems Engineering Department, University of Nebraska-Lincoln, 239 L.W. Chase Hall, P.O. Box 830726, Lincoln, NE 68583, USA
*
Author to whom correspondence should be addressed.
Sustainability 2021, 13(5), 2524; https://0-doi-org.brum.beds.ac.uk/10.3390/su13052524
Submission received: 17 January 2021 / Revised: 19 February 2021 / Accepted: 21 February 2021 / Published: 26 February 2021
(This article belongs to the Special Issue Sustainable Fruit Growing: From Orchard to Table)

Abstract

:
Fruit and nut trees production is an important activity across the southwest United States and this production is greatly impacted by the local climate. Temperature is the main environmental factor influencing the growth and the productivity of the fruit and nut trees as it affects the trees’ physiology and the vulnerability of flower bud, flowers, and young fruit and nut to the low temperatures or spring frost. The objective of the present study is to estimate the chilling and heat accumulation of fruit and nut trees across New Mexico. Three study sites as Fabian Garcia, Los Lunas, and Farmington were considered and climate variables were collected at hourly time step. The Utah model and the Dynamic model were used to estimate the accumulated chilling while the Forcing model was used for the heat accumulation. The possible fruit and nut trees endodormancy and ecodormancy periods were also determined at the study sites. The results obtained chilling hours of 715 ± 86.60 h at Fabian Garcia, 729.53 ± 41.71 h at Los Lunas, and 828.95 ± 83.73 h at Farmington using the Utah model. The accumulated chill portions during trees’ endodormancy was 3.12 ± 3.05 CP at Fabian Garcia, 42.23 ± 5.08 CP at Los Lunas, and 56.14 ± 1.84 CP at Farmington. The accumulated heat was 8735.52 ± 1650.91 GDH at Fabian Garcia, 7695.43 ± 212.90 GDH at Los Lunas, and 5984.69 ± 2353.20 GDH at Farmington. The fruit and nut trees are at no risk of bud flowers vulnerability at Fabian Garcia while they are under high risk of bud flowers and or young fruit and nut vulnerability to low temperatures early spring as hourly temperature can still drop below 0 °C in April at the end of ecodormancy and flower blooming and young fruits and nuts development stage at Los Lunas and Farmington. Severe weather, especially frost conditions during winter and early spring, can be a significant threat to sustainable nut and fruit production in the northern New Mexico while high chilling requirement fruit and nut trees might not meet chill requirements in the southern New Mexico.

1. Introduction

Temperate fruit trees production is an important activity which heavily depends on the prevailing climatic conditions in the production area and air temperature is the main factor controlling fruit trees phenology [1]. Under cold winter conditions, the temperate plants go dormant to protect the fragile growing tissue from frost and preserve accumulated nutrients. When chilling requirements are not met for a fruit tree, crop growth, bud initiation, flowering and fruit set are delayed in the following growing season [2,3]. On the other hand, increasing air temperature may accelerate winter chill accumulation and advances crop growth and flowering dates [4,5,6,7]. In contrast, spring phenology of fruit trees is delayed by warm winter [8,9,10,11]. Plants are affected by the winter temperature causing chilling effects and spring temperature causing forcing effects and these two mechanisms are determinant to spring phenology of the fruit trees [12]. Each fruit tree has accumulated chilling requirements and goes dormant by releasing winter endodormancy and ecodormancy [13,14]. Endodormancy is initiated by low temperature, whereas ecodormancy is driven by heat [15,16]. There is also accumulated heat requirement for the fruit trees for plant growth, leaf unfolding, bud burst initiation, and flowering [17]. The chilling and heat requirements are considered as the driving factors in breaking endodormancy and ecodormancy [16]. It is widely adopted that chilling period covers 1 November–30 April [12,18]. However, Guo et al. [19] found that chestnut chilling period covered from 14 September to 24 March, while the forcing period started on 4 January and ended on 23 May in Beijing, China. On the 1963–2008 period average, the forcing period therefore overlapped with the chilling period indicating that heat accumulation started when only about 50% of the chilling requirement had been fulfilled [19]. Guo et al. [19] reported that for jujube, the forcing phase begins when 55% of chilling requirements were fulfilled. While the occurrence of freezing conditions induces variation in a possible chill effectiveness in Beijing [19], that variation was also reported by Luedeling and Gassner [20] and Luedeling et al. [21] in studies on walnuts in California where temperatures rarely drop below 0 °C.
The chilling and heat requirements of the fruit trees have been quantified and estimated by horticulturist using modeling tools: Chilling Hours Model [22], the Utah Model [23], the Dynamic Model [24,25], Richardson-based Models, the North Carolina Model [26], the Melo-Abreu Model [27], the Positive Utah model [28] and the Low Chill Model [29], the Modified Utah Model (MUM) [30]. The North Carolina Model is an adaptation of the Utah model with adjusted temperature ranges for apple trees. The Melo-Abreu et al. [27] model is the generalization and simplification of the Utah Model which was applied to olive trees with good performance. Among these models, the Chilling Hours Model, the Utah Model, and the Dynamic Model are worldwide used with reasonably good performance [2,4,16,31,32,33,34,35,36,37,38,39,40,41,42,43,44]. These models showed different performance across the globe and the responses also vary with years, observation sites, and the growing regions [39,40]. Among the different chilling models, the dynamic model appears the most robust chilling model [20,34,36,41,45]. Heat requirement of the trees is modelled by the Forcing model also called the Growing Degree Hour model [46] which assumes heat accumulation starting when air temperature falls between a base temperature and the critical temperature with a maximum heat accumulation at the optimum temperature. The base temperature of a plant species is the minimum threshold temperature at which plant growth starts and the critical temperature is the upper threshold temperature at which all crop physiological activities cease [47].
Chill requirements vary with tree species. In Alabama, chill requirements are 800–1100 for standard apple, 400–750 for Japanese plum, about 1000 for cherry, and 50–800 for blackberry [48]. Luedeling et al. [43] found chill and heat requirements for cherry trees to be 68.6 ± 5.7 chill portions (CP) equivalent to 1375  ±  178 chilling hours or 1410  ±  238 Utah chill units and a heat requirement of 3473  ±  1236 growing degree hours in Bonn, Germany. Chilling and heat requirements were 79.8 ± 5.3 CP and 13,466 ± 1918 GDH for chestnut bloom in Beijing, 104.2 ± 8.9 CP and 2698 ± 1183 GDH for cherry bloom in Germany, and 37.5 ± 5.0 CP and 11,245 ± 1697 GDH for walnut leaf emergence in California [43], respectively. Chill portion and heat requirements of cherry cultivars varied from 30.4 to 57.6 CP and from 7326 to 9450 GDH, in Spain, respectively, [49]. Chilling requirements of 15 peach cultivars ranged between 263 and 2123 chill hour (CH), 377 and 1134 chill unit (CU), and 21.3 and 74.8 CP and the heat requirements varied from 4824 to 5506 GDH in Korea for the 1919–2018 period [50]. Local almond cultivars chilling and heat requirements ranged from 3.4 to 15.5 CP and between 3962 and 8873 GDH, respectively, while the corresponding values for foreign cultivars varied from 6.7 to 22.6 CP and from 2894 to 10,504 GDH, respectively, in Tunisia [51].
Fruit and nut trees are a rewarding addition to backyard landscapes beside the medium to large commercial fruit and nut trees fields across New Mexico where the climatic conditions are variable. Different fruit crops are grown over 1206.37 ha and nut trees grown over 20,769.28 ha across New Mexico with the market value of $210.253 million [52]. Fruit and nut trees such as Apricots, plums, apples, cherries, peaches, pears, grapes, persimmons, figs, pecans, pistachios, almonds, jujubes, blueberries, and different berries are produced across New Mexico. The late-blooming and non-uniform varieties with some late flowers have a better chance to produce than uniform and early blooming varieties [53]. Apples (466.60 ha), grapes (518 ha), peaches (62 ha), apricots (41.68 ha), pears (40.47 ha), and sweet cherries (33.18 ha) are the main fruit trees while pecan trees are the main nut trees grown in New Mexico [52]. The State of New Mexico is characterized by recurrent occurring late spring frosts across the state, injuring the flowers and young fruits of early flowering species [53]. The recurrent question growers ask the extension agents is related to fruit and nut tree species and cultivars choice with reference to their local environmental or climatic conditions. While the answer is not straightforward, very limited information exists on the chill and heat requirements of different fruit and nut trees across the main agroecological zone in New Mexico. Therefore, it is critical to estimate the chill portions and chill units in different parts of the state to assist growers with tree species and cultivars selection for each location for sustainable and profitable fruit production. The objective of this study is to help growers in decision-making regarding the fruit trees choice depending on their chill and heat requirement at different parts of the state of New Mexico, USA.

2. Materials and Methods

2.1. Study Sites and Data Collection

This study is focused on the State of New Mexico. Three locations were chosen as Fabian Garcia (32.28°, −106.77°, elevation 1186.0 m), Los Lunas (34.77°, −106.76°, elevation 1476.0 m), and Farmington (36.69°, −108.31°, elevation 1720.0 m) and are situated in the southern, central, and northwestern New Mexico, respectively, and where fruit and nut production is the predominant agricultural activity. New Mexico is characterized by a semiarid climate at the eastern and southern regions while the central, the northern, and western regions are characterized by arid climate. All climatic variables were monitored on an hourly basis at each site using an automated weather station. For the present study, only hourly and daily average temperatures were used.

2.2. Data Management

In this study, the following calendar was adopted: for the fruit trees across New Mexico. The dormancy season is assumed to start on 1 July and ends on 30 June of the following year. The period of July 2015 to June 2020 at Fabian Garcia, July 2017 to June 2020 at Los Lunas, and July 2015 to June 2020 at Farmington were considered under the present study due to data availability with no gap or periodic missing data. The time series data were checked for quality control following the methodology described by Allen et al. [54] and the abnormal data point were removed before the analysis.

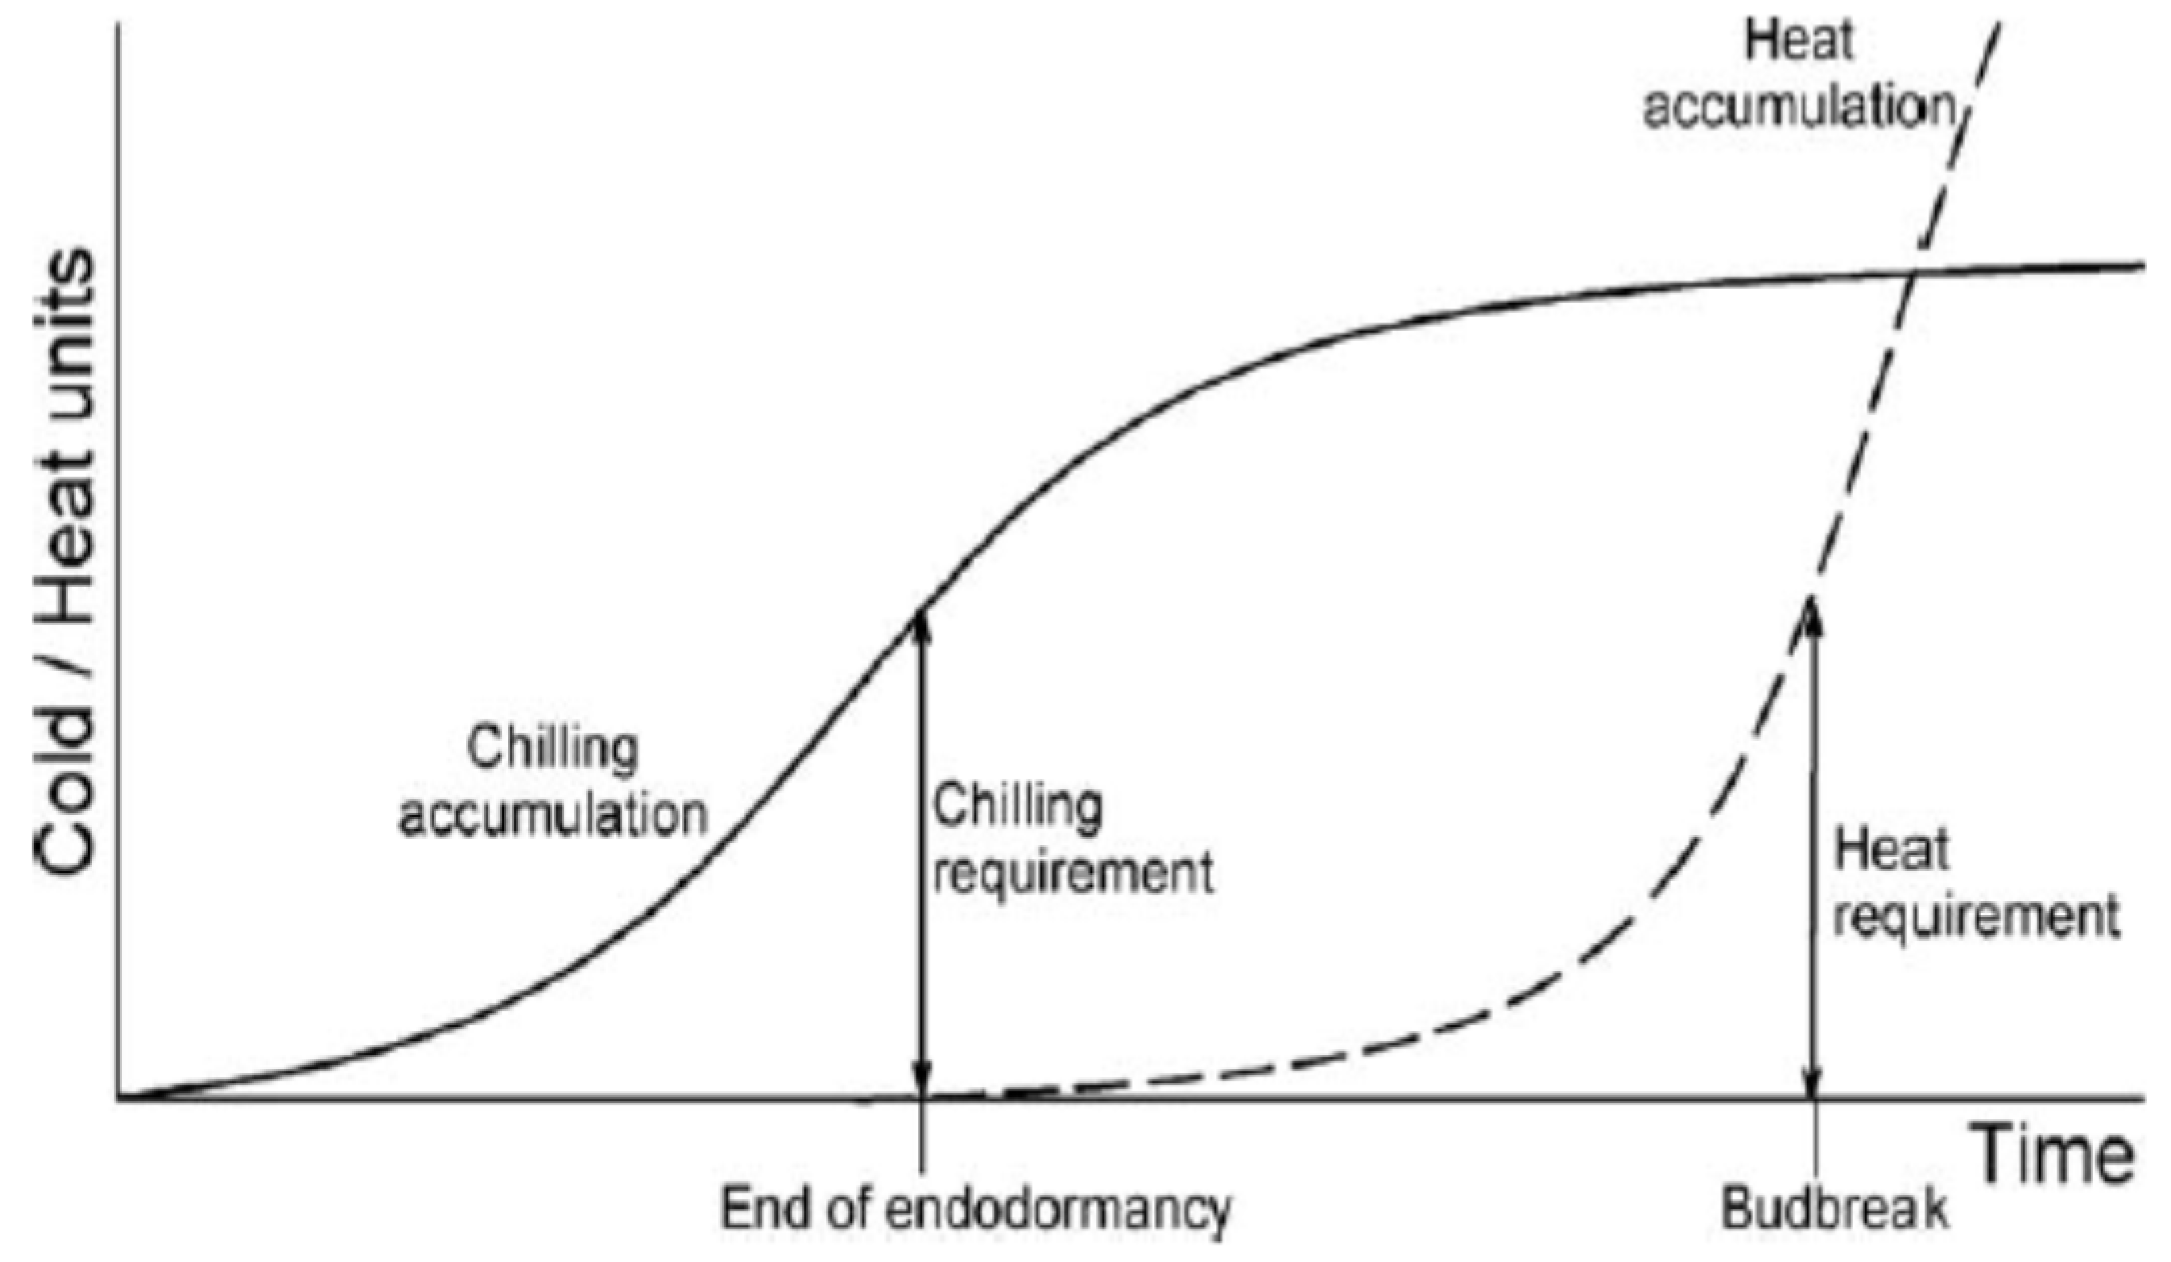
2.3. Estimation of the Heat and Chilling Accumulation: Heat and Chilling Model

Among the numerous models developed and evaluated for chill and heat accumulation by fruit trees, the Forcing model [46], the Utah Model [23], and the Dynamic Model [24,25] are the most used across the globe. The Forcing model revealed to be accurate with high precision. Similarly, the Utah model and the Dynamic model are the most used and the most precise chill accumulation models. For the present study we consider the three models to estimate the potential heat and chill accumulation at the three research stations. The chilling requirement was calculated each year as the sum of hourly chilling units (CU) from endodormancy onset until the transition from endodormancy to ecodormancy. Similarly, the heat requirement is the sum of the growing degree hours from the onset to the end of the ecodormancy.
  • Forcing model: Growing Degree Hour (GDH) Model
The Forcing model is the Growing Degree Hour (GDH) Model [46]. The GDH Model equivalent to the thermal unit accumulation model assumes heat accumulation when the actual hourly temperature (Ti) is between the fruit trees base temperature (Tb) which is the lowest temperature threshold and the critical temperature (Tc) which is the upper threshold temperature, and the optimum temperature (Tu) at which the maximum heat accumulations occurs. The GDH function is described below:
GDH = { F ( Tu Tb 2 ) ( 1 + cos ( π + π ( Ti Tb ) Tu Tb ) ; Tu   Ti   Tb   F ( Tu Tb ) ( 1 + cos ( π 2 + π ( Ti Tu ) 2 ( Tc Tu ) ) ; Tc Ti Tu 0 ; Ti > Tc   o r   Ti < Tb
F is a plant stress factor that is commonly set to 1, if no particular stress exists. Tb, Tu, and Tc were set to 4, 25, and 36 °C, respectively, as suggested by Anderson et al. [46] for fruit trees.
  • Chilling requirement of fruit trees: The Utah Model [23]
The Utah Model attributes the weighing parameter as function of actual temperature to determine the effectiveness of chilling. The Utah Model introduces the concept of negative chill accumulation and the chilling effectiveness. Thus, the temperature ranging between 0 and 16 °C promotes the breaking rest while all temperature greater than 16 °C accounts for negative chill. The chilling accumulation is effective at 7 °C. The distribution of chill accumulation as function of temperature is presented in Table 1.
  • The dynamic model [24,25]
The dynamic model developed in Israel assumes winter chill accumulation as a result of two-step process: production of intermediate chilling products which are destructible by the high temperatures, and the conversion of the intermediate products into permanent chill portions under moderate temperatures. The chill portions are accumulated and summed throughout winter. The detailed description of the dynamic model with all the used equations is presented in Fishman et al. [24,25], Luedeling et al. [2], Darbyshire et al. [55], and Luedeling and Brown [4].
The chilling portions, chilling hours, and heat requirement were estimated using the diagram presented in Figure 1 while the bud and flowers and or young fruit or nut vulnerability to low temperatures early spring was computed through the frequency of occurrence and or exposure to the below zero degree Celsius and below the killing freezing temperature of −2 °C using the daily average temperature and the hourly temperature from January to the end of April of each year.

3. Results

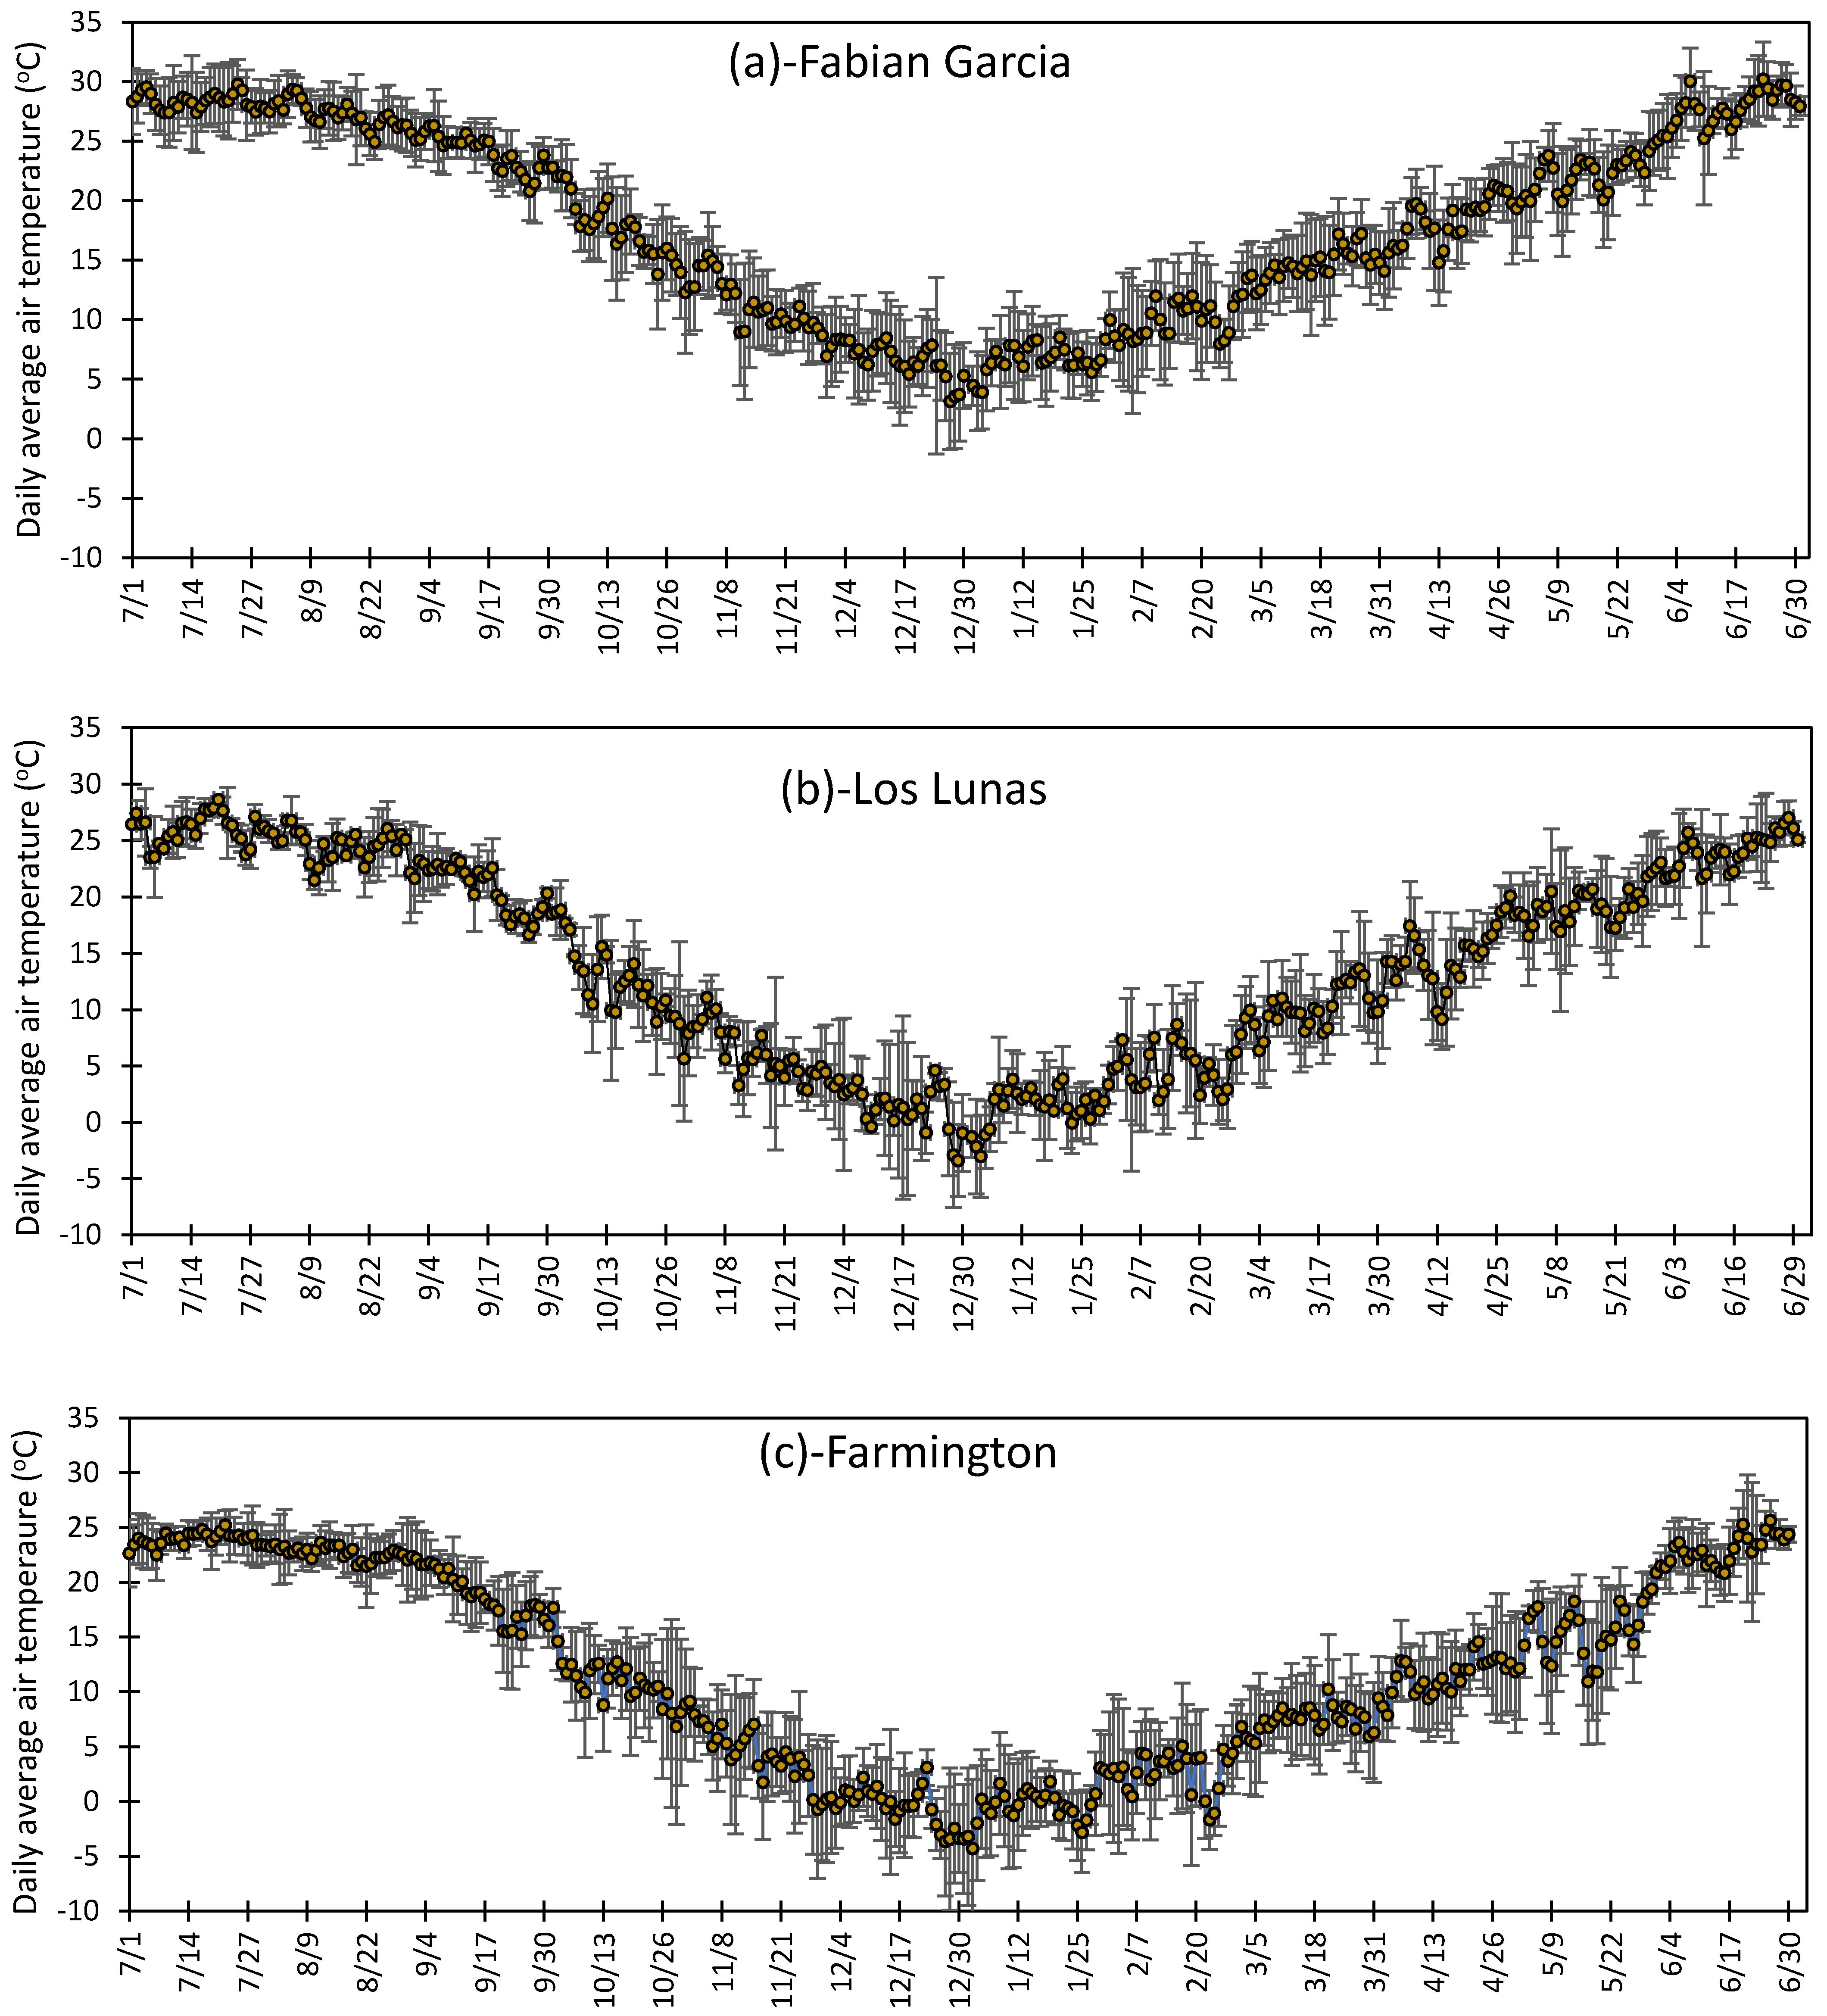
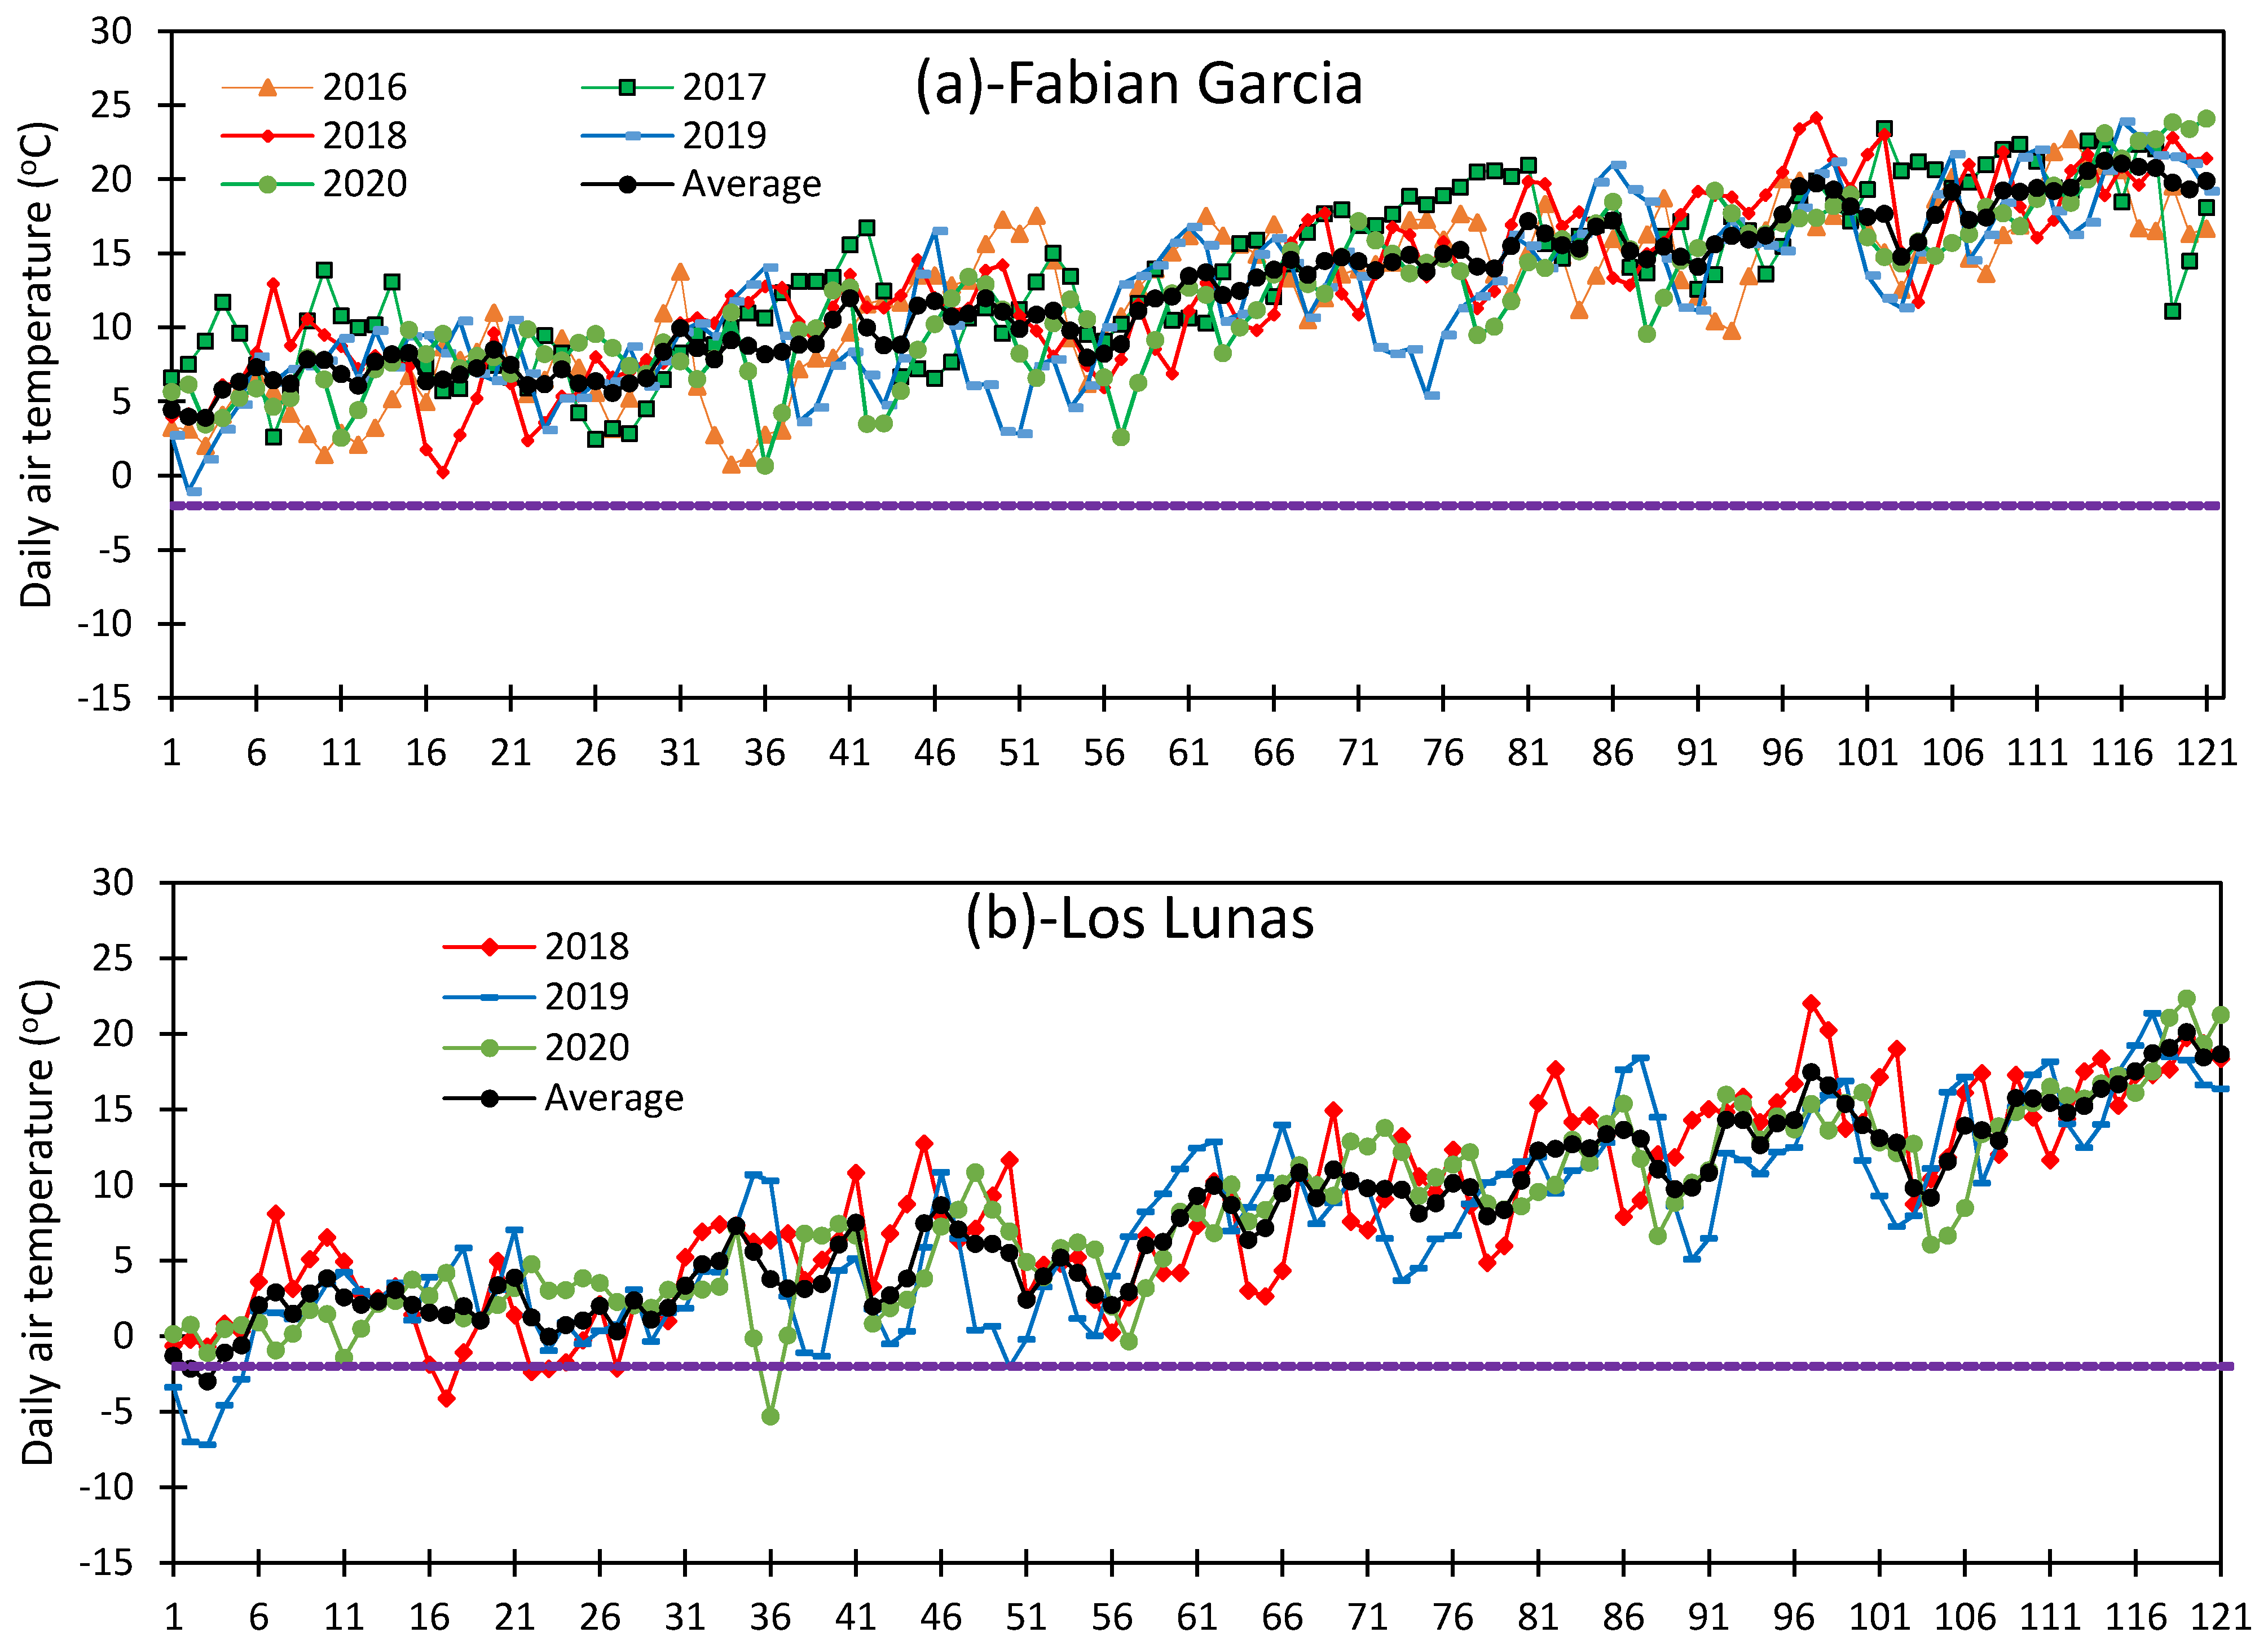
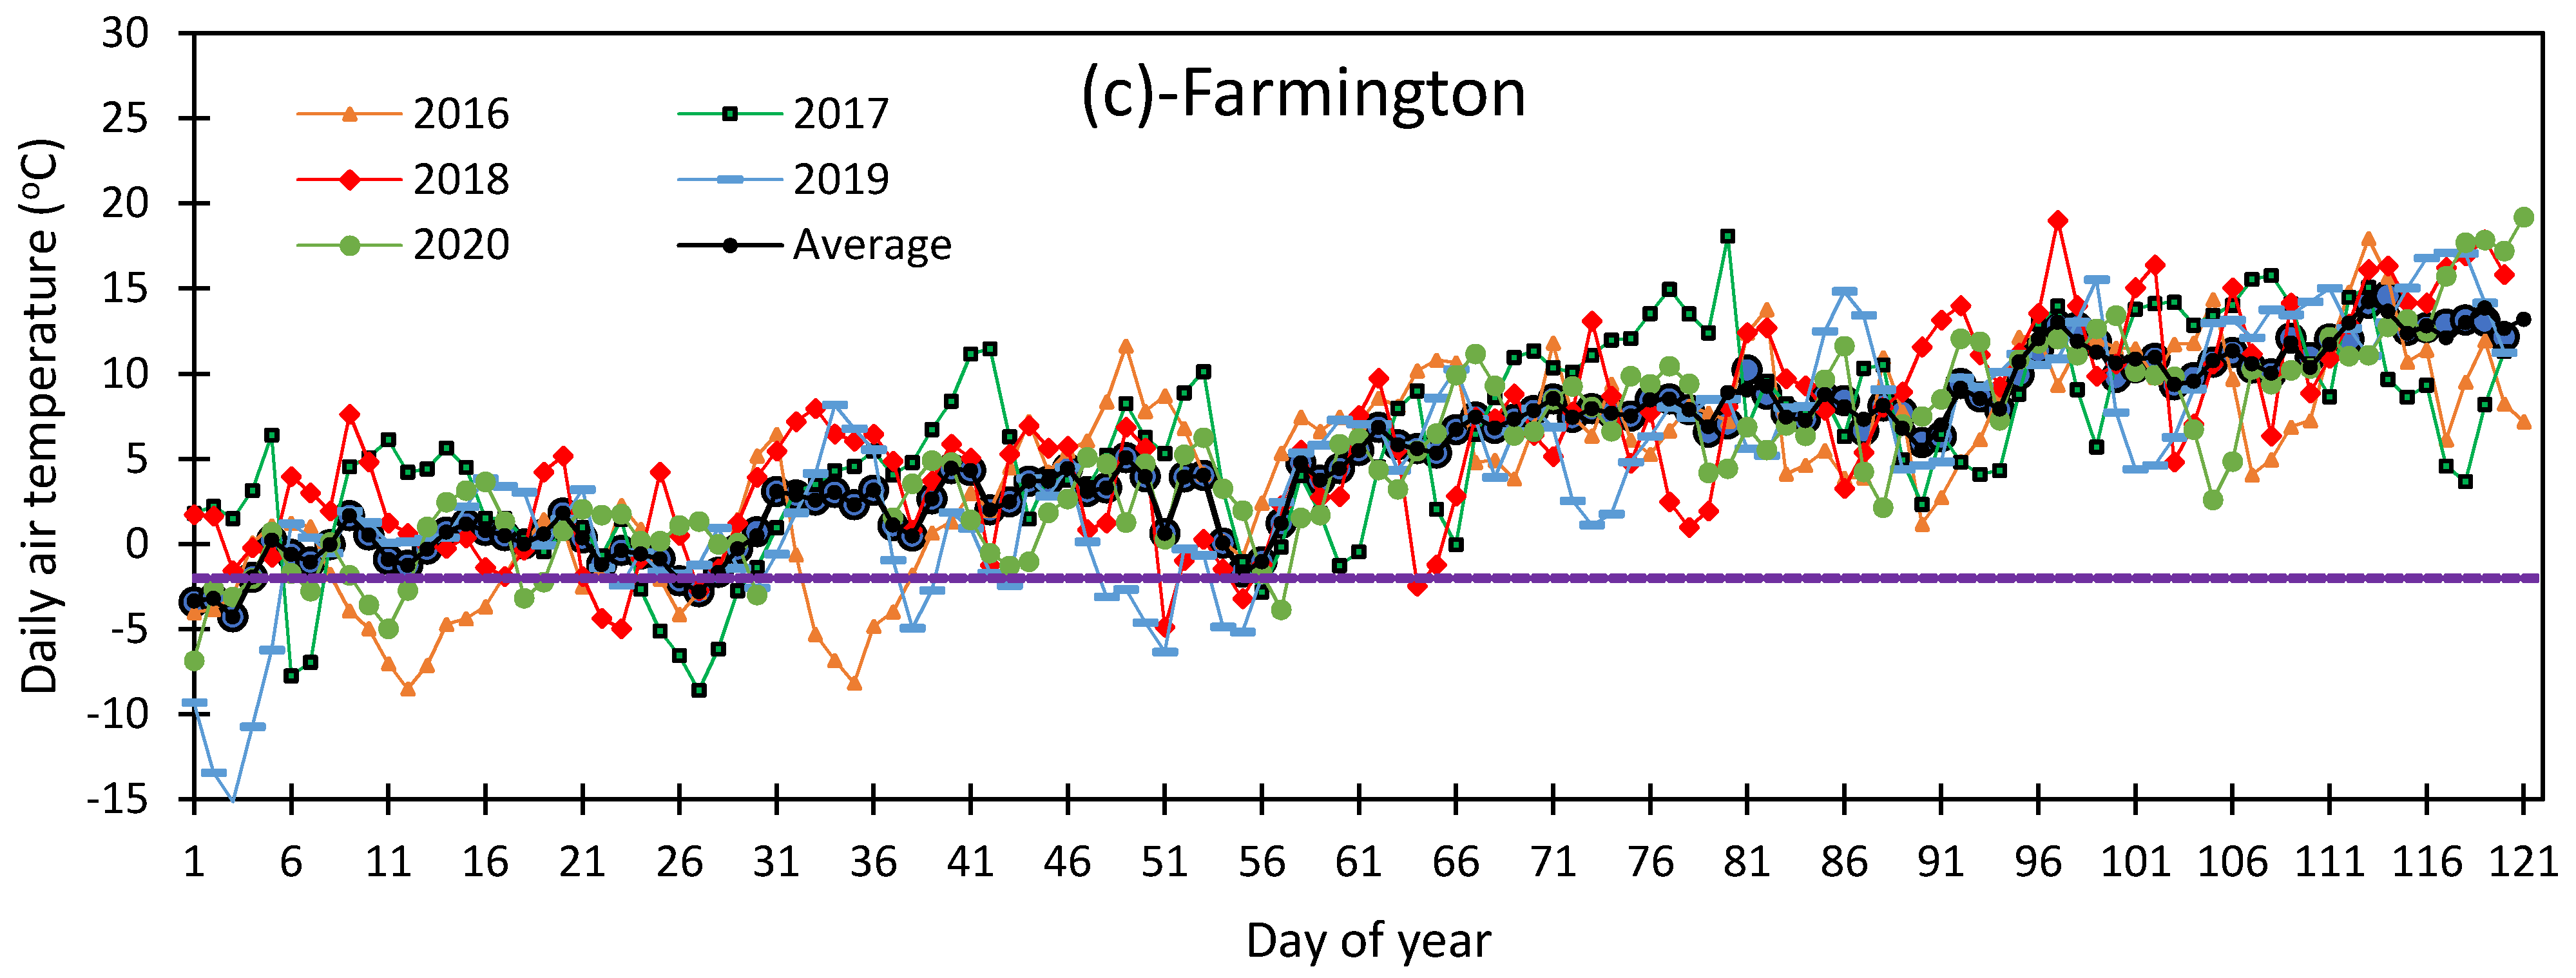
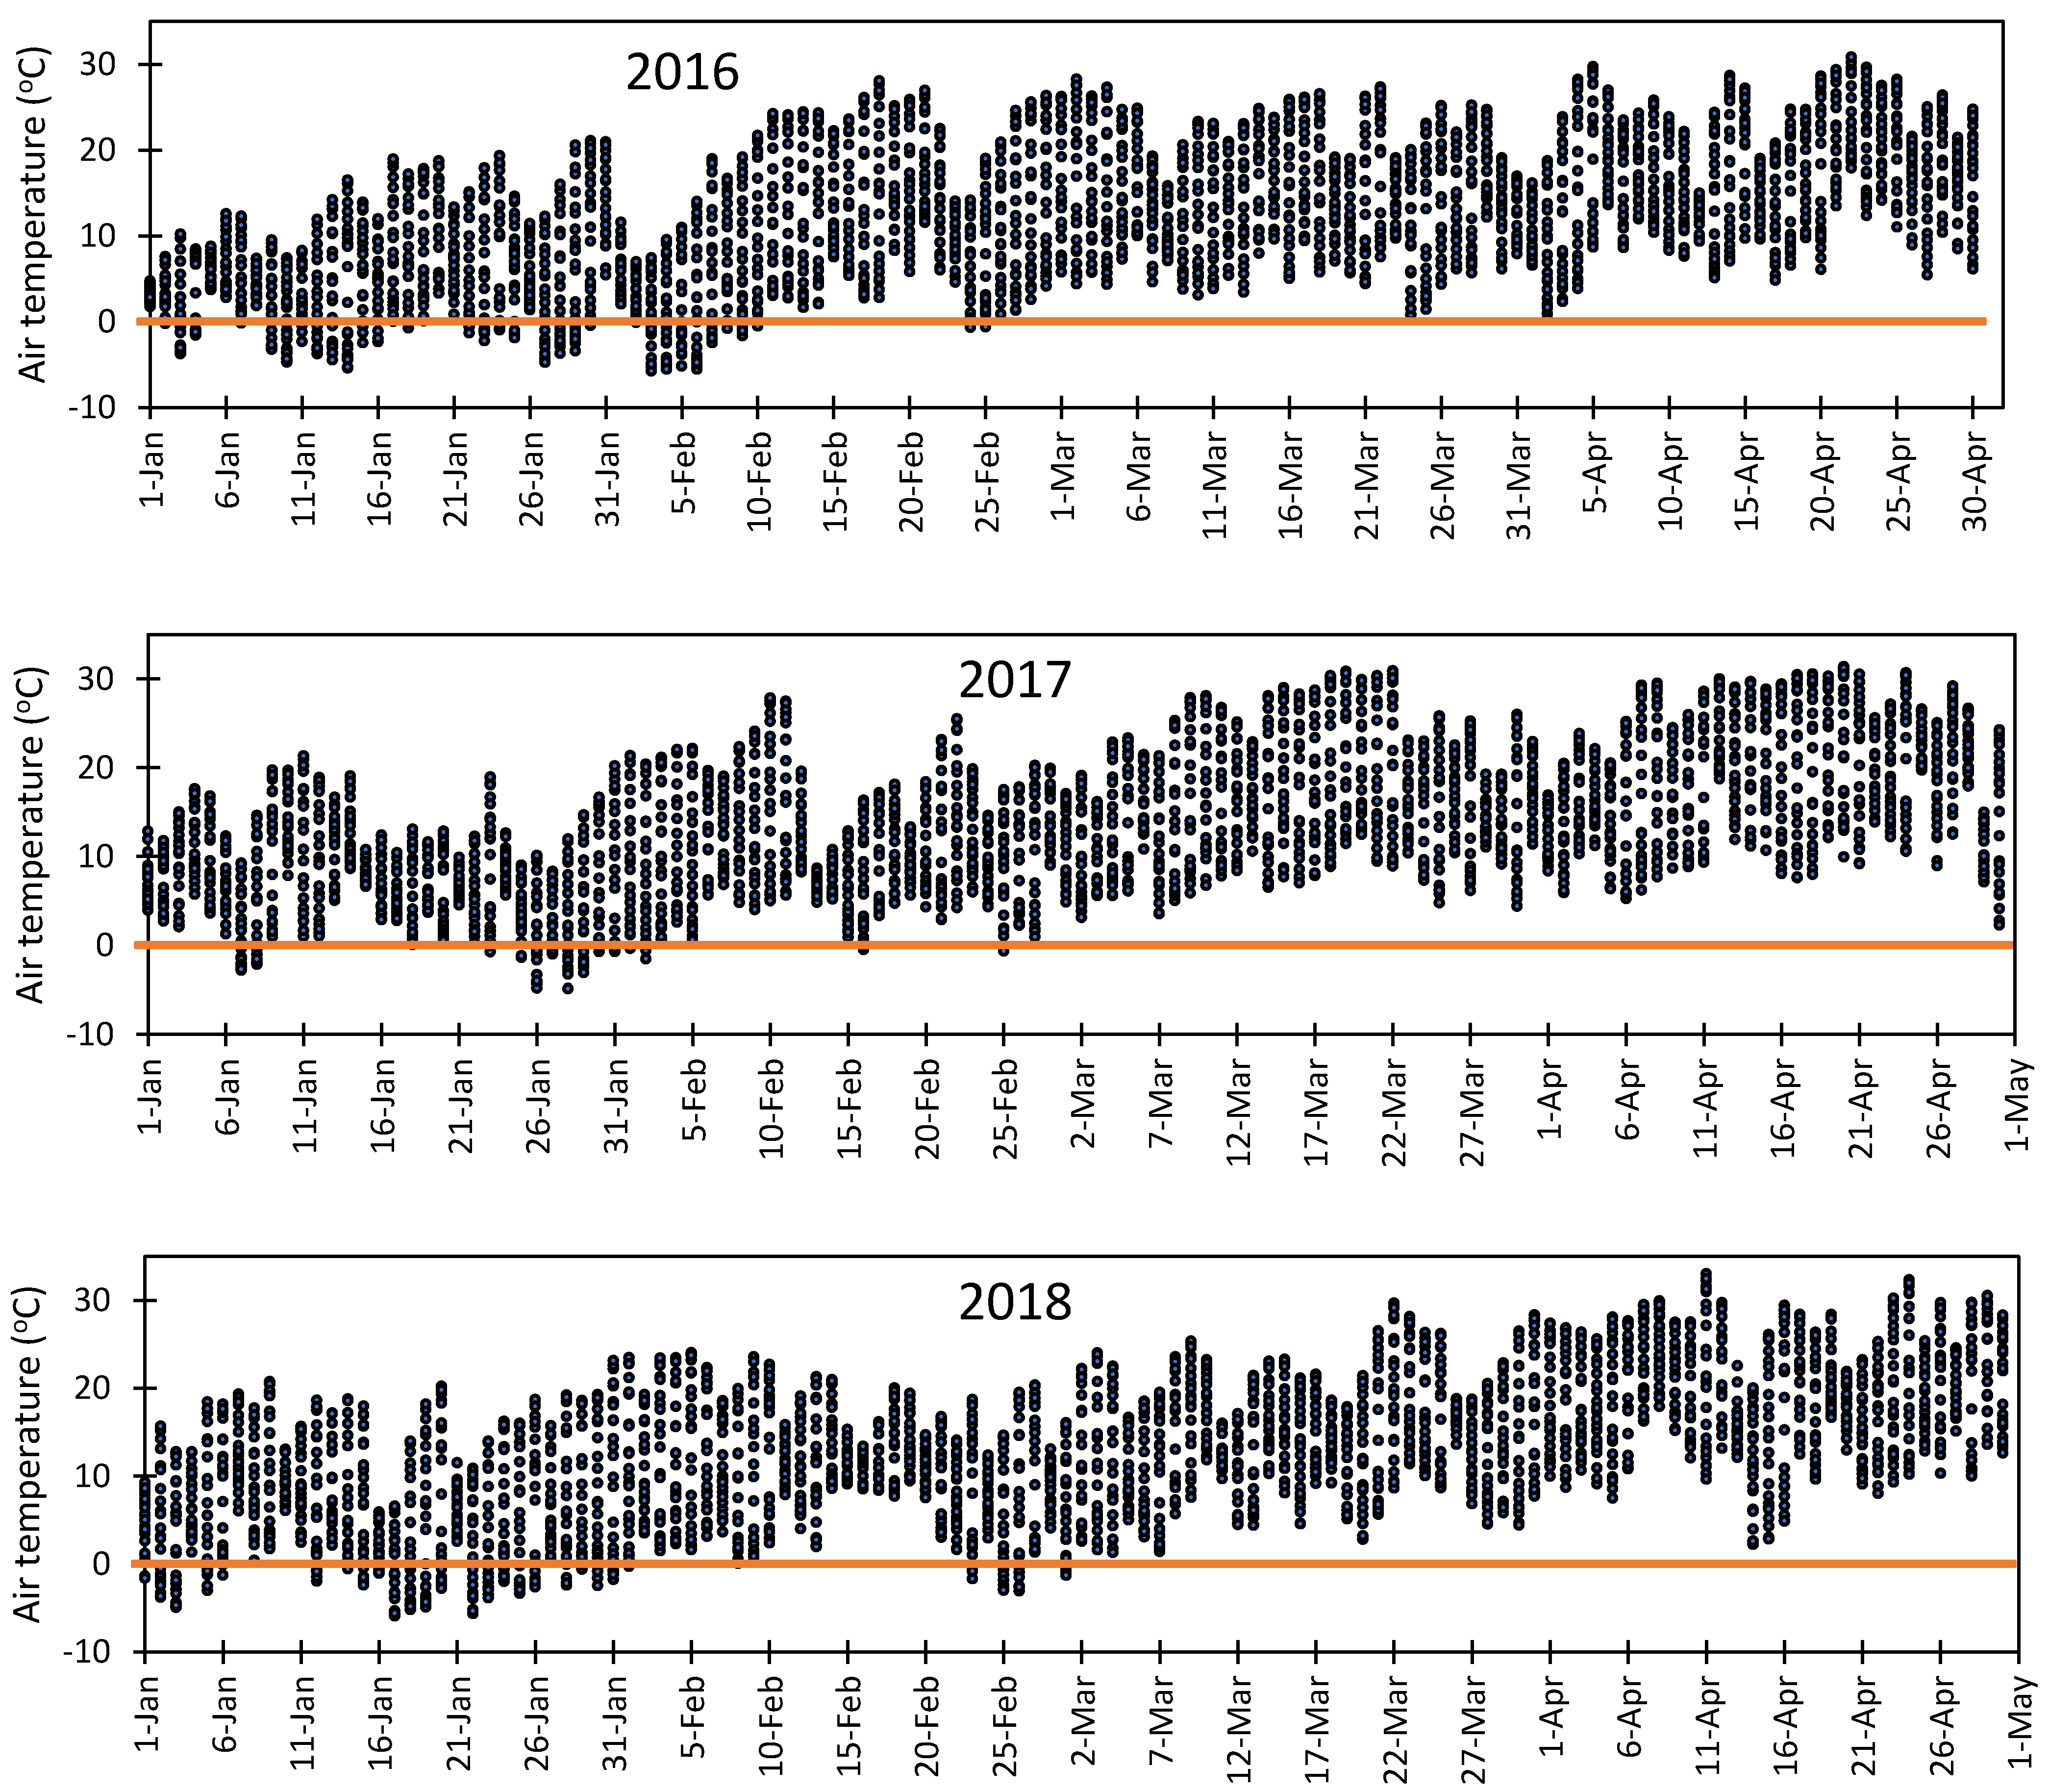
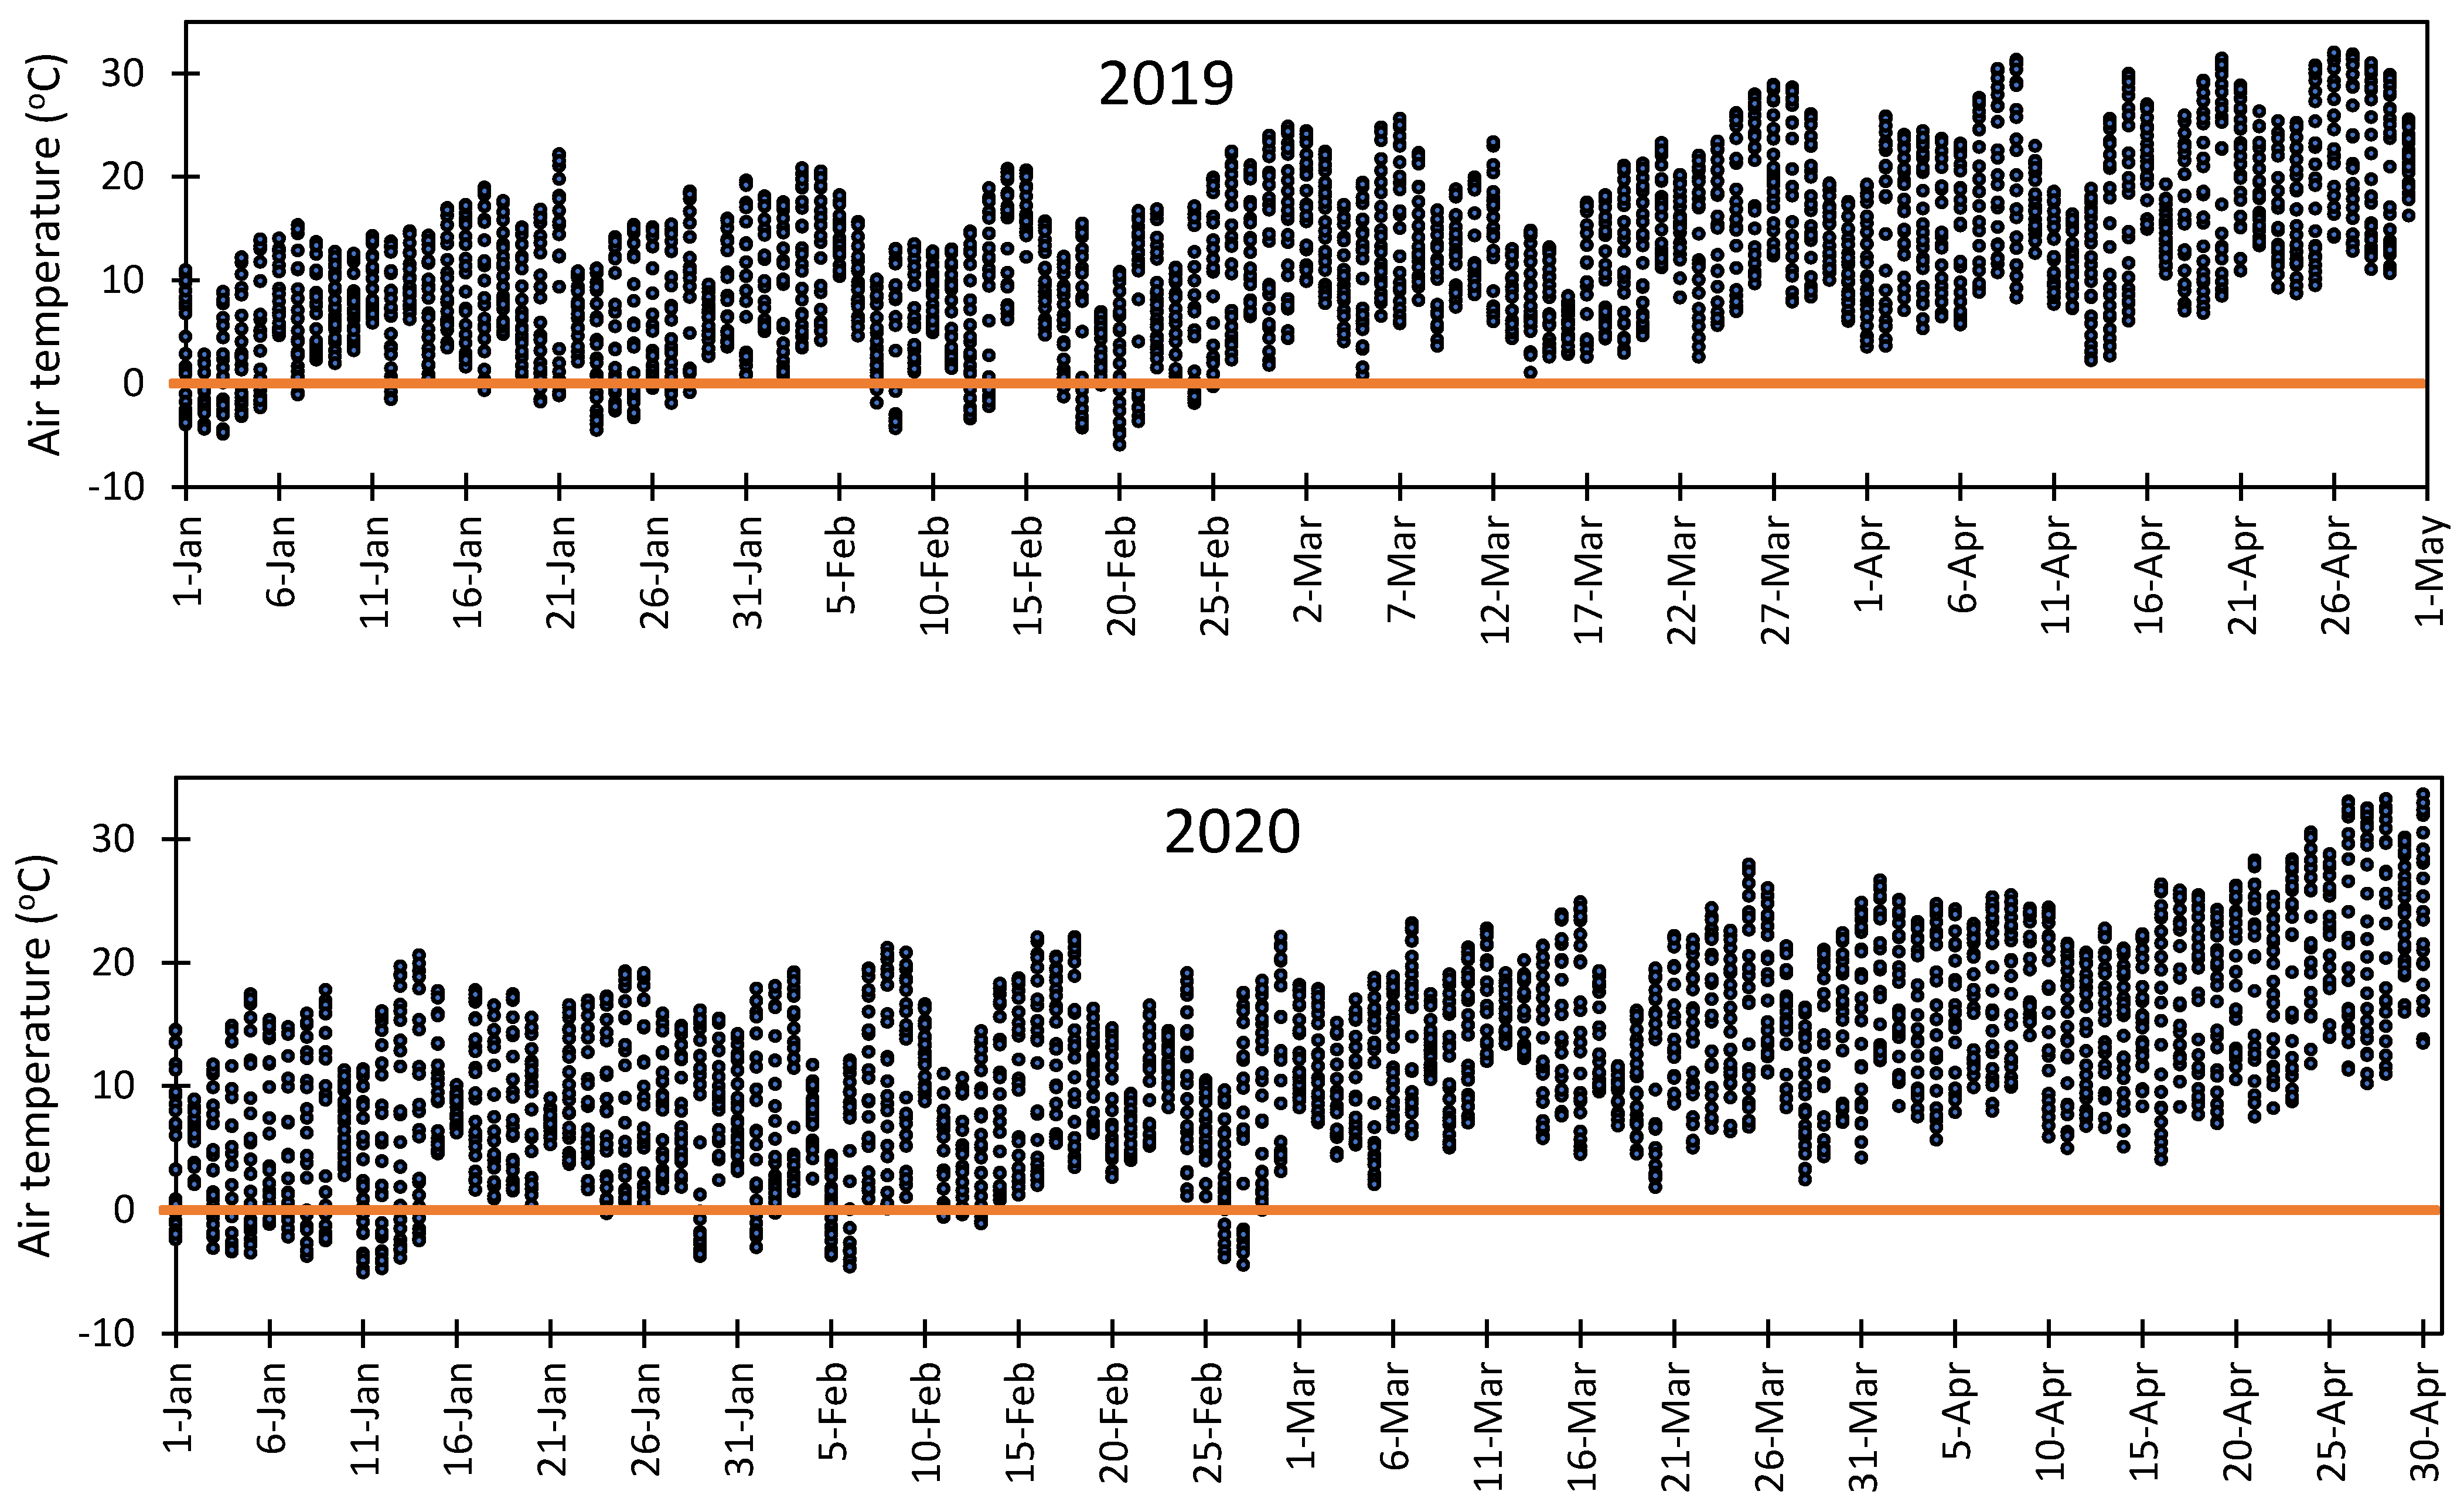
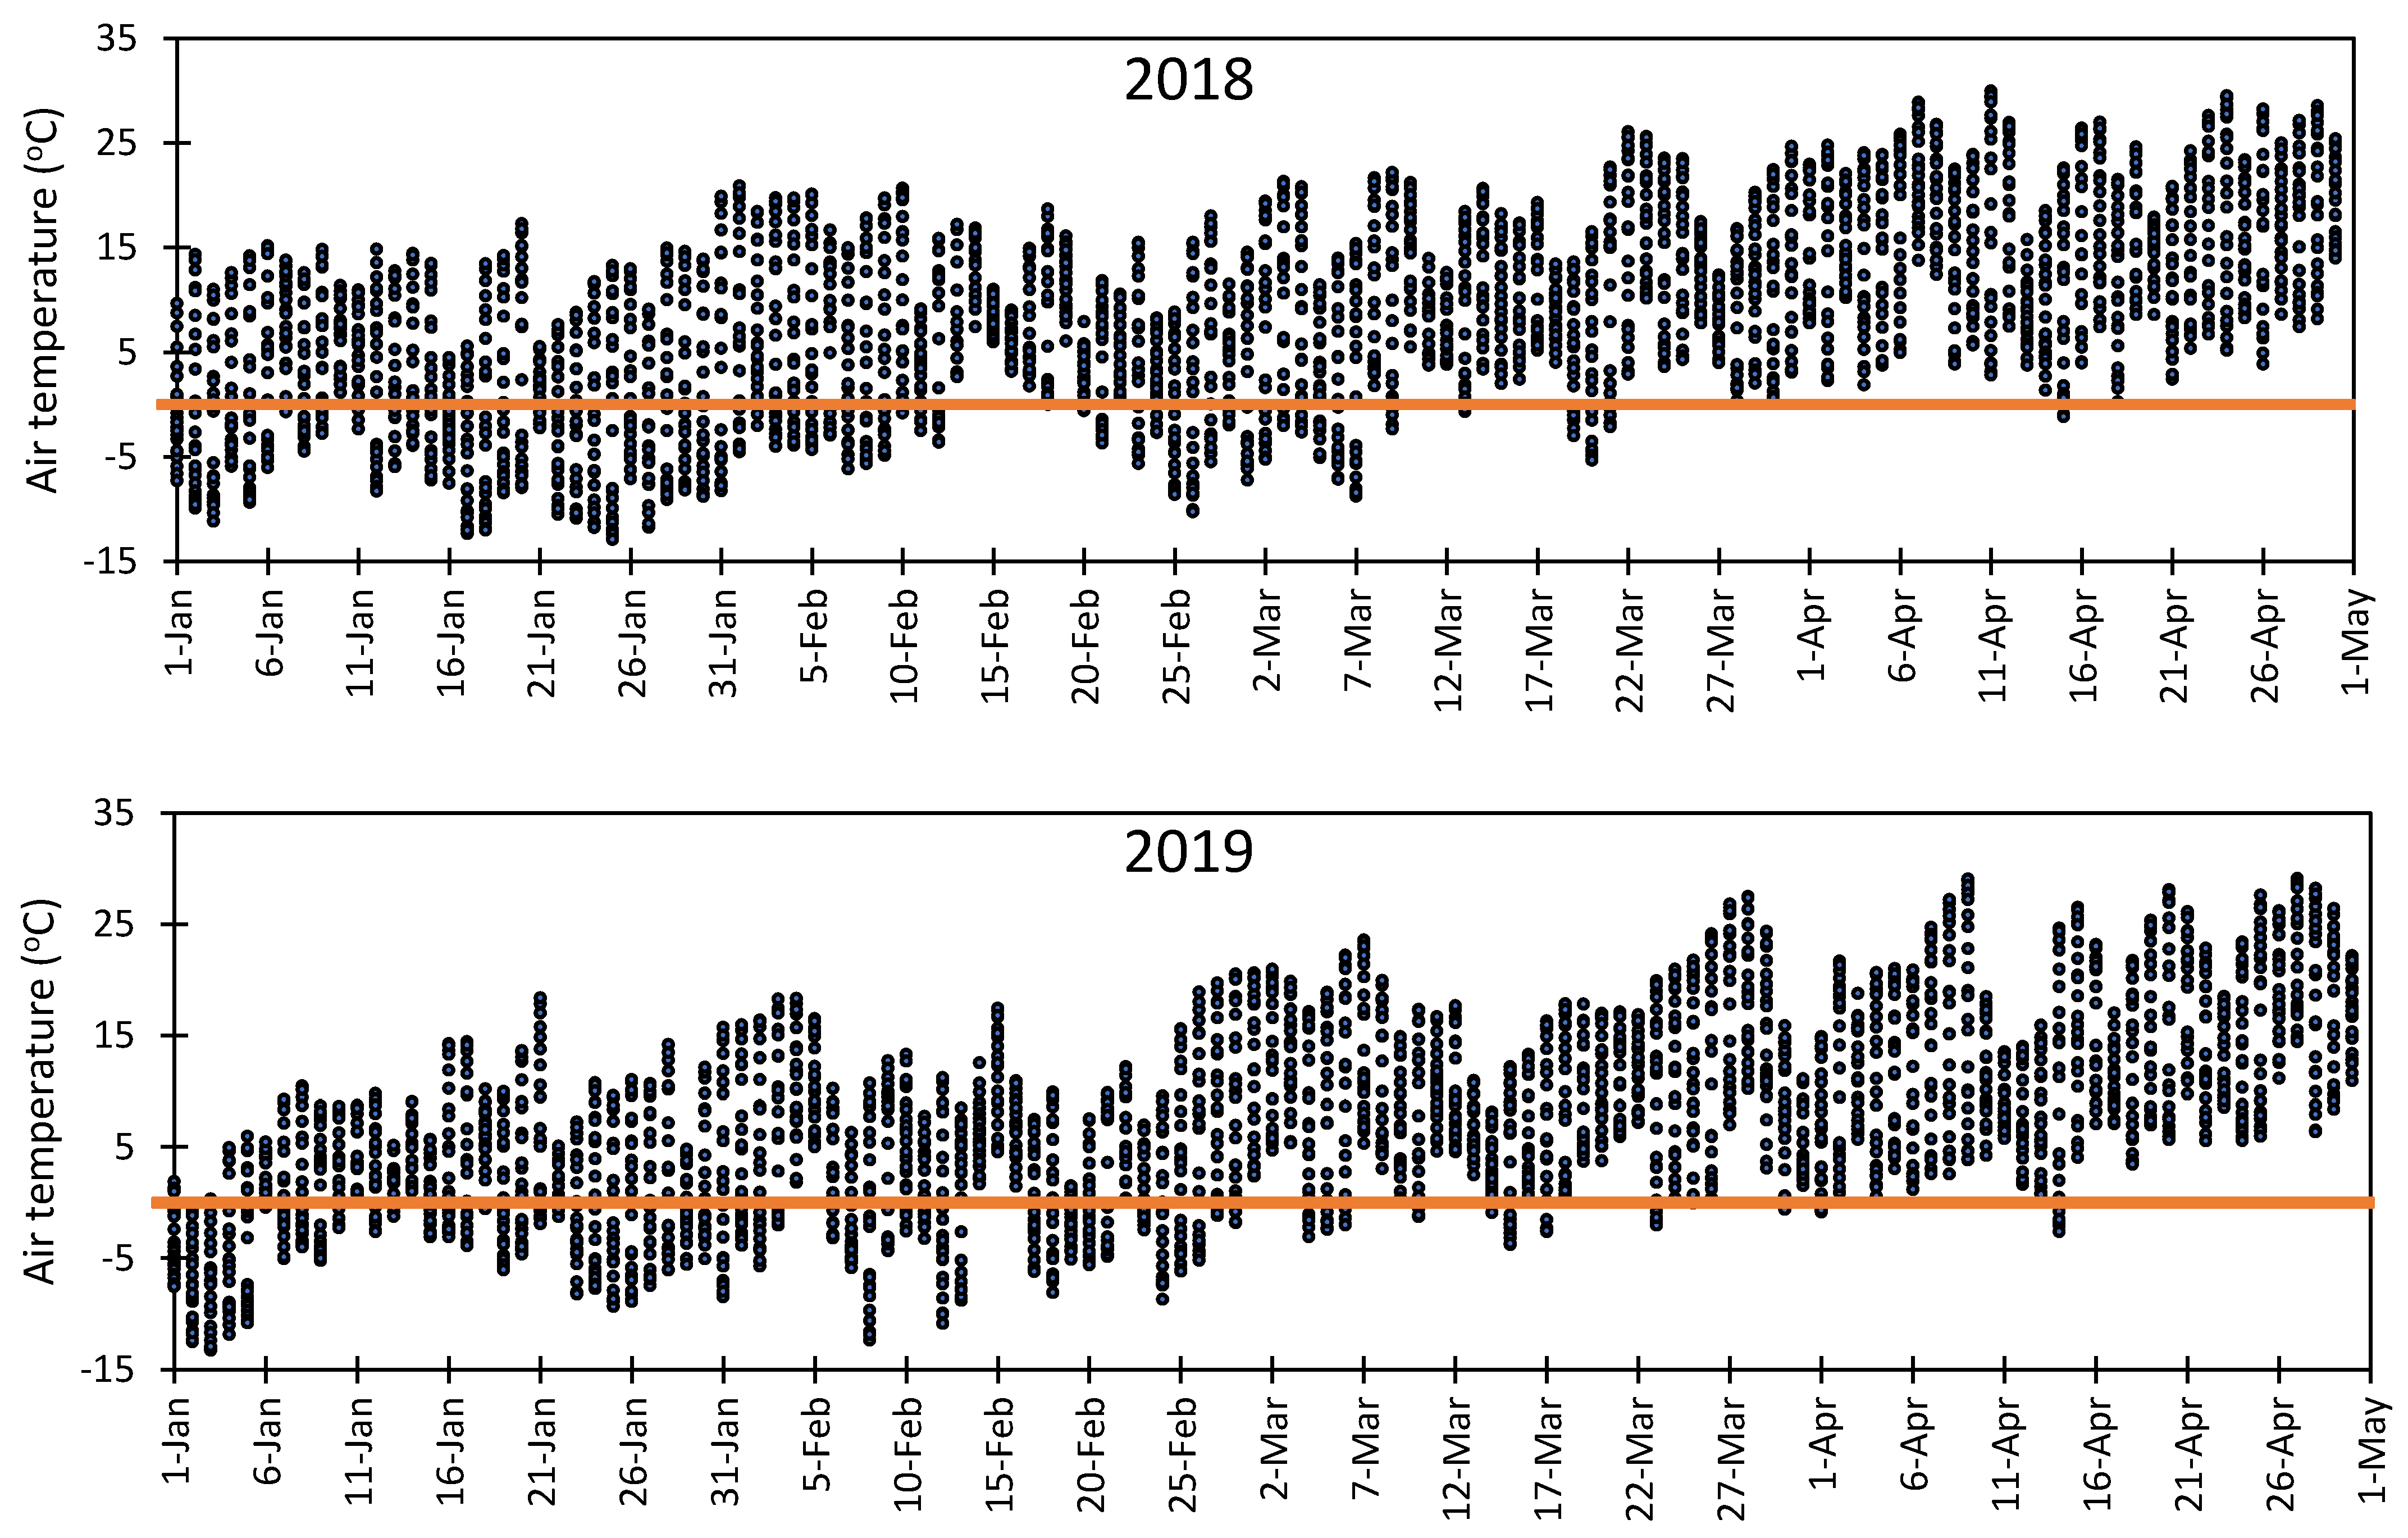
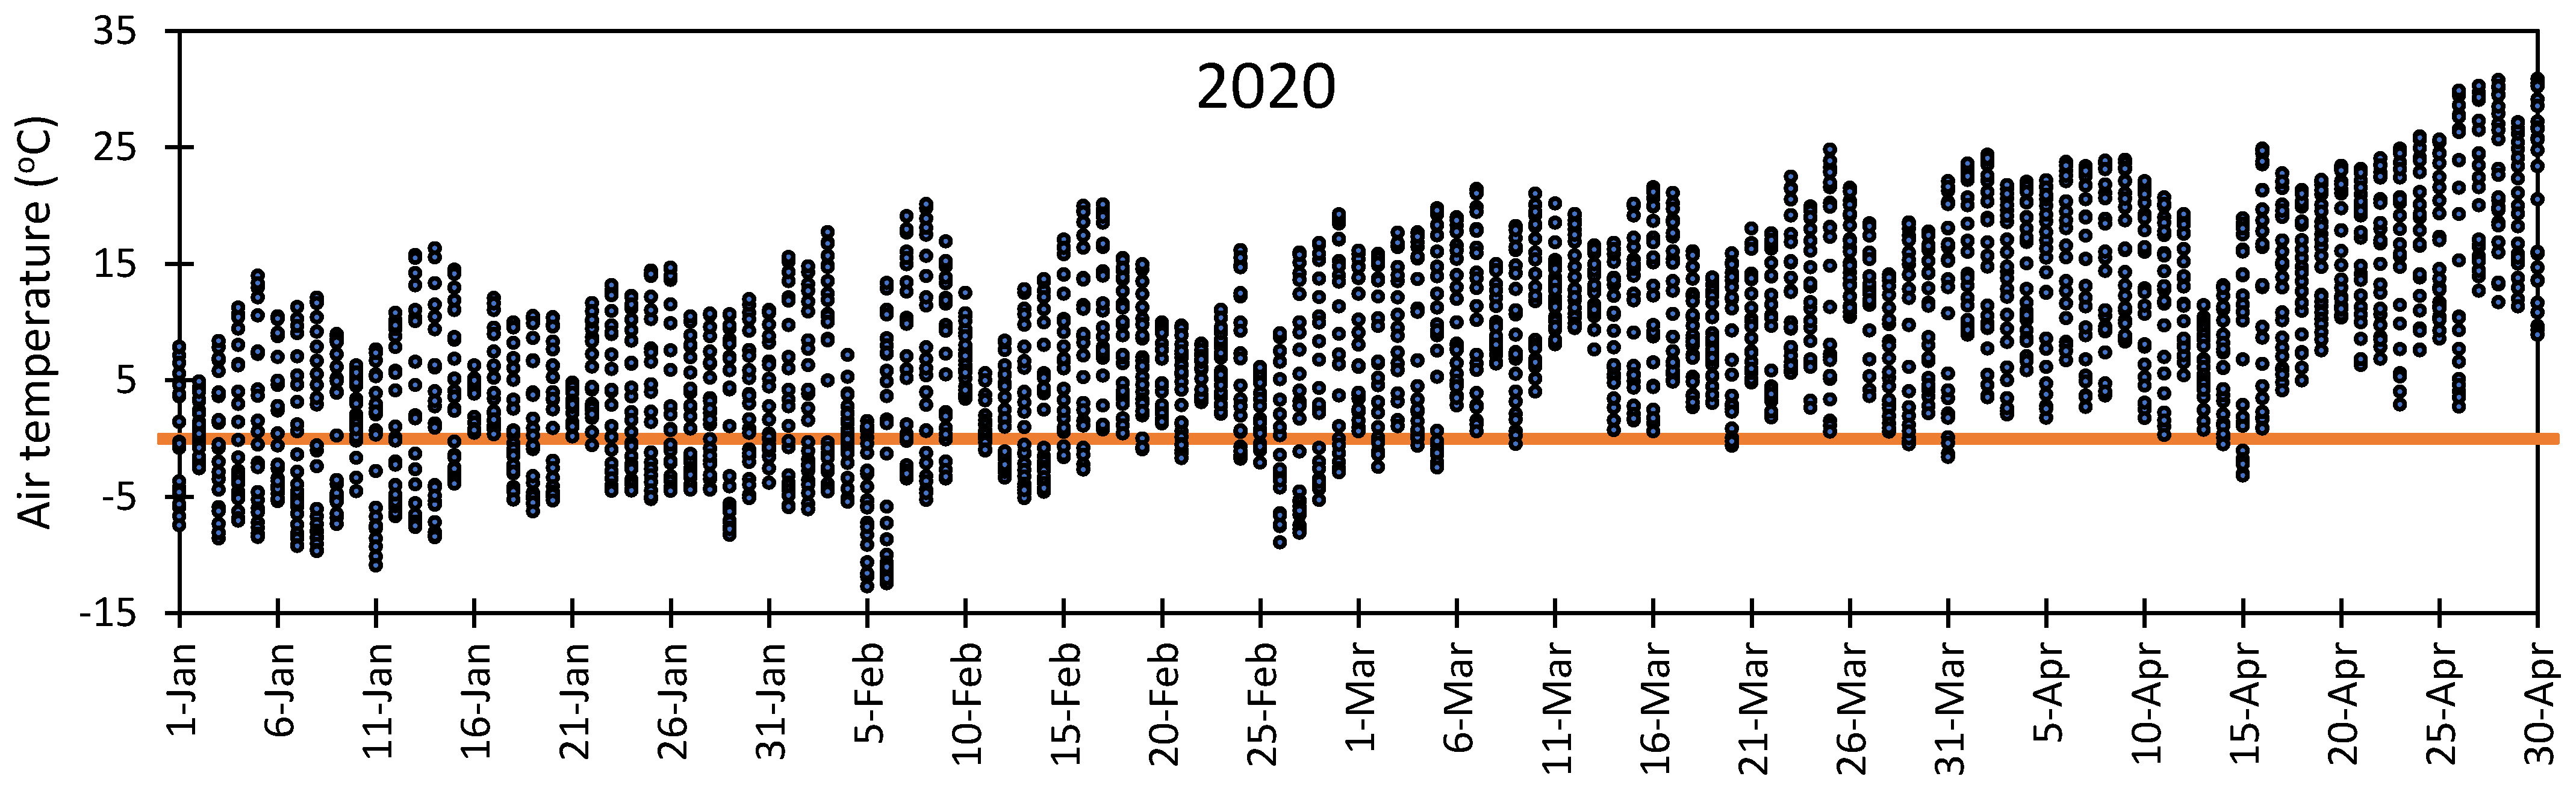
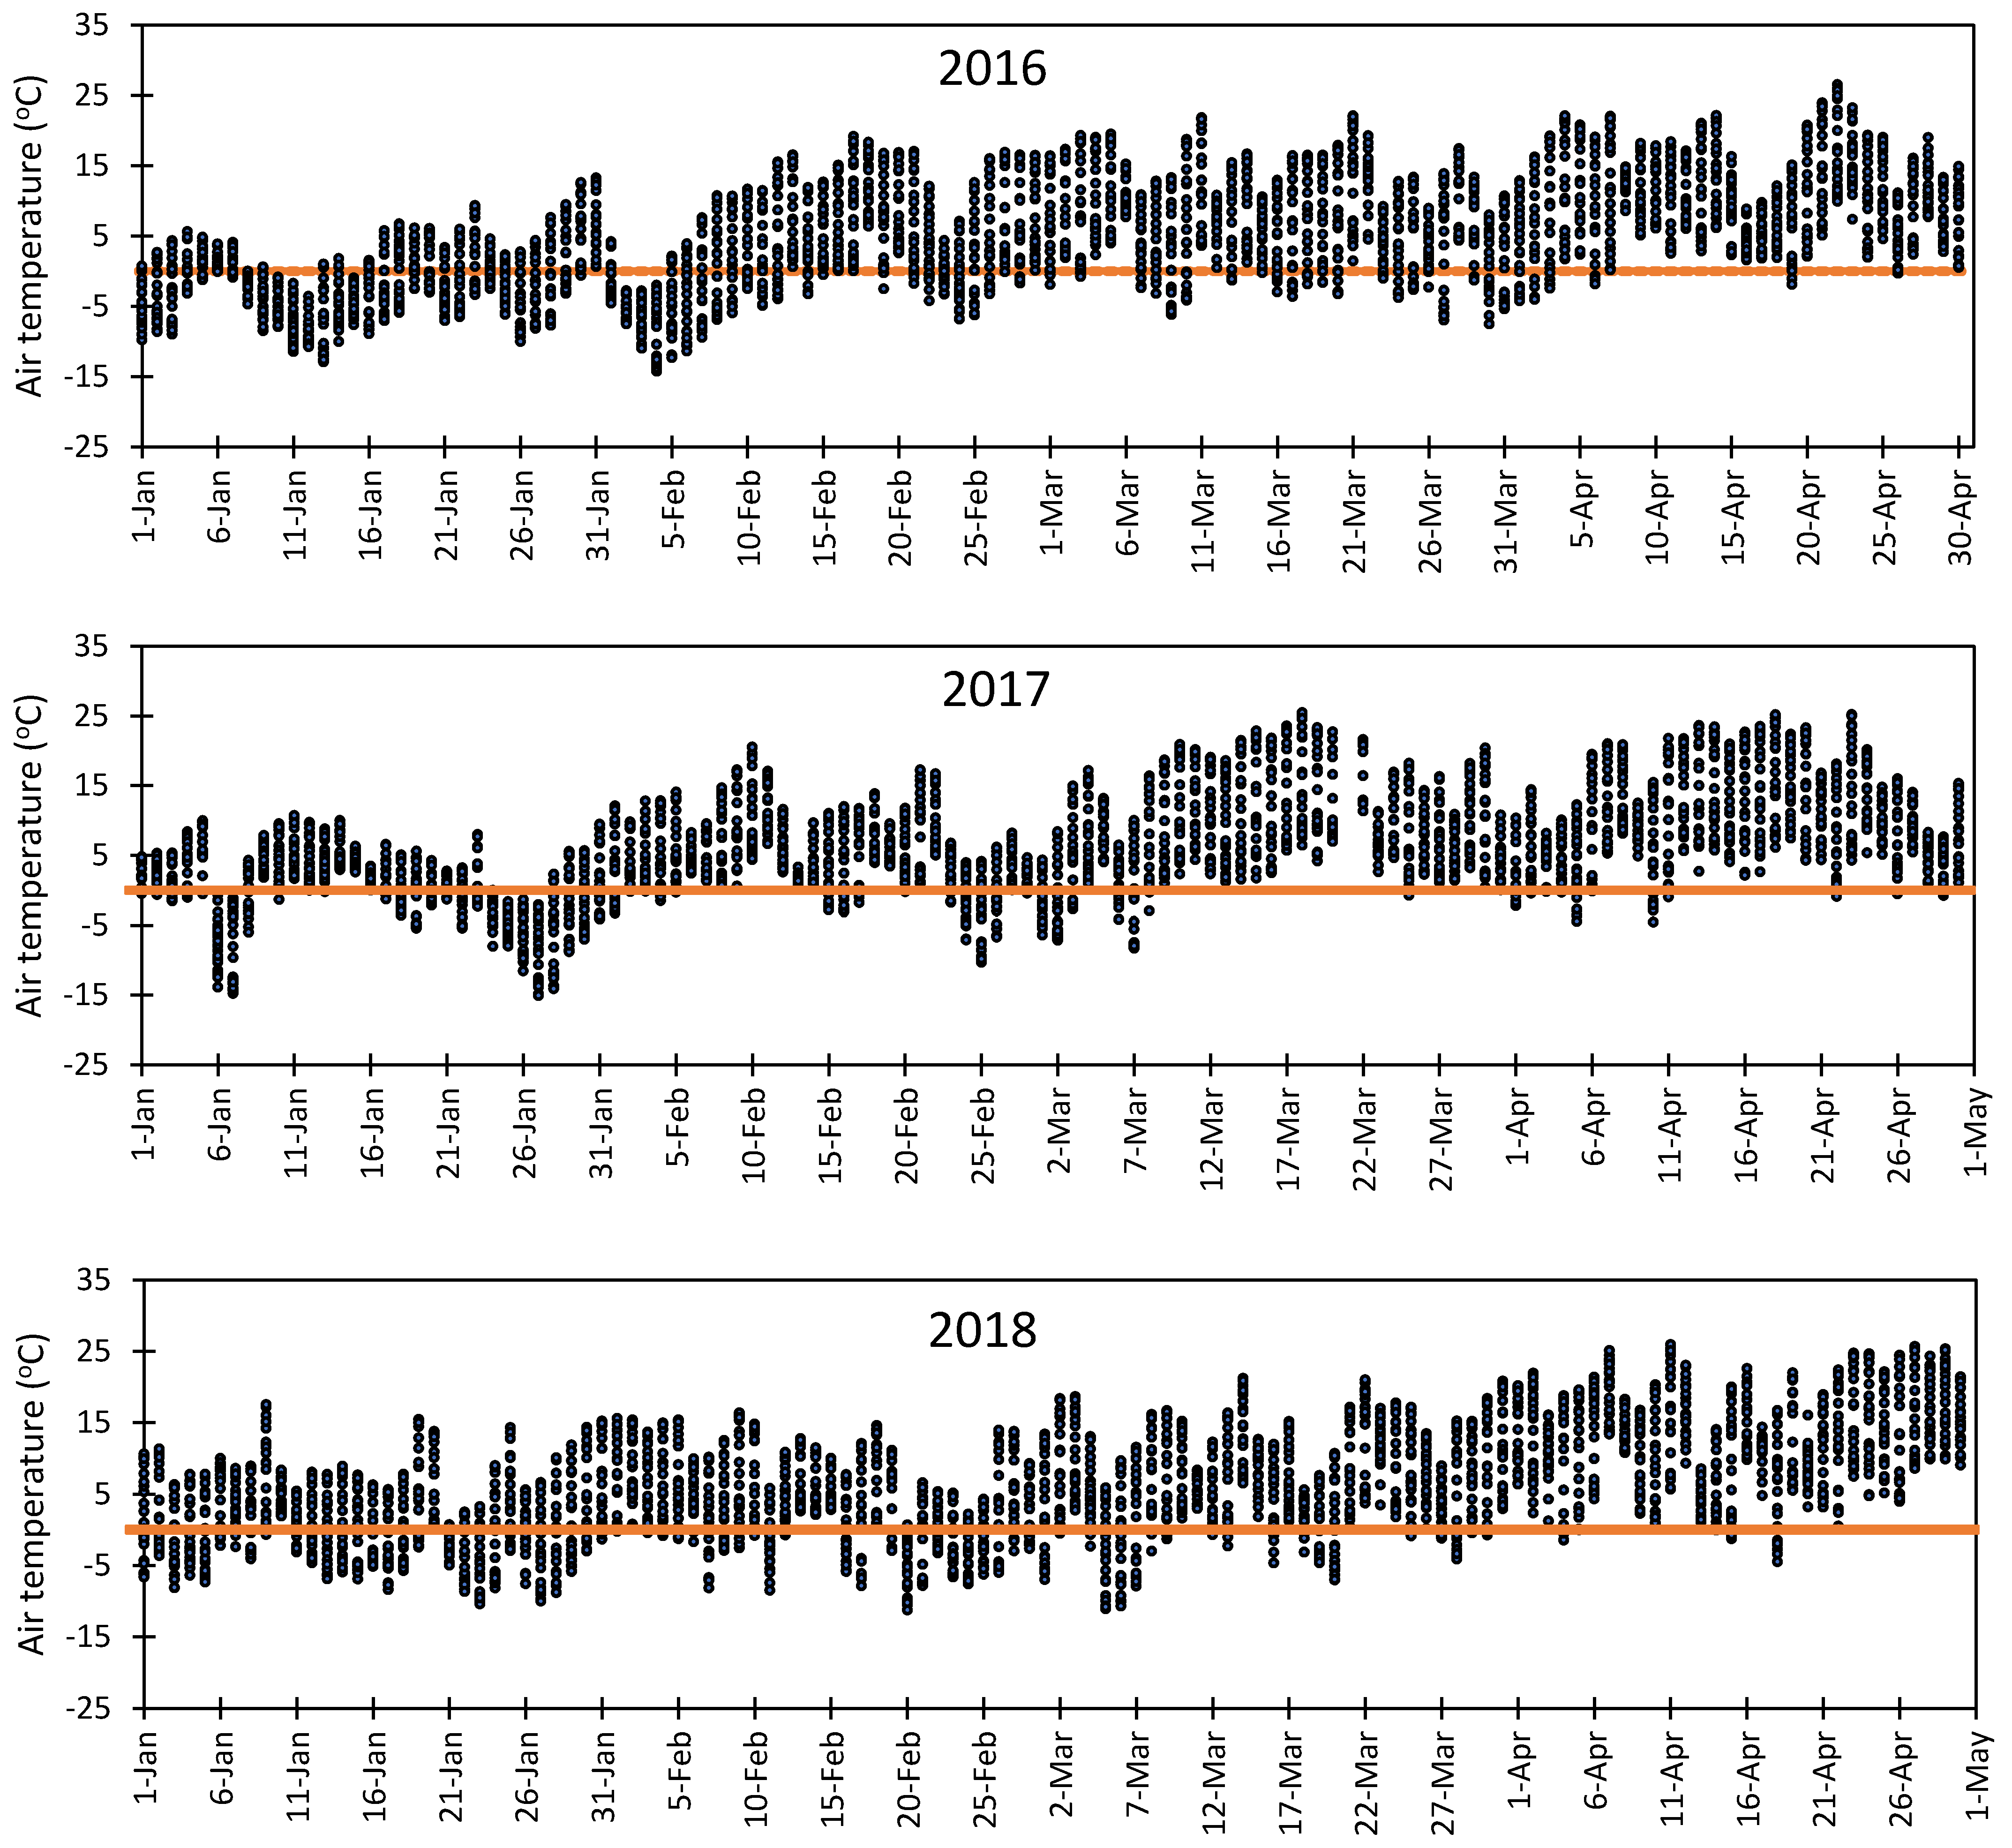
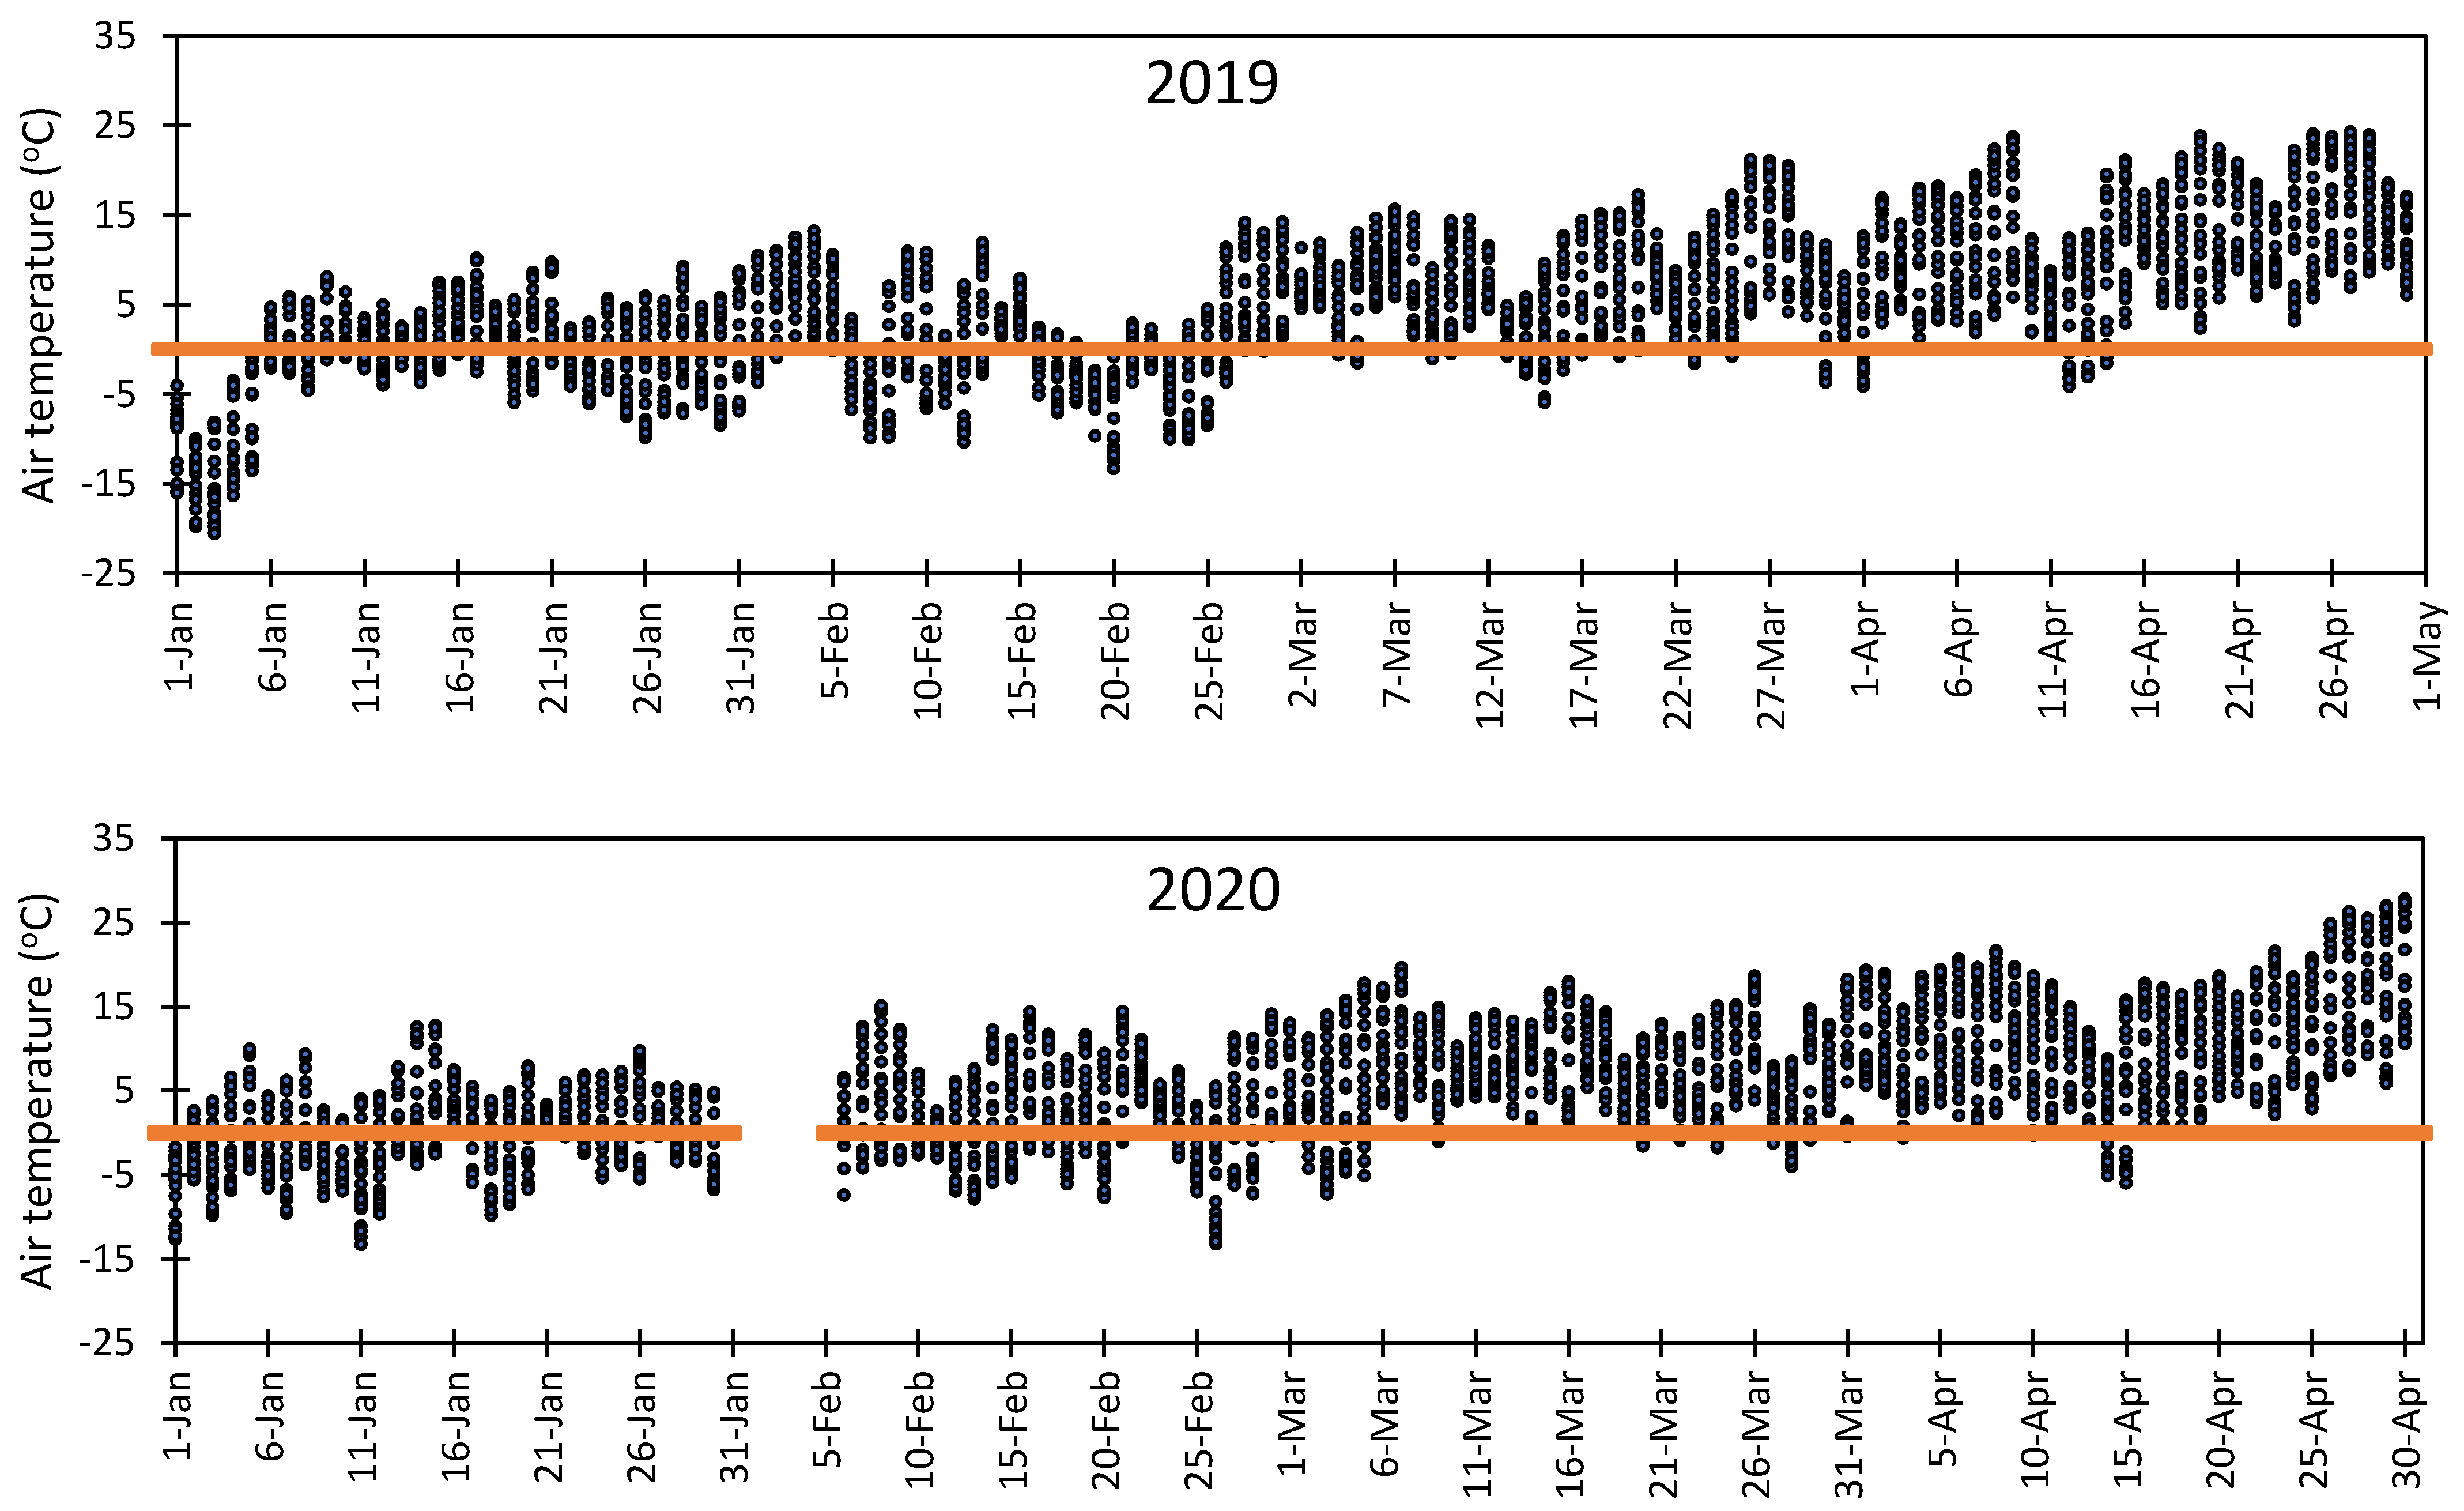
3.1. Variation in Air Temperature at Fabian Garcia, Los Lunas, and Farmington

Air temperature increased at Fabian Garcia from 1.6 °C early January to the maximum daily average temperature of 30 °C late June–early July and decreased thereafter (Figure 2a). On average, chilling accumulation period by the Utah Model (1.5 < temperature < 12.4) started from 8 November and ended late February. Daily average temperature was never negative according to our study period. For the period from October to March, average daily temperature was 11.3 ± 3.0 °C while the average temperature for the rest of the year was 24.7 ± 2.2 °C. Average annual temperature was 18.0 ± 2.6 °C.
At the Los Lunas site, daily average temperature was maximal at mid-July and minimal late December–early January and varied from −3.4 to 28.6 °C (Figure 2b). Annual daily temperature was 8.0 ± 1.3 °C. Daily average temperature fell within the range [1.5, 12.4] during the period from 8 October to 14 December and from 6 January to 23 March on average. For the period from October to March, average daily temperature was 6.2 ± 2.8 °C while the average temperature for the rest of the year was 21.7 ± 2.0 °C.
Daily air temperature at Farmington varied from −4.3 ± 6.4 °C early January to 25.6 ± 1.6 °C late June and the annual average air temperature was 11.7 ± 3.1 °C for the period of 2015 to 2020 (Figure 2c). Seasonal average air temperature for the period of October–March was 6.5 ± 3.6 °C while the average temperature from April to September was 19.2 ± 2.6 °C. The appropriate period for chilling accumulation at Farmington (1.5 < temperature < 12.4) varied from 4 October to 27 November and from 30 January to 9 May.
On annual basis, annual air temperature is 10.0 °C and 6.3 °C lower at Los Lunas and Farmington than the air temperature at Fabian Garcia, respectively. In the October–March period average air temperate was 5.1 °C and 4.8 °C lower at Los Lunas and Farmington than the air temperature at Fabian Garcia and there is more chance for greater chilling accumulation at Farmington and Los Lunas than at Fabian Garcia. In other words, greater chilling requiring fruit and nut trees are recommended at Los Lunas and Farmington than at Fabian Garcia.
Long-term monthly absolute minimum and maximum temperatures and average monthly minimum and maximum temperatures at Fabian Garcia, Los Lunas, and Farmington for the 1985–2020 period are presented in Table 2. The long-term February absolute minimum temperature was −13.9 °C at Fabian Garcia, −18.4 °C at Los Lunas, and −19.3 °C at Farmington. March and April absolute minimum temperatures were −7.4 and −2.7 °C at Fabian Garcia, −7.7 and −5.4 °C at Los Lunas, and −11.5 and −7.4 °C at Farmington, respectively, (Table 2). These early spring absolute minimum temperatures demonstrate the high probability of bud, flowers, and young fruit and nut vulnerability and exposure to early spring frost mostly at the Farmington area. Long-term summer period June, July, and August absolute maximum temperatures were quite high as 43.4, 42.5, and 40.8 °C at Fabian Garcia, 40.5, 40.3, and 37.6 °C at Los Lunas and 37.9, 39.0, and 37.0 °C at Farmington (Table 2) and which might expose the fruit and nut trees to heat stress.

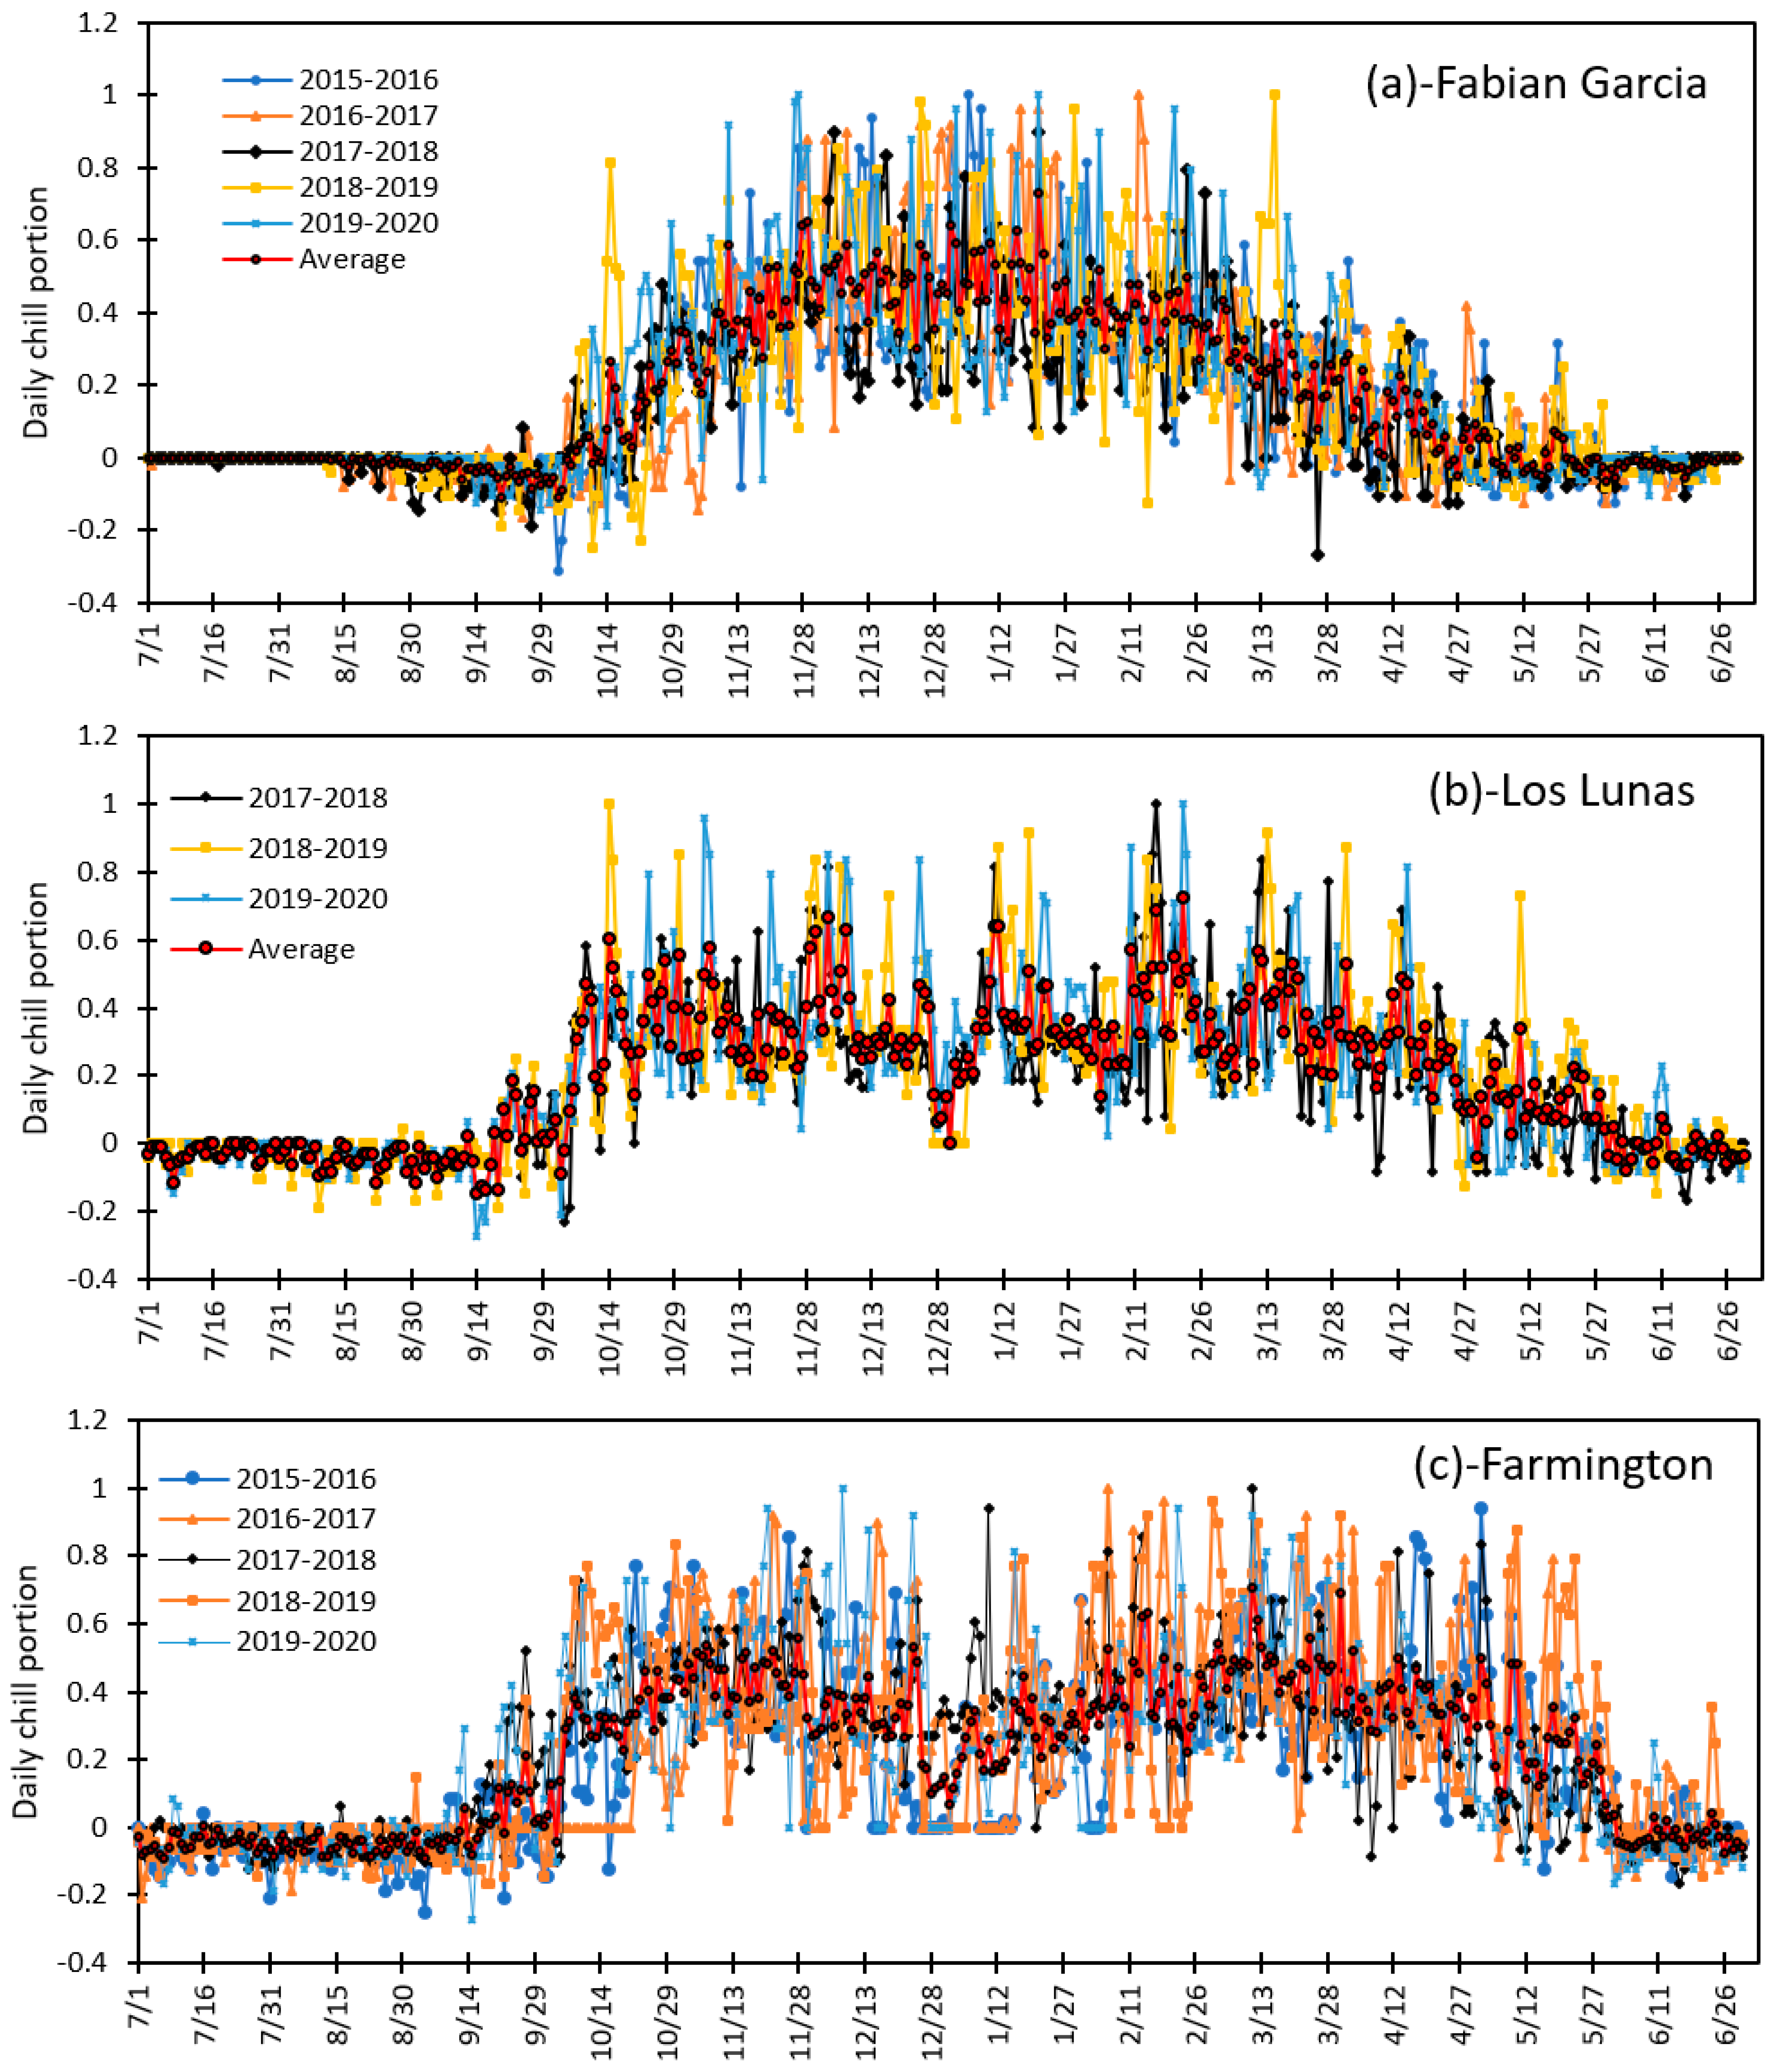
3.2. Variation in Daily Chill Portion and Seasonal Total Chill Hours for the Period of 2015 to 2020 at Fabian Garcia, Los Lunas, and Farmington

Chill portion estimated by the Utah model at all three study sites is presented in Figure 3. Daily chill portion was null or negative from the beginning of June to the end of September at Fabian Garcia (Figure 3a). Chill portion varied with years and became positive early October, increased and was equal to unity during few days mostly in December and January, and decreased toward the end of April. The 2005–2020 period chill portion increased from early October, reached a maximum average chill portion value of 0.55 from early December to mid-January, and it decreased and became null by the end of April.
At Los Lunas, chill accumulation was effective from the beginning of October to the end of May. While it averaged 0.4 on the daily time step, it varied from 0.1 to 1 with few days’ chill portion of 0.9 (Figure 3b). There was abrupt drop in chill portion to null at the end of December with the lower daily average temperature of −3.5 °C. Daily chill portion was null or negative from the beginning to mid-August. The variation in the chill portion during the effective period is due to the variation in hourly and daily air temperature at Los Lunas.
Chill portion by the Utah model at Farmington was slightly negative from 1 June to 15 September. Chill portion varied between 0 and 1 during the period of 15 September to 30 May, and averaged 0.4 during the favorable chilling accumulation period (Figure 3c). Overall, chill portion increased from mid-September and reached an average maximum of 0.5 early November and decreased thereafter up to 0.1 at the end of December. It increased again up to 0.7 on average at mid-March and decreased again until late May.
With reference to Figure 3, the chill hours’ values recorded at Fabian Garcia were 689.06, 660.84, 617.82, 791.10, and 820.64 h for the consecutive seasons from 2015–2016 to 2019–2020 seasons, respectively (Table 3). The recorded seasonal chill hours were 686.08, 733.26, and 760.24 h at Los Lunas for the 2017–2018, 2018–2019 and 2019–2020 seasons, respectively. In Farmington, the chill hours were higher than that at Los Lunas and Fabian Garcia and varied from 750.50 to 964.04 h. The endodormancy accumulated chill hours averaged 715 ± 86.60, 729.53 ± 41.71, and 828.95 ± 83.73 h at Fabian Garcia, Los Lunas, and Farmington, respectively. There was 1.9 and 16% more chill hours at Los Lunas and Farmington compared to Fabian Garcia. In other words, chill hour increased with latitude across the state of New Mexico.

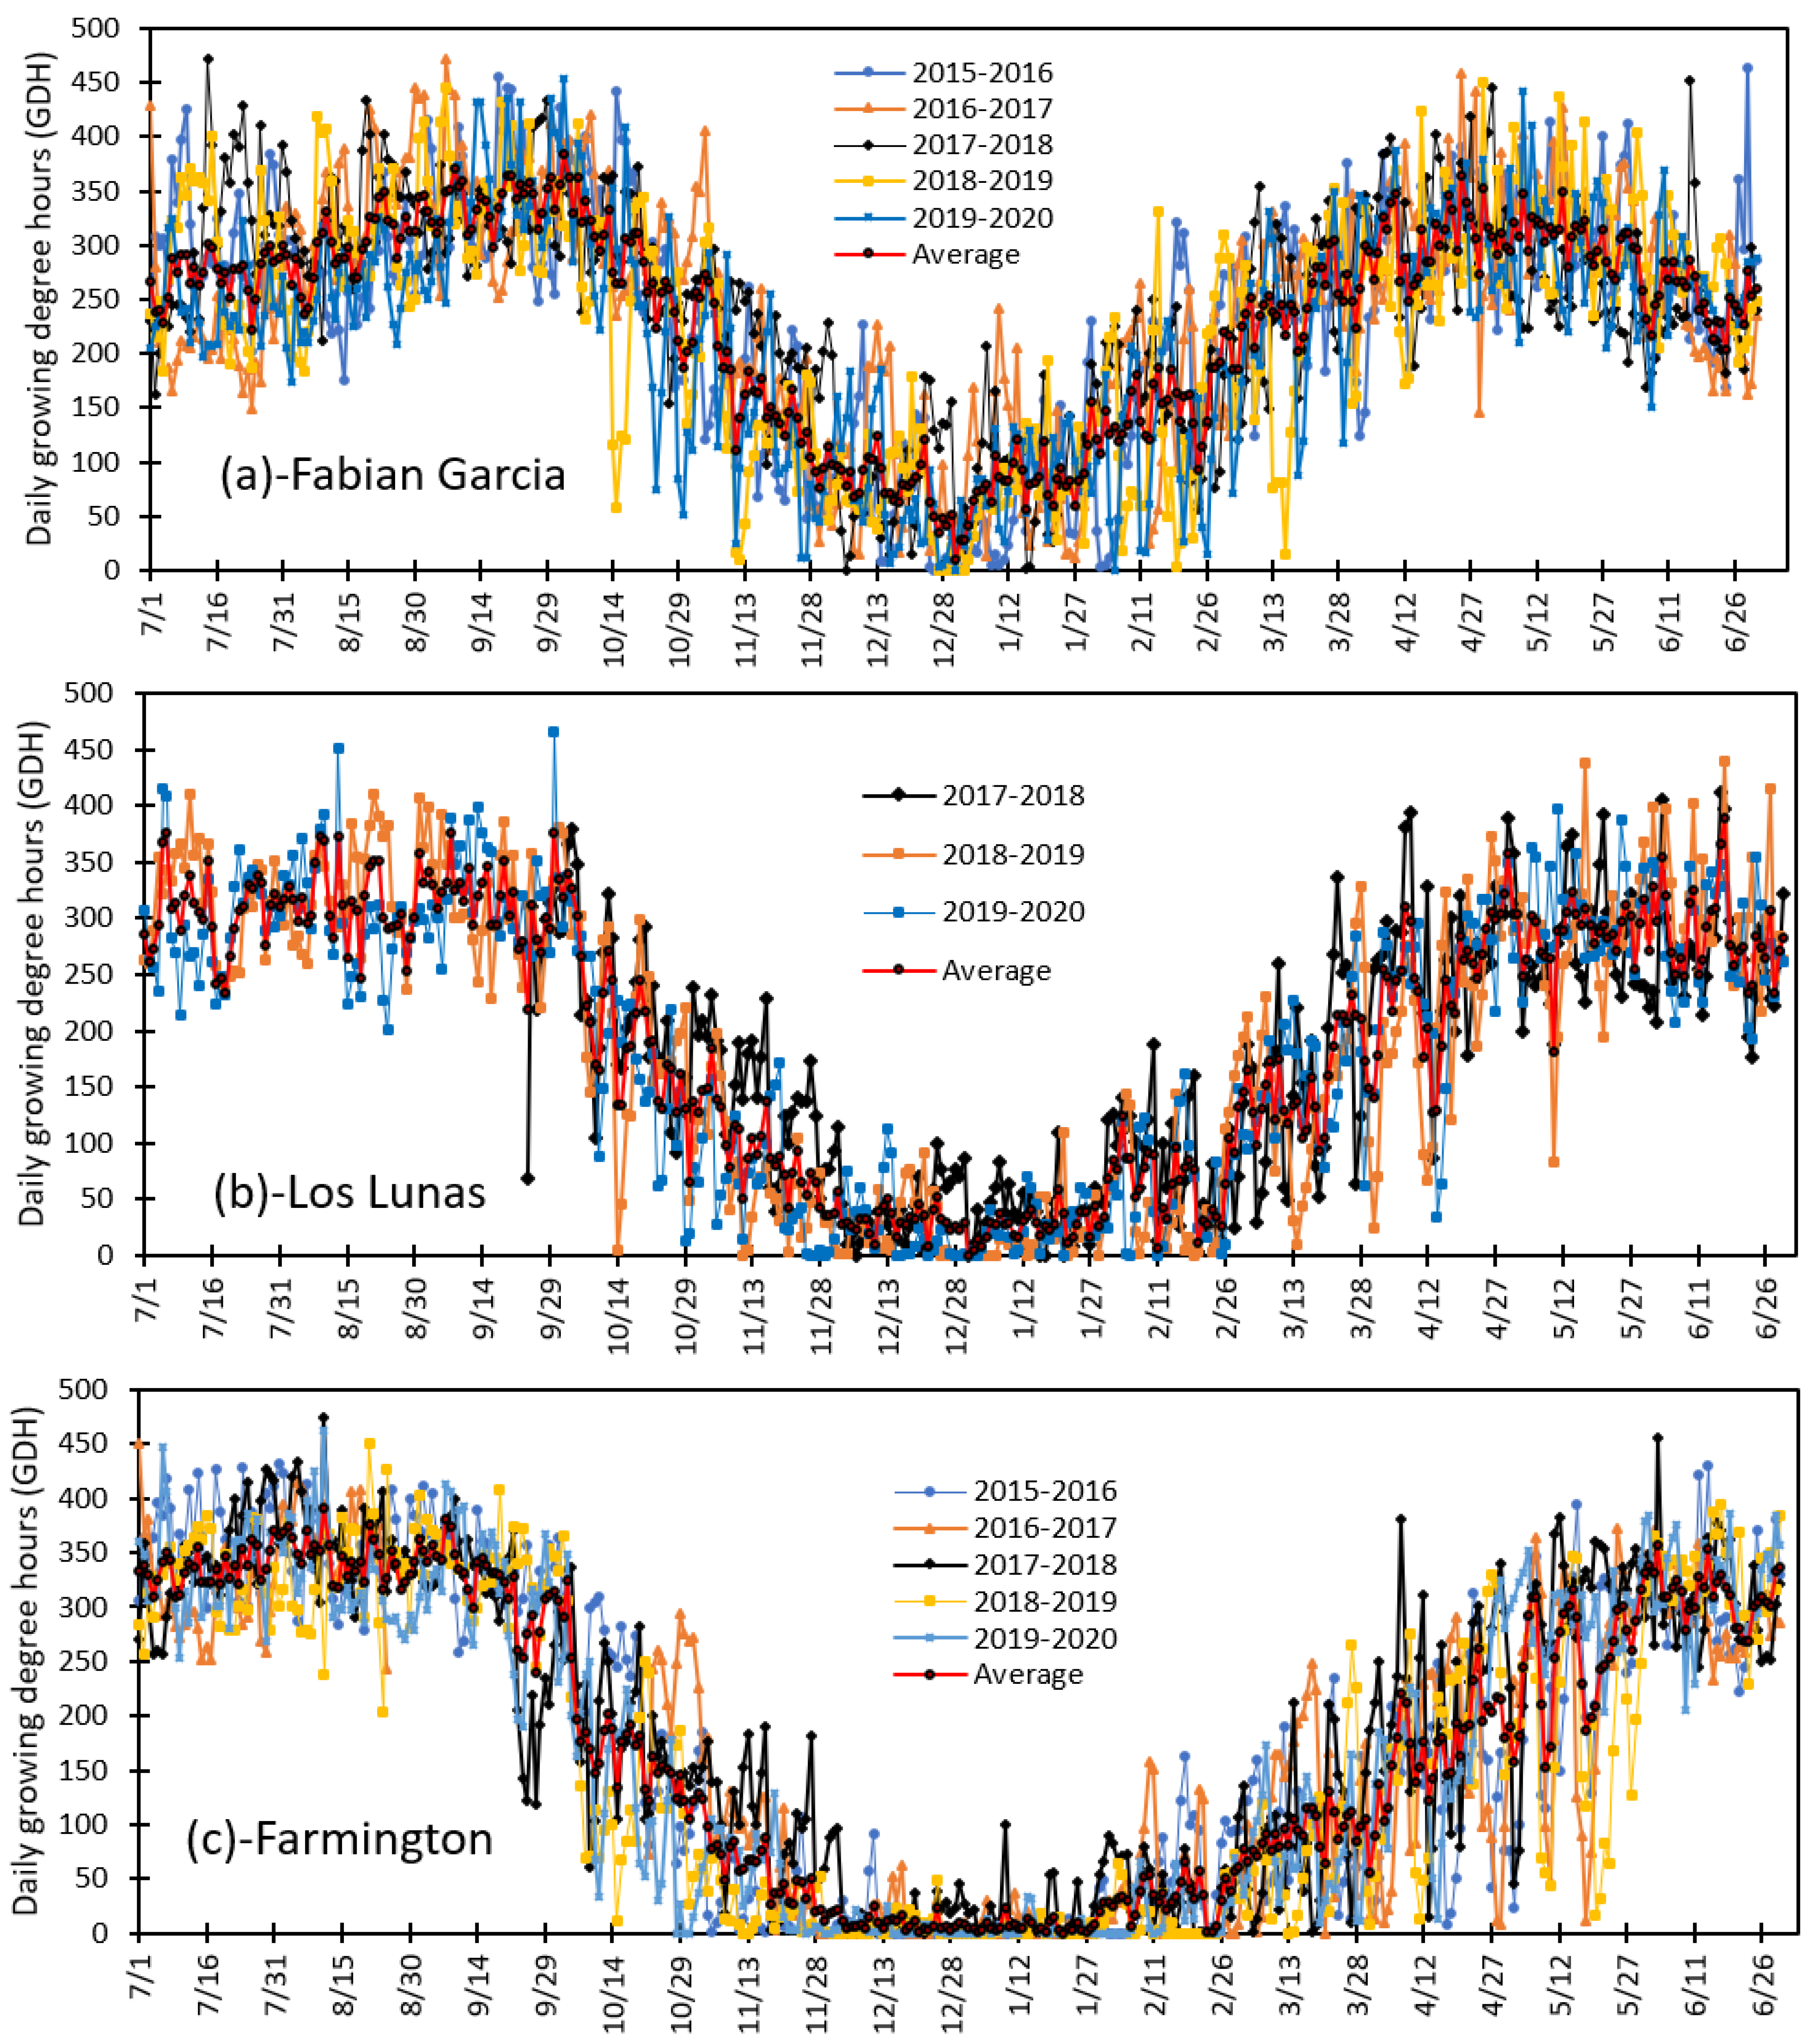
3.3. Variation in Daily Growing Degree Hours and Seasonal Total Heat Accumulated from 2015 to 2020 at Fabian Garcia, Los Lunas, and Farmington

The variation in the daily growing degree hours by the Forcing model at Fabian Garcia, Los Lunas, and Farmington is presented in Figure 4. Considering the fruit and nut trees growing season that covers the period from 1 July to 30 June, the daily growing hours at Fabian Garcia increased from 1 July to 30 September and decreased until its minimum value was close to zero at the end of December, increased again up to the end of April and decreased toward the end of June (Figure 4a). Daily growing degree hours ranged from 0 to 480 GDH and showed two peaks at the end of September and at the end of April. The most important part of the growing degree hour curve is the increasing section from January to April which represents the accumulated heat during the ecodormancy phase of the fruit and nut trees after the endodormancy had been accomplished. Therefore, daily heat accumulation increased from January to April with an abrupt decrease during the second half of February (Figure 4a). With the overall ecodormancy period covering early January to 18 March, the accumulated heat values at Fabian Garcia varied from 6947.58 to 11,352.27 GDH and averaged 8735.52 ± 1650.91 GDH (Table 3).
At Los Lunas, the daily heat varied from 0 to 480 GDH (Figure 4b). It slightly increased during July and August and decreased from the beginning of September to early December and stayed at its lowest level in December and January and increased thereafter. There were some regular drops in the growing degree hours in February, March, and April (Figure 4b) due to the changes in the hourly average temperature during the period of February-April at Los Lunas. While the ecodormancy period covers the period from early January to 8 April, the possible total accumulated heat by fruit and nut trees varied from 7544.88 to 10,748.86 GDH and averaged 7695.43 ± 212.90 GDH (Table 3).
Daily growing degree hours varied from 0 to 450 GDH with few days when the daily heat was 580 GDH at Farmington (Figure 4c). Overall, daily heat decreased from an average of 350 GDH late August to 0 by the end of November and remained stable at the minimum value during December and January. Heat started to accumulate from the beginning of February to end May at 360 GDH a day. The possible total accumulated heat varied from 4007.80 to 9894.20 GDH and averaged 5984.69 ± 2353.20 GDH (Table 3) during the ecodormancy period that covers early January to late April at Farmington.
The accumulated heat during trees ecodormancy varied greatly with location and decreased from the southern to the northern New Mexico. This change in the heat is due to the severity of the winter weather with latitude. There were 11.9 and 31.5% less accumulated heat at Los Lunas and Farmington, compared to the accumulated heat at Fabian Garcia during the ecodormancy respectively.

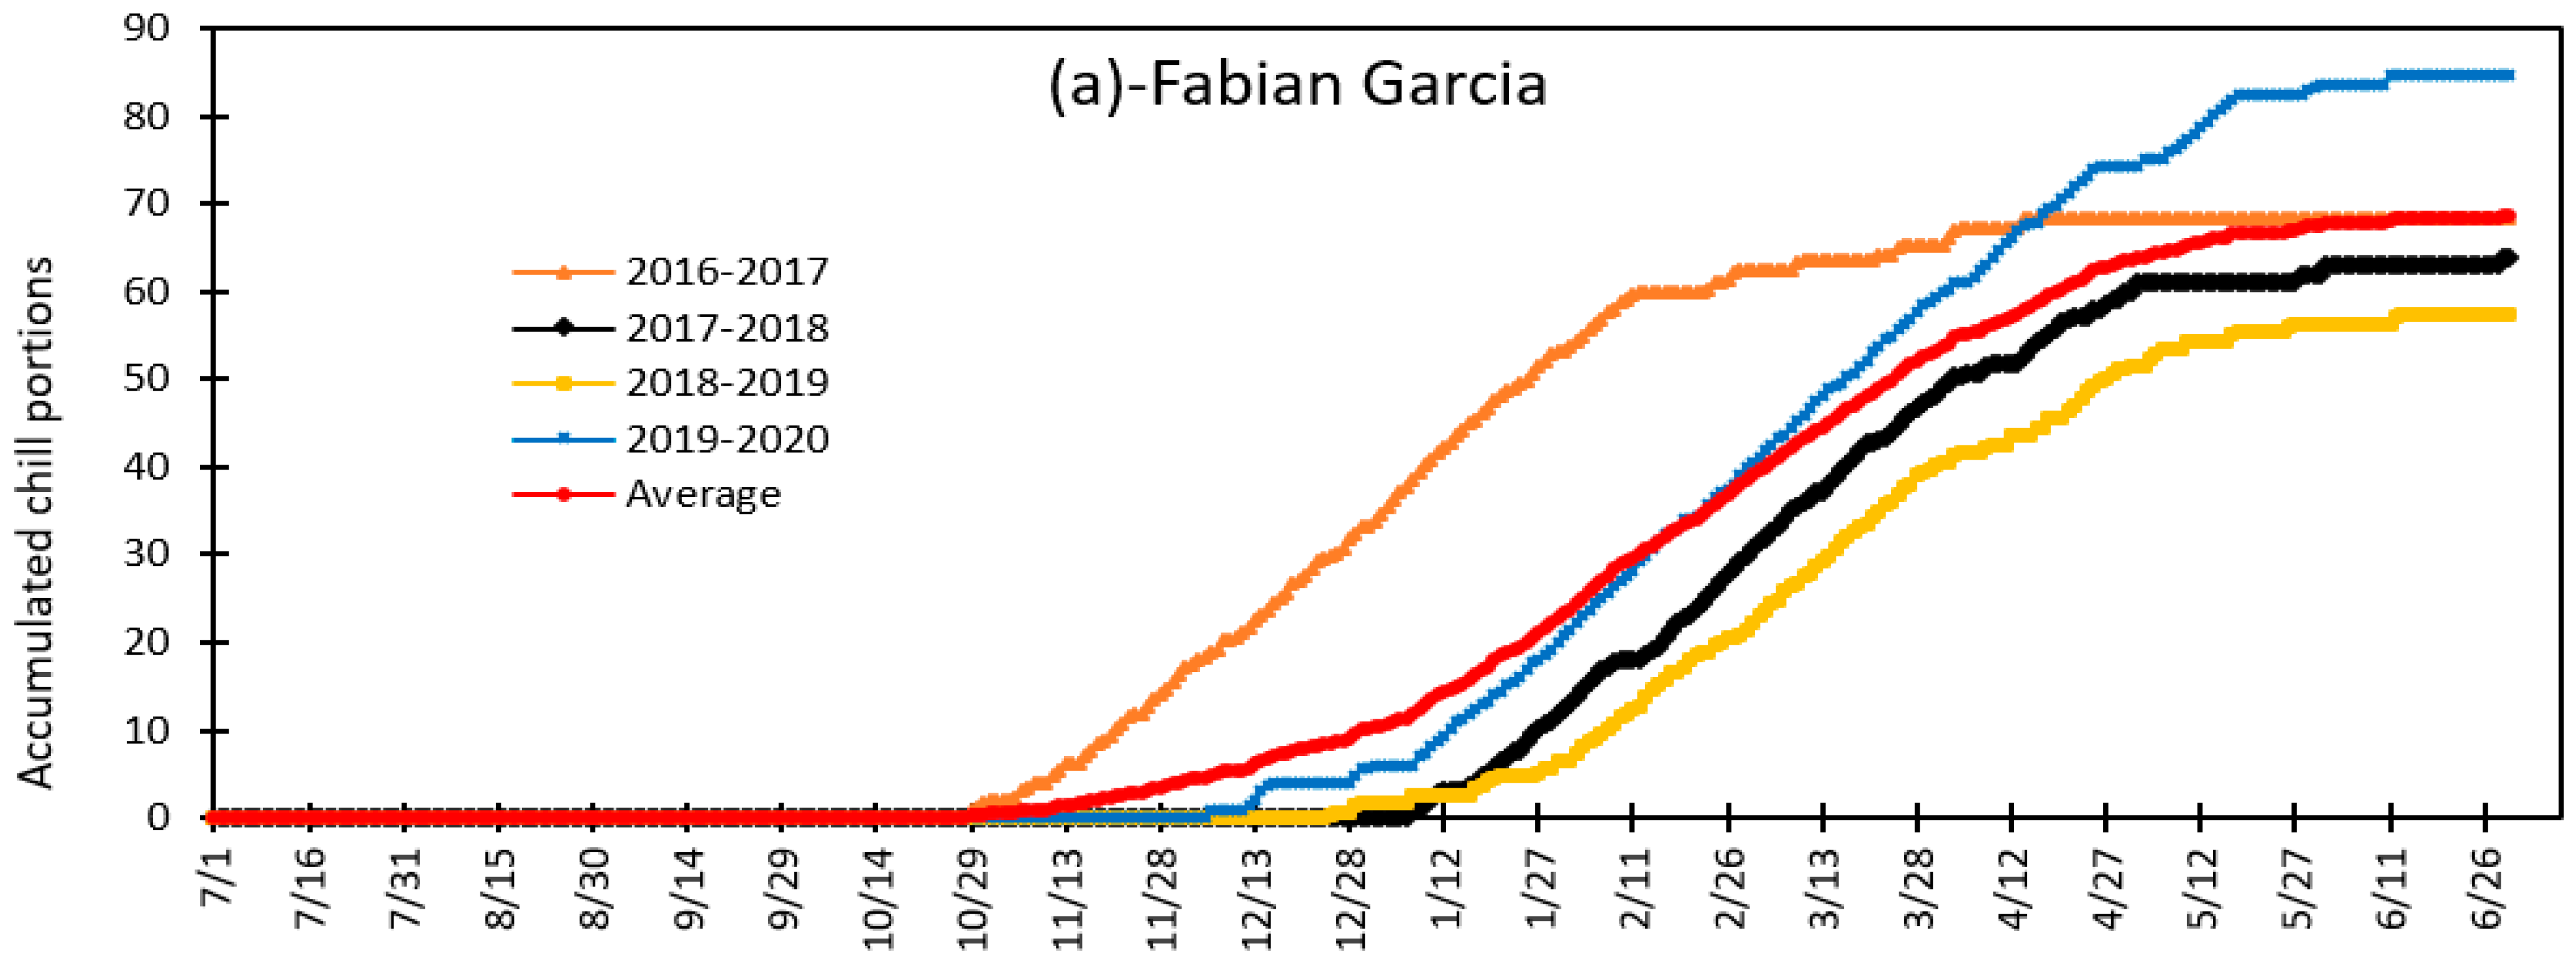
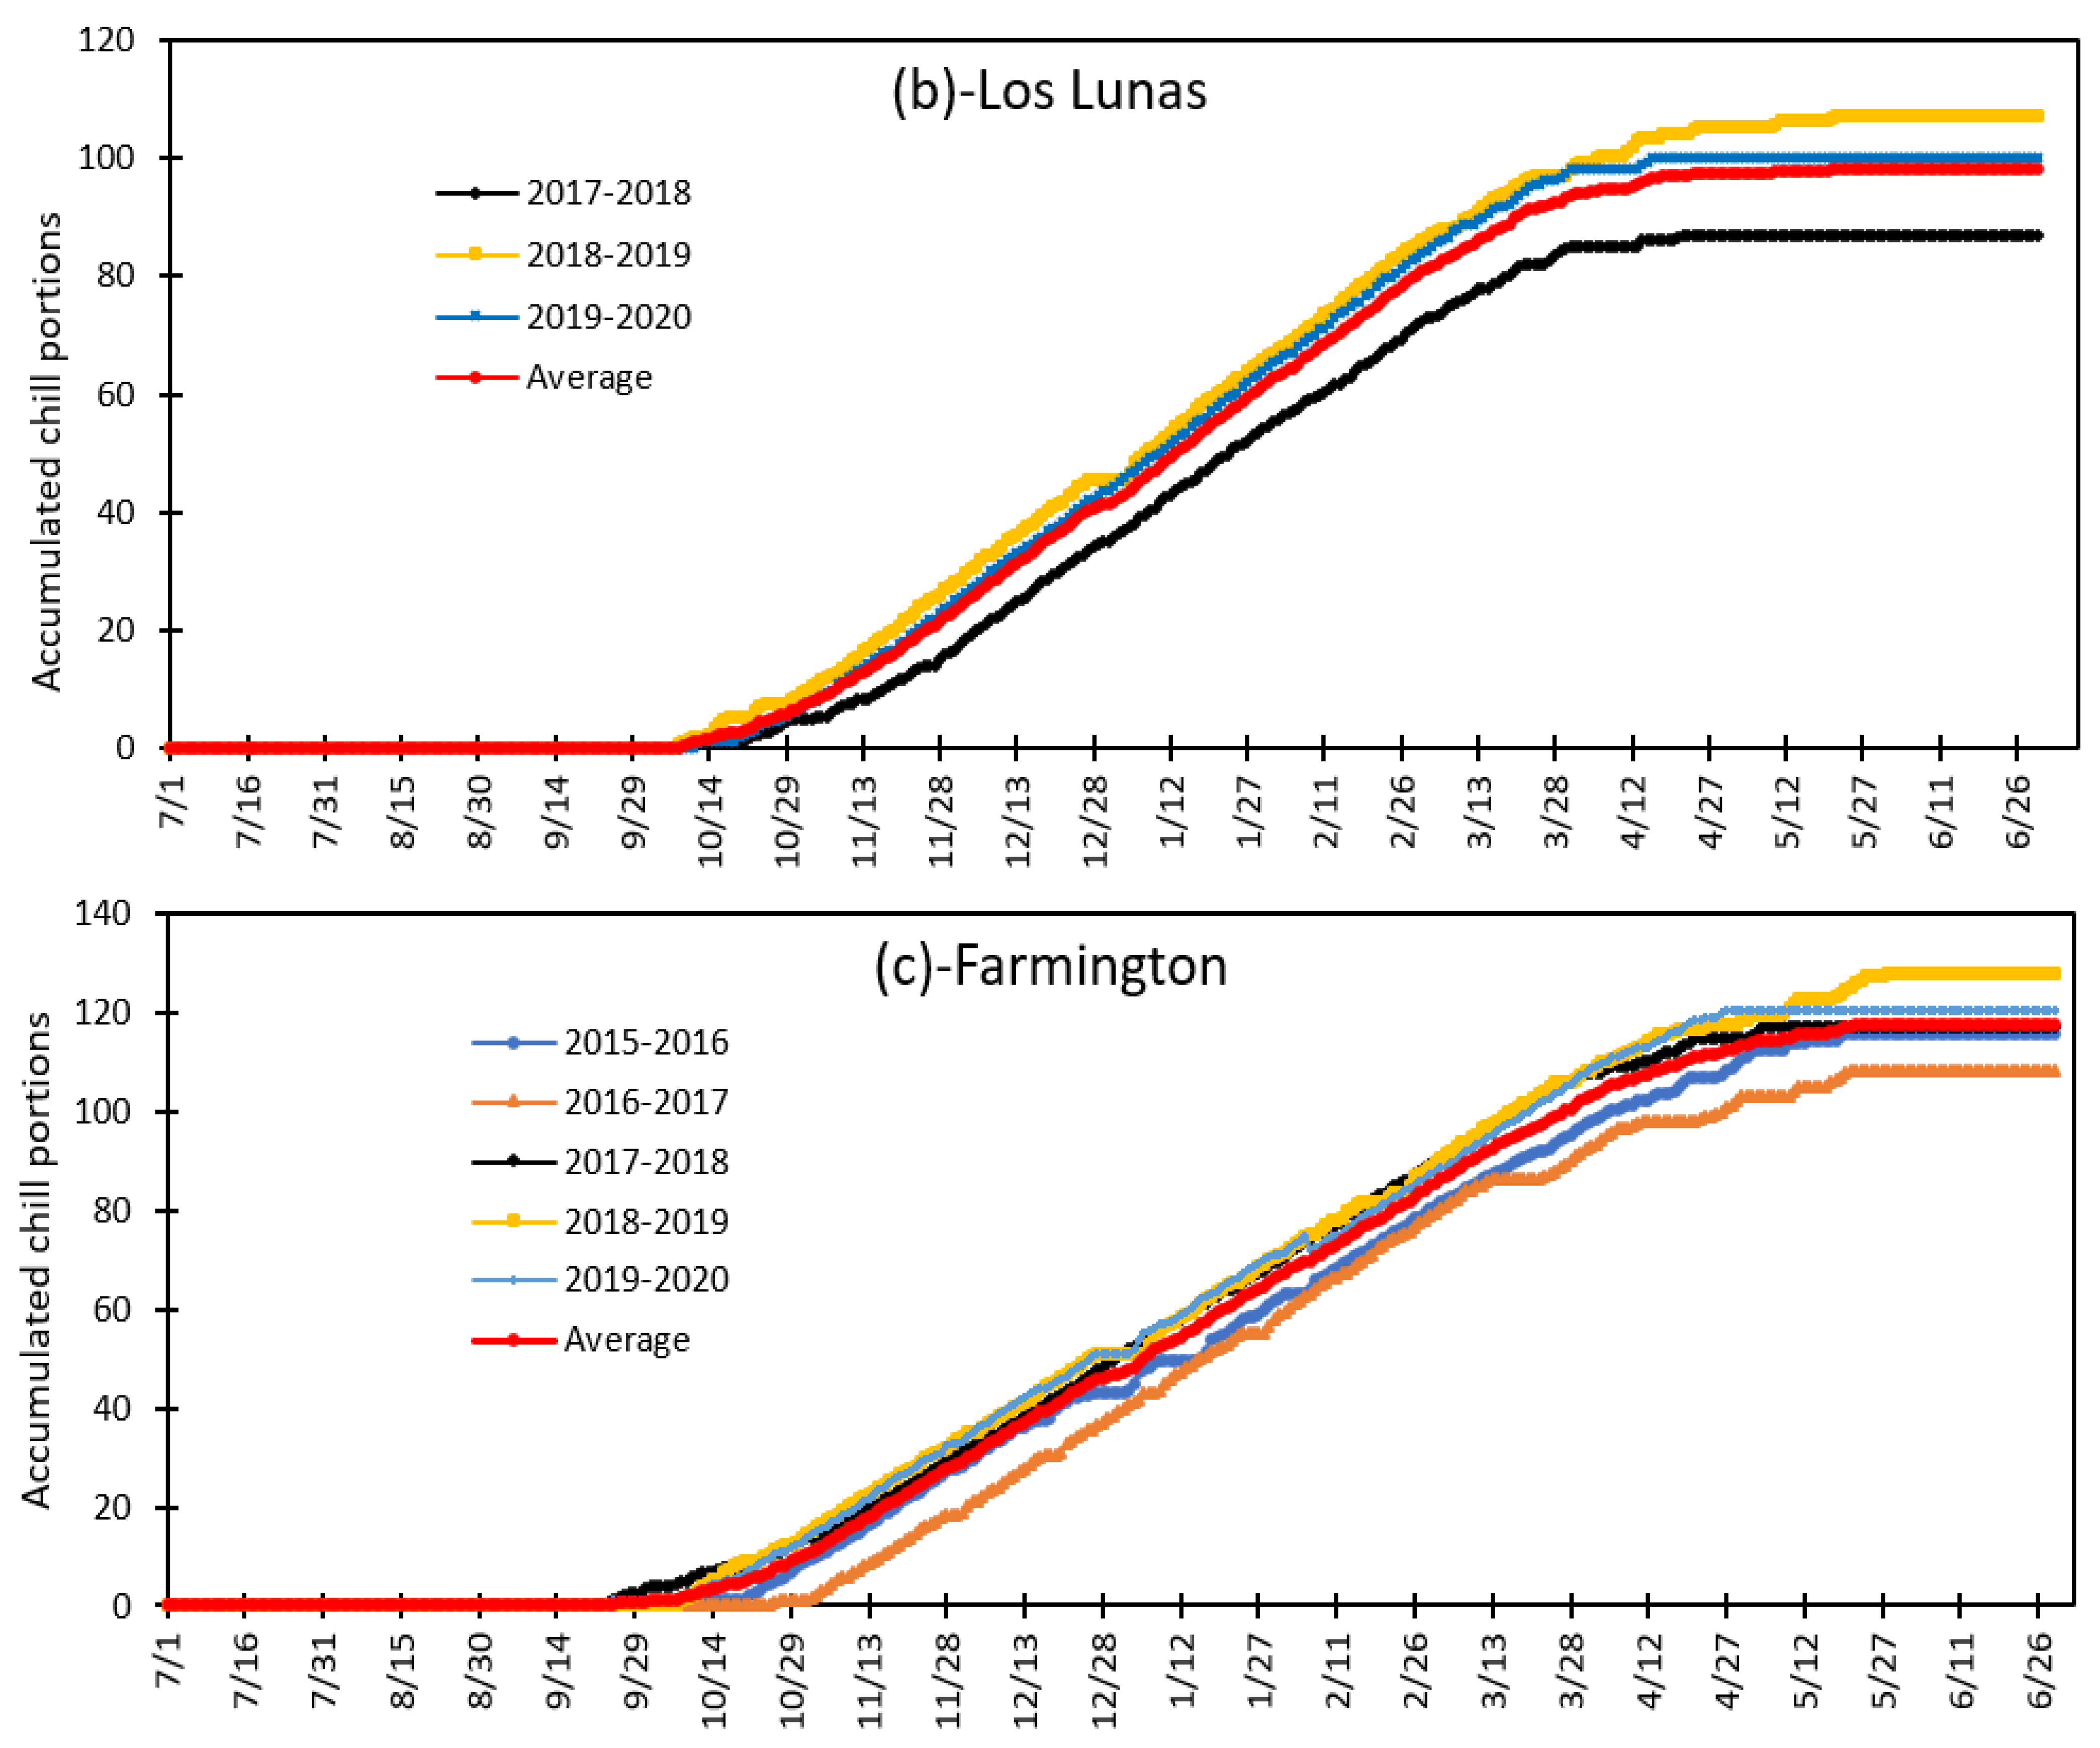
3.4. Variation in Daily Chill Portion and Seasonal Total Chill Portion during Fruit and Nut Trees Endodormancy at Fabian Garcia, Los Lunas and Farmington during the 2015 to 2020 Period

The Dynamic model estimated chill portion during the fruit and nut trees growing season is presented in Figure 5. On average according to the Dynamic model, the chill portion started accumulating as late as the end of December at Fabian Garcia while it started accumulating by early to mid-October at Los Lunas and Farmington (Figure 5). The total growth season chill portion varied from 58 to 85 chill portions and averaged 68 chill portions at Fabian Garcia (Figure 5a). It varied from 87 to 107 chill portions and averaged 98 chill portions at Los Lunas (Figure 5b) while it varied from 108 to 128 chill portions and averaged 118 chill portions at Farmington (Figure 5c). However, the magnitude of the total chill portions of the trees during the growing season are not ergonomically and physiologically important for fruit and nut trees production at the study sites. In contrast, the accumulated chill portions during trees endodormancy are physiologically most important for tree production. As the endodormancy period of the fruit and nut trees varied with the study site, the physiologically possible chill portions at Fabian Garcia, Los Lunas, and Farmington are presented in Table 3 and varied from 0 to 33.8 CP and averaging 9.26 ± 13.9 CP at Fabian Garcia, from 36.4 to 45.7 CP and averaging 42.23 ± 5.08 CP at Los Lunas, and from 53.5 to 57.9 CP and averaging 56.14 ± 1.84 CP at Farmington. It is important to indicate that the effective chill portions at Fabian Garcia were as low as 5.9 CP during four growing seasons out of five (80% of seasons) and averaged 3.12 ± 3.05 CP and should be considered for decision-making regarding tree species and cultivars choice by fruit and nut producers to minimize the risk of non-productive fruit trees which will never meet their chill requirement in Fabian Garcia region.

3.5. Vulnerability of Flower Bud to Early Spring Low Temperatures at Fabian Garcia, Los Lunas, and Farmington

The ecodormancy basically ends at the latest by mid-March with flower blooming and fruit formation and development in Fabian Garcia area. The daily average air temperature never reached the kill freezing temperature of −2 °C at Fabian Garcia. It increased and remained above 4 °C at the beginning of February, above 9 °C from 16 February toward the end of April (Figure 6c). Therefore, there is no risk of frost damage on the flower bud of fruit and nut trees in the Fabian Garcia area. However, due to the variability of climate and hazardous abrupt change in climate variables, we considered looking into the hourly air temperature during early spring period. Figure 7 presents the changes in the hourly air temperature at Fabian Garcia. Hourly air temperature fell below 0 °C the latest around the last week of February during the 2015–2020 period at Fabian Garcia and there is a minimal risk of frost damage on the bud and flower and young fruits and nuts.
Daily air temperature was below −2 °C mostly in January in 2018 and only once early 2020 February at Los Lunas. Air temperature reached −2 °C late 2019 February. Daily air temperature was above 0 °C by the end of February and steadily increased as in March and April, (Figure 6b) minimizing the risk of vulnerability of trees flower bud as the ecodormancy ends early April at Los Lunas. The close look at the hourly air temperature at Los Lunas (Figure 8), in opposite to Fabian Garcia, hourly temperature was below 0 °C several times in January and February 2018, 2019, and 2020. Hourly air temperature was below 0 °C few times in March each season and as late as 15 April 2018, 14 April 2019, and 15 April 2020. The occurrence of the 0 and or negative temperature mid-April remains a recurrent risk for fruit and nut trees production at Los Lunas as the ecodormancy might end the latest in early April and exposing the flowers and or young fruits or nuts to frost damage. The damage might be more important up to the loss of the whole annual production in the case of early flowering trees species with low chilling and heat requirements.
At Farmington, daily air temperature was below the kill freezing temperature of −2 °C several days every spring and the latest was early March and it increased thereafter (Figure 6c). However, the daily temperature was 0 °C on very few days even at the beginning of April, implying higher risk of bud flower, flower, and young fruit and nuts exposure to frost at Farmington. The hourly air temperature shown in Figure 9 was null and negative instantaneously until the end of 2016 April 2017, mid-April 2019, and 2020. As the ecodormancy theoretically ends from mid to end April, there is a very high probability for the bud flower to be under frost damage risk and the young fruits and nuts of the early flowering and low heat requirements trees to be exposed to frost damage at Farmington where a very late frost usually occurs during the third week of May [56].

4. Discussion

The present study simulated the chilling and heat that the fruit and nut trees could possibly accumulate at Fabian Garcia, Los Lunas, and Farmington during the 2015–2020 period. As summarized in Table 3, chill accumulation was very low as 3.12 CP at Fabian Garcia and 42.23 and 56.14 CP at Los Lunas and Farmington, respectively. This study provided the small and commercial fruit trees and nuts producers as well as urban back yard gardeners with the basic information for fruit trees choice with reference to their locations and the chill and heat requirements as compared to the values in Table 3. As an example, the Table 4 gives some fruit and nut trees chill and heat requirements across the globe and we strongly recommend reader, decision-makers, and fruit trees growers to refer to a larger study record across the literature as the heat and chilling requirements vary greatly within the same tree species.
While other sources of fruit and nut trees phenology data could be used in the present study to validate the selected models, fruit and nut trees orchards create a microclimate specific plant growth environment and the climatic conditions in the leaf canopy is usually influenced by light intensity, temperature, and relative humidity. Several satellites are used for terrestrial vegetation phenology monitoring, however, a strong deviation of ground base phenology data from the satellite-based data is observed and the relationship is stage dependent [57,58]. Fan et al. [59] pointed that remote sensing observations are at the plant population or plant community level and ground observations are at the level of individual species and differences in phenological observations may result from the difference in observation scales. Therefore, ground-observed phenology might offer a better and accurate data set with high temporal resolution and detailed information about individual fruit and nut tree species [60]. Schwartz et al. [61] indicated that satellite remote sensing allows exploration of landscape phenological events while ground phenological performance observations are plant species specific during the vegetation period. Nezval et al. [62] demonstrated that the modern method of phenological observation by phenocameras is suitable for mixed forests, but classical ground-based observations by a phenologist are still crucial in order to verify the simulated results using the meteorological approach.
In New Mexico, the timing of fruit and nut trees flowering is critical for the yield and the profitability and early emergence is risky and put crop growth and reproduction under early spring frost conditions. There is greater risk or flower bud vulnerability to low temperature in early spring at Farmington and Los Lunas than at Fabian Garcia as shown by Figure 7, Figure 8 and Figure 9 and the long-term absolute minimum temperature and average temperature data presented in Table 2. Rodriido [63] reported that the buds lose their cold tolerance ability at the onset of swelling. Frost is the main cause to economic losses in fruit production across the United States [64]. Frost has multiple effects as it can physically damage plant tissue [65,66], cause cellular deshydratation with development of ice crystals [67], diseases infestation through cellular lesions and loss of buds and shoots from 60 to 100% during seven seasons out of eight [66]. Salazar-Gutiérrez et al. [68,69] reported that early spring frosts cause significant injury to floral tissue of sweet cherry and apples and is a resinous problem for fruit trees growers and commercial producers in the Pacific Northwest and other regions of the United States. The risk reported in the present study might be greater for the fruit trees planted in the valley and flood plains in New Mexico. In fact, air temperature is usually lower in the valley and flood plains than on the plateaus during winter time. The research sites under this study are located on the plateaus. Personal communication with fruit trees growers in Farmington area indicated 75% of production loss due to the impact of spring frost on buds, flowers, and young fruits such as apples, sweet cherries, plums, apricots, and peaches.
While this study might provide some guidelines for fruit and nut trees production across the state of New Mexico, it is lacking real field data to confirm the models’ performance. Across New Mexico, apples are much more grown in Bernalillo, Rio Amba, Santa Fe, Sandoval, Taos, San Miguel, Dona Ana, and San Juan counties; apricots in Bernalillo, Rio Amba, Otero, and Santa Fe, Taos, and Valencia counties; cherries in Bernalillo, Rio Amba, Otero, Mora Taos, Valencia counties; grapes in Cibola, Dona Ana, Lincoln, Otero, Rio Amba, Sandoval, San Juan, San Migel, and Socorro counties; pomegranates in Otero, Sierra, and Dona Ana counties; and the nuts (pecans, almonds, chestnuts, walnuts, hazelnuts, and pistachios) are grown in Dona Ana, Eddy, Chaves, Otera, Bernalillo, Lea, Grant, Luna, Sandoval, Sierra, and Valencia counties [52]. It is therefore critical to estimate the chilling and heat requirements for the grapes, cherries, apples, apricots, plums, almonds, peaches, pecans, and other fruit and nuts trees grown across New Mexico for fruit and nut tree production viability and for the profitability of the production system for increasing the revenue of fruit and nut tree growers.
With the global combined ocean and air temperature increase of 0.65–1.06 °C during the 1880–2012 period [70] in general and with the overall increase in annual maximum temperature at the rates that varied from 0.6 to 3.1 °C per century and the increase in the minimum temperatures at the rates that varied from 0.1 to 8 °C over the last century across the southwest Unites States [71], there could be a shift from plant vegetative to reproductive phase in response to the elevated temperature [72]. Campoy et al. [3] indicated that climate change may significantly alter fruit and nut trees growth and reproduction with a reducing impact of the production. Santos et al. [73] projected increase in heat accumulation and decrease in chilling accumulation in Portugal. Lagave et al. [74] and Guo et al. [75] reported anticipated plant phenological timing in fruit trees. Projections showed advancing trends in bloom dates of different fruit and nut trees with changing dormancy breaking processes [76,77]. The shift in air temperature could be beneficial or detrimental to the fruit quality depending on the chilling and heat requirements of the fruit tree species [74,78] which affect budburst, flowering, and fruit maturation [79,80]. With the elevated temperature conditions, chilling accumulation is expected to start later and end earlier with lengthening effect on the endodormancy but shortening chilling accumulation period [81] and this phenomenon will be more pronounced in the regions with mild winter [82,83]. At Fabian Garcia where chill portion is almost null, chilling accumulation risks do not exist and some fruit and nut trees species and cultivars may not be viable at Fabian Garcia while the bud or flower or young fruit vulnerability may be increased at Farmington and Los Lunas. This aligned with Wang et al. [84] who suggested that with the global warming, southward planting has become difficult than the northward planting in the northern hemisphere. Luedeling [16] reported that projections of future chill indicate substantial losses for the warmest growing regions, while temperate regions will experience relatively little change, and cold regions may even see chill increases. Benmoussa et al. [85] reported a decline in the projected winter chilling accumulation by almond, pistachio, and peach cultivars in Tunisia and by the year 2100, pistachios and peaches may experience alarming chill shortfalls and only almonds may remain viable. However, the major source of variation and inaccuracy in chilling assessments is the choice of the chill model used to make the assessment [16,86,87].

5. Conclusions

The Utah model and the Dynamic model were used to estimate the accumulated chill portions while the Forcing model was used for the potential heat accumulation by fruit and nut trees at Fabian Garcia, Los Lunas, and Farmington in the State of New Mexico (USA). Reasonable chill portions might have been accumulated by the fruit and trees at Los Lunas and Farmington and negligible to very low chill portions occur to be accumulated at Fabian Garcia in the Southern New Mexico. The accumulated heat during trees ecodormancy varied with locations and is not a constraint for fruit and nut production across the study area. While the results of the present study are from the meteorological approach, they could help tree growers, crop consultants, and university researchers in understanding the present trend in fruit and nut trees phenology and production across the study areas. These findings may help in the choice of fruit and/or nut trees species and cultivars across New Mexico with regards to the chilling and heat requirements of the tree species or cultivars for endodormancy and ecodormancy versus the potential accumulation of chilling and heat by the trees and reducing the risk of nonproductive fruit and nut trees under certain environment. They might also be a valuable resource for the adoption of adaptation and mitigation strategies under global warming and improve the resilience of fruit and nut trees production in New Mexico and cope with climate change. With the high probability of bud, flower, and young fruit and nut vulnerability to low temperatures early spring in Farmington and Los Lunas areas, more cold-tolerant cultivars should be adopted for the production sustainability and profitability in those areas. For the future research, in situ observation data should be collected and used to validate the applied models and to develop decision-making tools for fruit and nut trees phenology prediction across New Mexico and the neighboring regions.

Author Contributions

K.D. and S.I. conceived and designed the experiments; K.D. and K.K. performed data collection and data analysis; M.D. and S.I. contributed reagents/materials/analysis tools; K.D., K.K., S.I. and M.D. wrote the paper. All authors have read and agreed to the published version of the manuscript.

Funding

This research received no external funding.

Institutional Review Board Statement

Not applicable.

Informed Consent Statement

Not applicable.

Data Availability Statement

Not applicable.

Acknowledgments

We completed this work with the support of New Mexico State University (NMSU) and the Agricultural Science Center at Farmington.

Conflicts of Interest

The authors declare no conflict of interest.

References

  1. Delpierre, N.; Vitasse, Y.; Chuine, I.; Guillemot, J.; Bazot, S.; Rutishauser, T.; Rathgeber, B.K.C. Temperate and boreal forest tree phenology: From organ-scale processes to terrestrial ecosystem models. Ann. For. Sci. 2016, 73, 5–25. [Google Scholar] [CrossRef] [Green Version]
  2. Luedeling, E.; Gebauer, J.; Buerkert, A. Climate change effects on winter chill for tree crops with chilling requirements on the Arabian Peninsula. Clim. Chang. 2009, 96, 219–237. [Google Scholar] [CrossRef] [Green Version]
  3. Campoy, J.A.; Ruiz, D.; Cook, N.; Allderman, L.; Egea, J. Clinal variation of dormancy progression in apricot. S. Afr. J. Bot. 2011, 77, 618–630. [Google Scholar] [CrossRef] [Green Version]
  4. Luedeling, E.; Brown, P.H. A global analysis of the comparability of winter chill models for fruit and nut trees. Int. J. Biometeorol. 2011, 55, 411–421. [Google Scholar] [CrossRef] [Green Version]
  5. Vitasse, Y.; Signarbieux, C.; Fu, Y.H. Global warming leads to more uniform spring phenology across elevations. Proc. Natl. Acad. Sci. USA 2018, 115, 1004–1008. [Google Scholar] [CrossRef] [Green Version]
  6. Fu, Y.H.; Piao, S.; Vitasse, Y.; Zhao, H.; DeBoeck, H.J.; Liu, Q.; Yang, H.; Weber, U.; Hänninen, H.; Janssens, I.A. Increased heat requirement for leaf flushing in temperate woody species over 1980–2012: Effects of chilling, precipitation and insolation. Glob. Chang. Biol. 2015. [Google Scholar] [CrossRef] [PubMed]
  7. Fu, Y.H.; Piao, S.; Zhou, X.; Geng, X.; Hao, F.; Vitasse, Y.; Janssens, I.A. Short photoperiod reduces the temperature sensitivity of leaf-out in saplings of Fagus sylvatica but not in horse chestnut. Glob. Chang. Biol. 2019, 25, 1696–1703. [Google Scholar] [CrossRef]
  8. Hart, R.; Salick, J.; Ranjitkar, S.; Xu, J. Herbarium specimens show contrasting phenological responses to Himalayan climate. Proc. Natl. Acad. Sci. USA 2014, 111, 10615–10619. [Google Scholar] [CrossRef] [Green Version]
  9. Schieber, B.; Kubov, M.; Janík, R. Effects of climate warming on vegetative phenology of the common beech Fagus sylvatica in a submontane Forest of the Western Carpathians: Two decades analysis. Pol. J. Ecol. 2015, 65, 339–351. [Google Scholar] [CrossRef]
  10. Signarbieux, C.; Toledano, E.; Sanginés de Carcer, P.; Fu, Y.H.; Schlaepfer, R.; Buttler, A.; Vitasse, Y. Asymmetric effects of cooler and warmer winters on beech phenology last beyond spring. Glob. Chang. Biol. 2017, 23, 4569–4580. [Google Scholar] [CrossRef]
  11. Yu, L.; Han, Y.; Jiang, Y.; Dong, T.; Lei, Y. Sex-specific responses of bud burst and early development to nongrowing season warming and drought in Populus cathayana. Can. J. For. Res. 2018, 48, 68–76. [Google Scholar] [CrossRef]
  12. Fu, Y.H.; Zhao, H.; Piao, S.; Peaucelle, M.; Peng, S.; Zhou, G.; Ciais, P.; Huang, M.; Menzel, A.; Peñuelas, J.; et al. Declining global warming effects on the phenology of spring leaf unfolding. Nature 2015, 526, 104–107. [Google Scholar] [CrossRef] [Green Version]
  13. Lang, G.A.; Early, J.D.; Martin, G.C.; Darnell, R.L. Endo, para-, and ecodormancy: Physiological terminology and classification for dormancy research. HortScience 1957, 22, 371–377. [Google Scholar]
  14. Basler, D.; Körner, C. Photoperiod and temperature responses of bud swelling and bud burst in four temperate forest tree species. Tree Physiol. 2014, 34, 377–388. [Google Scholar] [CrossRef] [Green Version]
  15. Harrington, R.; Anton, C.; Dawson, T.P.; De Bello, F.; Feld, C.K.; Haslett, J.R.; Kluvánková, T.; Kontogianni, A.; Lavorel, S.; Luck, G.W.; et al. Ecosystem services and biodiversity conservation: Concepts and a glossary. Biodivers. Conserv. 2010, 19, 2773–2790. [Google Scholar] [CrossRef]
  16. Luedeling, E. Climate change impacts on winter chill for temperate fruit and nut production: A review. Sci. Hortic. 2012, 144, 218–229. [Google Scholar] [CrossRef] [Green Version]
  17. Guo, L.; Xu, J.C.; Dai, J.H.; Cheng, J.M.; Luedeling, E. Statistical identification of chilling and heat requirements for apricot flower buds in Beijing China. Sci. Hortic. 2015, 195, 138–144. [Google Scholar] [CrossRef]
  18. Chen, L.; Huang, J.G.; Ma, Q.; Hänninen, H.; Rossi, S.; Piao, S.; Bergeron, Y. Spring phenology at different altitudes is becoming more uniform under global warming in Europe. Glob. Chang. Biol. 2018, 24, 3969–3975. [Google Scholar] [CrossRef] [PubMed]
  19. Guo, L.; Dai, J.; Ranjitkar, S.; Yu, H.; Xu, J.; Luedeling, E. Chilling and heat requirements for flowering in temperate fruit trees. Int. J. Biometeorol. 2014, 58, 1195–1206. [Google Scholar] [CrossRef] [PubMed]
  20. Luedeling, E.; Gassner, A. Partial Least Squares regression foranalyzing walnut phenology in California. Agric. For. Meteorol. 2012, 158, 43–52. [Google Scholar]
  21. Luedeling, E.; Guo, L.; Dai, J.; Leslie, C.; Blanke, M.M. Differential responses of trees to temperature variation during the chilling and forcing phases. Agric. For. Meteorol. 2013, 181, 33–42. [Google Scholar] [CrossRef] [Green Version]
  22. Weinberger, J.H. Chilling requirements of peach varieties. Proc. Am. Soc. Hortic. Sci. 1950, 56, 122–128. [Google Scholar]
  23. Richardson, E.A.; Seeley, S.D.; Walker, D.R. A model for estimating the completion of rest for Redhaven and Elberta peach trees. HortScience 1974, 9, 331–332. [Google Scholar]
  24. Fishman, S.; Erez, A.; Couvillon, G.A. The temperature dependence of dormancy breaking in plants: Computer simulation of processes studied under controlled temperatures. J. Theor. Biol. 1987, 126, 309–321. [Google Scholar] [CrossRef]
  25. Fishman, S.; Erez, A.; Couvillon, G.A. The temperature dependence of dormancy breaking in plants: Mathematical analysis of a two-step model involving a cooperative transition. J. Theor. Biol. 1987, 124, 473–483. [Google Scholar] [CrossRef]
  26. Shaltout, A.D.; Unrath, C.R. Rest completion prediction model for starkrimson delicious apples. J. Am. Soc. Hortic. Sci. 1983, 108, 957–961. [Google Scholar]
  27. Melo-Abreu, J.P.; Barranco, D.; Cordeiro, A.M.; Tous, J.; Rogadoe, B.M.; Villalobos, F.J. Modelling olive flowering date using chilling for dormancy release and thermal time. Agric. For. Meteorol. 2004, 125, 117–127. [Google Scholar]
  28. Linsley-Noakes, G.C.; Allan, P. Comparison of 2 models for the prediction of rest completion in peaches. Sci. Hortic. 1994, 59, 107–113. [Google Scholar] [CrossRef]
  29. Gilreath, P.R.; Buchanan, D.W. Rest prediction model for low-chilling Sungold nectarine. J. Am. Soc. Hort. Sci. 1981, 106, 426–429. [Google Scholar]
  30. Linvill, D.E. Calculating chilling hours and chill units from daily maximum and minimum temperature observations. HortScience 1990, 25, 14–16. [Google Scholar] [CrossRef] [Green Version]
  31. Erez, A.; Fishman, S.; Linsley-Noakes, G.C.; Allan, P. The dynamic model for rest completion in peach buds. Acta Hortic. 1990, 276, 165–174. [Google Scholar] [CrossRef]
  32. Erez, A. Bud dormancy; phenomenon, problems and solutions in the tropics and subtropics. In Temperate Fruit Crops in Warm Climates; Erez, A., Ed.; Kluwer Academic: Dordrecht, The Netherlands, 2000; pp. 17–48. [Google Scholar]
  33. Cesaraccio, C.; Spano, D.; Snyder, R.L.; Duce, P. Chilling and Forcing model to predict bud-burst of crop and forest species. Agric. For. Meteorol. 2004, 126, 1–13. [Google Scholar] [CrossRef]
  34. Ruiz, D.; Campoy, J.A.; Egea, J. Chilling and heat requirements of apricot cultivars for flowering. Environ. Exp. Bot. 2007, 61, 254–263. [Google Scholar] [CrossRef]
  35. Perez, F.J.; Vergara, R.; Or, E. On the mechanism of dormancy release in grapevine buds: A comparative study between hydrogen cyanamide and sodium azide. Plant Growth Regul. 2009, 59, 145–152. [Google Scholar] [CrossRef]
  36. Luedeling, E.; Zhang, M.H.; Girvetz, E.H. Climatic changes lead to declining winter chill for fruit and nut trees in California during 1950–2099. PLoS ONE 2009, 4, e6166. [Google Scholar] [CrossRef]
  37. Luedeling, E.; Hale, A.; Zhang, M.; Bentley, W.J.; Dharmasri, L.C. Remote sensing of spider mite damage in California peachorchards. Int. J. Appl. Earth Obs. 2009, 11, 244–255. [Google Scholar] [CrossRef]
  38. Luedeling, E.; Blanke, M.; Gebauer, J. Climate change effects on winter chill for fruit crops in Germany-Auswirkungen des Klimawandels auf die Verfügbarkeit von Kältewirkung (Chilling) für Obstgehölze in Deutschland. Erwerbs-Obstbau 2009, 51, 81–94. [Google Scholar] [CrossRef] [Green Version]
  39. Luedeling, E.; Zhang, M.H.; Luedeling, V.; Girvetz, E.H. Sensitivity of winter chill models for fruit and nut trees to climatic changes expected in California’s central Valley. Agric. Ecosyst. Environ. 2009, 133, 23–31. [Google Scholar] [CrossRef]
  40. Luedeling, E.; Zhang, M.; McGranahan, G.; Leslie, C. Validation of winter chill models using historic records of walnut phenology. Agric. For. Meteorol. 2009, 149, 1854–1864. [Google Scholar] [CrossRef]
  41. Zhang, J.L.; Taylor, C. The dynamic model provides the best description of the chill process on’ Sirora’ pistachio trees in Australia. HortScience 2011, 46, 420–425. [Google Scholar] [CrossRef] [Green Version]
  42. Luedeling, E.; Girvetz, H.; Semenov, M.A.; Brown, P.H. Climate change affects winter chill for temperate fruit and nut trees. PLoS ONE 2011, 6, 13. [Google Scholar] [CrossRef]
  43. Luedeling, E.; Kunz, A.; Blanke, M.M. Identification of chilling and heat requirements of cherry trees a statistical approach. Int. J. Biometeorol. 2013, 57, 679–689. [Google Scholar] [CrossRef] [Green Version]
  44. Fernandez, E.; Whitney, C.; Cuneo, I.F.; Luedeling, E. Prospects of decreasing winter chill for deciduous fruit production in Chile throughout the 21st century. Clim. Chang. 2020, 159, 423–439. [Google Scholar] [CrossRef]
  45. Campoy, J.A.; Ruiz, D.; Egea, J. Dormancy in temperate fruit trees in a global warming context: A review. Sci. Hortic. 2011, 130, 357–372. [Google Scholar] [CrossRef]
  46. Anderson, J.L.; Richardson, E.A.; Kesner, C.D. Validation of chill unit and flower bud phenology models for “Montmorency” sour cherry. Acta Hortic. 1986, 184, 71–78. [Google Scholar] [CrossRef]
  47. Djaman, K.; O’Neill, M.; Owen, C.K.; Smeal, D.; Koudahe, K.; West, M.; Allen, S.; Lombard, K.; Irmak, S. Crop Evapotranspiration, Irrigation Water Requirement and Water Productivity of Maize from Meteorological Data under Semiarid Climate. Water 2018, 10, 405. [Google Scholar] [CrossRef] [Green Version]
  48. Powel, A.; Dozier, W.; Williams, D.; Himelrick, D. Fruit Culture in Alabama. Winter Cgilling Requirements; The Alabama Cooperative Extension System (Alabama A&M University and Auburn University): Auburn, AL, USA, 2018.
  49. Alburquerque, N.; García-Montiel, F.; Carrillo, A.; Burgos, L. Chilling and heat requirements of sweet cherry cultivars and the relationship between altitude and the probability of satisfying the chill requirements. Environ. Exp. Bot. 2008, 64, 162–170. [Google Scholar] [CrossRef]
  50. Kwon, J.H.; Nam, E.Y.; Yun, S.K.; Kim, S.J.; Song, S.Y.; Lee, J.H.; Hwang, K.D. Chilling and heat requirement of peach cultivars and changes in chilling accumulation spectrums based on 100-year records in Republic of Korea. Agric. For. Meteorol. 2020, 288, 108009. [Google Scholar] [CrossRef]
  51. Benmoussa, H.; Ghrab, M.; Mimoun, M.B.; Luedeling, E. Chilling and heat requirement for local and foreign almond (Prunus dulcis Mill.) cultivars in a Mediterranean location based on 30 years of phenology records. Agric. For. Meteorol. 2017, 239, 34–46. [Google Scholar] [CrossRef]
  52. USDA-NASS. Census of Agriculture USDA; National Agricultural Statistics Service: Washington, DC, USA, 2019; p. 820.
  53. Yao, S.; Heerema, R. Fruits and Nuts for New Mexico Orchards; NMSU, Cooperative Extension Service, College of Agricultural, Consumer and Environmental Sciences: Las Cruces, NM, USA, 2014; Available online: http://aces.nmsu.edu/pubs/_h/H310.pdf (accessed on 15 December 2020).
  54. Allen, R.G.; Pereira, L.S.; Raes, D.; Smith, M. Crop evapotranspiration: Guide-lines for computing crop water requirements–FAO Irrigation and Drainage Paper 56. FAO Rome 1998, 300, D05109. [Google Scholar]
  55. Darbyshire, R.; Webb, L.; Goodwin, I.; Barlow, S. Winter chilling trends for deciduous fruit trees in Australia. Agric. For. Meteorol. 2011, 151, 1074–1085. [Google Scholar] [CrossRef]
  56. Djaman, K.; Owen, C.; West, M.M.; Allen, S.; Koudahe, K.; Darapuneni, M.; O’Neill, M. Relationship between Relative Maturity and Grain Yield of Maize (Zea mays L.) Hybrids in Northwest New Mexico for the 2003–2019 Period. Agriculture 2020, 10, 290. [Google Scholar] [CrossRef]
  57. Studer, S.; Stöckli, R.; Appenzeller, C. A comparative study of satellite and ground-based phenology. Int. J. Biometeorol. 2007, 51, 405–414. [Google Scholar] [CrossRef] [Green Version]
  58. Cui, L.; Shi, J. Evaluation and comparison of growing season metrics in arid and semi-arid areas of northern China under climate change. Ecol. Indic. 2021, 121, 107055. [Google Scholar] [CrossRef]
  59. Fan, D.; Zhao, X.; Zhu, W.; Sun, W.; Qiu, Y. An improved phenology model for monitoring green-up date variation in Leymus chinensis steppe in Inner Mongolia during 1962–2017. Agric. For. Meteorol. 2020, 291, 108091. [Google Scholar] [CrossRef]
  60. White, M.A.; Hoffman, F.; Hargrove, W.W. A global framework formonitoring phenologcal responses to climate change. Geophys. Res. Lett. 2005, 32. [Google Scholar] [CrossRef] [Green Version]
  61. Schwartz, M.D.; Reed, B.C.; White, M.A. Assessing satellite-derived start-of-season (SOS) measures in the conterminous USA. Int. J. Climatol. 2002, 22, 1793–1805. [Google Scholar] [CrossRef]
  62. Nezval, O.; Krejza, J.; Světlík, J.; Šigut, L.; Horáček, T. Comparison of traditional ground-based observations and digital remote sensing of phenological transitions in a floodplain forest. Agric. For. Meteorol. 2020, 291, 108079. [Google Scholar] [CrossRef]
  63. Rodrigo, J. Spring frost in deciduous fruit trees morphological damage and flower hardiness. Sci. Hortic. 2000, 85, 155–173. [Google Scholar] [CrossRef]
  64. Chmielewski, F.M.; Götz, K.P.; Weber, K.C.; Moryson, S. Climate change and spring frost damages for sweet cherries in Germany. Int. J. Biometeorol. 2018, 62, 217–228. [Google Scholar] [CrossRef]
  65. Cittadini, E.D.; de Ridder, N.; Peri, P.L.; Keulen, H.V. A method for assessing frost damage risk in sweet cherry orchards of South Patagonia. Agric. For. Meteorol. 2006, 141, 235–243. [Google Scholar] [CrossRef]
  66. Inouye, D.W. Effects of climate change on phenology, frost damage, and floral abundance of montane wildflowers. Ecology 2008, 89, 353–362. [Google Scholar] [CrossRef] [PubMed] [Green Version]
  67. Pearce, R.S. Plant freezing and damage. Ann. Bot. 2001, 87, 417–424. [Google Scholar] [CrossRef]
  68. Salazar-Gutierrez, M.R.; Chaves, B.; Anothai, J.; Whiting, M.; Hoogenboom, G. Variation in cold hardiness of sweet cherry flower buds through different phenological stages. Sci. Hortic. 2014, 172, 161–167. [Google Scholar] [CrossRef]
  69. Salazar-Gutierrez, M.R.; Chaves, B.; Hoogenboom, G. Freezing tolerance of apple flower buds. Sci. Hortic. 2016, 198, 344–351. [Google Scholar] [CrossRef]
  70. IPCC. Climate Change 2013: The Physical Science Basis. Contribution of Working Group 1 to the Fifth Assessment Report of the Intergovernmental Panel on Climate Change; Stocker, T.F., Qin, D., Plattner, G.K., Tignor, M., Allen, S.K., Boschung, J., Nauels, A., Xia, Y., Bex, C., Midgley, P.M., Eds.; Cambridge University Press: Cambridge, UK, 2016; p. 1535. [Google Scholar]
  71. Djaman, K.; Koudahe, K.; Bodian, A.; Diop, L.; Ndiaye, P.M. Long-Term Trend Analysis in Annual and Seasonal Precipitation, Maximum and Minimum Temperatures in the Southwest United States. Climate 2020, 8, 142. [Google Scholar] [CrossRef]
  72. Balasubramanian, S.; Sureshkumar, S.; Lempe, J.; Weigel, D. Potent induction of Arabidopsis thaliana flowering by elevated growth temperature. PLoS Genet. 2006, 2, 0980–0989. [Google Scholar] [CrossRef]
  73. Santos, J.A.; Costa, R.; Fraga, H. Climate change impacts on thermal growing conditions of main fruit species in Portugal. Clim. Chang. 2017, 140, 273–286. [Google Scholar] [CrossRef]
  74. Legave, J.M.; Guedon, Y.; Malagi, G.; El Yaacoubi, A.; Bonhomme, M. Differentiated responses of apple tree floral phenology to global warming in contrasting climatic regions front. Plant Sci. 2015, 6, 13. [Google Scholar] [CrossRef] [Green Version]
  75. Guo, L.; Dai, J.; Ranjitkar, S.; Xu, J.; Luedeling, E. Response of chestnut phenology in China to climate variation and change. Agric. For. Meteorol. 2013, 180, 164–172. [Google Scholar] [CrossRef]
  76. Guédon, Y.; Legave, J.M. Analyzing the time-course variation of apple and pear tree dates of flowering stages in the global warming context. Ecol. Model. 2008, 219, 189–199. [Google Scholar] [CrossRef] [Green Version]
  77. Legave, J.M.; Giovannini, D.; Christen, D.; Oger, R. Global warming in Europe and its impacts on floral bud phenology in fruit species. Acta Hortic. 2009, 838, 21–22. [Google Scholar] [CrossRef]
  78. Santesteban, L.G.; Miranda, C.; Royo, J.B. Average dates and accumulated thermal requirements for different phenophases of peach as influenced by climate. In VII International Peach Symposium, Acta Horticulturae; Girona, J., Marsal, J., Eds.; International Society for Horticultural Science: Leuven, Belgium, 2012; Volume 962, pp. 277–284. [Google Scholar]
  79. Fraga, H.; Costa, R.; Moutinho-Pereira, J.; Correia, C.M.; Dinis, L.T.; Gonçalves, I.; Silvestre, J.; Eiras-Dias, J.; Malheiro, A.C.; Santos, J.A. Modeling phenology, water status, and yield components of three Portuguese grapevines using the STICS crop model. Am. J. Enol. Viticult. 2015, 66, 482–491. [Google Scholar] [CrossRef]
  80. Moriondo, M.; Ferrise, R.; Trombi, G.; Brilli, L.; Dibari, C.; Bindi, M. Modelling olive trees and grapevines in a changing climate. Environ. Model. Softw. 2015, 72, 387–401. [Google Scholar] [CrossRef]
  81. Park, Y.; Lee, B.; Park, H. Predicted effects of climate change on winter chill accumulation by temperate trees in South Korea. Hortic. J. Preview 2018, 87, 166–173. [Google Scholar] [CrossRef] [Green Version]
  82. Atkinson, C.J.; Brennan, R.M.; Jones, H.G. Declining chilling and its impact on temperate perennial crops. Environ. Exp. Bot. 2013, 91, 48–62. [Google Scholar] [CrossRef]
  83. Baldocchi, D.; Wong, S. Accumulated winter chill is decreasing in the fruit growing regions of California. Clim. Chang. 2008, 87, S153–S166. [Google Scholar] [CrossRef]
  84. Wang, S.; Huang, C.; Tao, J.; Zhong, M.; Qu, X.; Wu, H.; Xu, X. Evaluation of chilling requirement of kiwifruit (Actinidia spp.) in south China. N. Z. J. Crop Hortic. Sci. 2017, 45, 289–298. [Google Scholar] [CrossRef]
  85. Benmoussa, H.; Luedeling, E.; Ghrab, M.; Mimoun, M.B. Severe winter chill decline impacts Tunisian fruit and nut orchards. Clim. Chang. 2020, 162, 1249–1267. [Google Scholar] [CrossRef]
  86. Wang, X.; Li, D.; Zhang, D.; Shi, X.; Wu, Y.; Qi, Z.; Ding, H.; Zhu, K.; Xia, Y.; Zhang, J. Improving crucial details and selecting the optimal model for evaluating the chilling requirement of Paeonia lactiflora Pall. at low latitudes during four winters. Sci. Hortic. 2020, 265, 109175. [Google Scholar] [CrossRef]
  87. Fernandez, E.; Whitney, C.; Luedeling, E. The importance of chill model selection-a multi-site analysis. Eur. J. Agron. 2020, 119, 126103. [Google Scholar] [CrossRef]
  88. Bailey, C.H.; Kotowski, S.; Hough, L.F. Estimate of chilling requirements of apricot selections II. Acta Hortic. 1982, 121, 99–102. [Google Scholar] [CrossRef]
  89. Kuden, A.B.; Kasaka, M.; Tanriver, E. Determining the chilling requirements and growing degree hours of some pistachionut cultivars and regions. Acta Hortic. 1995, 419, 85–90. [Google Scholar] [CrossRef]
  90. Dokoozlian, N.K. Chilling temperature and duration interact on the budbreak of ‘perlette’ grapevine cutting. HortScience 1999, 34, 1054–1056. [Google Scholar] [CrossRef] [Green Version]
  91. Egea, J.; Ortega, E.; Martínez–Gómez, P.; Dicenta, F. Chilling and heat requirements of almond cultivars for flowering. Environ. Exp. Bot. 2003, 50, 79–85. [Google Scholar] [CrossRef]
  92. Alono, J.M.; Anson, J.M.; Espiau, M.T.; Sociasi Company, R. Determination of endodormancy break in almond flower buds by a correlation model using the average temperature of different day intervals and its application to the estimation of chill and heat requirements and blooming date. J. Am. Soc. Hortic. Sci. 2005, 130, 308–318. [Google Scholar] [CrossRef] [Green Version]
  93. Okie, W.R.; Hancock, J.F. Plums. Temperate Fruit Crop Breeding; Hancock, J.F., Ed.; Springer: Amsterdam, The Netherlands, 2008; pp. 337–357. [Google Scholar]
  94. Rahemi, M.; Pakkish, Z. Determination of chilling and heat requirements of pistachio (Pistacia vera L.) cultivars. Agric. Sci. China 2009, 8, 803–807. [Google Scholar] [CrossRef]
  95. Schalau, J. Deciduous Fruit Tree Pruning. University of Arizona Cooperative Extension. 2009. Available online: https://cals.arizona.edu/yavapai/anr/hort/byg/archive/fruittreepruning2009.html (accessed on 15 June 2020).
  96. Chaar, J.; Astorga, D. Determination of the requirement of cold and heat in peach [Prunus persica (L.) Batsch.] through a correlation model. RIA Rev. Investig. Agropecu. 2012, 38, 289–298. [Google Scholar]
  97. Campoy, J.A.; Ruiz, D.; Allderman, L.; Cook, N.; Egea, J. The fulfillment of chilling requirements and the adaptation of apricot (Prunus armeniaca L.) in warm winter climates: An approach in Murcia (Spain) and the Western Cape (South Africa). Eur. J. Agron. 2012, 37, 43–55. [Google Scholar] [CrossRef]
  98. Prudencio, A.S.; Martínez-Gómez, P.; Dicenta, F. Evaluation of breaking dormancy, flowering and productivity of extra-late and ultra-late flowering almond cultivars during cold and warm seasons in south-east of Spain. Sci. Hortic. 2018, 235, 39–46. [Google Scholar] [CrossRef]
  99. Ramirez, L.; Sagredo, G.H.; Reginato, G.H. Prediction models for chilling and heat requirement to estimate full bloom of almond cultivars in the Central Valley of Chile. Acta Hortic. 2020, 872, 107–112. [Google Scholar] [CrossRef]
  100. Elloumi, O.; Ghrab, M.; Mimoun, M.B. Chilling accumulation effects on performance of pistachio trees cv. Mateur in dry and warm area climate. Sci. Hortic. 2013, 159, 80–87. [Google Scholar] [CrossRef]
  101. Ikinci, A.; Mamay, M.; Unlu, L.; Bolat, I.; Ercisli, S. Determination of heat requirements and effective heat summations of some pomegranate cultivars grown in Southern Anatolia. Erwerbs-Obstbau 2014, 56, 131–138. [Google Scholar] [CrossRef]
  102. Scott, C. Chill Requirement of Pecans. 2015. Available online: http://www.pecangrowers.org.au/here/wp-content/uploads/Pecan-Growing-Chill-Requirement-of-Pecans.pdf (accessed on 12 October 2020).
  103. Funes, I.; Aranda, X.; Biel, C.; Carbo, J.; Camps, F.; Molina, A.J.; Herralde, F.D.; Grau, B.R. Save Future climate change impacts on apple flowering date in a Mediterranean subbasin. Agric. Water Manag. 2016, 164, 19–27. [Google Scholar] [CrossRef]
  104. Yaacoubi, A.E.; Malagi, G.; Oukabli, A.; Citadin, I.; Hafidi, M.; Bonhomme, M.; Legave, J.M. Differentiated dynamics of bud dormancy and growth in temperate fruittrees relating to bud phenology adaption, the case of apple and almond trees. Int. J. Biometeorol. 2016, 60, 1695–1710. [Google Scholar] [CrossRef] [PubMed]
  105. Zhuang, W.; Cai, B.; Gao, Z.; Zhang, Z. Determination of chilling and heat requirements of 69 Japanese apricot cultivars. Eur. J. Agron. 2016, 74, 68–74. [Google Scholar] [CrossRef]
  106. Measham, P.F.; Darbyshire, R.; Turpin, S.R.; Murphy White, S. Complexity in chill calculations: A case study in cherries. Sci. Hortic. 2017, 216, 134–140. [Google Scholar] [CrossRef]
  107. Thompson, C. Georgia’s Peach Farmers Hoping for Colder Winter This Year. 2017. Available online: https://newswire.caes.uga.edu/story.html?storyid=6416secure.caes.uga.edu/extension/publications/files/pdf/B%201518_2.PDF (accessed on 21 June 2020).
  108. Montazeran, A.; Khadivi, A.; Khaleghi, A. The first report: Chilling and heat requirements of seedless barberry (Berberis vulgaris L. var. asperma). Sci. Hortic. 2018, 231, 188–193. [Google Scholar] [CrossRef]
  109. Gaeta, L.; Stellacci, A.M.; Losciale, P. Evaluation of three modelling approaches for almond blooming in Mediterranean climate conditions. Eur. J. Agron. 2018, 97, 1–10. [Google Scholar] [CrossRef]
  110. Chavez, D.; Florkowska, M.; Chen, C.; Cook, J. Home Garden Plums. University of Georgia Extension Bulletin 1518. 2019. Available online: https://secure.caes.uga.edu/extension/publications/files/pdf/B%201518_2.PDF (accessed on 12 October 2020).
  111. Díez-Palet, I.; Funes, I.; Savé, R.; Biel, C.; de Herralde, F.; Miarnau, X.; Vargas, F.; Àvila, G.; Carbó, J.; Aranda, X. Blooming under mediterranean climate: Estimating cultivar-specific chill and heat requirements of almond and apple trees using a statistical approach. Agronomy 2019, 9, 760. [Google Scholar] [CrossRef] [Green Version]
  112. Kaufmann, H.; Blanke, M. Substitution of winter chilling by spring forcing for flowering using sweet cherry as model crop. Sci. Hortic. 2019, 244, 75–81. [Google Scholar] [CrossRef]
  113. Parkes, H.; Darbyshire, R.; White, N. Chilling requirements of apple cultivars grown in mild Australian winter conditions. Sci. Hortic. 2020, 260, 108858. [Google Scholar] [CrossRef]
  114. Yang, Y.; Wu, Z.F.; Guo, L.; He, H.S.; Ling, Y.H.; Wang, L.; Zong, S.W.; Na, R.; Du, H.B.; Li, M.H. Effects of winter chilling vs. spring forcing on the spring phenology of trees in a cold region and a warmer reference region. Sci. Total Environ. 2020, 725, 138323. [Google Scholar] [CrossRef]
  115. Nasrabadi, M.; Ramezanian, A.; Eshghi, S.; Sarkhosh, A. Chilling and heat requirement of pomegranate (Punica granatum L.) trees grown under sustained deficit irrigation. Sci. Hortic. 2020, 263, 109–117. [Google Scholar] [CrossRef]
  116. Camargo-Alvarez, H.; Salazar-gutiérrez, M.; Keller, M.; Hoogenboom, G. Modeling the effect of temperature on bud dormancy of grapevines. Agric. For. Meteorol. 2020, 280, 107782. [Google Scholar] [CrossRef]
Figure 1. Schematic illustration of chilling and heat accumulation during the dormancy period as a function of time, under the assumption that chilling and heat are accumulated sequentially [2].
Sustainability 13 02524 g001
Figure 2. Daily average air temperature with standard deviation from 1 July to 30 June for the 1 July 2015 to 30 June 2020 period at (a) Fabian Garcia and (b) Los Lunas, and (c) Farmington.
Sustainability 13 02524 g002
Figure 3. Daily chill portion for the 2015–2020 period at (a) Fabian Garcia, (b) Los Lunas, and (c) Farmington (Utah model).
Sustainability 13 02524 g003
Figure 4. Daily growing degree hours for the 2015–2020 period at (a) Fabian Garcia, and (c) Farmington and for the 2017–2020 period at (b) Los Lunas.
Sustainability 13 02524 g004
Figure 5. Accumulated chill portions estimated by the Dynamic model for fruit trees growing seasons and the average accumulated chill portions at (a) Fabian Garcia, (b) Los Lunas, and (c) Farmington for the 2015–2020 period (dynamic model).
Sustainability 13 02524 g005aSustainability 13 02524 g005b
Figure 6. Variation in the daily air temperature from 1 January to 30 April during the 2016–2020 period at (a) Fabian Garcia, (b) Los Lunas, and (c) Farmington.
Sustainability 13 02524 g006aSustainability 13 02524 g006b
Figure 7. Variation in the hourly air temperature from 1 January to 30 April during the 2016–2020 period at Fabian Garcia.
Sustainability 13 02524 g007aSustainability 13 02524 g007b
Figure 8. Variation in the hourly air temperature from 1 January to 30 April during the 2018–2020 period at Los Lunas.
Sustainability 13 02524 g008aSustainability 13 02524 g008b
Figure 9. Variation in the hourly air temperature from 1 January to 30 April during the 2016–2020 period at Farmington.
Sustainability 13 02524 g009aSustainability 13 02524 g009b
Table 1. Temperature conversion to chill unit factor.
Temperature (°C)Chill Unit Accumulated
<1.40.0
1.5–2.40.5
2.5–9.11.0
9.2–12.40.5
12.5–15.90.0
16–18−0.5
>18−1.0
Table 2. Long-term monthly absolute minimum and maximum temperatures and average monthly minimum and maximum temperatures at Fabian Garcia, Los Lunas, and Farmington for the 1985–2020 period.
MonthsFabian GarciaLos LunasFarmington
Abs. TminAve. TminAbs. TmaxAve. TmaxAbs. TminAve. TminAbs. TmaxAve. TmaxAbs. TminAve. TminAbs. TmaxAve. Tmax
January−7.7 −0.7 ± 1.024.013.1 ± 1.9−15.2−3.7 ± 1.121.19.2 ± 2.0−19.4−5.7 ± 1.815.95.2 ± 1.8
February−13.91.2 ± 1.427.116.2 ± 1.8−18.4−2.3 ± 1.124.112.3 ± 1.9−19.3−4.1 ± 1.320.77.9 ± 1.8
March−7.44.3 ± 1.530.920.6 ± 1.7−7.70.4 ± 1.327.617.0 ± 1.7−11.5−1.4 ± 1.225.512.9 ± 1.8
April−2.78.1 ± 1.535.325.4 ± 1.6−5.43.9 ± 1.431.821.6 ± 1.7−7.41.7 ± 1.428.517.6 ± 1.6
May3.113.2 ± 1.139.330.4 ± 1.6−1.49.2 ± 1.337.926.8 ± 1.9−4.06.9 ± 1.536.223.3 ± 2.0
June10.718.9 ± 1.343.435.5 ± 1.65.414.9 ± 1.340.532.8 ± 1.62.312.8 ± 1.437.930.1 ± 1.7
July14.921.1 ± 1.042.534.5 ± 1.610.618.1 ± 1.040.332.7 ± 1.57.916.5 ± 1.03931.7 ± 1.5
August14.120.2 ± 1.140.833.3 ± 1.79.817.1 ± 1.137.631.3 ± 1.65.915.5 ± 1.137.029.9 ± 1.6
September6.716.5 ± 1.437.930.5 ± 1.70.712.8 ± 1.436.228.1 ± 1.5−1.110.8 ± 1.435.426.0 ± 1.5
October−3.510.2 ± 1.335.125.4 ± 1.5−7.16.1 ± 1.431.922.1 ± 1.6−9.84.1 ± 1.529.719.1 ± 1.7
November−7.03.6 ± 1.728.718.2 ± 1.9−8.4−0.2 ± 1.524.714.6 ± 2.0−12.5−1.9 ± 1.422.611.2 ± 2.2
December−8.3 −0.5 ± 1.124.312.8 ± 1.5−17.6−3.6 ± 1.120.38.9 ± 1.6−23.2−5.5 ± 1.4175.1 ± 1.5
Abs. Tmin is absolute minimum temperature; Abs. Tmax is absolute maximum temperature; Ave. Tmin is average minimum temperature; Ave. Tmax is average maximum temperature.
Table 3. Estimated chill portion, chilling hours and heat accumulation at Fabian Garcia, Los Lunas, and Farmington for the 2015–2020 period.
SitesFruit Tree Growing SeasonsEndodormancy PeriodEcodormancy PeriodChill PortionsChilling HoursAccumulated Heat (GDH)
Fabian Garcia2015–201620 October–31 December1 January–10 March33.8689.068855.81
2016–20176 November–30 December31 December–27 February0660.846947.58
2017–201821 October–31 December1 January–18 March1.6617.8211,352.27
2018–201924 October–31 December1 January–8 March5.9791.17817.70
2019–202018 October–31 December1 January–14 March3820.648702.91
Los Lunas2017–20186 October–01 January2 January–8 April36.4686.0810,748.86
2018–20195 October–03 January4 January–7 April45.7733.267845.97
2019–20204 October–01 January2 January–1 April44.6760.247544.88
Farmington2015–20167 October–17 January18 January–13 April53.5750.506316.67
2016–201726 October–29 January30 January–29 March57.9781.464475.90
2017–201824 October–11 January12 January–28 April57.9964.049894.20
2018–20191 October–6 January7 January–9 April55.1798.504007.80
2019–20205 October–6 January7 January–15 April55.7850.245228.87
Table 4. Some examples of estimated chill portions, chilling hours, and heat requirement by different fruit trees across the globe.
ReferencesLocationsTree SpeciesChill PortionsChilling HoursHeat Requirement (GDH)
Bailey et al. [88]New Jersey, USAApricots 873–1343
Anderson et al. [46] Sour cherry 9546130
Linvill [30]South Carolina, USA 65
Kuden et al. [89]California, USAPistacho 600–1050
Dokoozlian [90]California, USA 50–400
Egea et al. [91]Santomera, SpainAlmond 266–9965942–7577
Alonso et al. [92]SpainAlmond 400–600 5500–9300
Ruiz et al. [34] Calasparra, SpainApricots 596–12664078–5879
Okie et al. [93] Plums 450
Alburquerque et al. [49]Murcia, SpainSweet cherry30.4–57.6335 ± 38–1323 ± 687326–9450
Luedeling et al. [40] Walnuts 53.3–79.5700
Rahemi and Pakkish [94]IranPistachio 750–14008 852–15 420
Schalau [95]Yavapai, ArizonaFruit trees 500–1000
Chaar and Astorga [96]Junín, ArgentinaPeach 2177–6490
Luedeling [16]Klein-Altendorf, GermanyCherry68.6 ± 5.71375 ± 1783473 ± 1236
Campoy et al. [97]Western Cape, SouthAfricaApricot26.6–57.2312–1022
Campoy et al. [97]Murcia, SpainApricot31–51.8 4605–6247
Luedeling et al. [21]Beijing, ChinaChestnu79.8 ± 5.3 13466 ± 1918
Luedeling et al. [21]Klein-Altendorf, GermanyCherry104.2 ± 8.9 2698 ± 1183
Prudencio et al. [98]SpainAlmonds 49–66 308–84332,225–36,087
Raminrez et al. [99]ChileAlmonds23–32220–440 5814 ± 669–12,341 ± 637
Elloumi et al. [100]TunisiaPistachio36206
Ikinci et al. [101]TuekeyPomegranate 25,000–88,052
Guo et al. [19]Beijing, ChinaJujube89 ± 6 13,619 ± 2033
Guo et al. [19]Beijing, ChinaChestnut 93 ± 6 17,418 ± 1983
Scott Clark [102] Pecans17–83200–1000
Funes et al. [103]Girona, SpainApple 62.5–68.4 7416.2 ± 687–10,272.5 ± 1032
Yaacoubi et al. [104]Palmas, Brazil Apple 20.3–30.8 6893
Yaacoubi et al. [104]Marsillargues, FranceApple 39.1–70.8 9443
Yaacoubi et al. [104]Ain Taoujdate, Morocco Apple 64.2–67.2 5985
Yaacoubi et al. [104]Ain Taoujdate, Morocco Almonds12.4–16.4
Zhuang et al. [105]Nanjing, ChinaJapanese apricot24–82 691.9–2634.7
Benmoussa et al. [51]SfaxEl-Maou, TunisiaLocal almond3.4–15.5 3962–8873
Benmoussa et al. [51]SfaxEl-Maou, TunisiaForeign almond6.7–22.6 2894–10,504
Measham et al. [106]Western AustraliaCherries30.4–61.7
Thomppson [107]Georgia, USAPeach 800
Montazeran et al. [108]IranBarberry 14002904–3432
Gaeta et al. [109]ItalyAlmond24–62 3263–6699
Chavez et al. [110]Georgia, USAJapanese plums 500–900
Chavez et al. [110]Georgia, USAEuropian plums 700–1000
Díez-Palet et al. [111]EgyptAlmond8.40 ± 3.8–52.85 ± 6 6232 ± 1221–10,201 ± 1834
Díez-Palet et al. [111]EgyptApple 37.8 ± 2.7–54.4 ± 3 7471 ± 1191–9501 ± 1556
Kaufmann and Blanke [112] Sweet cherries 400–750 4000–13,000
Parkes et al. [113]AustraliaApple 57 ± 2.9–77 ± 1.5662 ± 44.5–908 ± 23.3
Yang et al. [114]Heilongjiang province, ChinaUlmus pumila86 5853
Yang et al. [114]Heilongjiang province, ChinaPopulus simonii86 5853
Yang et al. [114]Heilongjiang province, ChinaSyringa oblata86 5853
Nasrabadi et al. [115]IranPomegranate 605.56–7007750–9000
Kwon et al. [50]Republic of KoreaPeach21.3–74.8377–11344824–5149
Camargo-Alvarez et al. [116]Washington State, USAGrapevines 947–1162
Publisher’s Note: MDPI stays neutral with regard to jurisdictional claims in published maps and institutional affiliations.

