Article

Transitioning towards Organic Farming: Perspectives for the Future of the Italian Organic Wine Sector

1
CREA Research Centre for Agricultural Policies and Bioeconomy, 90143 Palermo, Italy
2
Independent Researcher, 90141 Palermo, Italy
*
Author to whom correspondence should be addressed.
Sustainability 2021, 13(5), 2815; https://0-doi-org.brum.beds.ac.uk/10.3390/su13052815
Submission received: 31 December 2020 / Revised: 27 February 2021 / Accepted: 2 March 2021 / Published: 5 March 2021

Abstract

:
In recent years, after the publication of Regulation (EU) 2018/848 on organic production and the labelling of organic products, all stakeholders have been considering threats and opportunities in the development of the organic food and beverage sector. The aim of the study outlined in this paper was to analyse the development prospects of the Italian organic wine sector in light of the Common Agricultural Policy (CAP) environmental and climate objectives. Specifically, the study focussed on applying a System Dynamics Approach (SDA) and a Network Analysis in order to explain how the most relevant social–economic determinants of the national organic wine sector are in all likelihood influencing the hoped-for shift from conventional to organic production. Such conversion appeared to be worth exploring because, despite the increasing global demand for organic wine, the economic effects on the entire system are still somewhat unclear from a dynamic perspective. The results of the study clearly demonstrated that public policies and regulatory actions at the national and European level will continue to be very influential for the future of the national organic wine system. Different development pathways, such as groups of operators and the adoption of the new national certification system for the sustainability of the entire wine supply chain, should be undertaken by Italian “small wine operators” in order to gain international markets.

1. Introduction

In 2018, the European Parliament and the Council of the European Union (EU) adopted the Regulation (EU) 2018/848 on organic production and the labelling of organic products and repealing Regulation (EC) No 834/2007. The regulation was intended to ensure that the objectives of the organic production policy were embedded in the objectives of the Common Agricultural Policy (CAP) by ensuring that farmers received a fair return for complying with the organic production rules [1]. In addition, it was thought that the growing consumer demand for organic products would create conditions for further development and expansion of the market in those products and consequently for an increase in farmers’ profitability.
It is now known that the new regulatory framework for organic production can actually be applied starting from 1 January 2022, since a one-year postponement has been established, because of the COVID-19 pandemic and the related public health crisis, by Regulation (EU) 2020/1693 of 11 November 2020. In such a period of time (vacatio legis), EU Member States, competent authorities, farmers, processors, and other stakeholders can prepare their administrative systems, processes, procedures, documentation, etc. for compliance with the new rules (e.g., the Integrated Administration and Control System—IACS, with which CAP expenditure is managed and controlled) [2,3].
Meanwhile, under the strategic point of view, organic production has returned to the centre of debate on the so-called “green architecture” of the new CAP [3,4], and specifically on the new “eco-schemes” options (e.g., maintenance of organic farming) and CAP Pillar II (e.g., conversion to organic farming), which can support both farmers and land managers undertaking agricultural practices beneficial for the climate, biodiversity, and the environment. In such a context, organic production has already been chosen as the main measure to place agriculture at the heart of the European Green Deal [5], as well as the EU’s Biodiversity [6] and Farm to Fork strategies [7].
In line with these strategic objectives, as the first case in the EU, Law no. 77, art. 224-ter [8] established the national certification system for the sustainability of the entire wine supply chain, including organic production, which is understood as the set of production rules and good practices defined in a specific product specification. Thus, Italian firms, responding to consumers’ requests to protect natural resources, will be able to go beyond mere compliance with production rules and will be able to demonstrate how to reconcile profits with environmental needs. Today, a premium price for sustainable wines is recognised in the most advanced markets (e.g., Northern Europe, USA, Canada) [9,10].
In the face of these challenges, there is a relevant need for studies relating dynamics, threats, and opportunities for the development of the organic food and beverage sector. This need is perhaps even stronger for wine, which is to be considered as “a differentiated product with a variety of characteristics that may interact with or cancel out the signal that the eco-label sends” [11]. In addition, the increasingly globalised wine market is facing many changes, to which “the small-scale viticulture sector in many traditional, European producer countries has not yet been able to respond appropriately” [12].
The aim of this paper is to identify and explain the consequences and implications of such a complex system on the competitiveness of the Italian organic wine production in the international market scene. In this connection, it will use as a reference the following definition of competitiveness by the European Commission [13]: “competitiveness is defined as the ability of a system to sustainably produce and sell goods and services on a given market, in such a way that buyers prefer these goods to those offered by competitors”.
Specifically, a System Dynamics (SD) model will be presented to represent, in a dynamic perspective, the relationships between the most relevant determinants affecting the transition from conventional to organic wine production, as well as the organic wine domestic supply as a whole.
The research questions that need to be answered include: What are the main drivers which affect the conversion from conventional wine growing towards organic wine production? How do these drivers interact with each other in influencing the organic wine market? How can the new European legal framework on organic wine production boost Italian organic wine exports? Which opportunities may arise for “small organic operators”?
This paper is structured as follows: Section 2 will focus on the Italian organic wine market within the broader international context. Section 3 will describe the Materials and Methods used in this study. Section 4 will outline the main Results and Discussion. The analysis will then conclude with some concluding remarks.

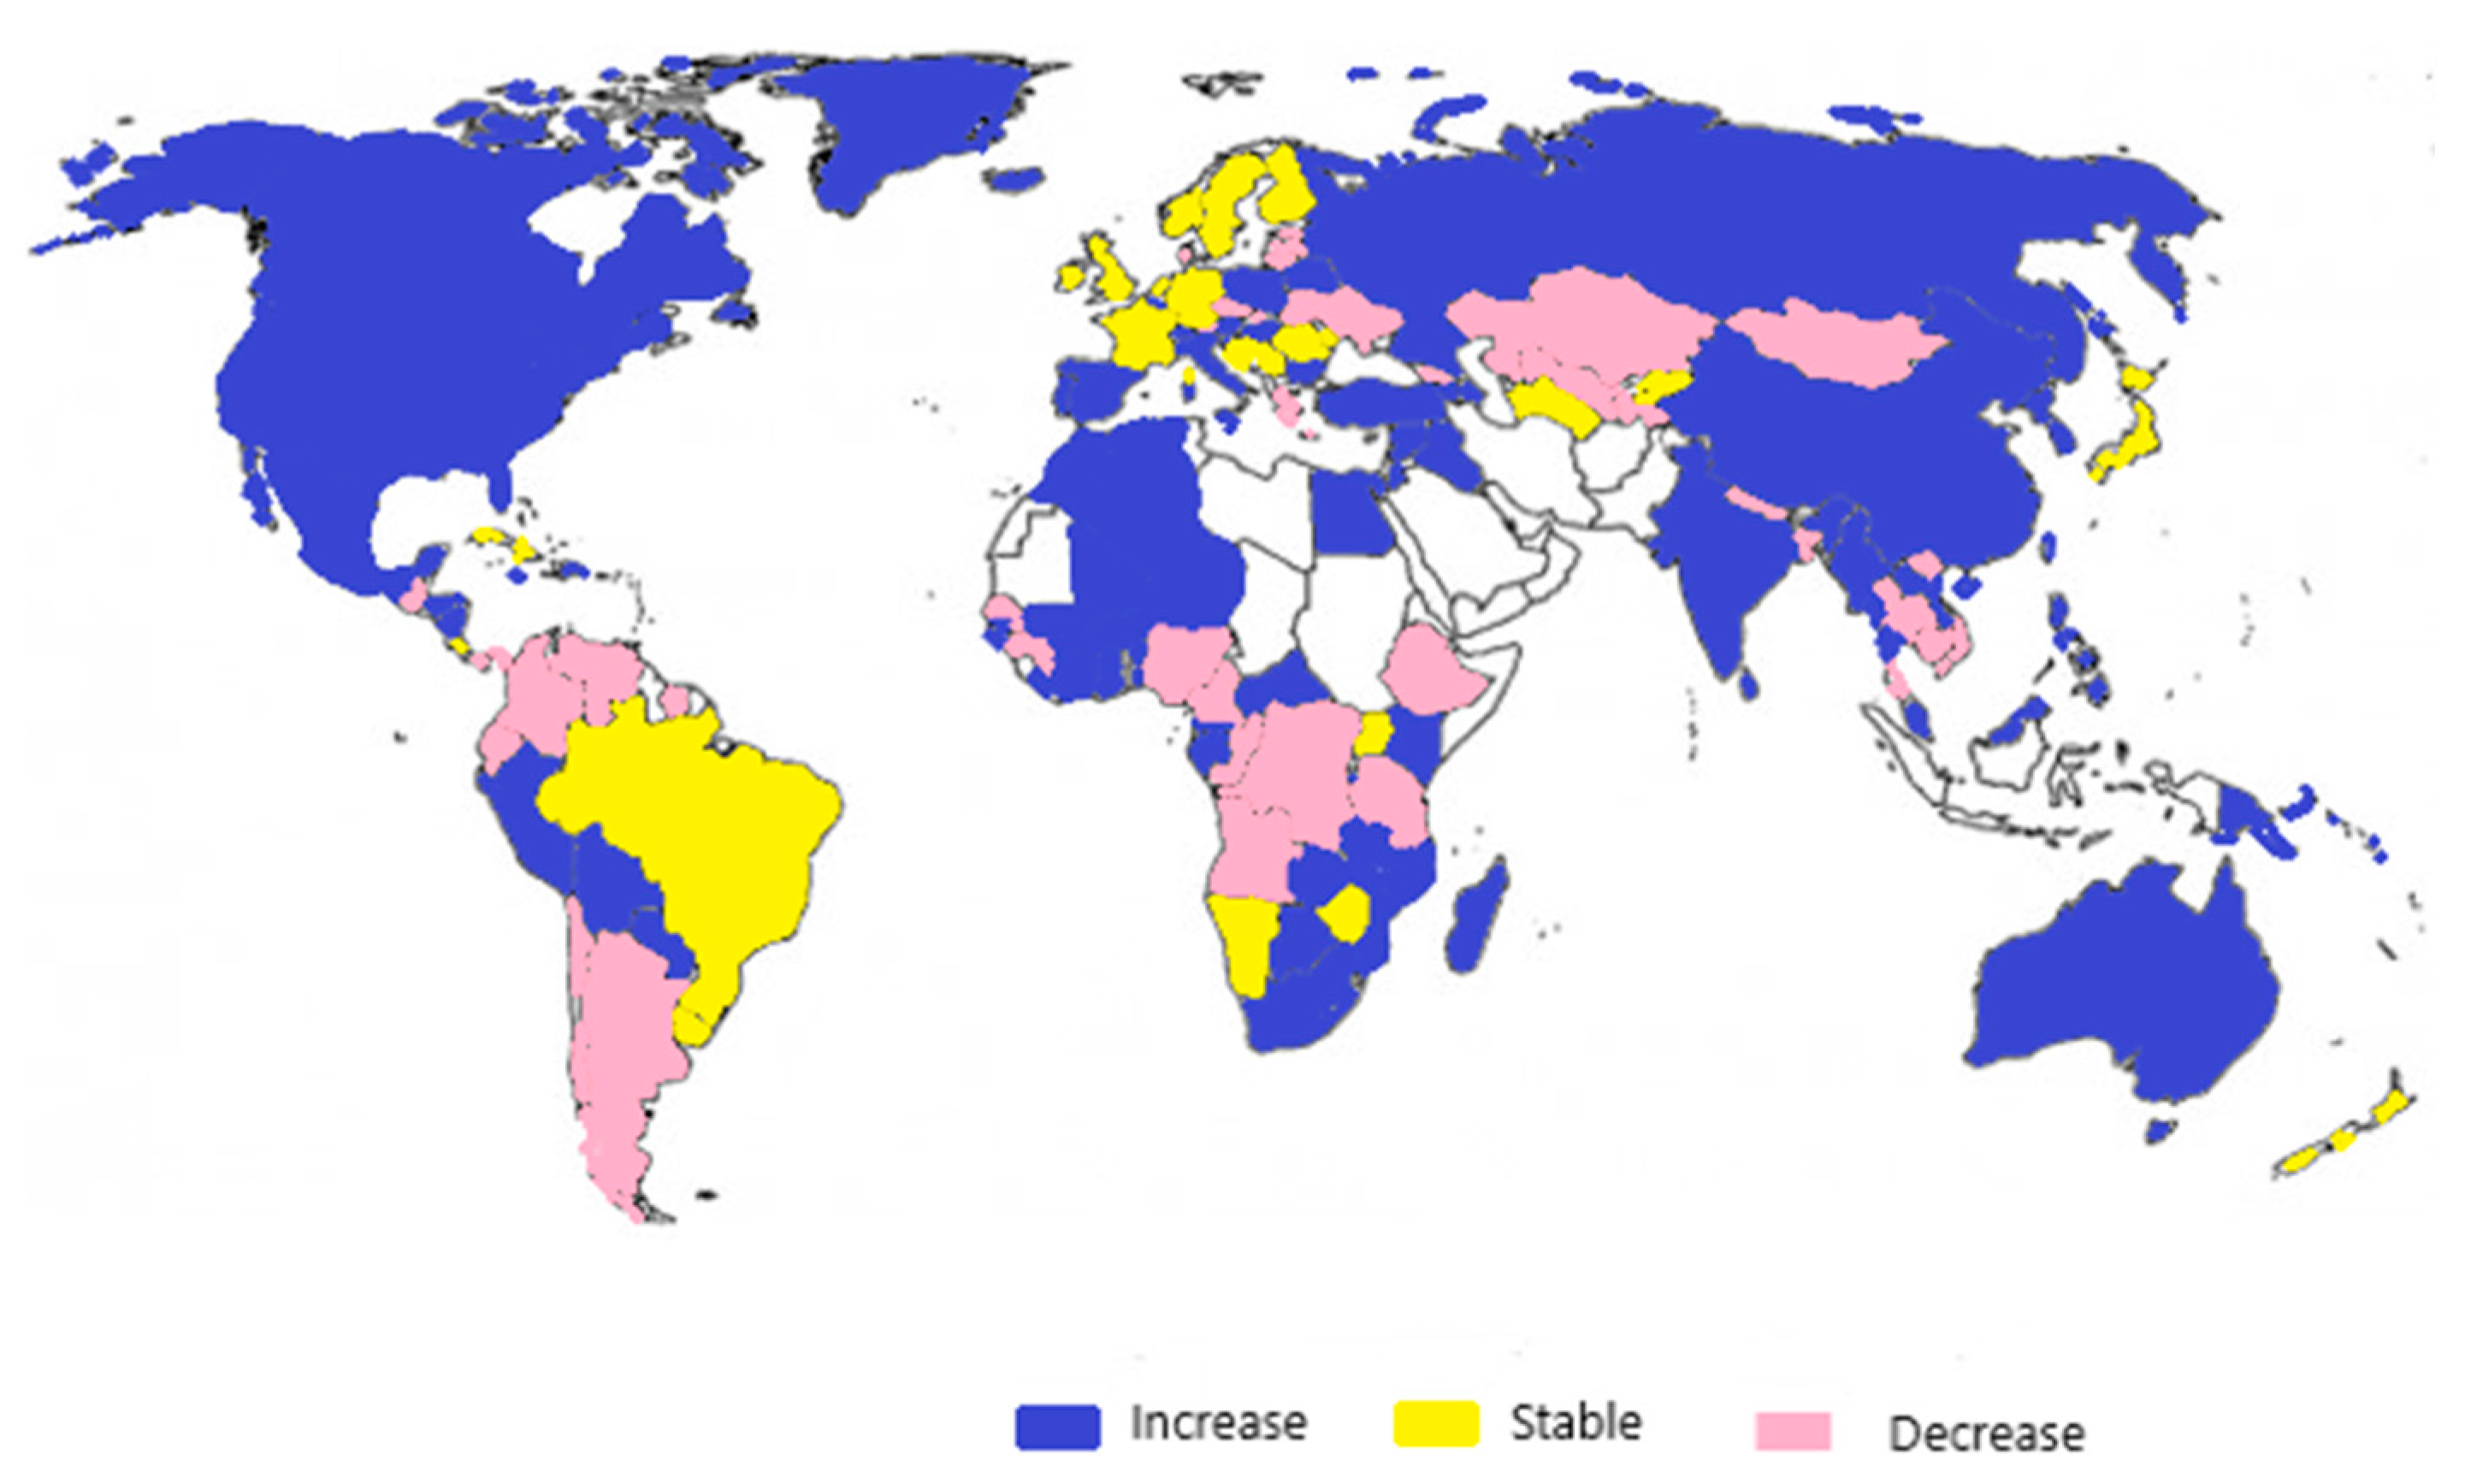
2. A Global Overview of the Wine Sector

Statistics published by the International Organisation of Vine and Wine [14] have demonstrated that, in 2019, the world wine production boasted 260 million hectolitres, and the world wine export reached a volume of 105.8 million hectolitres for a value of 31.8 billion Euros. It is interesting to note that bottled wine globally marketed represented 53% by production and 70% by value.
The global wine market is largely dominated by European countries, since France, Italy, and Spain are the biggest exporters. In 2019, these three countries together provided 53% by volume (57.1 million hectolitres) and 60% by value (18.9 billion Euros). The volume of Italian wine sold abroad was 21.6 million hectolitres for a value of 6.4 billion Euros [14]. With a share of 20.5%, Italy was the biggest exporter by volume, whereas France was the biggest exporter by value (almost 31% of share). The USA was the biggest consumer country worldwide (with 33 million hectolitres) [14,15].
In 2019, wine represented 15% by total value of Italian agri-food exports. In the same year, Italian exports of wine increased by 10.3% by volume and 3.6% by value [9]. An increasing competitiveness of Italian wine has been identified in some markets (e.g., Asiatic, East, or North European countries), which do not have a viticulture tradition and where the acknowledgement of the health characteristics of wine as an expression of an Italian lifestyle is a key factor for the success of Italian wine [16]. At the same time, France, the major Italian competitor, sold 14.2 million hectolitres for a value of 9.8 billion Euros. Therefore, it is interesting to observe that one hectolitre of wine exported from Italy was worth 296 Euros, while one hectolitre of French wine was about 688 Euros as a consequence of the different weight of bulk wine on the total exported volume from the two countries. After all, 71% of the wine placed on the international market by France was bottled [14].
Regarding consumption, in recent years (as shown in Figure 1), the trend of wine in the EU has been rather static, while it has grown in many Asian countries, in North America, and in Australia. Among the European traditional producing countries, from 2014 to 2019 in Italy and Spain, consumption grew by 16% and 13%, respectively. In 2019 in Italy the consumption of wine was equal to a total amount of 23 million hectolitres [14].
In the last 5 years, in Italy, the surface of wine grapes has increased by 3% (from 690,000 to 708,000 hectares). In the same period, wine production increased by 7.5% (from 44.2 million hectoliters to 47.5 million hectolitres) [14,17].
Of great concern are the duties imposed by the USA on French wine exports (made in Italy wines are currently exempt), which for years have been the leader in US wine imports. Considering France’s exports from November 2019 to March 2020, i.e., from the first month of full application of the additional US duty to the last pre-COVID month (a period not affected by the economic effects of the pandemic) and comparing it with the same time frame of the previous year, there has been a contraction of 24% by value and 14% by volume [18]. Brexit is also causing concern, considering that the UK is the world’s second largest wine importer (13.5 million hectolitres), just behind Germany (14.6 million hectolitres) [14].

Focus on the Italian Organic Wine Market

At the global level, the wine grape area is decreasing, while in the last 10 years, the world surface of organic grapes has increased (by 230%) [15]. Approximately 40 countries in the world have an area invested in organic wine grapes and, of these, 80% are in Europe.
The European market has lived with the problem of wine surplus for years, so marketing strategies have required changes in behavior and, among these, the qualification of production and attention to changes in consumer demand are also linked to new lifestyles. In this perspective, the conversion of conventional production to organic production is one of the winning moves in terms of market and therefore income.
Organic wine is currently one of the most important parts of the Italian food sector, with its 107,143 hectares of wine growing surface (+102% in 2019 compared with 2010) [19].
The demand for organic wine has significantly grown in recent years. In 2019, the sale of organic wine in large-scale retail grew by almost 90%. In general, new trends in food consumption are focussing on three elements at the top of the rating: made in Italy, organic food, and easy to consume. The success and increase in consumption of organic products is primarily linked to health and well-being, secondly to environmental sustainability, and ultimately to genuineness [20].
For this reason, “the wine industry, although traditionally considered fairly green [21,22], has adopted a growing number of initiatives aimed at increasing the sustainability of its practices and the quality of its products [23]”.
In Italy, many firms dedicate at least a part of their activities to organic production with the goal of differentiating them from an ecological point of view and paying attention to a rapidly growing market. In this regard, independently of the production of organic bottles, many firms have shown a greater sensitivity towards the sustainability of the production cycle through the reduction of emissions, saving of water resources, the use of renewable energy, reduction of effluents, recovery/recycling of by-products, the use of eco-packaging, etc.
It should be said that some producers of organic wine, despite compliance with the organic regulations and laws for both vineyards and wineries, have chosen not to declare it on the label until recently [24]. This is due to the prejudice, especially by some “operators” (distributors of quality wine, wine shops, restaurants) towards the quality of organic wine. This is because some important firms have preferred to inform their customers about the characteristics of sustainability of the wine and about the production process through informative advertising material rather than including the community organic logo on the label.
As stated by Delmas and Lessem [11] “when consumers buy eco-labelled wine they choose the one with an affordable price, while when they buy expensive wines they choose those of large non-organic brands”. Since price is a signal of quality in the wine industry [25,26], it can be inferred that consumers interpret eco-labels as a signal of lower quality. This price penalty persists even when another quality signal was added, such as region or territory.
According to the review by Schäufele and Hamm [27] written on the basis of 34 scientific articles published between January 2000 and March 2016 in different parts of the world, “producing and marketing wine with sustainability characteristics is a promising strategy for quality differentiation, particularly for wine that is both local and organic. Moreover, marketers, retailers and producers will likely profit from developing information campaigns with a focus on environmental, as well as social and economic aspects to increase consumers’ knowledge of sustainable wine production, thus creating preferences and influencing purchase behaviour”.
Therefore, it should be stressed that the adequacy of information campaigns is important to reduce the information asymmetry between producers and consumers, demolishing the old prejudices on organic wine, as well as conquering new important market spaces. Today, these prejudices seem to have been overcome thanks to the progress of organic processing methods and the quality of the finished product.
It is also very important to demonstrate the quality of wine through awards obtained from organic wines in prestigious events and competitions. The role of fairs is becoming increasingly important, such as Vinitaly, VinNature, Viniveri, BioFach in Nuremberg, and Millésime Bio in Montpellier; these last few focussed on the organic wine world [28].
Indeed, it should be considered that organic wine producers decide to fully manifest the nature of their organic products after their wines have been declared good or excellent [29].
One of the biggest US importers and distributors of organic and natural wines, David Bowler, has argued that today, “Organic and natural wines are considered key categories by importers (…) the interest in organic wine is part of the global food trend”; furthermore, “organic wine must be marketed by small players. If big firms get into the organic business, they will give it up. In this market, another key to success is the price, which must remain affordable. Finally, labels are strategic factors. They must reflect the slightly rebellious spirit of the offer, with a less traditional look” [30,31].

3. Materials and Methods

The study outlined in this paper used a System Dynamics Approach (SDA) [32,33,34,35,36,37], which is a methodological approach aimed at understanding the nonlinear behaviour of complex social, managerial, economic, or ecological systems over time. By complex system, what is meant is a system including a plurality of interdependent agents that demonstrate a collective behaviour not coming from the simple sum of the individual elements, but it is the expression of the mutual interaction and relationships of interdependence. The full implementation of such a methodology, which includes the application of a mathematical modelling technique with a big amount of data, leads to building an SD model aiming at solving the problem of simultaneity by updating all variables in small time increments with positive and negative feedbacks and time delays structuring the interactions and control [38].
Starting from the concept of value chain governance outlined by Goncharuk [39], it is in fact possible to argue how the challenge of environmental sustainability has made even more complex the tangle of power relations, normative work, and formal and informal rules of behaviour in the wine value chain. Therefore, SDA was chosen to identify and understand the most relevant interconnections among the determinants that affect the transition from conventional to organic wine production, including the main feedback mechanisms generated by the self-organisation [33,40,41] of the national production system in response to changes in legislation and agricultural policies.
In operational terms, a Causal Loop Diagram (CLD) was drawn by means of the Vensim PLE 7.2a software to obtain a holistic view of the determinants affecting the system. The relationships between such determinants were represented through two types of polarity: a positive link was used when the increase of a variable generated an increase in another variable compared to the condition under which the first variable did not change; conversely, a negative link was used when the increase of a variable led another variable to decrease compared to the condition under which the first variable did not change.
The analysis was performed by collating and processing data from official statistics (e.g., Italian National Information System on Organic Farming—SINAB, Italian Federation of Organic and Biodynamic Agriculture—Federbio, Wine Monitor—Nomisma, Italian Central Statistics Institute—ISTAT, International Organisation of Vine and Wine—OIV) complemented by further information from trade publications, regulations and laws, and scientific literature at the national and international level.
As shown by Table 1, the dynamics of the specific “agri-food-beverage” system examined are under the influence of four categories of drivers: economic, agro-technology, governance, and social quality.
In order to answer research questions and counterbalance the several drawbacks due to the absence of complete and comprehensive official data, SDA was integrated by using a network analysis, bearing in mind the interconnections between variables, as described in the CLD.
Network Analysis indeed provides a range of quantitative techniques that can summarise the structure of a network and quantify the importance of its elements. This suite of quantitative techniques, along with the Network Theory [42], can provide useful insights into the properties of complex systems, while analysing central drivers allows identifying leverage points. A CLD is naturally represented as a graph or network of relationships among a set of variables and thus contains data that lends itself to Network Analysis [43]. Thus, a CLD can also be represented as a network and a binary adjacency matrix with nodes x and edges representing directed causal relationships between each pair of variables xij = {0, 1}.
Structural metrics that summarised the CLD included density, average path length, diameter, and modularity. Since the CLD network was directed (not symmetric), in-degree and out-degree were considered. Furthermore, in order to gain insight into the role and importance of drivers in the diagram, other measures, such as modularity and hub, were also applied (Table 2).
Network Analysis and visualisation of results were performed by using the open software Gephi [44], which applies well-established algorithms for computing network statistics.

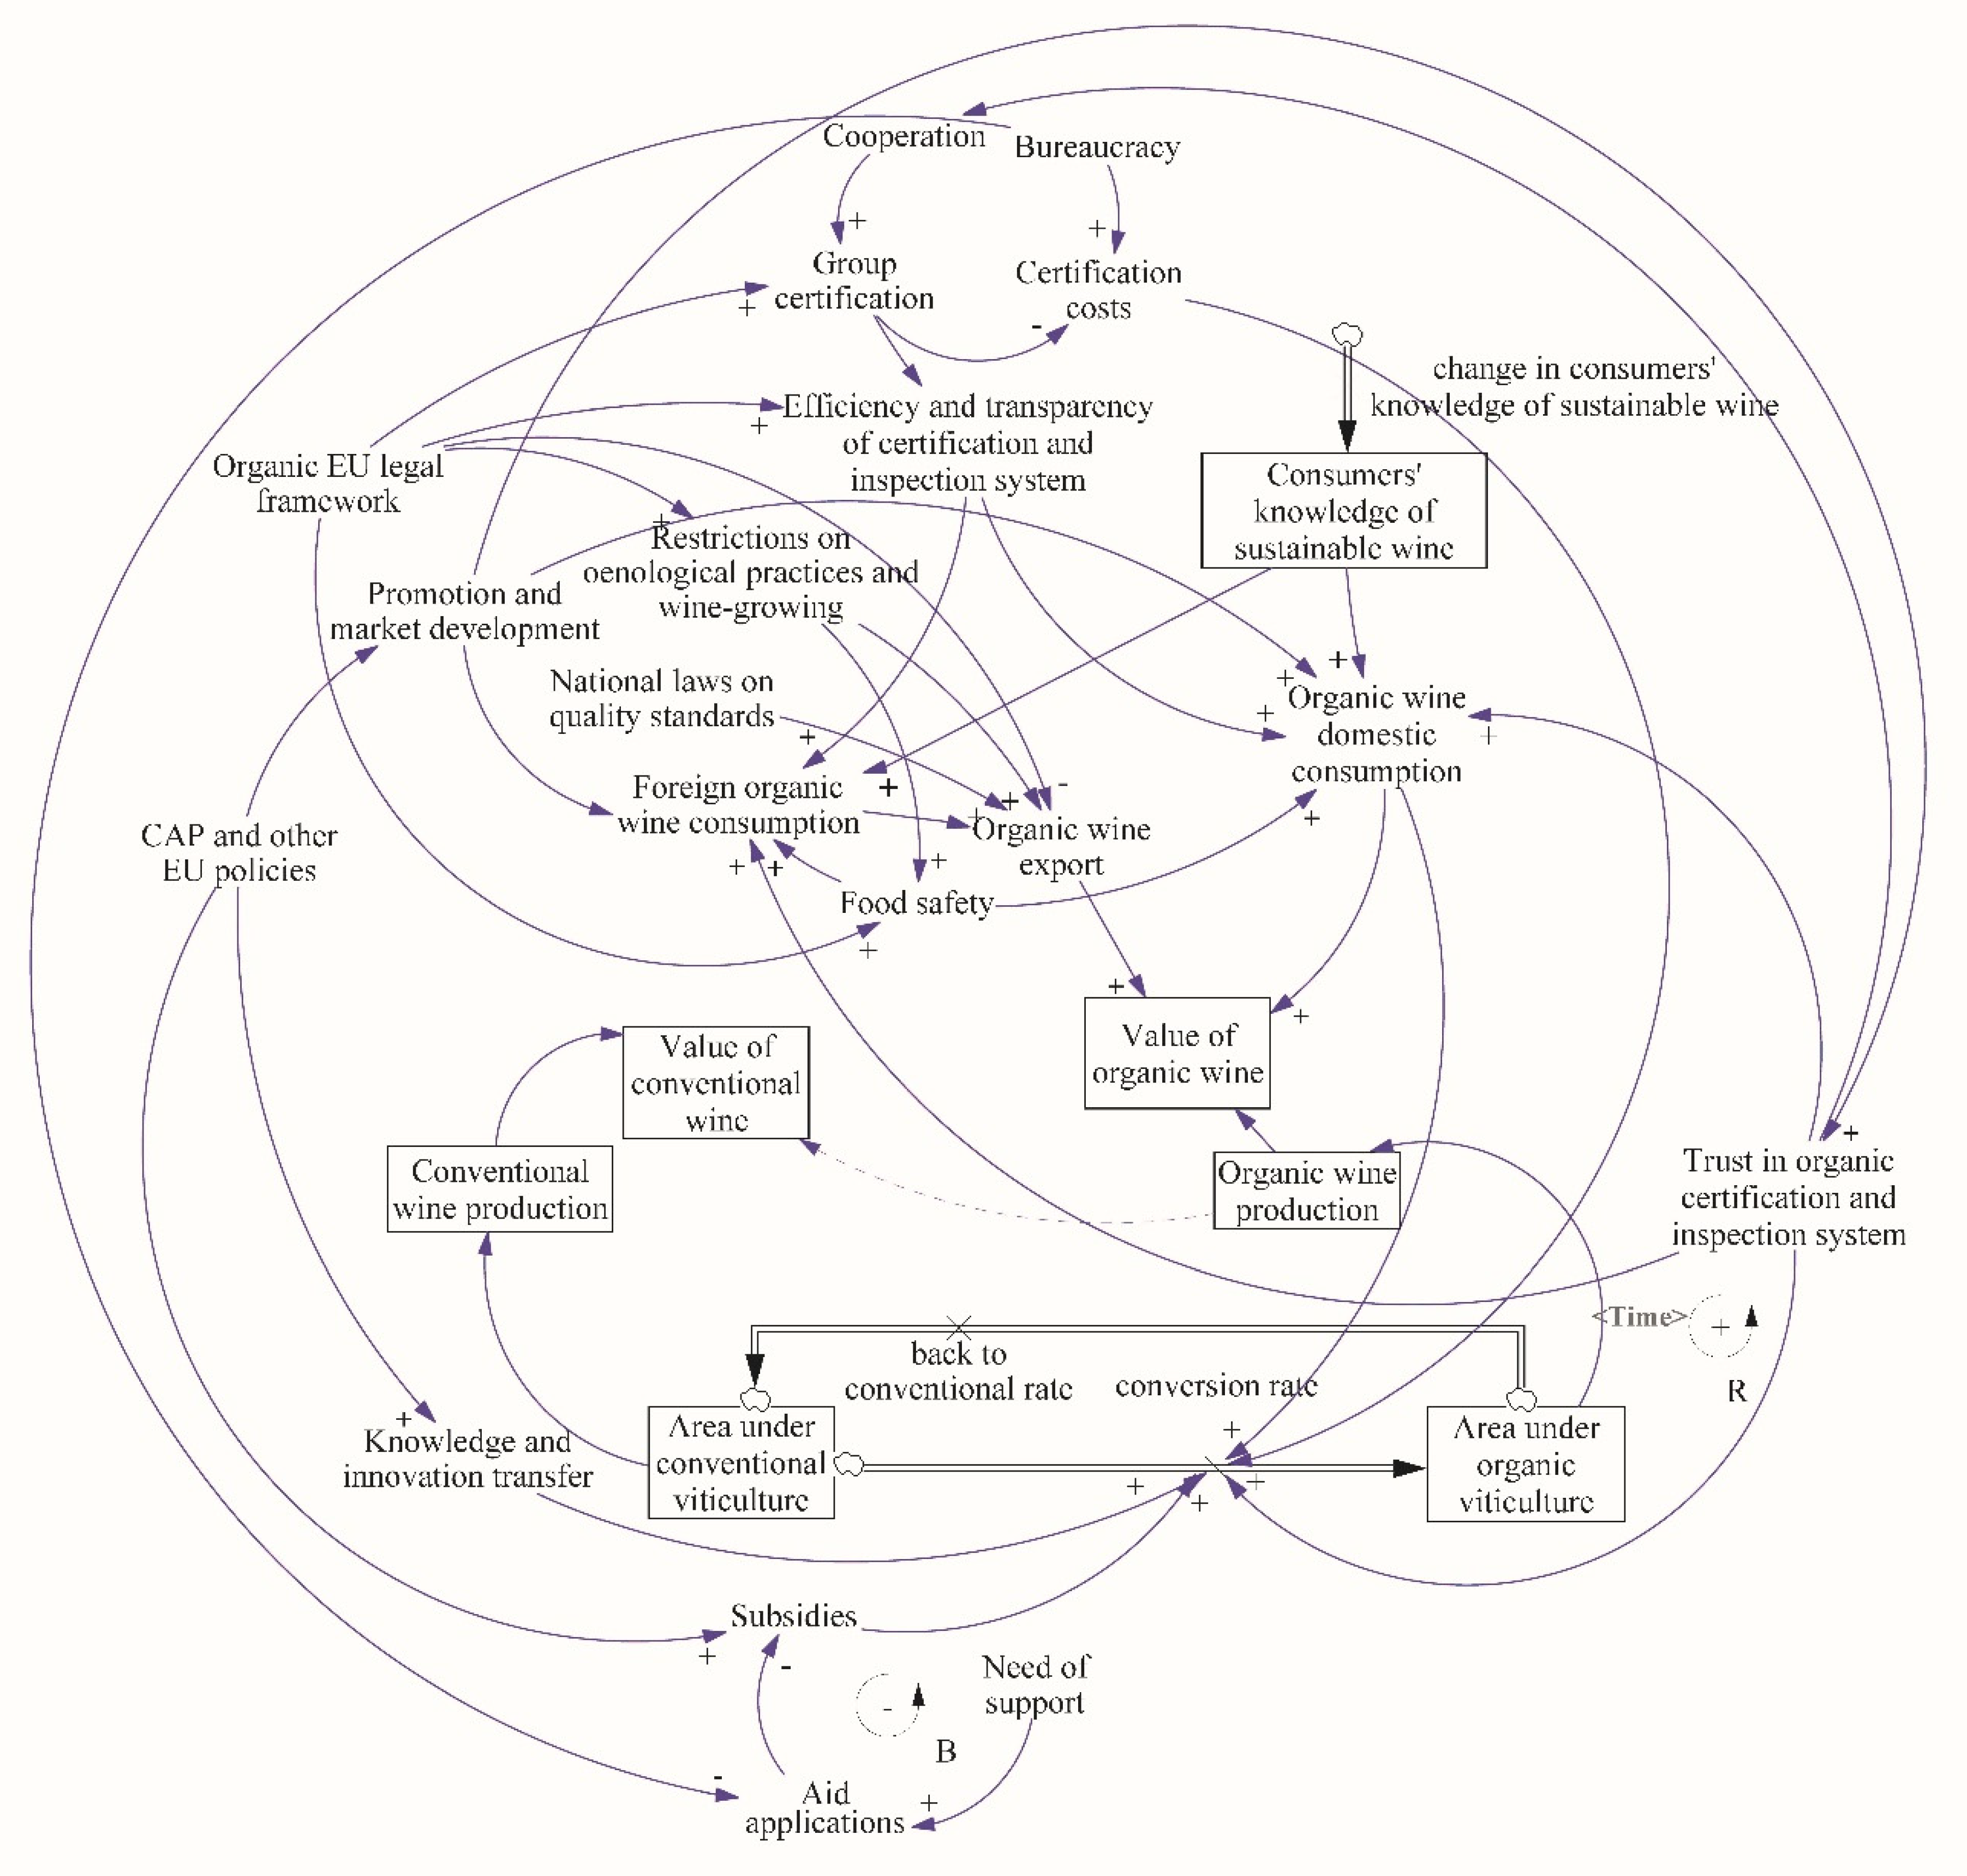
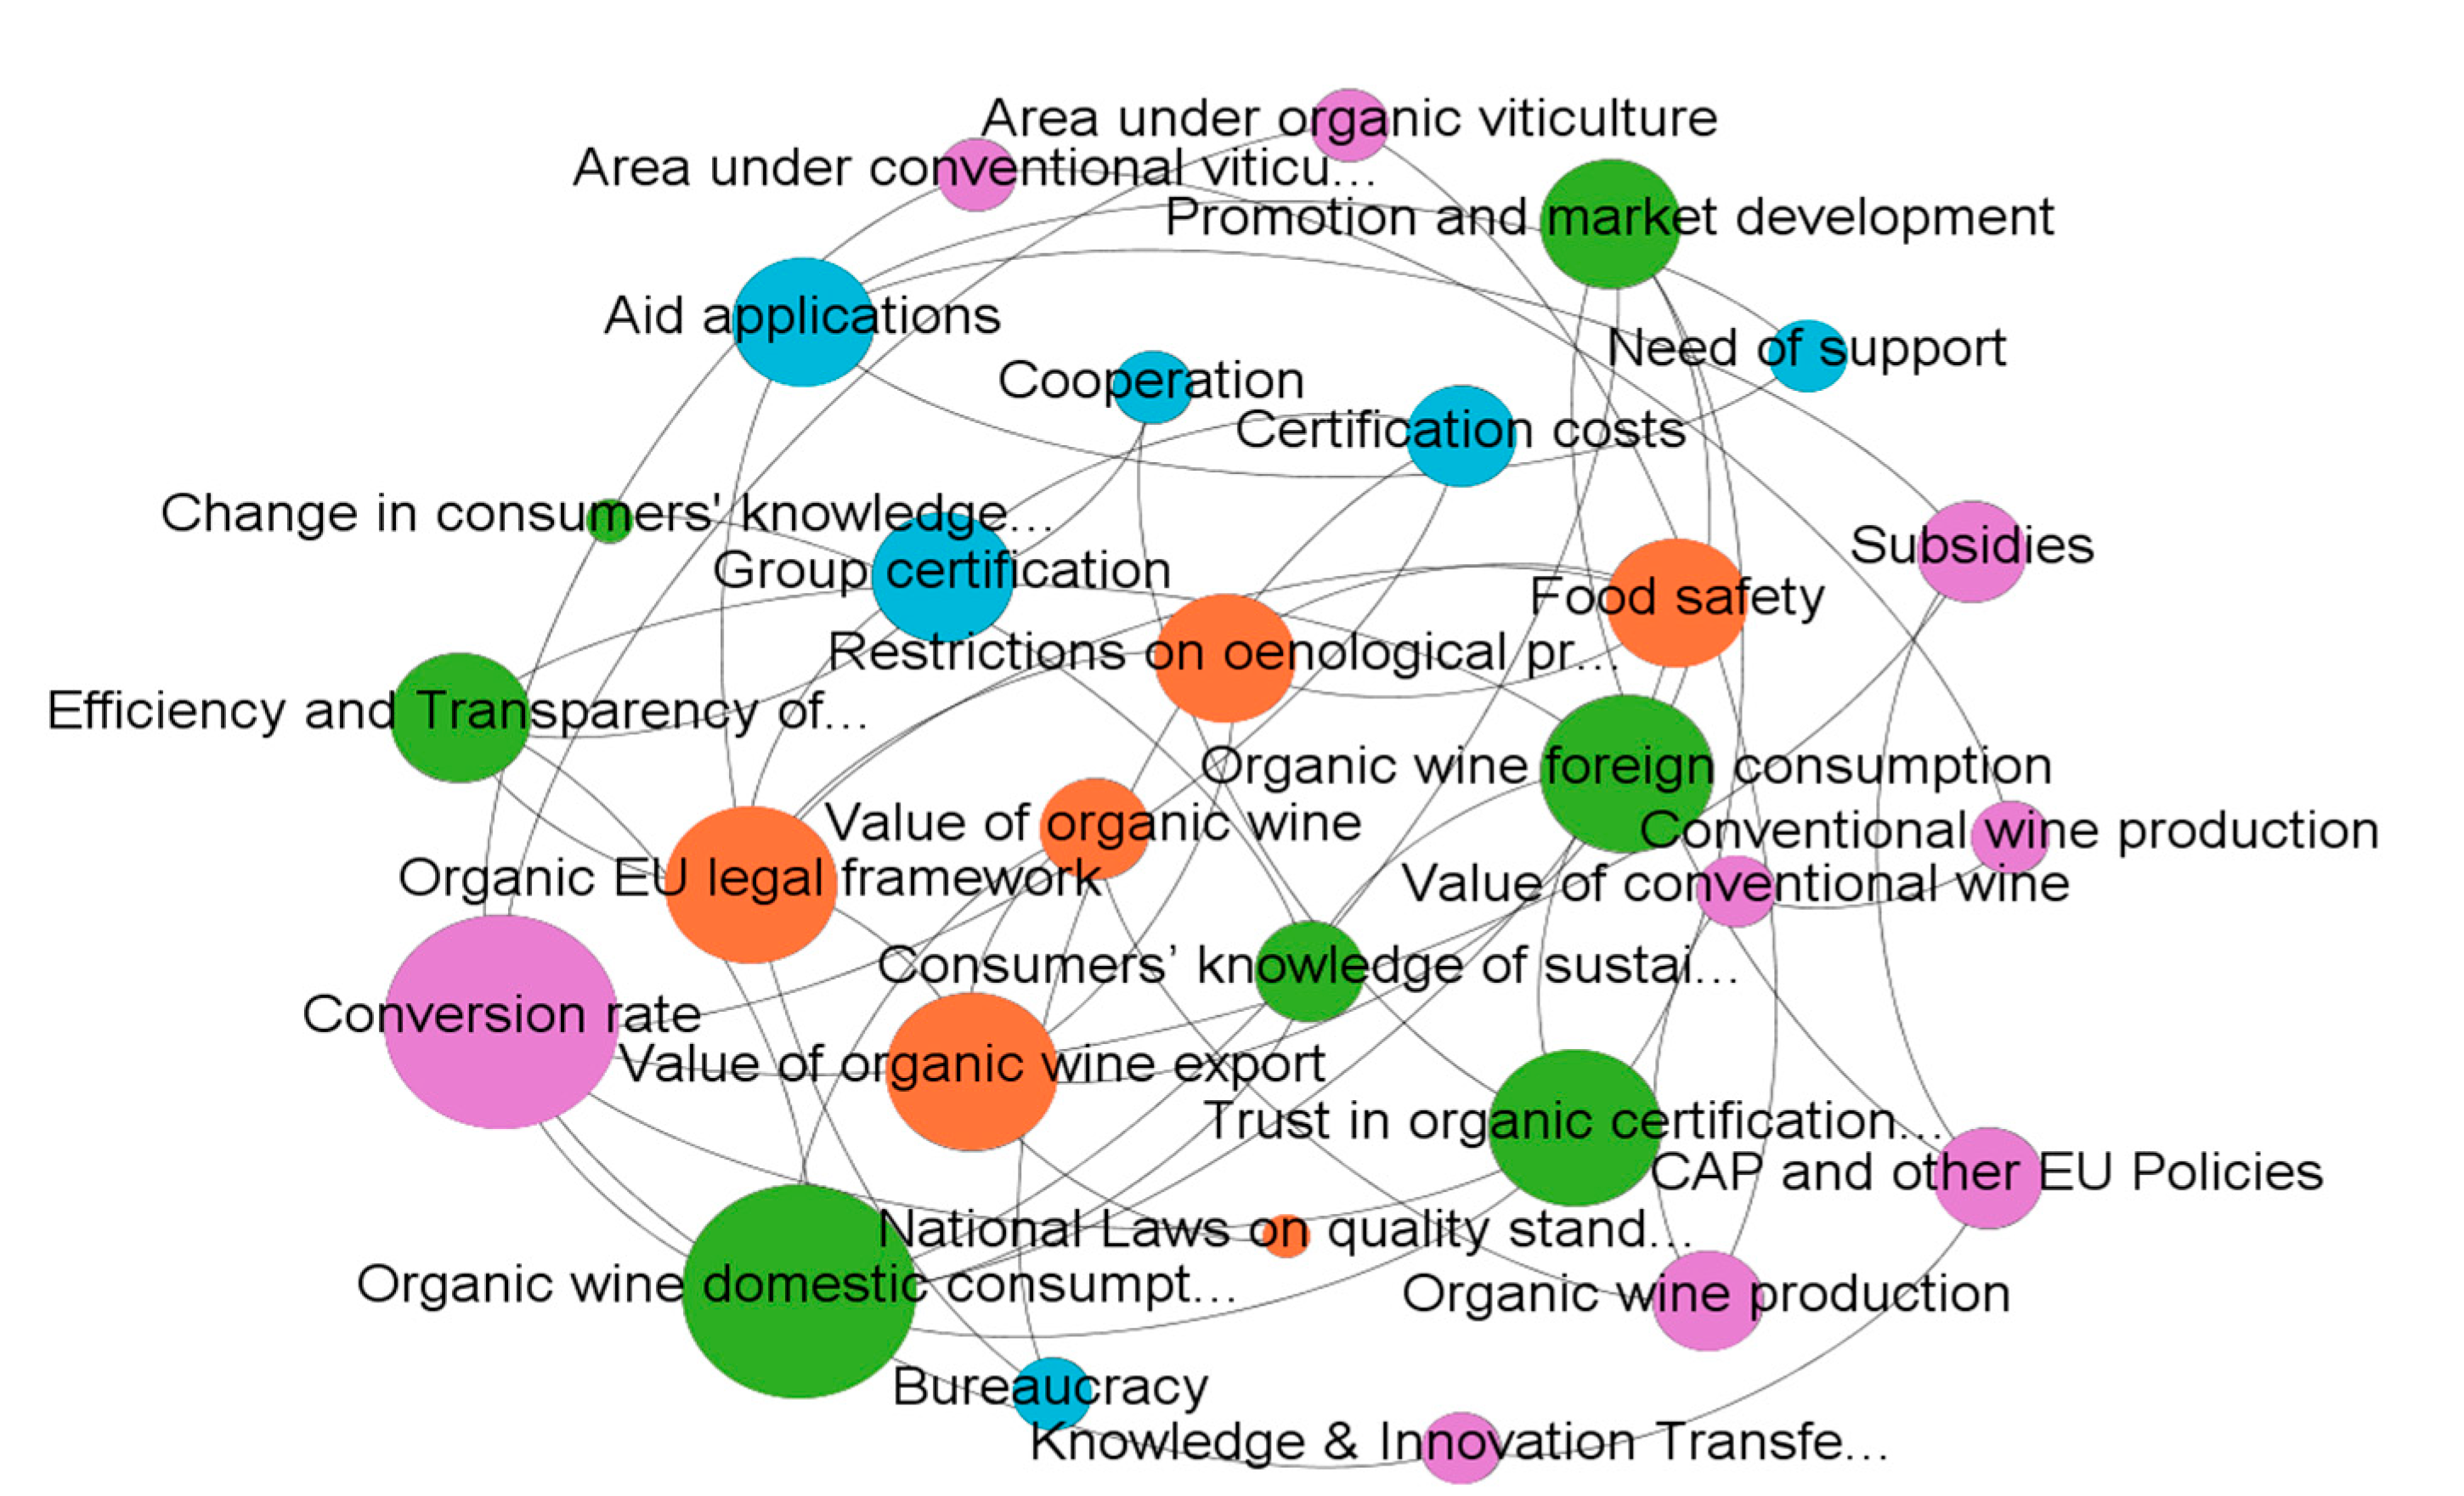
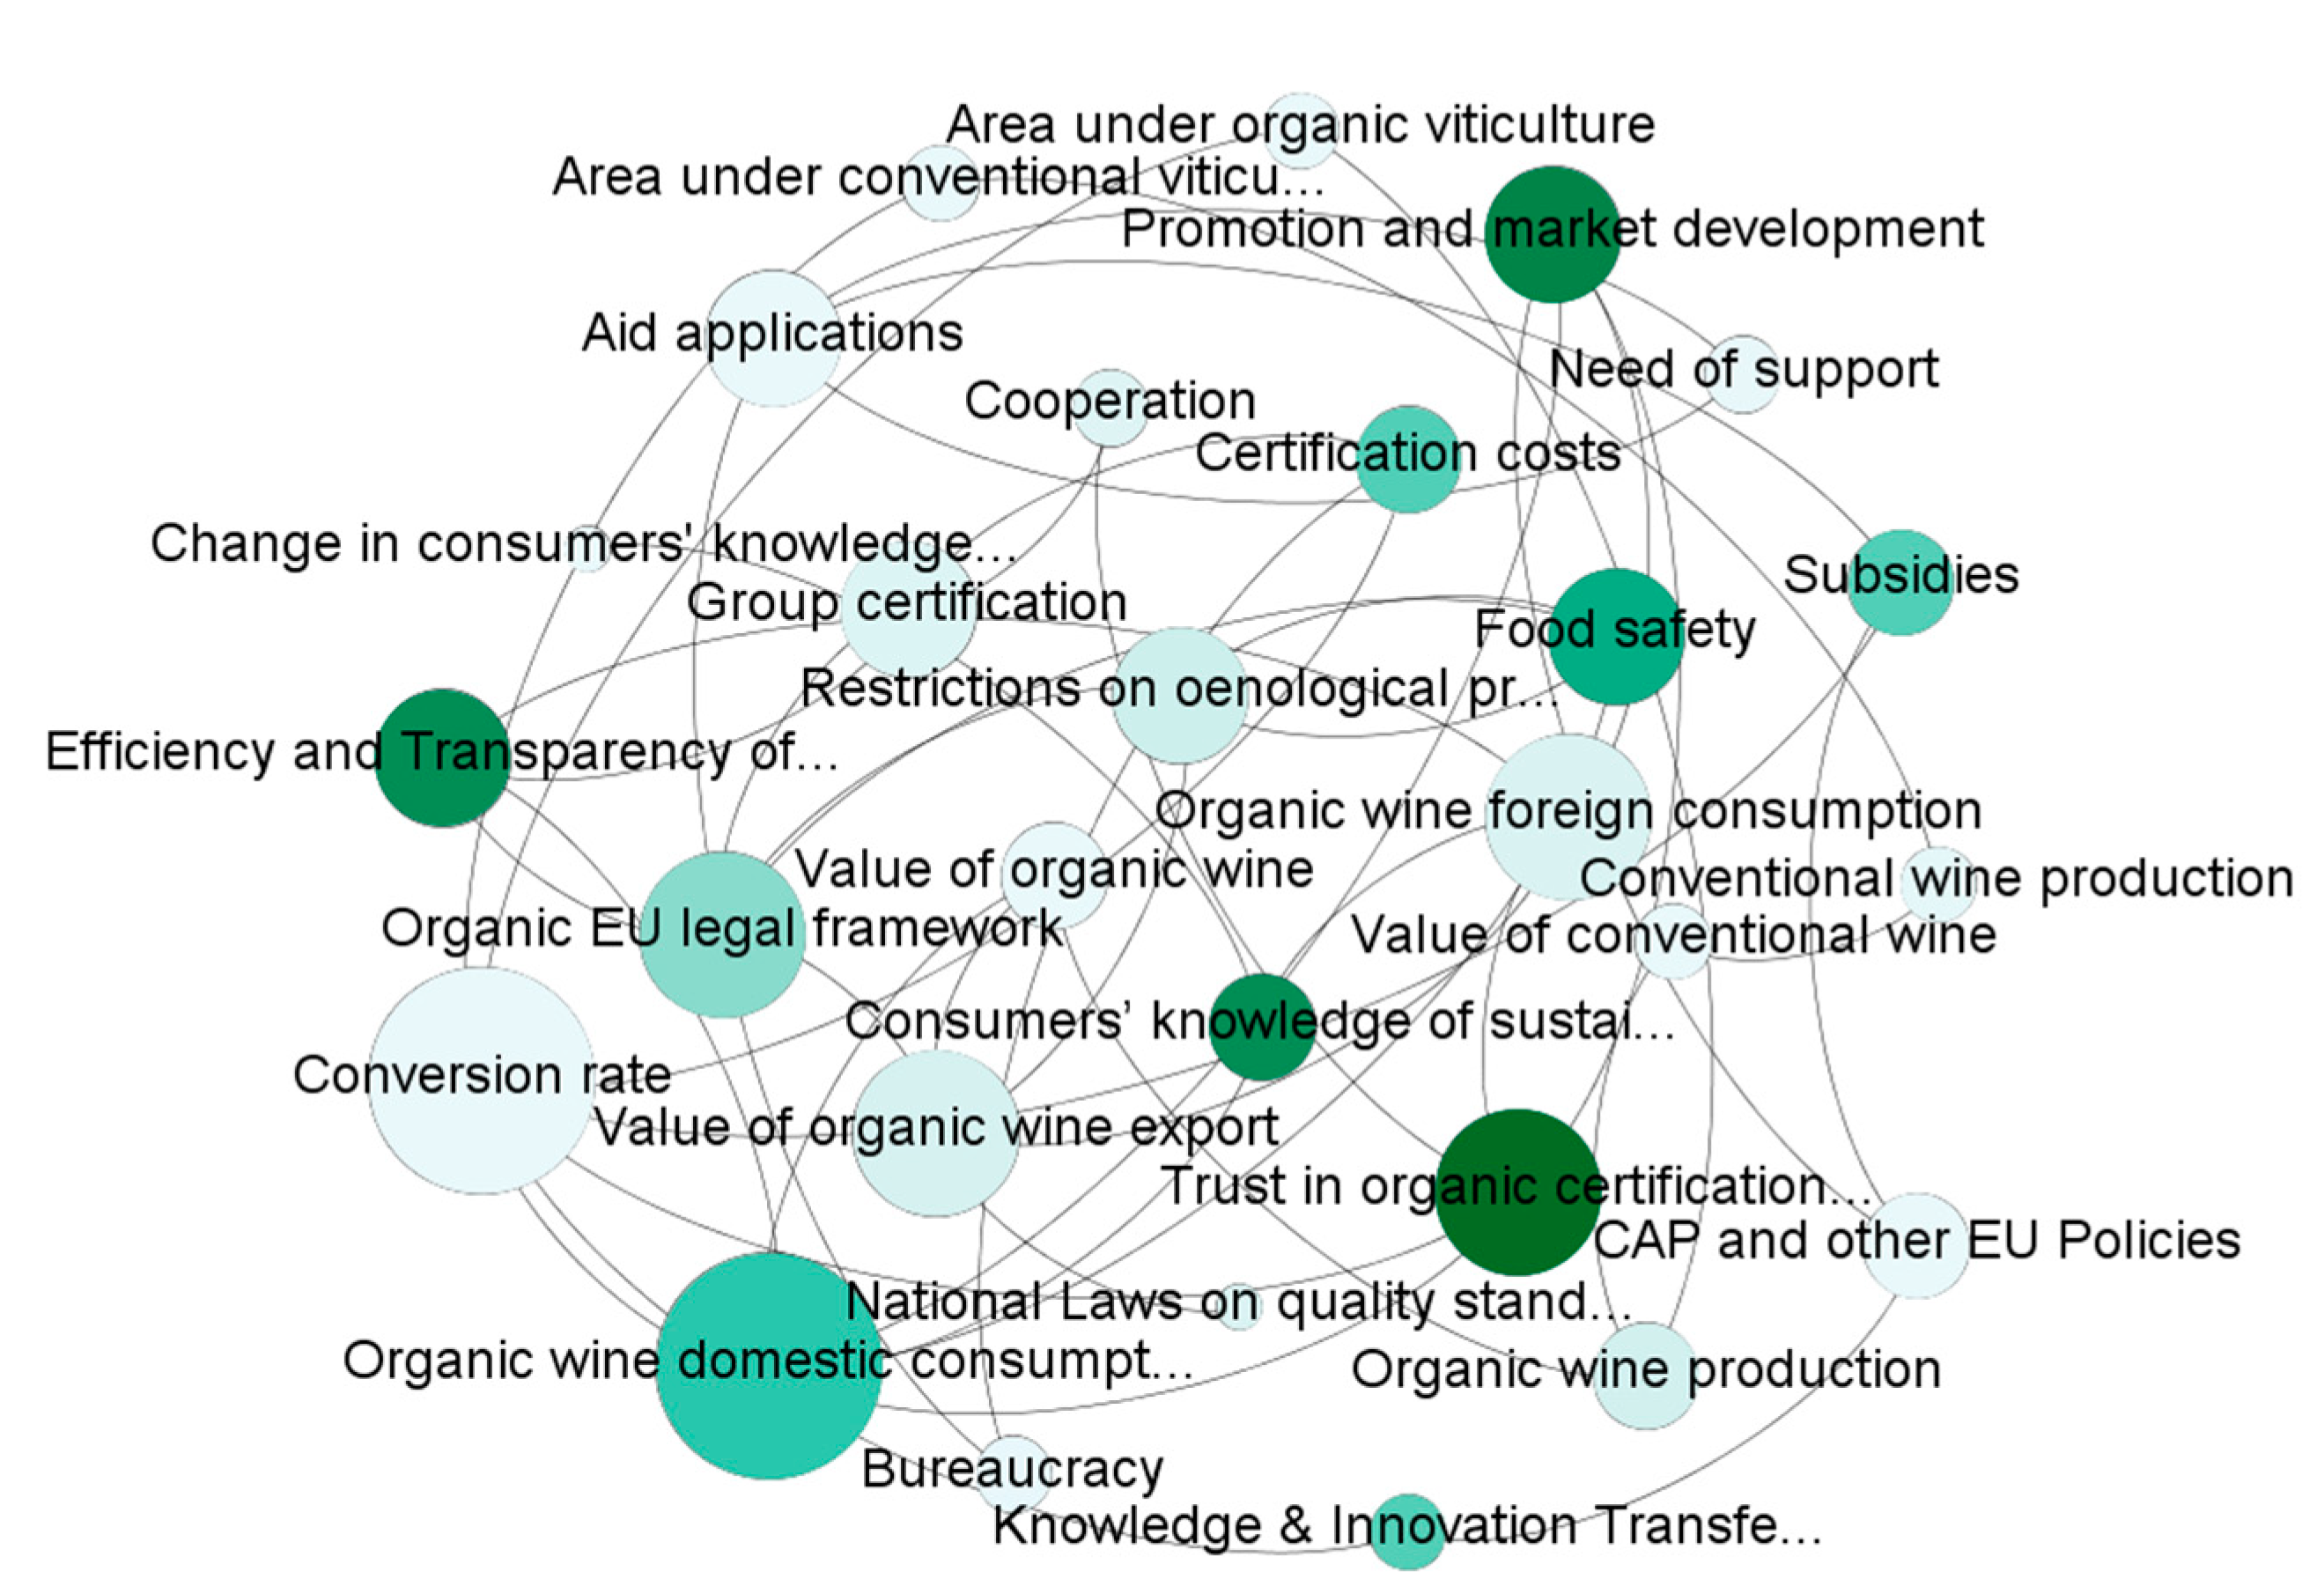
4. Results and Discussion

Figure 2 provides in one Causal Loop Diagram (CLD) an overview of the main feedback loops identified in the system. At the centre of the diagram, it is possible to observe two different stocks related to the Italian productive panorama in 2019:
  • “Area under conventional viticulture”, which was equal to 651,078 hectares [17];
  • “Area under organic viticulture”, which was equal to 109,423 hectares [19].
These area stocks are linked to each other with two conversion rates of opposite sign; moreover, each of these stocks in the diagram is directly linked to a corresponding stock of potential indicated in terms of economic value.
The conversion rate from conventional wine growing towards organic wine growing is positively affected by the following variables: “organic wine domestic consumption”, “subsidies”, “trust in organic certification and inspection system”, and “knowledge and innovation transfer”.
The more the “area under organic viticulture” increases, the more the “organic wine production” and its value grow. The “value of organic wine” is highly connected with the “organic wine domestic consumption”. As regards this, it is worth emphasising that the appeal of environmental friendly wines is closely connected to the age of consumers, which can significantly affect buying decision and willingness to pay [51]. Such propensity is probably connected to the certain higher green consciousness of younger people. In more general terms, the consumer profile has a great importance in the organic wine market, and it may also affect the strategies of firms in terms of distribution channels (e.g., specialty shops, e-commerce, wine bars, ho.re.ca, mass market retailers) [52], promotion, and marketing.
Moving back to the part of CLD pertaining to the “organic wine production”, the dotted arrow going to the stock of “value of conventional wine” represents the quantity of certified organic wine that is sold as conventional wine for some reason (e.g., market strategies, consequences of a lack of consumer trust in organic certification, consumers’ prejudices, implications from the normative ambiguity referred to as accidental contamination by phosphites, as will be discussed in more detail below).
A balancing loop (“B”) represents the accumulation of negative feedback mechanisms triggered by the conversion rate on the amount of public subsidies available on average per recipient. Meanwhile, the reinforcing loop “R” exemplifies the increase in “area under organic viticulture” caused by the increase in “trust in the wine organic certification and inspection system”. In this mechanism, the shadow variable “Time” plays a crucial role by leading to an increase of trust toward organic certification and the inspection system.
The entire CLD comprises 28 nodes and 47 edges. The network density is 0.062, meaning that the network contains 6.2% of all the possible edges. Therefore, it appears as a sparse network, where changes in one variable may not impact other parts of the system as quickly as a dense network. In other words, changes in multiple parts of the network should occur to impact the whole system.
The diameter of the network is 6, and the average path length is 2.77, meaning that any pair of nodes (e.g., the conversion rate and any other element of the network) connect with each other along the shortest paths through 2.77 ties, on average. This suggests that it is a very efficient network in the spread of influence.
The variables with the highest in-degree value are “conversion rate” and “organic wine domestic consumption” (both with in-degree 5); “foreign organic wine consumption” and “value of organic wine export” (both with in-degree 4). These four variables are affected by other variables in the system and are to be considered as “effects”.
The variables with the highest out-degree value are “organic EU legal framework” (out-degree 5) and “trust in organic certification and inspection system” (out-degree 4). They have the ability to affect other variables in the system and are to be considered as “causes”.
The network modularity is 0.44. Such a structural measure indicates the strength of the division of the network into variable clusters.
Figure 3 shows each of these clusters with a different colour, while node size is function of the degree.
Table 3 shows the composition of the same clusters with the list of nodes reported in descending order of value “hub”. The comparison between modularity classes and the value of hubs shows how cluster number 3 gathers most of the most influential “hubs” (nodes with darker green colour in Figure 4). These nodes may be valuable for creating change interventions because they are able to influence many other variables, not only inside the same cluster but also considering the network as a whole.
Variables with the highest betweenness centrality are “area under organic viticulture” (betweenness = 35.5) and “area under conventional viticulture” (betweenness = 28.5). These are elements that, as a result of their “mediating” role, facilitate the spillover of change from one cluster to other clusters in the system.
Regarding the CAP and other European policies, it is worth mentioning that they principally influence the system in two different ways: on the one hand by financially supporting farmers with several measures (those for investment in physical assets, quality schemes, agri-environment climate schemes, and measures for organic farming) and on the other hand, by supporting the promotion and market development in favour of processors and sellers. All this has strong implications on the transparency and reputation of the entire system, even in the foreign markets.
As far as the new organic EU legal framework is concerned, two main determinants have been identified:
-
Restrictions on oenological practices and wine-growing (e.g., in using sulphites), introduced by European Regulations and national laws on quality standards, which could hinder organic wine export by determining a sort of tariff barriers to foreign markets;
-
The new certification system for “groups of operators”, which was introduced by Regulation 2018/848 in order to support the production system in different ways: reducing inspections and certification costs, as well as associated administrative burdens; strengthening local networks and cooperation among small farmers and operators; contributing to the development of better market outlets; ensuring a level playing field with operators in third countries.
As far as the principle of conformity is concerned, it is recalled that “the equivalence system” was covered in the previous legislation (Regulation EC 834/2007) with the aim at ensuring the same quality levels for EU and non-EU products. With such a system, third countries can use plant protection material or agronomic techniques that were banned in Europe. With the application of the new “compliance” introduced by Regulation (EU) 2018/848, imported products will have to be totally homologated to domestic ones. The benefits will be appreciated in the long run, both because foreign control bodies need time to adapt to the new regulation and because a transitional period is foreseen, until 2026 (as recently established by Regulation EU 2020/1693). However, in such a long transitional period, speculations between countries could occur, with disruption of the normal flows of import/export, in an attempt to avoid the restrictions foreseen by regulations.
Among the other restrictions, there are also rules on residue levels for crop protection products from accidental and technically unavoidable contamination in organic farming. Until recently Italian products have risked being less competitive than those produced by other EU member states because the maximum residue limits imposed within national borders (by the Ministerial Decree No 309 of 13 January 2011) were much more restrictive than European ones. As far as phosphites are concerned, there have been many conflicting opinions regarding the need to amend or repeal that Ministerial Decree [53,54]. Meanwhile, producers have preferred to give up organic certification, despite having met the related specification [55].
For vineyards in conversion to organic farming, the situation has been improving with the Ministerial Decree No 7264 of 10 July 2020 (so-called “Phosphites Decree”) [56], which has established a transitional period, until 31 December 2022, to realign with the new European legislation (Regulation EU 2019/552) the maximum residue limits for phosphonic acid, which is a chemical characterised by a high persistence in the woody parts of the plant.
There are other rules on organic oenological practices. For example, with reference to the use of sulphites in winemaking processes, Regulation (UE) 203/2012 foresees the possibility of using sulphur dioxide for organic wines, albeit in reduced quantities compared to conventional wines, up to a maximum limit of 100 mg/l for red wines and 150 mg/l for white wines. As shown in Table 4, there are other important producing and importing countries where the quantities of sulphites permitted for wines are lower.
It is evident that the different level of tolerance for sulphur dioxide in organic wine can negatively affect the competitiveness of Italian organic wines in foreign markets.
It is worth noting that in the EU, in addition to above-mentioned regulations, there are other rules with a great influence on food safety and promotion and market development. For example, since the entry into force (4 December 2014) of Regulation (EU) 1169/2011 on the provision of food information to consumers, certain information on labels has become compulsory (e.g., the list of ingredients, any ingredient or processing aid causing allergies or intolerances, and a nutrition declaration). However, this regulation does not apply to the wine sector. This is instead covered under one of the basic regulations of the CAP (Regulation EU 1308/2013 establishing a common organisation of the markets in agricultural products) including the application of EU quality schemes, the required checks related, the labelling, and the presentation of Protected Designation of Origin (PDO) and Protected Geographical Indication (PGI) wines.
Regarding the mandatory labelling of wines, it can be argued that after years of intense debates, the European Commission, the main European wine sector associations, the industry, and other stakeholders could not reach an agreement on proposals for all alcoholic beverages. It is indeed a missed opportunity to provide to consumers harmonised, modern, and comprehensive information about conventional and organic wines.
As far as “groups of operators” are concerned, the Regulation (EU) 2018/2008 stated the required criteria for recognition of these organisations formed by “small organic wine-growers”: in the case of vineyards, in fact, each group shall only compose neighbouring farms whose size must be under 5 hectares and, considering the organic production, the value of the annual turnover must not exceed 25,000 Euro or, alternatively, the value of standard output must not exceed 15,000 Euro per year. Furthermore, the new groups of operators shall set up a joint marketing system for members’ products and an internal controls system for verifying compliance with Regulation 848/2018 by each member. For “small winegrowers”, groups of operators will certainly represent a good chance to save certification costs.
A certain simplification of rules and procedures is also expected. For instance, in the case of a low risk of non-compliance (firms will have to demonstrate having covered all production standards for three consecutive years at least), on-the-spot inspections can in fact be performed within 24 months at the latest rather than annually.
Of course, the efficiency and transparency of the new certification and inspection systems, as well as the possibility for the current high level of bureaucracy to be reduced, will depend on the future implementing provisions established within the Italian governance.

5. Conclusions

In light of the increased attention paid to the environment, climate changes, food safety, and healthy lifestyles, it seems very appropriate that researchers dedicate energy to studies useful to outline sustainable horizons of the future food and beverage sector.
This study has examined the perspectives of development of the Italian organic wine sector starting from the presence of a highly growing market, even in the broader international context.
The research has been addressed on the basis of data from the past years, leaving aside the effects of the COVID-19 pandemic and related health crisis.
Even though the study has had several drawbacks because of the absence of complete and comprehensive official data, creating a CLD and calculating some algorithms from Network Analysis have enabled the visualisation of the entire system, and some information particularly useful for all winegrowers and distributors has been provided. Furthermore, the proposed methodology may be helpful to policymakers in addressing public interventions towards more effective achievements in support of the competitiveness of the organic wine sector.
Findings have demonstrated that the challenge of environmental sustainability has made even more complex the tangle of relationships that already existed in the wine value chain.
Specifically, the conversion rate from conventional wine growing towards organic wine production is heavily affected by the following variables: “organic wine domestic consumption”, “trust in organic certification and inspection system”, and “knowledge and innovation transfer”.
If in recent years, public support has been a crucial factor for the conversion to organic farming; now, the challenge to develop the organic wine market seems to be based on the increase of the transparency and efficiency of the certification system, and on market strategies aimed at improving the reputation of organic wines, mainly among young consumers. In such a context, public interventions focussed on promotion and market development and increasing consumers’ knowledge of organic wine seem to point in the right direction.
We have also identified some of the most relevant weaknesses of the organic legal framework at the European and national level, which have been hampering the conquest of international markets, even during the long transitional period laid down in Regulation (EU) 2018/848 and subsequent amendments.
Public policies for food safety and regulatory actions will continue to be very important for the future of the system, but there is extensive room for improvement in reducing administrative burdens for applicants for grants and bureaucracy, especially as regards certain oenological and commercial practices.
Some of these requirements are greatly influencing production and sales planning by export-oriented entrepreneurs. While waiting for a single regulation for the wine sector covering all rules for production and processing [41], Italy has achieved a great improvement in the governance by establishing a national certification system for the sustainability of the entire wine supply chain.
This novelty and the opportunity to join groups of operators certainly will improve perspectives for Italian “small organic operators”.

Author Contributions

Conceptualisation, F.V., G.D.G., D.M. and I.A.; methodology, F.V., G.D.G., and D.M.; software, D.M.; investigation, F.S.; data curation, I.A. and F.S.; writing—original draft preparation, F.V., G.D.G., D.M., F.S. and I.A.; writing—review and editing, F.V., G.D.G.; supervision, G.D.G. and F.V.; funding acquisition, F.V. All authors have read and agreed to the published version of the manuscript.

Funding

This research was funded by Italian National Rural Network 2014/2020, grant number 2014IT06RDRP015.

Institutional Review Board Statement

Not applicable.

Informed Consent Statement

Not applicable.

Data Availability Statement

Publicly available data were used for the study.

Acknowledgments

The authors would like to thank the reviewers for their useful critical comments and suggestions to the early drafts of this manuscript.

Conflicts of Interest

The authors declare no conflict of interest.

References

  1. European Union. Regulation (EU) 2018/848 of the European Parliament and of the Council of 30 May 2018 on Organic Production and Labelling of Organic Products and Repealing Council Regulation (EC) No 834/2007, Official Journal of the European Union. Available online: https://eur-lex.europa.eu/legal-content/EN/TXT/PDF/?uri=CELEX:32018R0848&from=IT (accessed on 10 February 2021).
  2. European Commission. Directorate-General for DG for Agriculture and Rural Development Directorate C—Strategy, Simplification and Policy Analysis Unit C.4—Monitoring and Evaluation; European Commission: Brussels, Belgium, 2018. [Google Scholar]
  3. Birkenstock, M.; Röder, N. Eco-Schemes: Golden Bullet or an Additional Unnecessary Gadget Challenges for a Federal State to Implement Eco-Schemes Efficiently; European Association of Agricultural Economists: Brussels, Belgium, 2019. [Google Scholar]
  4. Lampkin, N.; Stolze, M.; Meredith, S.; de Porras, M.; Haller, L.; Mészáros, D. Using eco-schemes in the new cap. In A Guide for Managing Authorities; OAM EU, FIBL and IEEP: Brussels, Belgium, 2020. [Google Scholar]
  5. Communication from the Commission to the European Parliament, the European Council, the Council, the European Economic and Social Committee and the Committee of the Regions COM (2019) 640 Final, The European Green Deal. Brussels. 2019. Available online: https://eur-lex.europa.eu/resource.html?uri=cellar:b828d165-1c22-11ea-8c1f-01aa75ed71a1.0002.02/DOC_1&format=PDF (accessed on 16 January 2021).
  6. The European Green Deal Communication from the Commission to the European Parliament, the Council, the European Economic and Social Committee and the Committee of the Regions, EU Biodiversity Strategy for 2030. Bringing Nature Back into Our Lives COM (2020) 380 Final. Available online: https://eur-lex.europa.eu/resource.html?uri=cellar:a3c806a6-9ab3-11ea-9d2d-01aa75ed71a1.0001.02/DOC_1&format=PDF (accessed on 16 January 2021).
  7. Communication from the Commission to the European Parliament, the Council, the European Economic and Social Committee and the Committee of the Regions. A Farm to Fork Strategy for a Fair, Healthy and Environmentally-Friendly Food System com/2020/381 Final. Brussels. 20 May 2020. Institutional Document. Available online: https://eur-lex.europa.eu/legal-content/EN/TXT/?uri=CELEX:52020DC0381 (accessed on 20 January 2021).
  8. LEGGE 17 luglio 2020, n. 77. Conversione in Legge, con Modificazioni, del Decreto-Legge 19 Maggio 2020, n. 34, Recante Misure Urgenti in Materia di Salute, Sostegno al Lavoro e All’economia, Nonché di Politiche Sociali Connesse All’emergenza Epidemiologica da COVID-19. Available online: https://www.gazzettaufficiale.it/eli/gu/2020/07/18/180/so/25/sg/pdf (accessed on 10 February 2021).
  9. Council for Agricultural Research and Analysis of the Agricultural Economy (CREA). Commercio con l’estero dei Prodotti Agroalimentari 2019; CREA: Rome, Italy, 2020. [Google Scholar]
  10. FEDERVINI (Federazione Italiana Industriali Produttori, Esportatori ed Importatori di Vini). 2020. Available online: https://www.federvini.it/news-cat/2413-al-via-la-certificazione-della-sostenibilita-della-filiera-vitivinicola# (accessed on 8 February 2021).
  11. Delmas, M.A.; Lessem, N. Eco-Premium or Eco-Penalty? Eco-Labels and Quality in the Organic Wine Market, Business & Society; Sage: Thousand Oaks, CA, USA, 2015; pp. 1–39. [Google Scholar]
  12. Borsellino, V.; Varia, F.; Zinnanti, C.; Schimmenti, E. The Sicilian cooperative system of wine production: The strategic choices and performance analyses of a case study. Int. J. Wine Bus. Res. 2020, 32, 391–421. [Google Scholar] [CrossRef]
  13. European Commission. Study on the Competitiveness of European Wines; Final Report; Cogea S.R.L.: Rome, Italy, 2014. [Google Scholar]
  14. OIV International Organisation of Vine and Wine—Intergovernmental Organisation. State of the World Vitivinicultural Sector in 2019, April 2020; Statistical Report on World Vitiviniculture; OIV International Organisation of Vine and Wine: Paris, France, 2020. [Google Scholar]
  15. Corriere Vitivinicolo. Vino in Cifre, Anno 93, n. 1; Unione Italiana Vini: Milan, Italy, 2020. [Google Scholar]
  16. Crescimanno, M.; Galati, A. Competitiveness of Italian wines in the international market. Bulg. J. Agric. Sci. 2014, 20, 12–22. [Google Scholar]
  17. ISTAT. Available online: http://dati.istat.it/Index.aspx?DataSetCode=DCSP_COLTIVAZIONI (accessed on 20 December 2020).
  18. WineMonitor. Wine Marketing 2020, Bologna. Available online: https://www.winemonitor.it/Nomisma (accessed on 12 May 2020).
  19. SINAB. Bio in Cifre, Uffici SINAB c/o MiPAAF; Italian Ministry of Agriculture: Rome, Italy, 2020. [Google Scholar]
  20. Statista.com. Available online: https://0-www-statista-com.brum.beds.ac.uk/statistics/1129207/percentage-change-of-sales-value-wine-large-scale-retail-italy/ (accessed on 10 December 2020).
  21. Marshall, R.S.; Cordano, M.; Silverman, M. Exploring individual and institutional drivers of proactive environmentalism in the US Wine industry. Bus. Strat. Environ. 2005, 14, 92–109. [Google Scholar] [CrossRef]
  22. Moulton, K.; Zwane, A.P. Managing environmental risks through private sector cooperation: Theory, experience and a case study of the California code of sustainable winegrowing practices. Int. Food Agribus. Manag. Rev. 2005, 8, 77–90. [Google Scholar]
  23. Giacomarra, M.; Galati, A.; Crescimanno, M.; Tinervia, S. The integration of quality and safety concerns in the wine industry: The role of third-party voluntary certifications. J. Clean. Prod. 2016, 112, 267–274. [Google Scholar] [CrossRef]
  24. IFOAM EU Group. EU rules for organic wine production. In Background, Evaluation and Further Sector Development; Medicert srl: Brussels, Belgium, 2013. [Google Scholar]
  25. Lockshin, L.; Jarvis, W.; D’Hauteville, F.; Perrouty, J.-P. Using simulations from discrete choice experiments to measure consumer sensitivity to brand, region, price, and awards in wine choice. Food Qual. Prefer. 2006, 17, 166–178. [Google Scholar] [CrossRef]
  26. Mtimet, N.; Albisu, L.M. Spanish wine consumer behavior: A choice experiment approach. Agribussines 2006, 22, 343–362. [Google Scholar] [CrossRef]
  27. Schäufele, I.; Hamm, U. Consumers’ perceptions, preferences and willingness-to-pay for wine with sustainability char-acteristics: A review. J. Clean. Product. 2017, 147, 379–394. [Google Scholar] [CrossRef]
  28. Castellini, A.; Mauracher, C.; Procidano, I.; Sacchi, G. Italian market of organic wine: A survey on production system characteristics and marketing strategies. Wine Econ. Policy 2014, 3, 71–80. [Google Scholar] [CrossRef] [Green Version]
  29. Bertino, R. Vino Biologico e Vegano, Biobank. 2017. Available online: https://www.biobank.it/?cs=5&ps1=16&ps2=8&ps3=957, (accessed on 10 December 2020).
  30. Seuty, S. Une Demande en Croissance pour des Vins Bio, Légers et Innovants, VITI Leaders 2020, N 450; Viti: Metz, France, 2020. [Google Scholar]
  31. Cougard, M.J. Ces Nuages qui Obscurcissent L’horizon du vin Français, Les Échos; Groupe Les Échos-Le Parisien (LVMH): Paris, France, 2020. [Google Scholar]
  32. Forrester, J.W. The beginning of system dynamics. In Banquet Talk at the International Meeting of the System Dynamics Society; Mckinsey Quarterly: Stuttgart, Germany, 1989. [Google Scholar]
  33. Fiorani, G. System Thinking, System Dynamics e Politiche Pubbliche. Ph.D. Thesis, Università degli Studi di Roma “Tor Vergata, Rome, Italy, 2009. [Google Scholar]
  34. Rozman, Č.; Pažek, K.; Prišenk, J.; Škraba, A.; Kljaji, M. System dynamics model for policy scenarios of organic farming. Organizacija 2012, 45, 212–218. [Google Scholar] [CrossRef] [Green Version]
  35. Estrada, M.A.R.; Park, D. The past, present and future of policy modeling. J. Policy Model. 2018, 40, 1–15. [Google Scholar] [CrossRef]
  36. Fisher, D.K.; Norvell, J.; Sonka, S.; Nelson, M.J. Understanding technology adoption through system dynamics modelling: Implications for agribusiness management. Int. Food Agribus. Manag. Rev. 2000, 3, 281–296. [Google Scholar] [CrossRef]
  37. Varia, F.; Dara Guccione, G.; Macaluso, D.; Marandola, D. System dynamics model to design effective policy strategies aiming at fostering the adoption of conservation agriculture practices in sicily. Chem. Eng. Trans. 2017, 58, 763–768. [Google Scholar]
  38. Sung, W.-P.; Chen, R. (Eds.) Architectural, Energy and Information Engineering. In Proceedings of the International Conference on Architectural, Energy and Information Engineering (AEIE 2015), Xiamen, China, 19–20 May 2015, 1st ed.; CRC Press: Boca Raton, FL, USA, 2005. [Google Scholar]
  39. Goncharuk, A. Wine value chains: Challenges and prospects. J. Appl. Manag. Invest. 2017, 6, 11–27. [Google Scholar]
  40. Littlejohns, L.B.; Baum, F.; Lawless, A.; Freeman, T. The value of a causal loop diagram in exploring the complex interplay of factors that influence health promotion in a multisectoral health system in Australia. Health Res. Policy Syst. 2018, 16, 126. [Google Scholar] [CrossRef]
  41. Honti, G.; Dörgő, G.; Abonyi, J. Review and structural analysis of system dynamics models in sustainability science. J. Clean. Prod. 2019, 240, 118015. [Google Scholar] [CrossRef]
  42. Smith, J.O. Network Theory: The Basics. University of Michigan, USA. Available online: https://www.oecd.org/sti/inno/41858618.pdf (accessed on 23 February 2021).
  43. McGlashan, J.; Johnstone, M.; Creighton, D.; De La Haye, K.; Allender, S. Quantifying a systems map: Network analysis of a childhood obesity causal loop diagram. PLoS ONE 2016, 11, e0165459. [Google Scholar] [CrossRef] [Green Version]
  44. Bastian, M.; Heymann, S.; Jacomy, M. Gephi: An open source software for exploring and manipulating networks. In Proceedings of the Third Interna-tional AAAI Conference on Weblogs and Social Media, San Hose, CA, USA, 17–20 May 2009; pp. 361–362. [Google Scholar]
  45. Needham, M.; Hodler, E.A. Graph Algorithms; O’Reilly Media Inc.: Sebastopol, CA, USA, 2019. [Google Scholar]
  46. Freeman, L.C.; Roeder, D.; Mulholland, R.R. Centrality in social networks: II. experimental results. Soc. Netw. 1979, 2, 119–141. [Google Scholar] [CrossRef] [Green Version]
  47. Brandes, U. A faster algorithm for betweenness centrality. J. Math. Sociol. 2001, 25, 163–177. [Google Scholar] [CrossRef]
  48. Harary, F. Graph Theory; Addison-Wesley: Reading, MA, USA, 1969. [Google Scholar]
  49. Blondel, V.D.; Guillaume, J.-L.; Lambiotte, R.; Lefebvre, E. Fast unfolding of communities in large networks. J. Stat. Mech. Theor. Exp. 2008, 2008, P10008. [Google Scholar] [CrossRef] [Green Version]
  50. Kleinberg, J.M. Authoritative sources in a hyperlinked environment. J. ACM 1999, 46, 604–632. [Google Scholar] [CrossRef]
  51. Galati, A.; Schifani, G.; Crescimanno, M.; Migliore, G. “Natural wine” consumers and interest in label information: An analysis of willingness to pay in a new Italian wine market segment. J. Clean. Prod. 2019, 227, 405–413. [Google Scholar] [CrossRef]
  52. PricewaterhouseCoopers—PwC—Il Settore del Vino in Italia: Scenari Evolutivi e Strategie Nell’era Digital. 2017. Available online: https://www.pwc.com/it/it/industries/retail-consumer/assets/docs/settore-vino.pdf (accessed on 4 June 2020).
  53. Frascarelli, A.; Guidotti, A. Agricoltura Biologica, il Regolamento Comunitario Cambia lo Scenario, Terra e Vita; Edagricole: Bologna, Italy, 2018; pp. 6–8. [Google Scholar]
  54. Trinchera, A.; Bazzocchi, C.; Fichera, D. Fosfito, il Fantasma del Biologico, Terra e Vita n.3; Edagricole: Bologna, Italy, 2020. [Google Scholar]
  55. Corriere Vitivinicolo. Contaminazione da Fosfiti Nel Vino Bio, no. 30; Romeo-Vareille, E., Ed.; Unione Italiana Vini: Milan, Italy, 2020. [Google Scholar]
  56. Ministerial Decree, 10 July 2020 n. 7264 Modifica del Decreto del 13 Gennaio 2011 “Contaminazioni Accidentali e Tecnicamente Inevitabili di Prodotti Fitosanitari in Agricoltura Biologica”. Available online: https://www.politicheagricole.it/flex/cm/pages/ServeBLOB.php/L/IT/IDPagina/15958 (accessed on 20 January 2021).
Figure 1. Trend in world wine consumption since 2014 [14].
Sustainability 13 02815 g001
Figure 2. Causal Loop Diagram (CLD).
Sustainability 13 02815 g002
Figure 3. Variables clusters and importance of variables by degree.
Sustainability 13 02815 g003
Figure 4. “Hubs” in the organic wine network.
Sustainability 13 02815 g004
Table 1. Drivers influencing the wine productive system.
DriverSub-DriversVariablesVariables Value
(Data Source)
EconomicStructural featuresArea under organic viticulture105,384 ha
(Sinab, 2018)
Area under conventional viticulture629,191 ha
(ISTAT, 2017)
MarketConventional wine production45.18 million hl
(ISTAT, 2017)
Organic wine production5 million hl
(Federbio, 2017)
Value of conventional wine export5.9 billion Euros
(ISTAT, 2017)
Value of organic wine organic wine export275 million Euros
(OIV, 2017)
Organic wine domestic consumptionQualitative information
Organic wine foreign consumptionQualitative information
Promotion and market developmentQualitative information
Agro-food-beverage technologyKnowledge and innovation transfer (training, advisory services, information)Consumers’ knowledge of sustainable wineQualitative information
Efficiency and transparency of certification and inspection systemsTrust in organic certification and inspection systemQualitative information
GovernanceOrganic EU legal framework
National laws on quality standards
Restrictions on oenological practices and wine-growingQualitative information
Food safetyQualitative information
CAP and other EU policies
Bureaucracy
Subsidies
Need of support
Aid applications
Qualitative information
Social QualityCooperationGroup certificationQualitative information
Certification costsQualitative information
Table 2. Network Analysis measures. Adaptation from MacGlashan [43].
Network Analysis MeasureDefinitionReferences
DensityFraction of edges present relative to the maximum possible number of edges given the set of nodes.[43,45]
Degree centrality (in and out)The number of edges leading to or exiting nodes in the network. In-degree is the number of edges directed from other nodes to a specific node in the network. Out-degree is vice versa the number of edges directed from a particular node to other nodes in the network.[46]
Average path lengthThe smallest number of ties between any two nodes in the network, on average.[47]
DiameterThe largest number of vertices that must be traversed in order to travel from one vertex to another when paths that backtrack, detour, or loop are excluded from consideration[48]
Modularity (Louvain algorithm)It quantifies how well a node is assigned to a group by looking at the density of
connections within a cluster in comparison to an average or random sample.
[49]
HubIt is a node with a number of links that greatly exceeds the average.[50]
Table 3. Modularity class and “hubs”.
Modularity ClassDriversHub
0 Knowledge & Innovation Transfer (Training Advisory services and information)0.105
Subsidies0.105
Organic wine production0.018
Conventional wine production0.002
Conversion rate0
CAP and other EU Policies0
Area under organic viticulture0
Area under conventional viticulture0
Value of conventional wine0
1 Food safety0.253
Organic EU legal framework0.073
Restrictions on oenological practices and wine-growing0.022
Value of organic wine export0.016
National Laws on quality standards0.013
Value of organic wine0
2 Certification costs0.105
Group certification0.01
Bureaucracy0.008
Aid applications0.001
Cooperation0.001
Need of support0
3 Trust in organic certification and inspection system0.576
Promotion and market development0.459
Efficiency and Transparency of certification and inspection systems0.412
Consumers’ knowledge of sustainable wine0.412
Organic wine domestic consumption0.121
Organic wine foreign consumption0.013
Change in consumers’ knowledge of sustainable wine0
Table 4. Quantities of sulphites permitted in extra European Union (EU) countries.
Red Wine
Mg/L
White Wine
Mg/L
Argentina7080
Chile75100
South Africa90100
Australia100100
USAForbiddenForbidden
Publisher’s Note: MDPI stays neutral with regard to jurisdictional claims in published maps and institutional affiliations.

