Article

Development of a Rainfall and Runoff Simulator for Performing Hydrological and Geotechnical Tests

by
Thiago Augusto Mendes
1,2,*,
Sávio Aparecido dos Santos Pereira
1,
Juan Félix Rodriguez Rebolledo
3,
Gilson de Farias Neves Gitirana, Jr.
4,
Maria Tereza da Silva Melo
5 and
Marta Pereira da Luz
2,6
1
Federal Institute of Education, Science and Technology of Goias, Aparecida de Goiânia 74968-755, Brazil
2
School of Civil Engineering, Pontifical Catholic University of Goias, Goiânia 74605-010, Brazil
3
Technology College, University of Brasília, Brasília 70910-900, Brazil
4
School of Civil and Environmental Engineering, Federal University of Goias, Goiânia 74605-220, Brazil
5
School of Civil and Environmental Engineering, Federal University of Catalão, Catalão 75704-020, Brazil
6
Eletrobras, Furnas Centrais Elétricas S.A., Aparecida de Goiânia 74923-650, Brazil
*
Author to whom correspondence should be addressed.
Sustainability 2021, 13(6), 3060; https://0-doi-org.brum.beds.ac.uk/10.3390/su13063060
Submission received: 10 February 2021 / Revised: 23 February 2021 / Accepted: 3 March 2021 / Published: 11 March 2021
(This article belongs to the Special Issue Applications of Complex System Approach in Project Management)

Abstract

:
Laboratory apparatuses for the analysis of infiltration and runoff enable studies under controlled environments and at reduced costs. Unfortunately, the design and construction of such systems are complex and face difficulties associated with the scale factor. This paper presents the design, construction, and evaluation of a portable rainfall and runoff simulator. The apparatus allows the evaluation of unsaturated soils with and without vegetation cover, under a wide range of simulation scenarios. The apparatus also enables the control of the intensity, size, and uniformity of simulated raindrops for variable surface slope, specimen thickness, and length conditions. The monitoring of the volumetric water content and matric suction and a rigorous computation of water balance are ensured. The obtained results indicate that the automated rainfall generator produces raindrops with Christiansen uniformity coefficients higher than 70%, and with an adequate distribution of raindrop sizes under a range of rainfall intensities between 86.0 and 220.0 mm h−1. The ideal rainfall generator conditions were established for a relatively small area equal to or lower than 1.0 m2 and considering rainfall events with return periods of 10 to 100 years.

1. Introduction

The in situ analysis of natural rainfall and associated hydrological and geotechnical phenomena is a major challenge because the variables that characterize natural rainfall cannot be controlled under such circumstances [1,2,3]. To address these limitations, rainfall and runoff simulators (RSs) have been developed for laboratory and field analyses, enabling the study of controlled events under different intensities and adequate raindrop uniformity, diameters, velocities, and energy levels. RSs can also be used to evaluate soil behavior in response to variations in the slope, moisture content, and suction during testing.
In this context, RSs are important instruments that can be used to simulate different hydrological processes [4,5,6,7,8,9,10,11] and geotechnical systems [12,13,14,15,16], applied to numerous types of natural and man-made structures. The use of RSs allows the simulation of multiple phenomena, such as soil compaction due to the action of different raindrop sizes, erosion processes, transport of sediments and contaminants, and slope stability. RSs also enable the evaluation of water runoff and infiltration in soils with or without vegetation cover.
Several studies have presented the development, calibration, and use of RSs for a wide range of purposes, such as agricultural research [17,18,19,20,21,22]; biomass studies [23,24]; infiltration analysis [14,15,25,26]; urban hydrology simulation, including permeable pavement performance [27], evaluation of processes of accumulation and transport of pollutants on pavements and roof surfaces [28,29,30,31,32]; and rainwater quality research. RSs are frequently used in geotechnical evaluations of soil loss and erosion [1,16,22,33,34,35,36,37,38], slope stability [13,39,40] and infiltration, and percolation in unsaturated soils [12,14,15,41,42].
The performance of RSs must be evaluated considering various initial conditions, boundary conditions, simulated rainfall characteristics, and the scale factor (i.e., the evaluation of the specimen geometry and dimensions). There have been numerous studies on the limits and allowable tolerances in terms of the uniformity, droplet diameter, terminal velocity, and kinetic energy of simulated rainfall events [2,3,14]. Unfortunately, the available literature does not offer details in terms of the optimization of the RS geometry, delimitation of the ideal operation conditions, and numerical modeling of the interaction between rainfall and runoff, or rainfall–runoff–vegetation. Regarding the components and structural parts of an RS, the publications available are often lacking, not permitting the reproduction of the proposed apparatuses [14,43]. In addition, the available RSs are not specifically designed to deal with high rainfall intensities over small surface areas that impose the restriction of using a single rainfall simulation nozzle.
The objective of this paper is to present a new portable RS, which was idealized and designed based on computer-based numerical studies presented by Mendes et al. [15] and to verify its performance. The proposed apparatus was specifically designed to deal with some specific rigorous conditions not met by existing RSs [2,3,13] including the simulation of uniform rainfall on relatively small surface areas and under relatively high rainfall intensity and the simultaneous monitoring of runoff and infiltration. To allow indoor testing at reduced costs, the system was designed for a low height of application of simulated rainfall and the use of a single spray nozzle. The RS was developed to test unsaturated soil specimens with and without vegetation, overcoming limitations of hydrological and geotechnical studies using previous apparatuses. As a result, additional objectives are to demonstrate the applicability of the developed apparatus considering the simultaneous monitoring of the hydrological variables and of the internal specimen conditions.

2. Materials and Methods

The proposed apparatus was designed based on interdisciplinary requirements associated with the phenomena involving rainfall–runoff–vegetation interactions [15]. The RS is able to represent many hydrological and geotechnical conditions, with soil specimens of different geometry, slope and initial field state conditions (Figure 1). Some rainfall simulators are designed for rainfall intensities between below 50 mm h−1 [17,20]. The design presented herein enables the simulation of relatively higher rainfall intensities that are representative of tropical regions. A resulting limitation of the presented RS is the inferior performance for lower rainfall intensities, because parameters such as rainfall uniformity are decreased under intensities lower than 50 mm h−1. It is also important to note that the structural characteristics of the proposed design are adequate only for specimens with maximum dimensions of 150 cm in length, 100 cm in width, and 50 cm in depth.
The proposed RS is composed of three main systems: (a) structural system (mechanical and hydraulic); (b) rainfall system, encompassing the drive automation system that controls pressure and rainfall duration; and (c) instrumentation and data acquisition system, which is related to the monitoring of the water content and suction variations in the specimen. The design of the RS involved the optimization of the dimensions of the components and systems, including the structural weight, ease of assembly, transportation, operation, and data acquisition.
The dimensions of the specimen were optimized to avoid boundary effects by means of numerical simulations of the unsaturated/saturate water flux. The numerical solution for the unsaturated soil flow model was implemented using FlexPDE version 6, a general-purpose partial differential equation solver based on the Finite Element Method [44]. The numerical analysis exercises aimed to establish the behavior of the specimen in terms of pore-water pressure, degree of saturation and runoff coefficient. The behavior of the specimen was evaluated according to the variations in the specimen length, LD; thickness, HD; and inclinations, αD. A detailed description of the numerical exercises is presented by Mendes et al. [15].
Rainfall intensity requirements must be carefully established based on natural rainfall characteristics, among other factors. Tropical and equatorial regions are characterized by high rainfall intensities. For Goiania, GO, Brazil, for example, return periods between 10 and 100 years correspond to rainfall intensities between 86 and 220 mm h−1, considering typical rainfall durations [45]. Return periods between 10 and 100 years are relevant because they are frequently adopted for the design of several types of hydraulic systems. The proposed apparatus is also intended for the study of erosion processes, therefore requiring runoff generation. However, the saturated hydraulic conductivity of typical soils in the region is relatively high [46,47,48]. Therefore, runoff is generated only during high intensity events. For this reason, generating relatively high rainfall intensities is a primary requirement for the proposed RS.

2.1. Construction of the Components of the RS

The apparatus is composed of three main systems. The structural frame of the RS is responsible for receiving and carrying the entire load exerted by the soil specimen. The rainfall generator employs an automated control and hydraulic actioning system. The instrumentation and data acquisition system is responsible for monitoring and storing the soil parameter variations during the rainfall tests.

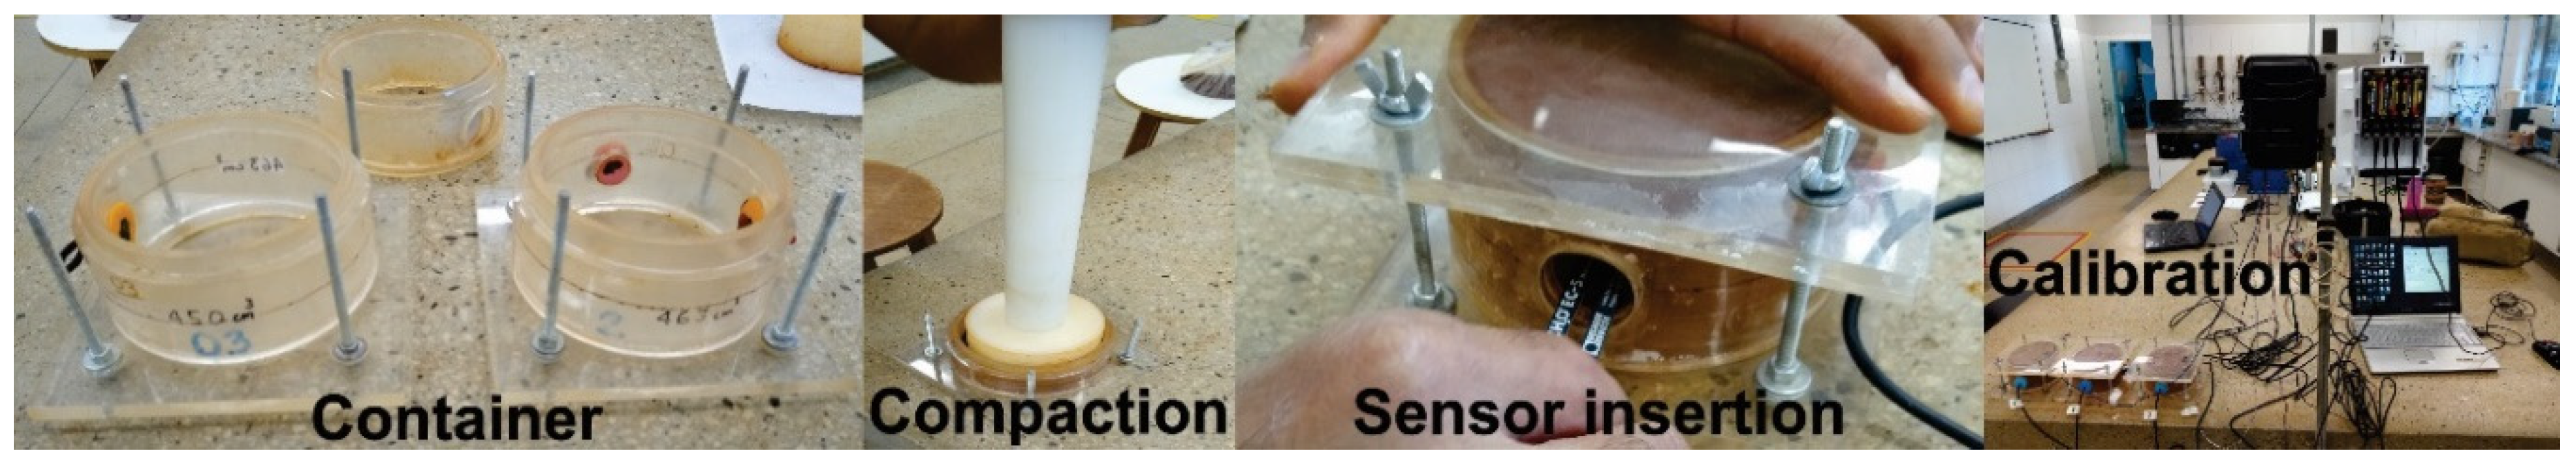
2.1.1. Structural Frame and Specimen Container

The structural frame of the RS supports the required loads and allows a range of slope angles, from 0 to 50 degrees. The system, shown in Figure 2, is composed of a metallic structure and an acrylic specimen container, with dimensions established based on numerical simulations on the scale factor, as developed and proposed by Mendes et al. [15]. Based on numerical simulations, a 10 mm thick transparent acrylic box was chosen, with 0.5 m in length, 0.5 m in width, and 0.3 m in height. The structure for the runoff flow recipient was also made of transparent acrylic with a thickness of 4 mm and dimensions of 0.05 m in length, by 0.05 m in width, by 0.5 m in height. Its duct is 50 cm in length and 5 cm in width and height (Figure 3).
The metallic structural design was developed using the STRAP software, version 2009. Structural stresses and bending moments resulting from the active loads and overloads were considered. The RS frame was made of A36 steel profiles, as indicated in Figure 2. The metal structure is composed of two side supports of 120 cm on top of two lower U-shaped supports, 120.5 cm long and 46.0 cm wide. Two vertical A-brackets are connected to the lower U-brackets, with two rails, 130 cm long. An upper lateral U-shaped support was installed, 120 cm long and with 75 cm in height. To hold the acrylic box, a tilt grille table was built, consisting of two U-shaped tilting table stands, 115 cm long and 15 cm wide, with two side supports along the metal box, 130 cm long and 3 cm wide, and five support bars, 109 cm long. Two tilt bars, with 83 cm in length, were also installed.
The runoff collection gutter (Figure 3a) has six exits, positioned to assist and guarantee the shortest drainage time of the runoff to the gutter and to prevent sediment accumulation from occurring. The developed crosshead connection, indicated in Figure 3a, is responsible for directing and conducting the drained volume to be measured with the flow sensors and precision scales.
The instrumentation ports, designated in Figure 3b as points 1, 2, 3, 4, and 5, were carefully planned to meet the requirements of (a) elucidating the evolution of interception–infiltration–runoff at the vegetation–soil–root interface; (b) preventing any overlapping of the area of influence of volumetric water content (VWC) sensors, thus preventing two or more sensors from measuring the same areas (blue circles in Figure 3b); (c) attaining symmetric representativeness of the specimen; and (d) allowing easy installation and avoiding partial sample alteration, mainly the uppermost superficial part (volume increase due to the introduction/insertion of the sensors).

2.1.2. Rainfall Generator

The rainfall generator is composed of an automated electronic controller responsible for the speed of the centrifugal pump, which maintains the pressure of the hydraulic network that produce the artificial precipitation events. RS also includes a hydraulic system consisting of a reservoir, weldable PVC pipes, pressure sensors, sprinkler nozzle, and another centrifugal pump.
The electronic controller has a proportional, integral, and derivative (PID) speed adjustment system, developed using an Arduino Mega processor and a Bluetooth driver/control. It can generate service pressures in the hydraulic network ranging from 0 to 150 kPa, in addition to controlling the opening and closing of the solenoid valve that feeds water to the sprinkler nozzle, to generate rainfall. Both the duration and intensity of the artificial rainfall can be adjusted in a constant or variable manner. The main components are the pressure sensor, solenoid valve, frequency inverter, PID controller, and finally, an application for an Android Bluetooth-enabled smartphone.
The hydraulic system has a reservoir of 200 L, a three-phase single-stage centrifugal water pump with a power of 0.5 kW, capable of generating an adequate service pressure (0 to 200 kPa), plumbing made of weldable PVC standards, dry pressure gauges (0 to 1000 kPa), and a sprinkler nozzle. The entire hydraulic design followed ASME technical recommendations, mainly regarding the proper installation distance of the connections, i.e., farther than 40 free upstream diameters and 10 free downstream diameters for any pipe, limiting the undesirable flow effects.
A pressure gauge was installed at the same position of the pressure sensor, for redundancy and validation purposes. Another important hydraulic component evaluated was the sprinkler nozzle, which is responsible for the type of jet (artificial rain) to be applied to the soil specimens, depending also on the height and service pressure. Two sprinkler nozzles, ¼″-10SQ-HHSQ, and ½″-29SQ-HHSQ, were evaluated in this study, regarding the produced water drop distribution uniformity, drop size distribution, intensity, and generated rainfall.

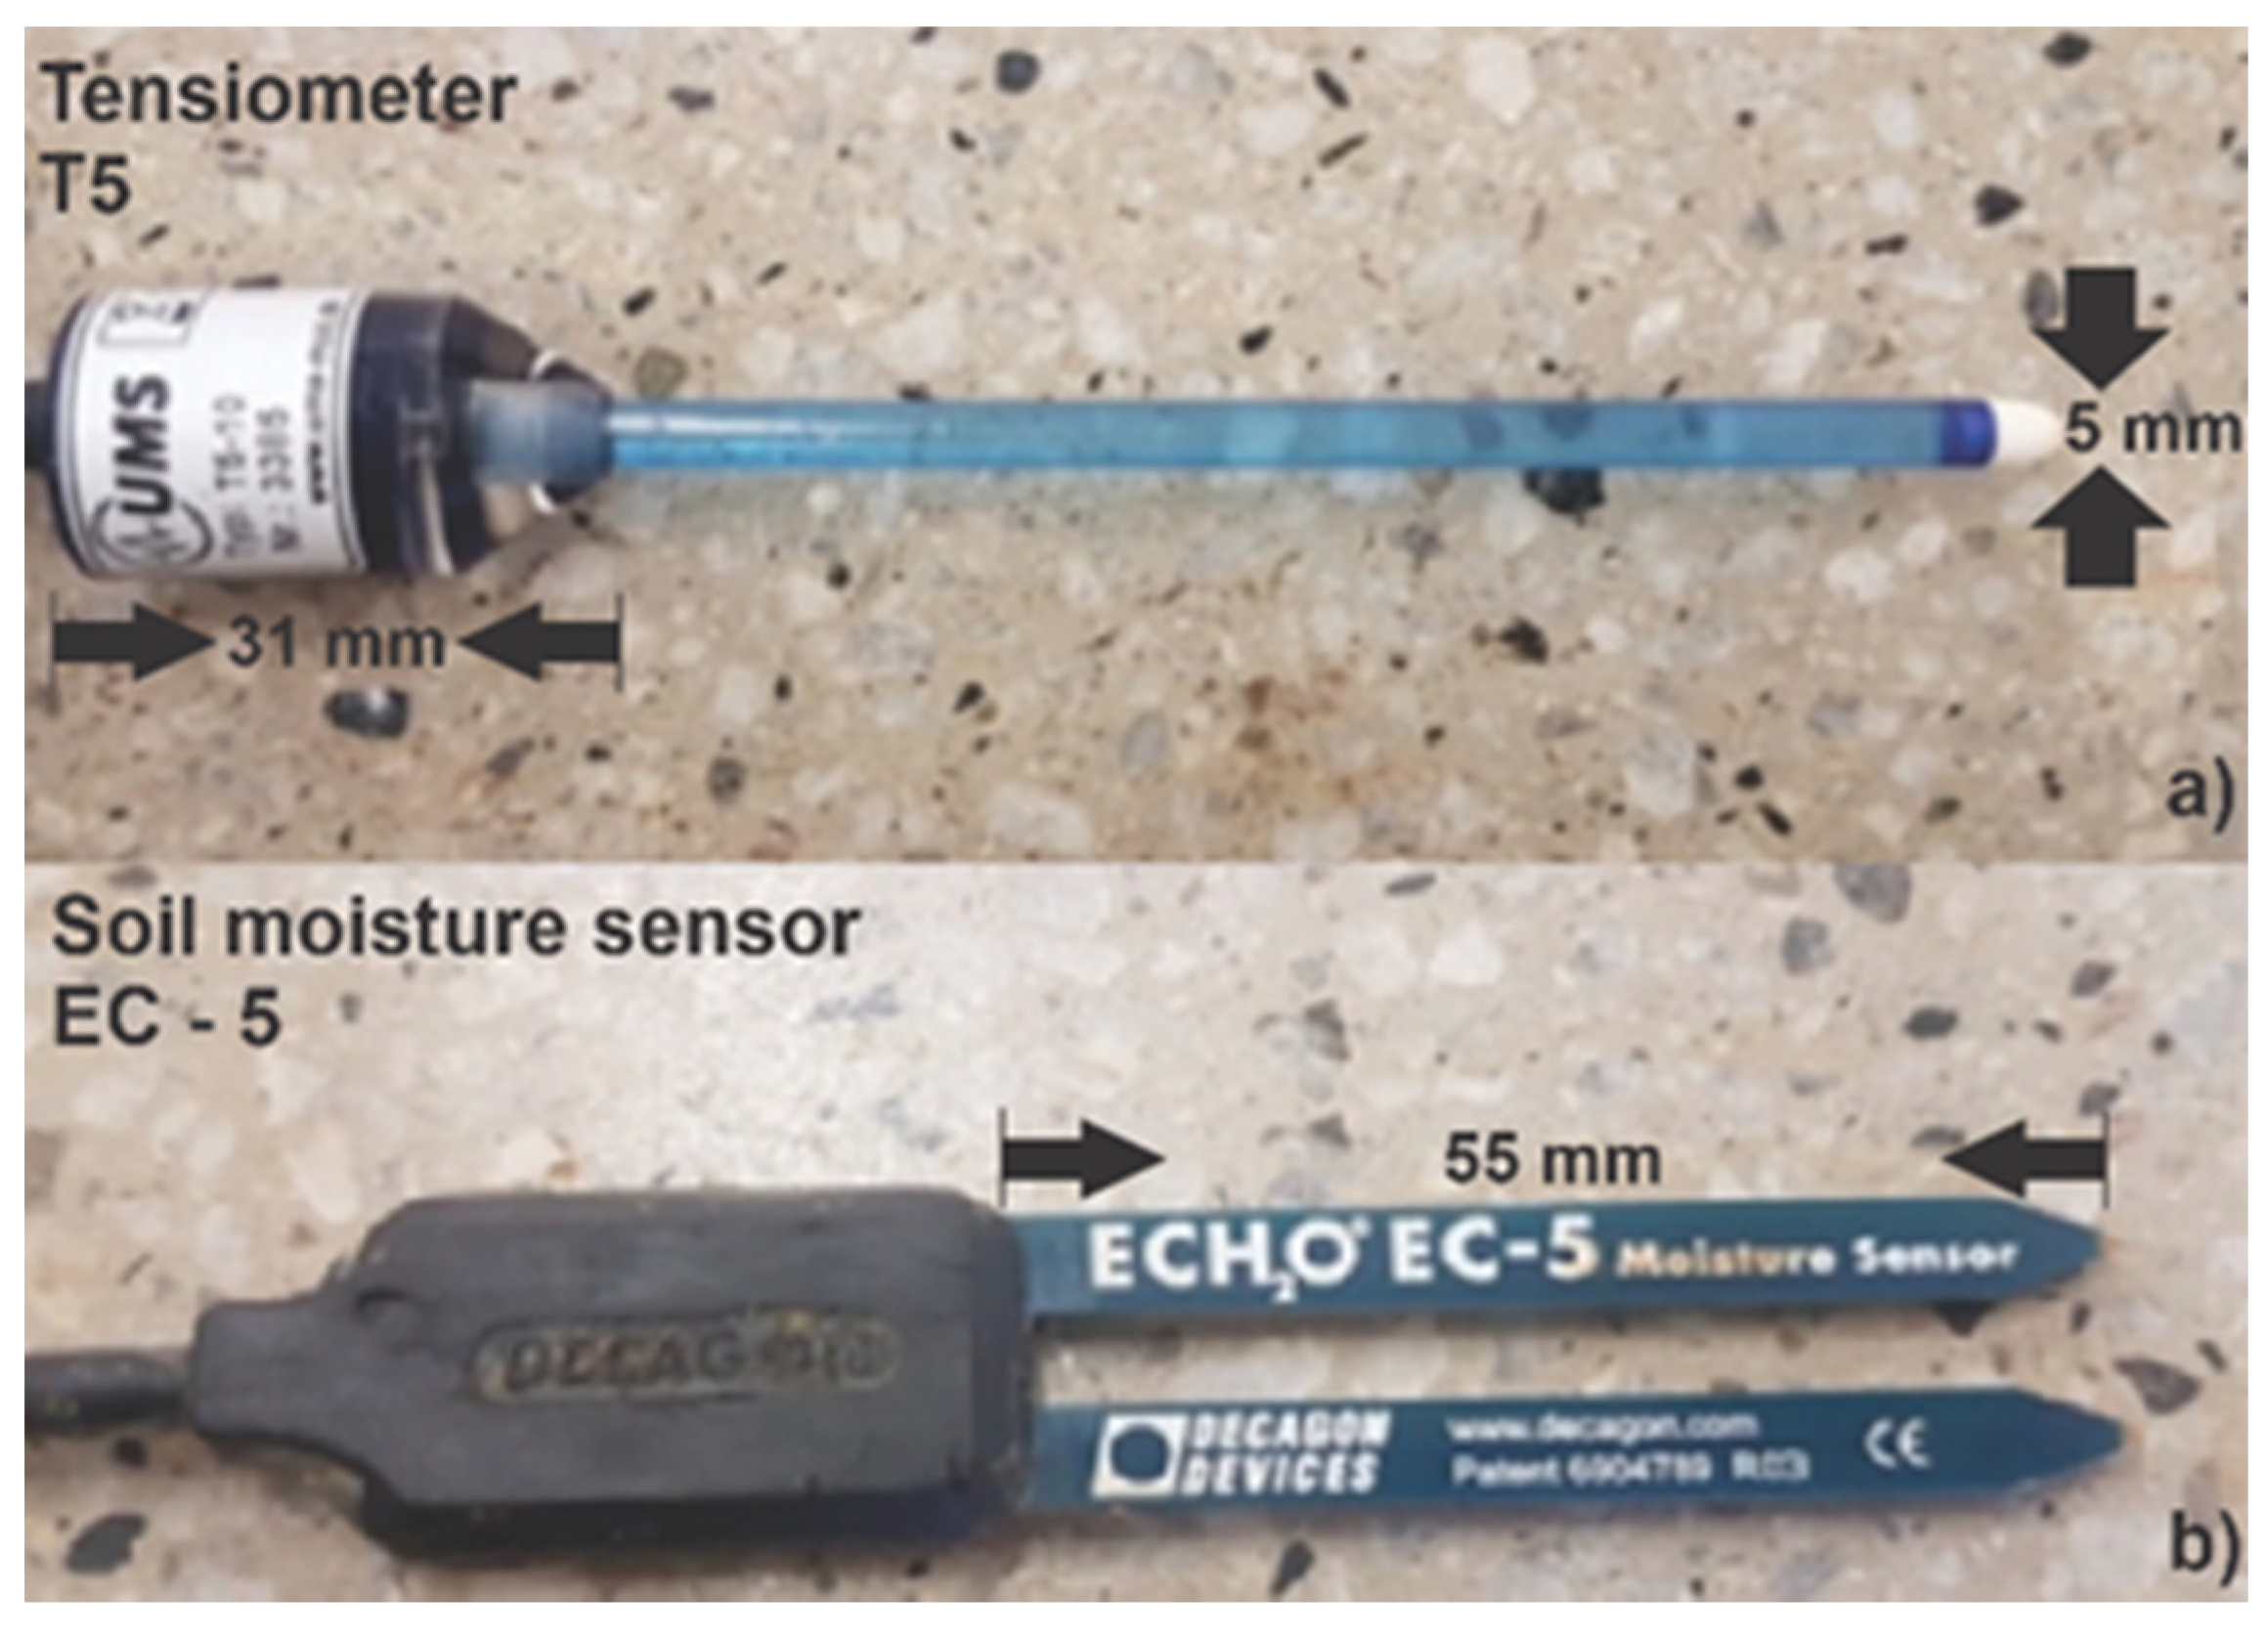
2.1.3. Instrumentation and Data Acquisition System

The RS instrumentation and data acquisition module is responsible for collecting and storing the soil monitoring data before, during, and after the rainfall tests. This system consists of three parts, and each part has a specific data logger. Figure 4 shows how the three parts are arranged in the RS, their interconnections, and components.
The first part is composed of five volumetric moisture sensors, model EC-5 (Decagon Devices, Pullman, WA, USA), to determine the volumetric water content (VWC) of the soil and a data logger model Em-50 (Decagon Devices, Pullman, WA, USA). The second part is composed of five mini-tensiometers model T5 (UMS, Munich, Germany), for negative pore-water pressure determination, and a model GP2 data logger (Delta-T, Cambridge, UK). The third part includes the acquisition of flow and ground erosion data via a precision scale, with the data logger adjusted to operate with an open-type Arduino microprocessor.
The EC-5 volumetric water content sensors operate based on the dielectric constant principle of the medium. This type of sensor belongs to the class of frequency domain sensors because it operates at a fixed frequency of 70 MHz, selected to reduce the effects of salinity and texture, thus providing a higher precision. Figure 5b shows the sensor and its dimensions, with the VWC measured along the entire length of the probe, which has a volume of influence of 0.3 L [49].
The T5 tensiometer measures the soil–water tension (Figure 5a). The voltage of the pressure transducer in contact with the water is converted into a continuous electrical signal, measured or transmitted by a power supply. The sensor principle is based on the piezoresistive effect of the silicon semiconductors, whereby their specific electrical resistance is affected by deformation, processed to obtain the voltage from a Wheatstone bridge. The deformation is caused by the pressure (or water stress) on the silicon chip, which is very thin and therefore extremely sensitive to pressure variations. The pressure transducer is calibrated to 10.6 Vdc and therefore requires a regulated power supply, obtaining signals ranging from 0 hPa ≈ 0 mVdc to 1000 hPa ≈ 103 mVdc [50].
For the monitoring and data acquisition of the drained flow over time, a precision microprocessor-connected scale programmable in Arduino was adopted, which allows data transmission of the water mass drained from the surface of the soil specimen at programmable time intervals, in this case, every 5 min during the artificial rainfall events.
Both the manometer and pressure transducer in the proposed RS (Figure 4) were calibrated and had an accuracy error of 1.1% (with a tolerance limit of 1.6%). The pressure transducer was calibrated in the apparatus itself based on the previously calibrated gauge readings.

2.2. Calibration of the Rainfall and Runoff Simulator

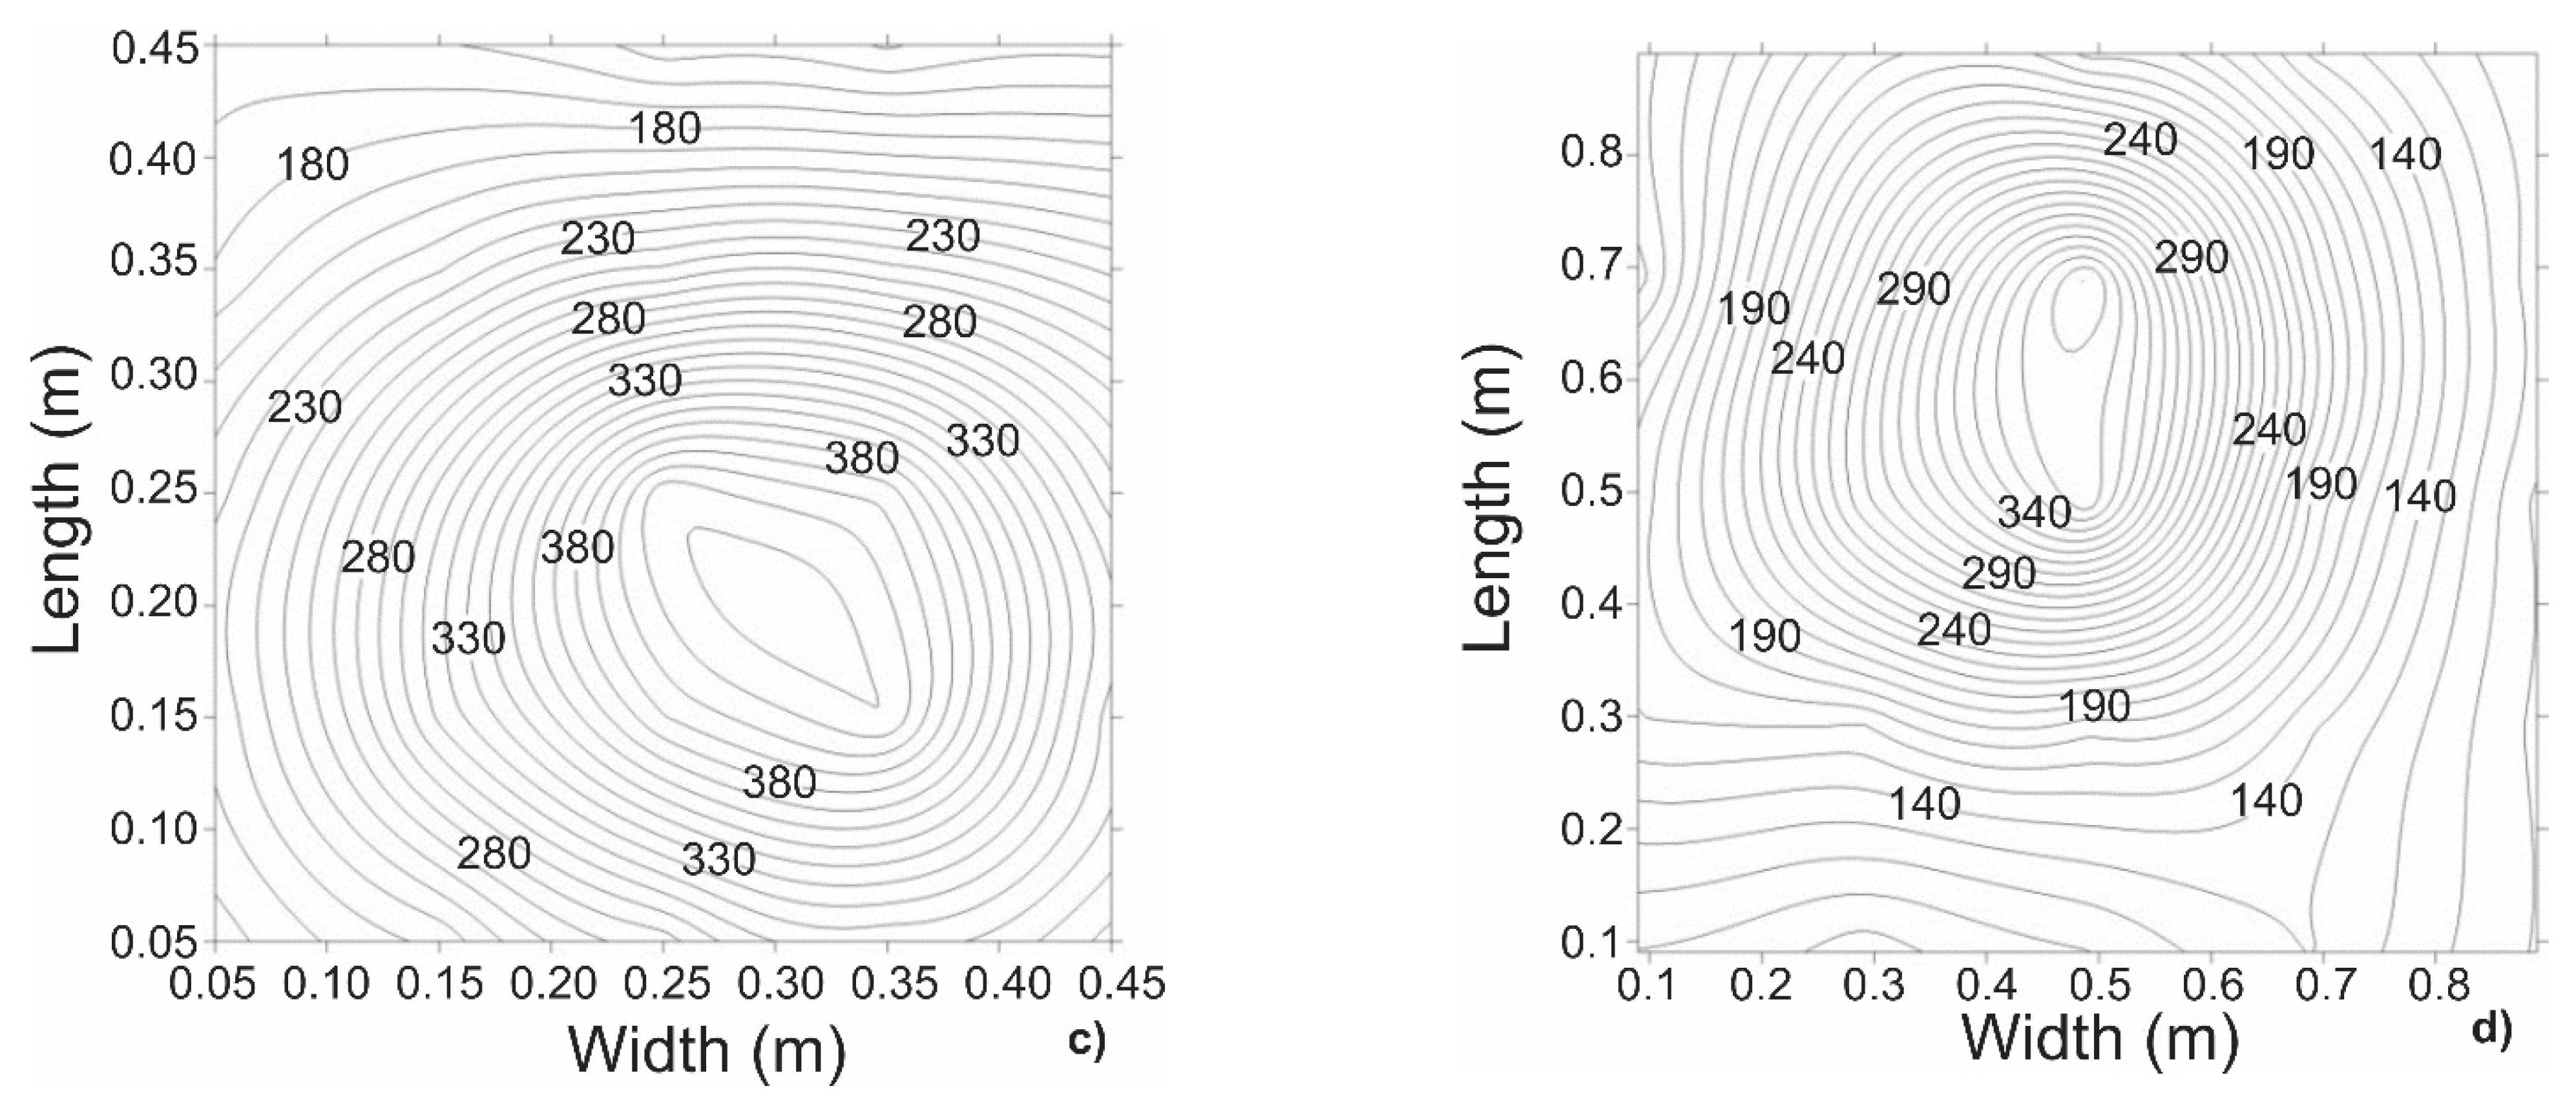
2.2.1. Calibration of the Rainfall Generator

A specific combination of apparatus specifications was designed to allow testing under the required high intensity rainfalls (up to 220 mm h−1) and using a single nozzle, which is a constraint imposed by the surface area of the specimens, between 0.25 and 1 m2. For the proper operation of the RS, the simulated rainfall should be as similar as possible to natural rainfall. Based on the size, mass, volume and speed of droplets, most rainfall characteristics, such as the intensity, height and kinetic energy, can be derived from these properties [38,51]. To evaluate the uniformity of the raindrop distribution, the Christiansen Uniformity Coefficient (CUC), defined by Equation (1), was adopted:
C U C = 100 ( 1 i = 1 n | X i X ¯ | n c X ¯ )
where Xi is the mean precipitation in each collector [L], X ¯ is the precipitated mean line [L] and nc is the number of collectors.
Meyer and Harmon and Tossell et al. [52,53] considered CUC values above 80% to be acceptable for a uniform raindrop distribution of RSs; however, according to Sousa Júnior et al. and Miguntanna [3,32], a value of CUC above 70% is sufficient, which is the value considered in this work.
For the determination of the distribution of the raindrop diameter (DSD), the flour pellet method was selected. This method was originally developed by Bentley [54], thereafter reviewed by Hudson [55,56] and implemented by Rahardjo et al., Herngren, Egodowatta, Miguntanna, Kincaid et al. and Pérez-Latorre et al. [26,28,29,32,57,58]. For this procedure, a 0.05 m2 tray with uncompacted wheat flour was exposed to the simulated rain at the center of the simulator for 1 s in triplicate. Then, the flour was dried for 24 h at ambient temperature and with a heater, and the formed granules were separated by a series of sieves (4.75 mm, 3.35 mm, 2.36 mm, 1.18 mm, and 0.85 mm), then weighed on an analytical balance, as suggested Sousa Júnior et al. [3]. Thus, the median diameter of the simulated rain drops (D50) of each class was determined from the distribution curve of the accumulated volume of the drops as a function of the average diameter of the drops per sampled class [14]. This test was performed for operating pressures of 70, 100, and 150 kPa.
The terminal velocity and energy can be determined from the raindrop uniformity and drop diameter as shown in Figure 6.

2.2.2. Calibration of the Soil Volumetric Water Content Sensors

Calibration of VWC probes was performed for each of the five sensors. Initially, a sample of the same soil used in pilot tests was compacted in the acrylic container, which has a port allowing the insertion of the soil moisture sensor. The selected soil has an optimal water content of 18% and the corresponding void ratio for the standard Proctor effort is 1.0, compatible with the samples to be tested in the RS. After the initial sensor reading was recorded, water was slowly added to the soil, thus increasing the soil water content. Soil samples were later collected for the determination of the final water content. The sensor readings were recorded as water was added to the container, thereby establishing moisture content calibration points. Figure 7 illustrates the calibration process of the moisture sensors.

2.2.3. Saturation of the Tensiometers

The tensiometer has an acrylic rod with a tip consisting of a porous stone. The acrylic rod must be filled with distilled water, with its tensile stress being measured by the pressure transducer. For the proper operation of the tensiometer, air bubbles must be removed from the body of the acrylic rod, ensuring complete saturation of the tensiometers. For the saturation process, distilled water was poured into the body and stem of the tensiometer. A suction pump was used to remove the bubbles in the water, thereby saturating the porous stone tip (Figure 8). To confirm the correct saturation state, portable tension measurement equipment was used to assess the response time of the readings, accuracy and limits established, which should not exceed −2000 hPa.

2.3. Operation

2.3.1. Apparatus Module

Before placing the sample in the RS, it is necessary to prepare markers to guide the positioning of the spray nozzle, ensuring that it is centralized and aligned with the center of the sample. Spray nozzle positioning depends on the specimen slope. A centering plumb and a bubble level were used. With the sample in place, the RS was locked and the equipment setup process was continued, with the insertion of water content sensors and tensiometers.

2.3.2. Monitoring Module

Because of the degree of compaction of the specimen, accessories were required to create a driving path for the installation of the soil instrumentation devices. The cavities created were slightly smaller than the dimensions of the sensors to allow insertion and a tight fit in the soil sample, without losing contact or causing damage to the instruments.

2.3.3. Rainfall Generator Module

Initially, it was necessary to purge air from the hydraulic network by activating the spray nozzle, applying five bursts of water or more under a high pressure of approximately 150 kPa, until all air was removed. A diversion funnel was used to prevent any simulated rainfall from reaching the specimen. Then, the pressure was adjusted to the service pressure (70 kPa), and the total time and the opening and closing periods of the sprinkler nozzle solenoid valve (constant or pulsed rain) were configured. All commands are applied through Bluetooth communication for Android (Figure 9).
The water containers were placed on an electronic balance for the collection of sediment, and flow sensors that monitored the water mass and superficial flow of water over the specimen at predefined 5 min intervals were inserted. The specimen table was adjusted to the desired slope with the use of safety locks, and the test was started.

3. Results and Discussions

This paper is not intended to present all the results and the detailed analysis on the experimental tests carried out but only to demonstrate the applicability and functioning of the developed RS, both for hydrological and geotechnical studies.

3.1. Evaluation of the Intensity and Uniformity of the Simulated Rainfall

The characteristics of the simulated rainfall are influenced by the sprinkler nozzle used and are a function of the service pressure and height of the sprinkler. The sprinkler nozzle for the RS was selected via an extensive literature review of the various types of sprinklers used in previous RS models. The review focused on the form of the sprinkler (e.g., hollow cone, full cone, or square), ease of acquisition and maintenance, required service pressure and technical data availability.
There are several rainfall apparatuses capable of simulating rainfalls with coefficients of uniformity (CUC) higher than 70%, such as those presented by Miller [60], Aksoy et al. [1,61], and Sousa Jr. et al. [3]. However, the high CUC values observed in these studies were obtained for apparatuses with relatively high surface areas (from 2.0 to 7.0 m2), which allowed the use of multiple nozzles. The use of multiple nozzles allows the application of relatively high rainfall intensities and results in higher CUC values [1,3,62]. The RS developed here was designed for testing relatively small surface areas under high rainfall intensities. The use of a single nozzle imposed by specimens with smaller areas, such as those presented herein, makes it possible to obtain higher CUC values. However, the rainfall characteristics degrade when high rainfall intensities are applied using a single nozzle, including inadequate raindrop size and kinetic energy. To improve raindrop characteristics, changes must be made to the system parameters. Unfortunately, these same changes tend to decrease CUC. In summary, the multiple variables involved affect the rainfall characteristics in a way that requires a balance among nozzle characteristics, nozzle elevation, and service pressure. A specific combination of conditions designed to allow testing under the required high intensity rainfall conditions using a single nozzle was developed.
Evaluation of the simulated rainfall was first performed via analysis of the distribution uniformity of the raindrops by considering CUC [63], and the intensity of the simulated rainfall for the specified service pressures (i.e., 70, 100, and 150 kPa), which guarantees a D50 diameter representative of natural rainfall, ranging from 2.0 to 2.5 mm. The obtained value of D50 was subsequently used to evaluate the terminal velocity [51,64,65,66] and kinetic energy of the raindrops [51,66]. The height of the simulated rainfall for the determination of CUC was 1.89 m at 1, 2, and 5 min, over a sampling area of 1.0 m2, using 25 collectors. The end collectors were placed 10 cm away from the edge of the specimen and the other collectors 20 cm apart from each other.
Figure 10 shows that for the determination of CUC, three tests were performed under each applied service pressure. The ½″-29SQ-HHSQ sprinkler nozzle (Figure 10b) provided higher CUC values, ranging between 78% and 86%, while the ¼″-10SQ-HHSQ sprinkler nozzle (Figure 10a) provided CUC values ranging between 60% and 71%. Although the ½″-29SQ-HHSQ sprinkler nozzle attained a higher uniformity, the actual rainfall intensity produced was relatively high (approximately 200.0 mm h−1). However, the ¼″-10SQ-HHSQ sprinkler nozzle satisfied the uniformity requirement proposed by Miguntanna [32], with a real intensity that is appropriate for rainfall intensities approximately 100 mm h−1.
Because it met the rainfall requirements, the uniformity assessment (CUC) of the fulljet ¼″-10SQ-HHSQ sprinkler nozzle was further evaluated. Additional tests were performed at a 1.59 m rain application height and, a service pressure of 50, 70, or 100 kPa over an area of 0.25 m2 and with a simulation time of 1 min under constant rainfall conditions. These specifications were designed to improve the rainfall uniformity. Only a simulation time of 1 min was considered, because it significantly affected the CUC (60 to 67%) under a service pressure of 70 kPa (Figure 10a).
Figure 11 depicts the results of the additional rainfall simulation tests, highlighting that the uniformity of the simulated rainfall increased 18% on average, exhibiting a CUC greater than 70% and meeting the requirements suggested by Miguntanna [32]. However, the problem of a high simulated average intensity again occurred due to the small sampling area, which made it necessary to generate pulsed and variable rainfall to decrease the simulated average intensity. The CUC results in this work (Figure 10b and Figure 11) agreed very well with those reported by Spohr et al. [2] and Sousa Júnior et al. [3] for areas close to 1.0 m2.
Based on the premise that the CUC value obtained with the ¼″-10SQ-HHSQ spray nozzle and the 0.25 m2 experimental plot was satisfactory (i.e., higher than 70%) under the given service pressure and application height, simulated rainfall needed to be generated at a lower rainfall intensity that was more consistent with most real field conditions (80 to 220 mm h−1), as presented in Section 2. To this end, the production of variable simulated rainfall was evaluated, that is, pulsed rainfall via short opening (ta) and closing (tf) time intervals of the solenoid valve supplying the water flow to the sprinkler nozzle. These setting ensured that a constant rainfall was maintained while more closely simulating natural rainfall (Table 1). This procedure is common in sprinkling RSs over small experimental plots, lower-intensity simulated rainfalls are required, as seeing in Spohr et al., Sousa Júnior et al., Alves Sobrinho et al., and Abudi et al. [2,3,19,20].
Tests were performed at different ta, tf and train values for the solenoid valve. The actual simulated intensity was verified during these tests (Table 1), as suggested by Sousa Júnior et al. [3]. It is important to mention that at least two repetitions were performed for each level of ta and tf, and Table 1 only lists the average values of each simulated scenario. The real simulated rainfall intensities shown in Figure 11 and listed in Table 1, corresponding to the ¼″-10SQ-HHSQ sprinkler nozzle, produced using pulsed rainfall, cover a wide range of high rainfall intensities. Widening the range of rainfall intensities to 86 to 234 mm h−1 also includes rainfalls events with shorter return time. Therefore, the developed RS is capable of addressing a wide range of rainfall intensities.
The spatial distribution of the simulated rainfall under pressures of 70, 100, and 150 kPa exhibited a similar pattern, as shown in Figure 12 for the ¼″-10SQ-HHSQ sprinkler nozzle. For the developed RS, no major variations occurred in the distribution patterns of the simulated rainfall under a service pressure of 70 kPa, with CUC ranging from 71 to 74%.
To summarize, the proposed RS was capable of producing rainfall with relatively high intensities (from 86 to 200 mm h−1). Other RSs presented in the literature [2,3,19,62] are capable of producing similar intensities, but not under the imposed constrains of indoor testing using a single jet nozzle. It is also important to point out that the obtained CUC varied between 71 and 74%, a range that is superior to the minimum values recommended by Miguntanna [32].

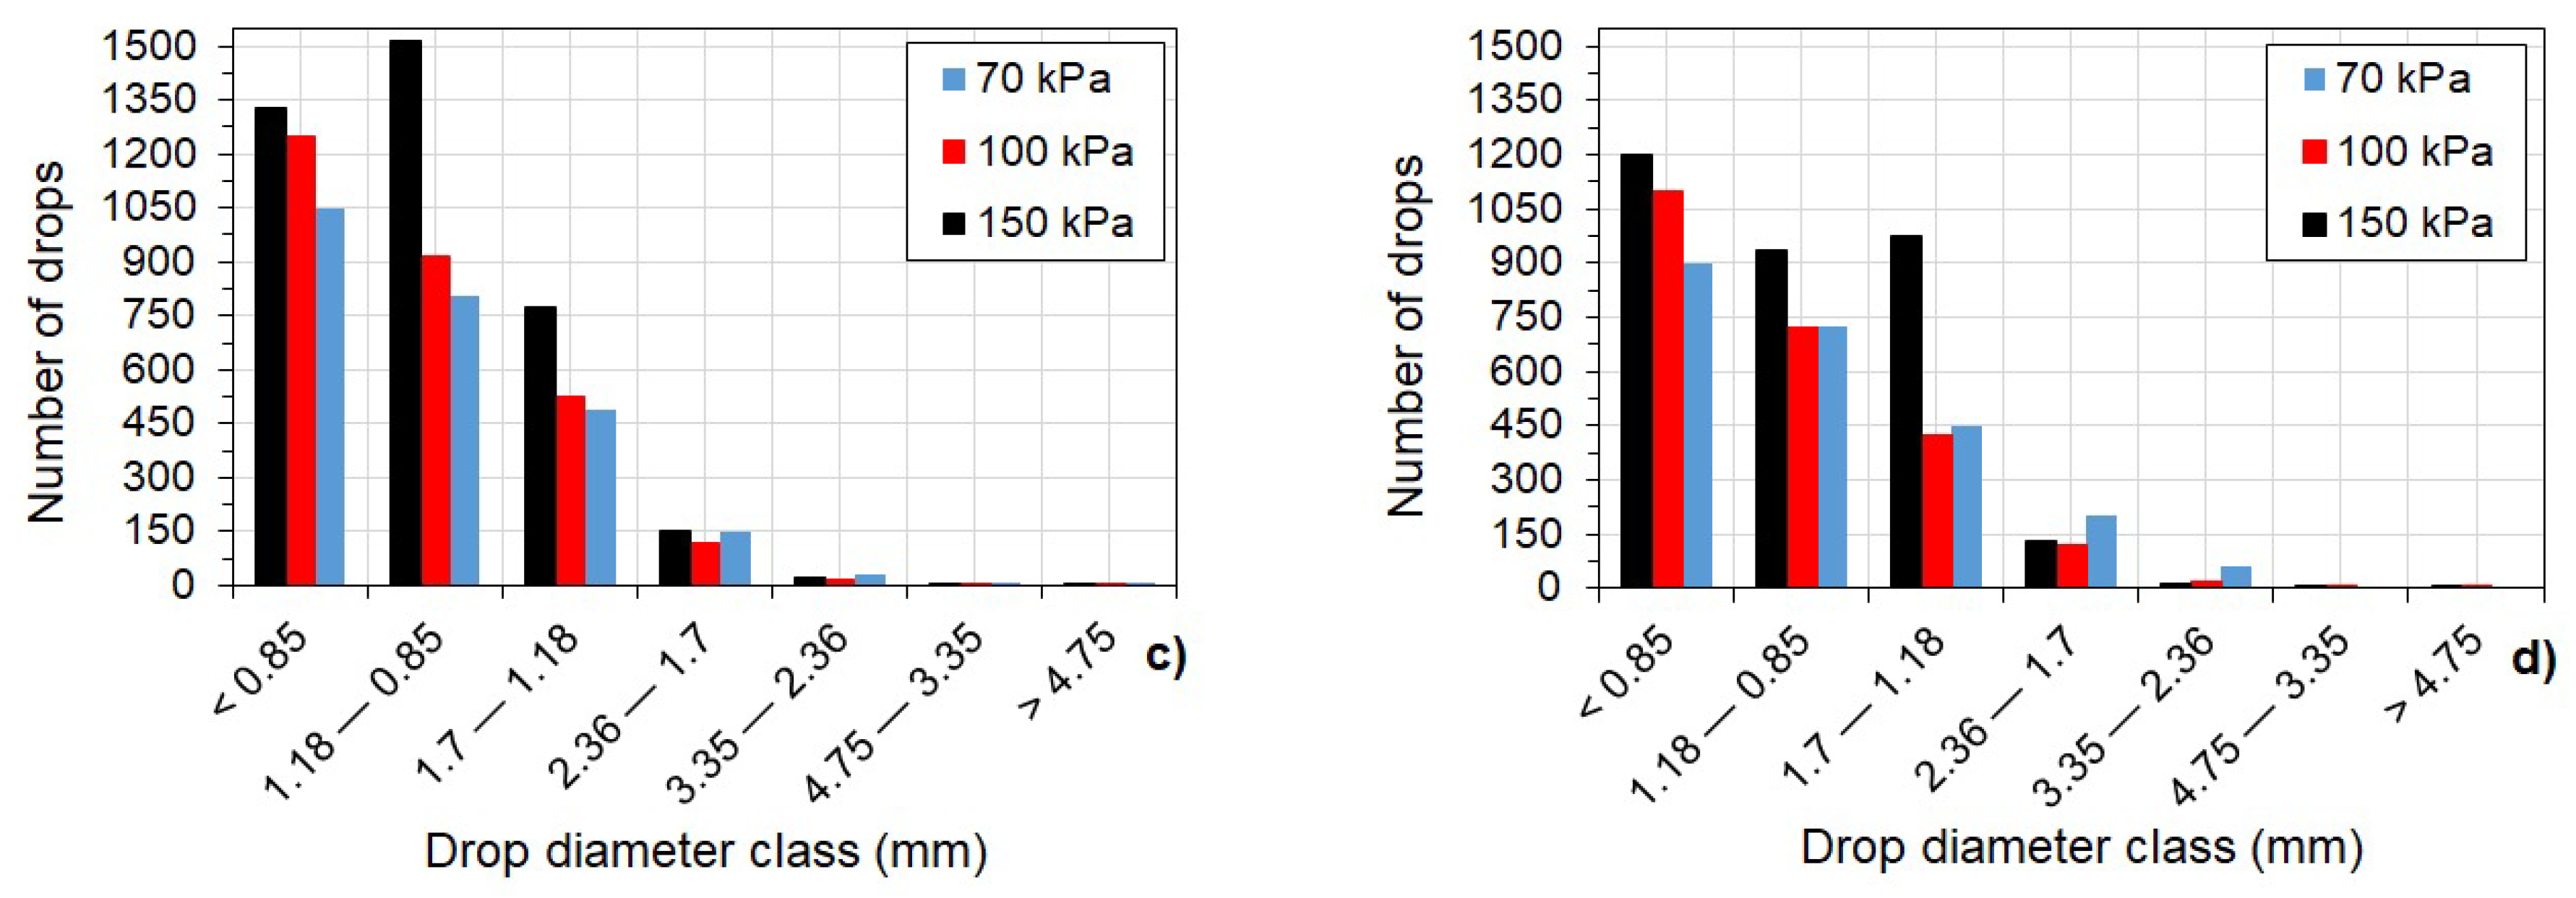
3.2. Evaluation of the Simulated Raindrop Characteristics

Regarding the distribution of raindrop diameter, the flour pellet method was employed for the same height as that in the uniformity test (i.e., 1.89 m), but with a rainfall simulation time of 1 s over a 0.15 m2 metallic plate. Generally, superior results may be obtained using disdrometers or imaging techniques. However, the decision to adopt the flour pellet method was based on recommendations from Kathiravelu et al. [67], who reported that results obtained using that method are adequate for raindrops between 0.3 and 6 mm in diameter. The raindrops produced by the proposed apparatus fall within that range. It is also important to note that high rainfall intensities degrade the quality of measurements using the disdrometers or imaging techniques, due to background noise [67].
After spray application under each service pressure (i.e., 70, 100, and 150 kPa), with three repetitions under each respective service pressure, the pellets were air dried for 24 h and then oven-dried for another 24 h. Figure 13 presents the obtained distribution of the simulated raindrop diameter. The highest raindrop amount production, considering all diameter ranges, was achieved with the ½″-29SQ-HHSQ sprinkler nozzle, under all the service pressures tested. Figure 13a,b show that the service pressure of 70 kPa was responsible for reproducing the largest raindrop diameter range (i.e., 2.0 to 2.5 mm), which is recommended by Mingutanna [32] for natural rainfall. The ¼″-10SQ-HHSQ sprinkler nozzle produced smaller raindrop diameters under all service pressures (Figure 13c,d), even though the pressure of 70 kPa produced raindrops ranging from 2.0 to 2.5 mm, in addition to generating an appropriate CUC value. In general, it was observed that the air-drying method followed by oven-drying generated a larger number of drops mainly for diameter classes smaller than 2.36 mm due to the high oven temperature (105 °C), which may have resulted in grain fragmentation.
Notably, both irrigation sprinklers have technical characteristics recommended for the simulation of artificial rainfall and produce results very close to those found by Sousa Júnior et al. [3], in terms of the uniformity, intensity, DSD, terminal velocity, and kinetic energy. However, Sousa Júnior et al. [3] used two ½″-SS-HH-40 cone sprinkler nozzles that are different from those used in the RA presented herein. The ½″-29SQ-HHSQ square cone sprinkler nozzle adopted herein generated a higher rainfall intensity, with more kinetic energy and a larger coverage distance (greater than 1.0 m2). In contrast, the ¼″-10SQ-HHSQ square cone sprinkler nozzle, also evaluated herein, produced a lower-intensity artificial rainfall with lower kinetic energy and covered an area smaller than 1.0 m2.
After verifying the adequate rainfall intensity and CUC, for the various service pressures (i.e., 70, 100, and 150 kPa) considering both spray nozzles (i.e., ¼″-10SQ-HHSQ, ½″-29SQ-HHSQ), the obtained droplet diameter distribution (Figure 13) was used to determine D50, according to the methodology proposed by Mendes [14]. The obtained value of D50 was 2.4 mm for a service pressure of 70 kPa. This service pressure resulted in the most uniform droplet diameter distribution, with values similar to those presented by Sousa Júnior et al. [3] using less rigorous conditions, including the use of two spray nozzles.
The terminal velocity of the simulated raindrops was calculated for each diameter class. A computer model developed in MATLAB, version R2015a, was used for the numerical solution of the partial differential equations developed by Pérez-Latorre et al., and Li and Kawano [58,64]. The fourth-order Runge–Kutta method was adopted, with initial conditions established by the RS itself and by the sprinkler nozzle, such as the falling height and initial speed (exit) of the drops from the sprinkler. Wind effects were neglected considering the experiments were performed indoors. The Torricelli equation was adopted to determine the initial raindrop speed upon leaving the spray nozzle as follows:
v i = C d 2 g P S E R
where vi is the initial drop speed exiting the sprinkler [LT−1]; Cd is the flow or discharge coefficient, which is the relation between the actual flow produced by the spray nozzle under a given service pressure and the measured flow; g is the gravity acceleration [LT−2]; and PSER is the operating pressure [L] at steps of 1 kPa or 0.1 m of a water column.
Figure 14 illustrates the behavior of the speed of the simulated raindrops for each average diameter class as a function of the time and distance. These results correspond to raindrops generated by the ¼″-10SQ-HHSQ spray nozzle at PSER = 70 kPa and vi = 11.25 m s−1. It is important to note that the assumption of a spherical raindrop shape is only satisfactory for small raindrop diameters [66]. When the raindrop diameter increases, its shape tends to change (Figure 15) to minimize the drag resistance force of the air. For this reason, the numerical results of the terminal velocity for large diameters (>5.0 mm) should be cautiously evaluated. Fortunately, this not the case for the simulated rainfalls presented herein, with raindrop diameters generated by the RS being smaller than 5.0 mm.
The kinetic energy produced by the raindrops was calculated from the speed values for the simulated raindrops when reaching the ground. The methodology of Brodie and Rosewell [68] was employed, expressed in terms of the specific energy of the volume, i.e., KEp (J m−2 mm−1). The calculated KEp value was 38.5 J m−2 mm−1, which represents 154% of the kinetic energy produced by natural rainfall events with a pluviometric intensity higher than 40.0 mm h−1, at 25.0 J m−2 mm−1 [51]. Simulated rainfall produced with adequate characteristics can attain up to 94% of the terminal velocity of natural rainfall [3,69] as long as it is of the same intensity. Thus, as will be shown below, the high kinetic energy developed by the RS helped to more easily investigate the effects of the inclusion of a vegetation cover as soil protection.
Figure 16 shows the percentage of the kinetic energy produced for each raindrop diameter class generated by the ¼″-10SQ-HHSQ spray nozzle at a height of 1.58 m. Raindrops with a diameter between 1.7 and 3.35 mm produced 60.26% of the total kinetic energy.
The droplet velocity and kinetic energy using the ¼″-10SQ-HHSQ spray nozzle and a service pressure of 70 kPa was 38.5 J m−2 mm−1, which is higher than the value obtained by Van Dijk et al. [51], of about 25.0 J m−2 mm−1 for lower intensity rainfalls of 40 mm h−1. These results are associated with the relatively low height of the spray nozzle in the proposed apparatus (i.e., 1.59 m above the specimen surface). It is important to note that there is a lack of published research considering high rainfall intensities, with Lassu et al. and Fernández-Raga et al. [37,66] presenting some of the main previous results. Finally, the relatively high kinetic energy produced by the proposed RS may be considered a limiting factor, but the obtained value may be adjusted by changing the spray nozzle heigh.

3.3. Evaluation of the RS under Real Testing Conditions

Tests were conducted on samples with and without vegetation, as shown in Figure 17, respectively. The grass species Paspalum notatum was used as the soil vegetation cover. Figure 17 shows that in specimens without vegetation, erosion occurred due to the high kinetic energy of the simulated raindrops, which was higher than that of natural raindrops. In the samples with vegetation, this erosion process did not occur, indicating the importance of vegetation in the processes of infiltration, percolation, erosion control, and solids transport, in addition to reducing the total surface runoff. It should also be noted that the rainfall intensity greatly influenced the total runoff and solids transport measured during the experimental tests performed with the RS without considering the vegetation cover.
For the test without vegetation cover (Figure 18), with PP = 86.0 mm h−1, e0 = 1.0 and αD = 15°, the water rapidly reached the lower soil layers, while in the test with vegetation cover (Figure 19), water redistribution occurred in the soil, thus resulting in a slow and gradual behavior of the pore-water pressure in the lower layers. In this last case water reached point 5 only after 68 min, which was 8 min after the end of the rainfall test.
The evolution of the internal conditions of the specimen in terms of the volumetric water content soil was evaluated by Egeli and Pulat and Greco et al. [13,70], but using other types of RSs, in the context of slope stability studies and disregarding the effect of vegetation. It is noteworthy that these studies used RSs with distinct technical characteristics when compared to the RS presented herein. The apparatuses presented is previous studies used a greater number of sprinkler nozzles, significantly different rainfall intensities, slopes angles, and surface area dimensions.
Egeli and Pulat [13] did not monitor soil suction, hindering the estimation of the soil–water characteristic curve, which is the most important soil information for the numerical modeling of infiltration and water percolation. Greco et al. [70] monitored both volumetric water content and matric suction. The authors did not consider the effect of vegetation, but the obtained results were similar to those presented in Figure 18. The soil suction range was similar, from 20 to 80 kPa, and a sudden advance of the wetting front was also observed, main for probes close to the specimen surface.

4. Conclusions

A newly developed portable rainfall simulator (RS) was introduced. The apparatus was designed to allow the simulation of rainfall events of relatively high intensities over small specimen surface areas and under laboratory conditions. The difficult balance of rainfall generation parameters using a single nozzle was evaluated. Because of the high rainfall intensities enabled by the proposed RS, it can be used in hydrological and geotechnical studies, including the study of rainfall–runoff interactions and the study of erosion processes. Special attention was given to the independent evaluation of runoff and infiltration, including the monitoring of internal specimen conditions. The characteristics of the proposed device address rigorous conditions required by relatively small portable apparatuses that combine the assessment of hydrological and geotechnical characteristics of both bare soils and vegetated surfaces in erosion studies.
The presented results demonstrate that it is possible to simulate rainfall events under the imposed constraints. Suitable uniformity was achieved, with CUC values greater than 70%. An adequate distribution of the raindrop size was reproduced, with a large number of drops, between 2.0 and 2.5 mm. Rainfall intensities ranging between 86.0 and 220.0 mm h−1 were obtained, meeting the RS specification goals.
The use of a PID system in Arduino (via Bluetooth) enabled the automatic control and monitoring of the service pressure of the rainfall generator, thus ensuring a greater uniformity control of the raindrop distribution and artificial rainfall intensity. Finally, the ¼″-10SQ-HHSQ square cone sprinkler nozzle is recommended, because it produces artificial rainfall with characteristics that are closer to those of natural rainfalls for areas smaller than 1.0 m2 and for an application height of 1.59 m at an intensity that is more consistent with that of rainfall events occurring over 10 to 100 years. The recommended specifications allow the testing of specimens under more realistic in situ conditions and the evaluation of surface and internal flow, slope stability, erodibility and other geotechnical aspects.

Author Contributions

Conceptualization, T.A.M., J.F.R.R. and G.d.F.N.G.J.; Methodology, T.A.M., J.F.R.R. and G.d.F.N.G.J.; Formal analysis, T.A.M. and J.F.R.R.; Investigation, T.A.M., M.T.d.S.M. and S.A.d.S.P.; Resources, T.A.M., J.F.R.R. and M.P.d.L.; Data curation, T.A.M., J.F.R.R. and G.d.F.N.G.J.; Writing—original draft preparation, T.A.M.; S.A.d.S.P. and G.d.F.N.G.J.; Writing—review and editing, T.A.M., S.A.d.S.P., G.d.F.N.G.J. and J.F.R.R.; Supervision, J.F.R.R. and G.d.F.N.G.J.; Project administration, T.A.M.; Funding acquisition, J.F.R.R. and M.P.d.L. All authors have read and agreed to the published version of the manuscript.

Funding

Part of this research was funded by the Agência Nacional de Energia Elétrica (ANEEL, PD-0394-1603/2016), Coordenação de Aperfeiçoamento de Pessoal de Nível Superior (CAPES) and, Conselho Nacional de Desenvolvimento Científico e Tecnológico (CNPq).

Institutional Review Board Statement

Not applicable.

Informed Consent Statement

Not applicable.

Data Availability Statement

Not applicable.

Acknowledgments

The authors would like to thank the Instituto Federal de Educação, Ciência e Tecnologia de Goiás (IFG, Goias Federal Institute of Education, Science and Technology), Universidade de Brasília (UnB, University of Brasilia), and all of the Eletrobras FURNAS community for the support of the research activities reported in this paper and Agência Nacional de Energia Elétrica (ANEEL, National Agency of Electric Energy) for promoting part this research to Bioengineering (PD-ANEEL 0394-1603/2016). The editorial board and the reviewers of this paper are also greatly appreciated.

Conflicts of Interest

The authors declare that they have no known competing financial interests or personal relationships that could have appeared to influence the work reported in this paper. Thus, the authors declare no conflict of interest.

References

  1. Aksoy, H.; Unal, N.E.; Cokgor, S.; Gedikli, A.; Yoon, J.; Koca, K.; Inci, S.B.; Eris, E. A rainfall simulator for laboratory-scale assessment of rainfall-runoff-sediment transport processes over a two-dimensional flume. Catena 2012, 98, 63–72. [Google Scholar] [CrossRef]
  2. Spohr, R.; Corcini, A.; Pellegrin, J.; Bonfanti, J.; Soto, M.; Cardoso, T. Development and validation of a portable rainfall simulator. Braz. J. Water Resour. 2015, 20, 411–417. [Google Scholar]
  3. Sousa Júnior, S.F.D.; Mendes, T.A.; Siqueira, E.Q.D. Development and calibration of a rainfall simulator for hydrological studies. Braz. J. Water Resour. 2017, 22, e59. [Google Scholar] [CrossRef] [Green Version]
  4. Boughton, W.; Droop, O. Continuous simulation for design flood estimation—A review. Environ. Modell. Softw. 2003, 18, 309–318. [Google Scholar] [CrossRef]
  5. Pathiraja, S.; Westra, S.; Sharma, A. Why continuous simulation? The role of antecedent moisture in design flood estimation. Water Resour. Res. 2012, 48, W06534. [Google Scholar] [CrossRef] [Green Version]
  6. Callau Poduje, A.C.; Haberlandt, U. Short time step continuous rainfall modelling and simulation of extreme events. J. Hydrol. 2017, 552, 182–197. [Google Scholar] [CrossRef]
  7. Paz, F.; Bautista, E.L.; Sosa, I.M. Validación del modelo expo-lineal precipitación-escurrimiento en un simulador de lluvia. Terra Latinoam. 2017, 35, 329–341. [Google Scholar]
  8. Rowe, T.J.; Smithers, J.C. Continuous simulation modelling for design flood estimation—A South African perspective and recommendations. Water SA 2018, 44, 691–705. [Google Scholar] [CrossRef] [Green Version]
  9. Winter, B.; Schneeberger, K.; Dung, N.V.; Huttenlau, M.; Achleitner, S.; Stötter, J.; Merz, B.; Vorogushyn, S. A continuous modelling approach for design flood estimation on sub-daily timescale. Sci. J. 2019, 64, 539–554. [Google Scholar]
  10. Grimaldi, S.; Nardi, F.; Piscopia, R.; Petroselli, A.; Apollonio, C. Continuous hydrologic modelling for design simulation in small and ungauged basins: A step forward and some tests for its practical use. J. Hydrol. 2020, 125664. [Google Scholar] [CrossRef]
  11. Petroselli, A.; Piscopia, R.; Grimaldi, S. Design discharge estimation in small and ungauged basins: EBA4SUB framework sensitivity analysis. J. Agric. Eng. 2020, 51, 107–118. [Google Scholar] [CrossRef]
  12. Miyazaki, T. Water Flow in Soils; CRC Press: Boca Raton, FL, USA, 2005. [Google Scholar]
  13. Egeli, I.; Pulat, H.F. Mechanism and modelling of shallow soil slope stability during high intensity and short duration rainfall. Sci. Iran. 2011, 18, 1179–1187. [Google Scholar] [CrossRef] [Green Version]
  14. Mendes, T.A. Physical and Numerical Modeling of Infiltration and Runoff in Unsaturated and Vegetative Coverage Surfaces. Ph.D. Thesis, Department of Civil and Environmental Engineering, University of Brasilia, Brasília, Brazil, 2019. [Google Scholar]
  15. Mendes, T.A.; Gitirana, G.F.N.; Rebolledo, J.F.R.; Vaz, E.F.; Da Luz, M.P. Numerical evaluation of laboratory apparatuses for the study of infiltration and runoff. Braz. J. Water Resour. 2020, 25, e37. [Google Scholar] [CrossRef]
  16. Melo, M.T.; Palmeira, E.M.; Santos, E.C.; da Luz, M.P. Geosynthetic performance against slope erosion caused by high intensity rainfall. Geosynth. Int. 2020, 27, 1–49. [Google Scholar]
  17. Montebeller, C.A.; Carvalho, D.F.D.; Alves Sobrinho, T.; Nunes, A.C.D.S.; Rubio, E. Hydraulic evaluation of a pendulum rainfall simulator. Braz. J. Agric. Environ. Eng. 2001. [Google Scholar] [CrossRef] [Green Version]
  18. Schaefer, C.E.R.; Silva, D.D.; Paiva, K.W.N.; Pruski, F.F.; Alburqueque Filho, M.R.; Alburqueque, M.A. Soil, nutrient and organic matter losses in a Red-Yellow Podzolic under simulated rainfall. Braz. J. Agric. Res. 2002, 37, 669–678. [Google Scholar]
  19. Alves Sobrinho, T.; Gómez-Macpherson, H.; Gómez, J.A. A portable integrated rainfall and overland flow simulator. Soil Use Manag. 2008, 24, 163–170. [Google Scholar] [CrossRef]
  20. Abudi, I.; Carmi, G.; Berliner, P. Rainfall simulator for field runoff studies. J. Hydrol. 2012, 454–455, 76–81. [Google Scholar] [CrossRef]
  21. Almeida, W.S.; Carvalho, D.F.; Panachuki, E.; Valim, W.C.; Rodrigues, S.A.; Varella, C.A.A. Hydraulic erosion in different tillage systems and soil cover. Braz. J. Agric. Res. 2016, 51, 1110–1119. [Google Scholar]
  22. Moraes, A.G.L.; Carvalho, D.F.C.; Antunes, M.A.H.; Ceddia, M.B. Relationship between remote sensing data and field-observed interril erosion. Braz. J. Agric. Res. 2018, 53, 332–341. [Google Scholar] [CrossRef] [Green Version]
  23. Von Bennewitz, E.; Aladro, J. The effects of rainfall intensity and rock fragment cover on soil hydrological responses in Central Chile. J. Soil Sci. Plant Nutr. 2017, 17, 781–793. [Google Scholar] [CrossRef] [Green Version]
  24. Pellat, F.P.; Solís, H.D. Relaciones entre la precipitación, producción de biomasa e índices espectrales de la vegetación: Alcances y limitaciones. Terra Latinoam. 2018, 36, 153–168. [Google Scholar] [CrossRef] [Green Version]
  25. Shao, Q.; Baumgartl, T. Estimating input parameters for four infiltration models from basic soil, vegetation, and rainfall properties. Soil Sci. Soc. Am. J. 2014, 78, 1507–1521. [Google Scholar] [CrossRef]
  26. Rahardjo, H.; Krisnanto, S.; Leong, E. Effectiveness of capillary barrier and vegetative slope covers in maintaining soil suction. Soils Rocks 2016, 39, 51–69. [Google Scholar]
  27. Araújo, A.G. Analysis of the Performance of Infiltration Wells in the City of Goiânia-GO. Master’s Thesis, Federal University of Goiás, Goiânia, Brazil, 2013. [Google Scholar]
  28. Herngren, L.F. Build-Up and Wash-Off Process Kinetics of Paths and Heavy Metals on Paved Surfaces Using Simulated Rainfall. Ph.D. Thesis, Queensland University of Technology, Brisbane, QLD, Australia, 2005. [Google Scholar]
  29. Egodawatta, P. Translation of Small-Plot Scale Pollutant Build-Up and Wash-Off Measurements to Urban Catchment Scale. Ph.D. Thesis, Queensland University of Technology, Brisbane, QLD, Australia, 2007. [Google Scholar]
  30. Egodawatta, P.; Thomas, E.; Goonetilleke, A. Mathematical interpretation of pollutant wash-off from urban road surfaces using simulated rainfall. Water Res. 2007, 41, 3025–3031. [Google Scholar] [CrossRef] [Green Version]
  31. Egodawatta, P.; Thomas, E.; Goonetilleke, A. Understanding the physical processes of pollutant build-up and wash-off on roof surfaces. Sci. Total Environ. 2009, 407, 1834–1841. [Google Scholar] [CrossRef] [PubMed] [Green Version]
  32. Minguntanna, N.S. Determining a Set of Surrogate Parameters to Evaluate Urban Stormwater Quality. Master’s Thesis, Faculty of Built Environment and Engineering, Queensland University of Technology, Brisbane, QLD, Australia, 2009. [Google Scholar]
  33. Seeger, M. Uncertainty of factors determining runoff and erosion processes as quantified by rainfall simulations. Catena 2007, 71, 56–67. [Google Scholar] [CrossRef]
  34. SKZ—Das Kunststoff-Zentrum. Erarbeitung und Verifizierung von Auswahlkriterien für Geosynthetische Erosionsschutzsysteme; Fördergemeinschaft für das Süddeutsche Kunststoff-Zentrum: Würzburg, Germany, 2011. [Google Scholar]
  35. Zhang, X.; Yu, G.; Li, Z.B.; Li, P. Experimental study on slope runoff, erosion and sediment under different vegetation types. Water Resour. Manag. 2014, 28, 2415–2433. [Google Scholar] [CrossRef]
  36. Sadeghi, S.H.R.; Gholami, L.; Sharifi, E.; Khaledi Darvishan, A.; Homaee, M. Scale effect on runoff and soil loss control using rice straw mulch under laboratory conditions. Solid Earth 2015, 6, 1–8. [Google Scholar] [CrossRef] [Green Version]
  37. Lassu, T.; Seeger, M.; Peters, P.; Keesstra, S.D. The Wageningen rainfall simulator: Set-up and calibration of an indoor nozzle-type rainfall simulator for soil erosion studies. Land Degrad. Dev. 2015, 26, 604–612. [Google Scholar] [CrossRef]
  38. Fernández-Raga, M.; Campo, J.; Rodrigo-Comino, J.; Keesstra, S.D. Comparative analysis of splash erosion devices for rainfall simulation experiments: A laboratory study. Water 2019, 11, 1228. [Google Scholar] [CrossRef] [Green Version]
  39. Cecconi, M.; Napoli, P.; Pane, V. Effects of soil vegetation on shallow slope instability. Environ. Geotech. 2015, 2, 130–136. [Google Scholar] [CrossRef]
  40. Montrasio, L.; Schilirò, L.; Terrane, A. Physical and numerical modelling of shallow landslides. Landslides 2016, 13, 873–883. [Google Scholar] [CrossRef]
  41. Römkens, M.J.; Helming, K.; Prasad, S. Soil erosion under different rainfall intensities, surface roughness, and soil water regimes. Catena 2002, 46, 103–123. [Google Scholar] [CrossRef]
  42. Montoya-Dominguez, J.D.; García-Aristizábal, E.F.; Vega-Posada, C.A. One-Dimensional Experimental Study of Rainfall Infiltration into Unsaturated Soil; Revista Facultad de Ingeniería, Universidad de Antioquia: Medellín, Colombia, 2017. [Google Scholar]
  43. Martinez, G.; Weltz, M.; Pierson, F.B.; Spaeth, K.E.; Pachepsky, Y. Scale effects on runoff and soil erosion in rangelands: Observations and estimations with predictors of different availability. Catena 2017, 151, 161–173. [Google Scholar] [CrossRef]
  44. PDE Solutions. Flexpde 7.12—Reference Manual; PDE Solutions Inc.: Antioch, CA, USA, 2016. [Google Scholar]
  45. Costa, A.R.; Prado, L.A. Espacialização de chuvas intensas para o estado de Goiás e sul de Tocantins. Rev. Eng. Agrícola 2003, 23, 268–276. [Google Scholar]
  46. Reatto, A.; Bruand, A.; Silva, E.D.; Martins, E.S.; Brossard, M. Hydraulic properties of the diagnostic horizon of Latosols of a regional toposequence across the Brazilian Central Plateau. Geoderma 2007, 139, 51–59. [Google Scholar] [CrossRef] [Green Version]
  47. Rodriguez, T.T.; Weiss, L.A.; Teixeira, R.S.; Branco, C.J.M.C. Permeabilidade de solo laterítico por diferentes métodos. Semina Ciências Exatas Tecnológicas 2015, 36, 17–32. [Google Scholar] [CrossRef] [Green Version]
  48. Soto, M.A.A.; Kiang, C.H. Avaliação da condutividade hidráulica em dois usos do solo na região central do Brasil. Revista Brasileira Ciências Ambient. 2018, 47, 1–11. [Google Scholar] [CrossRef]
  49. Decagon Devices Inc. Soil Moisture Sensors: User’s Manual; Decagon Device Inc.: Pullman, WA, USA, 2008. [Google Scholar]
  50. UMS. User’s Manual—T5 Tensiometer. Available online: http://library.metergroup.com/Manuals/UMS/T5_Manual.pdf (accessed on 5 March 2021).
  51. Van Dijk, A.I.J.M.; Bruijnzeel, L.A.; Rosewell, C.J. Rainfall Intensity—Kinetic Energy Relationships: A Critical Literature Appraisal. J. Hydrol. 2002, 261, 1–23. [Google Scholar] [CrossRef]
  52. Meyer, L.D.; Harmon, W.C. Multiple-intensity rainfall simulator for erosion research on roe side slopes. ASAE 1978, 77, 100–104. [Google Scholar]
  53. Tossell, R.W.; Dickinson, W.T.; Rudra, R.P.; Wall, G.J. A portable rainfall simulator. Can. Agric. Eng. Guelph 1987, 29, 155–162. [Google Scholar]
  54. Bentley, W.A. Studies of raindrops and raindrop phenomena. Mon. Weather. Rev. 1940, 32, 450–456. [Google Scholar]
  55. Hudson, N.W. Raindrop size distribution in high intensity storms. Rhod. J. Agric. Res. 1963, 1, 6–11. [Google Scholar]
  56. Hudson, N.W. The Flour Pellet Method for Measuring the Size of Raindrops; Department of Conservation and Extension: Harare, Zimbabwe, 1964. [Google Scholar]
  57. Kincaid, D.C.; Solomon, K.H.; Oliphant, J.C. Drop size distributions for irrigation sprinkler. Trans. ASAE 1996, 39, 839–845. [Google Scholar] [CrossRef]
  58. Pérez-Latorre, F.J.; de Castro, L.; Delgado, A. A comparison of Two Variable Intensity Rainfall Simulators for Runoff Studies. Soil Tillage Res. 2010, 107, 11–16. [Google Scholar] [CrossRef]
  59. Fukui, Y.; Nakanish, K.; Okamura, S. Computer evaluation of sprinkler irrigation uniformity. Irrig. Sci. 1980, 2, 23–32. [Google Scholar] [CrossRef]
  60. Miller, W.P. A solenoid-operated, variable intensity rainfall simulator. Soil Sci. Am. J. 1987, 51, 832–834. [Google Scholar] [CrossRef]
  61. Aksoy, H.; Gedikli, A.; Unal, N.E.; Yilmaz, M.; Eris, E.; Yoon, J.; Tayfur, G. Rainfall-runoff model considering microtopography simulated in a laboratory erosion flume. Water Resour. Manag. 2016, 30, 5609–5624. [Google Scholar] [CrossRef] [Green Version]
  62. Kim, H.; Ko, T.; Jeong, H.; Ye, S. The development of a methodology for calibrating a large-scale laboratory rainfall simulator. Atmosphere 2018, 9, 427. [Google Scholar] [CrossRef] [Green Version]
  63. Christiansen, J.P. Irrigation by Sprinkling; University of California: Oakland, CA, USA, 1942. [Google Scholar]
  64. Li, J.; Kawano, H. Simulating water-drop movement from noncircular sprinkler nozzles. J. Irrig. Drain. Eng. N. Y. 1995, 121, 152–158. [Google Scholar] [CrossRef]
  65. Beard, K.V.; Chuang, C. A new model for the equilibrium shape of raindrops. J. Atmos. Sci. 1987, 44, 1509–1524. [Google Scholar] [CrossRef]
  66. Fernández-Raga, M.; Fraile, R.; Keizer, J.J.; Teijeiro, M.E.V.; Castro, A.; Palencia, C.; Marques, R.L.D.C. The kinetic energy of rain measured with an optical disdrometer: An application to splash erosion. Atmos. Res. 2010, 96, 225–240. [Google Scholar] [CrossRef]
  67. Kathiravelu, G.; Lucke, T.; Nichols, P. Rain Drop Measurement Techniques: A Review. J. Water 2016, 8, 20. [Google Scholar] [CrossRef] [Green Version]
  68. Brodie, I.; Rosewell, C. Theoretical Relationships between Rainfall Intensity and Kinetic Energy Variants Associated with Stomwater Particle Washoff. J. Hydrol. 2007, 340, 40–47. [Google Scholar] [CrossRef]
  69. Yakubu, M.L.; Yusop, Z. Adaptability of rainfall simulators as a research tool on urban sealed surfaces—A review. Hydrol. Sci. J. 2017, 62, 996–1012. [Google Scholar] [CrossRef]
  70. Greco, R.; Guida, A.; Damiano, E.; Olivares, L. Soil water content and suction monitoring in model slopes for shallow flowslides early warning applications. Phys. Chem. Earth 2010, 35, 127–136. [Google Scholar] [CrossRef]
Figure 1. Idealization of a rainfall and runoff simulator (RS). Source: [14,15].
Sustainability 13 03060 g001
Figure 2. Technical sketch of the detachable components of the structural frame of the RS.
Sustainability 13 03060 g002
Figure 3. Acrylic box with dimensions of 0.5 × 0.5 × 0.3 m3: (a) details and auxiliary connections; (b) installation locations of the soil moisture sensors and tensiometers (sensors 1 to 5).
Sustainability 13 03060 g003
Figure 4. Complete schematic of the RS.
Sustainability 13 03060 g004
Figure 5. Monitoring sensors: (a) tensiometer; (b) soil moisture sensor.
Sustainability 13 03060 g005
Figure 6. Flowchart for the determination of distribution of the raindrop diameter (DSD), drag coefficient and terminal velocity of raindrop [58,59].
Sustainability 13 03060 g006
Figure 7. Steps of the calibration process of the soil volumetric water content sensors (EC-5).
Sustainability 13 03060 g007
Figure 8. Saturation process for the T5 tensiometers.
Sustainability 13 03060 g008
Figure 9. Main screen of the proportional, integral, and derivative (PID) system control application via Bluetooth communication for the automatic control of the service pressure in the hydraulic network of the developed RS.
Sustainability 13 03060 g009
Figure 10. Evaluation of Christiansen Uniformity Coefficient (CUC) as a function of the service pressure and rainfall intensity, for the 1.00 m2 surface: (a) ¼″-10SQ-HHSQ sprinkler nozzle; (b) ½″-29SQ-HHSQ sprinkler nozzle.
Sustainability 13 03060 g010
Figure 11. Evaluation of CUC as a function of the service pressure and rainfall intensity, for the 0.25 m2 surface using the fulljet ¼″-10SQ-HHSQ square cone jet sprinkler nozzle.
Sustainability 13 03060 g011
Figure 12. Spatial distribution patterns of the simulated rainfall under 70 and 100 kPa (¼″-10SQ-HHSQ sprinkler nozzle): (a) 70 kPa and area of 0.25 m2; (b) 70 kPa and area of 1.0 m2; (c) 100 kPa and area of 0.25 m2; (d) 100 kPa and area of 1.0 m2.
Sustainability 13 03060 g012aSustainability 13 03060 g012b
Figure 13. Distribution of the raindrop diameter (DSD): (a) ½″-29SQ-HHSQ sprinkler nozzle air dried and with a heater; (b) ½″-29SQ-HHSQ sprinkler nozzle air dried; (c) ¼″-10SQ-HHSQ sprinkler nozzle air dried and with a heater; (d) ¼″-10SQ-HHSQ sprinkler nozzle air dried.
Sustainability 13 03060 g013aSustainability 13 03060 g013b
Figure 14. Evaluation of the speed of the simulated raindrops for each class of the average diameter produced by the fulljet ¼″-10SQ-HHSQ spray nozzle and for a sample area of 0.25 m2: (a) as a function of time (b), indicate the ranges of height of rain application by the sprinkler nozzle used in RS that guarantee the necessary terminal speeds so that the generation of simulated rain can adequately represent natural rainfall.
Sustainability 13 03060 g014
Figure 15. Raindrop shape. Source: adapted from Beard and Chuang [65].
Sustainability 13 03060 g015
Figure 16. Percentage of kinetic energy produced by each of drop diameter class for the 0.25 m2 experimental area using the fulljet ¼″-10SQ-HHSQ sprinkler nozzle.
Sustainability 13 03060 g016
Figure 17. Test conducted with the rainfall simulator: (af) steps (10, 30, and 60 min) and monitoring details for soil without vegetation and; (gj) test conducted with the RS for soil with vegetation.
Sustainability 13 03060 g017
Figure 18. Evolution of the pore-water pressure at all monitored points in the test without vegetation, from the tensiometers, considering αD = 15°, PP = 86.0 mm h−1, and e0 = 1.0.
Sustainability 13 03060 g018
Figure 19. Evolution of the pore-water pressure at all the monitored points in the test with vegetation, from the tensiometers, considering αD = 15°, PP = 86.0 mm h−1, and e0 = 1.0.
Sustainability 13 03060 g019
Table 1. Results of the experiments performed with the RS (fulljet ¼″-10SQ-HHSQ square cone jet sprinkler nozzle) to calibrate the real intensity of the simulated rainfall for different ta and tf values.
ta (s)tf (s)train (min)Ir (mm h−1)HL (mm)Vc (L)Qc (L min−1)Qc5 (L min−1)ξr (%)
235137160.2770.0550.04027.8
10120200.4770.0480.0504.8
30116581.3140.0440.0431.8
253086430.8570.0290.0282.0
6086861.6010.0270.0262.6
3215188470.8760.0580.0572.4
30174873.1270.1040.1031.2
51302341175.1030.1700.1662.4
602272278.0820.1350.11514.6
5103092460.9150.0310.0324.9
6091911.8920.0320.0311.7
where ta, tf and train are the opening, closing and total times, respectively, of the solenoid valve controlled with the PID; Ir is the simulated real intensity; HL is the water depth measured in the 0.25 m2 experimental plot; Vc and Qc are the volume and flow, respectively, measured in the RS channel for the rainy season; Qc5 is the flow rate measured in the RS channel at 5 min test intervals; and ξr is the relative average error between Qc and Qc5.
Publisher’s Note: MDPI stays neutral with regard to jurisdictional claims in published maps and institutional affiliations.

