
The Impact of Land Use Change on Disaster Risk from the Perspective of Efficiency


1
Department of Urban Planning, National Cheng Kung University, Tainan 70101, Taiwan
2
Landscape Architecture, School of Landscape Architecture, Fujian Agriculture and Forestry University, Fuzhou 350002, China
*
Author to whom correspondence should be addressed.
Sustainability 2021, 13(6), 3151; https://0-doi-org.brum.beds.ac.uk/10.3390/su13063151
Submission received: 25 February 2021
/
Revised: 7 March 2021
/
Accepted: 9 March 2021
/
Published: 13 March 2021
(This article belongs to the Special Issue Risk Management as a Tool for Sustainability)
Abstract
:The increasing demand of humankind has caused a large number of land use changes, which pose a direct or indirect threat to the environment while promoting economic growth. The lack of risk-oriented land use changes may increase the disaster risk in the region. Therefore, how to study the relationship between land use change and disaster risk deserves attention. In this study, a research framework with quantitative relationship between land use change and disaster risk was constructed from the perspective of efficiency. The framework integrated land use change, disaster losses and environment variable (runoff increment) into a three-stage data envelopment analysis (DEA) assessment model to dynamically evaluate the impact of land use changes on disasters. The main conclusions include: (I) after the influence of runoff increment and random error was excluded, the overall risk score of counties and cities in Taiwan is 0.643, which represents a relatively high level, indicating that land use changes have caused high disaster risk; and (II) the vulnerability of land development in each county and city can be obtained through the comprehensive score of disaster risk the amount of unused input. The results of this study can help government agencies to rank various types of land development and then determine the acceptable risk level and incorporate disaster risk into land development.
1. Introduction
In order to meet the growing demands of mankind, land use conversion has become one of the most critical and direct ways for mankind to change the environment and has produced a profound impact on the natural environment [1,2]. Land use change has changed the physical parameters of the earth’s surface. A large amount of natural land (such as forests, grasslands and wetlands) has been converted into developed land (such as cities and farmland), which has led to a dramatic reduction in grasslands, woodlands, arable land, sea areas, tidal zones and unused land and a continuous increase in the construction land and industrial land. It is known that the natural ecological environment not only provides material resources for the production and life of human society but also plays an infinite role in regulating climate, water resources and reducing natural disasters [3]. However, a lot of changes in land types make ecologically fragile areas exposed to direct or indirect threats and have brought increasing pressure on the environment and ecosystem [4]. Land use change not only affects the soil environment, atmospheric environment and water environment but also has an impact on the balance of various systems on the earth’s surface. These changes not only have increased the frequency and intensity of natural disasters (such as floods) but also have improved soil salinity and land erosion. Although land development has become inevitable, it requires more resilient measures to avoid the increase in disasters [5]. In the context of rapid urbanization, people are increasingly aware of the interaction between land use changes and disaster risk. Human activities (deforestation, wetland reclamation, urban expansion, etc.) have changed the pattern of ecological risks. In this case, it is of realistic necessity to study the impact of land use changes on disaster risk. The information obtained from land use changes can help policy makers and managers better understand the potential relationship between human factors and the environment and to effectively assess the risk of natural disasters, which will help to realize sustainability and enhance resilience [6,7,8].
Land use reflects the interference of human activities in the regional environment. The rapid increase in urban built-up areas puts pressure on the scarce land and water resources in the peri-urban fringes, thereby potentially leading to environmental pressure [9], which increases the production of disaster contributions. With the development and expansion of cities in hazardous areas, the lack of risk-oriented land use changes may increase the disaster risk of the area. Therefore, land use planners and policy makers must establish a key connection between disaster risk reduction and land use changes [10]. Land use changes have obvious regional and cumulative characteristics. Land development will show different resilience, among other variances, depending on the conditions in the region [11]. Risk is a key aspect in the development process. In the development of cities, attention should be paid not only to profits but also to risk assessment and management [12]. Therefore, various risks related to development need to be handled in planning, including natural disaster risk [13,14] and flood risk in land allocation [15]. In this process, risk assessment is a key step in intervention planning. By examining the land use changes, analyzing the source of risk and the negative impact of natural disasters and establishing a relationship between land use change and disaster risk, the areas that require policy intervention in land use can be finally determined. This benefits the governance and protection of the ecological environment and facilitates the management of disaster risk. However, a feasible method for the risk assessment of land use change is absent.
In addition to the increase in disaster risk, land use changes will also bring a large amount of runoff increment. Flood flow increases with the increasing population density, which largely depends on the urban sprawl, the increase of impervious surfaces and the unresponsiveness of projects [16,17]. Studies have shown that land use changes contribute to 21.3–35.8% of runoff changes [18]. Land use changes may affect the local flooding process and increase property losses exponentially [19]. The increase in flood risk may enhance the overall disaster risk. Therefore, in the decision-making for land development, a lack of attention to runoff may bring more uncertain factors to the risk assessment. How to integrate runoff increment—an environment variable (unexpected output) to the risk assessment—has become a focus of this study.
Extensive models have been developed to improve the understanding of the impact of land use changes on disaster risk and to better predict the future uncertainty in land development [20,21,22]. For example, cost benefit analysis (CBA) was used to convert land development and risk losses into monetary units for measurement. However, this method fails to process the indicators of nonmonetary units, and it performs measurement through the overall relationship, which cannot rank different analysis units and deal with the poor output [23]. Stochastic efficiency is a method that uses utility function and stakeholders’ attitudes to rank risk assessments [24], but its setting and scoring of risk classifications are still subjective to a certain extent. In this paper, in order to integrate land use changes, disaster losses and runoff increment into one framework, data envelopment analysis (DEA) was adopted, whose ability to overcome the limitations of the above methods has been confirmed by abundant studies [25,26,27]. Data envelopment analysis (DEA) is a method to determining the optimal efficiency by comparing a set of decision-making units (DMUs) with multiple inputs and outputs. It has the following advantages: (I) DEA can simulate the situation where multiple inputs and outputs exist and can correlate input and output without assuming the form of functional production; (II) it can directly compare DMUs with peers or equivalent unit combinations; and (III) DEA can input and output different measurement units, which can strengthen the objectivity of the results obtained from the processing of tasks in real life; thus, it will provide good results when measuring efficiency. In this study, based on the view of efficiency, the intensity of land use changes was correlated with the intensity of disaster risk changes to rank the increase in risk caused by land use changes in the counties and cities in Taiwan. In this way, the influence of different driving factors in different counties and cities can be discovered, which can provide guidance for future development. However, the traditional DEA model ignores the impact of environment variable (runoff increment), which may result in deviations in risk assessment. Therefore, a three-stage DEA model was employed to take the undesired output (runoff increment) into account. The three-stage DEA model integrates the advantages of traditional DEA and Stochastic Frontier Analysis. That is, starting from the results of the traditional BCC–DEA analysis (BCC is the abbreviation of three operations researchers (Banker, Charnes, and Cooper)), Stochastic Frontier Analysis is used to explain the changes in the environment, and the second-stage adjustment data are used to obtain the true score of risk efficiency [28], so as to build an evaluation model of land use changes, disaster losses and runoff increment.
This study provides a framework for evaluating the correlation between land use changes and disaster risk, laying a quantitative basis of development models for counties and cities with different land development and different conditions and offering new insights for the monitoring and management of disaster risk triggered by land use changes. In this process, this study focuses on the following aspects: (I) How do land use changes affect disaster risk? (II) What is the relationship between land use changes and stormwater runoff? (III) How to apply the viewpoint of efficiency to make an overall assessment of land use changes, disaster losses and runoff increment?
2. Method
2.1. Research Area
Taiwan may be one of the most vulnerable places on earth to natural disasters, with 73% of the land and population exposed to three or more dangers. The frequency of rainfall is decreasing, while the frequency of heavy rains is increasing in Taiwan [29]. Located at the junction of the Pacific plate and the Asia–Europe plate, Taiwan is vulnerable to various geological natural disasters and extreme weather events, such as coastal storms, erosion, strong winds, floods, earthquakes and tsunamis. Moreover, Taiwan is also one of the most densely populated areas in the world, with nearly 80% of the population living in cities [30]. A large amount of ecological land has been converted into urban construction land, which has aggravated disaster losses. Therefore, there is an urgent need to study the relationship between land use changes and disaster risk in Taiwan. In this study, with the island of Taiwan as the research scope, a total of 19 counties and cities are involved. The scope of the research is shown in Figure 1.
2.2. Data Sources
The data of land use changes come from the “Taiwan Land Use Survey” [31]. In this study, the land use changes classified in the first level in the Land Use Survey in 2012 and 2017 were compared as the value of land use changed. The data of natural disaster losses come from “Disaster prevention and rescue white paper,” in which statistics have been made on the number of various natural disaster losses from 2010 to 2019 [32].
2.3. The Efficiency Method of the Three-Stage DEA Model
2.3.1. The First Stage: Traditional DEA Model
The traditional DEA models include CCR model with constant returns-to-scale (CRS) and BCC model with variable returns-to-scale (VRS) (CCR is the abbreviation of three operations researchers (Charnes, Cooper, and Rhodes)). Since this study focuses on the impact of land use changes on disaster risk, VRS can not only ensure the efficiency of risk assessment under scale compensation but can also further decompose the overall efficiency of risk assessment into scale efficiency and technical efficiency. Technical efficiency means that each unit of input maximizes output, and the influence of scale size is ignored, because decision-making units (DMUs) are only compared with units of similar scale size. Scale efficiency refers to an optimal unit size of operation, which is obtained through dividing the total efficiency by technical efficiency, and its decrease or increase will reduce the efficiency. Under certain input conditions, it can obtain the optimal solution of the linear programming with the largest possible output, and it also gets rid of the fixed prerequisite for returns to scale in the CCR model [33]. Therefore, the output-oriented BCC model was adopted in this study as the risk assessment model in the first stage. Suppose the BCC model regards each county and city in Taiwan as a DMU with i inputs and r outputs. Various types of land use changes were used as inputs of DMU, and disaster losses as outputs. The specific model is as follows:
where represents DMU; x and y are the values of input and output, respectively; are slack variables, and nonzero , respectively, denote input redundancy and output shortage; is the weight of related factor; and is the efficiency value of DEA, which represents the relative severity of natural disasters in this study.
When and , it means that the j-th DMU is DEA-effective, indicating that, compared with other DMUs, this DMU has no excess input and insufficient output, that is to say, all kinds of land use changes have caused an increase in disaster risk.
When and or , it means that the j-th DMU is weak DEA-effective, indicating that the DMU is close to the relatively optimal state of resource allocation, but there is still room for improvement. In other words, there are still some inputs of land use changes that have not increased disaster risk, or the inputs of land use changes may lead to greater disaster risks.
When , it means that the j-th DMU is non-DEA-effective, suggesting that, compared with other DMUs, this DMU still has a large number of inputs of land use changes that have triggered an increase in disaster risk, that is, the DMU is more conducive to urbanization.
2.3.2. The Second Stage: Stochastic Frontier Analysis (SFA) Model
The SFA model can analyze the input slacks calculated by the first-stage DEA model, so as to establish the functional relationship between environmental impact (herein referred to as runoff increment), random error and the influence of low management efficiency. The purpose is to eliminate the environmental impact and random error, thereby maintaining the input slack caused by low management efficiency [33,34]. In this study, the input slack of land use change was used as the dependent variable and runoff increment as the independent variable to construct the following similar SFA regression function:
where is the input slack, is runoff increment and is the coefficient of runoff increment; represents mixed error; is low random management efficiency, obeying the nonnegative tail of normal distribution; and denotes random error, obeying the distribution of .
In order to eliminate the influence of the environmental factor and random error, the inputs need to be adjusted by the following formula, so that all DMUs are in the same external environment.
where represent the input after adjustment and before adjustment respectively; shown in the first square bracket on the right is the adjustment of the external environmental factor, so that all DMUs are in the same environment; what is displayed in the second square bracket is to make the random influence of all DMUs consistent.
2.3.3. The Third Stage: The Optimized DEA Model
The third-stage DEA model calculates the efficiency value of each DMU under ideal state based on the evaluation of the efficiency obtained by the first-stage DEA mode and the Stochastic Frontier Analysis by the second-stage model (with the influence of environment variable and random error excluded). It expresses the score of disaster risk under land use change after excluding the environmental factor (runoff increment). The higher the score, the greater the disaster risk caused by land use change, indicating that the land suitability in the county is weak.
2.4. Research Architecture
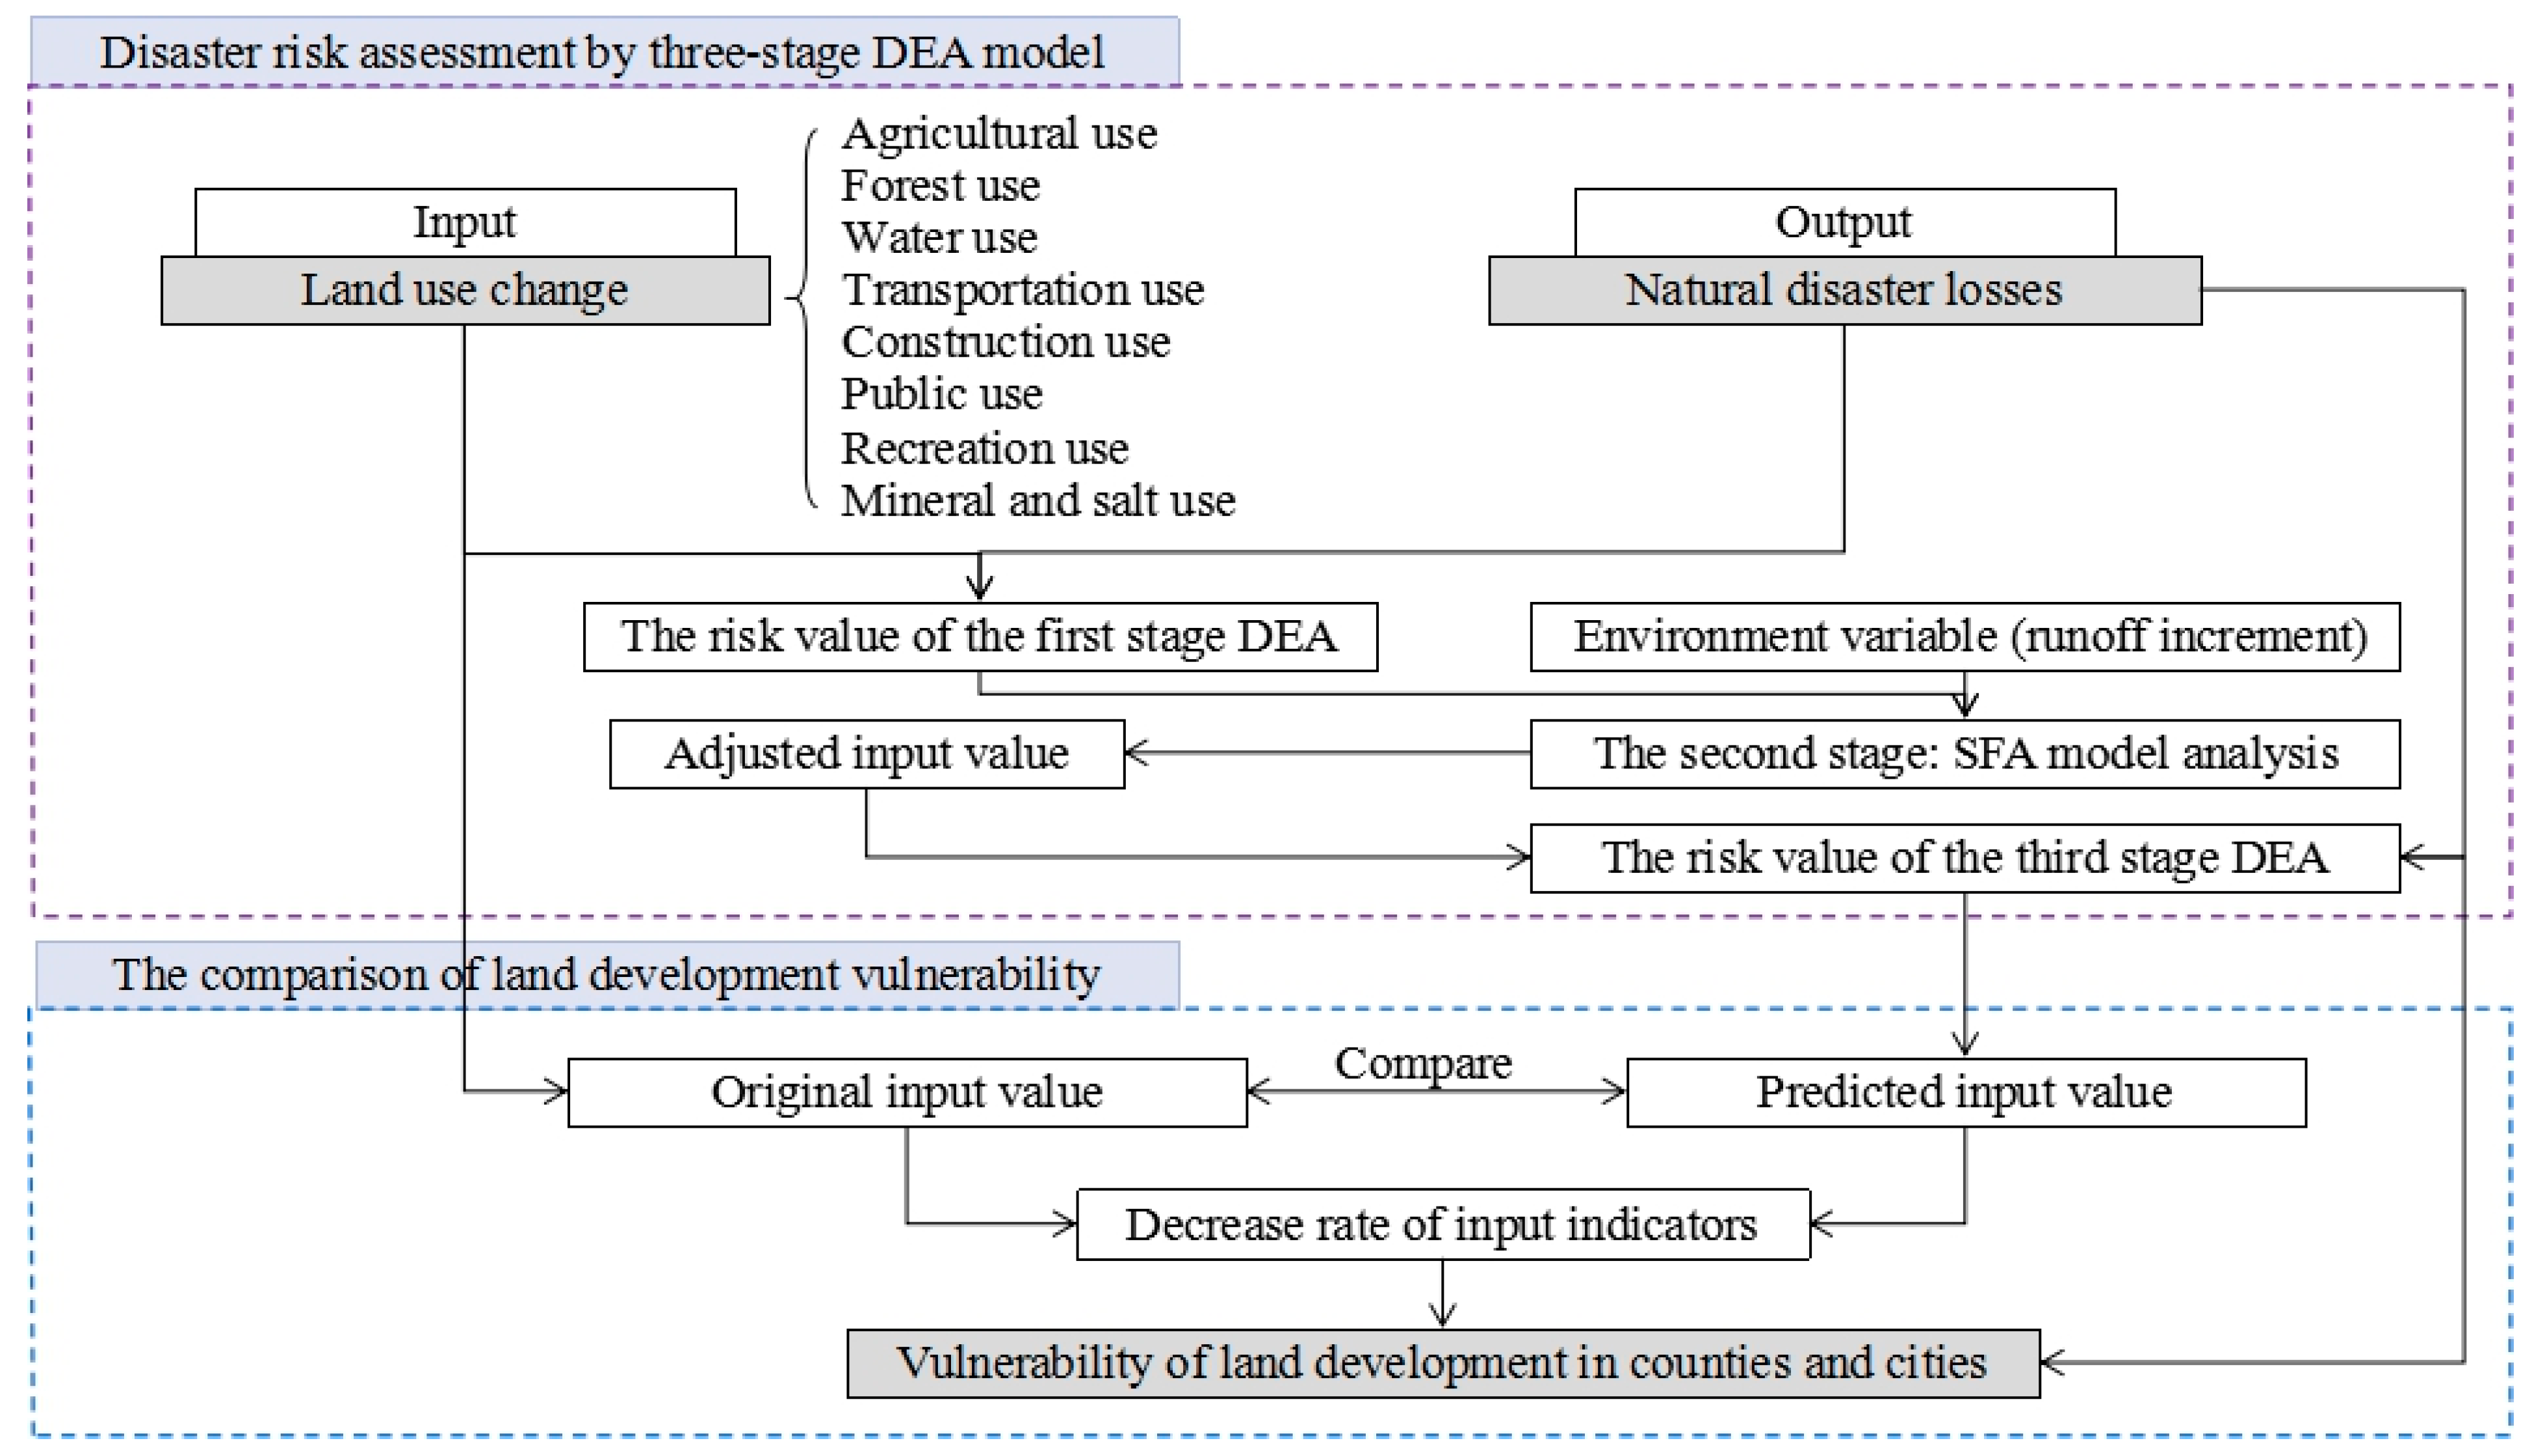
This study established a risk assessment model of land use change and natural disaster (Figure 2). It can be divided into two parts: disaster risk assessment by three-stage DEA model and the comparison of land development vulnerability. The first part is mainly aimed to calculate the true score of disaster risk. First, an indicator analysis system needs to be constructed. According to the land use classification system in Taiwan (9 categories, described below), the values of various land use changes were used as input indicators and the losses from natural disasters as output indicators. The score of disaster risk in the first stage was calculated through the traditional DEA model, which does not take the influence of environment variable into consideration. Therefore, in the second stage, we added the environment variable, namely runoff increment, and used the SFA model to obtain the adjusted inputs of land use changes. Finally, according to the new inputs and outputs of the disaster loss indicators, the true value of disaster risk was calculated. The second part focuses on the comparison of the relationship between land use changes and disaster risk, so as to analyze the land development suitability in each county. First, the predicted values of inputs of land use changes based on the analysis results in the third stage were obtained, which were then compared with the original input values to obtain the reduction in the values of the input indicators. This helps us to discover which land use changes in counties and cities have not caused an increase in natural disaster risk. The more the unused inputs, the more conducive the land use change is to the development of the county. In the second part, by comparing the amount of unused input and the overall risk score, the vulnerability of land development in each county can be acquired.
2.5. Indicator Measurement
2.5.1. Input Indicators
This study aims to explore the relationship between land use change and disaster risk. Therefore, land use changes can be used as input indicators in this study (Table 1). According to Taiwan’s land use classification system, land use is divided into 9 categories: forest use, agricultural use, water use, construction use, public use, mineral and salt use, recreation use, transportation use and other use [31]. The specific input data can be obtained by comparing the data of the two recent land use surveys, that is, by calculating the difference in the land use change between the land use classification system tables in 2012 and 2017. The difference in the change may be negative. Since this study explores the dynamic changes in land use, the absolute value was used as the value of land use change.
2.5.2. Output Indicators
Natural disaster losses were used as output indicators in this study (Table 1). Land use change increases the frequency and intensity of natural disasters, such as typhoons, floods and earthquakes. In order to build the relationship between land use change and disaster occurrence, the changes of natural disasters during the two land use surveys need to be compared, that is, the difference between the disaster losses in 2012 and 2017. However, considering the huge differences in the frequency and intensity of disasters in each year, statistics were mainly performed on the data of disaster losses 2 years before and after the two land use surveys, and the average value was obtained, respectively; then the difference between the average values was calculated as the output value of the output indicators. That is, the values of natural disaster losses from 2010 to 2014 were calculated, and the average value was used as the value of natural disaster losses in 2012; the values of natural disaster losses from 2015 to 2019 were obtained, and the mean was used as the value of natural disaster losses in 2012.
2.5.3. Environment Variable
Land use change will result in the changes of runoff, which will also expand the losses of natural disasters. Therefore, runoff increment is an external environment variable that causes natural disaster losses. In order to calculate the newly added runoff in each county and city, the impermeability of various land types needs to be learned. According to related research, the impervious rate of forest and agriculture, construction land and public facilities land is about 5.5%, 95% and 83%, respectively [35]. The annual rainwater runoff per hectare in Taichung City is 1203.8 m3 [36]. An increase of 3% in impermeable area will increase runoff by 5% [37]. Based on these theories, this study classified forest use, agricultural use and other land use (mainly grasslands and open spaces) as land with an impervious rate of 5.5%; construction use and transportation use as land with an impervious rate of 95% and water use, public use, mineral and salt use, and recreation use as land with an impermeable rate of 83%. Then the runoff caused by land use change was calculated using the following formula.
where i and j respectively represent various types of land use and counties and cities in Taiwan; is newly increased runoff; is land use change; is runoff per hectare of land; and denotes the impervious rate of various land types.
3. Results Analysis
3.1. Evaluation Results Obtained in the First Stage
Without considering the external environmental factor (runoff increment) and the influence of random interference, the BCC–DEA model was used to evaluate the values of disaster risk of each county and city in Taiwan. As can be seen from Table 2, Taiwan’s annual average risk score of overall efficiency is 0.825, the average risk score of technical efficiency is 0.852 and the average risk score of scale efficiency is 0.943, revealing that the disaster risk caused by the overall land use change in Taiwan is relatively high, and Taiwan is in a high-risk area. The risk value of 13 counties and cities is 1, indicating that, in terms of land development, they have a higher vulnerability than other counties and cities; 6 counties and cities are at low efficiency level, suggesting various land use changes have not all been converted to disaster risks; therefore, these areas have high resilience in land development. Hsinchu County is the county with the lowest risk among all counties and cities, and it can do more in the future land development. The results also showed that the scale efficiency of each county and city is greater than or equal to pure technical efficiency, demonstrating a small risk score of technical efficiency. It is mainly caused by the risk score of pure technical efficiency, which may be attributed to the lack of consideration for the external environmental factor.
3.2. SFA Analysis Results in the Second Stage
In this study, the input slack in the first stage was used as the independent variable (input slack refers to the difference between the original input value and the target input value), and the environment variable (runoff increment) as the dependent variable to build the SFA regression model. It can be seen from Table 3 that most of the parameters of the environment variable (runoff increment) have a significance level of 10% to 15%, which indicates that the environment variable has a statistically significant impact on the assessment of disaster risk. Therefore, it is necessary to eliminate such influence, so that the results can more reflect the real impact of land use changes on disaster risk. What the regression coefficient of SFA reveals is the relationship between environment variable and input slack. A negative coefficient indicates that the increase in runoff benefits the improvement of efficiency, which means the increase in disaster risk and more consumption of input resources (various land use changes), and vice versa. It can be found from the values of and that the influence of environment variable is more important than random error, and the random interference factor is almost negligible (see the paper published by [33] for specific solution). Table 3 also shows that runoff increment has different effects on land use changes. If these environmental factors are not controlled, deviations may be produced in the disaster risk estimate. The inputs can be adjusted through Equation (3), so as to reduce the interference from runoff increment.
3.3. Assessment Results in the Third Stage
After the influence of runoff increment and random error was excluded, according to the adjusted inputs, the disaster risk scores of the counties and cities in Taiwan were obtained, as shown in Table 4. It can be seen that Taiwan’s annual average risk score of overall efficiency is 0.643, the average technical efficiency risk score is 0.865, and the average risk score of scale efficiency is 0.761. Compared with the results obtained by the traditional BCC–DEA in Table 2, except for a small increase in technical efficiency (PTE), the overall efficiency and scale efficiency are reduced by 22.1% and 19.3%, respectively, demonstrating that, due to the interference from runoff increment and random error, disaster risk is overestimated. The great changes in the frontier of technical efficiency show that runoff increment has an enormous impact on the production frontier. In terms of the counties and cities, the risk assessment results of Kaohsiung City, New Taipei City, Taichung City, Changhua County, Taitung County and Keelung City have not changed, suggesting that land use changes in these areas have greater interference in the environment and will produce high disaster risk; the areas where disaster risk is greatly affected by runoff increment include Taipei City, Yilan County, Taoyuan City, Miaoli County, Nantou County, Yunlin County, Pingtung County, Hualien County, Hsinchu City and Chiayi City. After the interference from runoff increment was eliminated, the scores of disaster risk have dropped significantly, especially in Hsinchu City and Chiayi City, indicating that the runoff increment in these places has also significantly improved disaster risk; in Hsinchu County, Chiayi County, and Taitung County, the disaster risk is hardly affected by runoff increment and random error, revealing that land use changes in these areas are the main reason for the increase in disaster risk.
3.4. Comparison of the Vulnerability of Land Development among Counties and Cities
According to the second column of Table 4, the intensity distribution of disaster risk was obtained, as displayed in Figure 3. The overall vulnerability of land development was judged from the overall risk assessment. The unused inputs of land use changes were calculated according to the input ratio of various land use changes in the third stage, as shown in Table 5. It can be seen from the Table that the driving factors of disaster risk vary among counties and cities, that is, not all land use changes have caused the changes of disaster risk, due to different conditions in different counties and cities. For example, in Hsinchu County, changes in agricultural use and water use have resulted in the changes of disaster risk, but 41% of the changes in forest use are not involved in the change of disaster risk. Other types of land use changes can also be explained in the same way. Based on Figure 3 and Table 5, the disaster risk can be comprehensively evaluated. For example, the comprehensive risk in Chiayi City is only 0.185, but all types of land use changes participate in the risk assessment. Therefore, although the land use changes in the county will lead to the changes in disaster risk, the impact is relatively small, compared to that in other counties and cities. Another example is that the risk score of Pingtung County and Tainan City are 0.792 and 1, respectively, indicating relatively high risk, but, from the perspective of the input of land use changes, some land use changes in Pingtung County are not involved in the risk assessment, while all types of land use changes in Tainan City are involved in the risk assessment. It can be seen that Pingtung County has more resilience than Tainan City for land development, especially for the land with less input. Our research results can be used as a reference for future land development and can offer information on which types of land use development will cause less changes in natural disasters.
4. Discussion
Human activities and urban development have led to prominent land use changes, with obvious regional and cumulative characteristics. The lack of risk-oriented land use planning may increase disaster risk. Therefore, incorporating disaster risk into land development is essential to maintain sustainable development [38]. The impact of land use changes on risk assessment is complex. The purpose of this study is to understand the relationship between land use changes and disaster risk. In this study, the DEA method was adopted to evaluate disaster risk, the limitations of the traditional DEA models were described and the necessity of introducing the three-stage DEA model was highlighted. The research results showed that the environment variable, runoff increment, will cause the increase in disaster risk and interfere with the disaster risk assessment by land use change. By using the three-stage DEA for risk analysis, the influence of environment variable and random error was eliminated, and the evaluation and ranking of disaster risk in all counties and cities were conducted, which benefits the management of land use and the monitoring of environmental changes and helps decision makers to determine priorities, so that they can make wise decisions.
The innovation of this research lies in the combination of land use change and risk assessment and the quantification of the relationship between them. As far as we know, this study is the first attempt to simulate the relationship between land use change and disaster risk assessment through the DEA efficiency method. Although many previous studies focused on land use changes and flood disaster risk assessment, there is still a lack of quantification of their comprehensive impact. In other words, some quantitative methods are still only based on the multilevel analysis of different indicators, with unclear purpose of the evaluation and the relatively subjective results (judged and scored by hand). This reduces the role of the assessment results in helping policymakers to formulate land use planning to reduce natural disaster risk [39,40]. The method based on DEA risk assessment can support smarter management, so that long-term potential impact and external environment can be incorporated into land planning. Land use change is a dynamic and complex process. The framework of this study can dynamically assess the impact of land use change on disasters, and the changes in disaster risk caused by land development of different types can be monitored through the re-inputs of different types of land use. This provides planners and government officials with a tool to review future land use plans based on the relationship between land use change and disaster losses. More importantly, it allows local government agencies to determine acceptable risk levels and incorporate disaster risk into land development.
The framework of this study can be used not only to study the relationship between land use change and disaster risk, but also to investigate the impact of the transfer of water resources on the environment and the effect of different energy combinations on the economy in the future.
Despite the abovementioned contributions, this study still has some research limitations: (I) The limitation of data is the biggest uncertain factor in the evaluation of disaster risk in this study. Because disaster losses are characterized by uncertainty and suddenness each year, only the 5-year average was used as the statistical data. This is only a staged result, which cannot express the long-term trend of changes. (II) Since government policies and engineering plans, which belong to external environment variables, have no statistical data and are difficult to quantify, they were not included in the assessment of disaster risk. In the future, researchers can take the impact of this part into account, so that the impact of land use change on disaster risk can be more truly reflected.
5. Conclusions
Land use changes have stimulated economic development and caused environmental changes. This study provides new insights for disaster risk monitoring and land development management by measuring the impact of land use changes on disaster risk. The conclusions can be summarized as follows:
- (I)
- A research framework was constructed with a quantitative relationship between land use change and disaster risk from the perspective of efficiency. The framework first applied the traditional DEA to rank disaster risk and incorporated the environment variable, runoff increment, thereby eliminating the interference of the environment variable and obtaining a more realistic ranking of disaster risk.
- (II)
- After the influence of runoff increment and random error was excluded, the overall risk score of counties and cities in Taiwan is 0.643, which represents a relatively high level, indicating that land use changes have caused high disaster risk. Runoff increment has different influence on counties and cities, and it has almost no impact on Hsinchu City and Chiayi City.
- (III)
- Various types of land use changes in counties and cities do not always cause changes of disaster risk, due to different conditions in each county and city. The vulnerability of land development in each county can be obtained by the comprehensive score of disaster risk and the amount of unused input.
In general, this study helps policy makers and managers better understand the potential relationship between land use change and the environment. It can help us to formulate adaptive risk mitigation strategies and understand the practical significance of effective use of land resources. Surely, the impact of land use change on disasters is still a complicated process, and there is still a long way to go to make clear the relationship between them.
Author Contributions
Conceptualization, Q.S.; Formal analysis, Q.S.; Funding acquisition, K.C. and L.L.; Methodology, Q.S.; Project administration, K.C.; Software, Q.S.; Validation, K.C.; Visualization, Q.S.; Writing—original draft, Q.S.; Writing—review & editing, K.C. and L.L. All authors have read and agreed to the published version of the manuscript.
Funding
The APC was funded by [Fujian Provincial Social Science Planning Youth Project] grant number [FJ2019C038] And [Outstanding Youth Program of Fujian Agriculture and Forestry University] grant number [XJQ201932].
Informed Consent Statement
Informed consent was obtained from all subjects involved in the study.
Data Availability Statement
All data generated or analyzed during this study are included in this article.
Conflicts of Interest
The authors declare no conflict of interest.
References
- Fan, M.; Shibata, H. Water yield, nitrogen and sediment retentions in Northern Japan (Teshio river watershed): Land use change scenario analysis. Mitig. Adapt. Strateg. Glob. Chang. 2016, 21, 119–133. [Google Scholar] [CrossRef]
- Fan, M.; Shibata, H.; Chen, L. Environmental and economic risks assessment under climate changes for three land uses scenarios analysis across Teshio watershed, northernmost of Japan. Sci. Total Environ. 2017, 599–600, 451–463. [Google Scholar] [CrossRef] [PubMed]
- Tian, P.; Li, J.; Gong, H.; Pu, R.; Cao, L.; Shao, S.; Shi, Z.; Feng, X.; Wang, L.; Liu, R. Research on Land Use Changes and Ecological Risk Assessment in Yongjiang River Basin in Zhejiang Province, China. Sustainability 2019, 11, 2817. [Google Scholar] [CrossRef] [Green Version]
- Liang, J.; Zhong, M.; Zeng, G.; Chen, G.; Hua, S.; Li, X.; Yuan, Y.; Wu, H.; Gao, X. Risk management for optimal land use planning integrating ecosystem services values: A case study in Changsha, Middle China. Sci. Total Environ. 2017, 579, 1675–1682. [Google Scholar] [CrossRef] [PubMed]
- Mehaffy, M.W.; Salingaros, N.A. Design for a Living Planet: Settlement, Science, and the Human Future; Levellers/Sustasis Press and Vajra Publications & United Union: New York, NY, USA, 2015. [Google Scholar]
- Hussein, K.; Alkaabi, K.; Ghebreyesus, D.; Liaqat, M.U.; Sharif, H.O. Land use/land cover change along the Eastern Coast of the UAE and its impact on flooding risk. Geomat. Nat. Hazards Risk 2020, 11, 112–130. [Google Scholar] [CrossRef] [Green Version]
- Usman, M.; Liedl, R.; Shahid, M.A.; Abbas, A. Land use/land cover classification and its change detection using multi-temporal MODIS NDVI data. J. Geogr. Sci. 2015, 25, 1479–1506. [Google Scholar] [CrossRef]
- Saunders, W.S.A.; Kilvington, M. Innovative land use planning for natural hazard risk reduction: A consequence-driven approach from New Zealand. Int. J. Disaster Risk Reduct. 2016, 18, 244–255. [Google Scholar] [CrossRef] [Green Version]
- Riad, P.; Graefe, S.; Hussein, H.; Buerkert, A. Landscape transformation processes in two large and two small cities in Egypt and Jordan over the last five decades using remote sensing data. Landsc. Urban Plan. 2020, 197, 103766. [Google Scholar] [CrossRef]
- Glavovic, B.C.; Saunders, W.S.A.; Becker, J.S. Land-use planning for natural hazards in New Zealand: The setting, barriers, ‘burning issues’ and priority actions. Nat. Hazards 2010, 54, 679–706. [Google Scholar] [CrossRef]
- Mehaffy, M.W.; Yulia Kryazheva, A.R.; Salingaros, N.A. A New Pattern Language for Growing Regions: Places, Networks, Processes; Sustasis Press: Portland, OR, USA, 2019. [Google Scholar]
- O’Brien, P.; Lord, A.; Dembski, S. How do planners manage risk in alternative land development models? An institutional analysis of land development in the Netherlands. Land Use Policy 2020, 91, 104409. [Google Scholar] [CrossRef]
- Wamsler, C. Mainstreaming Risk Reduction in Urban Planning and Housing: A Challenge for International Aid Organisations. Disasters 2006, 30, 151–177. [Google Scholar] [CrossRef]
- Su, Q. Long-term flood risk assessment of watersheds under climate change based on the game cross-efficiency DEA. Nat. Hazards 2020, 104, 2213–2237. [Google Scholar] [CrossRef]
- van Herk, S.; Zevenbergen, C.; Ashley, R.; Rijke, J. Learning and Action Alliances for the integration of flood risk management into urban planning: A new framework from empirical evidence from The Netherlands. Environ. Sci. Policy 2011, 14, 543–554. [Google Scholar] [CrossRef]
- Berndtsson, R.; Becker, P.; Persson, A.; Aspegren, H.; Haghighatafshar, S.; Jönsson, K.; Larsson, R.; Mobini, S.; Mottaghi, M.; Nilsson, J.; et al. Drivers of changing urban flood risk: A framework for action. J. Environ. Manag. 2019, 240, 47–56. [Google Scholar] [CrossRef]
- Chang, H.-S.; Su, Q. Research on constructing sponge city indicator and decision evaluation model with fuzzy multiple criteria method. Water Environ. Res. 2020, 1–12. [Google Scholar] [CrossRef]
- Li, B.; Shi, X.; Lian, L.; Chen, Y.; Chen, Z.; Sun, X. Quantifying the effects of climate variability, direct and indirect land use change, and human activities on runoff. J. Hydrol. 2020, 584, 124684. [Google Scholar] [CrossRef]
- Lee, Y.; Brody, S.D. Examining the impact of land use on flood losses in Seoul, Korea. Land Use Policy 2018, 70, 500–509. [Google Scholar] [CrossRef]
- Huang, Y.; Liao, T.J. An integrating approach of cellular automata and ecological network to predict the impact of land use change on connectivity. Ecol. Indic. 2019, 98, 149–157. [Google Scholar] [CrossRef]
- Duru, U. Shoreline change assessment using multi-temporal satellite images: A case study of Lake Sapanca, NW Turkey. Environ. Monit. Assess. 2017, 189, 385. [Google Scholar] [CrossRef] [PubMed]
- Chang, H.-S.; Su, Q. Exploring the coupling relationship of stormwater runoff distribution in watershed from the perspective of fairness. Urban Clim. 2021, 36, 100792. [Google Scholar] [CrossRef]
- Garrote, J.; Bernal, N.; Díez-Herrero, A.; Martins, L.R.; Bodoque, J.M. Civil engineering works versus self-protection measures for the mitigation of floods economic risk. A case study from a new classification criterion for cost-benefit analysis. Int. J. Disaster Risk Reduct. 2019, 37, 101157. [Google Scholar] [CrossRef]
- Lien, G.; Størdal, S.; Hardaker, J.B.; Asheim, L.J. Risk aversion and optimal forest replanting: A stochastic efficiency study. Eur. J. Oper. Res. 2007, 181, 1584–1592. [Google Scholar] [CrossRef]
- Charnes, A.; Cooper, W.W.; Rhodes, E. Measuring the efficiency of decision making units. Eur. J. Oper. Res. 1978, 2, 429–444. [Google Scholar] [CrossRef]
- Kiani Mavi, R.; Saen, R.F.; Goh, M. Joint analysis of eco-efficiency and eco-innovation with common weights in two-stage network DEA: A big data approach. Technol. Forecast. Soc. Chang. 2019, 144, 553–562. [Google Scholar] [CrossRef]
- Chang, H.-S.; Su, Q.; Katayama, T. Research on establishment of the region flood protection standard—A case of watershed of Dajiaxi, Taiwan. Urban Water J. 2021, 1–10. [Google Scholar] [CrossRef]
- Li, H.; Zhang, J.; Wang, C.; Wang, Y.; Coffey, V. An evaluation of the impact of environmental regulation on the efficiency of technology innovation using the combined DEA model: A case study of Xi’an, China. Sustain. Cities Soc. 2018, 42, 355–369. [Google Scholar] [CrossRef]
- De Andrade, M.M.N.; Szlafsztein, C.F. Coping, adaptation strategies, and institutional perception of hydrological risks in an urban Amazon city. Disasters 2019. [Google Scholar] [CrossRef]
- National Statstics. Population in Urbanized Areas in Taiwan; National Statstics: Taiwan, China, 2019.
- Land Surveying and Mapping Center. Land Use Survey Results; Land Surveying and Mapping Center: Taiwan, China, 2018.
- Central Disaster Prevention and Response Council. Disaster Prevention and Rescue White Paper; Central Disaster Prevention and Response Council: Taiwan, China, 2020.
- Fried, H.O.; Lovell, C.A.K.; Schmidt, S.S.; Yaisawarng, S. Accounting for environmental effects and statistical noise in Data Envelopment Analysis. J. Product. Anal. 2002, 17, 157–174. [Google Scholar] [CrossRef]
- Jia, S.; Wang, C.; Li, Y.; Zhang, F.; Liu, W. The urbanization efficiency in Chengdu City: An estimation based on a three-stage DEA model. Phys. Chem. Earth 2017, 101, 59–69. [Google Scholar] [CrossRef]
- Liao, C.-H. The Spatial Patterns and Influenced Factors of Urban Impervious Surface Ratio; National Cheng Kung Univercity: Taiwan, China, 2016. [Google Scholar]
- Lin, C.-Y.; Chung, C.-P.; Lin, C.-R. A Study of Vegetation Coverage and Water Storage Capacity at Taichung Metropolitan Park Before and After development. J. Soil Water Conserv. 2009, 41, 31–44. [Google Scholar]
- Muñoz, L.A.; Olivera, F.; Giglio, M.; Berke, P. The impact of urbanization on the streamflows and the 100-year floodplain extent of the Sims Bayou in Houston, Texas. Int. J. River Basin Manag. 2018, 16, 61–69. [Google Scholar] [CrossRef]
- Guerry, A.D.; Polasky, S.; Lubchenco, J.; Chaplin-Kramer, R.; Daily, G.C.; Griffin, R.; Ruckelshaus, M.; Bateman, I.J.; Duraiappah, A.; Elmqvist, T.; et al. Natural capital and ecosystem services informing decisions: From promise to practice. Proc. Natl. Acad. Sci. USA 2015, 112, 7348–7355. [Google Scholar] [CrossRef] [PubMed] [Green Version]
- Shen, G.; Yang, X.; Jin, Y.; Xu, B.; Zhou, Q. Remote sensing and evaluation of the wetland ecological degradation process of the Zoige Plateau Wetland in China. Ecol. Indic. 2019, 104, 48–58. [Google Scholar] [CrossRef]
- Jiang, W.; Lv, J.; Wang, C.; Chen, Z.; Liu, Y. Marsh wetland degradation risk assessment and change analysis: A case study in the Zoige Plateau, China. Ecol. Indic. 2017, 82, 316–326. [Google Scholar] [CrossRef]
Figure 1.
The research scope of counties and cities in Taiwan.

Figure 2.
Assessment framework of land use change and disaster risk.

Figure 3.
Intensity distribution of disaster risk in various counties and cities.


Table 1.
Risk assessment indicators under land use change.
| Indicators | Sources | |
|---|---|---|
| Input indicators | Forest use | [31] |
| Agricultural use | ||
| Water use | ||
| Construction use | ||
| Public use | ||
| Mineral and salt use | ||
| Recreation use | ||
| Transportation use | ||
| Other use (mainly refers to grassland and open land) | ||
| Output indicators | Natural disaster losses | [32] |
| Environment variable | Runoff increment | Author calculation |
Table 2.
The disaster risk assessment results obtained by the traditional data envelopment analysis (DEA).
Table 2.
The disaster risk assessment results obtained by the traditional data envelopment analysis (DEA).
| Overall Efficiency Risk Score | Technical Efficiency Risk Score | Scale Efficiency Risk Score | Scale Return | |
|---|---|---|---|---|
| Taipei City | 1 | 1 | 1 | - |
| Kaohsiung City | 1 | 1 | 1 | - |
| New Taipei City | 1 | 1 | 1 | - |
| Yilan County | 1 | 1 | 1 | - |
| Taoyuan City | 0.388 | 0.401 | 0.969 | Irs |
| Hsinchu County | 0.148 | 0.254 | 0.582 | Drs |
| Miaoli County | 0.648 | 0.757 | 0.856 | Irs |
| Taichung City | 1 | 1 | 1 | - |
| Changhua County | 1 | 1 | 1 | - |
| Nantou County | 1 | 1 | 1 | - |
| Yunlin County | 1 | 1 | 1 | - |
| Chiayi County | 0.249 | 0.345 | 0.723 | Drs |
| Tainan City | 1 | 1 | 1 | - |
| Pingtung County | 1 | 1 | 1 | - |
| Taitung County | 0.84 | 1 | 0.84 | Drs |
| Hualien County | 0.405 | 0.426 | 0.951 | Irs |
| Keelung City | 1 | 1 | 1 | - |
| Hsinchu City | 1 | 1 | 1 | - |
| Chiayi City | 1 | 1 | 1 | - |
| Mean | 0.825 | 0.852 | 0.943 |
Note: Irs, increasing returns to scale; Drs, diminishing returns to scale; -, scale returns remain unchanged.
Table 3.
Stochastic Frontier Analysis (SFA) regression model analysis results.
| Independent Variable Dependent Variable | Runoff Increment | |||
|---|---|---|---|---|
| Coefficient Value | T Value | |||
| Agricultural use | −313.8 | 12.1% | 431,086.9 | 1.0 |
| Forest use | −932.9 | 12.6% | 3,542,059.3 | 1.0 |
| Transportation use | −41.4 | 12.9% | 6564.0 | 1.0 |
| Water use | −56.4 | 12.7% | 10,730.7 | 1.0 |
| Construction use | −107.4 | 12.6% | 62,162.1 | 1.0 |
| Public use | −74.9 | 13.2% | 17,473.8 | 1.0 |
| Recreation use | −3.0 | 14.5% | 38.7 | 1.0 |
| Mineral and salt use | −20.8 | 13.0 | 2665.6 | 1.0 |
| Other use | −1427.1 | 12.9% | 5,901,206.2 | 1.0 |
Table 4.
The disaster risk assessment results obtained by the third stage DEA.
| Overall Efficiency Risk Score | Technical Efficiency Risk Score | Scale Efficiency Risk Score | Scale Return | |
|---|---|---|---|---|
| Taipei City | 0.89 | 1 | 0.89 | Irs |
| Kaohsiung City | 1 | 1 | 1 | - |
| New Taipei City | 1 | 1 | 1 | - |
| Yilan County | 0.788 | 1 | 0.788 | Irs |
| Taoyuan City | 0.346 | 0.416 | 0.831 | Irs |
| Hsinchu County | 0.228 | 0.265 | 0.863 | Irs |
| Miaoli County | 0.387 | 1 | 0.387 | Irs |
| Taichung City | 1 | 1 | 1 | - |
| Changhua County | 1 | 1 | 1 | - |
| Nantou County | 0.596 | 1 | 0.596 | Irs |
| Yunlin County | 0.179 | 1 | 0.179 | Irs |
| Chiayi County | 0.344 | 0.354 | 0.97 | Irs |
| Tainan City | 1 | 1 | 1 | - |
| Pingtung County | 0.792 | 0.962 | 0.823 | Irs |
| Taitung County | 1 | 1 | 1 | - |
| Hualien County | 0.353 | 0.429 | 0.822 | Irs |
| Keelung City | 1 | 1 | 1 | - |
| Hsinchu City | 0.133 | 1 | 0.133 | Irs |
| Chiayi City | 0.185 | 1 | 0.185 | Irs |
| Mean | 0.643 | 0.865 | 0.761 |
Table 5.
Reduction rate of input indicators in all counties and cities.
| Agricultural Use | Forest Use | Transportation Use | Water Use | Construction Use | Public Use | Recreation Use | Mineral and Salt Use | Other Use | |
|---|---|---|---|---|---|---|---|---|---|
| Taipei City | 0 | 0 | 0 | 0 | 0 | 0 | 0 | 0 | 0 |
| Kaohsiung City | 0 | 0 | 0 | 0 | 0 | 0 | 0 | 0 | 0 |
| New Taipei City | 0 | 0 | 0 | 0 | 0 | 0 | 0 | 0 | 0 |
| Yilan County | 0 | 0 | 0 | 0 | 0 | 0 | 0 | 0 | 0 |
| Taoyuan City | 54% | 22% | 37% | 0 | 41% | 0 | 0 | 36% | 0 |
| Hsinchu County | 0 | 41% | 11% | 0 | 59% | 18% | 46% | 85% | 25% |
| Miaoli County | 0 | 0 | 0 | 0 | 0 | 0 | 0 | 0 | 0 |
| Taichung City | 0 | 0 | 0 | 0 | 0 | 0 | 0 | 0 | 0 |
| Changhua County | 0 | 0 | 0 | 0 | 0 | 0 | 0 | 0 | 0 |
| Nantou County | 0 | 0 | 0 | 0 | 0 | 0 | 0 | 0 | 0 |
| Yunlin County | 0 | 0 | 0 | 0 | 0 | 0 | 0 | 0 | 0 |
| Chiayi County | 71% | 46% | 45% | 43% | 0 | 60% | 0 | 65% | 0 |
| Tainan City | 0 | 0 | 0 | 0 | 0 | 0 | 0 | 0 | 0 |
| Pingtung County | 68% | 84% | 0 | 0 | 0 | 0 | 85% | 17% | 55% |
| Taitung County | 0 | 0 | 0 | 0 | 0 | 0 | 0 | 0 | 0 |
| Hualien County | 72% | 85% | 0 | 0 | 0 | 0 | 0 | 7% | 74% |
| Keelung City | 0 | 0 | 0 | 0 | 0 | 0 | 0 | 0 | 0 |
| Hsinchu City | 0 | 0 | 0 | 0 | 0 | 0 | 0 | 0 | 0 |
| Chiayi City | 0 | 0 | 0 | 0 | 0 | 0 | 0 | 0 | 0 |
Publisher’s Note: MDPI stays neutral with regard to jurisdictional claims in published maps and institutional affiliations. |
© 2021 by the authors. Licensee MDPI, Basel, Switzerland. This article is an open access article distributed under the terms and conditions of the Creative Commons Attribution (CC BY) license (http://creativecommons.org/licenses/by/4.0/).
Share and Cite
MDPI and ACS Style
Su, Q.; Chen, K.; Liao, L. The Impact of Land Use Change on Disaster Risk from the Perspective of Efficiency. Sustainability 2021, 13, 3151. https://0-doi-org.brum.beds.ac.uk/10.3390/su13063151
AMA Style
Su Q, Chen K, Liao L. The Impact of Land Use Change on Disaster Risk from the Perspective of Efficiency. Sustainability. 2021; 13(6):3151. https://0-doi-org.brum.beds.ac.uk/10.3390/su13063151
Chicago/Turabian StyleSu, Qingmu, Kaida Chen, and Lingyun Liao. 2021. "The Impact of Land Use Change on Disaster Risk from the Perspective of Efficiency" Sustainability 13, no. 6: 3151. https://0-doi-org.brum.beds.ac.uk/10.3390/su13063151
Note that from the first issue of 2016, this journal uses article numbers instead of page numbers. See further details here.