Article

Coupling and Coordination Level of the Population, Land, Economy, Ecology and Society in the Process of Urbanization: Measurement and Spatial Differentiation

College of Management and Economics, Tianjin University, Tianjin 300072, China
*
Author to whom correspondence should be addressed.
Sustainability 2021, 13(6), 3171; https://0-doi-org.brum.beds.ac.uk/10.3390/su13063171
Submission received: 31 January 2021 / Revised: 3 March 2021 / Accepted: 11 March 2021 / Published: 13 March 2021
(This article belongs to the Special Issue Land Cover/Land-Use Changes Impacts on Ecosystem)

Abstract

:
Coupled and coordinated development is key to improving the level of regional urbanization and sustainable urban development and has important practical significance for solving a series of problems that arise in the process of rapid urbanization. First, from the perspective of system coupling, the development mechanism of the urbanization internal subsystems was deconstructed into five dimensions: population, land, economy, ecology and society. Second, based on data from 2017, the coupling coordination degree of urbanization in 13 cities in the Beijing–Tianjin–Hebei region was measured using the entropy method and a coupling coordination model. Finally, the spatial differences in the levels of subsystem development, comprehensive development and coupling and coordination development of urbanization were analyzed using spatial analysis tools. The results indicate that there are significant differences in the development indices of urbanization subsystems in the Beijing–Tianjin–Hebei region, among which the economic and social development indices have the greatest differences, and the ecological development index has the smallest. The comprehensive urbanization index shows a core–periphery distribution pattern, in which Beijing and Tianjin have the highest values, the cities in middle-southern Hebei Province generally have lower values, and the cities in northern Hebei Province have the lowest values. The coupling coordination level of urbanization in the Beijing–Tianjin–Tangshan region and Shijiazhuang, the capital of Hebei Province, is high, and the difference is small. In contrast, in middle-southern and northern Hebei Province, the coupling coordination degree of urbanization is generally low, and the difference is large. Based on the current situation of urbanization in the Beijing–Tianjin–Hebei region, policy suggestions are proposed from the perspectives of strengthening the market mechanism of urbanization, adjusting the regional industrial structure and attaching importance to the coupled and coordinated development of urbanization.

1. Introduction

Urbanization is the only way to realize modernization in light of the inevitable trend of social and economic development. Great achievements have been made in the speed and scale of urbanization in China. Since the reform and opening-up, China’s urbanization rate increased from 17.90% in 1978 to 58.52% in 2017 (Table 1). According to the S curve of urbanization proposed by Northam, China is in a period of rapid development, with rates of 30–70% [1]. The reasons for the rapid urbanization are as follows: First, the reform and opening-up allowed China to enter the globalized market, and rapid economic development has directly accelerated the urbanization process. Second, the shift to a non-agricultural labor force caused many people to enter urban areas, and with the growth of the urban population, demand has increased and stimulated further urbanization. Third, China’s urbanization development model is government-led, and policy and institutional support has led to the agglomeration of resource factors in urban areas, thus leading to an accelerated urbanization process. As they are at the core of economic prosperity, population resource agglomeration, land development and utilization, and natural ecological development, cities promote the progress of the whole society. Urbanization has become an important engine of modernization and plays an important role in the economy, industrial restructuring, supply side structural reform and regional coordinated development.
Urbanization involves many subsystems, such as the population, land, economy, ecology and society [2]. In the early process of urbanization in China, the excessive pursuit of speed led to a serious imbalance in internal subsystems and economic instability, land-blind expansion, low population quality and ecological fragility [3]. Friedmann evaluated China’s rapid urbanization process as “urbanizing at breakneck speed” [4]. In the process of rapid urbanization, due to the one-sided pursuit of speed and scale, the carrying capacity of land and ecological resources is ignored, resulting in wasted resources and ecological destruction, which is contrary to the concept of sustainable development. On the other hand, it is beneficial for the sustainable development and improvement of urbanization to appropriately control the speed and scale and focus on the coordination degree and allocation efficiency among the internal elements. To alleviate the imbalance of internal subsystems caused by the rapid development of urbanization, China recently issued a series of urbanization development policies to ensure coordinated development (Table 2). The policies note that urbanization development should not only pursue speed but also pay attention to the coordination of internal factors to ensure healthy and rapid development.
The coordinated development of urbanization is reflected not only in coordination between cities but also in the coordinated development of internal subsystems [5]. Research on the coordinated development of urbanization subsystems has mainly focused on three aspects: (1) measuring the degree of coordinated development [6,7,8], (2) analysing the time series characteristics of coordinated development [9,10,11], and (3) exploring various influencing factors, such as investment intensity, the economic development level, and the degree of opening to the outside world [12,13,14]. There are no definitions and classifications of essential factors such as population, land and economic urbanization in foreign countries, but scholars believe that urbanization is complex and pluralistic, so some research has focused on population migration, the urbanization response etc. [15,16,17]. The research methods that have been used include exploratory spatial data analysis (ESDA), the geographically weighted regression model (GWR) [18], the coordinated development model [19] and the spatial econometric model [20]. In summary, current research on the coordinated development of urbanization internal subsystems has provided good inspiration for this study but still has the following shortcomings: (1) Urbanization is a complex process involving many subsystems. Its healthy development depends on the coordinated development of all subsystems. Current studies mostly focus on the three subsystems of population, land and economy using a single perspective. There are few studies on the coordinated development of multi-dimensional subsystems. (2) There are few studies on the spatial differentiation of the coordinated development of urbanization, which makes it difficult to reveal the spatial characteristics.
To make the research more scientific, this study establishes a multi-dimensional model of the coordinated development of urbanization from the perspective of a coupled system to deconstruct the mechanism of coordinated development. Using econometric models and spatial analysis tools, the level and spatial differentiation of the coupled and coordinated development of urbanization are measured and analyzed. The novelty and advantages of our research are mainly embodied in two aspects: (1) We measure the coupled and coordinated development level of urbanization from a five-dimensional perspective; that is, we include social and ecological subsystems based on the three systems of population, land and economy, to make the research more comprehensive and rigorous. (2) We reveal the spatial differentiation characteristics of the coupled and coordinated development degree of urbanization [21].

2. Methodology and Index Data
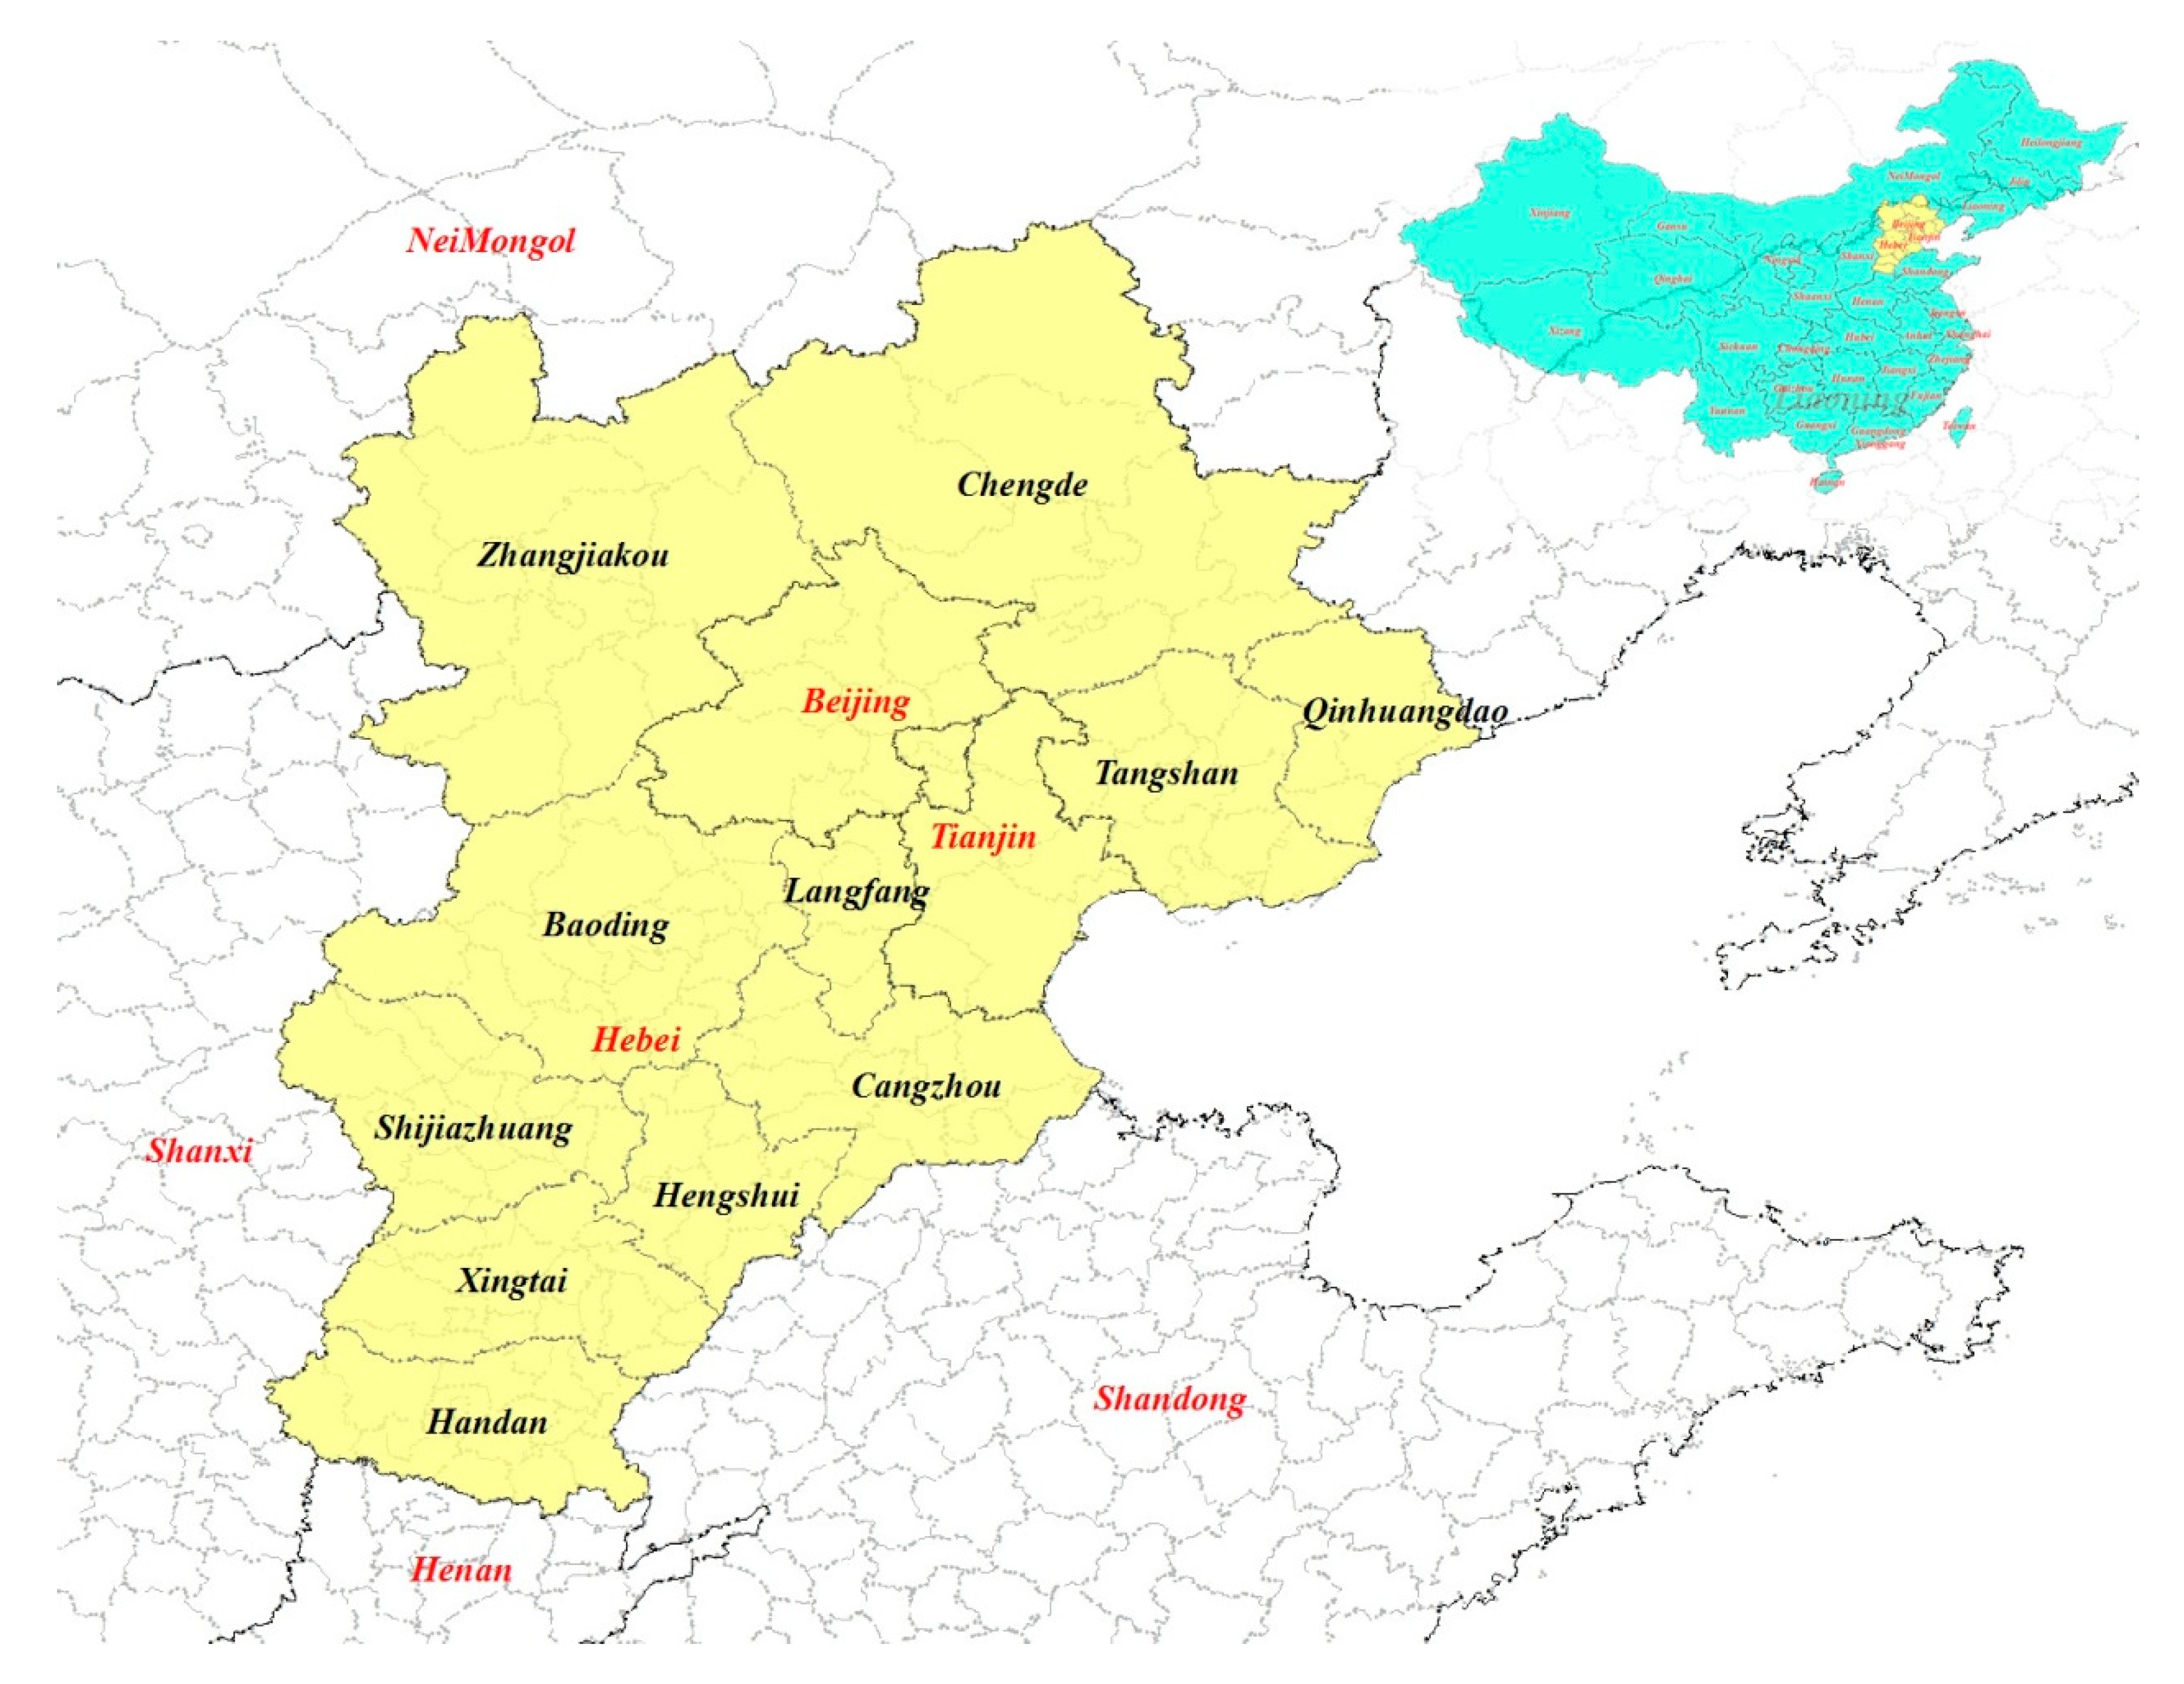
2.1. Study Area

In the Beijing–Tianjin–Hebei region, the formation mechanism of urbanization mainly comes from politics, history and culture. The market mechanism of urbanization is not strong, the private economy and foreign capital economy are relatively weak, and regional integration clearly differs. Core and peripheral cities have not formed a near-regional diffusion situation but formed a “poverty belt” around Beijing–Tianjin. The unbalanced development of the internal subsystems of urbanization, such as population, economy, land, ecology and society, shows that the development of a single factor will accelerate while the development of other factors will lag behind, stagnate or even regress, such as excessive population expansion, disorderly expansion of construction land and deterioration of the ecological environment, resulting in decreased coordination of development. At the same time, due to differences in administrative levels, urban attraction and market development levels, there are obvious differences in the development level of various elements, the comprehensive development level and the coordinated development level of urbanization among cities in the Beijing–Tianjin–Hebei region, which reflects the spatial differentiation of the above three aspects [22].
The Outline of Beijing–Tianjin–Hebei Coordinated Development Planning calls for a new path of intensive and scientific development through economic restructuring and spatial structure optimization, with urban construction as the carrier, ecological protection as the support and industrial optimization as the focus [23]. The establishment of the Xiongan New Area is reflective of a major strategic decision to promote the coordinated development of the Beijing–Tianjin–Hebei region.
Taking the Beijing–Tianjin–Hebei region as the research area (Figure 1), this study explores the mechanism and spatial differentiation of the coordinated development of urbanization. This can provide scientific guidance for establishing coordinated internal subsystem mechanisms and regulating key points of urbanization in hot areas, and has important theoretical and practical significance for enriching new urbanization theory and promoting the comprehensive, coordinated and sustainable development of the region.

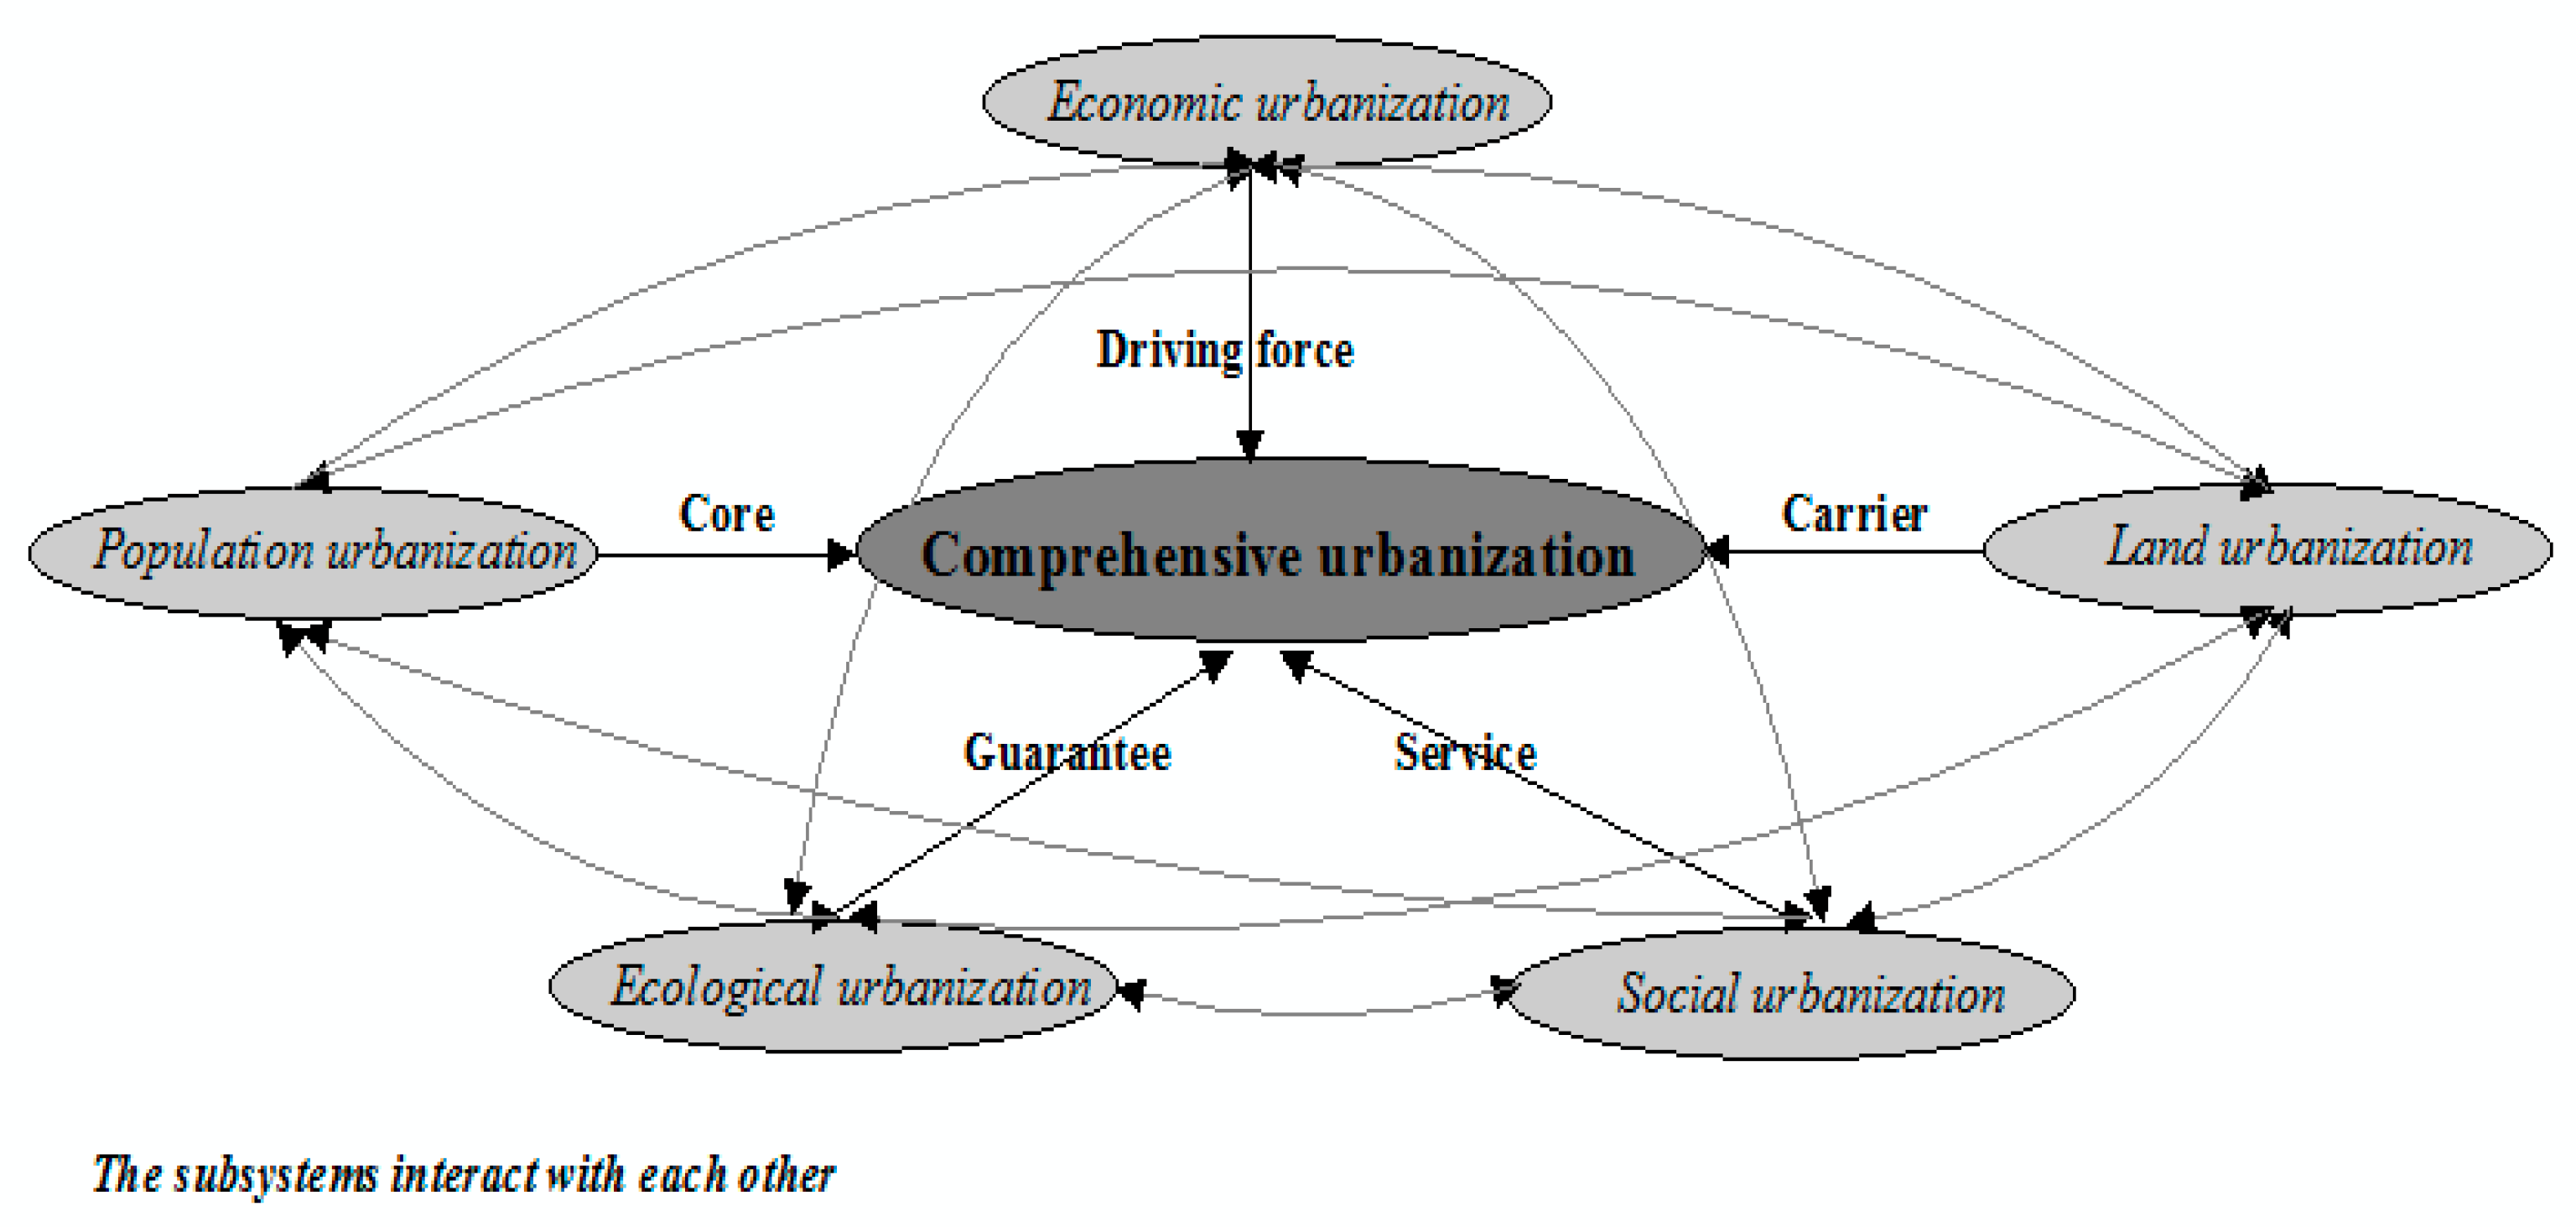
2.2. Deconstruction of Urbanization Connotation and Internal Coordination Development Mechanism

As a comprehensive concept, urbanization includes not only the concentration of the population and the transformation of a non-agricultural economy in cities and towns, but also the shaping and evolution of the abstract spirit of urban culture, values, production and lifestyle and the construction and evolution of the urban landscape ecosystem in specific areas [24]. According to the theory of system coupling, if there is an interactive relationship between elements in a system, it can be considered that there is a coupling phenomenon between them, and a coupling coordination state can be formed by guiding benign and positive interactions between the elements [10]. According to the content of this study, the internal elements of urbanization interact with and influence each other, which has the characteristics of system coupling. The purpose of coordinated development of urbanization is to guide all kinds of elements to achieve a coupled and coordinated state. Therefore, from the perspective of system coupling, this study deconstructs urbanization from five dimensions: population, land, economy, ecology and society [5,7,21,24,25].
  • The core of urbanization is population urbanization. Population agglomeration is an important driving force of urbanization and is the endogenous cause of urban formation [26]. Population factors and urbanization processes are deeply integrated through the land, economy, society, ecology and other aspects to form an inseparable and mutually reinforcing system [27].
  • Land urbanization is the carrier of urbanization. The spatial correlation between land use and urbanization is relatively high, and they both promote and restrict each other [28]. In the process of urban spatial expansion, the intensive and efficient use of land resources to the greatest extent possible is an important breakthrough point for promoting sustainable development [29,30]. The use of land indirectly affects the urbanization of the economy, population, ecology and society by expanding the city scale and changing the land use structure.
  • Economic urbanization is the motivating force of urbanization and mainly refers to improvements in the aggregate economy and the non-agriculturalization of the economic structure. Industrialization is the direct driving factor, while the rise and prosperity of tertiary industry is an expression of the degree of urbanization [7]. Through the development of secondary and tertiary industries, cities can attract nearby capital, technology, labour and other resources to achieve spatial agglomeration. The economy plays an important role in four aspects of urbanization: land, population, ecology and society.
  • Ecological urbanization is the guarantee of urbanization. By guaranteeing a virtuous cycle of urban ecosystems, taking the development of the ecological economy and improvement of environmental quality as the core and improving the ability of environmental governance as the means, the coordinated integration of population, land, economy and society within a city can be realized [31].
  • Social urbanization is the process of optimizing the allocation of public service resources [32]. As the process of urbanizing the population, land, economy and ecology develops, people’s production modes, behaviour and habits, social relations and public service resources will change [21].
In short, urbanization is a comprehensive process that includes five parts: population, land, economy, ecology and society. From the point of view of system theory, various parts of urbanization interact and restrict each other, forming an open dissipative structure (Figure 2). Urbanization in the new era should be promoted by ensuring a rational population size, scientific land use, healthy economic development, sustainable ecological environment and optimized allocation of social resources.

2.3. Index System Construction and Data Source

This study considers the actual situation of urbanization development in the Beijing–Tianjin–Hebei region. To reveal the internal coordination mechanism of urbanization, and drawing from the achievements of the existing comprehensive measurement index system [1,2,7,11,19,24,31,33,34,35,36], this study constructs a coupled and coordinated development index system of urbanization based on the five dimensions of population, land, economy, ecology and society (Table 3).
For population urbanization, the traditional index system mostly focuses on structural factors, such as using the proportion of the non-agricultural population to reflect population urbanization [7], but by considering new urbanization, the people-oriented concept is deepening. Population urbanization tends to focus on the urbanization of people, including employment, quality of life and living standards [37]. In the process of land urbanization, the rapid expansion of the urban scale does not represent quality; on the contrary, many problems arise. Therefore, the selection of land urbanization indicators should weaken the city scale [38] and strengthen the land use structure as well as the land input and output indices [1,6]. Economic urbanization is reflected not only in the economic development level, but also in the rationality of the economic structure. In addition to considering the above-mentioned indices, this study also uses economic extraversion to reflect the extent of regional participation in the international division of labour and economic exchange [1]. The destruction of the ecological environment has become a restrictive factor in the process of urbanization [39]. Many cities and towns are in an unhealthy or sub-healthy state. Ecological urbanization has been proposed to realize the sustainable development of urbanization. This study constructs the ecological urbanization index based on three levels: ecological quality, pressure and management [31]. Social urbanization is a process of equalizing public services and improving the social security level, which embodies the quality of urbanization. Therefore, this study constructs the social urbanization index based on three aspects: common facilities, social services and social security [1,21,24].
The relevant index data were mainly obtained from China’s Urban Statistical Yearbook 2018, Environmental Statistics Yearbook 2018, Science and Technology Statistical Yearbook 2018, the Regional Statistical Yearbook 2018 and the National Economic and Social Development Statistical Bulletin 2017. Some missing data were interpolated by using the moving average method.

2.4. Method

Coupling and coordination degrees are related but also different. The connection is that they both reflect the dynamic influence process between systems. The difference is that coupling degree only reflects the strength of the interaction between systems, but it is difficult to characterize whether there is a benign interaction, while coordination degree only reflects the benign interaction process between systems. The degree of coupling coordination refers to the dynamic change process between systems or subsystems, which gradually changes from disorder to order, reflecting the synergy effect between systems (Figure 3). Analyzing the coupling and coordination relationship can solve the problem of unbalanced development among systems, which is beneficial to the coordinated development of various systems or elements. Due to the strong coupling and coordination relationship among urbanization factors such as population, land, economy, ecology and society, the model is widely used in the study of coordinated development of urbanization [40,41], which is also an important reason why the model was selected for this study. The coupling coordination model is the combination of the coupling and coordinated development models. Many scholars have elaborated on the construction of the model [8,10,19,21,25,40,41]. Based on the above research methods, this paper measures the comprehensive development index and coupled coordination degree of five subsystems of 13 cities in the Beijing–Tianjin–Hebei region.
Processing of data standardization. As the development of the Beijing–Tianjin–Hebei region is quite different and the dimension and size of the original data are also different, this study uses standard deviation to standardize the index data. The formulas are as follows:
Y i j   =   ( 1     a )   +   a   × (   u i j     u i   m i n   )   /   (   u i   m a x     u i   m i n )
Y i j   =   ( 1     a )   +   a × (   u i   m a x     u i j )   /   (   u i   m a x     u i   m i n )  
where Yij is the standardized value; uij is the original value of index j of city I; and ui max and ui min are the maximum and minimum values of the corresponding indices, respectively. A ∈ (0,1) and generally has a value of 0.9 [42]. Formula (1) is used for positive values and Formula (2) for negative values.
Measurement of index weight. To avoid errors in subjective weighting, the entropy weighting method, which has better performance, is selected to measure the index weights in this study. Based on the definition of entropy, information entropy and the redundancy of each index are determined, and the entropy weight of each index and the urbanization level of population, land, economy, ecology and society of each city are measured. The formulas are as follows:
Information entropy:
e j = k i = 1 n Y i j   l n Y i j , j = 1 ,   2 ,   3 , ,   m
Redundancy:
d j = 1 e j ,   j = 1 ,   2 ,   3 , ,   m
Entropy weight:
w j = d j / j = 1 m d j ,   j = 1 ,   2 ,   3 , , m
Scores of various types of urbanization:
U i = j = 1 m w j × Y i j
where ej is the information entropy of index j; Y i j = Y i j / i = 1 n Y i j ; Yij is the standardized value of index j of city i; dj is the redundancy of index j; wj is the entropy weight of index j; Ui is the different types of urbanization development index in city i; m is the index number; n is the number of cities; and k is the adjustment coefficient, and k = 1/lnn.
System coupling coordination model. Urbanization is organic unification of the population, land, economy, ecology and society. The degree of interaction that exists among the five subsystems reflects their degree of coordinated development. The coupling model is as follows:
C i = U i a + U i b + U i c + U i d + U i e ( U i a ) 2 + ( U i b ) 2 + ( U i c ) 2 + ( U i d ) 2 + ( U i e ) 2
where Ci is the coupling degree and Uia, Uib, Uc, Uid and Uie are the evaluation scores for the population, land, economy, ecology and social urbanization of city i, respectively.
Since the coupling degree explains only the interaction between the five subsystems but does not reflect their level of coordinated development, it is necessary to introduce the system coupling coordination model to better express the degree of coupling and coordination. The model is shown in the following formula:
D i = C i × T i
T i = a U i a + b U i b + c U i c + d U i d + e U i e
where Di is the coupling coordination degree of urbanization development in city i; Ti is the comprehensive development index of five subsystems, reflecting the comprehensive development level of urbanization in city i; and a,b,c,d and e are the contributions the population, land, economy, ecology and society to the system. Considering the equal importance of each part, in this study, a = b = c = d = e = 1/5.

3. Results and Analysis

Formulas (1)–(5) are used to measure the index weight of each dimension of the urbanization system (Table 4); Formula (6) is used to measure the development index of the urbanization subsystems in the Beijing–Tianjin–Hebei region; and Formulas (7)–(9) are used to measure the comprehensive development index and coupling coordination degree of urbanization in the Beijing–Tianjin–Hebei region (Table 5). With the help of ArcGIS 10.1 spatial analysis technology, a spatial differentiation map of the comprehensive development index and its coupling coordination degree are drawn by using the Jenks natural breakpoint classification method (Figure 4).

3.1. Weight Analysis of Indices in Urbanization System.

This study used 650 original points of data from 2017 reflecting the urbanization systems in 13 cities in the Beijing–Tianjin–Hebei region, and the weight of 50 indicators was measured using the entropy method. By considering the five urbanization subsystems, we can see that the development of urbanization in the region in 2017 had the following characteristics: social urbanization (0.2795) > economic urbanization (0.2392) > population urbanization (0.2118) > land urbanization (0.1895) > ecological urbanization (0.0799). This shows that in the process of urbanization in the region, the dominant position was the urbanization of the society, economy and population, while land and ecological urbanization did not have a strong role.
In terms of the category level, the weight of the common facilities index is 0.1095, the largest in social urbanization, indicating that the construction of a common infrastructure can effectively promote the development of social urbanization. The weight of the economic extraversion index is 0.0848, the largest in economic urbanization, indicating that international trade can effectively promote regional economic development and the process of economic urbanization. The index weight of living standard in population urbanization is 0.0762, which shows that the living standard of residents can effectively reflect the urbanization degree of the population. The index weight of land input in land urbanization is 0.0812, which shows that efficient development of land and investment of funds can effectively promote the process of land urbanization. The weight of the ecological quality index in ecological urbanization is 0.0395, which shows that it is very important to protect the ecological environment and strengthen the prevention and control of environmental pollution to promote regional ecological urbanization.

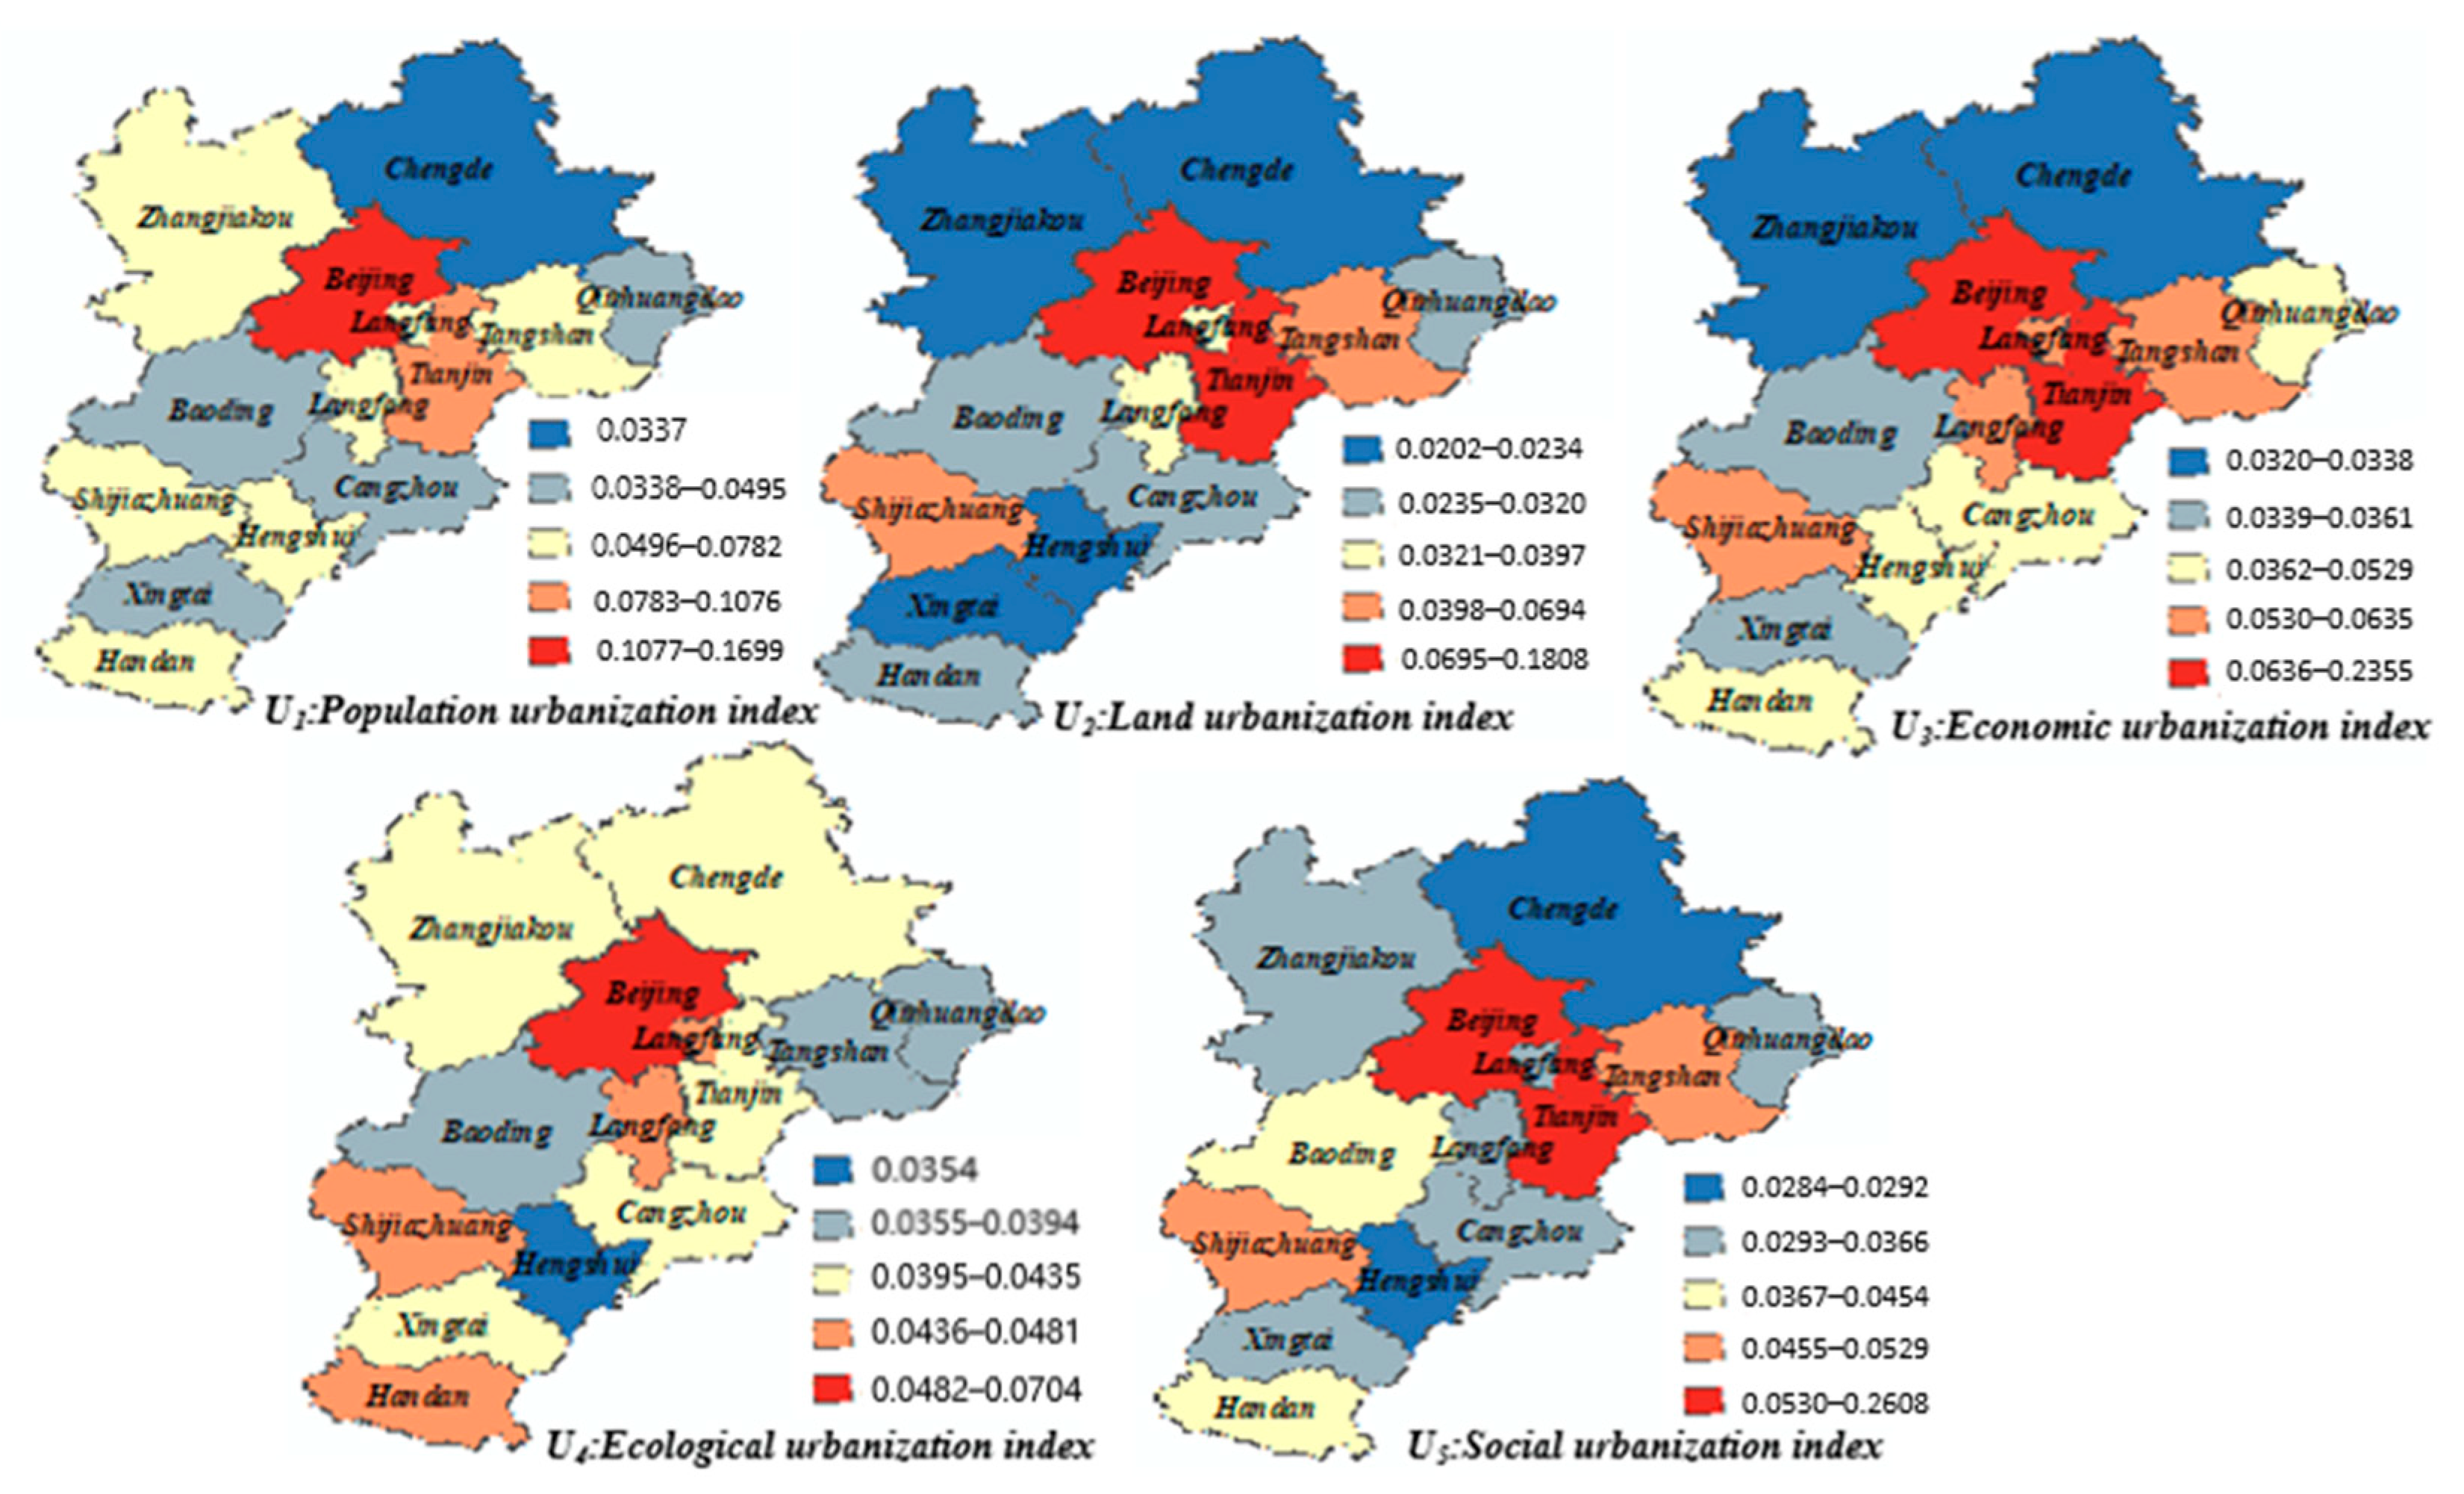
3.2. Analysis of Spatial Difference of Urbanization Subsystems

The population urbanization index is the highest in Beijing, followed by Tianjin, and the lowest is in northern Hebei. In middle-southern Hebei, the levels are staggered, showing a horizontal strip distribution pattern. The population urbanization index of Beijing and Tianjin has values higher than 0.1000. The indices of Shijiazhuang, Tangshan, Handan, Zhangjiakou, Langfang and Hengshui are all higher than 0.0500 (U1, Figure 4). The values for Baoding, Cangzhou and Xingtai in middle-southern Hebei, Chengde in northern Hebei and Qinhuangdao in eastern Hebei are all lower than 0.0500. Population urbanization is the core of urbanization and the main content and concentration of urbanization development. The imbalance of population urbanization is an important reason for the external imbalance of urbanization.
The land urbanization index of Beijing and Tianjin is at a high level, both have values above 0.1000. The value for Beijing is as high as 0.1808; the values for Shijiazhuang and Tangshan in Hebei are higher than 0.5000; and the values for middle-southern and northern Hebei are low (U2, Figure 4). Land urbanization is the carrier of urbanization and guarantees that there is space for economic development and population aggregation. From the index weight, we can see that land investment plays a significant role in the development of land urbanization, so the difference in financial investment in land caused by unbalanced economic development is one reason for the unbalanced development of land urbanization in the Beijing–Tianjin–Hebei region. On the other hand, to pursue land revenue, some cities over-promote the expansion of urban construction land, and the difference in degree of intensive land use leads to the unbalanced development of land urbanization.
The economic urbanization index for Beijing and Tianjin has high levels. The results show staggered development in middle-southern Hebei, and the index has a low distribution pattern in northern Hebei. The economic urbanization index for Beijing and Tianjin has values higher than 0.1500, with Beijing reaching 0.2355. The economic urbanization index of Shijiazhuang, Tangshan, Qinhuangdao, Cangzhou and Langfang has values higher than 0.5000, but those of Handan, Xingtai, Baoding, Hengshui in middle-southern Hebei and Chengde, and Zhangjiakou in northern Hebei are lower than 0.5000 (U3, Figure 4). The level of economic development is highly consistent with the level of comprehensive urbanization and is mainly concentrated in the Beijing–Tianjin–Tangshan and Qinhuangdao areas (U3, Figure 4; T, Figure 5). Beijing and Tianjin have gathered many economic development resources in the region. Tianjin, Tangshan and Qinhuangdao are located in Bohai Bay. Export trade is relatively developed, and economic extraversion plays an obvious role in promoting economic development. In contrast, the level of regional economic development in the surrounding areas is relatively low.
The ecological urbanization index in the Beijing–Tianjin–Hebei region has generally low values, all lower than 0.0800. In terms of spatial distribution, the ecological urbanization index in Beijing has the highest value, that of northern Hebei is relatively high, that of middle-southern Hebei is staggered and that of eastern Hebei is the lowest (U4, Figure 4). Ecological urbanization can guarantee urbanization, and the level directly determines its robustness and sustainability. The spatial differentiation of ecological urbanization is mainly affected by regional differences in the industrial structure and ecological governance investment.
The spatial patterns of the social urbanization index in the Beijing–Tianjin–Hebei region are quite different, and there is polarization between Beijing–Tianjin and Hebei. The Beijing and Tianjin regions have high levels, 0.2608 and 0.1763, respectively. In Hebei, only Shijiazhuang has a value higher than 0.5000, and the other cities are developing at a low level (U5, Figure 4). The differences in the social urbanization index values reflect the unbalanced supply of public services in the Beijing–Tianjin–Hebei region. These resources in Beijing and Tianjin tend to be saturated, but in Hebei are scarce, and the level of public infrastructure, social services and social security needs to be improved [31].

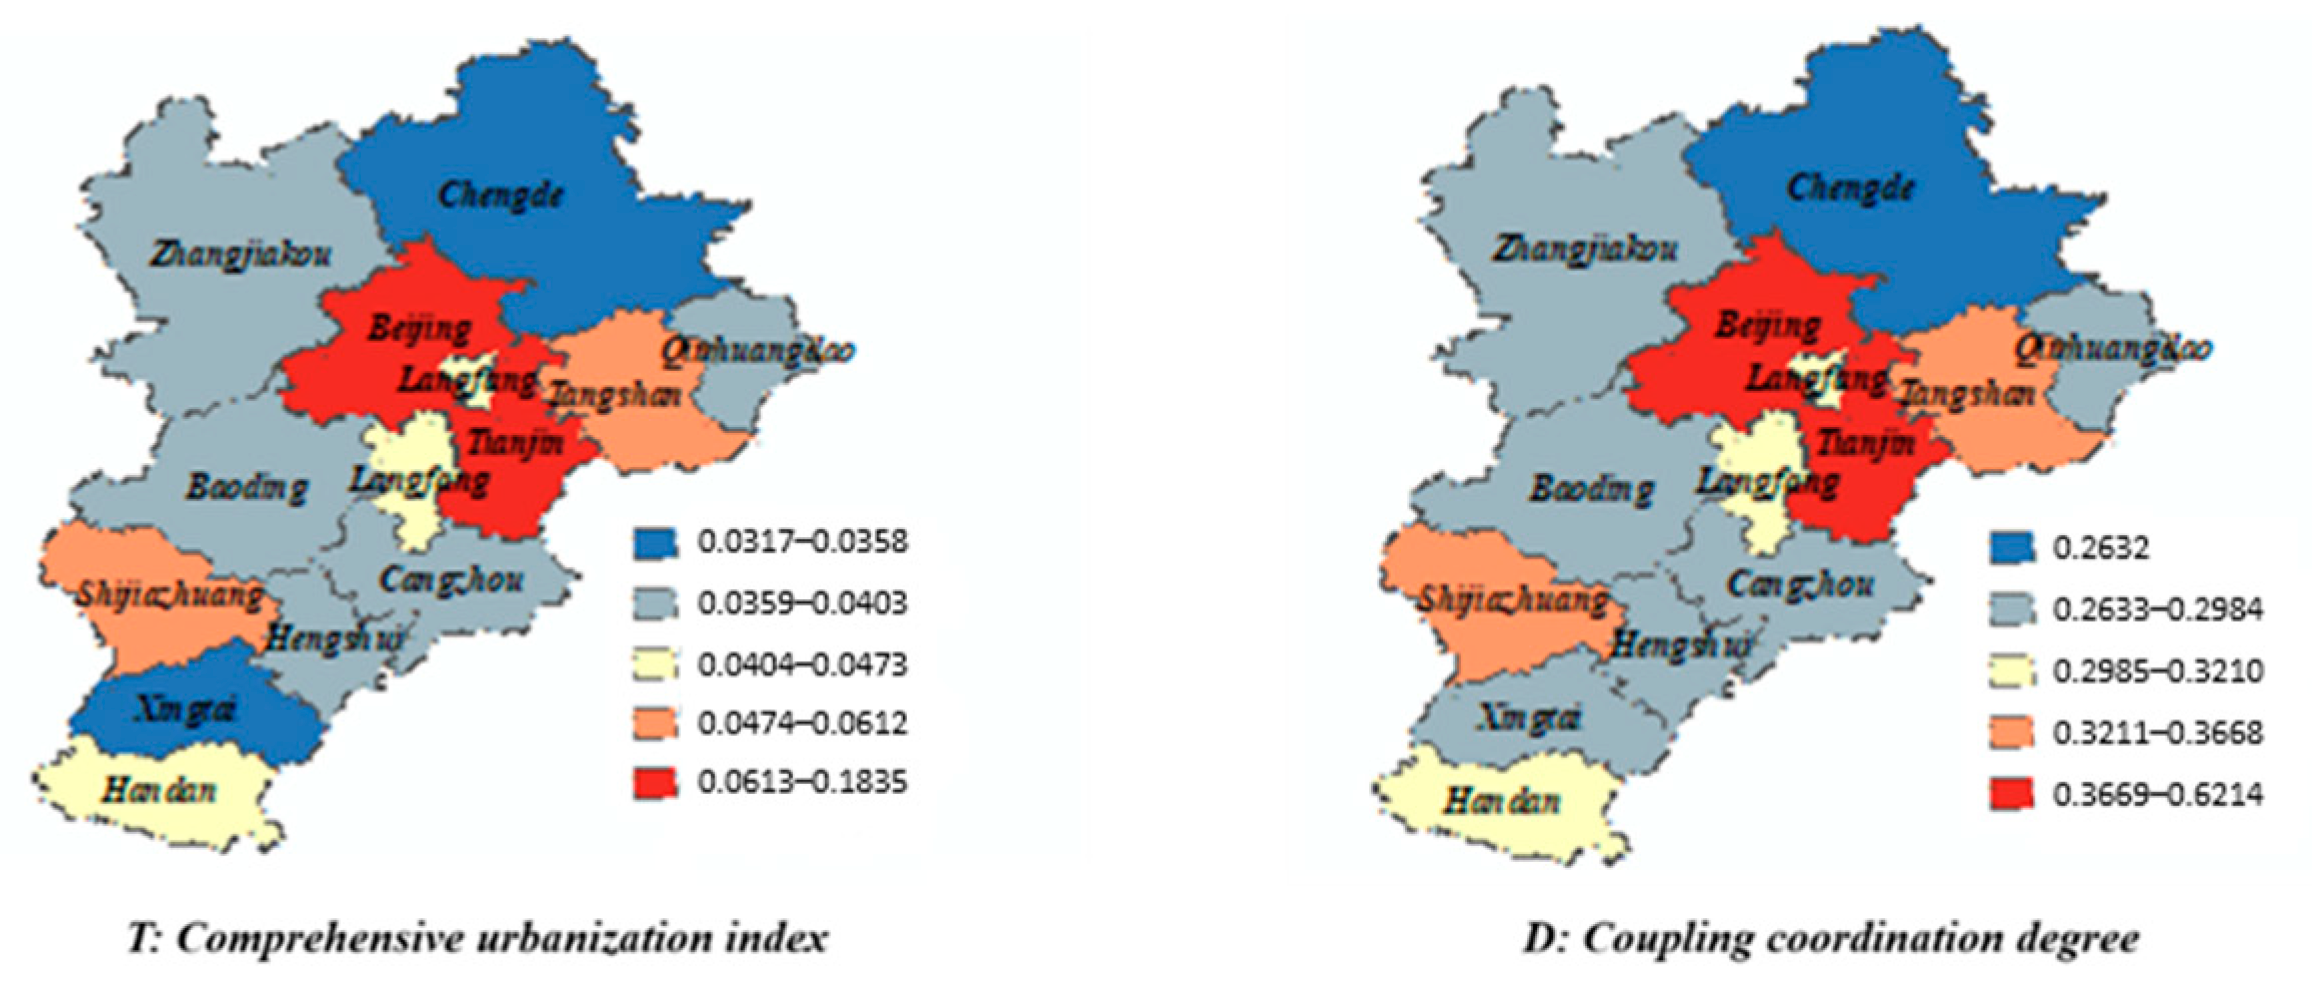
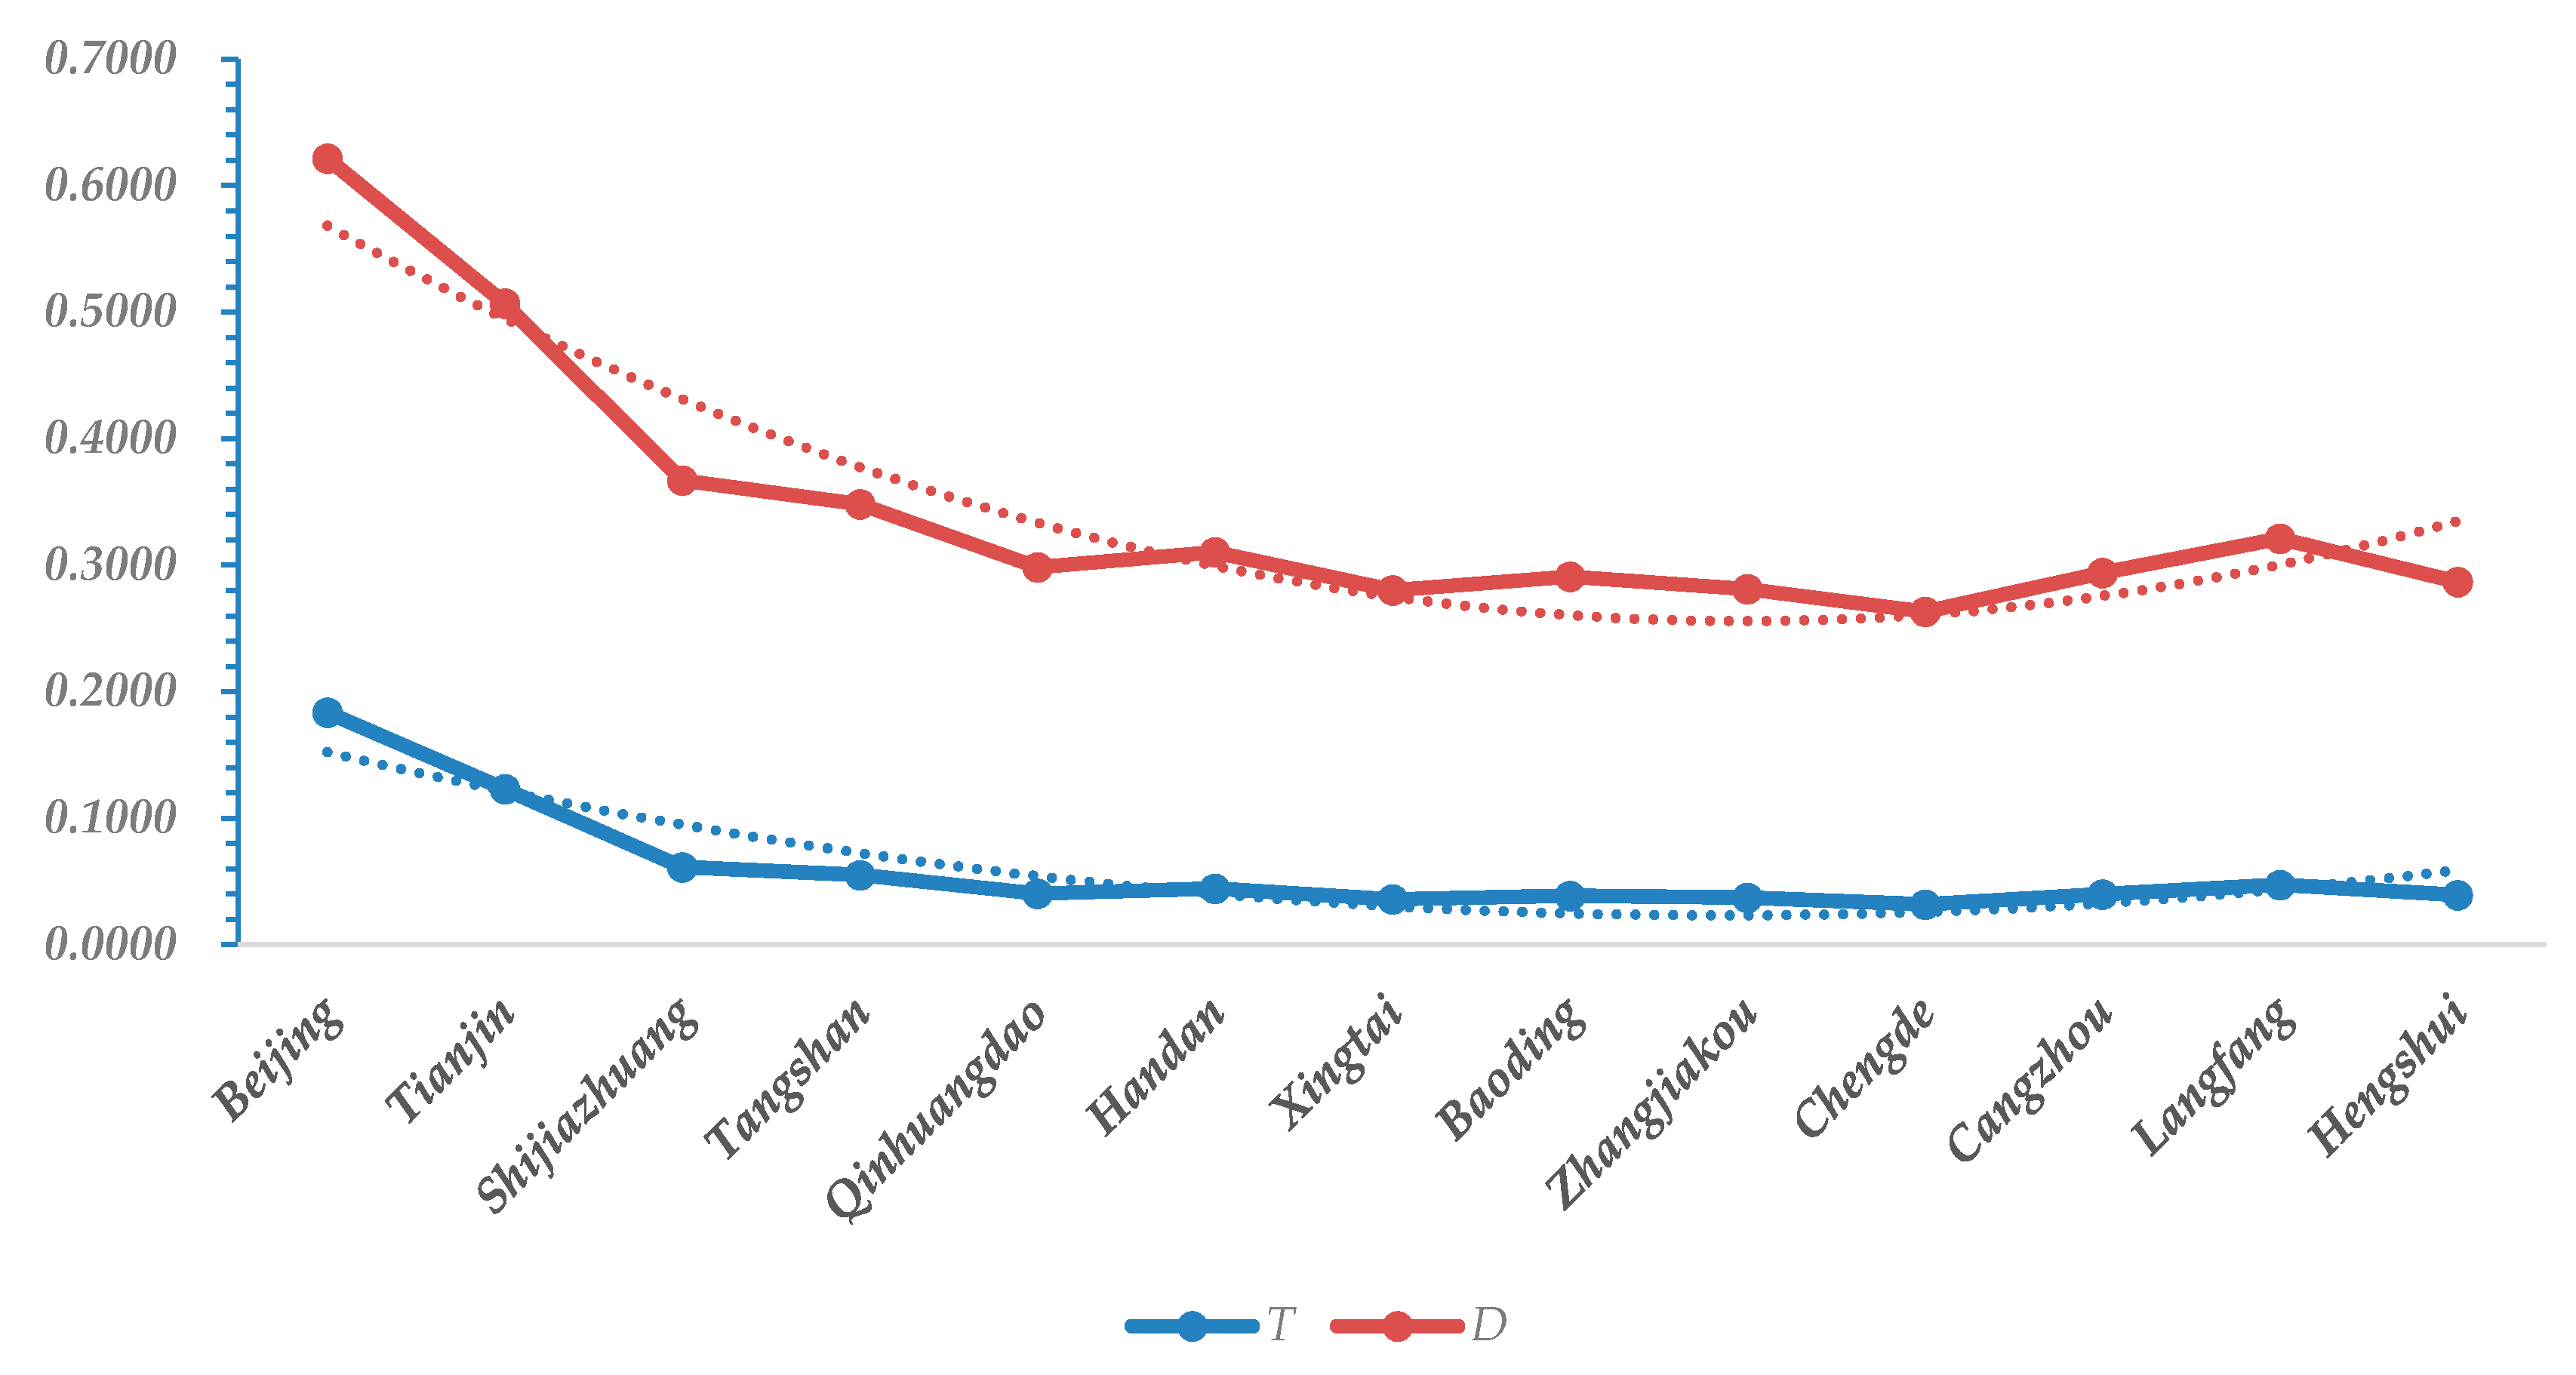
3.3. Analysis of Spatial Difference of Comprehensive Urbanization Index

The comprehensive urbanization index of the Beijing–Tianjin–Hebei region has a spatial pattern, with high values in Beijing–Tianjin and low values in the surrounding areas (T, Figure 5). Beijing and Tianjin have high values for economic development, land input and output, population concentration, ecological governance, social services, etc. The comprehensive urbanization index values are higher than 0.1000, and the value for Beijing is close to 0.2000. The comprehensive urbanization index of Tangshan and Shijiazhuang has values higher than 0.0500, and the value for Langfang is close to 0.0500. The values for Tangshan and Langfang are similar to those for Beijing and Tianjin, and the transfer of industry and technology provides the economic basis for comprehensive urbanization. Shijiazhuang has high values for the population and land urbanization indices due to the advantages of being Hebei’s provincial capital. Tangshan and Langfang have relatively high comprehensive urbanization index values. In addition, the surrounding areas of Beijing and Tianjin are developing at a low level, which shows that the comprehensive urbanization development of Beijing and Tianjin has a weak radiation driving effect on the surrounding areas. The comprehensive urbanization index for Handan, Xingtai, Baoding, Cangzhou and Hengshui in middle-southern Hebei, Chengde and Zhangjiakou in northern Hebei and Qinhuangdao in eastern Hebei all have values lower than 0.0450. Chengde and Xingtai have the lowest comprehensive urbanization index values, which are lower than 0.0400.

3.4. Analysis of Spatial Difference of Coupling Coordination Degree of Urbanization

The spatial pattern distribution of the coupling coordination degree of urbanization in the Beijing–Tianjin–Hebei region is highly consistent with that of the comprehensive urbanization index (Figure 5 and Figure 6). Using the Jenks natural breakpoint method, the coupling coordination degree of urbanization is divided into five levels: [0.3669, 0.6214] indicates high-level coupled coordination; [0.3211, 0.3668] indicates coupled coordination; [0.2985, 0.3210] indicates reluctant coupled coordination; [0.2633, 0.2984] indicates the endangered disorder level; and [0, 0.2632] indicates the disorder level (Table 6).
The high-level coupling coordination areas are distributed in Beijing and Tianjin, and their degree is 0.6214 and 0.5069, respectively. The urbanization indices of the population, land, economy and society in Beijing and Tianjin all have high values. Only the ecological urbanization index values are relatively low, at 0.0704 and 0.0414, respectively. Insufficient environmental carrying capacity and ecological destruction have become the main factors hindering the coupled and coordinated development of urbanization in Beijing and Tianjin.
The coupling coordination areas are distributed in Shijiazhuang and Tangshan, and their degree is 0.3668 and 0.3480, respectively. As the capital of Hebei, Shijiazhuang has obvious advantages in terms of capital, technology and policy. The urbanization indices of population, land, economy and society all have values higher than 0.5000, but economic and social development have not led to an improved ecological environment. The ecological urbanization index value is only 0.0481. The value of the economic urbanization for Tangshan, the economic centre of Hebei, is 0.0635, and economic development has led to population aggregation and urban construction. The population and land urbanization indices have also reached values of 0.0674 and 0.0566, but the ecological urbanization index value is only 0.0387. The ecological environment has become a bottleneck restricting the coupled and coordinated development of urbanization in Tangshan and Shijiazhuang.
The reluctantly coupled coordination areas are distributed in Langfang, which is in the middle of Hebei, and Handan, in southern Hebei. The coupling coordination degree is 0.3210 and 0.3104, respectively. The values of the population and economic urbanization indices of Langfang are 0.0596 and 0.0595, respectively, while those of the land and social urbanization indices are only 0.0397 and 0.0324; these are the main factors restricting the coupled and coordinated development of urbanization. The population urbanization index of Handan has a value of 0.0582, and the economic, ecological and social urbanization indices have a value of approximately 0.0450. The land urbanization index has the lowest value, at 0.0271, and has become a factor restricting the coupled and coordinated development of urbanization.
The endangered disordered areas are located in Zhangjiakou in northern Hebei, Qinhuangdao in eastern Hebei, and Baoding, Cangzhou, Hengshui and Xingtai in middle-southern Hebei. The coupling coordination degree is 0.2811, 0.2984, 0.2909, 0.2939, 0.2867 and 0.2801, respectively. The values of the land, economic and social urbanization indices for Zhangjiakou are only 0.0204, 0.0320 and 0.0333, manifested by rough land use, an underdeveloped industrial economy and an imperfect urban infrastructure. The economic urbanization index in Qinhuangdao is not low, but the land and social urbanization indices are relatively low and have become a factor restricting the coupled and coordinated development of urbanization. The land, economic and social urbanization indices of Baoding, Cangzhou, Hengshui and Xingtai in middle-southern Hebei all show a low level of development and have become the most important factor restricting the coupled and coordinated development of urbanization.
The distribution of the disordered level is in Chengde, and the coupling coordination degree is 0.2632. The lag in population, land, economic and social urbanization has become a bottleneck restricting the coupled and coordinated development of urbanization. Chengde has an unreasonable industrial structure, insufficient motivation for economic development, a small city scale and a weak agglomeration capacity. However, Chengde is a water conservation site and an ecological barrier against wind and sand in Beijing and Tianjin; its ecological urbanization index is as high as 0.0417.

4. Discussion

Taking the Beijing–Tianjin–Hebei region as an example, this study measured and analyzed the coordinated development level of urbanization and used GIS software to visualize the spatial differentiation. The research logic is as follows: (1) Based on an analysis of the connotation and mechanism of the coordinated development of urbanization, the measurement index system is constructed with reference to previous research results. (2) Using the entropy method and coupling coordination model, this study analyzed the development level of urbanization factors, the comprehensive development level and the coordinated development level of urbanization in the study area. The analysis of the concept and the application of the method are similar to previous studies [8,10,19], and the conclusions are in line with the development trend of urbanization, but some details are different. For example, some studies suggest that in the process of urbanization, land development is faster than population development [21]; in other studies, the ecological environment elements are separated in order to study the coordination with the urbanization system [20]. These studies are scientific and reasonable, but there are differences in research scope and dimensions.
Through the analysis of the index weighting of the urbanization subsystems in the Beijing–Tianjin–Hebei region, it is found that the order of the weights is as follows: social urbanization > economic urbanization > population urbanization > land urbanization > ecological urbanization. In the past 10 years, some cities in the region unilaterally pursued land urbanization, with rapid expansion of urban construction land and increased financial investment in land. However, with the development of land urbanization, the population structure, employment, living standards and population quality have not improved at the same speed, causing the land urbanization index to be higher than the population urbanization index. By 2017, the coupling and coordination degree of urbanization subsystem development continued to improve, and the degree of land urbanization development neared saturation, and the concept of population urbanization as the core of development was highlighted. Among the subsystems, the index weight of ecological urbanization is the lowest, which is consistent with the results of the current research [21,31,43,44,45]. In the process of urbanization in the future, we should pay more attention to ecological urbanization. By increasing investment in ecological environmental governance and financial funding, we can reduce the impact of the pressure of the ecological environment on the development of urbanization.
In terms of spatial differentiation of the population, land, economy, ecology and social urbanization subsystems, the Beijing–Tianjin–Tangshan region has a relatively high level of urbanization as a whole. The urbanization index of each dimension in the middle-southern Hebei region is at a moderately low level, while that in the northern Hebei region is at the lowest level. The spatial differentiation is the greatest in the economic and social urbanization indices, and lowest in the ecological urbanization index. The development of the economy has brought about population agglomeration, expansion of construction land, continuous improvement in the social infrastructure and social services, and destruction of the ecological environment. Although the spatial differentiation of the ecological urbanization index for the Beijing–Tianjin–Hebei region is very small, the overall level of the index is low.
The comprehensive urbanization index shows a core–periphery spatial distribution pattern. The highest levels are in Beijing and Tianjin, lower levels are in eastern and middle-southern Hebei and the lowest level is in northern Hebei. The main reasons for the large spatial differentiation of the comprehensive index of urbanization in this region are as follows: (1) unbalanced economic development among regions and obvious differences in the industrial structure; (2) disparities in public resources investment, resulting in a one-way flow of the high-quality labour force, means of production and other factors to Beijing and Tianjin; and (3) administrative division and local protectionism, leading to weak inter-city links and market vitality [2].
The coupling coordination degree of urbanization in the Beijing–Tianjin–Hebei region is highly consistent with the spatial distribution of the comprehensive urbanization index, and this is consistent with the conclusions of previous research [21,31]. The high-level coupling coordination area is located in Beijing and Tianjin, and the coupling coordination area is located in Shijiazhuang, the capital of Hebei, and Tangshan, in eastern Hebei. The cities in middle-southern Hebei are in a state of reluctant coupling coordination and have an endangered disorder level; and the disordered area is located in Chengde, in northern Hebei. The reason may be that the higher the development degree of comprehensive urbanization, the more balanced the development of the population, land, economy, ecology and social urbanization subsystems and, correspondingly, the higher the degree of coupling and coordination. In contrast, the lower the comprehensive urbanization index, the lower the degree of coupling and coordination, due to the great differences in development among subsystems.
Based on the results of the above analysis, combined with the implementability of the coupled and coordinated development policy of urbanization in the Beijing–Tianjin–Hebei region, relevant policy recommendations can be provided. First, we should strengthen the market mechanism of urbanization, realize the marketization of regional resource allocation, address the current situation of regional division, and help capital, talent, technology and information flow freely in the region. In addition, the economic advantages of the Beijing–Tianjin region should be promoted so they can radiate effectively to peripheral cities. Second, through the role of government macro-control, the industrial structure of the Beijing–Tianjin–Hebei region should be optimized according to development needs and form an industrial development trend of dislocated competition and chain development. Beijing has prioritized the development of the modern service and knowledge-intensive industries; Tianjin has developed a high-end manufacturing industry and port economy according to its own advantages; and Hebei has replicated Beijing’s non-capital function, which relieves the pressure on the capital and promotes economic development through industrial transfer, which leads to a win-win situation. Third, while pursuing the rapid development of comprehensive urbanization in the Beijing–Tianjin–Hebei region, more attention should be paid to the coupling and coordination of its subsystems. By optimizing the industrial structure, integration of the urban economy and industry can be promoted, which will cause economic development to have a strong endogenous effect and allow it to be sustainable. Mature economic and industrial development can promote population agglomeration and lead to rational and orderly urbanization of the population by equalizing social security and the supply of public services. By adjusting the industrial layout to guide the optimization of the land use structure, the efficient and intensive use of land can promote industrial upgrading, improve efficiency and achieve the coordination of economic development and land use. By changing the mode of economic development, optimizing the pattern of land development, developing a low-carbon economy and establishing green production and lifestyles, the coordinated development of the economy and ecological environment can be achieved.
This study has some limitations. Due to the limitation of space and considering the availability of data, this study only makes a static investigation of the coordinated development of urbanization in the Beijing–Tianjin–Hebei region in 2017, and includes less research on the dynamic evolution process of such development in this region. In addition, the timing and driving factors of the coupled and coordinated development of urbanization are not analyzed in this study. The above considerations should be strengthened in future research to enhance the scientific nature of the analysis.

5. Conclusions

Urbanization is a complex system that can be deconstructed by considering the five dimensions of population, land, economy, ecology and society. There is strong coupling and coordination among these subsystems, forming an open dissipative structure. In the urbanization development process, we should coordinate the relations among the five subsystems, realize that economic development and industrial restructuring are the driving forces, take efficient and intensive land use as the carrier, take the overall improvement in employment, life and quality as the core, take ecological environment governance and protection as the guarantee, and take the supply of social public resources as the service. Only in this way can the coupled and coordinated development of urbanization be guaranteed. There is significant spatial differentiation among the subsystems of the urbanization development indices in the Beijing–Tianjin–Hebei region. The economic and social indices have the greatest differences, followed by land, population and ecological urbanization, which have the smallest differences. The comprehensive urbanization index has a core–periphery distribution pattern. The comprehensive development level of urbanization in Beijing and Tianjin is relatively high, that in middle-southern Hebei is generally low and that in northern Hebei is the lowest. The coupling coordination degree of urbanization is high in the Beijing–Tianjin–Tangshan area and in Shijiazhuang, the capital of Hebei Province, and the difference is small. The coupling coordination degree of urbanization in middle-southern and northern Hebei is generally low, and the difference is large. The development of urbanization in northern Hebei is at a disorderly level.

Author Contributions

All authors contributed equally to this work. Specifically, X.S. developed the original idea, designed the methodology, and wrote the original draft which was revised by Z.Z. Both authors have read and agreed to the published version of the manuscript.

Funding

This research was funded by the National Social Science Foundation of China, Research on Policy Coordination of Rural Governance and Targeted Poverty Alleviation in Rural Revitalization in China, grant number 18BZZ077.

Institutional Review Board Statement

Ethical review and approval were waived for this study, due to not applicable for studies not involving humans or animals.

Informed Consent Statement

Not applicable for studies not involving humans.

Data Availability Statement

3rd Party Data. Restrictions apply to the availability of these data. Data was obtained from [CEI Statistics Database] and are available [from the authors/at https://db.cei.cn/, accessed on 2 March 2021] with the permission of [CEI Statistics Database].

Conflicts of Interest

The authors declare no conflict of interest.

References

  1. Tang, Z.; Zhang, Z.; Zuo, L.; Wang, X.; Hu, S.; Zhu, Z. Spatial econometric analysis of the relationship between urban land and regional economic development in the Beijing–Tianjin-Hebei coordinated development region. Sustainability 2020, 12, 8451. [Google Scholar] [CrossRef]
  2. Xie, Z.; Gao, Y.; Li, C.; Zhou, J.; Zhang, T. Spatial heterogeneity of typical ecosystem services and their relationships in different ecological-functional zones in Beijing-Tianjin-Hebei Region, China. Sustainability 2018, 10, 6. [Google Scholar] [CrossRef] [Green Version]
  3. Chen, L.; Ren, C.; Zhang, B.; Wang, Z.; Liu, M. Quantifying urban land sprawl and its driving forces in Northeast China from 1990 to 2015. Sustainability 2018, 10, 188. [Google Scholar] [CrossRef] [Green Version]
  4. Friedmann, J. Four theses in the study of China’s urbanization. Int. J. Urban Reg. Res. 2006, 30, 440–451. [Google Scholar] [CrossRef]
  5. Zhang, C.; Zhang, X.; Wu, Q.; Li, H. Research on the coordination between the quality of urbanization and the scale of urbanization—Taking Jiangsu province as an example. Sci. Geogr. Sin. 2013, 33, 16–22. (In Chinese) [Google Scholar]
  6. Maeda, S. A technique of urbanization measurement. Geogr. Sci. 1974, 21, 23–32. [Google Scholar]
  7. Zhao, F.; Tang, L.; Qiu, Q.; Wu, G. The compactness of spatial structure in Chinese cities: Measurement, clustering patterns and influencing factors. Ecosyst. Health Sustain. 2020, 6, 1743763. [Google Scholar] [CrossRef] [Green Version]
  8. Zhang, X.; Ren, A.; Chen, L.; Zheng, X. Measurement and spatial difference analysis on the accessibility of road networks in major cities of China. Sustainability 2019, 11, 4209. [Google Scholar] [CrossRef] [Green Version]
  9. Wang, Y.; Li, J.; Wang, L.; Lin, Y.; Zhou, M.; Yin, P.; Yao, S. The impact of carbon monoxide on years of life lost and modified effect by individual- and city-level characteristics: Evidence from a nationwide time-series study in China. Ecotoxicol. Environ. Saf. 2021, 210, 111884. [Google Scholar] [CrossRef] [PubMed]
  10. Ariken, M.; Zhang, F.; Chan, N.; Kung, H. Coupling coordination analysis and spatio-temporal heterogeneity between urbanization and eco-environment along the silk road economic belt in China. Ecol. Indic. 2021, 121, 107191. [Google Scholar] [CrossRef]
  11. Yilmaz, M.; Terzi, F. Characteristics of spatio-temporal urban growth patterns due to the driving forces of urbanization: The Coastal City of Antalya, Turkey. Int. Rev. Spat. Plan. Sustain. Dev. 2020, 8, 16–33. [Google Scholar] [CrossRef]
  12. Henderson, V. The urbanization process and economic growth: The so-what question. J. Econ. Growth 2003, 8, 47–71. [Google Scholar] [CrossRef]
  13. Farahmand, S.; Akbari, N.; Abootalebi, M. Spatial effects of localization and urbanization economies on urban employment growth in Iran. Kag. Kog. Ronbunshu 2012, 34, 224–229. [Google Scholar]
  14. Fluckiger, M.; Ludwig, M. Geography, human capital and urbanization: A regional analysis. Econ. Lett. 2018, 168, 10–14. [Google Scholar] [CrossRef] [Green Version]
  15. Weber, C.; Puissant, A. Urbanization pressure and modeling of urban growth: Example of the tunis metropolitan area. Remote Sens. Environ. 2003, 86, 341–352. [Google Scholar] [CrossRef]
  16. Glickman, N.; Mchone, W. Intercity migration and employment growth in Japanese urban-economy. Reg. Stud. 1977, 11, 165–181. [Google Scholar] [CrossRef]
  17. Zanette, L.R.S.; Martins, R.P.; Ribeiro, S.P. Effects of urbanization on neotropical wasp and bee assemblages in a Brazilian metropolis. Landsc. Urban Plan. 2005, 71, 105–121. [Google Scholar] [CrossRef]
  18. Zhu, C.; Zhang, X.; Zhou, M.; He, S.; Gan, M.; Yang, L.; Wang, K. Impacts of urbanization and landscape pattern on habitat quality using OLS and GWR models in Hangzhou, China. Ecol. Indic. 2020, 117, 106654. [Google Scholar] [CrossRef]
  19. Xu, D.; Hou, G. The Spatiotemporal Coupling characteristics of regional urbanization and its influencing factors: Taking the Yangtze River Delta as an example. Sustainability 2019, 11, 822. [Google Scholar] [CrossRef] [Green Version]
  20. Wang, Z.; Liang, L.; Sun, Z.; Wang, X. Spatiotemporal differentiation and the factors influencing urbanization and ecological environment synergistic effects within the Beijing-Tianjin-Hebei urban agglomeration. J. Environ. Manag. 2019, 243, 227–239. [Google Scholar] [CrossRef]
  21. Ni, W. Measurement of new urbanization and its coordinated development-Taking Beijing-Tianjin-Hebei urban agglomeration as an example. Jiangsu Agric. Sci. 2017, 45, 317–323. (In Chinese) [Google Scholar]
  22. Fang, C.; Zhou, C.; Gu, C.; Chen, L.; Li, S. Theoretical framework and technical path of interaction between urbanization and ecological environment in megacities. Acta Geogr. Sin. 2016, 71, 531–550. [Google Scholar]
  23. Fan, P.; Liang, L.; Li, Y.; Duan, L.; Wang, N.; Chen, C. Evaluation of coordinated development of urbanization from the perspective of system coupling in the Beijing-Tianjin-Hebei Region. Resour. Sci. 2016, 38, 2361–2374. (In Chinese) [Google Scholar]
  24. Desaegher, J.; Nadot, S.; Machon, N.; Colas, B. How does urbanization affect the reproductive characteristics and ecological affinities of street plant communities? Evol. Ecol. 2019, 9, 9977–9989. [Google Scholar] [CrossRef] [Green Version]
  25. Shen, X.; Wu, C.; Fang, M. Coordination of industry, population and land deagriculturalization during the rapid process of urbanization in Zhejiang province. China Popul. Resour. Environ. 2014, 24, 129–134. (In Chinese) [Google Scholar]
  26. Krugman, P.R. Increasing returns and economic geography. J. Polit. Econ. 1991, 99, 483–499. [Google Scholar] [CrossRef]
  27. Moir, H. Dynamic relationships between labor force structure, urbanization, and development. Econ. Dev. Cult. Chang. 1997, 26, 25–41. [Google Scholar] [CrossRef]
  28. Sun, X.; Zhang, Z.; Zhang, Y. Factors Influencing Farmer’s Decision-Making Behavior on Rural Construction Land Transformation. Sustainability 2018, 10, 4288. [Google Scholar] [CrossRef] [Green Version]
  29. Kottmeier, C.; Biegert, C.; Corsmeier, U. Effects of urban land use on surface temperature in Berlin: Case study. J. Urban Plan. Dev. 2007, 133, 128–137. [Google Scholar] [CrossRef]
  30. Gill, S.E.; Handley, J.F.; Ennos, A.R.; Pauleit, S.; Theuray, N.; Lindley, S.J. Characterising the urban environment of UK cities and towns: A template for landscape planning. Landsc. Urban Plan. 2008, 87, 210–222. [Google Scholar] [CrossRef]
  31. Grimm, N.; Faeth, S.; Golubiewski, N.; Redman, C.; Wu, J.; Bai, X.; Briggs, J. Global change and the ecology of cities. Science 2008, 319, 756–760. [Google Scholar] [CrossRef] [Green Version]
  32. Siciliano, G. The social and environmental implications of urbanization strategies and domestic land grabbing in China: The case of Chongming Island. Inst. Poverty Land Agrar. Stud. 2013, 26, 1–21. [Google Scholar]
  33. Tratalos, J.; Fuller, R.; Warren, P.; Davies, R.; Gaston, K. Urban form, biodiversity potential and ecosystem services. Landsc. Urban Plan. 2007, 83, 308–317. [Google Scholar] [CrossRef]
  34. Ghosh, S. A city growth and land-use/land-cover change: A case study of Bhopal, India. Model. Earth Syst. Environ. 2019, 5, 1569–1578. [Google Scholar] [CrossRef]
  35. Oungpasuk, P. Health for all: A pathway to economic growth in the Association of South-East Asian Nations. Bull. World Health Organ. 2014, 92, 775. [Google Scholar] [CrossRef] [PubMed]
  36. Henderson, J. Urbanization in the Hong Kong–South China Region: An introduction to dynamics and dilemmas. Int. J. Urban Reg. Res. 2009, 15, 169–179. [Google Scholar] [CrossRef]
  37. Sethuraman, S. Urbanization and employment: A case study of Djakarta. Int. Labour Rev. 1975, 112, 191–205. [Google Scholar]
  38. Gibbs, J.; Martin, W. Urbanization, techology, and the division of labor: International patterns. Am. Sociol. Rev. 1962, 27, 667–677. [Google Scholar] [CrossRef]
  39. Zhang, L.; Cai, J.; Wang, Y. Advance in study on urbanization and urban ecological environment. Ecol. Environ. Sci. 2010, 19, 244–252. (In Chinese) [Google Scholar]
  40. Wu, Y.; Zhang, Y. Research on the coupling and coordinated development of regional economic growth and environment in China. Resour. Sci. 2008, 1, 25–30. (In Chinese) [Google Scholar]
  41. Tian, J.; Wang, B.; Wang, S. Study on evaluation of urban land use benefit and coupling coordination relationship in three provinces of Northeast China. Sci. Geogr. Sin. 2019, 39, 305–315. (In Chinese) [Google Scholar]
  42. Duan, Y.; Zhou, J.; Shen, X. Research on post-evaluation model of real estate project based on entropy weight TOPSIS method. Proj. Manag. Technol. 2010, 9, 40–43. (In Chinese) [Google Scholar]
  43. Adachi, S.; Kimura, F.; Kusaka, H.; Inoue, T.; Ueda, H. Comparison of the impact of global climate changes and urbanization on summertime future climate in the Tokyo metropolitan area. J. Appl. Meteorol. Climatol. 2012, 51, 1441–1454. [Google Scholar] [CrossRef]
  44. Xiang, F. A Study on Psychological Contract Violation and Its Effects of Knowledge Workers in Scientific and Technological SMEs; China Social Sciences Press: Beijing, China, 2015. (In Chinese) [Google Scholar]
  45. Xiang, F. A Theoretical and Empirical Study on the Development of Teaching and Scientific Research in Colleges and Universities: Based on the Perspective of the Employability Psychological Contract of Young Teachers; China Social Sciences Press: Beijing, China, 2017. (In Chinese) [Google Scholar]
Figure 1. Study area.
Sustainability 13 03171 g001
Figure 2. Mechanism of internal coordinated development of urbanization.
Sustainability 13 03171 g002
Figure 3. Conceptual model of coupling coordination theory. Note: ”I” and “II” represent two different coupling processes, “I” represents low-level coupling process, “II” represents coupling coordination process.
Sustainability 13 03171 g003
Figure 4. Spatial differentiation of subsystem index of urbanization in Beijing–Tianjin–Hebei region in 2017.
Sustainability 13 03171 g004
Figure 5. Spatial differentiation of comprehensive urbanization index and coupling coordination degree in Beijing–Tianjin–Hebei region in 2017.
Sustainability 13 03171 g005
Figure 6. Comprehensive urbanization index and coupling coordination degree of Beijing–Tianjin–Hebei region in 2017.
Sustainability 13 03171 g006
Table 1. Growth rate of urbanization in China since reform and opening-up.
IntervalUrbanization RateGrowth Rate
1979–198919.99–26.21%6.22%
1989–199926.21–30.89%4.68%
1999–200930.89–46.59%15.70%
2009–201746.59–58.52%11.93%
Table 2. New urbanization development policy.
DatePolicyKey Points
March 2014National new urbanization planning (2014–2020)
(1)
Citizenize agricultural transfer population
(2)
Optimize layout and form of urbanization
(3)
Improve the ability of urban sustainable development
December 2014Notice on issuing the comprehensive pilot scheme for new national urbanization
(1)
Establish cost sharing mechanism for citizenization of agricultural transfer population
(2)
Establish diversified and sustainable urbanization investment and financing mechanism
(3)
Establish urban and rural land management system
(4)
Strengthen construction of ecological civilization system
February 2016Opinions on further promoting the construction of new urbanization
(1)
Actively promote citizenization of agricultural transfer population
(2)
Improve land use mechanism
(3)
Improve level of infrastructure construction and basic public services
Table 3. Coordinated development index system of urbanization.
Population Urbanization (U1)Economic Urbanization (U3)
Population Structure (u11)Population urbanization rate (%) (u111)Economic structure (u32)General public budget revenue (100 million yuan) (u323)
Urban population density (persons/km2) (u112)General public budget expenditure (100 million yuan) (u324)
Employment Level (u12)Proportion of employees in secondary and tertiary industry (%) (u121)Economic extraversion (u33)Number of foreign investment projects utilizing contracts (u331)
Employment number of urban units (10,000 persons) (u122)Actual utilization of foreign direct investment (10,000 dollars) (u332)
Registered urban unemployment rate (%) (u123)Proportion of total exports to regional GDP (%) (u333)
Living Standard (u13)Per capita disposable income of urban residents (yuan) (u131)Ecological Urbanization (U4)
Per capita consumption expenditure of urban residents (yuan) (u132)Ecological quality (u41)Green coverage rate of built-up areas (%) (u411)
Engel coefficient of urban residents (%) (u133)Parks and green areas (hm2) (u412)
Urban residential area (km2) (u134)Ecological pressure (u42)Emissions of industrial sulfur dioxide (t) (u421)
Population Quality (u14)Proportion of education expenditure to general public budget expenditure (%) (u141)Emissions of industrial smoke and dust (t) (u422)
Proportion of scientific expenditure to general public budget expenditure (%) (u142)Emissions of industrial wastewater (wt) (u423)
Number of students in institutions of higher learning (persons) (u143)GDP energy consumption (tons of standard coal/10,000 yuan) (u424)
Land Urbanization (U2)GDP electricity consumption (kWh/10,000 yuan) (u425)
Land
Structure (u21)
Urban construction land area (km2) (u211)Ecological management (u43)Comprehensive utilization rate of solid waste (%) (u431)
Urban built-up area (u212)Harmless treatment rate of domestic waste (%) (u432)
Land
Input (u22)
Land-average fixed assets investment (10,000 yuan/km2) (u221)Sewage treatment rate (%) (u433)
Land-average number of employees in secondary and tertiary industries (persons/km2) (u222)Social Urbanization (U5)
Land-average general public budget expenditure (10,000 yuan/km2) (u223)Common facilities (u51)Urban road area (10,000 m2) (u511)
Land
Output (u23)
Land-average second and third output value (10,000 yuan/km2) (u231)Length of urban drainage pipeline (km) (u512)
Land-average general public budget income (10,000 yuan/km2) (u232)Number of beds in medical and health institutions (u513)
Economic urbanization (U3)Total number of books in public libraries (10,000 books) (u514)
Economic Development (u31)GDP (100 million yuan) (u311)Social
services (u52)
Expenditure on urban maintenance (10,000 yuan) (u521)
GDP growth rate (%) (u312)Number of taxi operations (vehicles) (u522)
Per capita GDP (yuan) (u313)Number of operational buses and trams (vehicles) (u523)
Total retail sales of consumer goods (100 million yuan) (u314)Social
security (u53)
Number of participants receiving basic endowment insurance (person)(u531)
Economic Structure (u32)Secondary and tertiary industry output values as proportion of GDP (%) (u321)Number of participants receiving basic medical insurance (persons) (u532)
Contribution rate of secondary and tertiary industries (%) (u322)Number of participants receiving unemployment insurance (persons) (u533)
Table 4. Index weight of urbanization system.
SchemedCategorydIndexEDWSubSystemDCategoryDIndexEDW
U10.2118u110.0317u1110.94180.05820.0108U30.2392u320.0781u3230.82760.17240.0319
u1120.88730.11270.0209u3240.83720.16280.0302
u120.0469u1210.97820.02180.0040u330.0848u3310.79750.20250.0375
u1220.79820.20180.0374u3320.83040.16960.0314
u1230.97020.02980.0055u3330.91440.08560.0159
u130.0762u1310.89190.10810.0200U40.0799u410.0395u4110.92440.07560.0140
u1320.89700.10300.0191u4120.86260.13740.0255
u1330.92790.07210.0133u420.0251u4210.97170.02830.0053
u1340.87180.12820.0237u4220.97680.02320.0043
u140.0570u1410.89010.10990.0204u4230.96660.03340.0062
u1420.92400.07600.0141u4240.97920.02080.0039
u1430.87800.12200.0226u4250.97030.02970.0055
U20.1895u210.0522u2110.85330.14670.0272u430.0154u4310.97390.02610.0048
u2120.86470.13530.0251u4320.97600.02400.0044
u220.0812u2210.87700.12300.0228u4330.96710.03290.0061
u2220.84670.15330.0284U50.2795u510.1095u5110.88070.11930.0221
u2230.83790.16210.0300u5120.83350.16650.0308
u230.0561u2310.86300.13700.0254u5130.85920.14080.0261
u2320.83430.16570.0307u5140.83560.16440.0305
U30.2392u310.0762u3110.84880.15120.0280u520.0827u5210.79390.20610.0382
u3120.97440.02560.0047u5220.88240.11760.0218
u3130.91040.08960.0166u5230.87740.12260.0227
u3140.85480.14520.0269u530.0874u5310.84390.15610.0289
u320.0781u3210.93730.06270.0116u5320.84440.15560.0288
u3220.97620.02380.0044u5330.84020.15980.0296
Table 5. Measurement results of coupling coordination degree of urbanization in Beijing–Tianjin–Hebei region in 2017.
RegionU1U2U3U4U5TR(T)DR(D)
Beijing0.16990.18080.23550.07040.26080.183510.62141
Tianjin0.10760.13200.15760.04140.17630.123020.50692
Shijiazhuang0.07820.06940.05720.04810.05290.061230.36683
Tangshan0.06740.05660.06350.03870.04930.055140.34804
Qinhuangdao0.04290.03200.05060.03940.03660.040370.29847
Handan0.05820.02710.04550.04460.04540.044260.31046
Xingtai0.04410.02340.03610.04110.03420.0358120.280112
Baoding0.04950.02610.03600.03940.04190.0386100.29099
Zhangjiakou0.05680.02040.03200.04350.03330.0372110.281111
Chengde0.03370.02020.03380.04170.02920.0317130.263213
Cangzhou0.04420.02510.05290.04290.03360.039780.29398
Langfang0.05960.03970.05950.04520.03240.047350.32105
Hengshui0.06220.02170.04830.03540.02840.039290.286710
Table 6. Classification of coupling coordination degree.
Coupling Coordination LevelCoupling Coordination Degree
High-level coupling coordination0.3669–0.6214
Coupling coordination0.3211–0.3668
Reluctant coupling coordination0.2985–0.3210
Endangered disorder level0.2633–0.2984
Disorder level0–0.2632
Publisher’s Note: MDPI stays neutral with regard to jurisdictional claims in published maps and institutional affiliations.

