Article

Investigating the Relationship between Public Satisfaction and Public Environmental Participation during Government Treatment of Urban Malodorous Black River in China

1
School of Civil Engineering, Sanjiang University, Nanjing 210012, China
2
Water Bureau of Wujiang District, 1000 Kaiping Road, Suzhou 215200, China
3
Hongteng Construction Group Co., Ltd., No. 59-4 Gujiaying Road, Nanjing 210014, China
4
XJTLU-Urban and Environmental Studies University Research Centre, Xi’an Jiaotong-Liverpool University, Suzhou 215200, China
5
Department of Civil Engineering, Xi’an Jiaotong-Liverpool University, Suzhou 215123, China
*
Author to whom correspondence should be addressed.
Sustainability 2021, 13(6), 3584; https://0-doi-org.brum.beds.ac.uk/10.3390/su13063584
Submission received: 4 January 2021 / Revised: 9 March 2021 / Accepted: 11 March 2021 / Published: 23 March 2021
(This article belongs to the Collection Sustainability of Water Environment)

Abstract

:
During China’s rapid economic development and urbanization, numerous cases of urban malodorous black river (MBR) have occurred. MBR refers to a polluted urban river that smells bad, is almost black in color, has no aquatic plants or animals, and that consequently causes many social and environmental problems. The Chinese government has sought public participation during the whole process of MBR treatment as part of a comprehensive action plan to improve residents’ satisfaction with their environment. To investigate the influencing factors of public participation and satisfaction, a questionnaire survey was conducted among residential communities close to an MBR. SPSS 22.0 was employed to conduct an analysis of the collected data, using factor analysis, correlation analysis, and linear regression analysis. The results indicate that there is a direct relationship between public satisfaction and the factors of government treatment, public perception and public participation behaviors, such as engagement behavior, supervision behavior, health influence, and compensation measures.

1. Introduction

With China’s rapid social and economic development, large numbers of people migrate from rural to urban areas every year seeking a better life. The urbanization rate reached over 60% in 2019 from 10.64% in 1949 [1,2], which has caused increasingly severe urban environmental problems. One such problem is the urban ecological issue of malodorous black river (MBR), which refers to polluted urban rivers that smell bad, are almost black in color, and that have no aquatic plants or animals [3,4,5]. The cause of MBR is insufficient dissolved oxygen in the water, which overwhelms many of the aquatic plants and animals, and anaerobic bacteria then breaks down organic material in the water into smelly black compounds [6]. This is compounded by the fact that the quantity and quality of urban water disposal facilities have not kept pace with the urban population increase resulting in large amounts of wastewater being disposed of in urban rivers every year. According to an investigation conducted by China’s Ministry of Housing and Urban-Rural Development (MOHURD) in 2016, there were 2026 urban MBRs in 220 of China’s cities [
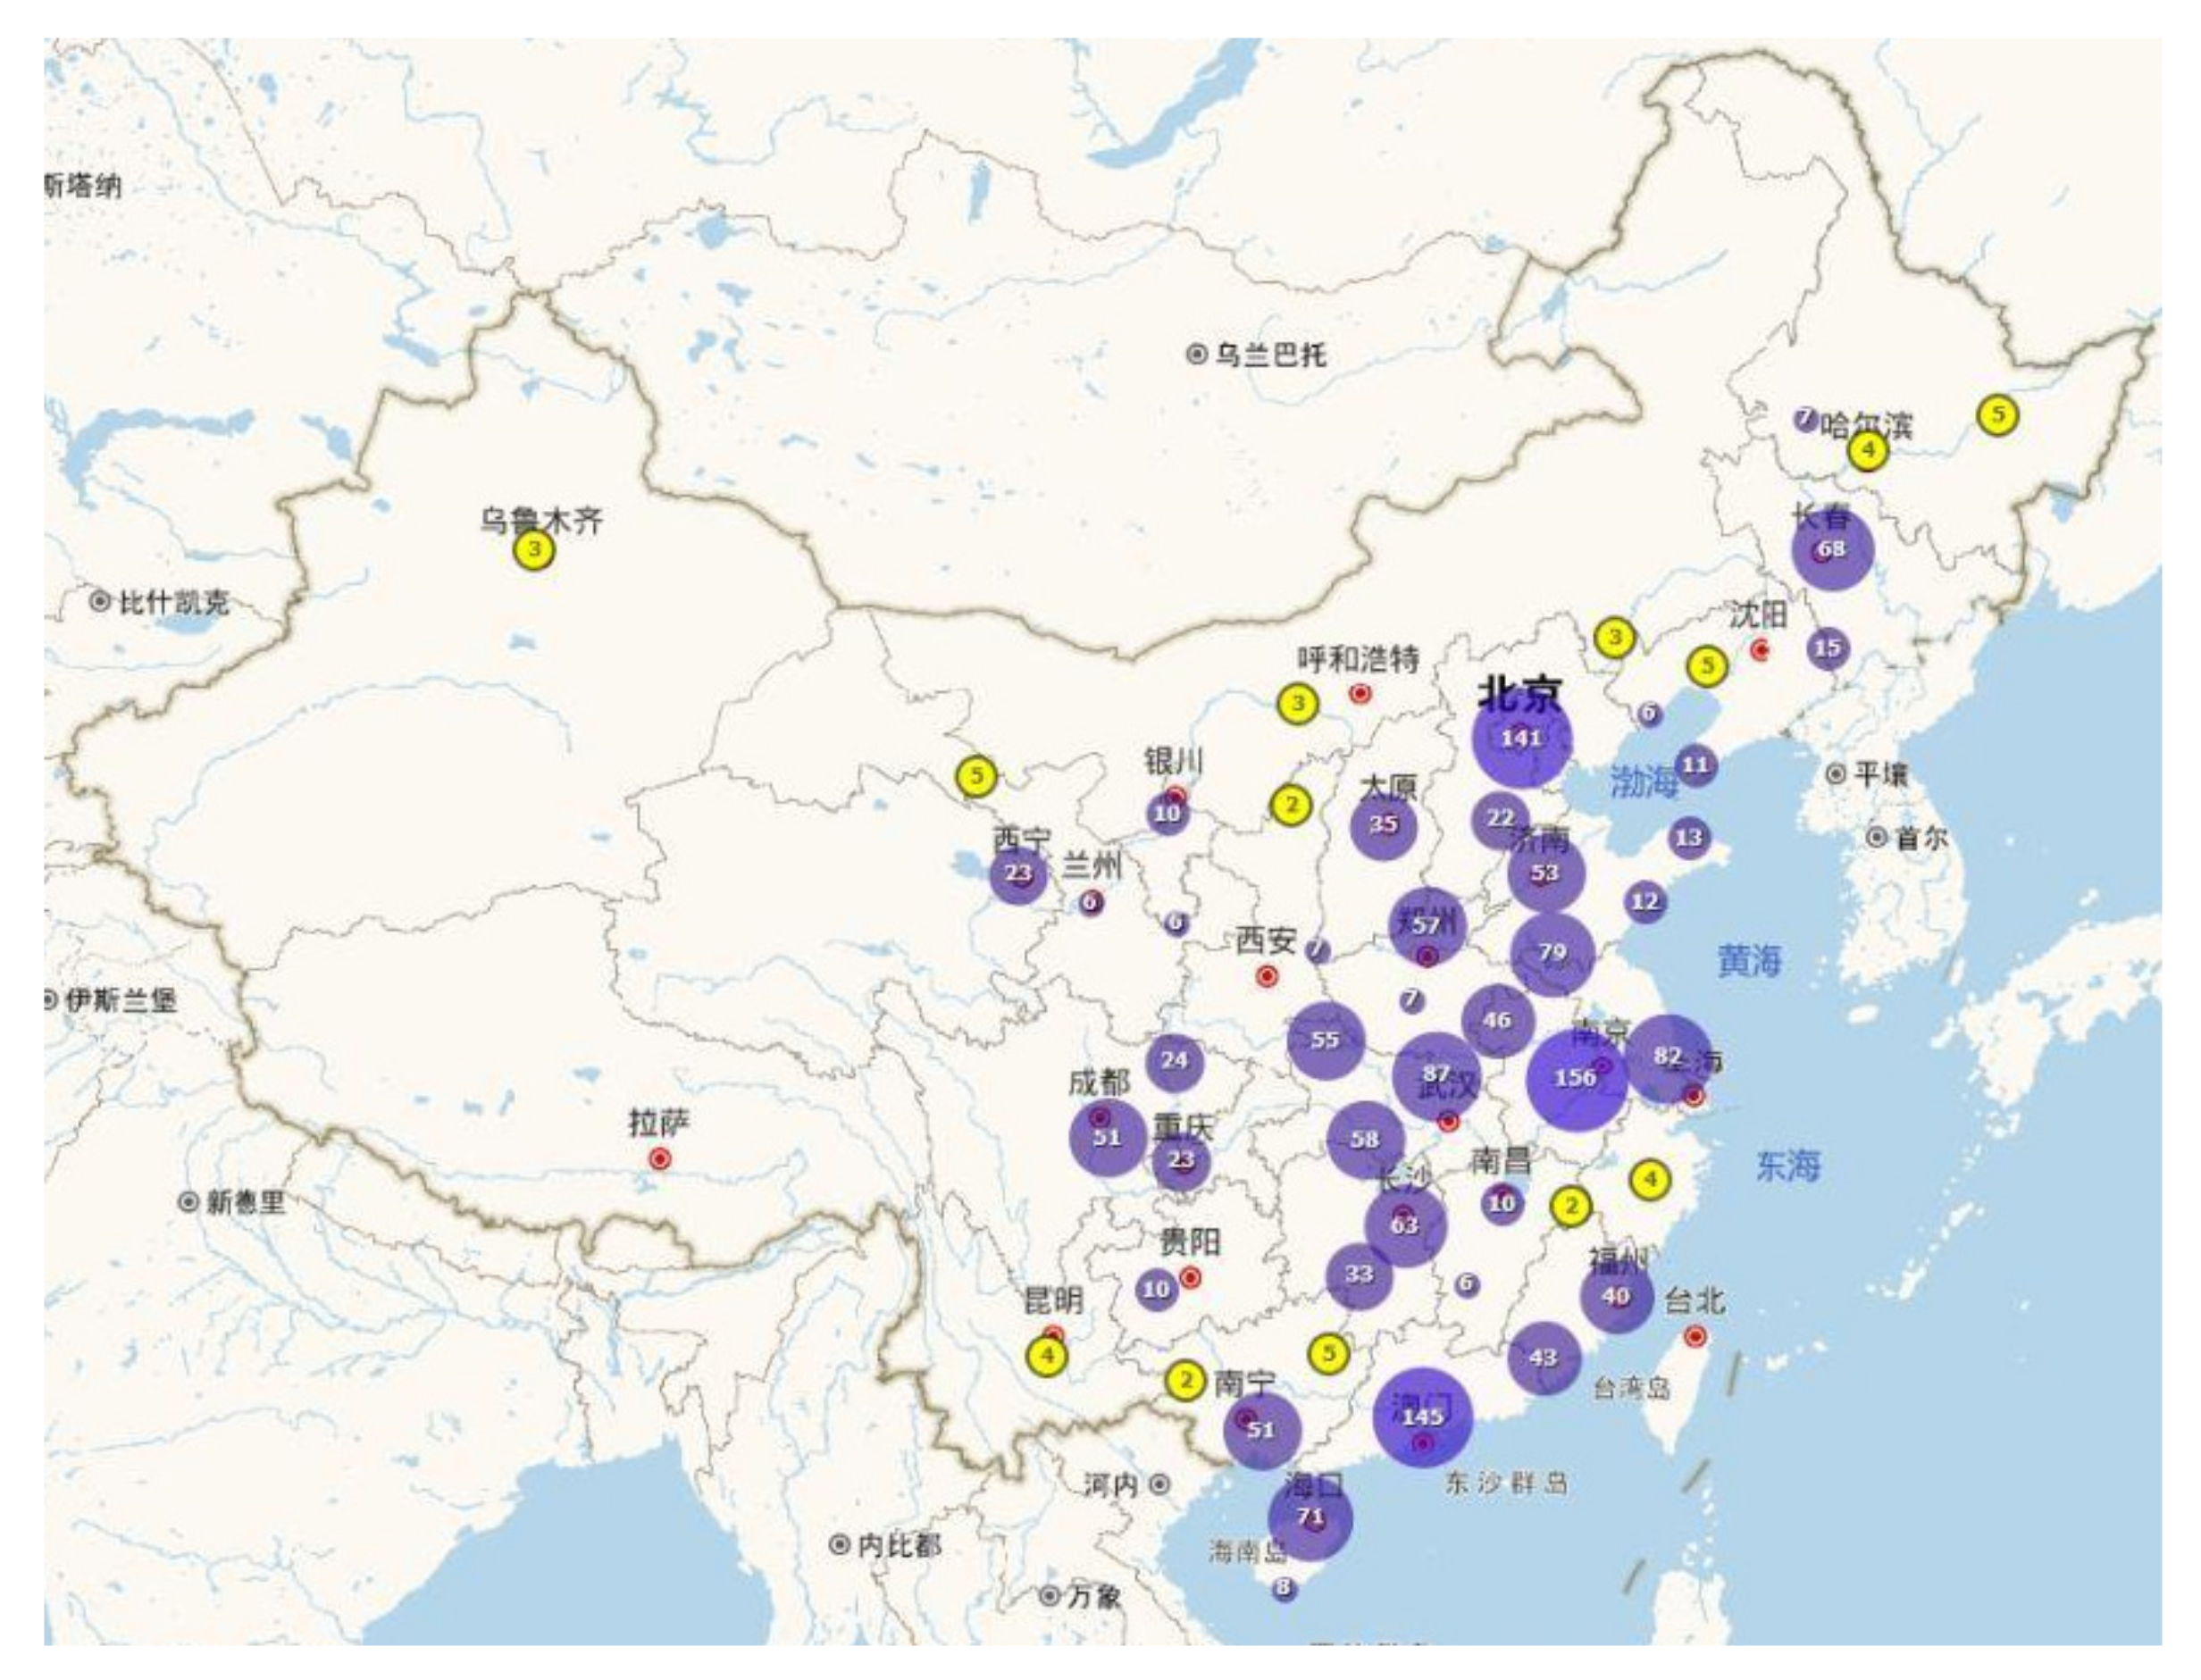
7]; Figure 1 shows examples of urban MBRs in China. These MBRs have many negative influences, including (1) seriously affecting the everyday life of residents; (2) causing health problems by affecting urban drinking water sources; and (3) affecting the quality and image of the municipal service department. Urban rivers play an important role in urban development and so MBRs bring many hazards to the environment and society. The polluted water without appropriate treatment will further contribute to an increased contamination risk along the coast [8]. Given the severe consequences of MBRs, the problem and the treatment of MBRs is attracting greater public attention through television, social media, newspapers, and online resources.
To improve MBRs and redress the ecological imbalance within them, the Chinese State Council issued the “Action Plan for Preventing and Controlling Water Pollution” in 2015 [9]. This “Action Plan” encouraged public participation and welcomed public supervision and appraisal during the process of treating MBRs. In the same year, several policies were issued by ministries of the central government to deal with the MBRs: the State Council issued the policy of “Guidance on promoting the construction of the cavernous city” [10]; the Ministry of Water Resources issued the policy of “the detailed implementation guidelines of accelerating the construction of river treatment project” and the Ministry of Finance and the Ministry of Environmental Protection co-issued the policy of “Suggestions on the implementation of promoting the government and the social capital cooperation in the field of water pollution control” [11,12]. According to the “guideline for the treatment of urban MBRs” co-issued by MOHURD and the Ministry of Ecology and Protection (MEP), the proportion of MBRs in cities’ urban water bodies at or above the prefecture level should be under 10% by 2020 and eliminated in metropolitan areas by 2030 [13]. Consequently, MBRs in many places have significantly improved. By 2019, MBR treatment in Jiangsu Province reached 97.9% [14], and Suzhou city in Jiangsu Province was reported to have eliminated MBRs by the end of 2020 [15]. These facts reflect government efforts to control MBRs. However, the MBR problem will not be easily solved without public participation, since the major source of MBRs is urban household waste and wastewater. To this end, there is a specific section on MOHURD’s website that provides information on the latest local MBR treatment in order to allow for public participation. In addition, one of the most critical evaluation criteria of the government’s treatment measures lies in public satisfaction. However, there are limited studies on public environmental participation and public satisfaction with the government’s treatment of the MBR problem [16]. This study was therefore conducted to investigate the relationship between government treatment, public satisfaction, public participation, and public perception of the MBR problem.
This paper comprises seven sections. The first section introduces the current situation of MBRs in China and the necessity for this study. The second section provides a literature review regarding MBRs, while the third section describes the research methodology, including questionnaire design, survey sampling, process design, and data analysis techniques. Data analysis results are presented in section four, including factor analysis, correlation analysis, and regression analysis. The fifth section explains the study’s findings, while the sixth section discusses the limitations of this study. The seventh section covers a summary, practical implications of the study, and suggestions for further related research.

2. Literature Review

During the process of economic development in each country, environmental pollution problems inevitably occur. MBRs often occur during urbanization when the government pays more attention to the economy and society than to the environment. According to Wen et al. (2018), there are three main causes of urban MBRs: (1) domestic sewage, which mostly exists in the rivers running through the residential communities and food markets; (2) industrial wastewater, which frequently occurs in the rivers near chemical plants and construction sites, and (3) blocked rivers where the water does not flow [17]. They are nothing new and have even occurred in developed countries such as the Cheonggyecheon Stream in Seoul, South Korea, and the Thames River in London, UK [18,19,20]. MBRs bring many health risks to the residents around them, such as Itai-Itai disease and Minamata disease that appeared in some MBRs in Japan [21,22]. These rivers are now much better after effective improvement measures were taken by local government with the participation of residents. Public participation plays a vital role in preventing water pollution. There are many types of public participation, including monitoring, compliance, and engagement [23,24,25]. The vernacular press was found in India to have a pronounced effect on water pollution as an informal regulation [26]. Evidence from the US shows that private citizen monitoring contributes to environmental compliance and wastewater treatment [27]. Community pressure was found in Brazil to significantly impact the environmental performance of polluters [28]. Public participation aroused by public initiatives and enthusiasm helps to avoid the drawbacks of traditional government enforcement and improves the efficiency and effectiveness of environmental treatment by cooperating with the government. Research has revealed that compliance behavior improvement is more beneficial to pollution treatment and environmental protection [23]. Although the government has enacted many laws and regulations to protect the environment and control pollution behavior, the practical effect is far too ideal even in the hazardous medical waste industry [29]. One reason for this is that these regulations lack efficient supervision and depend to a considerable extent on the willingness of individuals to comply with them.
One of the premises of public participation lies in public perception, which means that people are aware of water pollution and perceive it as a severe threat to them. Evidence shows that public environmental awareness contributes to the government’s treatment of pollution problems [30]. The public normally pays little attention to pollution problems when they do not affect their interests or health. However, if pollution negatively affects property prices or causes illness, as may happen if there is a MBR nearby, the public’s coping behavior will be aroused. According to the fight or flight theory [31], if a person’s interest or health is negatively affected by pollution, they will either move out, complain, protest [32,33,34], or they may participate in environmental protection [35]. To improve public participation effectiveness, qualified environmental education and public awareness campaigns are quite helpful, as they can provide essential knowledge regarding environmental and social issues [36]. According to Wang (2007), public environmental participation behavior is positively correlated to age, income, environmental protection knowledge, and environmental protection habit [37]. Public participation behavior can be improved by raising the public perception of the importance of environmental protection through education and training [29]. In addition, social and communications media can also contribute to publicity about pollution issues and environmental actions for the public.
Public satisfaction with government treatment (GT) influences their participation behavior. According to [38], the level of GT and public participation positively impact public satisfaction. Many scholars claim that public participation can play a significant role in MBR treatment. Public satisfaction is viewed as a crucial criterion of MBR treatment’s success: the success of the MBR treatment depends on whether the quality of the urban river after improvement satisfies over 90% of the nearby people [10]. This indicates the importance of public satisfaction during the process of pollution improvement.
Government’s involvement with the treatment of polluted water, such as MBR, significantly affects environmental protection due to its powers of enforcement and administrative role in society and industry. It can make laws to regulate polluters’ behavior and introduce advanced technology for MBR improvement. Water charges may be an effective tool for inducing factories to invest in water reuse and to reduce water demand [39]. The government can also help those affected by MBRs by collaborating with Non-government organizations (NGOs) and other non-profit organizations [40]. Economic and psychological compensation from the government and other organizations help comfort residents, which is conducive to social harmony. Modern communications media, including websites, TV, and newspapers, are suggested as means to provide timely information on MBR treatment and maintain communication between the government and the public [41]. This is important because one of the reasons that public perception of environmental pollution is subjective rather than objective is due to the lack of reliable information [42]. Adequate information regarding environmental issues helps protect and promote the public’s right to know, participate, and supervise urban environmental protection. Government regulations relating to environmental pollution can effectively limit pollution by enforcement and penalization [43]. Public environmental participation will also be encouraged if the government carefully enacts regulations and deals efficiently and effectively with complaints about environmental issues [23,44]. Hence, sufficient laws and regulations need to be enacted and strictly enforced.

3. Methodology

This paper investigates public satisfaction with the treatment of MBR and its influence on public participation behavior.

3.1. Questionnaire

A questionnaire was designed based on a review of relevant literature. The questionnaire had three parts: The first part was designed to collect respondents’ demographic information including age, gender, education level, and the distance between the MBR and the respondents’ residence. The second part was designed to illicit the respondents’ overall impression of MBRs. The third part of the questionnaire involved public satisfaction, government treatment, public environmental participation behavior, and public perception of MBRs. A five-point Likert scale was used with respondents invited to share their perceptions of each question using 1 to indicate strongly disagree/unsatisfied, through to 5 to indicate strongly agree/satisfied [45,46]. There was a total of thirty-nine questions in the questionnaire.

3.2. Survey

The survey was conducted in Nanjing city, located on the Yangtze River’s lower reaches and having many urban area rivers. By 2019, the total population of Nanjing was 8.5 million and the urban population was 7.07 million [47]. The green space rate of the Nanjing urban built-up area is nearly 41% and the per capita park green area is about 15.55 square meters [48]. The water area of Nanjing covers more than 11% of the city and includes Qinhuai River, Jinchuan River, Xuanwu Lake, Mochou Lake, Baijia Lake, Shijiu Lake, Gucheng Lake, Jinniu Lake, and other large and small rivers and lakes. The Yangtze River crosses the city, and the total length of its shoreline is nearly 200 km. There are 120 large and small rivers in the territory, including the Yangtze River, Qingyi-Shuiyang River, Chuhe River, Qinhuai River, Gucheng Lake, and Shijiu Lake. The water systems are divided by river basins that crisscross provinces and cities. There were about 156 MBRs in Nanjing before the government took steps to improve the water quality [49].
The stratified random sampling method was used to select a representative sample for this research [50]. The respondents were selected using the following criteria: (1) they had to live in a residential community near a MBR or a river that was a MBR before; or (2) they were residents near a river that had been improved or was being improved by the government. The questionnaire survey was conducted in residential communities along the Yueyahu from the Qinhuai area, Chuhe from the Liuhe area, and Qinhuaihe from the Yuhuatai area, as shown in Figure 2. Since there are four seasons in Nanjing and the problems of MBR mostly occur in summer, the questionnaire survey was performed from April to July in 2018. To ensure that all the respondents were qualified and understood the questions, trained investigators went to the residential communities near MBRs and invited residents one by one to share their perceptions of each question on the questionnaire; where necessary, questions and queries were patiently explained during the process of helping respondents to complete the questionnaire. Most of the questionnaires were printed and distributed in the residential communities. However, respondents who were unable to complete the questionnaire at the time were invited to complete it online via Wenjuanxing (a popular questionnaire investigation website in China).

3.3. Data Analysis

SPSS 22.0 was employed to analyze the collected data from the questionnaire survey; factor analysis, correlation analysis, and regression analysis were conducted. Of the 500 distributed questionnaires, 152 valid ones were returned, which produced a response rate of 30.4%. Among the four age groups of respondents, the first age group (21–30 years old) accounted for the most significant proportion of respondents at 32.2%, which was followed by the second age group (31–40 years old) with a percentage of 30.9%. The third age group (41–50 years old) and the fourth age group (51–60 years old) were 23.0% and 7.2%, respectively. The fifth age group (≥61 years old) accounted for 6.6% of respondents. Detailed information of the respondents is shown in Table 1.

4. Results

4.1. Descriptive Statistical Analysis

To learn the public perception of MBR, six questions were designed with a choice of several different response statements for each, which are summarized in Table 2. Analysis of the responses showed that 63.2% (96) of respondents worked or lived around 1 to 2 km from an MBR. In terms of MBR’s seasonal impact, 96.1% (146) of respondents reported that MBR impacts them most in the summer months. Over half of the respondents (77 responses, 50.7%) thought urban pollution is the main cause of MBR, followed by industrial pollution (53 replies, 34.9%). Solid waste floating on the surface of the water, and a pungent smell as the main characteristic that most accurately describes MBR, accounted for 49.3% and 42.8% of responses, respectively. Most of the respondents (78 replies, 51.3%) pointed out that the most crucial consequence of MBR is that it can pollute the drinking water and pose a health risk to the public.

4.2. Factor Analysis

Factor analysis was conducted to reduce items into some distinct variables using statistical analysis. The principal component method was adopted to extract the factors and the eigenvalue should be over 1 [51]. Varimax rotation was used to obtain a clear association between the variables and the factors [52]. The value of factor loading should be equal to or larger than 0.6 [53]. The Kaiser–Meyer–Olkin (KMO) measure was used to test if the data were applicable for factor analysis and the KMO value should be larger than 0.8 [54]. The threshold of Cronbach’s Alpha is 0.6, which means the variable is reliable to represent a set of items [55]. A total of ten factors were finally extracted from thirty-three questions in this study, including three factors of public perception, three factors of government’s treatment, three factors of public participation behavior and public satisfaction. The process of factor analysis is as follows.
According to the factor analysis, nine items of the public perception (PP) on MBR treatment were generally loaded into three predicted factors, accounting for 79.32% of the total variance. The three factors were public awareness (P1), interest influence (P2), and health influence (P3), as shown in Table 3. All the factor loadings are larger than 0.6 and the KMO value is 0.945 in this factor analysis, which is acceptable. The Cronbach’s Alpha for variables P1, P2, and P3 were then examined by reliability analysis and the values are 0.902, 0.770, and 0.718, respectively, which at more than 0.7 indicates high reliability.
Ten items of the government’s treatment (GT) of MBR were loaded into three predicted factors, accounting for 63.78% of the total variance. The three factors are compensation measures (G1), improvement measures (G2), and regulating measures (G3) as shown in Table 4. All the factor loadings are larger than 0.6 and the KMO value is 0.900, which is acceptable. The Cronbach Alpha for variables G1, G2, and G3 are 0.870, 0.876, and 0.821, respectively. Since the values are higher than 0.7, they are considered highly reliable.
Three factors were identified from eleven items of the public participation behavior (PPB) in the factor analysis, accounting for 70.897 percent of the total variance. The three identified factors were engagement behavior (E1), supervision behavior (E2), and compliance behavior (E3), as shown in Table 5. All the factor loadings are larger than 0.6 and the KMO value is 0.812, which is acceptable. The Cronbach’s Alpha for variables E1, E2, and E3 are 0.921, 0.764, and 0.909, respectively, which at more than 0.7 indicates good internal consistency. The factor of public satisfaction is composed of three items with acceptable reliability, which is 0.641, as shown in Table 6.

4.3. Correlation Analysis

Bivariate correlation analysis was applied to evaluate the association’s strength between two continuous variables, and the Pearson correlation coefficient was adopted as the threshold [56]. The results of the correlation analysis, as shown in Table 7, indicate that a significant relationship can be established between public satisfaction (PS), public participation behavior (PPB), government’s treatment (GT), and public perception (PP) regarding MBR. Public satisfaction is positively and significantly correlated with supervision behavior (B2: 0.317), health influence (P2: 0.321), compensation measures (G1: 0.305), and improvement measures (G2: 0.370). Engagement behavior is shown to have a positive correlation with compliance behavior (G2: 0.370), public awareness (G2: 0.370), interest influence (G2: 0.370), health influence (G2: 0.370), and regulating measures (G2: 0.370). Likewise, supervision behavior has correlations with compliance behavior (B3: 0.507) and improvement measures (G2: 0.287). Finally, compliance behavior positively correlates to engagement behavior (B1: 0.338) and supervision behavior (B2: 0.507).

4.4. Multiple Linear Regression Analysis

Multiple linear regression analysis (MLRA) was conducted to explore the causal relationship between public satisfaction (PS), public participation behavior (PPB), government’s treatment, and public perception on MBR treatment [57]. The stepwise method was used in the MLRA, and several essential parameters were adopted to ensure the reliability of the regression model, including p-value, variance inflation factor (VIF), and R2 [58,59,60]. Four models were finally identified, as summarized in Table 8. All the factors p-value (significant) and VIF (less than 10) value were acceptable [61], indicating the positive qualification of the four models.
Model I reveals that public satisfaction (PS) is positively associated with compensation measures (G1), supervision behavior (B2), and compliance behavior (B3), while negatively associated with health influence (P3), accounting for 23.2% of the variance. In Model II, engagement behavior (B1) is positively predicted by supervision behavior (B2), compliance behavior (B3), and interest influence (P2), explaining 38.8% of the variance. Supervision behavior (B2) is found in Model III to be positively associated with improvement measures (G2) and negatively predicted by compensation measures (G1), with 7.4% of the variance. Model IV reveals that compliance behavior (B3) is positively predicted by regulating measure (G3), engagement behavior (B1), and interest influence (P2), explaining 37.6% of the variance.

5. Discussion

As summarized in Table 9, results of the data analysis provide crucial findings of the public perception (PP) of MBR and also reveal several important factors influencing public satisfaction (PS) and public participation behavior (PPB).

5.1. Factors Influencing Public Satisfaction

Supervision behavior (B2), health influence (P3), and compensation measures (G1) are revealed in both correlation and regression analysis to have a positive correlation with public satisfaction. In the last five years, the central and local governments paid more attention to water pollution and carefully dealt with complaints and encouraged responsible behaviors among the public. This has led to improvement of the water quality, and hence to public satisfaction with the positive changes of MBR, especially since they feel as though they participated in the whole process of MBR treatment. Residents living near an MBR are influenced by it in respect of the malodor, polluted drinking water, and even health problems caused by mosquitos [62]. The shorter the distance between the residence and the MBR, the severer the influence on the residents. The influence of pollution has been shown to negatively correlate to residents’ happiness [63]. This means that the residents influenced by MBR pay more attention to this polluted water and will personally experience the MBR improvement after government treatment. Accordingly, they will feel more satisfied with the positive change than those who are not influenced by MBR. It is therefore not surprising that a positive relationship was revealed during correlation analysis between the government’s improvement measures (G2) and public satisfaction (PS). After all, fresh air and a clean environment are better than malodorous and a filthy environment. Complaints and dissatisfaction are common reactions for those living near a MBR due to its severe negative influence. Residents expect the government to pay attention to their suffering and improve MBR. They will feel better when the government takes measures to show solicitude for the residents by means of economical, ecological or psychological compensation.

5.2. Factors Impacting Public Engagement Behavior

Public engagement behavior is positively associated with interest influence (P2) and regulating measures (G3). When an urban river becomes malodorous and black, no one wants to live or work nearby. Residential property values near a MBR lack competitiveness compared to the places far away, and there are many inconveniences for residents’ daily lives [64]. Residents suffering interest loss caused by MBR will fully understand the consequences of water pollution and the importance of environmental protection. They believe that their efforts can help solve environmental problems and enjoy being part of collective efforts [65]. They tend to take green behavior more seriously during their daily life, like separating and recycling waste for example. Interestingly, the government is regulating measures that can trigger public engagement behavior. By taking regulatory measures such as enforcing industries to adopt high-quality sewage systems and environmental technology, the government can determine MBR treatment and publicize the importance of environmental protection. Accordingly, residents are encouraged to participate in environmental protection and conduct environmental engagement behavior. Public awareness is revealed to significantly and positively correlate with engagement behavior. Individual’s environmental awareness influences green practice attitudes [25,66]. Normally, the stronger the public awareness is, the more likely they will be to participate in environmental protection. One study confirmed that local environmental pollution awareness easily stimulates residents’ environmental engagement behavior [67]. Hence, residents who have an awareness of MBR tend to engage in participation behavior to avoid the severe consequences of the pollution.

5.3. Factors Impacting Public Supervision Behavior

Public supervision behavior is positively triggered by improvement measures (G2) and negatively triggered by compensation measures (G1). When the quality of river water deteriorates due to pollution, nearby residents will firstly experience the ill effects, including smelly air and more pests. Normally, the worse the environmental pollution, the stronger the public support for environmental protection [68,69]. To improve MBR, the government needs to take effective measures, including raising public environmental awareness, encouraging public supervision, and enacting laws and regulations. Accordingly, the residents suffering from MBR are easily inspired to take any chance to request the government to improve nearby MBRs. When the Chinese central government planned to improve MBR nationwide, it built a specific website (i.e., http://www.hcstzz.com/, accessed on 19 December 2020) and a WeChat program (i.e., http://www.hcstzz.com/WxWeb/WeChatReport/Login.html, accessed on 19 December 2020) to release MBR treatment information to the public and encouraged public participation and supervision. Public supervision behavior is significantly motivated by the government’s treatment. According to the MOHURD and MEE (Ministry of Ecology and Environment, 2020), 13,761 supervisory tip-offs regarding MBR have been received since 2016, indicating a high enthusiasm for supervision from the public [70].
Surprisingly, government compensation measures are negatively associated with public supervision behavior. This may be due to inconsistency with public expectation of MBR treatment. Residents suffering from the influence of a MBR might desperately want the MBR to be improved as soon as possible. When the government takes compensation measures to deal with the MBR problems, the surrounding residents may feel better since the government is at least showing its concern. However, compared to practical measures, compensation does nothing to restore the MBR and can hardly motivate public participation in supervision. Evidence shows that local government’s nonfeasance in dealing with public complaints will dampen the residents’ supervision initiatives [71]. Therefore, public supervision behavior will decrease since they think this behavior is of no use.

5.4. Factors Impacting Public Compliance Behavior

Public compliance behavior is positively associated with engagement behavior (B1) and supervision behavior (B2). When people actively engage in pro-environmental actions, they show much more commitment and enthusiasm for environmental protection. Higher commitment to environmental protection was found to predict more involvement in actual behavior [72]. Hence, they will comply with environmental regulations and participate in environmental protection activities. When people actively adopt supervisory behavior, they will not just correct the inappropriate actions of other people and consider themselves as exceptions. According to Confucianism, self-regulation goes first before correcting the behavior of others [73]. Chinese people usually act themselves first before asking others to do it. Thus, people will proactively comply with the laws and regulations before they adopt supervision behavior. Furthermore, compliance behavior was found during the statistical analysis to be associated with public perception of interest influence (P2) including living conditions and housing price. Owning property is one of the most valuable assets for citizens in China and housing prices can be negatively influenced by water pollution [74]. When the residents realize that the MBR significantly influences their interest including housing price, they will take action to eliminate the negative influence of the MBR, including proactive compliance behavior.

6. Limitations

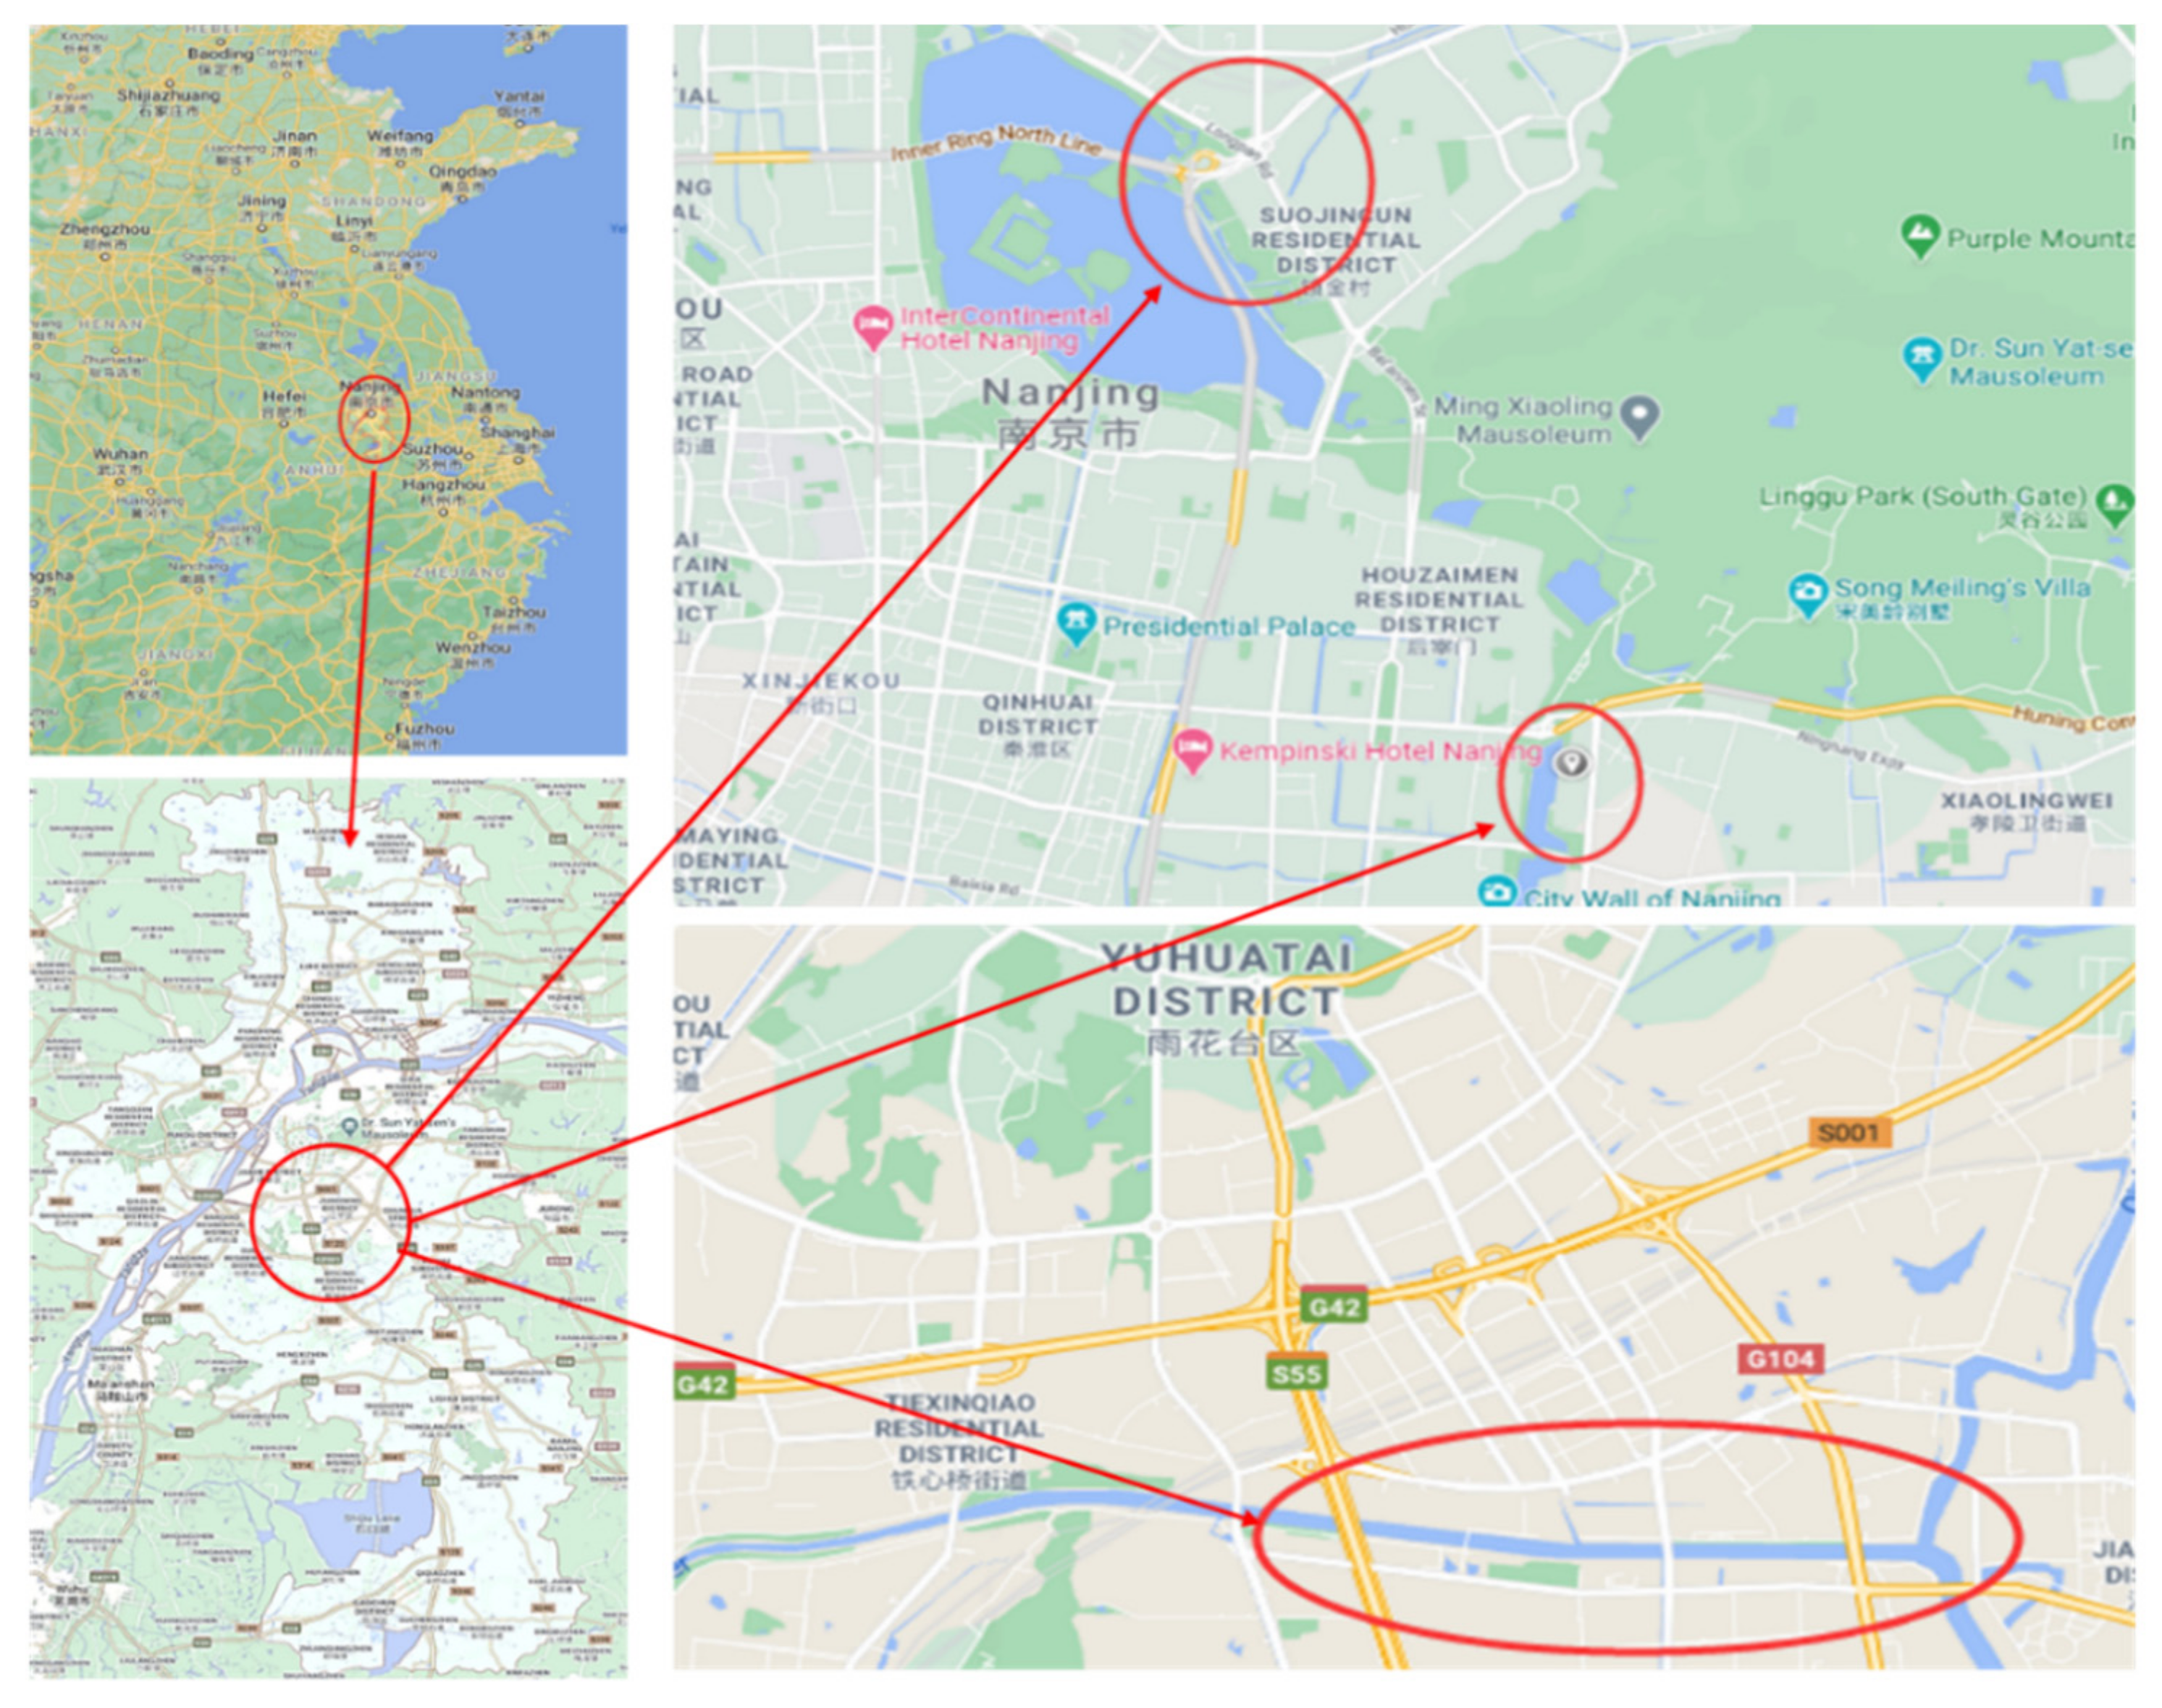
Despite the important findings revealed in this study, the relatively small sample size may limit generalizability and representativeness of the results. However, several factors have been considered in advance to reduce the impact of this limitation: (1) all scales used in the measurement of public satisfaction, government treatment, public perception and public participation behaviors were adopted based on an extensive literature review; (2) the respondents were purposefully selected to capture the diversity of the residents along the MBRs (e.g., gender, ages, years of residency); and (3) all respondents were selected from residential communities along different MBRs in the main urban area of Nanjing.
The public’s perception of the government’s treatment was adopted in this study, which is the perceived treatment rather than the actions the government actually took. How to measure the government’s actions remains unclear for several reasons, such as coverage by the media of government actions [75], and the effect of the actions and the expectation of the citizens [76]. Generally, citizens will not proactively search and evaluate the actions of the government even if their interests are significantly influenced. When the actions on MBR the government took are sound and effective, the residents nearby will sense the obvious changes, such as the smell and color of the MBR. In fact, studies on government actions usually use the “perceived” expression. For example, Wang (2010) studied the relationship between public satisfaction and perceived government performance [77]. A questionnaire survey was employed in this study. Although the questionnaire was designed based on a review of the relevant literature, the findings may not be as strong as they could be due to the method itself, including the length of the questionnaire, response rate, and limited control over the respondents [78].

7. Conclusions

This study investigated the relationship between publication satisfaction, public environmental participation behaviors, public awareness, and the government’s treatment of MBR. A questionnaire was designed based on a review of the relevant literature. A questionnaire survey was conducted in Nanjing, Jiangsu Province, China, and SPSS 22.0 was adopted to analyze the data. Results from correlation and regression analysis reveal that: (1) public satisfaction is positively predicted by supervision behavior, health influence, and compensation measures; (2) public environmental engagement behavior is positively triggered by compliance behavior and vice versa; (3) public environmental engagement behavior is positively triggered by regulating behavior and interest influence; (4) public supervision behavior is positively associated with improvement measures; and (5) public compliance behavior is positively predicted by supervision behavior.
A few practical implications can be derived from the findings in this study. The findings indicate the significant influence of health influence on public satisfaction. Urban citizens are very much concerned with their health and are very sensitive to hazards that negatively impact it. It is suggested that the local government should take strong actions to carefully deal with environmental problems including MBR and smog, which can threaten public health. Due to the positive effect of improvement measures on public supervision behavior, it is suggested that the local government should take the following actions: (1) provide a platform or channel (hotline or email) for the public to report their environmental concerns; (2) carefully and expeditiously deal with complaints from citizens; and (3) give feedback to the public in a timely manner regarding the treatment process.
The public environmental engagement behavior is also revealed to be positively triggered by the government’s regulating behavior. Since public engagement is necessary for both water pollution treatment and environmental protection, it is strongly suggested that the government should take sufficient effective actions regarding regulating behavior: (1) enact more laws and regulations on aspects of domestic and industrial wastewater emission and policies of levying fines; (2) provide a detailed mechanism for the government to take charge of specific water treatment and protection; and (3) propagate the regulations and laws relating to MBRs through all types of media, including TV, newspaper, websites, and social media.
The positive relationship between public compliance behavior and interest influence indicates that the government should emphasize the immediate interest of the residents influenced by the MBR and benefits (including housing price increase) of water quality improvement when encouraging the citizens to perform compliance behavior regarding MBR treatment. The findings also reveal the importance of making the public aware of pro-environmental engagement behavior. It is suggested to raise the public awareness on environmental issues by adopting the following strategies: (1) promote environmental education in schools [79,80]; (2) refer to serious incidents of water pollution when advertising environmental issues [81]; (3) use social media as a tool to raise environmental awareness amongst the public [82]; (4) organize environmental volunteer movements regarding the MBR issues through universities and local government [83].
Due to the advantages of face-to-face interviews, including the highest potential regarding complexity and flexibility of questions asked [84,85], it is suggested to conduct face-to-face interviews to validate the findings revealed in this research. Since the distances between the MBR and the respondents’ residences are different, it is suggested to further explore the influence of distance on public satisfaction with MBR and their environmental participation behavior. Moreover, results from the data analysis reveal that government compensation measures are positively associated with public satisfaction while negatively associated with supervision behavior. Considering the complexity of public satisfaction and its influence on public behavior, it is suggested to explore the relationship between public behavior and public satisfaction with government’s attitude, coping strategies and policies. Since holding a focus group is a useful technique for discussing specific topics in great detail [86], it is suggested to conduct a focus group study on this issue by gathering together people with different backgrounds and experiences of MBRs.

Author Contributions

Conceptualization, S.Y., J.B., J.H.; methodology and data collection, W.D., X.C.; analysis and writing, W.D., P.S., W.Z.; review and editing, S.Y., X.T., J.H., P.S.; supervision, S.Y., X.T., J.H.; funding acquisition, J.B., J.H., X.T. All authors have read and agreed to the published version of the manuscript.

Funding

The authors are grateful for the support given by the Research Fund (RDH-101–2020-0044) of Xi’an Jiaotong-Liverpool University Urban and Environmental Studies University Research Center.

Institutional Review Board Statement

Not applicable.

Informed Consent Statement

Not applicable.

Data Availability Statement

Not applicable.

Conflicts of Interest

The authors declare no conflict of interest.

References

  1. National Bureau of Statistics. China’s Statistical Bulletin on National Economic and Social Development in 2019. 28 February 2020. Available online: http://www.stats.gov.cn/tjsj/zxfb/202002/t20200228_1728913.html (accessed on 25 October 2020). (In Chinese)
  2. Lin, H. China’s Urbanization Rate Has Increased Significantly in the Last 70 Years. Econ. Dly. Available online: http://www.ce.cn/xwzx/gnsz/gdxw/201908/16/t20190816_32923881.shtml(accessed on 15 October 2019). (In Chinese)
  3. He, D.; Chen, R.; Zhu, E.; Chen, N.; Yang, B.; Shi, H.; Huang, M. Toxicity Bioassays for Water from Black-Odor Rivers in Wenzhou, China. Environ. Sci. Pollut. Res. 2015, 22, 1731–1741. [Google Scholar]
  4. Krenkel, P. Water Quality Management; Elsevier: Amsterdam, The Netherlands, 2012. [Google Scholar]
  5. Wang, J.; Liu, X.D.; Lu, J. Urban River Pollution Control and Remediation. Procedia Environ. Sci. 2012, 13, 1856–1862. [Google Scholar] [CrossRef] [Green Version]
  6. Liu, M.; Ran, Y.; Peng, X.; Zhu, Z.; Liang, J.; Ai, H.; Li, H.; He, Q. Sustainable Modulation of Anaerobic Malodorous Black Water: The Interactive Effect of Oxygen-Loaded Porous Material and Submerged Macrophyte. Water Res. 2019, 160, 70–80. [Google Scholar] [CrossRef] [PubMed]
  7. MOHURD. The Urban Malodorous and Black River Treatment Advances Orderly. 12 December 2016. Available online: http://www.mohurd.gov.cn/zxydt/201612/t20161213_229941.html. (accessed on 19 December 2020). (In Chinese)
  8. Malcangio, D.; Donvito, C.; Ungaro, N. Statistical Analysis of Bathing Water Quality in Puglia Region (Italy). Int. J. Environ. Res. Public. Health 2018, 15, 1010. [Google Scholar] [CrossRef] [PubMed] [Green Version]
  9. Chinese State Council. Notice of the Chinese State Council on the Issuance of the Action Plan for the Prevention and Control of Water Pollution. 16 April 2015. Available online: http://www.gov.cn/zhengce/content/2015-04/16/content_9613.htm (accessed on 25 December 2020). (In Chinese)
  10. The State Council. Guidance on Promoting the Construction of the Cavernous City. 16 October 2015. Available online: http://www.gov.cn/zhengce/content/2015-10/16/content_10228.htm (accessed on 12 December 2020). (In Chinese)
  11. Ministry of Finance; Ministry of Environmental Protection. Suggestions on the Implementation of Promoting the Government and the Social Capital Cooperation in the Field of Water Pollution Control. 9 April 2015. Available online: http://www.gov.cn/zhengce/2016-05/25/content_5076598.htm (accessed on 22 December 2020). (In Chinese)
  12. Ministry of Water Resources. The Detailed Implementation Guidelines of Accelerating the Construction of River Treatment Project. 8 August 2015. Available online: http://www.mwr.gov.cn/zw/tzgg/tzgs/201702/t20170213_858588.html (accessed on 6 November 2020). (In Chinese)
  13. MOHURD; MEP. Notice of the MOHURD and the MEP on Printing and Distributing Guidelines for the Remediation of Urban Malodorous and Black Waters. 28 August 2015. Available online: http://www.mohurd.gov.cn/wjfb/201509/t20150911_224828.html (accessed on 6 December 2020). (In Chinese)
  14. Zhang, Y. The Progress of Remediation of Black and Smelly Water Bodies in Jiangsu Has Reached 97.9%. Mod. Express. 23 December 2019. Available online: http://jsszfhcxjst.jiangsu.gov.cn/art/2019/12/23/art_8642_8855192.html (accessed on 26 October 2020). (In Chinese)
  15. Ye, Y. Urban and Rural Areas of Suzhou City Basically Eliminate Black and Smelly Water. Suzhou Dly. 2020. Available online: http://www.jiangsu.gov.cn/art/2020/9/9/art_64750_9502635.html (accessed on 16 December 2020). (In Chinese)
  16. Zhang, Y.; Zhao, W.; Chen, X.; Jun, C.; Hao, J.; Tang, X.; Zhai, J. Assessment on the Effectiveness of Urban Stormwater Management. Water 2020, 13, 4. [Google Scholar] [CrossRef]
  17. Wen, S.; Wang, Q.; Li, Y.; Zhu, L.; Lv, H.; Lei, S.; Ding, X.; Miao, S. Remote Sensing Identification of Urban Black-Odor Water Bodies Based on High-Resolution Image: A Case Study of Nanjing. Environ. Sci. 2018, 39, 57–67. [Google Scholar]
  18. Lim, H.; Kim, J.; Potter, C.; Bae, W. Urban Regeneration and Gentrification: Land Use Impacts of the Cheonggye Stream Restoration Project on the Seoul’s Central Business District. Habitat Int. 2013, 39, 192–200. [Google Scholar] [CrossRef]
  19. Maruzani, R.; Canali, A.; Serafim, V.; Munoz, L.P.; Shah, A.J.; Perito, B.; Marvasi, M. Effect of Anthropogenic Pollution on the Fitness of Tetracycline Sensitive Shigella Flexneri in Thames River Water. J. Environ. Chem. Eng. 2018, 6, 19–27. [Google Scholar] [CrossRef]
  20. Yamaguchi, N.; Gazzard, D.; Scholey, G.; MacDonald, D.W. Concentrations and Hazard Assessment of PCBs, Organochlorine Pesticides and Mercury in Fish Species from the Upper Thames: River Pollution and Its Potential Effects on Top Predators. Chemosphere 2003, 50, 265–273. [Google Scholar] [CrossRef]
  21. Funabashi, H. Minamata Disease and Environmental Governance. Int. J. Jpn. Sociol. 2006, 15, 7–25. [Google Scholar] [CrossRef]
  22. Kaji, M. Role of Experts and Public Participation in Pollution Control: The Case of Itai-Itai Disease in Japan1. Ethics Sci. Environ. Polit. 2012, 12, 99–111. [Google Scholar] [CrossRef] [Green Version]
  23. Fu, J.; Geng, Y. Public Participation, Regulatory Compliance and Green Development in China Based on Provincial Panel Data. J. Clean. Prod. 2019, 230, 1344–1353. [Google Scholar] [CrossRef]
  24. Stern, P.C. New Environmental Theories: Toward a Coherent Theory of Environmentally Significant Behavior. J. Soc. Issues 2000, 56, 407–424. [Google Scholar] [CrossRef]
  25. Story, P.A.; Forsyth, D.R. Watershed Conservation and Preservation: Environmental Engagement as Helping Behavior. J. Environ. Psychol. 2008, 28, 305–317. [Google Scholar] [CrossRef]
  26. Kathuria, V. Informal Regulation of Pollution in a Developing Country: Evidence from India. Ecol. Econ. 2007, 63, 403–417. [Google Scholar] [CrossRef]
  27. Langpap, C.; Shimshack, J.P. Private Citizen Suits and Public Enforcement: Substitutes or Complements? J. Environ. Econ. Manag. 2010, 59, 235–249. [Google Scholar] [CrossRef]
  28. Féres, J.; Reynaud, A. Assessing the Impact of Formal and Informal Regulations on Environmental and Economic Performance of Brazilian Manufacturing Firms. Environ. Resour. Econ. 2012, 52, 65–85. [Google Scholar] [CrossRef]
  29. Botelho, A. The Impact of Education and Training on Compliance Behavior and Waste Generation in European Private Healthcare Facilities. J. Environ. Manag. 2012, 98, 5–10. [Google Scholar] [CrossRef]
  30. Shen, D.; Xia, M.; Zhang, Q.; Elahi, E.; Zhou, Y.; Zhang, H. The Impact of Public Appeals on the Performance of Environmental Governance in China: A Perspective of Provincial Panel Data. J. Clean. Prod. 2019, 231, 290–296. [Google Scholar] [CrossRef]
  31. Bracha, D.H.S. Freeze, Flight, Fight, Fright, Faint: Adaptationist Perspectives on the Acute Stress Response Spectrum. CNS Spectr. 2004, 9, 679–685. [Google Scholar] [CrossRef] [PubMed]
  32. Deng, Y.; Yang, G. Pollution and Protest in China: Environmental Mobilization in Context. China Q. 2013, 2013, 321. [Google Scholar] [CrossRef]
  33. Taylor, D. Toxic Communities: Environmental Racism, Industrial Pollution, and Residential Mobility; NYU Press: New York, NY, USA, 2014; ISBN 978-1-4798-6178-1. [Google Scholar]
  34. Tevapitak, K.; Helmsing, A.B. The Interaction between Local Governments and Stakeholders in Environmental Management: The Case of Water Pollution by SMEs in Thailand. J. Environ. Manag. 2019, 247, 840–848. [Google Scholar] [CrossRef] [PubMed]
  35. Qu, W.; Qu, G.; Zhang, X.; Robert, D. The Impact of Public Participation in Environmental Behavior on Haze Pollution and Public Health in China. Econ. Model. 2020. [Google Scholar] [CrossRef]
  36. Tran, K.C.; Euan, J.; Isla, M.L. Public Perception of Development Issues: Impact of Water Pollution on a Small Coastal Community. Ocean Coast. Manag. 2002, 45, 405–420. [Google Scholar] [CrossRef]
  37. Wang, F. Research on the Influencing Factors and Mechanism of Public Participation in Environmental Behavior. Ph.D. Thesis, Northwest University, Xi’an, China, 2007. (In Chinese). [Google Scholar]
  38. Chen, W.; Yang, R. Government Regulation, Public Participation and Environmental Governance Satisfaction—The Empirical Analysis Based on CGSS2015 Data. Soft Sci. 2018, 32, 49–53. [Google Scholar]
  39. Féres, J.; Reynaud, A.; Thomas, A. Water Reuse in Brazilian Manufacturing Firms. Appl. Econ. 2012, 44, 1417–1427. [Google Scholar] [CrossRef]
  40. Tang, S.-Y.; Zhan, X. Civic Environmental NGOs, Civil Society, and Democratisation in China. J. Dev. Stud. 2008, 44, 425–448. [Google Scholar] [CrossRef]
  41. Guo, H. Public Participation Is Indispensable to the Treatment of Urban Malodorous And black River Bodies. China Environ. News, 23 December 2016. Available online: http://epaper.cenews.com.cn/html/2016-12/23/content_54053.htm(accessed on 16 November 2020). (In Chinese)
  42. Wang, Y.; Han, D. Economic Development, Environmental Pollution and Public Pro-Environmental Behavior—A Multi-Level Analysis of the 2013 Chinese General Social Survey. J. Renmin Univ. China 2016, 2, 79–92. (In Chinese) [Google Scholar]
  43. Feng, L.; Liao, W. Legislation, plans, and policies for prevention and control of air pollution in China: Achievements, challenges, and improvements. J. Clean. Prod. 2016, 112, 1549–1558. [Google Scholar] [CrossRef]
  44. Drazkiewicz, A.; Challies, E.; Newig, J. Public Participation and Local Environmental Planning: Testing Factors Influencing Decision Quality and Implementation in Four Case Studies from Germany. Land Use Policy 2015, 46, 211–222. [Google Scholar] [CrossRef]
  45. Allen, I.E.; Seaman, C.A. Likert Scales and Data Analyses. Qual. Prog. 2007, 40, 64–65. [Google Scholar]
  46. Nemoto, T.; Beglar, D. Likert-Scale Questionnaires. In Proceedings of the JALT 2013 Conference Proceedings, Kobe, Japan, 25–28 October 2013; pp. 1–8. [Google Scholar]
  47. Nanjing Municipal Bureau Statistics. Nanjing Statistical Bulletin of National Economic and Social Development in 2019. March 2020. Available online: http://njrb.njdaily.cn/njrb/html/2020-04/03/content_563857.htm (accessed on 30 January 2021). (In Chinese).
  48. Nanjing Daily. The Green Area Rate of Nanjing’s Built-Up Area is Nearly 41%. 2018. Available online: http://njrb.njdaily.cn/html/2018-09/19/content_513475.htm?div=-1 (accessed on 2 January 2021). (In Chinese).
  49. Li, W. Nanjing Releases White Paper on the State of the Environment in 2018. Nanjing Dly. 2019. Available online: http://www.nanjing.gov.cn/njxx/201905/t20190529_1551409.html (accessed on 25 December 2020). (In Chinese)
  50. Levy, P.S.; Lemeshow, S. Sampling of Populations: Methods and Applications; John Wiley & Sons: Hoboken, NJ, USA, 2013; ISBN 978-1-118-62731-0. [Google Scholar]
  51. Kline, P. An Easy Guide to Factor Analysis; Routledge: London, UK, 2014. [Google Scholar]
  52. Hinton, P.R.; McMurray, I.; Brownlow, C. SPSS Explained; Routledge: London, UK, 2014. [Google Scholar]
  53. Pallant, J. SPSS Survival Manual: A Step by Step Guide to Data Analysis Using IBM SPSS; Routledge: London, UK, 2020. [Google Scholar]
  54. Pett, M.A.; Lackey, N.R.; Sullivan, J.J. Making Sense of Factor Analysis: The Use of Factor Analysis for Instrument Development in Health Care Research; Sage: Thousand Oaks, CA, USA, 2003. [Google Scholar]
  55. Comrey, A.L.; Lee, H.B. A First Course in Factor Analysis; Psychology Press: Hillsdale, NJ, USA, 2013. [Google Scholar]
  56. Cohen, J.; Cohen, P.; West, S.G.; Aiken, L.S. Applied Multiple Regression/Correlation Analysis for the Behavioral Sciences; Routledge: New York, NY, USA, 2013. [Google Scholar]
  57. Aiken, L.S.; West, S.G.; Pitts, S.C.; Baraldi, A.N.; Wurpts, I.C. Multiple Linear Regression. Handb. Psychol. Second Ed. 2012, 2, 511–542. [Google Scholar]
  58. Montgomery, D.C.; Peck, E.A.; Vining, G.G. Introduction to Linear Regression Analysis; John Wiley & Sons: Hoboken, NJ, USA, 2012; Volume 821. [Google Scholar]
  59. Robinson, C.; Schumacker, R.E. Interaction Effects: Centering, Variance Inflation Factor, and Interpretation Issues. Mult. Linear Regres. Viewp. 2009, 35, 6–11. [Google Scholar]
  60. Seber, G.A.; Lee, A.J. Linear Regression Analysis; John Wiley & Sons: Hoboken, NJ, USA, 2012; Volume 329. [Google Scholar]
  61. Keith, T.Z. Multiple Regression and beyond: An Introduction to Multiple Regression and Structural Equation Modeling; Routledge: New York, NY, USA, 2014. [Google Scholar]
  62. Issahaku, A.; Ampadu, B.; Braimah, M.M. The Causes, Effects, and Disease Burden Attributable to Water Quality and Sanitation Conditions in the Kassena Nankana Municipality, Ghana. Environ. Qual. Manag. 2017, 26, 17–29. [Google Scholar] [CrossRef]
  63. Goetzke, F.; Rave, T. Regional Air Quality and Happiness in Germany. Int. Reg. Sci. Rev. 2015, 38, 437–451. [Google Scholar] [CrossRef]
  64. Chen, W.Y.; Li, X.; Hua, J. Environmental Amenities of Urban Rivers and Residential Property Values: A Global Meta-Analysis. Sci. Total Environ. 2019, 693, 133628. [Google Scholar] [CrossRef]
  65. Dresner, M.; Handelman, C.; Braun, S.; Rollwagen-Bollens, G. Environmental Identity, pro-Environmental Behaviors, and Civic Engagement of Volunteer Stewards in Portland Area Parks. Environ. Educ. Res. 2015, 21, 991–1010. [Google Scholar] [CrossRef]
  66. Ojo, A.O.; Fauzi, M.A. Environmental Awareness and Leadership Commitment as Determinants of IT Professionals Engagement in Green IT Practices for Environmental Performance. Sustain. Prod. Consum. 2020, 24, 298–307. [Google Scholar] [CrossRef]
  67. Peng, Y. Analysis of the Influence of Urban Residents’ Environmental Cognition on Environmental Behavior. J. Cent South Univ. Soc. Sci. 2015, 3, 173–179. (In Chinese) [Google Scholar]
  68. Gelissen, J. Explaining Popular Support for Environmental Protection: A Multilevel Analysis of 50 Nations. Environ. Behav. 2007, 39, 392–415. [Google Scholar] [CrossRef]
  69. Greenstone, M.; Hanna, R. Environmental Regulations, Air and Water Pollution, and Infant Mortality in India. Am. Econ. Rev. 2014, 104, 3038–3072. [Google Scholar] [CrossRef] [Green Version]
  70. MOHURD; MEE. Weekly Report on Public Supervision and Response to the Renovation of Black and Smelly Water Bodies in Cities Nationwide. 2020. Available online: http://www.hcstzz.com/show.aspx?NewsID=10843 (accessed on 25 October 2020). (In Chinese).
  71. Che, Y.; Yang, K.; Jin, Y.; Zhang, W.; Shang, Z.; Tai, J. Residents’ Concerns and Attitudes toward a Municipal Solid Waste Landfill: Integrating a Questionnaire Survey and GIS Techniques. Environ. Monit. Assess. 2013, 185, 10001–10013. [Google Scholar] [CrossRef] [PubMed]
  72. Cantor, D.E.; Morrow, P.C.; Montabon, F. Engagement in Environmental Behaviors among Supply Chain Management Employees: An Organizational Support Theoretical Perspective. J. Supply Chain Manag. 2012, 48, 33–51. [Google Scholar] [CrossRef]
  73. Ames, R.T.; Rosemont, H., Jr. The Analects of Confucius: A Philosophical Translation; Ballantine Books: New York, NY, USA, 2010. [Google Scholar]
  74. Xiao, Y.; Hui, E.C.; Wen, H. Effects of Floor Level and Landscape Proximity on Housing Price: A Hedonic Analysis in Hangzhou, China. Habitat Int. 2019, 87, 11–26. [Google Scholar] [CrossRef]
  75. Kleinnijenhuis, J.; Van Hoof, A.M. Media Coverage of Government Policies and Public Satisfaction with Information Provision and Policy Results. In Politik in der Mediendemokratie; Marcinkowski, F., Pfetsch, B., Eds.; VS Verlag für Sozialwissenschaften: Wiesbaden, Germany, 2009; pp. 320–344. [Google Scholar]
  76. Song, M.; Meier, K.J. Citizen Satisfaction and the Kaleidoscope of Government Performance: How Multiple Stakeholders See Government Performance. J. Public Adm. Res. Theory 2018, 28, 489–505. [Google Scholar] [CrossRef]
  77. Wang, Z. Citizens’ Satisfaction with Government Performance in Six Asian-Pacific Giants. Jpn. J. Polit. Sci. 2010, 11, 51. [Google Scholar] [CrossRef]
  78. Phellas, C.N.; Bloch, A.; Seale, C. Structured Methods: Interviews, Questionnaires and Observation. Res. Soc. Cult. 2011, 3, 181–205. [Google Scholar]
  79. Altin, A.; Tecer, S.; Tecer, L.; Altin, S.; Kahraman, B.F. Environmental Awareness Level of Secondary School Students: A Case Study in Balıkesir (Türkiye). Procedia-Soc. Behav. Sci. 2014, 141, 1208–1214. [Google Scholar] [CrossRef] [Green Version]
  80. Yilmaz, N.Y. An Examination of the Relationship between Primary School Students’ Environmental Awareness and Basic Science Process Skills. Educ. Res. Rev. 2019, 14, 140–151. [Google Scholar]
  81. Xu, L.; Shen, J.; Marinova, D.; Guo, X.; Sun, F.; Zhu, F. Changes of Public Environmental Awareness in Response to the Taihu Blue-Green Algae Bloom Incident in China. Environ. Dev. Sustain. 2013, 15, 1281–1302. [Google Scholar] [CrossRef]
  82. Tlebere, T.; Scholtz, B.; Calitz, A.P. Using social media to improve environmental awareness in higher education institutions. In Information Technology in Environmental Engineering; Springer: Cham, Switzerland, 2016; pp. 101–111. [Google Scholar]
  83. Shelest, K.D.; Ionov, V.V.; Tikhomirov, L.Y. Environmental Awareness Raising through Universities–City Authorities’ Cooperation. Int. J. Sustain. High. Educ. 2017, 18, 39–49. [Google Scholar] [CrossRef]
  84. Brace, I. Questionnaire Design: How to Plan, Structure and Write Survey Material for Effective Market Research; Kogan Page Publishers: London, UK, 2018. [Google Scholar]
  85. De Leeuw, E. Self-Administered Questionnaires and Standardized Interviews. In The SAGE Handbook of Social Research Methods; Alasuutari, P., Bickman, L., Brannen, J., Eds.; SAGE Publications: London, UK, 2008; pp. 313–327. [Google Scholar]
  86. Liamputtong, P. Focus Group Methodology: Introduction and History. In eFocus Group Methodology: Principles and Practice; Liamputtong, P., Ed.; Sage: London, UK, 2011; pp. 1–14. [Google Scholar]
Figure 1. Examples of urban MBRs in China.
Sustainability 13 03584 g001
Figure 2. Locations of the questionnaire survey.
Sustainability 13 03584 g002
Table 1. Detailed information of questionnaire respondents.
Items DetailsAmountProportion (%)
Age21–304932.2
31–404730.9
41–503523.0
51–60117.2
≥61106.6
GenderMale8153.3
Female7146.7
Period of resident<1 Year2818.4
1–5 Years4932.2
6–10 Years3623.7
11–15 Years149.2
16–20 Years127.9
>20 Years138.6
Education levelSenior middle school5032.9
Bachelor 8857.9
Master and above149.2
Table 2. Result of descriptive statistical analysis of public perception of MBR.
QuestionsItemsStatementNumberPercentage (%)
1. The distance between MBR and your workplace or residence(1)≤100 m32.0
(2)100 m–500 m127.9
(3)500 m–1 km4127.0
(4)1 km–2 km9663.2
2. In which season do you think the MBR impact you the most?(1)Spring32.0
(2)Summer14696.1
(3)Autumn32.0
(4)Winter00.0
3. How long do you think the river nearby has become black and malodorous?(1)≤1 Year1811.8
(2)1–3 Years3523.0
(3)>3 Year1711.2
(4)No idea8253.9
4. Which one is the most crucial cause of the MBR in your opinion?(1)Biochemical action of microorganisms in water1912.5
(2)Industrial pollution5334.9
(3)Urban pollution7750.7
(4)Others32.0
5. Which one do you think most accurately describes your understanding of MBR?(1)Pungent smell6542.8
(2)Wastes floating on the surface of the water7549.3
(3)Algal blooms95.9
(4)Others32.0
6. Which one do you think is the most important consequence of MBR?(1)Many aquatic animals died caused by water eutrophication,3019.7
(2)The water of agricultural irrigation was polluted, resulting in the polluted farmland crops and cereal.2818.4
(3)More money is needed to control water pollution1610.5
(4)MBR can pollute the drinking water and pose a health risk to the public.7851.3
Table 3. Factor analysis of public perception of MBR treatment.
FactorsItemsStatementFactor LoadingCronbach Alpha
P1-Public 1I think water bloom is a kind of MBR.0.8820.902
Environment2I think the smell of MBR is malodorous.0.780
awareness3I know the consequence of MBR.0.732
4I think there are trashes and oil on the MBR.0.702
P2-Interest influence1I am thinking of moving out of the residential community to avoid the influence of MBR.0.8800.770
2The MBR undermines the public interest, including mine.0.753
3The MBR negatively influences the nearby housing price.0.630
P3-Health 1The MBR negatively influence public health.0.9120.718
influence2I feel sick and upset when I am near the MBR.0.715
Table 4. Factor analysis of government’s treatment of MBR (malodorous black river.)
FactorsItemsStatementFactor LoadingCronbach’s Alpha
G1- 1The government takes ecological measurements to improve the quality of MBR, such as planting trees and grasses along the river.0.9050.870
Compensation measures2The government takes economic compensation to those who are affected by MBR.0.886
3The government takes psychological counseling measurements to comfort the ones being influenced by MBR.0.880
G2- 1The government publicizes the knowledge of preventing water pollution.0.7740.876
Improvement2The government introduces advanced technology to improve MBR.0.746
measures3The government welcomes public scrutiny and positively responds.0.717
4The government improves laws and regulations regarding control water pollution.0.690
G3-Regulating 1Industrial wastewater is enforced to be reused after deeply purified. 0.7370.821
measures2The government enacts laws and regulations to force heavy-polluting industries to use environmental technologies.0.726
3The government takes a measurement of sewage charge system.0.725
Note: “government’s treatment“refers to the public perception of the government’s treatment.
Table 5. Factor analysis of public participation behavior.
FactorsItemsStatementFactor LoadingCronbach’s Alpha
B1- 1I will initiatively separate waste into groups. 0.9060.921
Engagement 2I usually take low-carbon travel.0.897
behavior3I usually try to recycle resources.0.864
4My lifestyle is environmentally friendly.0.793
B2- 1I often expose water pollution behaviors.0.8210.764
Supervision behavior2I usually pay attention to the garbage dump along the nearby river.0.769
3I usually complain to the authorities when the MBR seriously affects my life.0.674
4I will discourage those who throw the garbage into the river/lakes.0.644
B3- 1I would like to participate in environmental activities.0.9220.909
Compliance behavior2I would like to join the activities of MBR improvement arranged by the government.0.919
3I would like to obey the laws and regulations of environmental protection.0.910
Table 6. Reliability analysis of public satisfaction with government’s treatment of MBR.
FactorsItemsStatementCronbach’s Alpha
PS-Public1I am satisfied with the government performance of MBR treatment.0.641
Satisfaction2I am satisfied with the attitude of the government on MBR treatment.
3I am happy that the nearby MBR has been improved significantly.
Table 7. Correlation analysis among PS, PPB, GT, and PP on MBR.
FactorsB1B2B3P1P2P3G1G2G3
PS-Public satisfaction0.0330.317 **0.1490.0200.0630.321 **0.305 **0.370 **0.122
B1- Engagement behavior1.000 **0.0780.338 **0.227 **0.276 **0.247 **0.1480.175 *0.360 **
B2-Supervision behavior0.0781.000 **0.507 **0.0010.0400.026−0.187 *0.287 **0.142
B3- Compliance behavior0.338 **0.507 **1.000 **0.0160.0980.0840.0530.1550.235
Note: P1-public awareness, P2-Interest influence, P3-Health influence, G1-Compensation measures, G2-Improvement measures, G3-Regulating measures. **-Correlation is significant at the 0.01 level (2-tailed). *-Correlation is significant at the 0.05 level (2-tailed).
Table 8. Regression analysis of PS and PPB and their influencing factors.
ModelBStd. ErrortSig.VIFRR2Sig (ANOVA)
I PS-Public satisfaction←PPB, GT, PP
(Constant)3.1990.4187.6470.000 0.4820.2320.000
G1-Compensation measures0.2010.0672.9960.0031.162
P3-Health influence0.2070.0752.7500.0071.222
B1-Engagement behavior0.2240.0653.4610.0011.144
B2-Supervision behavior0.5620.0916.2040.0001.365
II B1-Engagement behavior←PPB, GT, PP
(Constant)2.0210.4964.0740.000 0.5250.2760.000
G3-Regulating measures0.4050.1103.6910.0001.135
B3-Compliance behavior0.3430.0704.9270.0001.015
P2-Interest influence0.2460.0852.8970.0041.144
III B2-Supervision behavior←PPB, GT, PP
(Constant)3.0290.22513.4390.000 0.2720.0740.000
G2-Improvement measures0.2900.0893.2770.0011.288
G1Compensation measures−0.1800.071−2.5180.0131.288
IV B3-Compliance behavior←PPB, GT, PP
(Constant)−0.2170.481−0.4510.653 0.6230.3880.000
B2-Supervision behavior0.6380.0847.5620.0001.007
B1-Engagement behavior0.3620.0685.3270.0001.088
P2-Interest influence0.2470.0773.2240.0021.083
Table 9. Relationships revealed in correlation and regression analysis among PS, PPB, GT, and PP of MBR.
FactorsB1B2B3P1P2P3G1G2G3
PS-Public satisfactionRC&R C&RC&RC
B1-Engagement behavior C&RCC&RC C&R
B2-Supervision behavior C RC&R
B3-Compliance behaviorC&RC&R R
Note: C-relationships revealed in correlation analysis. R-relationships revealed in regression analysis.
Publisher’s Note: MDPI stays neutral with regard to jurisdictional claims in published maps and institutional affiliations.

