
Green Credit Policy and Maturity Mismatch Risk in Polluting and Non-Polluting Companies


1
School of Management, Wuhan University of Technology, Wuhan 430070, China
2
School of Economics and Finance/Sustainable Real Estate Research Center, Hong Kong Shue Yan University, Hong Kong 5132, China
3
Wolfson College, Oxford University, Oxford OX1 2JD, UK
4
School of Life Sciences, Shanxi University, Taiyuan 030006, China
5
Institute of Biomedical and Environmental Science & Technology, University of Bedfordshire, Park Square, Luton LU1 3JU, UK
*
Author to whom correspondence should be addressed.
Sustainability 2021, 13(7), 3615; https://0-doi-org.brum.beds.ac.uk/10.3390/su13073615
Submission received: 4 February 2021
/
Revised: 8 March 2021
/
Accepted: 12 March 2021
/
Published: 24 March 2021
(This article belongs to the Special Issue Corporate Social Responsibility Practice in the High-Tech Sector)
Abstract
:A major issue is whether the implementation of China’s green credit policy will affect the coordinated development of corporate sustainable operations and environmental protection. This paper used a propensity score matching—difference-in-differences (PSM-DID) model to analyse the impact of China’s green credit policy implemented in 2012 on the maturity mismatch risk between investment and financing in polluting and non-polluting companies. We found that: (1) green credit policies can help reduce the risk of maturity mismatch between investment and financing for polluting companies; (2) the reduction of short-term bank credit is the main way to curb the risk of maturity mismatch risk between investment and financing; (3) the green credit policy has no obvious mitigation effect on the risk of maturity mismatch between investment and financing among polluting companies with environmental protection investment; (4) the mitigation effect of the green credit policy on the maturity mismatch risk is more significant in state-owned polluting companies and polluting companies in areas with a lower level of financial development. The empirical results show that China’s green credit policy helps stimulate the environmental protection behaviour of companies, as well as helping alleviate the capital chain risk caused by the maturity mismatch between investment and financing. In addition, despite the effect of heterogeneity, it can solve the contradiction between environmental protection and economic development.
1. Introduction
With China’s rapid industrialisation and urbanisation, its rapid economic growth has been accompanied by a sharp deterioration of the ecological environment. The contradiction between environmental protection and economic development is of great interest to the Chinese government, which has formulated effective policies and programmes to balance environmental protection and the economic benefits of companies for China to achieve the sustainable development goals [1]. In 2007, the China Environmental Protection Administration, the People’s Bank of China and the former China Banking Regulatory Commission jointly issued Opinions on Implementing Environmental Protection Policies and Regulations to Prevent Credit Risks, which marked the beginning of the introduction of green credit management in China. As an important part of “green development”, green credit is the policy that directs commercial banks to take social responsibility as their core value orientation; to allocate credit resources rationally; to develop the green consumption concept in consumers; and to guide the flow of social capital to promote the coordinated development of the economy, resources and the environment [2]. In 2012, China’s green credit policy clarified the standards and principles of green credit in the banking industry. On the one hand, it raised the green credit policy to a strategic prominence to ensure that this policy has strong execution power in banking financial institutions; on the other hand, it requires banking financial institutions to implement differentiated credit standards for companies with different environmental and social performance levels when approving corporate loan applications. The implementation of the green credit policy has provided detailed operability instructions to enable financial institutions to develop green credit business effectively, promoting green transformation and the upgrading of polluting companies. Subsequently, the Ministry of Finance and the National Development and Reform Commission jointly issued Guiding Opinions on Building a Green Financial System in 2016, and the People’s Bank of China incorporated high-quality green credit into the Medium-Term Loan Facility (MLF) in 2018 to ensure that the green credit policy undergoes continuous improvement.
From a theoretical point of view, the green credit policy adjusts the business philosophy, business process and management strategy of the banking industry by formulating differentiated credit policies to guide credit resources away from polluting companies, and promoting non-polluting company credit support and the green transformation and upgrade of polluting companies, seeking economic development in the pursuit of environmental protection. However, there are still controversies regarding the current research conclusions on the financial risks of green credit policies to polluting companies. On the one hand, from the perspective of short-term benefits, green credit policies are part of financial supply-related policies. By creating green financial tools, the environmental compliance of polluting companies is an important condition for issuing loans, raising financing costs and increasing the economic burden of polluting companies [3,4,5]. Green credit policies guide the development of green industries, while significantly curbing the credit financing of polluting enterprises, increasing the cost and uncertainty faced by polluting enterprises and also reducing the total factor productivity of enterprises by affecting the allocation of resources in the financial market [6,7]. The main purpose of green credit policies is to stimulate the internal motivation to reduce emissions from polluting enterprises, so as to actively reduce emissions through technological innovation [8,9]. However, the impact of green credit policies on the production and operation of polluting enterprises will lead to the inability to repay bank loans, thus increasing the operational risks of banks at the same time. In order to reduce operational risks, banks have to increase their proportions of green credit in total bank loans by improving the level of credit risk management [10,11], reduce the capital supply to polluting enterprises and curb the investment in technological innovation of polluting enterprises [12,13]. The increase in financing costs and the containment of technological innovation negatively impact the economic benefits of polluting companies, thereby exacerbating the financial risks of polluting companies. On the other hand, from the perspective of improving the sustainable growth capacity of companies, the green credit policies encourage polluting companies to withdraw from projects that may cause major environmental problems [14,15,16,17]. Banks can also provide financial support for the development of green industries through credit supply, investment, term and interest rate [18,19,20], to optimise and upgrade the industrial structure by promoting the ecological development of traditional industries and the development of new green ecological industries, so as to achieve the goals of sustainable development [21,22,23]. Based on the Porter Hypothesis, long-term green credit policies can promote the green transformation and upgrading of polluting enterprises through an “innovation compensation effect”, enhance the sustainable development ability of polluting enterprises and promote long-term economic growth [24].
Research on the impact of green credit policies on the financial risks of polluting companies has mainly concentrated in the areas of corporate financing and investment [5,9,20]. Indeed, there have been relatively few studies on the impact of green credit policies on the financial risks of polluting companies based on the maturity mismatch between investment and financing. The maturity mismatch between investment and financing refers to the excessive use of short-term borrowing by companies to meet the capital needs of fixed assets and other long-term investments, resulting in the company lacking sufficient cash flow to repay the debts due, which will amplify the corporate debt repayment pressure and exacerbate the corporate financial risk [25,26].The undifferentiated use of long-term and short-term liabilities weakens the corporate governance mechanism [27], and the constant pressure to provide capital repayment with interest forces companies to continuously strive to solve the problem of capital liquidity, which reduces corporate investment efficiency [28]. If the corporate problem of maturity mismatch between investment and financing cannot be controlled quickly, it will directly affect the company’s normal operation and sustainable development goals. In view of the current research controversy on the effect of the green credit policy implementation and the common problem of maturity mismatch risk between investment and financing among companies in this emerging financial market environment in China [29], the influence of the green credit policy on the maturity mismatch risk, as well as the realisation of the environment win-win situation between protection and economic development needs to be studied in-depth.
Some of the literature on the implementation effect of green credit policies focuses on different perspectives with different methods. Liu et al. (2015) used the computable general equilibrium model to present the transmission path of the punitive high interest rate of green credit policies [30]. Pan (2019) used the DSGE model to test the impact of green credit policies on green credit supply [31]. Lai et al. 2013 investigated the impact of green credit on water pollution prevention and control by using differential game and numerical simulation, and found that green credit of banks is positively correlated with enterprise emission reduction [32]. Therefore, does the green credit policy affect the corporate risk of maturity mismatch between investment and financing? What is the impact mechanism and is there any heterogeneity? This paper used “The Green Credit Guidelines” released by the China Banking Regulatory Commission in 2012 as an exogenous event in an attempt to address these questions. Taking polluting companies as the experimental group, the propensity score matching method (PSM) was used to match the polluting companies with the non-polluting companies control group, also applying the double-difference method (DID) to compare the changes in the maturity mismatch between investment and financing between the experimental group and the control group before and after the implementation of the policy to evaluate the microscopic impact of the green credit policy on maturity mismatch between investment and financing in polluting companies. At the same time, by examining the impact of the green credit policy on long-term investment and short-term loans, the path of influence by which the green credit policy affects maturity mismatch between investment and financing problem in polluting companies was revealed. In further analyses, we investigated the asymmetric impact of different environmental investment performance, the nature of property rights and financial development levels on the problem of maturity mismatch between investment and financing in polluting companies. Our study found that green credit has a mitigating effect on the maturity mismatch between investment and financing for polluting companies. Banks based on the green credit review to reduce the short-term credit supply of polluting companies are the main way to alleviate the problem of maturity mismatch between investment and financing for polluting companies. Polluting companies cater to the green credit policy by increasing investment in environmental protection, reducing the mitigation effect of the green credit policy on the maturity mismatch between investment and financing. In addition, the mitigation effect of the green credit policy on the maturity mismatch between investment and financing is even more obvious in polluting companies with no environmental protection investment, state-owned polluting companies and polluting companies in areas with low-level financial development.
The innovations and contributions of this paper are manifested in the following three aspects. Firstly, given the controversy in previous studies on the impact of green credit policies on the financial risks of polluting companies, this paper explored the risk effect of green credit policies on polluting corporate finance from the perspective of maturity mismatch between investment and financing. Secondly, there is almost no literature on the mechanism of green credit policies affecting the financial risks of polluting companies. This paper shows the impact of green credit policies on the financial risks of polluting companies from both long-term investments and short-term loans. Thirdly, taking into account China’s special corporate environmental protection investment motivations, the nature of ownership and the imbalance of regional financial development, we further explored the pollution of green credit policies in areas with different environmental investment performance, corporate property rights and financial development levels as well as the differential impact of mismatches in corporate investment and financing periods. Our research conclusions provide empirical evidence for financial institutions and local governments to better implement green credit policies and achieve a coordinated development of environmental protection and economic benefits.
2. Institutional Background and Research Hypothesis
2.1. Institutional Background
Bank credit is an important means of realising national macro-control, as well as a financing source for companies. In this context, as an important tool to ensure the country’s green and sustainable development, the green credit policy has aroused wide concern from theorists and companies. Although China introduced the green credit policy in 2007, due to the deficient evaluation standards and implementation details, the banking industry views the green credit policy more in terms of corporate social responsibility performance and reputation enhancement than as a credit risk problem. The Green Credit Guidelines issued by the China Banking Regulatory Commission in 2012 marked the comprehensive and standardised implementation of the green credit policy in China. The guidelines not only define the scope of green credit and environmental and social risks more clearly but also clarify the supervisory responsibilities of the China Securities Regulatory Commission and the banking regulatory agencies. This has enabled a more standardised and institutionalised green credit policy and made banking financial institutions pay more attention to credit risk. Therefore, 2012 was selected as the time node to study the impact of green credit on the corporate problem of maturity mismatch between investment and financing. According to the statistics of the Green Credit Development Report issued by the China Banking Regulatory Commission, China’s green credit amount increased from 5.20 trillion yuan at the end of 2013 to 8.23 trillion yuan in 2018, and by the end of 2019, China’s 21 major banks’ credit balance reached 10 trillion yuan. The implementation of the green credit policy has strengthened the banks’ credit risk management level, ensuring banks pay more attention to the negative impact of environmental risks. At present, due to the prominent environmental violations in construction projects and companies in some areas of China, there is increased credit risk brought by the shutdown of polluting companies causing huge losses to the banking industry. As the green credit policy is implemented, banks will continuously optimise their risk management methods to realise risk transfer and will adjust the credit structure to accelerate the reduction of internal non-performing loans [33].
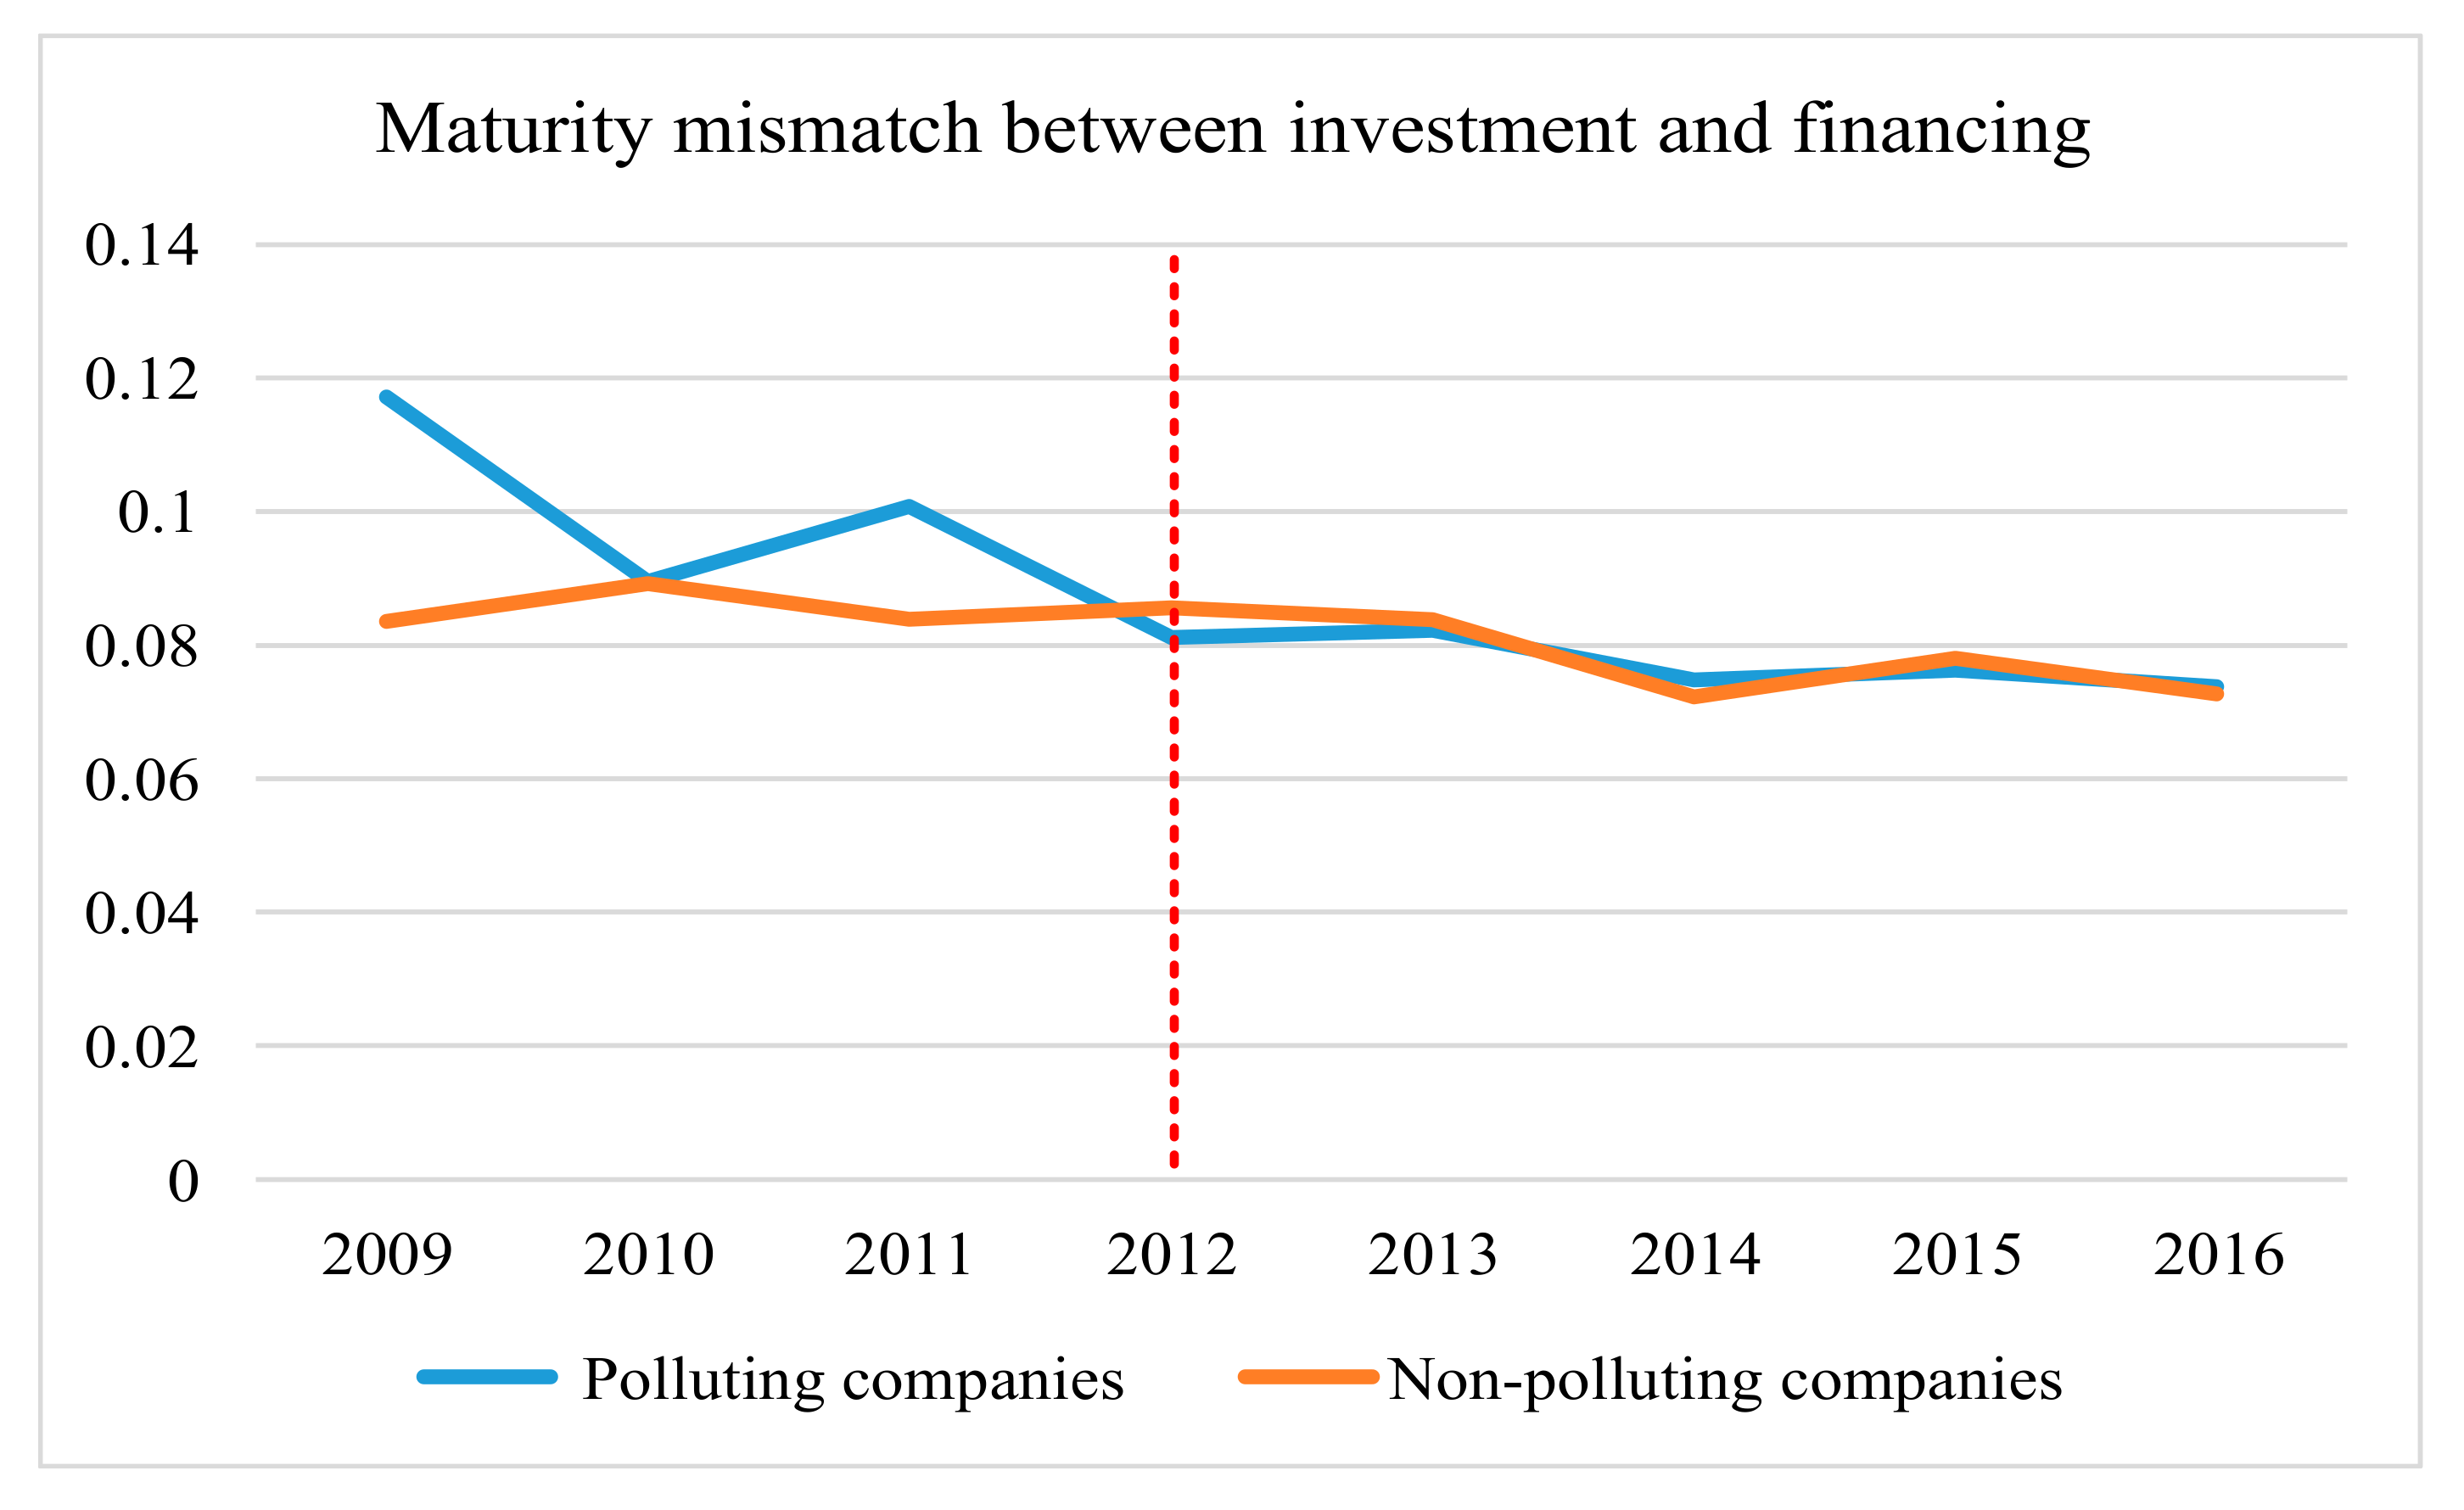
Compared with developed financial markets as in the United States, China as an emerging market economy is still in an imperfectly competitive financial market environment. Constrained by imperfect financial market development and low information transparency, banks are more willing to provide short-term loans externally due to the consideration that short-term credit can reduce corporate adverse selection and moral hazard [34]. Moreover, the flexibility of short-term loans can also reduce the regulatory authorities’ pressure regarding the assessment of bank loan issuance and recovery. Therefore, under the bank-dominated financial system [35], Chinese companies rely more on short-term loans to support long-term investment, that is, Maturity Mismatch between investment and financing. In the developed capital market, the corporate investment and financing strategy of maturity mismatch between investment and financing is to reduce transaction costs; this is an independent corporate decision based on respective characteristics [36], as well as an investment and financing decision with a positive effect on corporate performance. Maturity mismatch between investment and financing characterised by a funding maturity mismatch can provide liquidity support for corporate investment and ease financing constraints [37,38]. It has been identified that in China, a more aggressive mismatch between investment and financing in emerging markets with a high degree of financial restraint will amplify the corporate debt repayment pressure and increase corporate financial risks [39,40,41], thereby affect sustainable corporate development. The green credit policy requires banking financial institutions to consider factors such as pollution control, environmental protection and sustainable development as an important basis for issuing credit; this will inevitably affect the problem of maturity mismatch between investment and financing among Chinese companies, especially polluting companies. We studied the data on the average change in maturity mismatch between investment and financing behaviour in polluting companies and non-polluting companies before and after the green credit policy promulgation in 2012. As a result, according to the indexes in the 2009–2016 database of the National Bureau of Statistics and China’s stock market and accounting research (CSMAR) for the measurement of corporate, a larger index value indicates a more serious maturity mismatch between investment and financing [29].
As shown in Figure 1, from the perspective of changes in average levels, before the release of the Green Credit Guidelines in 2012, polluting companies presented a more serious maturity mismatch between investment and financing than non-polluting companies. After the implementation of the green credit policy in 2012, polluting companies had less maturity mismatch between investment and financing, almost equivalent to non-polluting companies. In Figure 1, the maturity mismatch between investment and financing behaviour in non-polluting companies did not change significantly before and after the implementation of the green credit policy in 2012. This reflects that the implementation of the green credit policy has alleviated the problem of maturity mismatch between investment and financing in polluting companies to a certain extent; therefore, it is necessary to study the specific effects.
2.2. Research Hypothesis
The corporate problem of maturity mismatch between investment and financing occurs because the existing corporate funds cannot meet the cash expenditure requirement of long-term investment activities such as the construction of fixed assets. On the one hand, due to China’s imperfectly competitive financial market environment, the funds acquired by companies mainly derive from the banking financial system; on the other hand, due to information asymmetry and weak protection of investors, banks are more inclined to issue short-term loans to strengthen risk control, which in turn makes companies more likely to use short-term loans to meet long-term investment needs [42]. Under the environmental conditions of green transformation and upgrading, the impact of the green credit policy on the maturity mismatch between investment and financing problem in polluting companies can be analysed in two dimensions: corporate credit policy accommodation behaviour and bank credit supply.
From the perspective of corporate credit policy accommodation behaviour, changes in the macroeconomic situation and financial credit policy adjustments affect the overall market demand, which in turn encourages companies to adjust their investment decisions based on changes in market prospects [29]. By optimising resource allocation, the green credit policy promotes the upgrading of industrial structure [11], guiding the transformation of corporate production and social lifestyle in a green and sustainable direction, thus greatly affecting the market prospects of polluting companies. After the implementation of the green credit policy, polluting companies can only resolve the current development dilemma by production scale reduction and green transformation and upgrading. Therefore, polluting companies tend to reduce the production scale by cutting and postponing the cash expenditures of investment activities such as fixed assets to cope with the economic and environmental impacts [43]. At the same time, polluting companies may make more environmental protection investments to enhance the performance in the bank’s green credit review. Environmental protection investment is generally dedicated to the purchase of environmental protection facilities, the improvement of environmental protection technology and systems and the treatment of polluting emissions [44], which present long-term investment characteristics. Therefore, after the implementation of the green credit policy, the polluting companies’ production scale reduction and green transformation and upgrading do not significantly affect their long-term investment.
From the perspective of bank credit supply, the implementation of the green credit policy has enabled the banks to strengthen the green credit review of polluting companies. Penalties such as high pollution taxes, huge fines and production suspension have increased the possibility that polluting companies will be unable to repay their debts [45]. Considering self-interest and the need to avoid credit risks, banks may control the amount of short-term loans to polluting companies, which will positively affect alleviating the maturity mismatch between investment and financing.
In summary, this paper proposes the following hypothesis:
After the release of the guidelines, the extent of maturity mismatch between investment and financing has dropped significantly in polluting companies.
3. Research Design
3.1. Sample and Data
This paper took China’s A-share listed companies from 2009 to 2016 as the research sample, with polluting companies as the experimental group and the remaining companies as the control group. The sample data are controlled in this interval, because on the one hand, there were other green credit policies issued in 2007 and 2008, while the sample interval controlled from 2009 to 2016 can avoid the influence of previous policies and obtain the net effect of green credit policies. On the other hand, the existence of sequence correlation using DID method will lead to the underestimation of the standard deviation of the estimator, making the value of T statistic larger, and thus, excessively rejecting the null hypothesis. Therefore, the data that spans a long period of time may cause serial-related problems, which can be alleviated by controlling the sample within 2016.The sample was further processed as follows: (1) companies that have been specially treated (ST, * ST) during the research year were deleted; (2) the sample of companies in the financial industry were deleted; (3) samples with missing variables were deleted; (4) all continuous variables were winsorised at the 1% and 99% quantiles annually. Finally, 14,045 observations were obtained, of which the experimental group included 4220 observations and the control group 9825 observations.
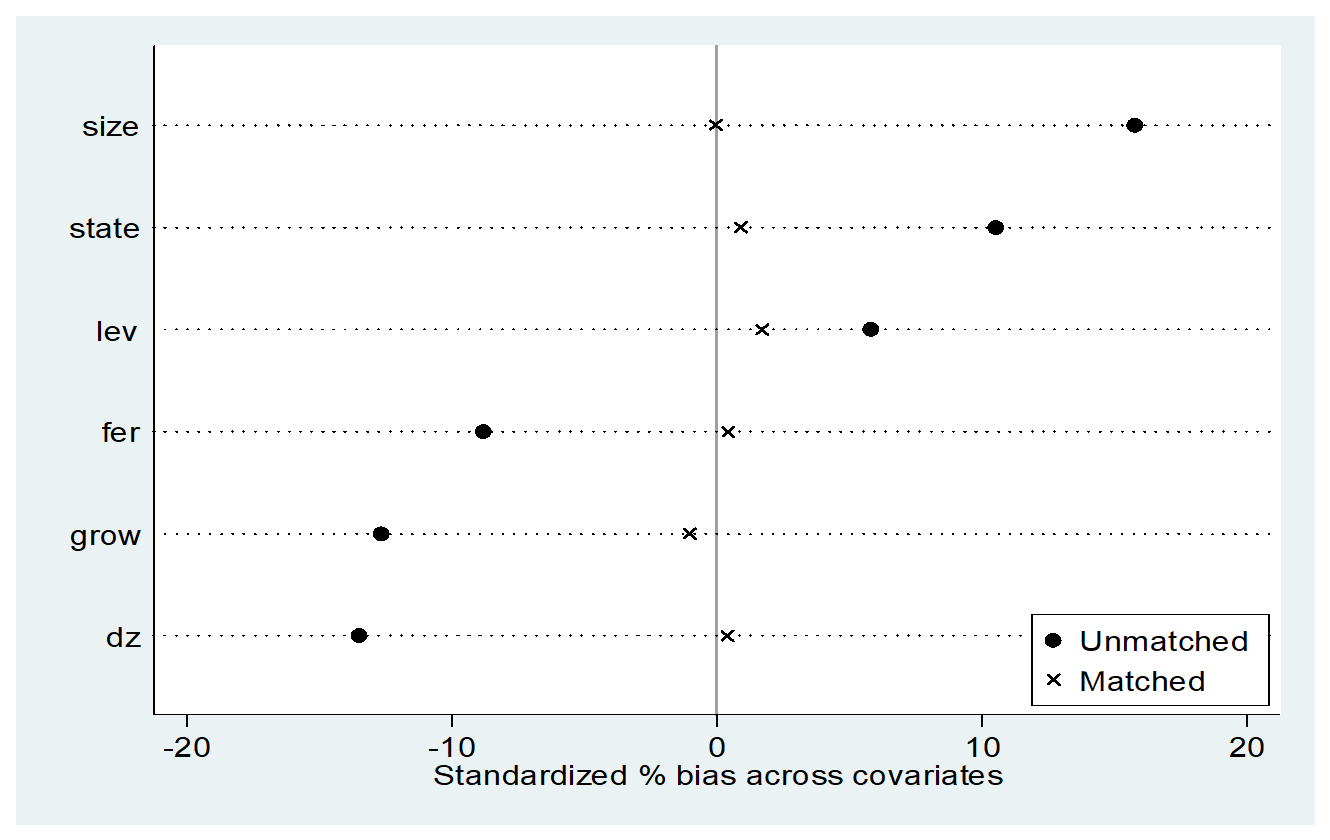
Double-difference models are often used in quantitative evaluation of public policies. Two groups of changes have been obtained by making the first difference before and after the implementation of the policies. After the first difference, the heterogeneity of individuals does not change with time, and can then be eliminated; the second difference is made for the two groups of changes to eliminate the increment of changes with time, and finally, the net effect of the implementation of the policy will be obtained. Moreover, the estimation results of double-difference models are strictly dependent on the selection of the control group. In order to reflect the robustness of these results, this article uses the propensity score matching method to further match the control group in the contaminated samples, that is, to find the individuals with similar characteristics to the experimental group in the control group, eliminate the deviation of sample selection and ensure that the balance hypothesis is satisfied between the experimental group and the control group. Specifically, with corporate characteristic variables of asset-liability ratio (Lev), company size (Size), whether the chairman and general manager were the same person (Dz), the main business income growth rate (Grow), the fixed expense repayment multiple (Fer) and company nature (State), we regressed the experimental group and the control group based on the dual probit model, matching the experimental group with the control group whose matching probability value was the closest based on the propensity score value. After processing, 9402 observations were obtained, including 4220 in the experimental group and 5182 in the control group. To guarantee the reliability of the propensity score matching results, we conducted a balance test. As shown in Table 1 and Figure 2, the standard deviation of all variables had an absolute value less than 3% after matching, and the standard deviation of each variable became smaller after matching. The p-values of the t-test were all greater than 10% after matching, indicating that there was no significant difference between the experimental group and the control group in all variables after matching.
3.2. Double Difference Model
We examined the impact of the green credit policy on the problem of maturity mismatch between investment and financing in polluting companies based on the following double difference model:
where Mmif is the maturity mismatch between investment and financing index for companies; treated is a group dummy variable (corporate value of the experimental group is 1 and that of the control group is 0); after is the event dummy variable, and the release of guidelines in 2012 was taken as the time dividing point (the value is 1 in 2012 and later, and 0 before 2012); is a double difference variable; is a control variable, which includes asset-liability ratio (Lev), company size (Size), total asset growth rate (Gts), total asset net interest rate (Roa), fixed expense repayment multiple (Fer), 10 major shareholders’ shareholding ratio (Block), whether the chairman and general manager were the same person (Dz), main business income growth rate (Grow), own fund ratio (Cfo) and company nature (State); and is a random disturbance term. It can be seen that is the double difference coefficient, which was used to measure the impact of green credit.
3.3. Variables
The key to calculating the extent of maturity mismatch between investment and financing is how to determine the growth of corporate long-term investment needs and short-term credit. The main reason for the radical corporate financing decision of maturity mismatch between investment and financing is that the funds currently held by companies cannot meet the investment needs of constructing fixed assets, which in turn pushes companies to use short-term loans to meet investment needs such as fixed assets. Accordingly, the method applied by Zhong et al. [29], in which the proxy variable that measures the corporate maturity mismatch between investment and financing (Mmif) is: cash expenditure for investment activities such as the purchase and construction of fixed assets—(increase in long-term borrowing in the current period + increase in equity in the current period + net cash flow from operating activities + cash inflow from sales of fixed assets)/total assets at the beginning of the period. Other variables in this paper are shown in Table 2.
Regarding the data sources used: (1) financial data, nature of property rights and corporate attribute information were obtained from the CSMAR database; (2) regional financial development level data were taken from the “Financial Industry Marketization” development measurement index in the boo (2018) China’s Marketization Index Report by Provinces; (3) the corporate environmental protection investment data were gathered from the Yihuo database.
In Table 3, based on descriptive statistics of the sample, the proxy variable of maturity mismatch between investment and financing (Mmif) shows that its mean value is –0.138, the 50th quantile is −0.070, and the 75th quantile is 0.003, indicating that in the sample period, less than half but more than a quarter of the sample, had a serious maturity mismatch between investment and financing.
Table 4 lists the difference in the degree of maturity mismatch between investment and financing between the experimental group and the control group before and after the implementation of the green credit policy. After the implementation of green credit, compared with the control group, the experimental group had significantly reduced (−0.022, t = −2.01) the extent of the maturity mismatch between investment and financing. In the analysis of policy adjustments, due to the impact of chronological factors, if the horizontal differences among the groups were excluded, the resulting conclusions may not be credible. Therefore, column (7) examined the differences between the experimental group and the control group before and after policy implementation, showing that the difference is significant (−0.025, t = −1.89), indicating that the green credit policy can curb the problem of maturity mismatch between investment and financing in polluting companies. The nature of property rights and the area’s financial development level were further distinguished, showing that among state-owned polluting companies and those in areas with low-level financial development, the green credit policy plays a more significant role in controlling the problem of maturity mismatch between investment and financing in polluting companies (−0.031, t = −2.09; −0.038, t = −1.92).
4. Empirical Analysis
4.1. The Green Credit Policy and Maturity Mismatch Between Investment and Financing
Table 5 shows the test results regarding the impact of the green credit policy on the problem of maturity mismatch between investment and financing in polluting companies. When control variables were not added to columns (1) and (2) of the table, the estimated values of the DID crossover term coefficients were all negative after the full sample and PSM sample processing and significant (−0.0281, t = −2.11; −0.0346; t = −2.27). When control variables were added to columns (3) and (4), the DID crossover term coefficients of were also negative after full sample and PSM sample processing, as well as significant (−0.0343, t = −3.59; −0.0262, t = −2.41), indicating that the green credit policy has significantly alleviated the problem of maturity mismatch between investment and financing in polluting companies, therefore verifying the research hypothesis.
4.2. Robustness Test
To test the robustness of the PSM-DID estimation, we adopted a counterfactual method as the results obtained may be caused by other events before the issuance of the guidelines. Using a placebo test with 2007–2012 as the sample interval, 2009 was selected as the time when the virtual policy occurred. The results are presented in columns (1) and (2) of Table 6 and the coefficients were insignificant (−0.0214, t = −1.57; −0.0238, t = −1.62). Therefore, the virtual policy impact did not influence the maturity mismatch between investment and financing in polluting companies. In other words, before the guidelines were issued in 2012, the extent of the maturity mismatch between investment and financing in the experimental group and the control group companies presents a common time trend, indicating that it is ideal to select the 2012 guidelines as a quasi-natural experimental environment, and also verifies the reliability of the DID estimation results in Table 5.
Similarly, after the 2008 financial crisis, China launched a series of economic stimulus policies, such as the “Four Trillion” economic stimulus plan, and down-regulation of deposit and loan interest rates. To consider the potential impact of macroeconomic factors on the maturity mismatch between investment and financing in polluting companies, by referring to Su and Lian [19], we added broad money supply (M2), growth rate (Meu) and GDP growth rate (Gdpu) as control variables. The results in columns (3) and (4) of Table 6 are still consistent with Table 5 (−0.0327, t = −3.43; −0.0239, t = −2.20).
5. Impact Mechanism Research
The empirical test results show that the green credit policy has significantly curbed the problem of maturity mismatch between investment and financing in polluting companies. According to our analysis of the causes of corporate maturity mismatch between investment and financing, the implementation principles of the green credit policy and the investment decisions of polluting companies, the green credit policy may help alleviate the problem of maturity mismatch between investment and financing in polluting companies by instructing such companies to reduce the original production scale and shift to environmental protection investment. This enables banks to reduce the release of short-term loans.
5.1. The Influence Path of Long-Term Investment
According to our theoretical analysis, to cope with the impact of the green credit policy on their market prospects, polluting companies reduce the original production scale and shift to environmental protection investment, thus achieving green transformation and upgrading. Therefore, their long-term investment has not significantly increased or decreased due to the green credit policy. To test the above analysis, formula (2) was constructed as follows:
where Live represents long-term investment, which is measured by the increase in the purchase and construction of fixed assets and is standardised by total assets. The regression results are shown in Table 7.
From Table 7, it can be seen that the Treated × After DID crossover term coefficients of the full sample and the PSM sample without control variables are not significantly negative (−0.0014, t = −0.78; −0.0030, t = −1.48); the Treated × After DID crossover term coefficients of the full sample and the PSM sample with control variables are also not significantly negative (−0.0013, t = −0.80; −0.0021, t = −1.08). This verifies our assumption that after the implementation of the green credit policy, polluting companies reduced the original production scale while increasing environmental protection investment, thereby alleviating the maturity mismatch between investment and financing.
5.2. The Influence Path of Short-Term Loans
In our theoretical analysis, after the implementation of the green credit policy, banks strengthen their green credit review and reduce the supply of short-term loans for polluting companies, which in turn alleviates the problem of maturity mismatch between investment and financing in such companies. To test the above analysis, formula (3) was constructed as follows:
where Sdebt stands for short-term loans, which is measured by the increase in short-term loans and standardised through total assets. To eliminate the impact of corporate investment on short-term financing, we controlled the long-term investment (Live) of the year. The regression results are shown in Table 8.
From Table 8, the Treated × After DID crossover term coefficients of the full sample and PSM sample without control variables were significantly negative (−0.0052, t = −1.98; −0.0056, t = −1.92). Although the Treated × After DID crossover term coefficients of the full sample were not significantly negative, those of the PSM sample were also significantly negative (−0.0037, t = −1.48; −0.0047, t = −1.96). This is also consistent with our assumption.
6. Further Analysis
6.1. Banks’ Response to Corporate Accommodation to Green Transformation
The green credit policy adjusts the overall supply of funds on the market and provides financial support for projects that advocate a circular economy, environmental protection and energy conservation and emission reduction [46]. According to the theory of social reputation management, valuing reputation and actively practising environmental responsibilities can enhance the competitiveness of banks [20]. Green credit is a reflection of banks’ fulfilment of environmental responsibilities in the course of business operations [47]. By providing credit support to polluting companies that accommodate themselves to the green credit policy and encouraging the green transformation and development of polluting companies, it is possible to positively promote banks’ social reputation. Therefore, in the context of China’s financial repression, after the implementation of the green credit policy, if polluting companies adjust themselves to the policy, it will be easier for them to acquire short-term loans, thereby weakening the mitigation effect on the maturity mismatch between investment and financing behaviour.
To test this possibility, we divided the samples of polluting companies into two groups based on whether they made environmental protection investments: one group with environmental protection investments and another group without environmental protection investments. A regression analysis was conducted, respectively, with regression results shown in Table 9. When testing the sample group with environmental protection investment, we found that the Treated × After DID crossover term coefficients of the full sample and PSM sample were not significantly positive (0.0216, t = 1.32; 0.0150, t = 0.82), indicating that banks tend to increase short-term loans for polluting companies with environmental protection investment, which weakens the mitigation effect on the maturity mismatch between investment and financing behaviour. We then tested the sample group without environmental protection investment. Although the Treated × After DID crossover term coefficients of the full sample were not significantly negative, those of the PSM sample were also significantly negative (−0.0130, t = −1.62; −0.0251, t = −1.99), indicating that after the implementation of the green credit policy, polluting companies without environmental protection investment acquire fewer short-term loans, thereby alleviating the maturity mismatch between investment and financing.
6.2. The Green Credit Policy and Maturity Mismatch Between Investment and Financing: Heterogeneity Analysis of the Nature of Property Rights
In the Chinese system, state-owned and non-state-owned companies have natural differences in their relationship with the government. The strategy of companies regarding the implementation of the green credit policy will show differences due to the different nature of their property rights. On the one hand, because state-owned companies undertake more national policy-oriented tasks, they play an important role in guiding the green transformation and upgrading of the entire industry. Therefore, in the context of the implementation of the green credit policy, banking financial institutions will pay more attention to the credit management of state-owned polluting companies. Moreover, considering that state-owned companies act as local pillar companies, to achieve faster green transformation and upgrading of state-owned polluting companies, banks may be more willing to issue long-term credit funds to state-owned companies [48], thereby alleviating the maturity mismatch between investment and financing. On the other hand, compared with state-owned polluting companies, non-state-owned polluting companies may have weak execution power when implementing the green credit policy, owing to the long cycle of green transformation and uncertainty of future earnings, and they may not reduce investment in original fixed assets. Moreover, because of the huge market share of non-state-owned companies, banks will relax the short-term loan management of non-state-owned polluting companies in pursuit of their interests [49]. According to the above analysis, the role of green credit in curbing maturity mismatch between investment and financing will produce different impacts on companies with different property rights.
We divided the full sample and PSM sample into state-owned and non-state-owned companies according to the nature of property rights (State), with test results shown in Table 10. In the group test of state-owned companies, the Treated×After DID crossover item coefficients of the full sample and PSM sample were significantly negative (−0.0374, t = −3.30; −0.0326, t = −2.53), whereas for non-state-owned companies, the Treated × After DID crossover term coefficients of the full sample and PSM sample were negative but insignificant (−0.0231, t = −1.49; −0.0136, t = −0.78), indicating that the green credit policy mainly curbs the maturity mismatch between investment and financing in state-owned polluting companies.
6.3. The Green Credit Policy and Corporate Maturity Mismatch Between Investment and Financing: The Influence of the Regional Financial Development Level
For the Chinese market, which is undergoing financial changes, the in-depth development of the financial system not only improves market competitiveness and credit resource allocation efficiency, but also affects the relationship between the green credit policy and maturity mismatch between investment and financing in polluting companies. Financial development level is mainly manifested as the development of the banking industry and financial intermediaries. With the improvement of financial development level, the banking industry will increase the funds’ supply and improve loan release efficiency for companies [50,51,52,53]. Financial intermediaries’ role as the creator of financial instruments is mainly to mobilise and pool scattered reserves, to provide financing for large-scale, short-term investments. Therefore, in areas with relatively high-level financial development, the high-level allocation of credit resources and developed financial tools facilitate short-term loans for companies, which will adversely affect the role of the green credit policy in alleviating the maturity mismatch between investment and financing.
We adopted the “financial industry marketisation” indexes disclosed in the book China’s Marketization Index Report by Provinces by Wang, Fan and Hu (2018) as substitution variables to measure the financial development level in the area. According to whether the “financial industry marketisation” index of the area where the company is located was greater than and equal to the median or less than the median, the full sample and PSM sample were divided into companies in areas with high-level financial development and those in areas with low-level financial development. The results are shown in Table 11. In the group test oriented to areas with high-level financial development, although the Treated×After DID crossover term coefficients of the full sample were significantly negative, those of the PSM sample were insignificantly negative (−0.0239, t = −1.76; −0.0144, t = −0.96). In the group test oriented to areas with low-level financial development, the Treated × After DID crossover term coefficients of the full sample and the PSM sample were significantly negative (−0.0424, t = −3.18; −0.0346, t= −2.24), indicating that the green credit policy plays a more prominent role in alleviating the maturity mismatch between investment and financing among polluting companies in areas with low-level financial development.
7. Conclusions
In recent years, the relationship between green credit policies and the realisation of sustainable development goals has also become the focus of academic research because green finance has become a hot topic in the global financial field, with the background that China continuously advocates the transformation of its economic development mode. Many studies have also revealed the impact of green credit policies on corporate financial risks by focusing on the fields of corporate financing and investment, but few studies have been made on the impact of green credit policies on the financial risks of maturity mismatch between investment and financing in polluting companies. In the face of the common maturity mismatch between investment and financing among Chinese enterprises, this paper constructs a quasi-natural experiment using the 2012 Green Credit Guidelines as an event to evaluate the impact of the green credit policy on maturity mismatch between investment and financing in polluting companies employing the propensity score matching—difference-in-differences (PSM-DID) model. The research conclusions are as described below.
Our research confirms that the green credit policies have alleviated the problem of the maturity mismatch between investment and financing in polluting companies and promoted the green and sustainable development of the industry. This result is in line with other empirical studies, which have found that the improvement of the appropriate level of monetary policy can directly inhibit the problem of the maturity mismatch between investment and financing [29]. This conclusion also enriches the research status of the relationship between the green credit policy and sustainable development.
Through a mechanism test, our research finds that the main path of green credit policies to alleviate the problem of maturity mismatch between investment and financing in polluting companies is to reduce short-term loans. This result is consistent with the research that the financing constraints of the green credit policy on polluting enterprises are only reflected in short-term credit loans [5]. This study also enlightens, within the financing environment of China’s financial repression, that it is difficult for companies to gain long-term credit support. Although the implementation of green credit policies can alleviate the maturity mismatch between investment and financing in polluting companies, it is at the cost of strict control over, or even reduction of the credit supply; hence, companies are more likely to face the dilemma of “difficult financing–reduced investment–reduced business performance”. Moreover, our study also finds that polluting enterprises have increased investment in environmental protection while reducing the original production scale. This is in line with the works of Hamamoto [8] and Li [54], who suggested that green credit policies stimulate the internal motivation of enterprises to reduce emissions and enable them to actively reduce emissions through technological innovation. The results of this study also reveal that green credit supply of banks will be based on companies’ green investment behaviour, but for companies participating in green transformation, it will still be mainly provided via short-term loans. Therefore, although the implementation of green credit policies helps polluting companies to engage in green transformation for the sake of bank credit, it will not help to alleviate the problem of maturity mismatch between investment and financing in such polluting companies.
Our research has also discussed the consistent impact of the green credit policy on the maturity mismatch between investment and financing arising from the nature of property rights and the level of regional financial development. The study finds that the green credit policies have more significant control over the problem of maturity mismatch between investment and financing for state-owned polluting enterprises. This result is in agreement with the research conclusion that under the influence of green credit policies, the contraction of capital investment in state-owned polluting enterprises is more significant [55]. This study also confirms that the green credit policy will have more significant control over the problem of maturity mismatch between investment and financing for polluting enterprises in areas with low level of financial development. This conclusion also reveals that the implementation effects of green credit policies are heterogeneous; moreover, it enriches the research status of the green credit policy implementation.
Based on the above research conclusions and insights, we would like to propose the following recommendations to the government, companies and banks: (1) For the government, it is necessary to further accelerate the market-oriented reform process of financial credit, make monetary finance more relevant to the real economy and alleviate the financing constraints faced by polluting companies in green transformation through the rational allocation of long-term and short-term loans. Thus, it is essential for the government to encourage commercial banks and other financial institutions to continuously innovate and optimise green financial products and businesses, and simultaneously increase the long-term credit supply of banks and promote optimised capital allocation in order to boost the sustainable development of polluting companies; (2) For banks, in terms of implementing the green credit review, it is necessary to strengthen cooperation with environmental protection departments, fully understand the green transformation performance of polluting companies and increase long-term loans. It is also advisable for banks to strengthen the green credit management of non-state-owned financial institutions in areas with high-level financial development, and to reasonably control the credit supply to such polluting companies; (3) For companies, when affected by the green credit policy, polluting companies should actively increase environmental protection investment while reducing the original production scale, and also fully implement green transformation to better cope with banks’ green reviews and increase banks’ willingness to release long-term loans. Companies should pay much attention to their maturity mismatch between investment and financing during the process of green transformation, to strengthen their independent innovation capabilities, to improve the efficiency of green transformation and upgrading, to enhance their long-term profitability, to reduce dependence on bank loans and to actively expand their equity-financing channels to alleviate the financial risk caused by maturity mismatch between investment and financing.
The impact of green credit policies on the risk of maturity mismatch between investment and financing in polluting companies has been discussed and studied in this paper, but there are still some limitations that need to be expanded on and improved. First of all, our research does not take some aspects into consideration, such as the adjustment effect of government subsidies and other influencing factors on the risk of maturity mismatch between investment in polluting companies. Secondly, due to the lack of data about comprehensive corporate pollution emissions, it cannot be ruled out that there may be unobserved companies in the control group, but companies with higher pollution levels may be affected by the green credit policies. Finally, although there is no obvious gap between China and other developed countries in terms of policy formulation, there are still some serious deficiencies in terms of policy enforcement. Due to the inconsistent goals from the central governments, local governments and banks when implementing their green credit policies, the game of interests among them may affect the policy effect. Thus, this article does not study the dynamic policy effects after the implementation of the green credit policies. In the future, more research on the effect of green credit policies implementation still needs further improvement of related micro-data mining and other research methods.
Author Contributions
Conceptualisation, Y.Z. and L.Y.; methodology and formal analysis, Y.C.; writing—original draft preparation, Y.C.; writing—review and editing, R.Y.M.L., M.J.C.C. and Y.Z.; supervision, Y.Z. and L.Y.; funding acquisition, Y.Z. All authors have read and agreed to the published version of the manuscript.
Funding
The paper was supported by the following fund project: National Social Science Focus Project (project no. 15AGL008).
Conflicts of Interest
The authors declare no conflict of interest.
References
- Liu, X.L.; Wen, S.Y. Should China’s financial institutions bear environmental responsibility? Basic facts, theoretical models and empirical tests. J. Econ. Res. 2019, 54, 38–54. (In Chinese) [Google Scholar]
- Zhang, B.; Yang, Y.; Bi, J. Tracking the implementation of green credit policy in China: Top-down perspective and bottom-up reform. J. Environ. Manag. 2011, 92, 1321–1327. [Google Scholar] [CrossRef] [PubMed]
- Chang, K.; Zeng, Y.; Wang, W.; Wu, X. The effects of credit policy and financial constraints on tangible and research & development investment: Firm-level evidence from China’s renewable energy industry. Energy Policy 2019, 130, 438–447. [Google Scholar] [CrossRef]
- Hot, V.H. Sustainable finance & China’s green credit reforms: A Test Case for bank monitoring of environmental risk. J. Cornell Int. Law 2018, 51, 609–681. [Google Scholar]
- Lili, L. Does green credit influence debt financing cost of business?—A comparative study of green businesses and “two high” businesses. J. Financ. Econ. 2015, 30, 83–93. (In Chinese) [Google Scholar]
- Wang, Y.; Shen, N. Environmental regulation and environmental productivity: The case of China. J. Renew. Sustain. Energy Rev. 2016, 62, 758–766. (In Chinese) [Google Scholar] [CrossRef]
- Gray, W.B.; Shadbegian, R.J. Plant vintage, technology, and environmental regulation. J. Environ. Econ. 2003, 46, 384–402. [Google Scholar] [CrossRef] [Green Version]
- Hamamoto, M. Environmental regulation and the productivity of Japanese manufacturing industries. Resour. Energy Econ. 2006, 28, 299–312. [Google Scholar] [CrossRef]
- Liu, J.; Xie, J. Environmental regulation, technological innovation, and export competitiveness: An empirical study based on china’s manufacturing industry. Int. J. Environ. Res. Public Health 2020, 17, 1427. [Google Scholar] [CrossRef] [Green Version]
- Serrano-Cinca, C.; Gutiérrez-Nieto, B.; Reyes, N.M. A social and environmental approach to microfinance credit scoring. J. Clean. Prod. 2016, 112, 3504–3513. [Google Scholar] [CrossRef] [Green Version]
- Li, Y.; Hu, H.Y.; Li, H. An empirical analysis on the impact of green credit on china’s industrial structure upgrading—Based on china’s provincial panel data. J. Econ. Prob. 2020, 1, 37–43. (In Chinese) [Google Scholar]
- Ding, N.; Ren, Y.N.; Zuo, Y. Do the losses of the green-credit policy outweigh the gains? A PSM-DID Cost-efficiency analysis based on resource allocation. J. Financ. Res. 2020, 4, 112–130. (In Chinese) [Google Scholar]
- Bao, X.L.; Luo, Q.S.; Li, S.C. Corporate social responsibility and maturity mismatch between investment and financing: Evidence from polluting and non-polluting companies. Sustainability 2020, 12, 4972. [Google Scholar] [CrossRef]
- Hu, Y.; Jiang, H.; Zhong, Z. Impact of green credit on industrial structure in China: Theoretical mechanism and empirical analysis. Environ. Sci. Pollut. Res. 2020, 27, 10506–10519. [Google Scholar] [CrossRef]
- He, L.; Zhang, L.; Zhong, Z.; Wang, D.; Wang, F. Green credit, renewable energy investment and green economy development: Empirical analysis based on 150 listed companies of China. J. Clean. Prod. 2019, 208, 363–372. [Google Scholar] [CrossRef]
- Popovich, N. Green Credit rewards: Credit cards that come with environmental benefits. J. Envi. Mag. 2011, 30, 148–174. [Google Scholar]
- Li, X.X.; Xia, G.; Cai, N. Green finance and sustainable development. J. Financ. Econ. 2015, 20, 30–40. (In Chinese) [Google Scholar]
- Allet, M.; Hudon, M. Green microfinance: Characteristics of microfinance institutions involved in environmental management. J. Bus. Ethics 2015, 126, 395–414. [Google Scholar] [CrossRef] [Green Version]
- Su, D.W.; Lian, L.L. Does green credit affect the investment and financing behavior of heavily polluting enterprises? J. Financ. Res. 2018, 12, 123–137. (In Chinese) [Google Scholar]
- Qi, M. Green Credit, Financial Ecological Environment, and Investment Efficiency. J. Complex 2021, 5, 1–14. (In Chinese) [Google Scholar]
- Khidmat, W.B.; Wang, M.; Awan, S. The value relevance of R&D and free cash flow in an efficient investment setup: Evidence from Chinese A-listed firms. J. Asian Account. Res. 2019, 4, 95–111. [Google Scholar]
- Al-Dhamari, R.A.; Ismail, K.N.I.K. An investigation into the effect of surplus free cash flow, corporate governance and firm size on earnings predictability. Int. J. Account. Inf. Manag. 2014, 22, 118–133. [Google Scholar] [CrossRef]
- Huang, K.F.; Shen, H.B. Debt sources, debt maturity structure and cash flow over-investment: Empirical evidence based on Chinese listed manufacturing companies. J. Financ. Res. 2009, 9, 143–155. [Google Scholar]
- Greenstone, M.; List, J.A.; Syverson, C. The Effects of Environmental Regulation on the Competitiveness of US Manufacturing; National Bureau of Economic Research: Cambridge, MA, USA, 2012. [Google Scholar]
- Diamond, D.W. Debt maturity structure and liquidity risk. J. Q. Econ. 1991, 106, 709–737. [Google Scholar] [CrossRef]
- Zhang, Z. Law and economic growth in china: A case study of the stock market. J. Asian Law Soc. 2018, 5, 333–357. [Google Scholar] [CrossRef] [Green Version]
- Tong, P.; Lu, Z.F. Impact of debt financing on corporate investment behavior: Review and prospects. J. Account. Res. 2005, 12, 71–76, 96. (In Chinese) [Google Scholar]
- Deng, K.B.; Zeng, H.J. Financing constraints of chinese enterprises: Characteristic phenomenon and genesis test. J. Econ. Res. 2014, 49, 47–60, 140. (In Chinese) [Google Scholar]
- Zhong, K.; Cheng, X.K.; Zhang, W.H. The Moderate adjustment of monetary policy and the phenomenon of corporate long-term investment with short-term financing. J. Work App. Manag. 2016, 3, 87–98, 114, 188. (In Chinese) [Google Scholar]
- Liu, J.Y.; Xia, Y.; Lin, S.M. Analysis on china’s green credit policy’s short, medium- and long-term impact based on financial cge model. J. Manag. Sci. 2015, 23, 46–52. (In Chinese) [Google Scholar]
- Pan, D. The economic and environmental effects of green financial policy in China: A DSGE approach; University College London: London, UK, 2019. [Google Scholar]
- Lai, P.; Cao, G.H.; Zhu, Y. Study on regional coalition of watershed water pollution abatement based on differential games. J. Syst. Manag. 2013, 22, 308–316. [Google Scholar]
- Xing, C.; Zhang, Y.M.; Wang, Y. Do banks value green management in china? The perspective of the green credit Policy. J. Financ. Res. Lett. 2020, 35, 101601. [Google Scholar] [CrossRef]
- Custodio, C.; Ferreira, M.A.; Laureano, L. Why are US firms using more short-term debt? J. Financ. Econ. 2013, 108, 182–212. [Google Scholar] [CrossRef]
- Allen, F.; Qian, J.; Qian, M. Law, finance, and economic growth in China. J. Financ. Econ. 2005, 77, 57–116. [Google Scholar] [CrossRef] [Green Version]
- Kahl, M.; Shivdasani, A.; Wang, Y. Short-term debt as bridge financing: Evidence from the commercial paper market: Short-term debt as bridge financing. J. Financ. 2015, 70, 211–255. [Google Scholar] [CrossRef]
- Murillo, C.; Erasmo, G.; Graham, J.R. Liquidity management and corporate investment during a financial crisi. J. Financ. Stud. 2011, 6, 1944–1979. [Google Scholar]
- Lian, Y.J.; Peng, F.P.; Su, Z. Financial constraints and liquidity management behavior. J. Financ. Res. 2010, 10, 158–171. (In Chinese) [Google Scholar]
- Ma, H.; Hou, G.S.; Wang, Y.Y. Finance-industrial integration and maturity mismatch between investment and financing in Chinese: Based on empirical data of listed companies. J. Nankai Manag. Rev. 2018, 21, 46–53. (In Chinese) [Google Scholar]
- Bai, Y.X.; Qiu, M.Q.; Li, W. Maturity mismatch between investment and financing and its institutional explanation—Evidence from compariosn of chinese and U.S. financial markets. J. Indus. Econ. 2016, 7, 23–39. (In Chinese) [Google Scholar]
- Acharya, V.V.; Gale, D.; Yorulmazer, T. Rollover Risk and Market Freezes. J. Financ. 2011, 66, 1177–1209. [Google Scholar] [CrossRef] [Green Version]
- Armstrong, C.S.; Guay, W.R.; Weber, J. The role of information and financial reporting in corporate governance and debt contracting. J. Account. Econ. 2010, 50, 179–234. [Google Scholar] [CrossRef] [Green Version]
- Zhang, C.; Lu, Y.; Guo, L.; Yu, T.S. The intensity of environmental regulations and the progress of production technology. J. Econ. Res. 2011, 46, 113–124. (In Chinese) [Google Scholar]
- Guoping, T. Environmental regulation, industry attributes and corporate environmental protection investment. J. Account. Res. 2013, 6, 83–89, 96. (In Chinese) [Google Scholar]
- Fan, Z.Y.; Tian, B.B. Tax competition, tax enforcement and corporate tax avoidance. J. Econ. Res. 2013, 48, 99–111. (In Chinese) [Google Scholar]
- Cai, H.J.; Wang, X.Y.; Tan, C. Green credit policy, new bank loans to enterprises and environmental protection effect. J. Account. Res. 2019, 3, 88–95. (In Chinese) [Google Scholar]
- Sullivan, N.; Dwyer, B. The structuration of issue-based fields: Social accountability, social movements and the Equator Principles issue-based field. J. Account. Organ. Soc. 2015, 43, 33–55. [Google Scholar] [CrossRef]
- Cao, C.F.; Xu, N.; Lu, D. Pyramid layers, long-term loans allocation, and efficiency of long-term loans use: Based on local state-owned listed companies. J. Nankai Manag. Rev. 2015, 18, 115–125. (In Chinese) [Google Scholar]
- Sun, Z.; Liu, F.W.; Li, Z.Q. Marketization degree, government intervention and corporate debt maturity structure: Empirical evidence from domestic listed companies. J. Econ. Res. 2005, 5, 52–63. (In Chinese) [Google Scholar]
- Shen, H.B.; Kou, H.; Zhang, C. An empirical study of financial development, financing constraints and corporate investment. J. Ind. Econ. 2010, 6, 55–64. (In Chinese) [Google Scholar]
- Zhu, H.; He, X.J.; Chen, S. Financial Development, Soft Budget Constraints, and Firm Investment. J. Account. Res. 2006, 10, 64–71, 96. (In Chinese) [Google Scholar]
- Claessens, S.; Ueda, K.; Yafeh, Y. Institutions and financial frictions: Estimating with structural restrictions on firm value and investment. J. Dev. Econ. 2014, 110, 107–122. [Google Scholar] [CrossRef]
- Ji, D.; Liu, Y.; Zhang, L.; An, J.; Sun, W. Green social responsibility and company financing cost-based on empirical studies of listed companies in china. Sustainability 2020, 12, 6238. [Google Scholar] [CrossRef]
- Li, X.; Lu, X.; Tao, X. Does the intensity of environmental regulation affect the trade comparative advantage of China’s industrial sector. J. World Econ. 2012, 4, 62–78. (In Chinese) [Google Scholar]
- Ding, J. Green credit policy, credit resources allocation and strategic response of enterprises. J. Econ. Rev. 2019, 4, 62–75. (In Chinese) [Google Scholar]
Figure 1.
Maturity mismatch between investment and financing in polluting and non-polluting companies.
Figure 1.
Maturity mismatch between investment and financing in polluting and non-polluting companies.

Figure 2.
Standard deviation diagram after matching.


Table 1.
Balance test results before and after propensity score matching (PSM).
| Variables | Type | Experimental Group | Control Group | Standard Deviation% | Standard Deviation Change% | t Value | p > |t| |
|---|---|---|---|---|---|---|---|
| Lev | before matching | 0.448 | 0.435 | 5.8 | 70.9 | 3.16 | 0.002 |
| after matching | 0.448 | 0.444 | 1.7 | 0.78 | 0.438 | ||
| Size | before matching | 22.149 | 21.945 | 15.8 | 99.7 | 8.62 | 0.000 |
| after matching | 22.149 | 22.149 | −0.0 | −0.02 | 0.982 | ||
| Dz | before matching | 0.190 | 0.246 | −13.5 | 97.0 | −7.20 | 0.000 |
| after matching | 0.190 | 0.189 | 0.4 | 0.19 | 0.846 | ||
| Grow | before matching | 0.145 | 0.203 | −12.7 | 91.9 | −6.67 | 0.000 |
| after matching | 0.145 | 0.149 | −1.0 | −0.53 | 0.599 | ||
| Fer | before matching | 3.059 | 3.943 | −8.8 | 95.1 | −4.52 | 0.000 |
| after matching | 3.059 | 3.016 | 0.4 | 0.20 | 0.841 | ||
| State | before matching | 0.478 | 0.426 | 10.5 | 91.6 | 5.73 | 0.000 |
| after matching | 0.478 | 0.474 | 0.9 | 0.40 | 0.687 |
Table 2.
Definition of the analysis model variables.
| Variable Type | Variable Name | Symbol | Definition |
|---|---|---|---|
| Explained variable | maturity mismatch between investment and financing | Mmif | (cash expenditure for investment activities such as the purchase and construction of fixed assets—(increase in long-term borrowing in the current period + increase in equity in the current period + net cash flow from operating activities + cash inflow from sales of fixed assets))/total assets at the beginning of the period The smaller the Mmif value, the lower the risk of maturity mismatch between investment and financing will be |
| Explanatory variable | Double differences | Treated | The Trested value is the policy impact dummy variable, Treated Value 1 is polluted enterprise, and the value of 0 is non-polluted enterprise |
| After | The After value is the time dummy variable; After Value 1 is 2012–2016, and After Value 0 is 2009–2011 | ||
| Treated × After estimate coefficient mainly measures the impact of the green credit policy on the risk of maturity mismatch between investment and financing. < 0 means that after the implementation of green credit, the risk of maturity mismatch between investment and financing in polluting enterprises is less than that of non-polluting enterprises | |||
| Control variable | Asset-liability ratio | Lev | total liabilities/total assets |
| Company size | Size | natural logarithm of total assets | |
| Growth rate of total assets | Gts | growth of total assets this year/total assets at the beginning of the year | |
| Return on assets | Roa | net profit/average total assets | |
| Fixed expenditure repayment multiple | Fer | (pre-tax profit + fixed expenditure)/fixed expenditure | |
| Main business income growth rate | Grow | (main business income in the current period—main business income in the last period)/main business income in the last period | |
| Own fund ratio | Cfo | (net cash flow from business activities—net cash flow from investment activities)/total assets at the beginning of the period | |
| Shareholding concentration | Block | shareholding ratio of the top ten shareholders | |
| Whether the CEO and the general manager are the same person | Dz | Dz is the dummy variable; the value is 1 if they are the same person, if not, it is 0 | |
| Company nature | State | State is the dummy variable, Value 1 is a state-owned enterprise, and Value 0 is a non state-owned enterprise | |
| Year dummy variable | Year | the value is 1 for the current year and 0 for a non-current year | |
| Industry dummy variable | Industry | the value is 1 for this industry and 0 for other industries | |
| Robustness test variable | Actual M2 growth rate | Meu | (M2 amount in the current period—M2 amount in the previous period)/M2 amount in the previous period |
| GDP growth rate | Gdpu | (current GD previous period GDP)/previous period GDP |
Table 3.
Descriptive Statistics.
| Variable | N | mean | sd | min | p25 | p50 | p75 | max |
|---|---|---|---|---|---|---|---|---|
| Mmif | 14,045 | –0.138 | 0.326 | –2.249 | –0.170 | –0.070 | 0.003 | 0.274 |
| Lev | 14,045 | 0.439 | 0.216 | 0.047 | 0.264 | 0.434 | 0.607 | 0.943 |
| Size | 14,045 | 22.005 | 1.289 | 19.485 | 21.080 | 21.827 | 22.725 | 25.970 |
| Gts | 14,045 | 0.172 | 0.309 | –0.270 | 0.016 | 0.098 | 0.222 | 1.903 |
| Roa | 14,045 | 0.038 | 0.051 | –0.169 | 0.013 | 0.035 | 0.063 | 0.191 |
| Fer | 14,045 | 3.678 | 10.623 | –48.551 | 1.366 | 2.330 | 4.514 | 59.186 |
| Block | 14,045 | 57.586 | 15.615 | 3.587 | 46.556 | 58.577 | 69.480 | 101.160 |
| Dz | 14,045 | 0.229 | 0.420 | 0.000 | 0.000 | 0.000 | 0.000 | 1.000 |
| Grow | 14,045 | 0.185 | 0.475 | –0.569 | –0.031 | 0.105 | 0.270 | 3.191 |
| Cfo | 14,045 | 0.135 | 0.171 | –0.285 | 0.036 | 0.114 | 0.209 | 0.823 |
| State | 14,045 | 0.441 | 0.496 | 0.000 | 0.000 | 0.000 | 1.000 | 1.000 |
Table 4.
Differences between the experimental group and the control group before and after the adjustment of the green credit policy.
Table 4.
Differences between the experimental group and the control group before and after the adjustment of the green credit policy.
| Sample Classification | Before Policy Adjustment | After Policy Adjustment | Difference | DID | |||
|---|---|---|---|---|---|---|---|
| Control Group (1) | Experimental Group (2) | Control Group (3) | Experimental Group (4) | (5) = (2) – (1) | (6) = (4) – (3) | (7) = (6) – (5) | |
| Full sample | −0.144 | −0.141 | −0.114 | −0.136 | 0.003 (0.40) | −0.022 ** (−2.01) | −0.025 * (−1.89) |
| State-owned company | −0.123 | −0.115 | −0.096 | −0.119 | 0.008 (0.97) | −0.023 * (−1.88) | −0.031 ** (−2.09) |
| Non-state-owned company | −0.167 | −0.185 | −0.139 | −0.150 | 0.009 (0.77) | −0.010 (−0.55) | −0.020 (−0.88) |
| Areas with high-level financial development | −0.145 | −0.143 | −0.116 | −0.126 | 0.002 (0.17) | −0.010 (0.69) | −0.012 (0.67) |
| Areas with low-level financial development | −0.142 | −0.138 | −0.112 | −0.146 | 0.005 (0.41) | −0.034 ** (−2.04) | −0.038 * (−1.92) |
Note: The values in parentheses are t-values; ***, ** and * indicate significance at levels of 0.01, 0.05 and 0.1, respectively.
Table 5.
The impact of the green credit policy on the problem of maturity mismatch between investment and financing in polluting companies.
Table 5.
The impact of the green credit policy on the problem of maturity mismatch between investment and financing in polluting companies.
| Mmif | DID | PSM-DID | DID | PSM-DID |
|---|---|---|---|---|
| (1) | (2) | (3) | (4) | |
| Treated | 0.0062 (0.10) | −0.0010 (−0.02) | −0.0147 (−0.36) | −0.0007 (−0.02) |
| After | −0.0504 *** (−3.89) | −0.0329 ** (−2.15) | 0.0077 (0.79) | −0.00009 (−0.01) |
| Treated×After | −0.0281 ** (−2.11) | −0.0346 ** (−2.27) | −0.0343 *** (−3.59) | −0.0262 ** (−2.41) |
| Lev | 0.1024 *** (5.60) | 0.0989 *** (5.36) | ||
| Size | 0.0021 (0.87) | 0.0030 (1.24) | ||
| Gts | −0.5153 *** (−27.81) | −0.5038 *** (−21.09) | ||
| Roa | −0.4068 *** (−5.62) | −0.3686 *** (−5.23) | ||
| Fer | −0.0002 (−0.97) | −0.0002 (−1.03) | ||
| Block | −0.00004 (−0.31) | 0.00006 (0.42) | ||
| Dz | 0.0147 ** (2.88) | 0.0151 ** (2.52) | ||
| Grow | −0.1551 *** (−11.26) | −0.1571 *** (−8.34) | ||
| Cfo | −0.3923 *** (−13.32) | −0.3615 *** (−10.09) | ||
| State | −0.0436 *** (−9.20) | −0.0424 *** (−7.77) | ||
| Control | Year Industry | Year Industry | Year Industry | Year Industry |
| _Cons | −0.1615 *** (−4.64) | −0.1538 ** (−3.30) | −0.0661 (−1.31) | −0.1089 ** (−2.04) |
| N | 14,045 | 9402 | 14,045 | 9402 |
| Adj.R2 | 0.0376 | 0.0378 | 0.5281 | 0.5178 |
Note: The values in parentheses are t-values; ***, ** and * indicate significance at levels of 0.01, 0.05 and 0.1, respectively.
Table 6.
Robustness test.
| Mmif | With 2009 as the Policy Demarcation Point (DID) | With 2009 as the Policy Demarcation Point (PSM-DID) | Add M2, GDP Growth Rate Control Variables (DID) | Add M2, GDP Growth Rate Control Variables (PSM-DID) |
|---|---|---|---|---|
| (1) | (2) | (3) | (4) | |
| Treated | −0.0373 (−1.10) | −0.0252 (−0.51) | −0.0163 (−0.40) | −0.0033 (−0.08) |
| After | −0.0007 (−0.07) | 0.0011 (0.08) | −0.0723 (−1.32) | −0.0746 (−1.17) |
| Treated × After | −0.0214 (−1.57) | −0.0238 (−1.62) | −0.0327 ** (−3.43) | −0.0239 ** (−2.20) |
| Lev | −0.0589 (−2.15) | −0.0317 (−1.05) | 0.1008 *** (5.51) | 0.0970 *** (5.26) |
| Size | 0.0273 *** (7.08) | 0.0255 *** (5.92) | 0.0024 (1.00) | 0.0034 (1.43) |
| Gts | −0.4964 *** (−16.53) | −0.4748 *** (−13.25) | −0.5159 *** (−27.87) | −0.5048 *** (−21.29) |
| Roa | −0.9945 *** (−9.31) | −0.9662 *** (−7.85) | −0.4105 *** (−5.67) | −0.3744 *** (−5.32) |
| Fer | −0.0007 * (−1.85) | −0.0004 (−0.90) | −0.0002 (−0.97) | −0.0002 (−1.03) |
| Block | −0.0002 (−1.10) | 0.00007 (0.34) | −0.00003 (−0.23) | 0.00007 (0.53) |
| Dz | −0.0007 (−0.09) | 0.0039 (0.38) | 0.0147 ** (2.88) | 0.0152 ** (2.55) |
| Grow | −0.1585 *** (−10.42) | −0.1717 *** (−9.00) | −0.1553 *** (−11.27) | −0.1572 *** (−8.36) |
| Cfo | −0.3557 *** (−8.32) | −0.3546 *** (−7.04) | −0.3930 *** (−13.34) | −0.3625 *** (−10.12) |
| State | −0.0328 *** (−4.52) | −0.0406 *** (−4.97) | −0.0441 *** (−9.30) | −0.0433 *** (−7.94) |
| Meu | −0.4906 (−1.39) | −0.4562 (−1.11) | ||
| Gdpu | 0.1655 ** (2.51) | 0.2308 ** (2.99) | ||
| Control | Year Industry | Year Industry | Year Industry | Year Industry |
| _cons | −0.4464 *** (−5.71) | −0.4533 *** (−4.79) | 0.0484 (0.43) | −0.0115 (−0.09) |
| N | 9089 | 6692 | 14,045 | 9402 |
| Adj.R2 | 0.4530 | 0.4494 | 0.5284 | 0.5184 |
Note: The values in parentheses are t-values; ***, ** and * indicate significance at levels of 0.01, 0.05 and 0.1, respectively.
Table 7.
The influence path of long-term investment.
| Live | DID | PSM-DID | DID | PSM-DID |
|---|---|---|---|---|
| (1) | (2) | (3) | (4) | |
| Treated | 0.0049 (0.26) | 0.0059 (0.27) | −0.0021 (−0.12) | −0.0066 (−0.34) |
| After | 0.0075 *** (4.21) | 0.0105 *** (4.69) | 0.0075 *** (4.27) | 0.0095 *** (4.30) |
| Treated × After | −0.0014 (−0.78) | −0.0030 (−1.48) | −0.0013 (−0.80) | −0.0021 (−1.08) |
| Lev | 0.0035 (1.65) | 0.0065 ** (2.43) | ||
| Size | −0.0016 *** (−4.69) | −0.0019 *** (−4.71) | ||
| Gts | 0.0135 *** (10.66) | 0.0139 *** (8.71) | ||
| Roa | 0.0441 (5.03) | 0.0452 *** (4.26) | ||
| Fer | −0.00002 (−0.93) | 3.3342 (0.09) | ||
| Block | 0.00001 (0.85) | 8.3713 (0.30) | ||
| Dz | 0.0015 * (1.73) | 0.0024 * (2.17) | ||
| Grow | 0.0002 (0.30) | −0.0001 (−0.15) | ||
| Cfo | 0.0645 *** (23.67) | 0.0710 *** (20.49) | ||
| State | 0.0017 ** (2.27) | 0.0022 ** (2.37) | ||
| Control | Year Industry | Year Industry | Year Industry | Year Industry |
| _cons | −0.0040 (−0.22) | −0.0064 (−0.31) | 0.0210 (1.16) | 0.0298 (1.45) |
| N | 13,756 | 9316 | 13,756 | 9316 |
| Adj.R2 | 0.0305 | 0.0359 | 0.1328 | 0.1442 |
Note: The values in parentheses are t-values; ***, ** and * indicate significance at levels of 0.01, 0.05 and 0.1, respectively.
Table 8.
The influence path of short-term loans.
| Sdebt | DID | PSM-DID | DID | PSM-DID |
|---|---|---|---|---|
| (1) | (2) | (3) | (4) | |
| Treated | −0.0098 (−0.38) | −0.0046 (−0.12) | 0.0020 (0.08) | 0.0064 (0.16) |
| After | 0.0074 ** (2.69) | 0.0073 ** (2.13) | 0.0014 (0.51) | 0.0023 (0.67) |
| Treated × After | −0.0052 ** (−1.98) | −0.0056 * (−1.92) | −0.0037 (−1.48) | −0.0047 * (−1.96) |
| Lev | 0.0324 (8.51) | 0.0328 (7.09) | ||
| Size | 0.0022 (4.01) | 0.0021 ** (3.17) | ||
| Gts | 0.0436 *** (18.01) | 0.0499 *** (15.15) | ||
| Roa | −0.0458 ** (−2.94) | −0.0572 ** (−3.03) | ||
| Fer | −0.00007 ** (−2.11) | −0.00004 (−0.93) | ||
| Block | 0.0001 (4.00) | 0.0001 *** (4.29) | ||
| Dz | 0.0027 ** (2.21) | 0.0014 (0.90) | ||
| Grow | 0.0107 *** (7.52) | 0.0109 *** (5.71) | ||
| Cfo | −0.0239 *** (−5.74) | −0.0246 (−4.58) | ||
| State | −0.0055 *** (−4.56) | −0.0063 (−4.33) | ||
| Linv | 0.0972 *** (7.19) | 0.0869 *** (5.14) | ||
| Control | Year Industry | Year Industry | Year Industry | Year, Industry |
| _cons | −0.0053 (−0.21) | −0.0109 (−0.28) | −0.0895 ** (−3.35) | −0.0946 ** (−2.22) |
| N | 13741 | 9280 | 13741 | 9280 |
| Adj.R2 | 0.0186 | 0.0235 | 0.1088 | 0.1169 |
Note: The values in parentheses are t-values; ***, ** and * indicate significance at levels of 0.01, 0.05 and 0.1, respectively.
Table 9.
The influence path of environmental protection investment.
| Sdebt | With Environmental Protection Investment | Without Environmental Protection Investment | ||
|---|---|---|---|---|
| DID | PSM-DID | DID | PSM-DID | |
| (1) | (2) | (3) | (4) | |
| Treated | −0.0060 (−0.20) | −0.0106 (−0.33) | −0.0049 (−0.27) | 0.0055 (0.22) |
| After | −0.0263 (−1.49) | 0.0202 (−1.03) | −0.0033 (−0.40) | 0.0041 (0.42) |
| Treated × After | 0.0216 (1.32) | 0.0150 (0.82) | −0.0130 (−1.62) | −0.0251 ** (−1.99) |
| Lev | 0.0429 ** (2.34) | 0.0432 ** (2.29) | −0.0369 (−0.89) | −0.0712 (−1.22) |
| Size | 0.0074 ** (2.73) | 0.0072 ** (2.65) | 0.0125 ** (2.53) | 0.0148 ** (2.25) |
| Gts | 0.0875 *** (7.57) | 0.0911 *** (7.49) | 0.0585 *** (7.02) | 0.0577 *** (4.43) |
| Roa | −0.0732 (−0.89) | −0.0697 (−0.81) | −0.2086 (−1.33) | −0.2440 (−1.14) |
| Fer | −0.0025 (−1.48) | −0.0026 (−1.46) | −0.0001 (−0.51) | 0.00004 (0.10) |
| Block | 0.00008 (0.76) | 0.00007 (0.69) | 0.00008 (0.73) | −0.00003 (−0.20) |
| Dz | 0.0012 (0.22) | 0.0006 (0.12) | −0.0067 (−0.96) | −0.0097 (−0.98) |
| Grow | 0.0400 *** (6.36) | 0.0393 *** (5.95) | 0.0207 *** (4.70) | 0.0263 *** (4.01) |
| Cfo | −0.0362 * (−1.66) | −0.0368 (−1.63) | −0.0138 (−1.08) | 0.0015 (0.09) |
| State | −0.0067 (−1.54) | −0.0062 (−1.42) | −0.0039 (−1.11) | 0.0005 (0.13) |
| Live | 0.0398 (0.50) | 0.0199 (0.24) | 0.1869 ** (3.08) | 0.1500 ** (2.71) |
| Control | Year, Industry | Year, Industry | Year, Industry | Year, Industry |
| _cons | −0.1720 ** (−2.96) | −0.1623 ** (−2.74) | −0.2783 ** (−3.27) | −0.3174 ** (−2.84) |
| N | 2000 | 1951 | 9356 | 6455 |
| Adj.R2 | 0.1563 | 0.1607 | 0.0559 | 0.0601 |
Note: The values in parentheses are t-values; ***, ** and * indicate significance at levels of 0.01, 0.05 and 0.1, respectively.
Table 10.
The impact of green credit on polluting companies with different property rights.
| Mmif | State-Owned Company | Non-State-Owned Company | ||
|---|---|---|---|---|
| DID | PSM-DID | DID | PSM-DID | |
| Treated | 0.0353 (0.69) | 0.0411 (0.67) | −0.0668 (−1.16) | −0.0401 (−0.64) |
| After | −0.0083 (−0.65) | −0.0120 (−0.83) | 0.0443 ** (2.77) | 0.0342 (1.70) |
| Treated × After | −0.0374 ** (−3.30) | −0.0326 ** (−2.53) | −0.0231 (−1.49) | −0.0136 (−0.78) |
| Lev | 0.0511 *** (2.21) | 0.0396 (1.50) | 0.1700 *** (6.02) | 0.1723 *** (6.56) |
| Size | 0.0073 ** (2.42) | 0.0081 ** (2.63) | −0.0039 (−0.87) | −0.0037 (−0.88) |
| Gts | −0.2960 *** (−7.39) | −0.2445 *** (−5.11) | −0.5976 *** (−28.37) | −0.6133 *** (−22.72) |
| Roa | −0.5199 *** (−4.80) | −0.4954 *** (−4.74) | −0.4255 *** (−4.30) | −0.4083 *** (−4.26) |
| Fer | −0.0003 (−0.90) | −0.0002 (−0.05) | −0.00009 (−0.30) | −0.0002 (−0.80) |
| Block | −0.0011 *** (−5.44) | −0.0012 *** (−5.40) | 0.0009 *** (4.65) | 0.0012 *** (6.29) |
| Dz | −0.0152 (−1.49) | 0.0004 (0.04) | 0.0192 ** (3.25) | 0.0145 ** (2.08) |
| Grow | −0.2043 *** (−9.92) | −0.2274 *** (−8.03) | −0.1233 *** (−6.79) | −0.1012 *** (−4.23) |
| Cfo | −0.4184 *** (−8.17) | −0.4262 *** (−6.59) | −0.3638 *** (−9.98) | −0.3070 *** (−7.42) |
| Control | Year, Industry | Year, Industry | Year, Industry | Year, Industry |
| _cons | −0.1263 ** (−2.05) | −0.1421 ** (−2.02) | −0.0521 (−0.57) | −0.1022 (−1.10) |
| N | 6206 | 4363 | 7839 | 5039 |
| Adj.R2 | 0.4172 | 0.4177 | 0.6009 | 0.6134 |
Note: The values in parentheses are t-values; ***, ** and * indicate significance at levels of 0.01, 0.05 and 0.1, respectively.
Table 11.
The impact of green credit on polluting companies in areas with different financial development levels.
Table 11.
The impact of green credit on polluting companies in areas with different financial development levels.
| Mmif | Areas with High-Level Financial Development | Areas with Low-Level Financial Development | ||
|---|---|---|---|---|
| DID | PSM-DID | DID | PSM-DID | |
| Treated | −0.0549 * (−1.66) | −0.0744 ** (−2.05) | 0.0204 (0.34) | 0.0722 (1.10) |
| After | 0.0144 (1.06) | 0.0003 (0.02) | 0.0007 (0.05) | −0.0044 (−0.25) |
| Treated × After | −0.0239 * (−1.76) | −0.0144 (−0.96) | −0.0424 *** (−3.18) | −0.0346 ** (−2.24) |
| Lev | 0.1593 *** (6.49) | 0.1508 *** (5.82) | 0.0459* (1.67) | 0.0366 (1.40) |
| Size | −0.0037 (−1.10) | −0.0011 (−0.33) | 0.0073 ** (2.02) | 0.0068 ** (1.98) |
| Gts | −0.5350 *** (−21.17) | −0.5261 *** (−15.81) | −0.5010 *** (−18.91) | −0.4886 *** (−14.64) |
| Roa | −0.4488 *** (−5.02) | −0.4428 *** (−4.70) | −0.3882 ** (−3.45) | −0.3456 ** (−3.42) |
| Fer | −0.0002 (−0.69) | 0.00001 (0.03) | −0.0001 (−0.43) | −0.0004 (−1.26) |
| Block | 0.0003 * (2.02) | 0.0004 ** (2.32) | −0.0005 ** (−2.49) | −0.0003 ** (−1.82) |
| Dz | 0.0175 ** (2.84) | 0.0161 ** (2.24) | 0.0068 (0.80) | 0.0075 (0.75) |
| Grow | −0.1039 *** (−5.21) | −0.0899 ** (−3.16) | −0.1915 *** (−10.48) | −0.1956 *** (−8.10) |
| Cfo | −0.3503 *** (−9.52) | −0.2799 *** (−6.36) | −0.4434 *** (−9.61) | −0.4412 *** (−7.84) |
| State | −0.0487 *** (−7.34) | −0.0532 *** (−6.93) | −0.0297 *** (−4.17) | −0.0246 ** (−3.02) |
| Control | Year, Industry | Year, Industry | Year, Industry | Year, Industry |
| _cons | 0.0317 (0.46) | −0.0088 (−0.13) | −0.1386 * (−1.90) | −0.1870 ** (−2.45) |
| N | 7314 | 4815 | 6731 | 4587 |
| Adj.R2 | 0.5313 | 0.4977 | 0.5446 | 0.5577 |
Note: The values in parentheses are t-values; ***, ** and * indicate significance at levels of 0.01, 0.05 and 0.1, respectively.
Publisher’s Note: MDPI stays neutral with regard to jurisdictional claims in published maps and institutional affiliations. |
© 2021 by the authors. Licensee MDPI, Basel, Switzerland. This article is an open access article distributed under the terms and conditions of the Creative Commons Attribution (CC BY) license (http://creativecommons.org/licenses/by/4.0/).
Share and Cite
MDPI and ACS Style
Cao, Y.; Zhang, Y.; Yang, L.; Li, R.Y.M.; Crabbe, M.J.C. Green Credit Policy and Maturity Mismatch Risk in Polluting and Non-Polluting Companies. Sustainability 2021, 13, 3615. https://0-doi-org.brum.beds.ac.uk/10.3390/su13073615
AMA Style
Cao Y, Zhang Y, Yang L, Li RYM, Crabbe MJC. Green Credit Policy and Maturity Mismatch Risk in Polluting and Non-Polluting Companies. Sustainability. 2021; 13(7):3615. https://0-doi-org.brum.beds.ac.uk/10.3390/su13073615
Chicago/Turabian StyleCao, Yaowei, Youtang Zhang, Liu Yang, Rita Yi Man Li, and M. James C. Crabbe. 2021. "Green Credit Policy and Maturity Mismatch Risk in Polluting and Non-Polluting Companies" Sustainability 13, no. 7: 3615. https://0-doi-org.brum.beds.ac.uk/10.3390/su13073615
Note that from the first issue of 2016, this journal uses article numbers instead of page numbers. See further details here.