Article

Spatiotemporal Characteristics and Influencing Factors of Tourism Revenue in the Yangtze River Delta Urban Agglomeration Region during 2001–2019

1
School of Geography and Tourism, Anhui Normal University, Wuhu 241002, China
2
College of Tourism, Jiangxi Science and Technology Normal University, Nanchang 330013, China
3
College of Environmental and Resource Sciences, Zhejiang A&F University, Hangzhou 311300, China
4
Institute of Nature Reserve Protection, East China University of Technology, Nanchang 330013, China
5
Faculty of Economics, University of Gdansk, 81-824 Sopot, Poland
*
Author to whom correspondence should be addressed.
Sustainability 2021, 13(7), 3658; https://0-doi-org.brum.beds.ac.uk/10.3390/su13073658
Submission received: 27 February 2021 / Revised: 18 March 2021 / Accepted: 22 March 2021 / Published: 25 March 2021

Abstract

:
Green development is a solution to achieve sustainable development, while tourism development is one of the best approaches to realize a green economy. As the most rapid economic development region in China, the Yangtze River Delta Urban Agglomeration (YRDUA) has also witnessed rapid changes in its tourism economy during 2001–2019. Here, we analyzed the spatiotemporal patterns of its tourism revenue, and further identified contributions from multiple socio-economic factors using spatial analysis tools and regression models. The total tourism revenue increased 14.35 fold, with an annual increase rate of 79.73% during 2001–2019. The proportion of tourism revenue to the GDP continuously increased from 11.57% in 2001 to 18.89% in 2019. Tourism revenue increased for all cities, with the least increasing rates in the metropolitan cities including Shanghai, Nanjing, Suzhou and Hangzhou, and the largest increase rates in Ma’anshan, Hefei, Huzhou and Zhoushan. A regression and causality test indicated that different socioeconomic factors controlled the spatiotemporal variation patterns in different cities. The economic structure in the YRDUA has undergone significant shifts, with an increasing importance of tourism revenue in the GDP for most cities and a reducing discrepancy of tourism revenue among cities. Our study can enable the policy makers to be aware of the magnitude, temporal variation patterns, differences among cities and controlling factors for tourism development, and thus take suitable measures to further promote green tourism development in the YRDUA region.

1. Introduction

The impacts of tourism on a region include: (1) economic, (2) environmental, (3) social and cultural, (4) crowding and congestion, (5) services, (6) taxes, and (7) community attitude [1]. The major goal of developing the tourism industry in a region is to maximize positive impacts while minimizing potential negative impacts. For decades, tourism industry growth has been an important contributor to increased economic activity in China. It has created jobs in both large and small cities and is a major or dominant industry in some cities. In 2015, China ranked after the United States as the second largest travel and tourism economy in the world according to the data from United Nation World Tourism Organization [2]. However, the impacts of tourism to a region are not widely understood, even where tourism is growing dramatically and should be of the greatest interest or concern [3]. To assess the impacts of tourism on the above-mentioned seven aspects, a comprehensive analysis on the spatiotemporal characteristics of tourism activities and revenue is needed and the first step.
With the rapid development of tourism, total tourism revenue has become an important component of the gross domestic product (GDP), and its contribution to the economy of China is also dramatically growing [4,5,6]. The Yangtze River Delta Urban Agglomeration (YRDUA) is one of the six biggest urban agglomerations in the world, and is one of the fastest economic development regions in China and thus the major “engine” of China’s economic development in the past three decades [7]. As a major component of “green economy”, tourism economy played a significant role in promoting economic development in this region. In 2015, tourism revenue in YRDUA accounted for 52.72% of national total tourism revenue and 15.7% of the total GDP in this region. This proportion has a great potential to expand in the future due to the special advantages and attractions of climate, history, culture and geography, and the national environmental and economic policies and demands in pursuit of “green economy” [8].
Tourism development and spatial and temporal characteristics are influenced by many factors including environment, socio-economics, historical and cultural factors, and religious factors [9,10,11]. The major socio-economic factors include macro-economic policy framework, leisure time, affluence (e.g., the real and disposable income), the mobility (e.g., transportation, hotels, restaurants), and other support services (e.g., number of scenic sites, hospital, bank, and insurance) [3]. With the increasing importance of tourism in the economy, the links between tourism and local economic development have evolved considerably. Hence, it becomes more difficult to disentangle the complex relationships between tourism and economic development [3]. In the past, the ‘top-down’ theory has been applied to conceptualize more fully the complexity and nuances of the tourism development process. At present, a new configuration of articulated economic spaces and scales of governance is emerging in the tourism industry. To attempt to explain the national or global (up) controls on regional tourism development, it is essential to first unravel the spatial and temporal characteristics of the tourism economy at the regional scale (bottom), emerging as a “bottom-up” approach. Many previous studies have explored the evolutional characteristics of tourism in the entire or portions of YRDUA from multiple and varied perspectives. Taking the number of tourists and tourism revenue as indicators, Zhu et al. [12] analyzed the evolutionary trend of the spatial structure of tourism using the Herfindahl index and rank-size model. Zhou and Jiang [13] used the entropy method to evaluate the spatial distribution characteristics of the comprehensive tourism competitiveness. Fang et al. [14] established a tourism economy network of contacts by modifying the gravity model and applied the social network analysis method to conduct a quantitative analysis of the network and analyze the reasons for the spatial differences in the tourism economy. Liang and Shi [15] and Bian [16] analyzed the evolution of the core-edge spatial structure of the tourism cities. Based on the tourist flow potential index, Huang [17] suggested that there was a significant linear relationship between the tourist flow potential and GDP in the YRDUA region. However, few studies have been done to comprehensively analyze the spatial and temporal evolution characteristics and examine the contributing socio-economic factors of tourism economy from a long-term perspective in the YRDUA.
Based on long-term (2001–2019) city-level inventory data for tourism revenue, GDP and other tourism-related socioeconomic data, this study aimed to reveal the spatial and temporal characteristics of tourism revenue and the potential contributors using GIS spatial analysis and regression models. Specifically, the objectives were to: (1) explore the contemporary spatial and temporal patterns in tourism revenue in the YRDUA; (2) illustrate spatiotemporal variation patterns of tourism revenue during 2001–2019; and (3) identify the potential contributors to the spatiotemporal variations of tourism revenue. Our study would make the local governments aware of regional and city level tourism revenue conditions, and thus take measures to manage and lead the tourism industry to a green development direction.

2. Materials and Methods
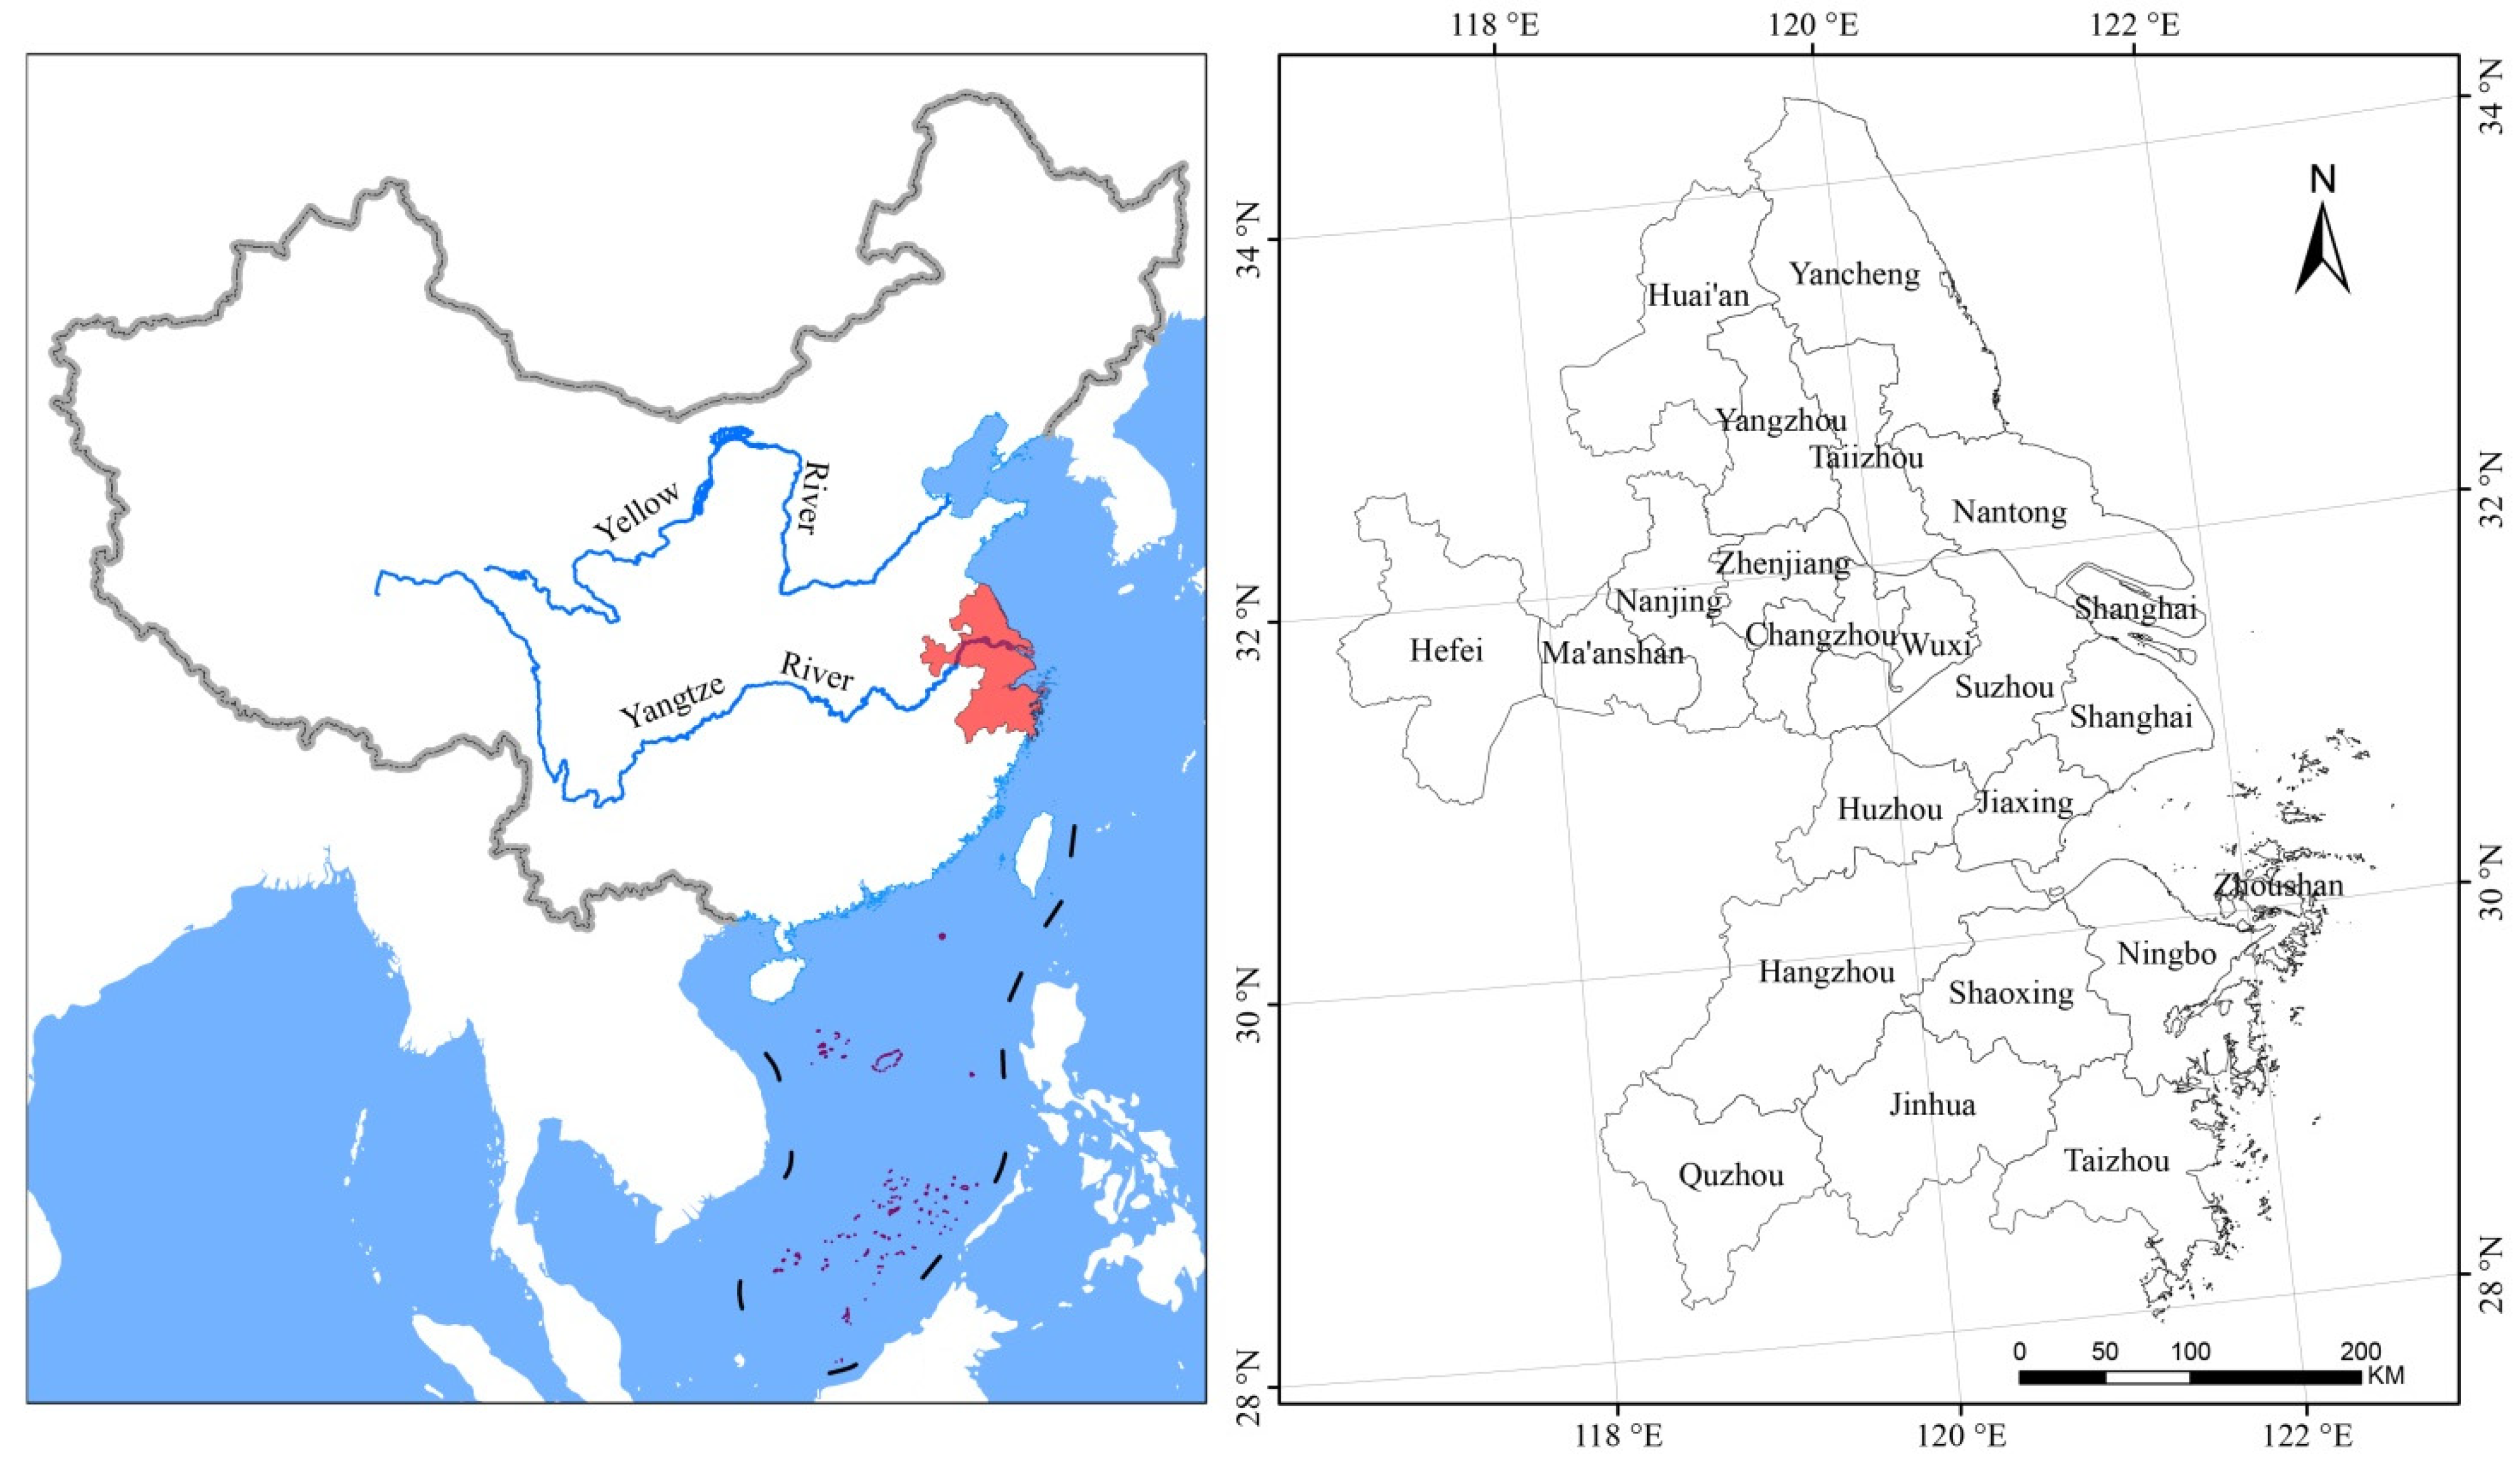
2.1. Study Area

The YRDUA region has increased from 22 prefecture cities before 2010 to 26 prefecture cities at present. To maintain consistency, we used the old YRDUA boundary of 22 prefecture cities to conduct this study (Figure 1). Except for Shanghai City, other cities were all located in the Jiangsu (9 cities), Zhejiang (9 cities) and Anhui (3 cities) provinces. The total area of YRDUA is about 0.21 million km2, accounting for about 2.2% of the national land area. YRDUA is one of the most rapid economic development regions and is the most developed region in China at present. The total GDP was 12,670 billion Chinese Yuan in 2014, accounting for 18.5% of the national GDP. The total population was 0.15 billion in 2014, accounting for 11% of the national population. The population and number of tourists had significantly increased during 2001–2019. This region has further divided into 6 major metropolis circles, including Shanghai, Ningbo (includes Ningbo, Zhoushan and Taizhou), Hangzhou (includes Quzhou, Huzhou, Jiaxing and Shaoxing), Hefei (includes Hefei, Ma’anshan and other 6 cities in Anhui Province), Nanjing (includes Zhenjiang, Yangzhou, Huai’an, and other cities), and SuXiChang (includes Suzhou, Wuxi and Changzhou) metropolis circles. This region has special cultural, geographic and climatic advantages over other major economic zones in China; therefore, tourism economy has become one of the major economic development engines in the past two decades. As part of the “green economy” and reduced adverse environmental impact, tourism economy is recommended as a priority development area in the near future.

2.2. Data Sources

2.2.1. Data for Tourism Scenic Spots

The National Tourism Administration has graded five levels of scenic sites in China, namely 5A (i.e., AAAAA), 4A, 3A, 2A, and 1A levels in declining order of site quality. The national tourism rating system and standards have been implemented since 1999. There were, in total, 2424 A-grade tourism spots in China during 2012 [18], and about 32% of these spots (724) were located in the YRDUA region. More scenic sites have not been recognized or rated by the National Tourism Administration. In this study, we obtained the data for tourism scenic spots from the Peking University Open Research Data Platform [19]. This dataset includes both nationally graded and non-graded scenic sites. At present, there are 37,238 scenic spots in total in the YRDUA region.

2.2.2. Tourism Revenue and Related Data

We collected the tourism revenue (TR; billion $), GDP, tertiary industry revenue (TIR; billion $), disposable personal income (DPI; $), number of persons engaged in tertiary industries (NPE; ×10,000 persons), urbanization rate (UR; fraction), highway mileage (HM; km), number of A-graded scenic spots (NSS), and number of star-rated hotel (NSH) data of 22 cities in YRDUA from the National Bureau of Statistics of China [20] and the China Statistical Information Network [21]. These socio-economic factors can either directly or indirectly affect the tourism revenue at both spatial and temporal scales [22]. A middle level currency exchange rate of 6.5 (the rate in March 2021) was used to convert Chinese Yuan (CNY) to US Dollar ($ USD), i.e., 1 USD = 6.5 CNY.

2.2.3. Establishments of Regression Models between Tourism Revenue and Socioeconomic Factors

First, we applied the Granger Causality Test in R program (version 3.5.3) [23] to identify and test if there is a significant causality relationship between tourism revenue (TR) and other individual socio-economic factors. The tests indicated that some factors (e.g., UR, HM and NSS) in some cities were not the Granger reasons for TR. Therefore, we decided to apply stepwise regression model to remove some factors. To further test the regression model types used for each factor, we conducted one-factor regression models between TR and other individual factors through selecting linear, exponential, logarithmic, power and polynomial models. The tests indicated that the exponential model is suitable to fit the relationships between TR and most socio-economic factors. The logarithmic relationships between TR and socioeconomic factors have also been inferred from Cobb–Douglas production theory [24] and previous studies [25,26]. The regression model was fitted as:
L N ( T R i j ) = a + b X i j
which is further transformed to:
T R i j = a E X P b X i j
where: TRij is the tourism revenue for factor i in city j; Xij is the time series values for factor i in city j; i is the factor ID for TIR (1), GDP (2), DPI (3), NPE (4), UR (5), HM (6), NSS (7), and NSH (8); j is the city ID; a is the intercept; and b is the growth rate.
Then, we applied the Shapiro–Wilk Normality Test in the R program to test if all the variables followed a normal distribution. The test indicated that several variables (i.e., UR and HM) did not follow normal distribution for some cities. This also suggested that a logarithmic model is needed to transform the data. The transformed all-subset partial regression model for each city was thus expressed as:
L N T R =   a + i = 1 8 b i X i + c
or
T R   =   a i = 1 8 E X P b i X i   +   c
where: a is the intercept; b1 to b8 are the fitted growth rates for GDP, TIR, DPI, NPE, UR, HM, NSS, and NSH, respectively; and c is the random error.
As indicated by the Granger Causality Test and all-subset regression model, we applied both forward and backward stepwise regression method to further remove some insignificant non-causable variables to establish a stepwise partial regression model for each city.

2.3. Statistical Analysis

The causality test, correlations and regressions (all-subset and stepwise regression) as well as the statistical significance tests were conducted using R programing. Significance levels lower than 0.001 (*** or p < 0.001) indicated extremely significant, 0.01 (** or p < 0.01) indicated very significant, 0.05 indicated significant (* or p < 0.05), and 0.1 indicated weakly significant (# or p < 0.1).

3. Results

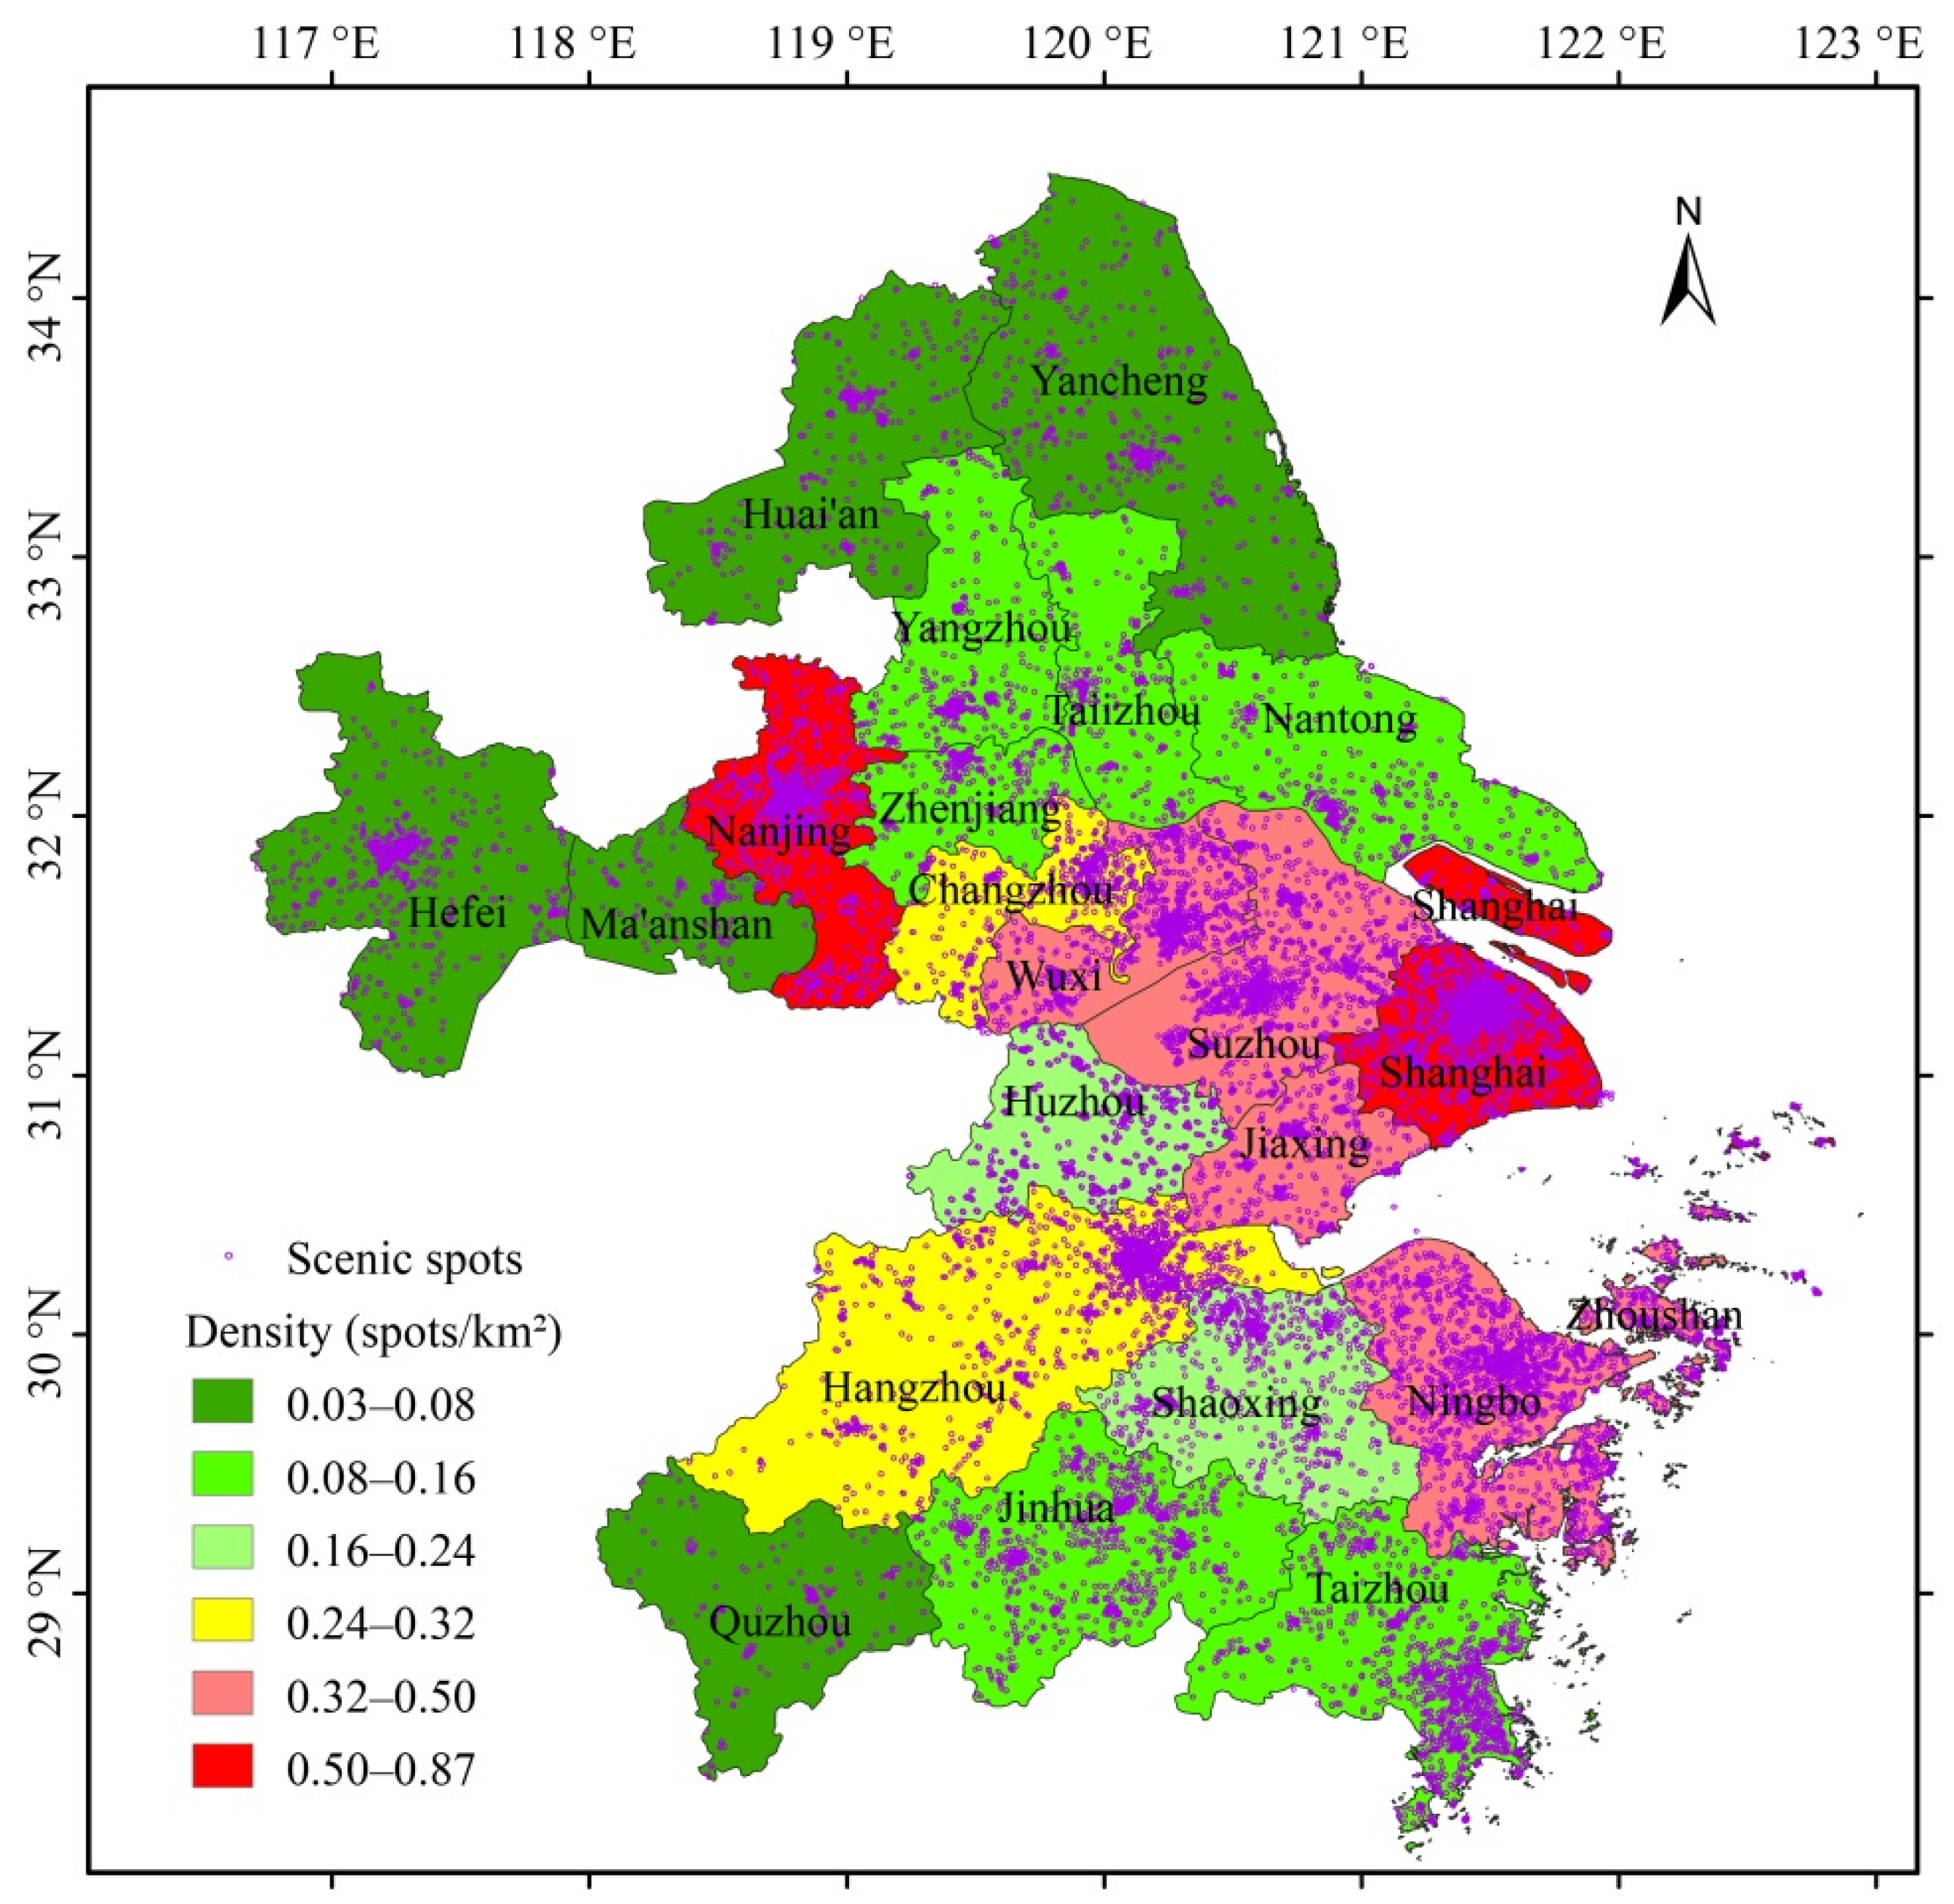
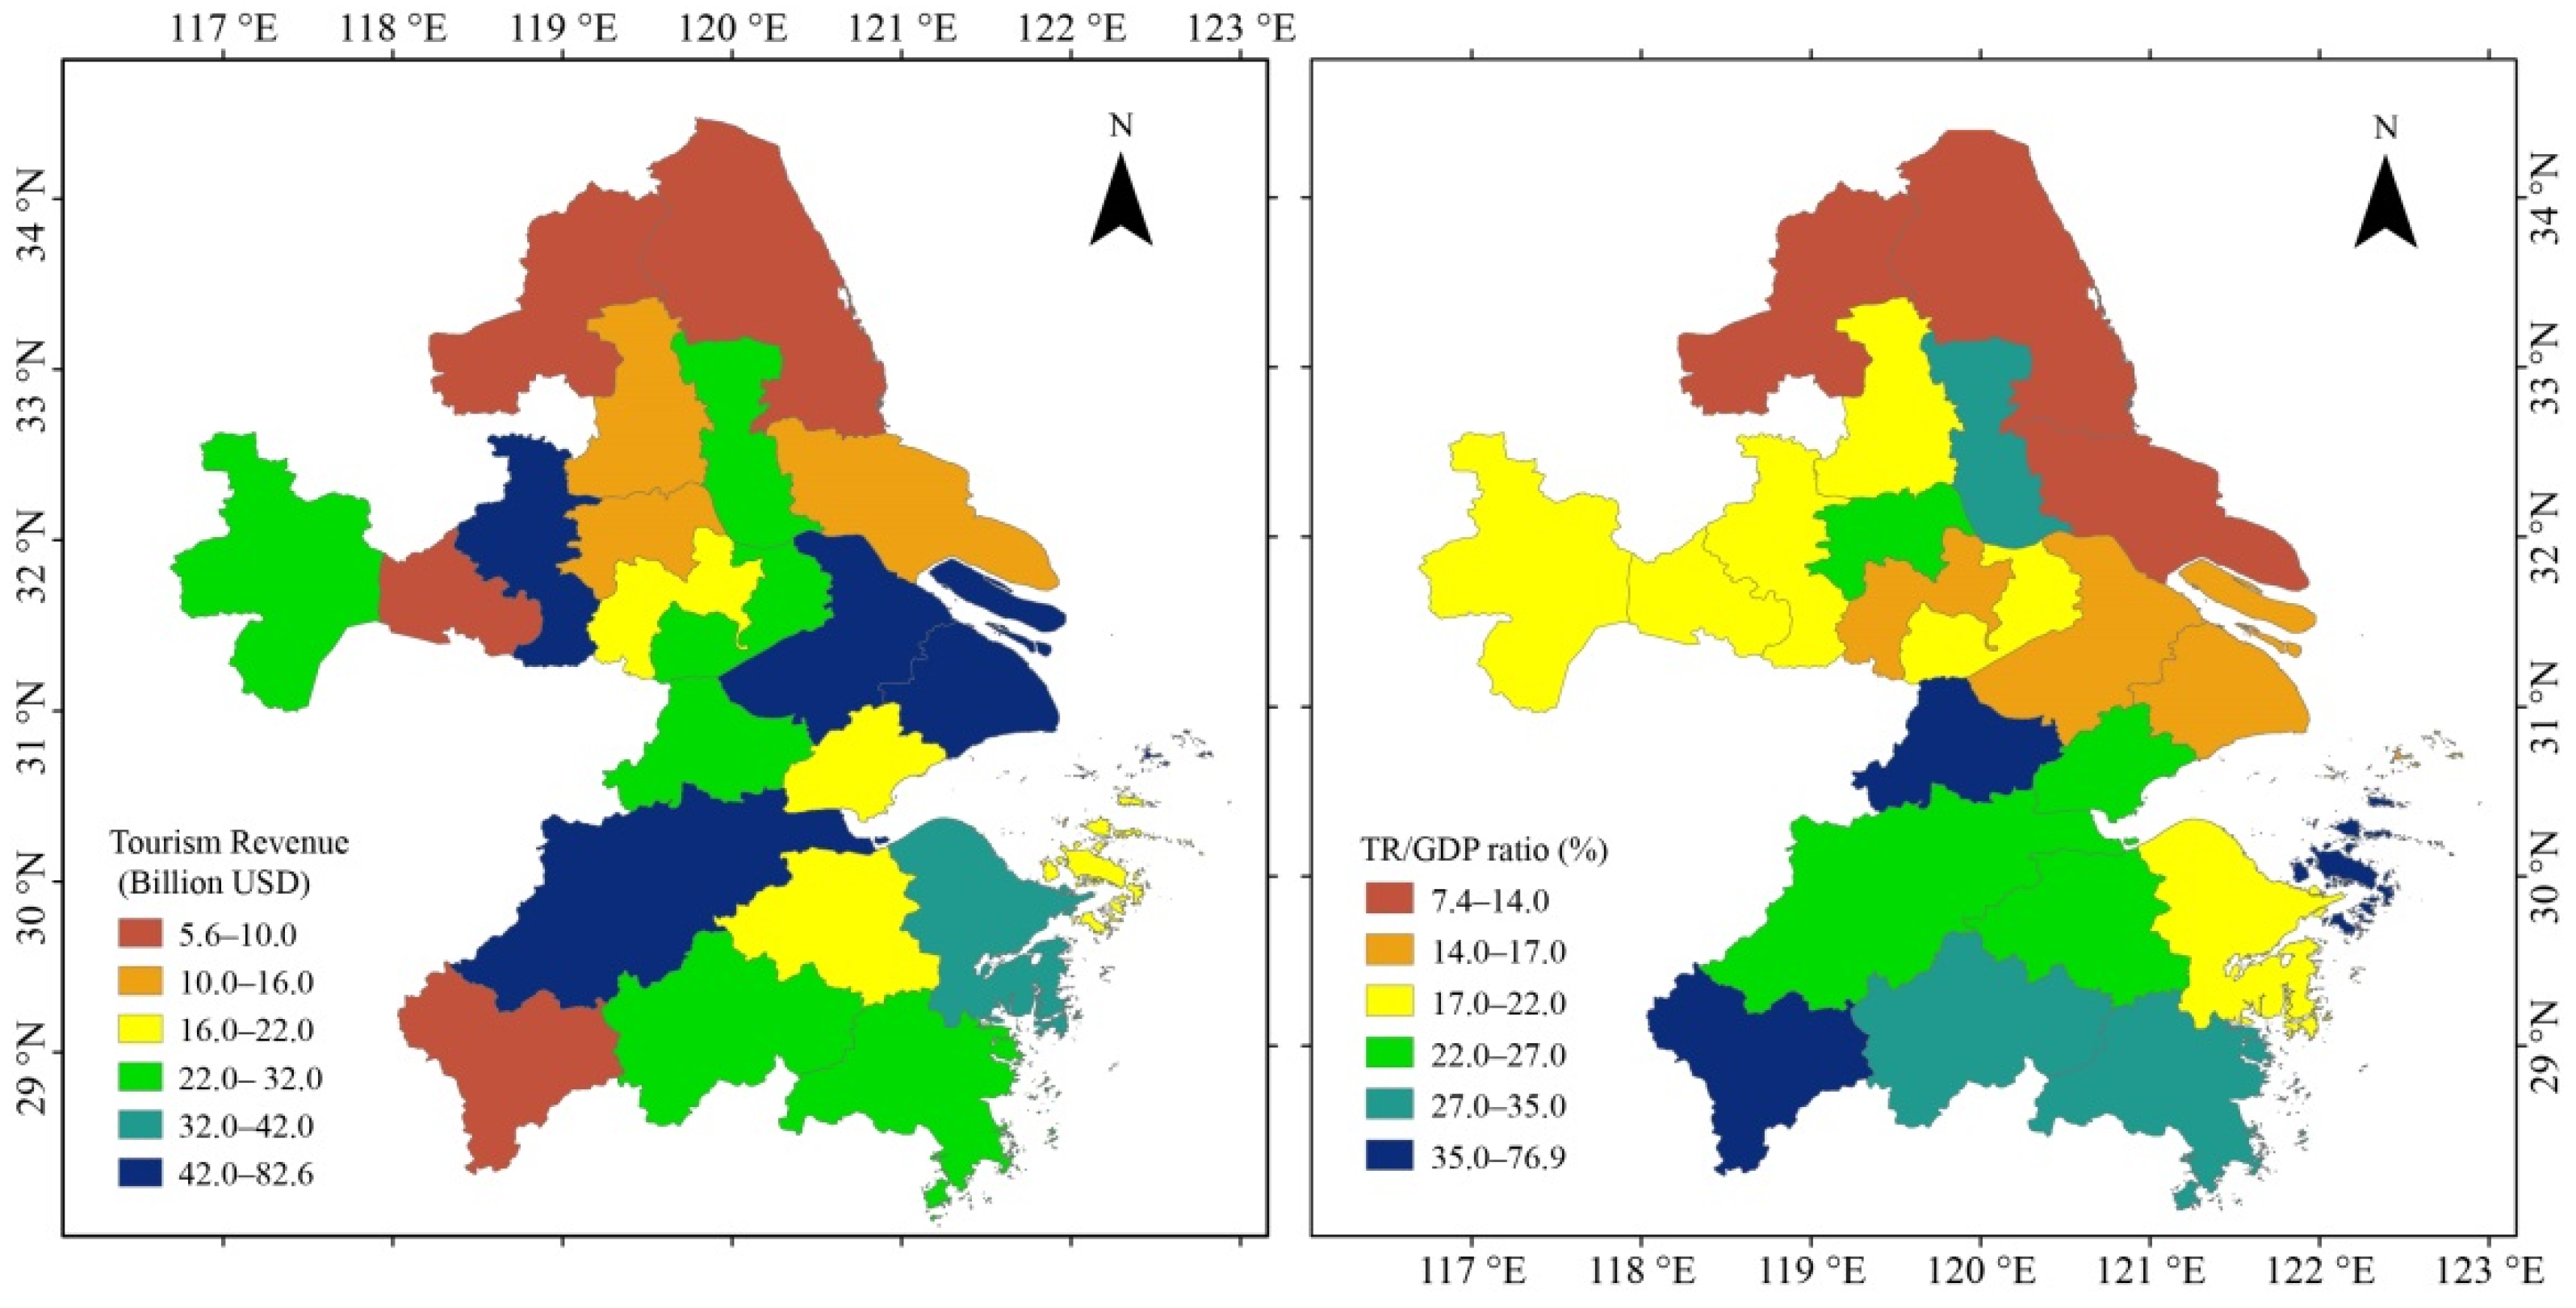
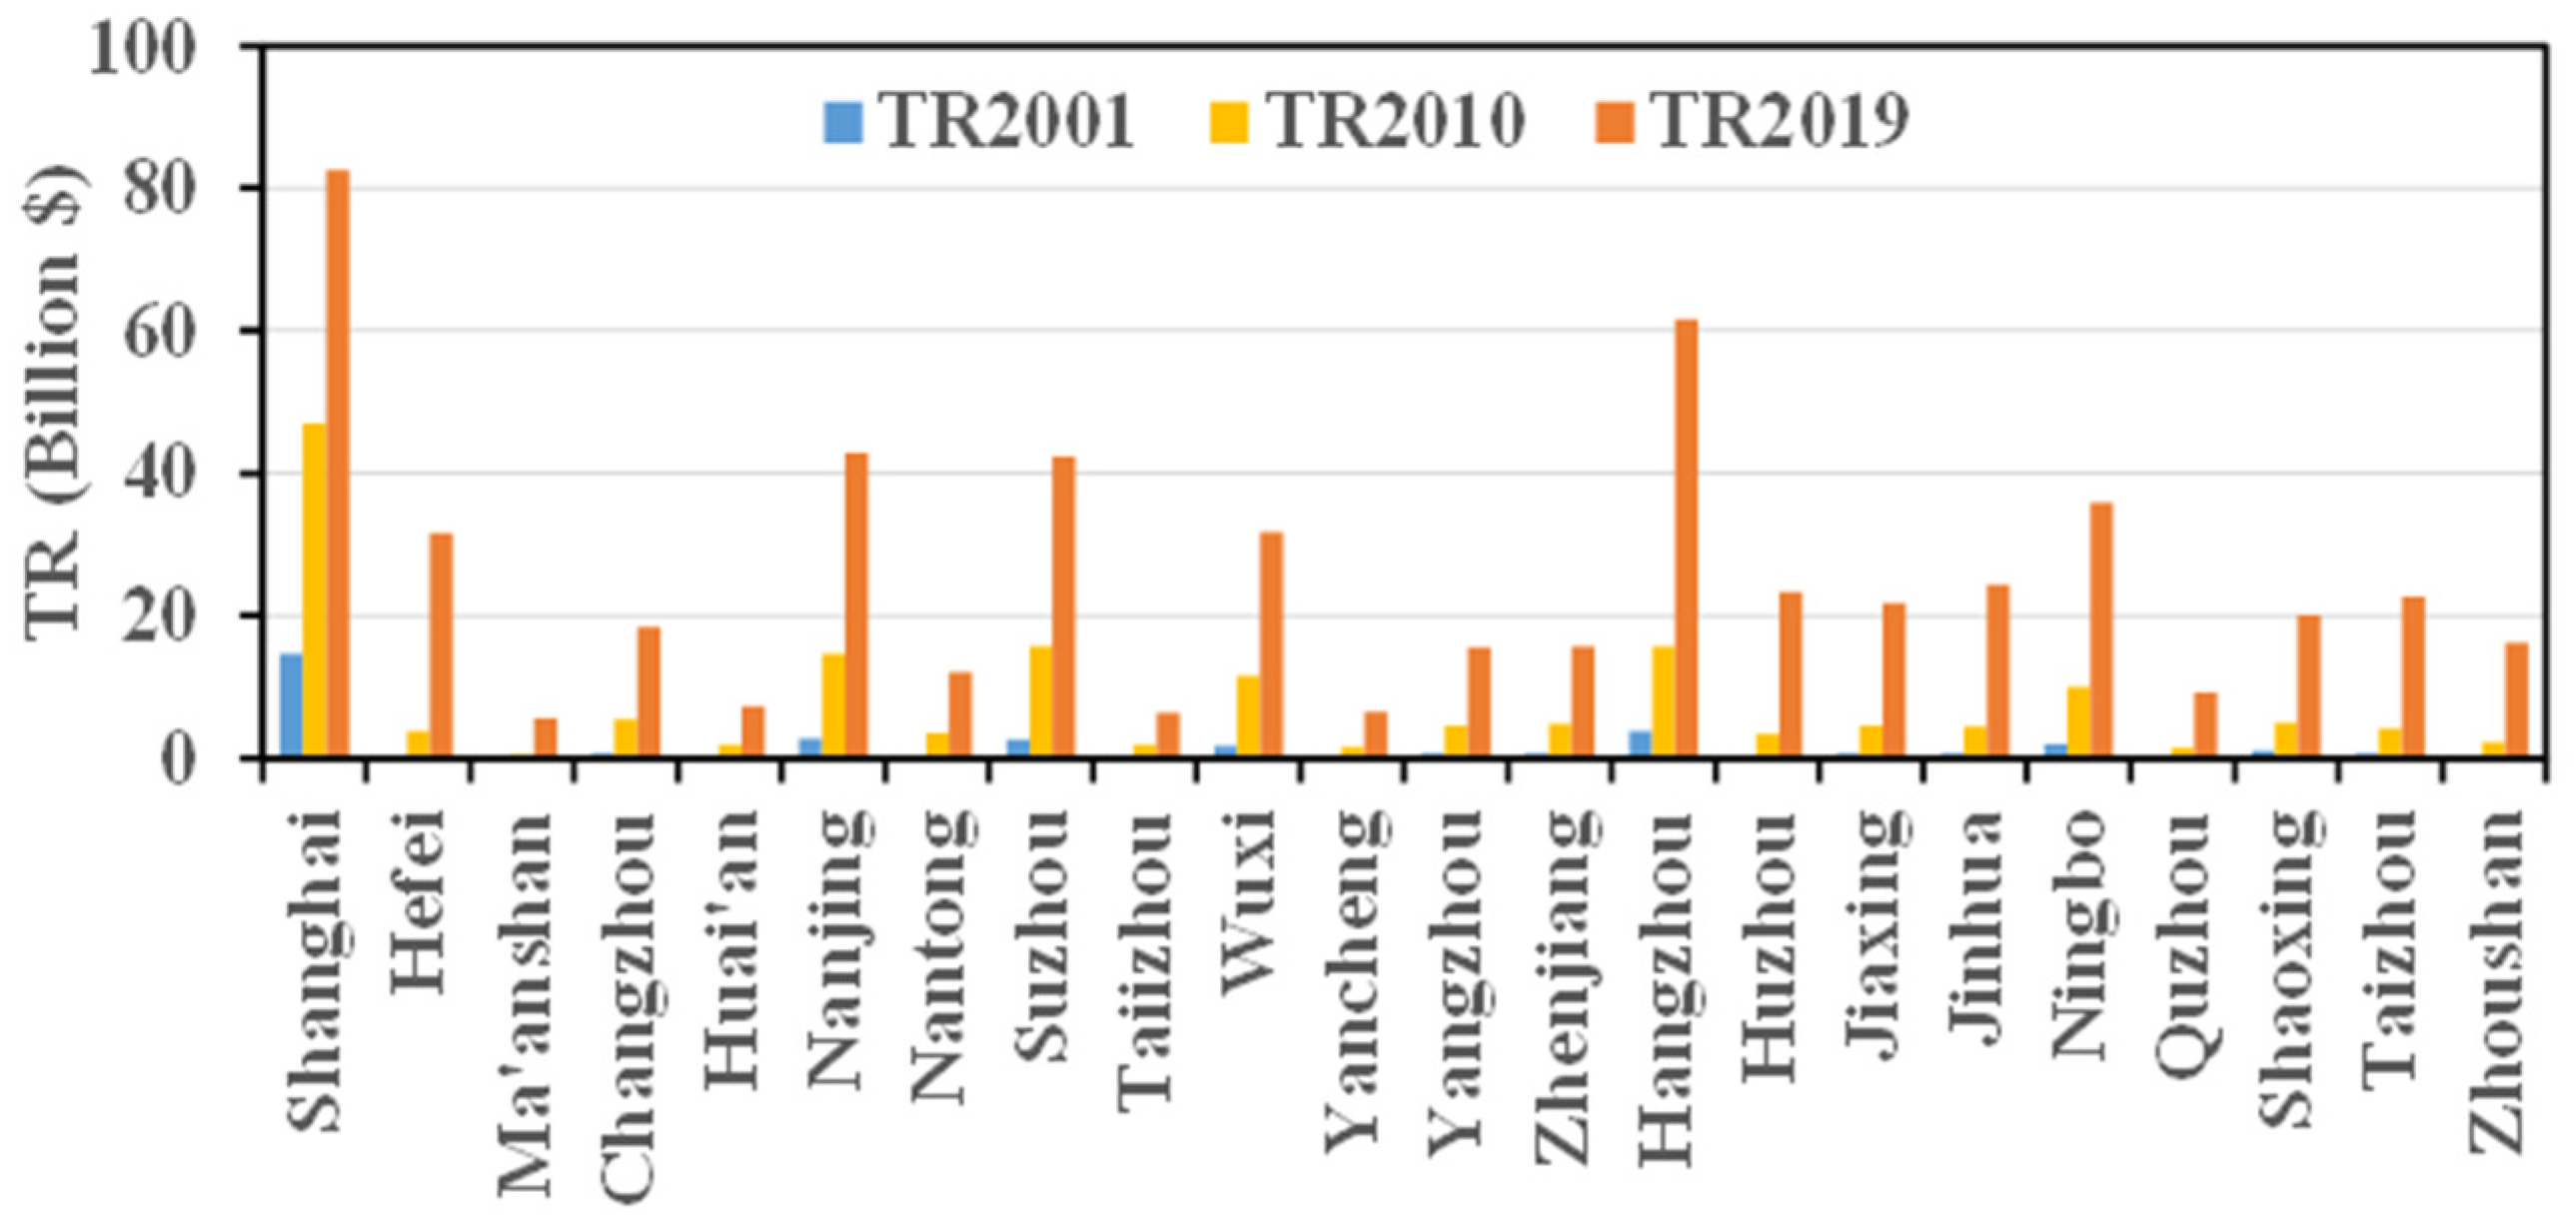
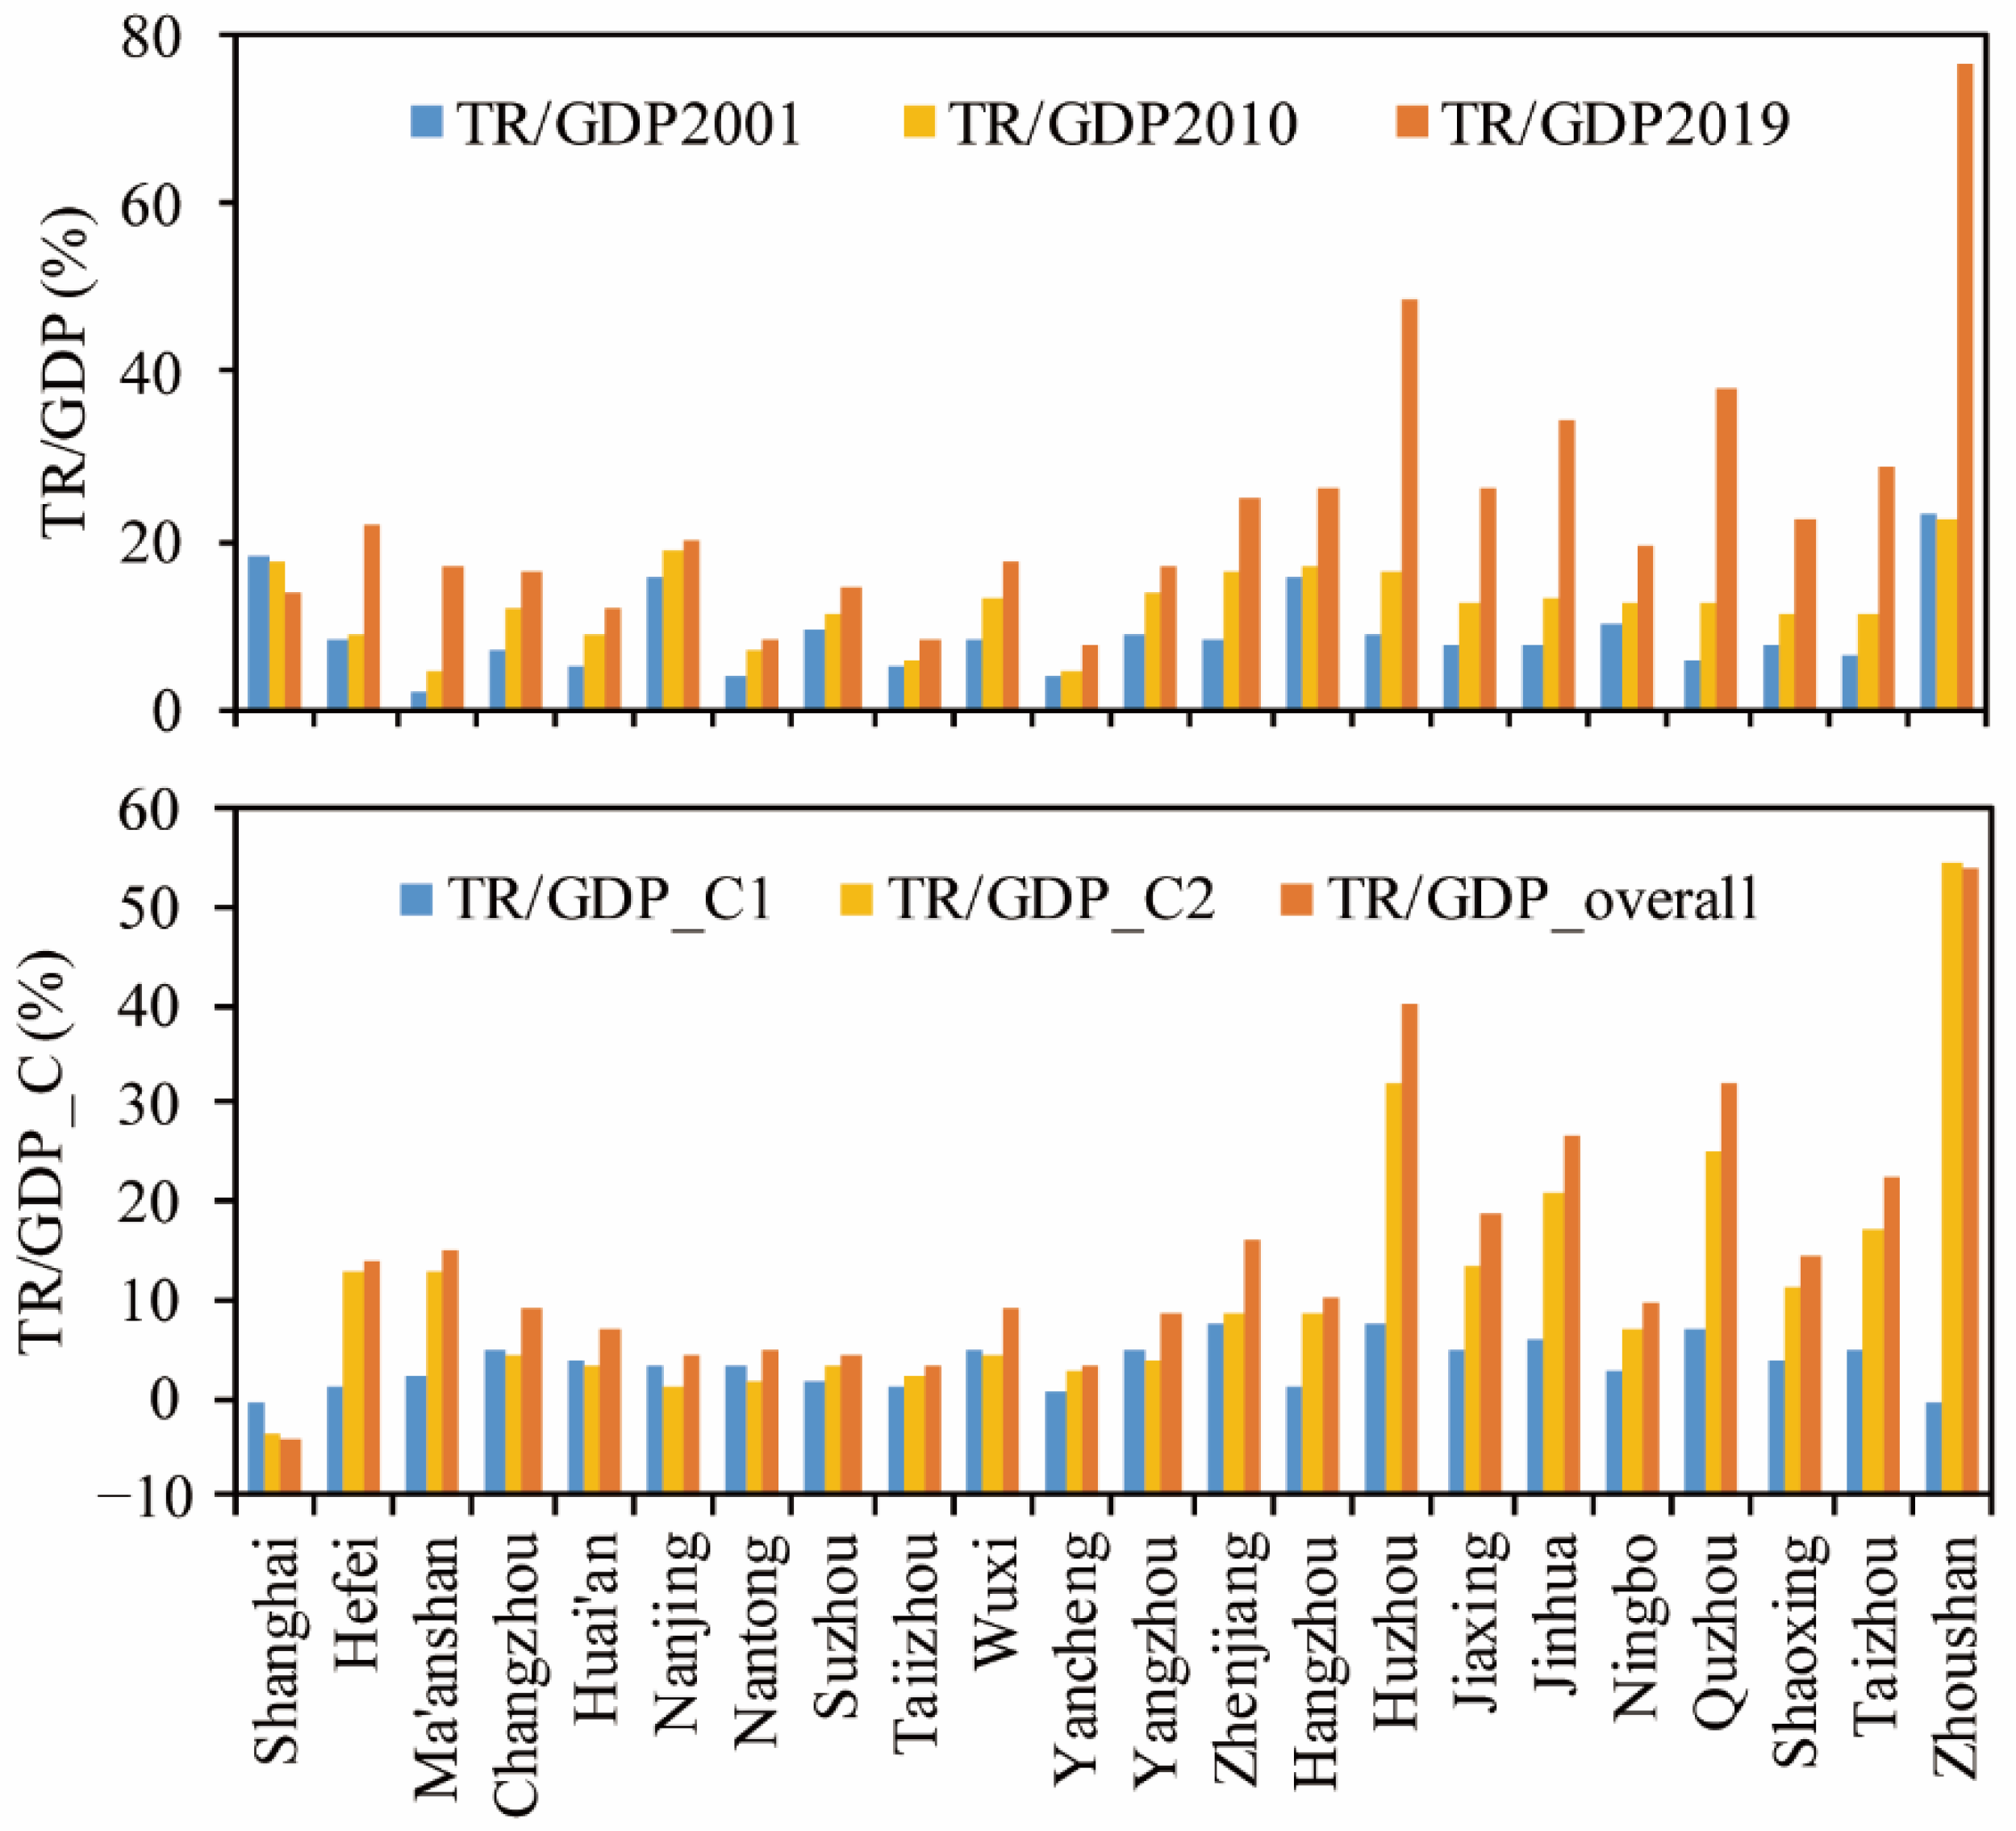
3.1. Contemporary Tourism Scenic Spots and Tourism Revenue Patterns

Scenic spots and density provide basis for further expansion of tourism economy. The numbers of all kinds of scenic spots were 37,009 in the YRDUA region, among which A-graded scenic spots were 1282, only accounting for 3.46% of the total number (Figure 2). This implied that this region still has a great potential to increase scenic spot quality. The overall scenic spot density was 0.22 spot per km2. At city scale, most of the scenic spots concentrated in the downtown area for some metropolitan cities, such as Shanghai, Nanjing and Hangzhou; while some other smaller cities, such as Yancheng, Huai’an, Yangzhou and Quzhou, had relatively more scattered distributions. Shanghai and Hangzhou had the most scenic spot numbers, while Yancheng, Ma’anshan and Quzhou had the least scenic spot numbers. Shanghai and Nanjing had the highest scenic spot density, while Ma’anshan, Jiaxing, Wuxi and Shanghai had the highest A-graded scenic spot density.
In 2019, the total tourism revenue in the YRDUA region was $554 billion USD, which accounts for 18.89% and 33.28% of the GDP and tertiary industry revenue (TIR), respectively (Figure 3). At the prefecture city scale, Shanghai, Hangzhou and Suzhou had the highest tourism revenue, while Ma’anshan, Yancheng, Taiizhou and Quzhou had the lowest tourism revenue. Similarly, Shanghai, Hangzhou and Suzhou were the three cities with the highest GDP, while Zhoushan, Quzhou, Ma’anshan, and Quzhou had the lowest GDP. However, the proportion of tourism revenue to GDP was the greatest in Zhoushan (50.53%), Huzhou (33.59%) and Quzhou (25.08%), while the lowest in Yancheng (5.37%), Taiizhou (6.55%) and Nantong (7.54%).

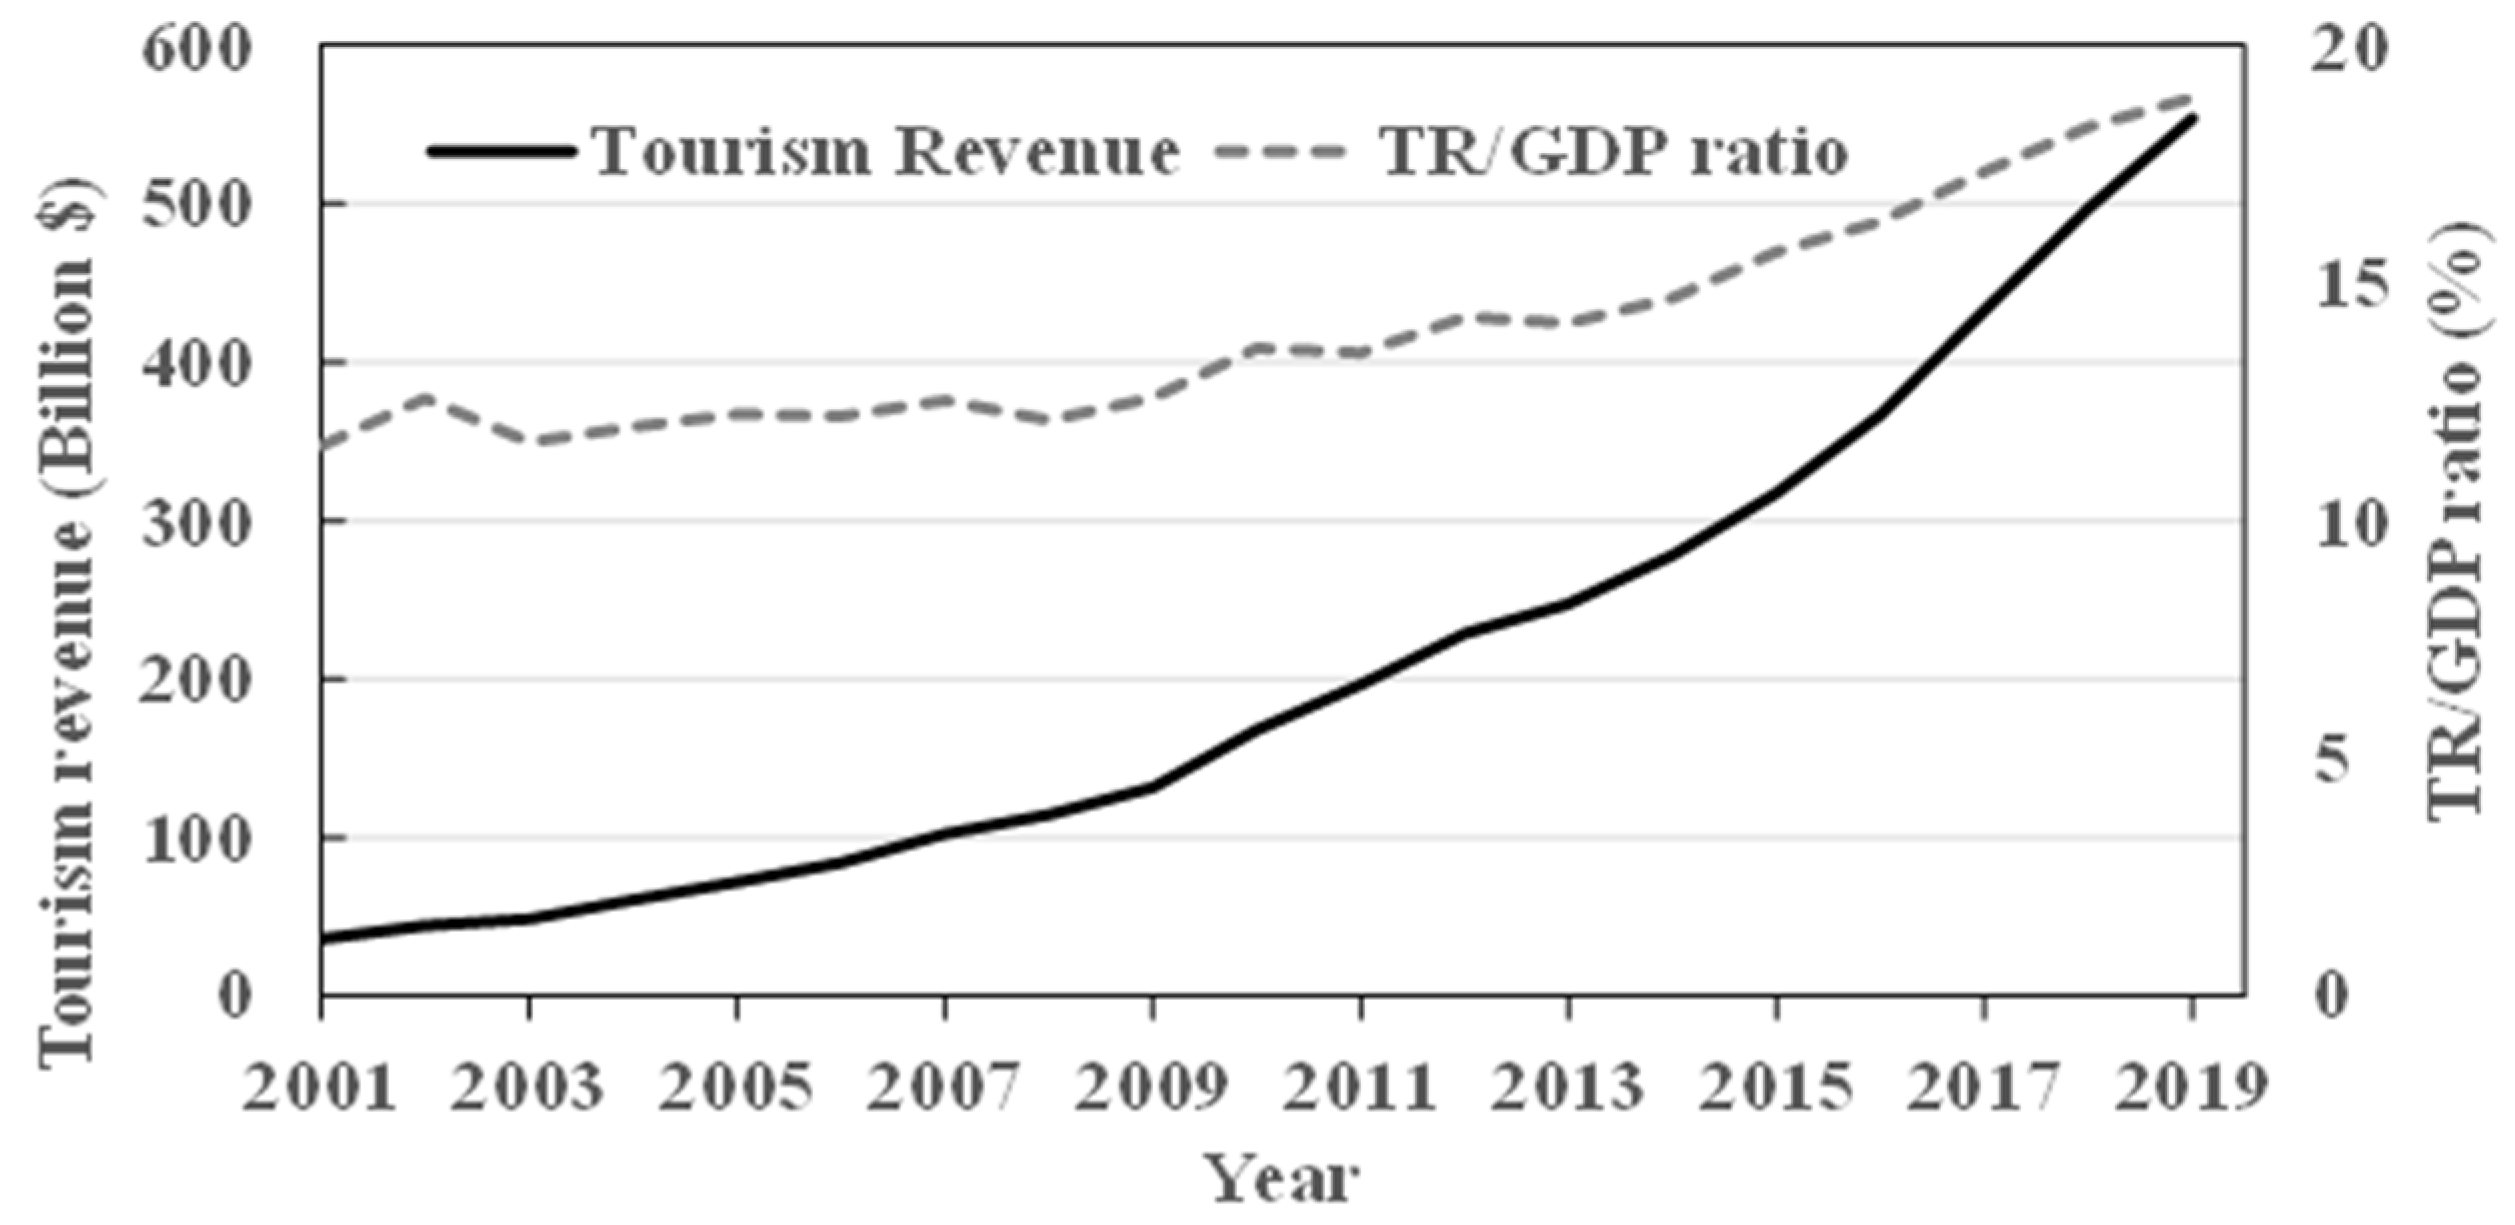
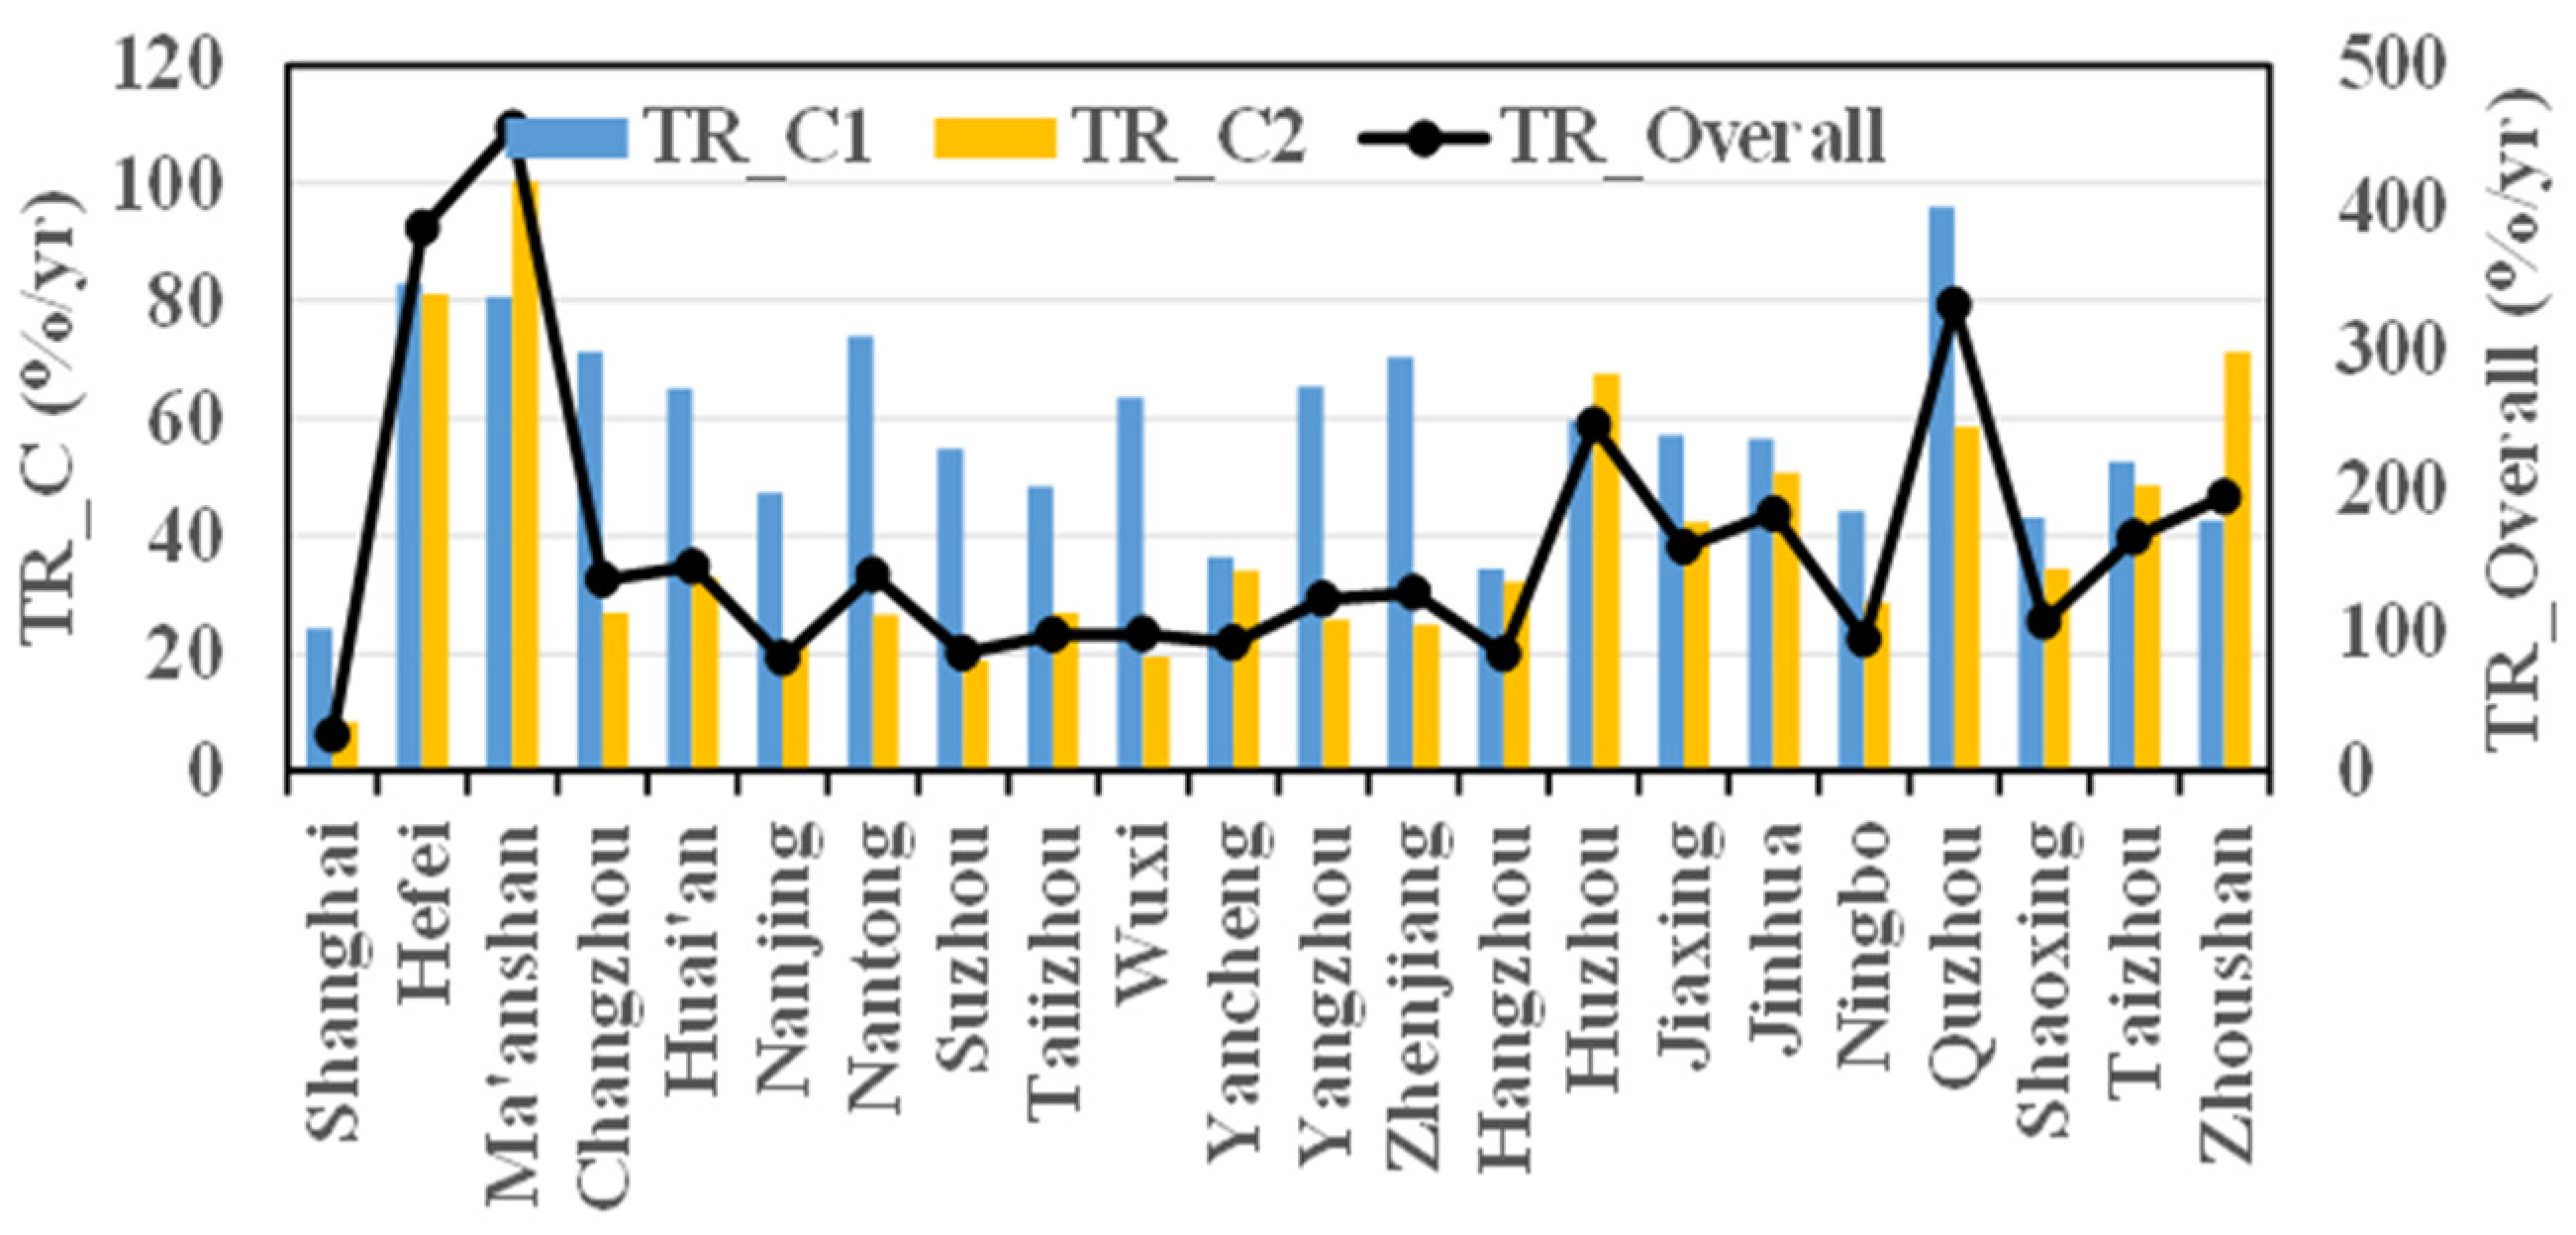
3.2. Temporal Variations in Tourism Revenue

The annual tourism revenue for the 22 cities in the YRDUA region showed an exponential increasing trend (y = 33.40 × e0.15x; R2 = 0.996; p < 0.01) during 2001–2019, with a growth rate of 0.15 (Figure 4). The total tourism revenue in 2001 and 2019 was 36.07 and 553.68 billion USD, with a 14.35-fold increase (79.73% per year) during 2001–2019. The increasing trend of tourism revenue during 2001–2010 (40.53% per year) was higher than that during 2010–2019 (25.59% per year). During the study period, total GDP increased from $312 billion in 2001 to $2931.28 billion in 2019, with a 8.41-fold increase. The proportions of tourism revenue accounts for GDP (TR/GDP) were 11.57% and 18.89% in 2001 and 2019, respectively, with an increase of 63.20% during this period. This indicated that the increase rate of TR was continuously greater than that of GDP in this region. The TR/GDP ratio kept a relatively small increase rate during 2001–2010 (by 17.73%), but a more rapid increase from 2010 to 2019 (by 38.62%). An even larger increase in TR/GDP ratio was found since 2012. This was because the GDP increase rate was greater than the tourism revenue before 2012 and significantly slower than the tourism revenue increase rate after 2012. This implied that the role of tourism in the economic development was significantly shifted around 2012, with a more important role in GDP since 2012. This might further suggest a shifting industry structure and shifting contributions of socio-economic factors on tourism revenue during different periods.
Tourism revenue during 2001–2019 increased exponentially (R2 > 0.98; p < 0.01) for all cities, with the greatest growth rates in Ma’anshan (by 82.97-fold; 546.50% per year), Hefei (70.28-fold; 461.86% per year) and Quzhou (60.44-fold; 396.27% per year), and the smallest increases in Shanghai (5.61-fold; 30.71% per year), Nanjing (15.41-fold; 96.06% per year), and Hangzhou (15.99-fold; 99.95% per year) (Figure 5 and Figure 6). The tourism revenue increase rates during 2001–2010 were greater than that during 2010–2019 for most cities, except for Ma’anshan, Huzhou and Zhoushan (Figure 6), suggesting that the growth of tourism revenue in most cities started to show a saturation pattern since 2010. Hangzhou and Yancheng had almost the same change rates of tourism revenue during these two periods. Quzhou, Hefei, and Ma’anshan had the highest increase rates during 2001–2010, while Ma’anshan and Hefei had the highest increase rates during 2010–2019. From 2001–2010 to 2010–2019, Zhoushan exhibited the greatest increase (28.64%) in annual change rates while Nantong (47.39%, Zhenjiang (45.44%), and Changzhou (44.45%) had the greatest decrease in annual change rates. These analyses indicated a very complex temporal change pattern in tourism revenue among cities. As indicated by the coefficient of variance (CV; standard deviation/mean), the difference in tourism revenue among cities has been significantly reduced from 1.88 to 0.76, suggesting significantly declined differences in tourism revenue among all cities through the reduced increasing rates of tourism revenue in more-developed cities while faster growing in less-developed cities.
In 2001, the highest TR/GDP ratios were 23.13% and 18.37% in Zhoushan and Shanghai, respectively (Figure 7); in 2010, the highest ratios were shown in Zhoushan (22.41%) and Nanjing (18.99%) while in 2019, the highest ratios exhibited in Zhoushan (76.89%) and Huzhou (48.64%), indicating that the tourism revenue in these two cities became the main contributors to economic development. The TR/GDP ratio showed an increase from 2001 to 2010 for most cities except for Shanghai (slightly decreased by 0.59%) and Zhoushan (by 0.70%). From 2010 to 2019, TR/GDP ratios showed an increasing trend except for Shanghai (decreased by 3.72%). From 2001 to 2019, TR/GDP ratios displayed an increasing trend for all cities except for Shanghai (decreased by 4.30%), with the largest net increase in Zhoushan (53.77%) and Huzhou (39.90%). The TR/GDP ratio in Shanghai showed a larger decrease during 2010–2019 than that during 2001–2010, indicating that the importance of tourism in GDP declined in Shanghai. In contrast, tourism revenue became an economic growth engine and pillar industry in Zhoushan and Huzhou as implied by the even more rapid increases in the TR/GDP ratio during the second period.

3.3. Influencing Factors for the Variations in Tourism Revenue

As indicated in the above analyses, there were complicated and distinct temporal change patterns in tourism revenue among cities. Through the stepwise regression models (Equation (3)), we found that the socioeconomic factors, including GDP, tertiary industry revenue (TIR), disposable personal income (DPI), number of persons engaged in tertiary industries (NPE), urbanization rate (UR), highway mileage, number of scenic spots (NSS), and number of star-rated hotel (NSH), can be applied to effectively (R2 > 0.98 and p < 0.01 for all models) predict the temporal change patterns in tourism revenue for all the cities in the YRDUA region, with different main controlling factors for different cities (Table 1). For 8 cities (e.g., Ma’anshan, Nantong, and Suzhou), UR was one of the main factors determining the temporal variations in tourism revenue; for 5 cities (Shanghai, Wuxi, Jinhua, Shaoxing and Zhoushan), GDP was one of the main explanatory factors; for 2 cities (Shanghai and Taizhou), tertiary industry revenue was the main factor; for 10 cities (e.g., Hefei, Ma’anshan, and Changzhou), DPI was one of the main factors; for 5 cities (Huai’an, Zhenjiang, Hangzhou, Ningbo and Shaoxing), highway mileage was one of the main factors; for 8 cities (e.g., Changzhou, Huai’an and Nanjing), the number of scenic spot was one of the main explanatory factors; for 7 cities, the number of persons engaged in tertiary industries was one of the main factors; and for 2 cities (Hangzhou and Quzhou), the number of star-rated hotels was one of the main factors. Among all factors, GDP, disposable personal income, number of scenic spot, number of person engaged and urbanization rate were always positive contributors to the increasing tourism revenue, while tertiary industry revenue was a negative contributor for Shanghai and Taiizhou. These suggested that the increasing trends and interannual variations were controlled by different factors for different cities. Therefore, the city governments should not directly refer to the policies implemented in other cities; instead, they should specifically care about the factors promoting or impeding the tourism economy development in their cities.

4. Discussion

4.1. Industry Adjustment Patterns in the YRDUA Region

The 14th five-year plan for China has explicitly stated that China’s economy development will follow a green development road. Most cities in China are adjusting their development strategies to conform to the national policy. The importance of tourism in promoting China’s economic growth has been frequently reported. For example, Li [27] revealed the leading role of tourism to Shanghai’s economic growth by analyzing the contribution from tourism and its multiplier effects to economic growth. Wu [28] concluded that tourism had a positive effect on the economy in China by making a quantitative and empirical analysis on the tourism industry in China. As part of the tertiary industry revenue, tourism revenue in the YRDUA region accounted for 15.65% of GDP in 2015, which is significantly higher than the national average value (about 10.8% in 2015) [29], indicating the higher importance of tourism in YRDUA. The YRDUA region experienced increases of 63.20% (from 11.57% to 18.89%) and 36.10% (from 41.71% to 56.76%) in the TR/GDP and TIR/GDP ratios, respectively during 2001–2019, suggesting a shifting economic structure and increasing importance of tourism and tertiary industry in economic development in this region. Our further analyses indicated a large difference in TR/GDP ratio change trends at the prefecture city level. Shanghai showed a continuous declining TR/GDP ratio during 2001–2019, suggesting the shrinking importance of the tourism economy in this city. Some cities such as Zhoushan (76.89%) and Quzhou (48.64%) had a very high TR/GDP ratio and could be called a tourism city; thus, they might have less space to continuously increase the TR/GDP ratio. However, they can still increase their TR by increasing GDP. Some other cities, such as Quzhou, Ma’anshan and Taizhou, experienced the fastest increases in TR/GDP ratios from 2001 to 2019. From the sole perspective of tourism spot density and the growing importance of tourism revenue, these cities potentially anticipate a further expansion in their tourism economy in the near future. Certainly, the scenic heritage quality, culture, history, infrastructure, and other supports (e.g., hotels, income, roads, and leisure time) will compound this anticipation. According to the report of World Tourism Cities Federation [30], the global mean TR/GDP ratio in 2018 was 6.8%, while it was 11.04% for China. Compared with the values for the global mean and China, the TR/GDP for Yancheng (7.40%), Taiizhou (8.07%), and Nantong (8.34) were still very low; therefore, they had a great potential to continuously increase tourism revenue.

4.2. Socio-Economic Predictors of Tourism Development in the YRDUA Region

Our study indicated that the temporal changes in tourism revenue were determined by different socio-economic factors among cities in the YRDUA region. There were many previous studies that explored the relationships between tourism revenue and socio-economic factors (e.g., [5,8,22,28,31]. For example, Lu and Yu [22] compared the provincial change patterns in tourism revenue during 1990–2002 and concluded that the spatial and temporal change characteristics of tourism revenue in China were primarily influenced by the tourism resource quantity and quality, infrastructure (e.g., road density), geography, and industry structure. Our study also indicated that the temporal change patterns in tourism revenue were determined by different factors related to the tourism resources (i.e., HM, GDP, TIR, DPI, UR, NSS, NSH) for different cities. To promote tourism development, the local governments should pay special attention to the major factors or resources that limit or enhance the tourism revenue expansion in their own cities. For example, Yancheng City had the smallest tourism revenue and TR/GDP ratio and our analysis found that the number of star-rated scenic spots and urbanization rate were the major contributing factors to tourism revenue growth. Thus, this city should specifically increase scenic spot numbers and expand the urban area and population. Through analyzing 28 indexes related to tourism competitivity for 16 cities in the YRDUA region, Wang [32] indicated that Shanghai, Hangzhou and Taizhou had the highest tourism competitivity in 2005. Our study indicated that Shanghai still had the highest tourism revenue; however, its competitivity has been declining since 2012, indicating that tourism development is leveling off in this city. Our analysis further explained that the other, fast-growing TIR sectors became a negative effect on the tourism revenue expansion, implying strong resource competition with tourism revenue. However, considering its good tourism resources (i.e., highway mileage, personal income, scenic spots, and urbanization rate) and relatively low (14.07%) and declined TR/GDP ratio (reduced by 23.44% during 2001–2019), there is still great potential to increase tourism revenue in Shanghai in the future if appropriate management strategies are implemented.
Using a district in the Jiangsu province as an example, Wang and Xia [33] indicated that changes in tourism revenue can be explained by GDP, but tourism revenue is not the Granger causality of GDP. Based on the Granger causality test and regression models, Caglayan et al. [34] found that there were both unidirectional and bidirectional relationships between GDP and tourism revenue for different countries. Dritsakis [35] analyzed the tourism data from 1960 to 2000 for Greece and indicated a mutual promotion between tourism and economic growth. However, Tang and Jang [36] analyzed the relationships between the performance of tourism related industries and the GDP in the United States by applying cointegration and Granger causality tests. Their study indicated that there was no cointegration or causality between GDP and tourism revenue, and the tourism revenue can still increase even in the face of sustained economic stagnation. Our study also indicated that GDP was not a Granger causality of tourism revenue for most cities in the YRDUA. The tourism revenue change patterns can only be explained by GDP for five cities; instead, some other factors, including NSS, DPI and UR, can be used to explain tourism revenue change patterns for more cities. Li [31] analyzed the relationships between tourism revenue and 13 socio-economic factors. The results indicated that NPE and HM were positive contributors to tourism revenue in Hainan Province, while NSS was a negative contributor. However, we found that NSS was a positive contributor to increasing tourism revenue for eight cities in the YRDUA. Using an ordinary least squares (OLS) multiple regression model, Jang et al. [37], Croes and Vanegas [38] and Wang [39] found that tourist arrivals were best explained by income. Our study also indicated that DPI can be used to explain the tourism revenue change patterns for 10 cities in the study region. The comparisons implied a regional difference in the relationships between tourism revenue and other socio-economic factors.

4.3. Implications and Future Outlooks

During 2001–2019, the entire YRDUA region experienced the fastest-growing economy, historically. The economic development could be influenced by many environmental, social, geographic and governmental factors. The complexity of the economic system requires a tile by tile. As a major component of “green economy”, tourism development has been regarded as the most important approach by many countries such as the United States, the European Union and China. With increasing personal income and leisure time, Chinese outbound tourists have greatly increased during the recent decade [40]. It is an unavoidable issue regarding how to attract domestic and international travelers to this region and continue improving the tourism spot quality in the future. The A-graded tourism spots in this region accounted for 32% of China’s total numbers (2424) in 2014 [18], implying an excellent quality of tourism resources. Except for the direct tourism revenue, there is an indirect contribution of tourism to economy development. As estimated by Statista [41], the global direct tourism revenue was $1.22 trillion, while its total contribution to the global economy was $8.27 trillion in 2016. The Third Italy and Silicon Valley are known as ‘smart regions’ that have managed to create good circumstances to enable both economic growth and tourism development [3,42]. With continuous governmental supports and healthy economic environment, a similar development regime could be anticipated for the YRDUA region.
The integrated tourism economy development of the YRDUA economic circle should first know the development history and geospatial difference in tourism revenue and related socioeconomic factors. Our study indicated that the difference in tourism revenue among cities was reducing, which has also been indicated in previous studies (e.g., [8,31]). This means a more balanced development and this phenomenon is good for economic development for the YRDUA region as a whole. Although the tourism revenue/GDP ratio is very high (18.89%), there still is a large space to increase tourism revenue, especially for the less developed or small scale cities, through implementing the all-region tourism policy [43]. Every city in the YRDUA has its special advantages and attractions of climate, history, culture, and geography [8]. These resources can sustainably expand tourism revenue. In addition, the China government is promoting the developments of “green economy”, “Beautiful Countryside”, “City Park”, and “Rural Vitalization”. Thus, we can anticipate a new, rapidly increasing period for tourism revenue in the near future for the YRDUA region, especially for the cities with lower tourism revenue and tourism revenue/GDP ratio.

5. Conclusions

Based on spatial analysis tools and regression models, our study analyzed the spatial and temporal variations in tourism revenue and related variables and attributed the contributions from multiple socioeconomic factors in the Yangtze River Delta Urban Agglomeration region. Although tourism revenue continuously increased for all cities, the change rates of tourism revenue and the TR/GDP ratio were greatly different between 2001–2010 and 2010–2019 periods among different cities. Some cities, such as Ma’anshan, Hefei, Taiizhou and Quzhou were witnessing a continuously increasing rate of tourism revenue, while increasing rates were declining or shrinking for some metropolitan cities such as Shanghai, Nanjing, and Suzhou. These suggested a shifting industry structure and an unbalanced development in the YRDUA. However, the difference of tourism revenue among cities was declining and turning toward a more integrated development for the YRDUA as a whole. Regression analyses indicated that the interannual variation patterns of tourism revenue were controlled by different socioeconomic factors. According to our results, the city governments should thus take different management measures to reduce the negative controlling socioeconomic factors while promoting the positive controlling factors. With the implementations of economic and social policies such as “Green Development”, “Beautiful Countryside”, and “Rural Vitalization”, the cities in YRDUA are anticipated to have a new, rapidly increasing period for tourism revenue.

Author Contributions

Conceptualization, G.J. and X.Y.; methodology, G.J. and Z.H.; software, G.J., Z.H. and G.T.C.; formal analysis, G.J., and G.T.C.; resources, G.J., Z.H., and L.L.; data curation, G.J., X.Y.; writing—original draft preparation, G.J.; writing—review and editing, G.C., L.L., X.Y., Z.H. and G.T.C.; supervision, X.Y. and L.L.; project administration, X.Y. and L.L.; funding acquisition, X.Y. and L.L. All authors have read and agreed to the published version of the manuscript.

Funding

This paper was funded by the National Natural Science Foundation of China (Grant numbers 41230631 and 41471129).

Institutional Review Board Statement

Not applicable.

Informed Consent Statement

Not applicable.

Data Availability Statement

The data that support the findings of this study are available from the corresponding author (X.Y.) upon justifiable request.

Conflicts of Interest

The authors declare no conflict of interest.

References

  1. Lima, J.M.; Valle, D.; Moretto, E.M.; Pulice, S.M.; Zuca, N.L.; Roquetti, D.R.; Beduschi, L.E.; Praia, A.S.; Okamoto, C.P.; da Silva Carvalhaes, V.L.; et al. A social-ecological database to advance research on infrastructure development impacts in the Brazilian Amazon. Sci. Data 2016, 3, 160071. [Google Scholar] [CrossRef] [Green Version]
  2. United Nation World Tourism Organization. Tourism Statistics Data. Available online: https://www.unwto.org/tourism-statistics-data (accessed on 10 February 2021).
  3. Milne, S.; Ateljevic, I. Tourism, economic development and the global-local nexus: Theory embracing complexity. Tour. Geogr. 2001, 3, 369–393. [Google Scholar] [CrossRef]
  4. Jin, J.C. The Effects of Tourism on Economic Growth in Hong Kong. Cornell Hosp. Q. 2011, 52, 333–340. [Google Scholar] [CrossRef]
  5. Zeng, G.; Cai, J. Study on the contribution of China’s tourism industry to national economy. Tour. Trib. 2012, 27, 23–31. [Google Scholar]
  6. Wang, W.; Xu, Y. Econometric analysis of Chinese tourism’s contribution to national economy. Math. Pract. Theory 2009, 39, 1–8. [Google Scholar]
  7. Zhuo, X. Research on Development of Urban Agglomeration in Yangtze River Delta; Xuelin Publishing House: Shanghai, China, 2006. [Google Scholar]
  8. Zhan, J.; Zhang, Q.; Liu, L. Research on disparity of tourism economy and rank-size system for Yangtze River Deleta. J. Anhui Agric. Sci. 2017, 45, 154–158. [Google Scholar]
  9. Smeral, E. Tourism Demand, Economic Theory and Econometrics: An Integrated Approach. J. Travel Res. 1988, 26, 38–43. [Google Scholar] [CrossRef]
  10. Huang, S.S.; Wei, X. Chinese outbound travel: Understanding the socioeconomic drivers. Int. J. Tour. Res. 2018, 20, 25–37. [Google Scholar] [CrossRef] [Green Version]
  11. Jayaraman, K.; Lin, S.K.; Haron, H.; Ong, W.L. Macroeconomic factors influencing Malaysian tourism revenue, 2002–2008. Tour. Econ. 2011, 17, 1347–1363. [Google Scholar] [CrossRef]
  12. Zhu, F.; Lu, L.; Yu, R.; Bao, J. Tourism Spatial Structure Evolution of Metropolitan Area: A Case Study of Changjiang River Delta Metropolitan Area. Sci. Geogr. Sin. 2012, 32, 570–576. [Google Scholar]
  13. Zhou, L.; Jiang, J. Comprehensive Evaluation of Urban Tourism Competitiveness in the Yangtze River Delta and Its Spatial Patterns Analysis. Econ. Geogr. 2015, 35, 173–179. [Google Scholar]
  14. Fang, Y.; Huang, Z.; Tu, W. Spatial Differences of Tourism Economy in Yangtze River Delta from the Perspective of Social Network. Trop. Geogr. 2013, 33, 212–218. [Google Scholar]
  15. Liang, M.; Shi, C. Core-periphery spatial structure and its evolution of tourism cities in the Yangtze River Delta Area. Tour. Forum 2009, 2, 229–233. [Google Scholar]
  16. Bian, X. Analysis of the forming mechansim of urban tourism core-periphery spatial structure in Yangtze River Delta. Commer. Res. 2010, 395, 62–66. [Google Scholar]
  17. Huang, T. Evolution characteristics and factors affecting tourist flow potential in the Yangtze River Delta Urban Agglomerations. Resour. Sci. 2016, 38, 120–126. [Google Scholar]
  18. Pan, J.; Li, J. Spatial distribution characteristics and accessibility of A-grade tourist attractions in China. J. Nat. Resour. 2014, 29, 55–66. [Google Scholar]
  19. Peking University Open Research Data Platform. Map Poi (Point of Interest) Data. Available online: https://opendata.pku.edu.cn/dataset.xhtml?persistentId=doi:10.18170/DVN/WSXCNM (accessed on 10 February 2021).
  20. National Bureau of Statistics of China. National data. Available online: https://data.stats.gov.cn/easyquery.htm?cn=C01 (accessed on 10 February 2021).
  21. China Statistical Information Network. Statistical Yearbook of China. Available online: http://www.tjcn.org/ (accessed on 10 February 2021).
  22. Lu, L.; Yu, F. A study on the spatial characteristic of provincial difference of tourism economy. Econ. Geogr. 2005, 25, 406–410. [Google Scholar]
  23. Beer, G. The Cobb-Douglas Production Function. Math. Mag. 1980, 53, 44–48. [Google Scholar] [CrossRef]
  24. R Program. R-3.5.3 for Windows. Available online: https://cran.r-project.org/bin/windows/base/old/3.5.3/ (accessed on 10 February 2021).
  25. He, Y.; Chen, H.; Tang, L. Economic development levels of provincial scale in China based on DMSP/OLS data. Geospat. Inf. 2014, 12, 79–82. [Google Scholar]
  26. Xu, Z. Economic benefit analysis of government investment and financing on tourism industry of the Yangtze River Delta Region. J. Hangzhou Norm. Univ. Nat. Sci. Ed. 2012, 11, 572–576. [Google Scholar]
  27. Li, Z. The economic analysis on the output contribution of tourism—The output contribution and the multiplier effect of tourism in Shanghai. Shanghai J. Econ. 2001, 12, 66–69. [Google Scholar]
  28. Wu, G. The correlation analysis on tourism development and economic development in China. J. Shanghai Coll. Appl. Technol. 2003, 3, 238–241. [Google Scholar]
  29. National Tourism Administration Data Centre. China Tourism Statistics Bulletin (2015). Available online: http://www.gov.cn/xinwen/2016-10/19/content_5121432.htm (accessed on 10 February 2021).
  30. World Tourism Cities Federation. Report on World Tourism Economy Trends (2018). Available online: https://www.wtcf.org.cn/uploadfile/2017/1114/20171114051111772.pdf (accessed on 10 February 2021).
  31. Li, Y. Research on factors of tourism economic growth based on grey correlation model. J. Southwest China Norm. Univ. 2017, 42, 97–102. [Google Scholar]
  32. Wang, D. Comparative study of 16 cities tourism competitive power in Changjiang Delta. Resour. Dev. Mark. 2007, 23, 414–418. [Google Scholar]
  33. Wang, B.; Xia, M. A Study on the Relationship between Tourism Industry and Regional Economic Growth: A Case Study of Jiangsu Gaochun District. Mod. Econ. 2013, 2013, 482–488. [Google Scholar] [CrossRef] [Green Version]
  34. Caglayan, E.; Sak, N.; Karymshakov, K. Relationship between Tourism and Economic Growth: A Panel Granger Causality Approach. Asian Econ. Financ. Rev. 2012, 2, 591–602. [Google Scholar]
  35. Dritsakis, N. Tourism as a long-run economic growth factor: An empirical investigation for Greece using causality analysis. Tour. Econ. 2004, 10, 305–316. [Google Scholar] [CrossRef]
  36. Tang, C.; Jang, S. The tourism–economy causality in the United States: A sub-industry level examination. Tour. Manag. 2009, 30, 553–558. [Google Scholar] [CrossRef]
  37. Jang, S.; Bai, B.; Hong, G.; Oleary, J.T. Understanding travel expenditure patterns: A study of Japanese pleasure travelers to the United States by income level. Tour. Manag. 2004, 25, 331–341. [Google Scholar] [CrossRef]
  38. Croes, R.; Vanegas, M. An econometric study of tourist arrivals in Aruba and its implications. Tour. Manag. 2005, 26, 879–890. [Google Scholar] [CrossRef]
  39. Wang, Y. The impact of crisis events and macroeconomic activity on Taiwan’s international inbound tourism demand. Tour. Manag. 2009, 30, 75–82. [Google Scholar] [CrossRef] [PubMed]
  40. Bi, J.; Lehto, X.Y. Impact of cultural distance on international destination choices: The case of Chinese outbound travelers. Int. J. Tour. Res. 2018, 20, 50–59. [Google Scholar] [CrossRef]
  41. Statista. Global Tourism Industry-Statistics & Facts. Available online: https://0-www-statista-com.brum.beds.ac.uk/topics/962/global-tourism/ (accessed on 10 February 2021).
  42. Milne, S. Tourism and sustainable development: Exploring the global-local nexus. In Sustainable Tourism: A Geographical Perspective; Hall, C.M., Lew, A.A., Eds.; Addison Wesley Longman Ltd.: Harlow, UK, 1998; pp. 35–48. [Google Scholar]
  43. Zhou, X.; Tian, D.; Zhang, T. Literature Review on Domestic Pan-Regional Tourism in China. J. Kunming Metall. Coll. 2020, 36, 99–104. [Google Scholar]
Figure 1. Location of the Yangtze River Delta Urban Agglomeration (YRDUA; red-colored region; left) and names and boundary of the included 22 cities (right).
Sustainability 13 03658 g001
Figure 2. Scenic spots distribution and density (spots per square kilometer) in the 22 prefecture cities of the YRDUA region.
Sustainability 13 03658 g002
Figure 3. Spatial distribution in tourism revenue (billion USD) and its proportion to GDP in the YRDUA region in 2019.
Sustainability 13 03658 g003
Figure 4. Interannual variations in tourism revenue (billion $ per year) and tourism revenue/GDP ratio (TR/GDP; %) in the YRDUA region during 2001–2019.
Sustainability 13 03658 g004
Figure 5. Tourism revenue (billion $ per year) in 2001, 2010 and 2019 for different cities in the YRDUA region.
Sustainability 13 03658 g005
Figure 6. The mean annual change of tourism revenue (% per year) during 2001–2010 (C1), 2010–2019 (C2) and 2001–2019 (overall).
Sustainability 13 03658 g006
Figure 7. Tourism revenue/GDP ratio (TR/GDP; %; top panel) in 2001, 2010, and 2019 and the net changes (%; bottom panel) during 2001–2010 (C1), 2010–2019 (C2) and 2001–2019 (overall) for different cities.
Sustainability 13 03658 g007
Table 1. Selected variables and fitted regression models between tourism revenue and other socio-economic factors.
CityStepwise Regression Models
ShanghaiLN(TR) = 6.43 + 0.21GDP *** − 0.20TIR ***
HefeiLN(TR) = 2.69 + 1.36DPI ***
Ma’anshanLN(TR) = 1.01 +1.18DPI ***
ChangzhouLN(TR) = 2.76 + 0.35NSS ** + 0.36DPI *** + 1.14NPE ***
Huai’anLN(TR) = 1.73 + 0.15NSS ** + 0.75HM *** + 0.45NPE *** + 0.63DPI ***
NanjingLN(TR) = 4.57 + 0.37NSS *** + 0.18DPI ***
NantongLN(TR) = 1.00 + 7.274UR *** + 0.17DPI *
SuzhouLN(TR) = 3.24+0.19NSS***+3.00UR***+0.35NPE***
TaiizhouLN(TR) = 1.80 + 0.62DPI * − 2.09TIR *** + 1.12NPE *** + 1.06GDP **
WuxiLN(TR) = 3.34 + 1.06NPE *** + 0.29GDP *** + 1.29UR ***
YanchengLN(TR) = 1.86 + 0.27NSS *** + 3.74UR ***
YangzhouLN(TR) = 3.46 + 0.45NSS *** + 1.58NSH ***
ZhenjiangLN(TR) = 2.31 + 0.47DPI *** + 1.41HM *** + 2.01UR *
HangzhouLN(TR) = 3.48 + 0.57DPI *** + 0.52NSH *** − 0.52HM ** + 1.75UR *
HuzhouLN(TR) = 0.54 + 8.04NPE *** + 0.16NSS *
JiaxingLN(TR) = 1.30 + 3.07NPE *** + 3.09UR *
JinhuaLN(TR) = 0.16 + 0.50GDP *** + 7.40UR ***
NingboLN(TR) = 3.78 + 0.29NSS *** + 0.53NPE ** + 0.79HM **
QuzhouLN(TR) = 0.78 + 1.04DPI *** + 1.78NSH *** + 1.79NPE *
ShaoxingLN(TR) = 1.87 + 0.89NPE *** + 0.44GDP *** + 0.19HM *
TaizhouLN(TR) = 1.31 + 6.04UR *** + 0.38DPI ***
ZhoushanLN(TR) = 3.02 + 1.68GDP *** + 0.97NSS *
Note: *** denotes extremely significant at p-value < 0.001; ** very significant at p-value < 0.01; * significant at p-value < 0.05. Units: tourism revenue (TR) (billion USD), tertiary industry revenue (TIR) and GDP (×10 billion USD), disposable personal income (DPI) (×1000 USD), number of persons engaged in tertiary industries (NPE) (million person), urbanization rate (UR) (0-1; unitless), highway mileage (HM) (×10,000 km), number of A-graded scenic spots (NSS) (×10), number of star-rated hotels (NSH) (×100).
Publisher’s Note: MDPI stays neutral with regard to jurisdictional claims in published maps and institutional affiliations.

