
Densify and Expand: A Global Analysis of Recent Urban Growth


1
Marron Institute of Urban Management, New York University, Brooklyn, NY 11201, USA
2
Pillai College of Engineering, New Panvel, Navi Mumbai 410206, India
3
Pillai College of Architecture, New Panvel, Navi Mumbai 410206, India
*
Author to whom correspondence should be addressed.
Sustainability 2021, 13(7), 3835; https://0-doi-org.brum.beds.ac.uk/10.3390/su13073835
Submission received: 20 February 2021
/
Revised: 15 March 2021
/
Accepted: 24 March 2021
/
Published: 31 March 2021
(This article belongs to the Special Issue Rethinking Urban Population Density and Sustainable Cities)
Abstract
:Serious concerns with accelerating global warming have been translated into urgent calls for increasing urban densities: higher densities are associated with lower greenhouse gas emissions, especially those related to vehicle kilometers traveled (VKT). In order to densify meaningfully in the coming decades, cities need to make room within their existing footprints to accommodate more people. In the absence of adequate room within their existing footprints, cities create more room through outward expansion, typically resulting in lower overall densities. We introduce a quantitative dimension to this process, focusing on the population added to a global stratified sample of 200 cities between 1990 and 2014. In three-quarters of the cities we studied, the areas built before 1990 gained population and thus densified significantly. On average, however, only one-quarter of the total population added to the 200 cities in the sample in the 1990–2014 period were accommodated within their 1990 urban footprints, while three-quarters were accommodated within their newly built expansion areas. That resulted in an overall decline in average urban densities during the 1990–2014 period despite the near-global, decades-old and rarely questioned consensus that urban expansion must be contained.
1. Background and Research Questions
Between 1950 and 2020, the world’s urban population has grown by a factor of 5.8 [1] (file 3), while income per capita has grown by a factor of 4.4 [2]. Urban economies have thus grown, on average, by a factor of 25 or more during this period. As cities have grown and developed, their residents have needed more room or, more precisely, more floor space. We observe that cities have added floor space in three ways: by building upwards, by infilling the vacant open spaces between buildings, or by expanding outwards, and they typically grew in all three ways together.
We can distinguish between these three ways by referring to building upwards and infill within existing urban footprints as densification and to building outwards as expansion. To an important extent, densification and expansion are substitutes: typically, when not enough room can be made available to meet the demand for floor space through densification, then room is inevitably made available through expansion. Conversely, when there are barriers to expansion, densification creates more room than it would create in the absence of such barriers. In an ideal real estate market, households and firms can choose whether to locate within existing urban footprints or on the urban periphery, thus contributing to densification or expansion. Indeed, the classical models of the urban land market, e.g., [3,4,5], posit a market equilibrium where households and firms settle on their preferred combination of land and transport cost, opting for a smaller plot closer to the city center or a larger plot further away.
City planners, environmentalists, and other advocates of the “compact city paradigm,” e.g., [6,7], assert that the tradeoff posited in the standard model leads to “urban sprawl”, which has many negative externalities that are not reflected in the price of land [8,9,10]. This paradigm insists that it is in the public interest to densify the existing footprints of cities while containing urban expansion, so as to attain numerous public objectives that free market transactions fail to internalize: the preservation of natural habitats on the periphery of cities [11,12,13]; the conservation of lands in prime agricultural use [14]; the judicious management of public infrastructure networks [15,16]; the reduction in vehicle kilometers traveled (VKT) [17,18], and the increased use of public transport [19], biking, and walking [20], resulting in both the reduction of greenhouse gas emissions and in improved public health, to name a few. These public concerns necessitate, in turn, the active containment of urban expansion through strict land use and zoning regulations and through the selective extension of infrastructure lines into the urban periphery.
Together with our colleagues, we conducted a regulatory survey in 2016 (unpublished) in a stratified global sample of 200 cities—148 cities in less developed countries and 52 cities in more developed ones—using local informants [21]. The survey, conducted in preparation for Habitat III, the 2016 UN conference on cities, contained three questions about the containment of urban expansion:
- Is containing the expansion of the city an explicit goal of the zoning and land use plan? (yes/no)
- Are regulations that prohibit development on specific plots in the expansion area respected by private developers? (always/sometimes/never)
- Are regulations that prohibit development on specific plots in the expansion area respected by government agencies? (always/sometimes/never)
Of 194 valid responses to these questions, informants in 129 cities (66%) answered “yes” to the first question, 101 (71%) in cities in less developed countries and 28 (53%) in cities in more developed ones. In less developed countries, regulations that prohibited development in expansion areas were “always” respected by private developers and government agencies in 54% and 70% of the cities, respectively, and “sometimes” respected by private developers and government agencies in 45% and 29% of the cities, respectively. In more developed countries, regulations that prohibited development in expansion areas were “always” respected by private developers and government agencies in 89% and 100% of the cities, respectively, and “sometimes” respected by private developers and government agencies in 11% and 0% of the cities, respectively. Advocates for compact cities would appear to have succeeded, and yet even a cursory examination of the urban peripheries of cities would reveal that massive growth has taken place in recent years.
The primary purpose of this paper is to examine data for the 1990–2014 period with a view to answering two knowledge gaps that are of key importance in gaining a better understanding of the role of the compact city paradigm in guiding urban development since 1990. This starts with understanding what densification meant on the ground and how cities actually densified and expanded in recent decades. The first research question we answer is:
- What is the average share of the population added to cities during the 1990–2014 period that was accommodated within their 1990 urban footprints versus the share added to their 1990–2014 expansion areas, and how did it affect the overall change in urban densities?
It is also vital to understand whether the densification of the 1990 footprints of cities took place the easy way—through the saturation of the remaining vacant lands within existing urban footprints with new buildings, a process that must eventually end—or the hard way, through adding floors to existing buildings, replacing them with bigger, taller ones, or reducing dwelling unit size and floor area per person, a process that is more difficult. The second research question we answer is:
- 2.
- What share of the overall increase in population density within 1990 urban footprints can be explained by the saturation of vacant lands with buildings and what share by the increase in density in built-up areas?
Answers to these questions are important because urban planners and policy makers who adhere to the compact city paradigm continue to hope that it will eventually be successful. These actors and the cities they serve will benefit from more realistic expectations and goals for densification as a means of accommodating urban population growth. The development of gridded population products that allow for intraurban population estimates over time at a high spatial resolution [22,23,24,25] provide valuable insights that can guide our understanding of how cities across the world have densified and expanded in recent decades. While studies have mapped the spatial extent of cities using satellite imagery and measured their populations and densities to estimate their average values or average rates of change, these studies typically compare aggregate or average values for the city as a whole at each time period [26,27,28,29]. Few studies examine the decomposition of the added population across the city into change within the city boundary at an earlier date versus change within the expansion area at a later date. Beyond isolated examples that focus on a single city, the authors are aware of only one study that addresses this question globally, published less than a year from the time of this manuscript’s writing [30]. Surprisingly, our analysis arrives at different conclusions. We explore potential explanations for the divergent findings in the discussion section. We are not aware of any study that examines our second research question. Comparing population increase attributed to infill within the city footprint at an earlier date and expansion areas at later dates follows a tradition exemplified by [31] and adopted by others such as [32,33].
The evidence in this paper demonstrates that only a relatively small share of the urban population was accommodated within existing urban footprints, but also shows that densification did take place in some cities. As urban planners, we might not be able to contain urban expansion, but we may be able to chart a more effective evidence-based course of action to increase the share of the urban population that is accommodated within existing urban footprints, slowing down urban expansion rather than seeking to contain it. This reality check is now sorely needed in light of urgent calls to make cities more compact so as to mitigate global warming while, at the same time, keeping them productive and affordable.
The remainder of the paper is structured as follows: Section 2 introduces the global sample of cities and explains the methodology for measuring change in cities’ populations, densities, and associated metrics; Section 3 presents a typology of cities based on their densification and expansion characteristics and illustrates this typology with four city case studies; Section 4 reviews the findings for the global sample of 200 cities; Section 5 discusses the implications of these findings, and the limitations of the study. Section 6 concludes with an exposition of the making room paradigm, the central policy implication of the findings.
2. Methodology and Data Sources
To answer the questions that are central to this paper, we required comparable measurements of cities’ footprints in at least three points in time; measurements of cities’ population at each of those time periods; fine-grained population data that would allow us to determine how many new residents settled in expansion areas versus core areas; and a set of cities to study that could provide externally valid statistics on global urban growth.
2.1. The Global Sample of Cities
The authors have previously identified the universe of all 4231 cities and metropolitan areas that had 100,000 people or more in 2010. A random sample of 200 cities, stratified by three characteristics, was drawn from this universe (see Figure 1). The identification of the universe of cities and the method of selecting and weighting the sample is explained in detail in the Atlas of Urban Expansion, Volume I [34] (pp. 9–20) and will not be repeated here.
2.2. Mapping Changes in the Urban Extents of Cities
To map the land area of cities, we devised a comparable and spatially derived unit of analysis named the urban extent. The urban extent of a city contains both its built-up area and its urbanized open space. Its built-up area contains residential, industrial, commercial, office and civic buildings, as well as roads, rail lines and rail yards, ports, and airports. Its urbanized open space contains public parks and gardens, private parks and gardens, cemeteries, and vacant lands. To calculate the urban extent, we analyzed Landsat imagery to extract information for built-up areas, open spaces, and water. We segmented built-up pixels into two broad classes: urban and rural, based on the number of built-up pixels in a 1 km2 neighborhood around a pixel. Urban built-up pixels are those whose 1 km2 neighborhoods are at least 25 percent built-up. The labels urban and rural are used somewhat loosely as they refer to generalized patterns of built-up area concentration as opposed to an official definition. We segmented open space pixels into three categories: fringe, captured, and rural open space, based on their distance to urban built-up pixels or whether they are completely surrounded by urban built-up pixels. Fringe open space pixels—those within 100 m of urban built-up pixels and captured open space pixels—those completely surrounded by urban built-up pixels and less than 200 hectares in combined area, comprise urbanized open space. The rules and rationale for the subclassification of built-up and open space pixels are described in [35,36].
Urban built-up pixels and their urbanized open space comprise urban clusters. For a given analysis area, we identified all urban clusters; there could be as few as one or several hundred. We then applied an “inclusion rule” to determine which urban clusters would be unioned into the same urban extent. The inclusion rule creates a catchment area around individual urban clusters based on the amount of built-up area within them. Clusters with overlapping catchment areas were unioned and labeled with the name associated with the principal urban cluster. This mapping exercise was repeated at three time periods: circa 1990, circa 2000, and circa 2014. A discussion of the inclusion rule and its application is described in [35] (pp. 12–14). For the present analysis, we rely on data for circa 1990 and circa 2014 only. Superimposing the two urban extents of a city over each other, we created maps that show (1) their 1990 footprint: the area built until 1990, and (2) their expansion area: the area added between 1990 and 2014 (Figure 2).
2.3. Population Data Sources
The urban extent is a morphological measure of a city at a given point in time and does not correspond to census enumeration districts. To calculate the population of a city’s urban extent, we collected input population data on a city-by-city basis to identify the most reliable data sources with the smallest spatial resolution. It includes a mixture of census data, city ward data, and data collected by local experts. We then used an apportionment procedure to distribute the populations of individual enumeration districts that completely encompassed the urban extent. The population of an enumeration district was divided equally among all built-up pixels within that district. The population of the urban extent was then calculated as the total population of the built-up pixels within the urban extent. The apportionment method and data sources applied in the Atlas of Urban Expansion are described in [35] (p. 14–16).
Calculating the total population of the expansion area often required data of a more granular nature. In recent years, a number of research projects have attempted to estimate the distribution of the global population using statistical models and remote sensing data. This includes intraurban population distributions that can be used to estimate the share of the total population in different areas of cities, such as the expansion area and the core. We selected the WorldPop 1 km gridded population product as it offers high methodological rigor [37]. We continued to use our own estimates of the populations of urban extents as the basis for our zonal population estimates. More precisely, we overlaid the WorldPop grid on the two zones (1990 footprint, 1990–2014 expansion area), converted the zonal totals into shares, and multiplied them by our own estimate of the population in 2000 or 2014 to obtain new population estimates for the expansion area in 2000 or the two expansion areas at 2014 (Figure 3).
2.4. Defining Urban Density, Saturation and Built-Up Area Density
2.4.1. Urban Density
We define urban density as the average population density in a given zone (or in a city as a whole), ignoring internal variations in density. We can represent it as a ratio of the total population of the city and the urban extent of the city, the area it occupies:
Urban density = Population ÷ Urban Extent.
Equation (1) tells us that, other things being equal, urban density in that city will increase when the population of the city increases and decline when the urban extent of the city expands. More generally, urban density will increase if the rate of increase in population is higher than the rate of expansion of its urban extent. Urban density is a gross density in the sense that its denominator is the entire area of a zone or a city inclusive of all its land uses (the urban extent). It does not have an a priori upper or lower limit. In the global sample of cities in 2014, for example, urban density varied from a maximum of 372 persons per hectare in Dhaka, Bangladesh, to a minimum of seven persons per hectare in Killeen, TX, United States.
2.4.2. Saturation
The urban extent of a city consists of both open spaces and built-up areas. The urban extent can be more or less saturated by its built-up areas. Saturation is defined as the ratio of the built-up area of a zone (or a city) and its extent:
Saturation = Built-up Area ÷ Urban Extent.
Saturation varies from 0 to 1. It is closer to 0 when the share of urbanized open space in the city is high in comparison to the share of its built-up area; it is closer to 1 when the share of urbanized open space in the city is low in comparison to the share of its built-up area. In the global sample of cities in 2014, for example, saturation varied from a maximum of 0.84 in Osaka, Japan, to a minimum of 0.48 in Kozhikode, India.
2.4.3. Built-Up Area Density
The inhabitants of a given city or zone typically reside in built-up areas and not urbanized open spaces (people tend to live in buildings). One expression of population density is the built-up area density of a zone or a city. Built-up area density is defined as the average population density in the built-up area of a given zone, exclusive of its urbanized open space. This can be represented as a ratio of the total population and the total built-up area within the zone:
Built-up Area Density = Population ÷ Built-up Area.
Like urban density, built-up area density does not have an a priori upper or lower limit, but it is always higher than urban density because its denominator, the built-up area, is always smaller than the city’s urban extent. In the global sample of cities in 2014, for example, built-up area density varied from a maximum of 552 persons per hectare in Dhaka, Bangladesh, to a minimum of 13 persons per hectare in Killeen, TX, United States.
The reader can ascertain that urban density is the arithmetic product of saturation and built-up area density because:
Built-up Area Density × Saturation = (Population ÷ Built-
up Area) × (Built-up Area ÷ Urban Extent) = Population ÷
Urban Extent = Urban density.
up Area) × (Built-up Area ÷ Urban Extent) = Population ÷
Urban Extent = Urban density.
As urban density is a product of saturation and built-up area density, we can represent it as a rectangle on the XY-plane, where its value on the X-axis for a given zone—say, the 1990 footprint of a given city—corresponds to its saturation, its value on the Y-axis corresponds to its built-up area density, and the area of the rectangle corresponds to its urban density value (see Figure 4).
The Atlas of Urban Expansion furnished data for the 200 cities in the global sample of cities on urban density, saturation, and built-up area density for their urban extents in 1990 and 2014. With the inclusion of WorldPop data, we have calculated those values for their 1990–2014 expansion areas as well (see Figure 2 for further clarification on these areas). This has made it possible to provide reliable quantitative answers to important questions pertaining to their densification, saturation, and expansion during this period. We use this information to report on two sets of findings:
- The average share of the population added to cities between 1990 and 2014 that was accommodated through the densification of their 1990 footprints versus the average share accommodated in their expansion areas, the area added to cities between 1990 and 2014 in the global sample of cities; and
- Initial values and changes in urban density, saturation and built-up area density within the 1990 urban footprint of cities, and their impact on the change in average urban density in cities as a whole during the 1990–2014 period.
3. Findings: A Typology of Cities for Studying Densification and Expansion
To analyze densification and expansion in cities, we can consider two distinct zones: their 1990 urban footprints—the areas of cities built and inhabited before 1990—and their expansion areas, areas built and inhabited, or absorbed into the city, over the 1990–2014 period (Figure 2 illustrates these zones). By looking at the changes in population, built-up area density, urban extent density, and saturation in these zones over the 1990–2014 period, we can assess whether cities’ 1990 footprints densified, and if so, how.
There are several possible scenarios: the city as a whole may have gained (or lost) population during this period. The 1990 footprint may have gained (or lost) a share of that population gain (or loss). Note that the area of the 1990 urban extent did not change at all between 1990 and 2014, only its population changed. According to Equation (1), if its population grew, its urban density increased. This increase in urban density was accompanied either by an increase in saturation, an increase in built-up area density, or by an increase in both. This suggests that cities may fall into different categories pertaining to the densification of their 1990 urban footprints and that cities in some categories may be more amenable to overall densification than others. The classification of the 200 cities in the global sample into these categories is summarized in Figure 5.
First, we differentiated the global sample of 200 cities into two categories, those that gained population during the 1990–2014 period and those that lost population. There are 194 cities (97% of the total) in the first category and six (3%) in the second category. In all six cities that lost population, their 1990 urban footprints lost population as well and thus de-densified: their urban densities declined.
Second, we differentiated the 194 cities that gained population during the 1990–2014 period into two categories: those where the 1990 urban footprint gained population and those that it lost population. A total of 144 cities (72% of the total) are in the first category and 50 (25%) are in the second category. In all 50 cities that lost population in their 1990 footprint, their footprints de-densified: their urban density declined. In these cities, the expansion area accommodated all the gain in population in the city as a whole, while some of the population of the 1990 urban footprint shifted to the expansion area as well. In the remaining 144 cities, the 1990 urban footprint benefited from the overall increase in city population and accommodated a share of that population. Given that the 1990 footprints of cities remained the same in 2014—namely, they did not change in area—and given that in these 144 cities the population within the 1990 footprint increased, all of these cities—almost three-quarters of the global sample of cities—experienced the “densification” of their 1990 footprints.
The densification of the 1990 urban footprint of cities could occur in two different ways: (1) accompanied by an increase in built-up area density; or (2) accompanied by a decrease in built-up area density. We refer to densification accompanied by an increase in built-up area density as “hard densification” and to densification that entails a decline in built-up area density as “soft densification”. “Hard densification” can be accompanied by either an increase or a decrease in saturation, while “soft densification” is always accompanied by an increase in saturation. A decrease in saturation is extremely rare, as it requires clearance of built-up areas—typically through war, civil war, or natural disaster—and their transformation into urbanized open space.
We thus further differentiated the 144 cities in the global sample where 1990 urban footprints underwent “densification” into two categories: those cities where built-up area density increased (“hard densification”) and those where it declined (“soft densification”). There were 72 cities (36% of the total) in the first category and 72 cities (36%) in the second one.
To review, the 200 cities in the global sample can be divided into four discrete and exclusive categories with regard to densification:
- Category 1: six cities with population loss during the 1990–2014 period;
- Category 2: 50 cities with population gain that lost population within their 1990 footprints;
- Category 3: 72 cities with population gain within their 1990 footprint accompanied by decreased built-up area density within that footprint (“soft densification”); and
- Category 4: 72 cities with population gain within their 1990 footprint accompanied by increased built-up area density within that footprint (“hard densification”).
A map of these cities is shown in Figure 6. The reader can ascertain that cities in these four categories are not unique to particular world regions, except that five of the six cities in the global sample that lost population (Category 1) are concentrated in Eastern Europe.
In the following sections, we elaborate on some of the characteristics and attributes of these four categories by focusing on four cities:
3.1. Category 1: Cities that Lost Population—The Case of Dzerzhinsk, Russian Federation
The U.N. Population Division estimates that, of the 1860 cities and metropolitan areas that had populations of 300,000 or more in 2018, 4.5% lost population between 1990 and 2015, and 4.2% are expected to lose population between 2020 and 2035 [1] (file 12). Between 1990 and 2014, the urban population in the Russian Federation, for example, declined from 108.3 to 106.3 million as cities lost population to out-migration and to low birth rates (estimated from [1], file 3). One of the cities that lost population was Dzerzhinsk (Figure 6). During the 1990–2014 period, the population of Dzerzhinzk decreased by 41,000 people, its 1990 footprint lost 65,000, and its expansion area gained 24,000. Urban density within the 1990 footprint of Dzerzhinsk decreased from 39 to 29 persons per hectare. Saturation within its 1990 footprint increased as construction on vacant lands continued, while built-up area density decreased from 69 to 40 persons per hectare (at −2.2% per annum) as people left. Urban density in Dzerzhinsk as a whole declined from 39 to 27 persons per hectare (at −1.6% per annum) during this period.
In the two graphs on the left of Figure 7, saturation is shown on the X-axis, varying from 0 to 1, and built-up area density is shown in persons per hectare on the Y-axis, varying from 0 to 320 p/ha. In the graph on the left, we see urban density within its 1990 footprint in 1990 (dark grey rectangle) and in 2014 (thick border rectangle). The changing shape of the urban density rectangle tells us that built-up area density decreased during this period (from 70 to 40 p/ha), while saturation increased (from 0.6 to 0.7). In the graph on the right, we see urban density in its expansion area (light grey rectangle) and in the city as a whole (double line border rectangle) in 2014. The smaller size of the light grey rectangle, in comparison with the dark grey one on the left, tells us that overall urban density in the new expansion areas was lower than that of the 1990 urban footprint. The lower height of the light grey triangle tells us that it was smaller because of lower built-up area density, and not because of lower saturation levels. The double-line border rectangle tells us that overall urban density in the city in 2014 was lower than that 1990 (dark grey rectangle on left) because of lower built-up area density, not because of lower saturation.
3.2. Category 2: Cities That Gained in Population but Lost Population within Their 1990 Footprints—The Case of Berlin, Germany
Of the 194 cities in the sample that gained in population, 50 cities lost population within their 1990 urban footprints while their expansion areas accommodated 100 percent of their added populations. We note that this group of cities had the same share of cities in more developed countries as the sample of cities as a whole: loss of population in 1990 footprints is not a feature that is unique to cities in more developed countries.
Since all of these cities lost population within their 1990 footprints between 1990 and 2014, urban density within these footprints declined in all of them. Interestingly enough though, this decline in all cities but one in this group was brought about by the decline in built-up area density within these footprints, accompanied by an increase in saturation. If we assume that the amount of residential floorspace within their 1990 footprints did not decline, we could conclude that housing became more spacious as the same amount of floorspace accommodated fewer people. It is more likely however, that residential floorspace did decline as more room was made for non-residential land uses such as offices, hotels, commercial areas, and cultural amenities.
Berlin, Germany, is a typical city in this group (Figure 8). During the 1990–2014 period, the population of Berlin increased by 600,000 people: its 1990 footprint lost 800,000, and its expansion area gained 1.4 million. Like 38 out of the 50 cities in this group, as its 1990 footprint lost population, its urban density declined. In the case of Berlin, it declined from 72 to 55 persons per hectare by 2014. The decline was mostly explained by a decline in built-up area density, because saturation within the 1990 footprint increased during this period. Built-up area density declined from 130 to 80 persons per hectare, while saturation increased from 0.6 to 0.7 as vacant lands were filled in. At the same time, the urban periphery of Berlin was built at a considerably lower built-up area density (50 p/ha) and at a lower saturation as well (0.5), both translating into lower urban density in the expansion areas of the city (22 p/ha). The decline in urban density both within the 1990 footprint and in the expansion area of Berlin resulted in a lower overall urban density in the city as a whole (35 p/ha) by 2014.
The large majority of cities in this group followed the same pattern as that of Berlin, but not all of them. Twelve cities in this group followed a slightly different pattern: their expansion areas were built at a higher built-up area density than that of their 1990 footprints. Theories of the urban land market—such as those propounded by [3,4,5]—expect density to decline with distance from the city center. In Ahvaz, Iran, for example, built-up area density within its 1990 footprint declined from 100 to 70 p/ha between 1990 and 2014, while built-up area density within its newly built expansion areas averaged 130 p/ha in 2014. Still, because saturation levels on the new urban periphery were low (0.4), overall urban density in these areas in 2014 was still lower than urban density within the 1990 footprint, resulting in the decline in urban density in the city as a whole, from 71 p/ha in 1990 to 62 p/ha by 2014. This pattern was common to 11 out of the 12 cities in this category. The only exception was Singapore. As its 1990 footprint lost population during the 1990–2014 period, urban density within its 1990 footprint declined, like all cities in this group. However, its new expansion areas were built at a higher built-up area density and at a higher level of saturation, with the astonishing result that the urban density in the expansion area of the city in 2014 was more than double the urban density within its 1990 footprint in that year (219 p/ha vs. 82 p/ha). As a result, overall urban density in Singapore increased from 90 to 121 p/ha, at the average rate of 1.2% per annum.
3.3. Category 3: Cities that Experienced “Soft Densification” within Their 1990 Footprints—The Case of Hyderabad, India
Of the 144 cities that added population to their 1990 footprints during the 1990–2014 period, 72 cities (50%) experienced “soft densification”: they gained in population and thus increased urban density within their 1990 urban footprints, while built-up area densities within these footprints declined. A simple way to understand this is to consider that the added population was largely accommodated by new construction on vacant lands within the 1990 footprint. This new construction increased the saturation of the 1990 footprint with built-up areas but was mostly inhabited at a lower built-up area density. In addition, built-up area density in the existing housing stock may have declined as well, either due to the gentrification of older neighborhoods or to the change in use from residential to non-residential. The overall result within the 1990 footprint was a decrease in built-up area density with a simultaneous increase in population, which was compensated for by an increase in saturation, leading to an increase in urban density.
Hyderabad, India, is a typical city in this group (Figure 9). During the 1990–2014 period, the population of Hyderabad increased by 3.7 million people, its 1990 footprint gained 400,000, and its expansion area gained 3.3 million. As a result, the urban density within the 1990 footprint—the ratio of its population to its total area—increased, from 180 to 200 persons per hectare. It densified, but as it turned out, most of the new construction during the 1990–2014 period did not densify its built-up areas but saturated its vacant areas and urbanized open spaces. Hyderabad’s saturation of its 1990 footprint increased from 0.7 to 0.9 while its built-up area density declined from 310 p/ha in 1990 to 220 in 2014. By 2014, since its saturation level was already 0.9, not many vacant lands and open spaces remained available for further “soft densification”. If further densification is to take place in Hyderabad’s 1990 footprint in the coming years, it will have to involve “hard densification”.
Changes in urban density, saturation, and built-up area density within the 1990 footprints of most cities in the “saturation only” group were similar to those of Hyderabad, but there were some exceptions. Ndola, Zambia, for example, was one of six cities where built-up area density in their expansion areas was higher, not lower, in 2014. This type of urban expansion holds the promise of increased overall urban density on the urban periphery in the coming years, as the outer residential areas in the city increase in saturation. For now, because of the high built-up area density in its expansion area, overall urban density in Ndola declined only mildly between 1990 and 2014, from 59 to 57 p/ha. Overall urban density in six cities in this group increased during the 1990–2014 period, albeit only minimally. Los Angeles, United States, was one of those cities. During the 1990–2014 period, its overall urban density increased from 25 to 26 p/ha.
3.4. Category 4: Cities that Experienced "Hard Densification” within Their 1990 Footprints: The Case of Marrakesh, Morocco
Marrakesh, Morocco, is one of the cities that experienced “hard densification” of its 1990 footprint during the 1990–2014 period (Figure 10). During the 1990–2014 period, the population of Marrakesh increased by 400,000 people: its 1990 footprint gained 260,000 and its expansion area gained 140,000. During this period, urban density within its 1990 footprint increased from 72 to 122 persons per hectare, its saturation increased from 0.7 to 0.9, and its built-up area density increased from 90 to 130 p/ha. Still, overall urban density in Marrakesh declined from 72 to 54 persons per hectare. In the 72 cities of this group as a whole, overall urban density declined at 0.1 ± 0.5% per annum—a rate not significantly different from zero. In other words, overall urban density did not increase significantly, even in the presence of “hard densification” within 1990 urban footprints. Decomposing this average, we found that urban density did increase in 39 cities (54% of the cities in the group) during the 1990–2014 period, and in the cities that it did increase, it increased at an average rate of 1.2 ± 0.5%per annum.
To conclude, differentiating cities into these categories makes it clear that the densification of the existing urban footprints of cities does not have a universal meaning but varies depending on the conditions prevailing in the city. Cities that are losing population or, for that matter, cities that are losing population in their urban cores cannot be expected to densify. The particular pattern of densification vs. expansion in a city should guide effective interventions that will make it possible for a given city to effectively confront climate change while remaining productive, inclusive, and sustainable. The next section elaborates on key metrics that differentiate these four categories of cities from one another, making it possible for us to better understand variations among cities when it comes to densification and expansion.
4. Densification and Expansion, 1990–2014: An Overview
We can now begin to answer the questions posed in the introduction by rephrasing them to reflect the division of cities into the four categories introduced in Section 3. In the presentation of data for each question we report estimates for both the global sample and for each of the four categories. We also report the values for ten cities in different world regions to provide specific examples that are representative of each of the categories.
4.1. What Is the Average Share of the Population Added to Cities during the 1990–2014 Period That Was Accommodated within Their 1990 Urban Footprints versus the Share Added to Their 1990–2014 Expansion Areas?
The key finding, shown in Table 1 below, is that in the global sample of 200 cities as a whole, the share of the population added to cities during the 1990–2014 period that was accommodated within their 1990 footprint was 23%, while the share accommodated in the expansion areas—the areas built and settled between 1990 and 2014—was 77%. These percentages varied from 0% and 100% in the six cities that lost population or in the 50 cities that lost population within their 1990 footprints—to 40% and 60% in cities that increased built-up area density within their 1990 footprints. In no category did the densification of the 1990 footprints of cities absorb half or more of the added populations.
4.2. How Did Those Respective Shares Affect the Change in Average Urban Density in Cities as a Whole during the 1990–2014 Period in Different Categories of Cities?
Table 1 also shows that despite the increase in urban density within 1990 footprints in almost three-quarters (144 cities) of the sample, this increase was not sufficient to increase overall urban densities. The average urban density in cities as a whole declined in all cities except in the category of cities that increased built-up area density within their 1990 footprints as well, and even in this category the change in overall urban density in cities as a whole, −0.1 ± 0.5%, was not significantly different than zero. That did not mean that urban density did not increase in individual cities in the sample. In three out of the ten city-specific examples it increased substantially: in Singapore from 90 to 121 persons per hectare, in Bogotá from 138 to 196 persons per hectare, and in Shenzhen from 33 to 105 persons per hectare. It also increased slightly in Los Angeles, from 25 to 26 persons per hectare. In the global sample of 200 cities, the average urban density in the city as a whole increased between 1990 and 2014 in 43 cities, and 39 of these cities were among those that increased their built-up area density in their 1990 footprints. Singapore was the only city in the global sample that increased its urban density while losing population within its 1990 footprint.
One possible explanation as to why the densification of the 1990 urban footprint in the majority of cities in the sample did not lead to an overall increase in urban density in the cities as a whole comes from one of the basic findings in urban economic geography: density typically declines regularly with distance from a city’s center. This was first noted by [38] who showed that densities decline at a negative exponential rate with distance from the city center. Theoretical explanations of this pattern were provided by [3,4,5], that showed that land prices—and hence residential densities that are, in essence, market responses to land prices—can be expected to decline with distance from city centers. Since urban expansion takes place on the periphery of established urban footprints, it necessarily takes place at greater distances from city centers than these established urban footprints. We should hypothesize, therefore, that urban density in the expansion areas of cities built during the 1990–2014 period will be significantly lower than urban density in their 1990 footprints. The same should be true of built-up area density, which is a market response to lower land prices on the urban periphery. Saturation is hypothesized to be lower in expansion areas as well because the peripheries of cities—even their near peripheries—constitute a vast land market and only select plots in this market get built upon initially, while the remaining plots get built upon over a longer time period. If only plots that were directly adjacent to existing built-up areas were allowed to develop, their owners would have monopolistic power. For the land market on the urban periphery to function properly, supply must be adequate to allow competition to determine land prices.
4.3. By 2014, Were There Significant Differences in Urban Density, Saturation, and Built-Up Area Density between the 1990 Urban Footprints of Cities and Their Expansion Areas in Different Categories of Cities?
Table 2 compares the three key metrics introduced in this paper—urban density, saturation, and built-up area density—for the year 2014 in the 1990 footprints and the 1990–2014 expansion areas of cities in the seven categories introduced earlier.
A cursory look at the table largely confirms the hypotheses introduced in the preceding paragraphs: in 2014, all three metrics were significantly lower in the expansion areas of cities in all four categories. In fact, urban density in the expansion areas of cities in 2014 was less than half its average value in their 1990 footprints in all categories of cities, and there was no significant difference in this value among categories. That said, we note again that Singapore is an exception: urban density in its expansion area was more than double that of its 1990 footprint: 219 vs. 82 persons per hectare. Singapore was the only city in the global sample where saturation was higher in its expansion area in 2014 than in its 1990 footprint in that year: 0.94 vs. 0.57. In general, however, saturation was more than 40% lower in the expansion areas of cities and—except in cities that lost population— there was no significant difference in this value among categories as well. Interestingly, differences in built-up area densities did not show as regular a pattern as urban density and saturation. 2014 values for 1990 footprints and for expansion areas were not significantly different in cities that lost population and they were higher in Dzerzhinsk, the one city representing this category in the table. They were also higher in Ahvaz, Iran (133 persons per hectare in 2014 in its expansion area compared to 83 persons per hectare in its 1990 footprint in that year), in Singapore (232 vs. 144 persons per hectare), in Ndola (127 vs. 92 persons per hectare), and in Bogotá (262 vs. 252 persons per hectare). Still, despite these important outliers, built-up area density in the periphery of cities in the global sample of cities as a whole was 27 ± 3% lower in expansion areas—in line with the traditional theory of urban spatial structure—and that pattern persisted in all categories except in in the category of cities that lost population were the difference was not statistically significant due to the small number of cities in this category.
4.4. What Share of the Overall Increase in Population Density within 1990 Urban Footprints in Different Categories of Cities by 2014 Can Be Explained by the Saturation of Vacant Lands with Buildings and What Share by the Increase in Built-Up Area Densities?
Table 3 summarizes the changes in the three metrics within the 1990 footprint of cities during the 1990–2014 period in the sample as a whole and in the four discrete categories of cities. The average urban density within 1990 footprints for the sample as a whole increased from 98 to 117 persons per hectare, an annual increase of 0.8%; it decreased, of course, in the 56 cities where the 1990 footprint lost population. Interestingly, in the remaining 144 cities, it increased below the global average, at 0.6% per annum, in cities that densified only by saturating their 1990 footprint and above average, at 1.5% per annum, in cities that increased their built-up area density as well.
Saturation increased within 1990 footprints in all categories of cities, even those that lost population within these footprints during the 1990–2014 period. For the sample as a whole, it increased from 0.61 to 0.82, and, except in cities that lost population during this period, the increase in saturation in all other categories was not significantly different from that average. In two of the ten representative cities—Marrakesh and Shenzhen—saturation levels by 2014 were 0.90 and above, suggesting that there will be little or no room for further densification through saturation within the 1990 footprints of these cities in the coming years. If any further densification is to take place within these footprints, it will have to be through increasing built-up area densities within their 1990 footprints or through the further saturation of their 1990–2014 expansion areas.
Finally, the change in built-up area density in the different categories of cities presents a more complex picture. In the sample as a whole, built-up area density within the 1990 footprints of cities declined slightly, though significantly, at the rate of 0.5% per annum during the 1990–2014 period. The decline was more pronounced, 1.9% per annum, in cities that lost population within their 1990 footprints, and even steeper in the 50 cities that gained population overall but lost population within their 1990 footprints: 2.4% per annum. In the 72 cities that densified their 1990 footprint through saturation only, built-up area density declined at 0.8% per annum, while it increased at 1.1% per annum in the category of cities that increased their built-up area density. Indeed, when we look at four discrete categories of cities, that latter category is the only category where built-up area density within the 1990 footprints of cities increased. As a consequence, this is the only category of cities where the overall urban density in cities as a whole, summarized in Table 1 above, did not decline during the 1990–2014 period.
4.5. Summary of Findings
We can summarize this section by reviewing the responses to the four questions we posed in the previous paragraphs for the global of sample of cities as a whole:
- The average share of the population added to the 200 cities in the global sample during the 1990–2014 period that was accommodated within their 1990 urban footprints was 23 ± 3% versus 77 ± 3% that was added to their 1990–2014 expansion areas.
- As a result, the average urban density in cities as a whole declined at the rate of 1.4 ± 0.3% per annum during the 1990–2014 period.
- By 2014, the average urban density in the expansion areas of cities in the global sample was 59 ± 4% lower than urban density within their 1990 footprints; saturation was 44 ± 2% lower; and built-up area density was 27 ± 5% lower.
- Of the 144 cities in the global sample that increased urban density within their 1990 footprints, 72 cities increased it through an increase in saturation accompanied by a significant decline in built-up area density (at the rate of −0.8 ± 0.2% per annum), while 72 cities increased it through significant increases in both saturation and built-up area density. Overall, however, the densification of 1990 footprints failed to increase the average urban density of cities as a whole. The latter declined significantly in the first category, and it did not change significantly in the second category.
5. Discussion
5.1. Social Implications of the Study
The most important finding to emerge from this study was that the densification of existing urban footprints was not able to accommodate more than one-quarter of the population added to these cities between 1990 and 2014. Even in the one-third of the cities that experienced “hard densification” of their 1990 cores, less than half of the added population was added to their 1990 cores. In all classes of city, the population accommodated through the densification of the existing urban footprint was smaller than the share accommodated by new expansion areas on the periphery of cities.
The implication for planning practice is clear: with the absence of a major disruption to the pattern of urban development (and thus far not even a global pandemic and economic collapse has proven to be such a disruption), it behooves urban planners and policy makers to prepare adequately for both the densification and expansion of their cities, making room for the densification of existing urban footprints and making adequate room for their orderly expansion.
The stakes are high. When inadequate room is made available—either through densification or through expansion—then floor space supply bottlenecks will emerge. This is likely to reduce both productivity and housing affordability, rendering cities less productive and less affordable, and exacerbating inequality [39]. This has broad macroeconomic implications as well: the failure to make room within American cities, for example, is estimated to have lowered aggregate U.S. growth by 36% from 1964 to 2009 [40].
Advocates of the compact city have successfully advocated for limits on urban expansion, but until recently have done little to remove regulatory obstacles to the densification of existing urban footprints.
As a result, forced densification through the explicit containment of urban expansion—by greenbelts, as in Seoul, Korea or in English cities, by urban growth boundaries, as in Portland, Oregon, or by environmental restrictions as in California—has inevitably been associated with declines in housing affordability (for Seoul, see [41]; for English cities, see [42]; for Portland, see [43]; and for California, see [44]). In most places enforcing containment in one way or another, making room through urban expansion was restricted, while making room through densification was not correspondingly eased, creating floor space supply bottlenecks. When room for housing is in short supply, for example, it is likely to be captured by the better off, while requiring the rest to allocate too large a share of their incomes to house themselves or to resort to sub-standard housing arrangements of one kind or another. In short, to make adequate room for both housing and the productive needs of urban populations, something has to give. The more successful we are at making room through densification, the lower the pressure for making room through urban expansion.
In developing countries, regulatory barriers to densification may even have accelerated urban expansion—which is typically less constrained and less regulated—rendering cities less compact and thus less able to mitigate the effects of climate change [45]. At the same time, such barriers to densification make housing within the existing footprints of cities—in more desirable locations with better access to jobs, schools, markets, public services and amenities—less affordable, forcing both firms and people out and into locations beyond the urban periphery, where both commercial and residential land, while further away, is more affordable, but where transport costs, the time spent in travel—and hence greenhouse gas emissions as well—are higher [46].
The evidence from this paper provides initial guidance for cities seeking to set attainable densification goals. Ideally, this should be the first step in a comprehensive strategy for making room for their coordinated densification. One such comprehensive strategy, named the anatomy of density, is laid out along with an effective measurement program for monitoring its progress in two related papers [47,48]. Such a strategy must be accompanied by the careful monitoring of affordability and related metrics in order to ensure that densification goals do not compromise other social imperatives.
5.2. Responding to Opposing Claims on Changes in the Spatial Distribution of Population, and Density, in Cities
The findings in this paper challenge those of a recent OECD report that claimed the average population density of cities has increased over time and that half of the added population in cities over time occurred within original city boundaries [30]. Further examination of the report’s claims pointed to differences in the definition of the city area, measurement approaches, input data, and timescales as probable explanations for why our two analyses arrived at different conclusions.
The OECD’s analysis is based on the Global Human Settlements Layer (GHSL) a data platform produced by the European Commission’s Joint Research Center, in conjunction with its Directorate General for Regional and Urban Policy [49]. Its underlying data layers include global grids of built-up area and population, corresponding to four cross-sectional time points, or epochs: 1975, 1990, 2000, and 2015. For a given epoch, GHSL characterizes human settlements by applying a methodology named the degree of urbanization (DEGURBA) that combines information from the built-up and population layers. Using rules based on population density, contiguity, and population size, DEGURBA assigns cells to different settlement categories [50]. For example, if a cell has population density of at least 1500 persons per km2 (over the entire cell) or is at least 50 percent built-up, and if it is contiguous to other such cells where the combined population of cells is at least 50,000 inhabitants, then this cell is an “urban center” cell and it belongs to a set of cells named an urban center entity, synonymous with a city. Applying these rules to the entire world, the GHSL team produced a 2015 Urban Centre Database (UCDB), a tabular file of 13,135 urban center entities with associated metrics, as well as an urban center polygon file [51].
Urban center entities, calculated in 1975 and 2015, underlie the OECD’s claims. It would be unreasonable to inspect each observation in the UCDB for completeness, but it is possible to conduct a quality control check by observing population densities in urban center entities. For this check we focused on built-up area density, because it controls for the different approaches to open space and water taken by the DEGURBA methodology and our analysis, when they determine city boundaries. We know that population density varies substantially across regions and income categories, but we also know there are upper limits that urban population density rarely exceeds. In our own work, the highest built-up density we encountered was 552 persons per hectare in Dhaka, Bangladesh in 2015 (this is around 18 square meters of built-up area per person, a density that is very high when considering that this includes streets, roads, parking lots, and government, commercial and industrial buildings as well as private residences). It is not unlikely that observations in the UCDB would contain higher densities than the highest values we observed in our own sample, but it is concerning that more than one third of the UCDB falls into this category. Even if we raise Dhaka’s density by 50%, to 828 persons per hectare, we find that that 30% of all observations in the UCDB exceed this value in 2015.
The GHSL framework apportions the populations of census polygons to grid cells in proportion to the built-up area in those grid cells [52]. Provided there is a low built-up threshold for apportionment—a cell needs to be only three percent built-up in order to receive a population [53] (p. 19)—we can begin to explain why built-up area densities in 1 km2 urban center cells, or average built-up area density for urban center entities, may be extremely high. In short, population takes precedence over built-up area in the GHSL workflow with respect to the identification of urban center cells, and by extension, urban center entities.
Our own experiences documenting spatial and population changes in cities make us particularly concerned for the accuracy of historical data in the OECD report. While there are established methods for assessing the accuracy of remotely sensed land cover, there is no analogous practice for the population apportioned to individual cells, when the cell size is smaller than the input polygons. We already have concerns about the accuracy of GHSL built up areas, given the share of urban center entities with unusually high built-up area densities. We have even greater concern for the inherent reliability issues with spatially referenced population data for the entire world for the 1975 epoch. Sporadic census data in many countries, varying population zone sizes over time, georeferencing errors of paper maps, and interpolation or extrapolation of population counts over long periods of time may all affect the reliability of population apportionment in significant ways.
In summary, there are several explanations that can help us understand why our findings contradict those published in a recent OECD report. First, the analyses rely on different timescales: our study period extends backward to 1990, the OECD to 1975. This introduces both comparability and data quality concerns. Second, the analyses focus on different underlying populations: our study uses sampling theory to estimate average values for all cities with populations over 100,000 while the OECD report attempts to measure all cities with populations over 50,000. This more than doubles the number of cities in the OECD report. Third, our definition of cities places greater emphasis on built-up area contiguity while the degree of urbanization places greater emphasis on the populations of 1 km cells and a population threshold of 1500 persons per square kilometer. This resulted in different spatial definitions of cities. Fourth, our sample-based study allowed us to assemble and verify city data on a case-by-case basis, allowing us to address errors and improve data whenever possible. Due to the global nature and size the GHSL dataset, this type of review was not possible in the OECD analysis. While this brief review of data and methods does not settle our dispute with the OECD findings in a definitive manner, we hope it draws attention to the analytical considerations that are required to render judgement on questions about global changes in density and the spatial distribution of population over time.
5.3. Limitations of the Study
Our study, although breaking new ground and addressing new questions that have clear and serious policy implications, was limited in a number of ways.
First, while the analytical framework of our study was relatively straightforward, we acknowledge uncertainty in the underlying data on which we base our calculations. An accuracy assessment of our Landsat classifications for the circa 2014 time period was positive and revealed virtually identical average overall accuracy when compared to the GHSL circa 2014 built-up dataset, using the same reference data [54]. Classification accuracies were not perfect, however, and we observed variation in overall, built-up, and open space accuracy across cities. This may have downstream effects on the calculation of cities’ urban extent. In theory, this may bias the delineation of the 1990 and 2014 urban extent boundaries, which may in turn bias calculations based on these areas. It was not possible to assess circa 1990 classification accuracy for the global sample of cities owing to a lack of contemporaneous reference data. Uncertainty in the gridded population data may also affect the calculation of shares of added population attributed to core and expansion areas. Uncertainty arises when the spatial resolution of input population data is greater than the destination grid cell resolution. Unfortunately, we know relatively little about the accuracy of gridded population data. Beyond variation in input population zone sizes, the quality of the covariates used to model and distribute population to grid cells (including built-up area), will affect the quality of cell population estimates at a given point in time. We strongly doubt that uncertainty in the land cover data or population data would be large enough to alter the average finding for the 200-city sample. Nevertheless, we recognize that the findings for individual cities require careful interpretation.
Second, we have chosen a specific time frame—a 24-year period beginning circa 1990 and ending circa 2014—for analyzing the data and drawing our conclusions. This 24-year period roughly corresponds to the period during which the compact city paradigm has become the governing paradigm for planning cities the world over. It is also a reasonable time frame for the long-term planning of cities. Still, choosing a time period with a specific length raises the question of whether the length of the study period affects the results. Clearly, if the time period was exceptionally long, say over 100 years, we can clearly expect most, if not all, of the added population of a city to be accommodated in its expansion areas. In the year 1800, Paris, France, had an area of 11.7 km2 and a population of 581,000 [55]. In 2014, that area accommodated 294,000—losing half its population—while the city expanded to an area of 2778 km2 and its population grew to 11.1 million (calculated using [55] and [22]). By 2014, the expansion area of Paris during the 214 years since 1800 accommodated 100 percent of its added population. This is not surprising. The interesting question is whether a shorter time period than 24 years will affect the shares of the added population accommodating by existing footprints versus expansion areas. We remind the reader that the share of the added population during the 1990–2014 period accommodated in the expansion areas of cities in the global sample averaged 77 ± 3%. Using similar data, for the 1990–2000 and the 2000–2014 period, we found that share to be 76 ± 4% for the 10-year period 1990–2000 and 63 ± 4% for the 14-year period 2000–2014. We cannot therefore ascertain with any degree of confidence that our results would differ substantially if we focused on a shorter time period, say 10 years.
Third, our study falls short of explaining the variation in these shares among cities, even among cities in the global sample. What accounts for the decline in city populations or for the decline in the populations of their 1990 footprints? Or, more generally, what accounts for the variations in the population growth rate within the 1990 footprints of cities? In cities that experienced an increase, not a decline, in the population within their 1990 footprints, we can ask what accounts for the share of the added population that was accommodated within their 1990 footprints? Unfortunately, there is no established theory that can provide the expected answers to these questions. We need to use common sense to generate some speculative hypotheses that can then be tested with the limited data we have for the global sample of 200 cities. We have left our preliminary investigations of these questions for further study.
Finally, we noted that most cities in the global sample of cities adopted the compact city paradigm in their plans. Yet, as we have shown, they have generally failed to densify meaningfully during the study period. Why? Unfortunately, the information necessary to answer this question is not yet available, and we are unable to shed light on it. There is no doubt, however, that this is an important question that merits serious study.
6. Conclusions: The Making Room Paradigm
The limited success of cities around the world in accommodating population growth through densification makes it clear that this will not be easy or simple to do. The existing fabric of cities resists radical change. That is why those making room for urban growth—whether the demand for more room is powered by population pressure or by economic pressure—find it easier to do so in vacant lands on the urban periphery rather than within the existing fabric of cities, where regulations are typically stricter, where land is more costly, where infrastructure may already be stressed, and where neighbors are better organized and better able to resist change. That said, we must also acknowledge that overcoming resistance to the radical change involved in densification is not impossible, but it requires strong organization and strong political will. Recent successes in Minneapolis [56,57] and in Oregon [58] demonstrate that this is not impossible, but repeated failures in California show that it is by no means certain [59,60].
Regardless of the prospects for densification, the data clearly show that cities also must make room for their orderly expansion. As we proposed at the outset, making room for densification and making room for expansion work hand in hand. They are at the core of the making room paradigm, a paradigm that must accompany the compact city paradigm if it is to perform better in meeting its expectations. When inadequate room is provided for densification—especially in the rapidly growing cities in less-developed countries—then only making room through orderly urban expansion can keep cities productive, affordable—and hence more inclusive—and sustainable, all of which are important public objectives. Alternatively, when not enough room can be provided through urban expansion—say, because of topographical constraints, then actively making room through orderly densification can make up for it, keeping cities productive, inclusive, and sustainable. The issue is one of balance rather than one of binary choice. It is worth contemplating the fact that only five cities out of 200 in this study accommodated more than 70 percent of their added populations within their 1990 footprints: Auckland, New Zealand (76%), Belo Horizonte, Brazil (75%), Bogotá, Colombia (74%), Pokhara, Nepal (74%), and Baghdad (72%). Yes, densification may be preferable, but perfect densification—one that completely puts an end to the need for expansion—may not be attainable. We know of no contemporary city where that has even been approximated (even Singapore, an island city state, relies on land reclamation to accommodate a portion of its growth).
The new making room paradigm, accounting for both densification and orderly urban expansion, commits the public sector to preparing the ground for the production and consumption decisions of households and firms, acting through both formal and informal land and housing markets. These actors must be able to build enough floor space for cities to thrive, keeping commercial and residential land affordable and greenhouse gas emissions at bay.
Making room for densification requires the public sector to create a level playing field for firms and households, removing the built-in difficulties in recycling land and structures in built-up areas, adjusting regulations, removing fiscal and financial incentives that discourage densification, and upgrading infrastructure, so as to allow for adequate and more than adequate increases in floor space within the existing footprints of cities.
Making room for orderly urban expansion—a subject on which the authors have already elaborated in numerous publications (see, for example, [28,54,61])—requires the public sector to take minimal actions to prepare the rural periphery of growing cities for urban development by taking four actions: (1) estimating the amount of land required for development during the next three decades and identifying potential expansion areas; (2) protecting areas of environmental risk as well as a hierarchy of public open spaces from development; (3) laying out and securing the rights-of-way for a future arterial infrastructure grid that can carry public transport throughout the projected expansion area; and (4) fostering the proper subdivision of lands—to rectangular or near-rectangular plots, where possible—by all suppliers of commercial and residential lands, with special attention given to informal housing developers, so as to prevent rural lands converted to residential use from becoming and remaining “slums”, and facilitating their transformation into regular residential neighborhoods. These four basic actions are the foundation of a comprehensive strategy for making room for urban expansion.
Making room through orderly urban expansion requires the public sector to actively engage with development on the urban periphery, but such engagement is unlikely to take place as long as advocates for the compact city paradigm keep pressing for containment, choosing to look away from disorderly urban expansion—as though waiting for it to magically disappear—instead of seeking to manage urban expansion properly.
In decades past, the pursuit of compactness has led city leaders to largely neglect both aspects of the making room paradigm. The focus on containment typically neglected direct cities to make adequate room for their densification, leaving them no choice but to expand [35]. Worse yet, the disengagement of those favoring containment from the expansion agenda—by refusing to lend a hand to planning them properly—typically resulted in disorderly expansion: the invasion of areas of high environmental risk that should have been kept free of development; contiguous urban development with the absence of a hierarchy of public open spaces; a dearth of arterial roads in expansion areas that can carry public transport and link people to jobs; inadequate land devoted to streets and civic buildings; city blocks that were too large to facilitate walking; and subdivisions that were improperly laid out and difficult to service, making it difficult to transform them into regular urban neighborhoods [62].
The data presented in this paper highlight the fallacy of that approach, provides some initial explanations of why and how densification occurs, presents strategies for how to manage urban growth, and offers a new tool, the making room paradigm, to put the efforts of urban planners and city leaders on a more empirical, sustainable, inclusive, and reality-based footing—one that seeks to welcome all future and current urban residents and to empower city governments to lead the way in shaping their future cities.
Author Contributions
Conceptualization, S.A.; methodology, S.A. and P.L.-H.; formal analysis, P.L.-H.; S.K.; S.S.; writing—original draft preparation, S.A., P.L.-H.; A.B.; writing—review and editing, P.L.-H.; A.B.; visualization, P.L.-H.; A.B. All authors have read and agreed to the published version of the manuscript.
Funding
This research received no external funding.
Institutional Review Board Statement
Not applicable.
Informed Consent Statement
Not applicable.
Data Availability Statement
Publicly available datasets were analyzed in this study. This data can be found here: [http://www.atlasofurbanexpansion.org and http://www.worldpop.org (accessed on 26 March 2021)].
Conflicts of Interest
The authors declare no conflict of interest.
References
- United Nations, Department of Economic and Social Affairs, Population Division. World Urbanization Prospects: The 2018 Revision, Online Edition; UN: New York, NY, USA, 2018; Available online: https://population.un.org/wup/Download/ (accessed on 1 November 2020).
- Bolt, J.; Inklaar, R.; de Jong, H.; van Zanden, J.L. Rebasing ‘Maddison’: New Income Comparisons and the Shape of Long-Run Economic Development; Maddison Project Working Paper 10; Groningen Growth and Development Center: Groningen, The Netherlands, 2018. [Google Scholar]
- Alonso, W. Location and Land Use: Toward a General Theory of Land Rent; Harvard University Press: Cambridge, MA, USA, 1964. [Google Scholar]
- Mills, E. An Aggregative Model of Resource Allocation in a Metropolitan Area. Am. Econ. Rev. 1967, 57, 197–210. [Google Scholar]
- Muth, R.F. Cities and Housing: The Spatial Pattern of Urban Residential Land Use; University of Chicago Press: Chicago, IL, USA, 1969. [Google Scholar]
- Burton, E. The Compact City and Social Justice. In Housing, Environment and Sustainability; University of York: York, UK, 2001; Available online: http://www.china-up.com:8080/international/special/pdf/8.pdf (accessed on 12 February 2021).
- OECD. Rethinking Urban Sprawl: Moving Towards Sustainable Cities, Policy Highlights; OECD Publishing: Paris, France, 2018. [Google Scholar]
- Brucekner, J.K. Urban Sprawl: Lessons from Urban Economics. Brook. Whart. Pap. Urban Aff. 2001, 65–97. [Google Scholar] [CrossRef]
- Nechyba, T.J.; Walsh, R.P. Urban Sprawl. J. Econ. Perspect. 2004, 18, 177–200. [Google Scholar] [CrossRef] [Green Version]
- Litman, T. Analysis of Public Policies That Unintentionally Encourage and Subsidize Urban Sprawl; New Climate Economy: Washington, DC, USA, 2015. [Google Scholar]
- Ewing, R.; Kostyack, D.; Stein, B.; Ernst, M. Endangered by Sprawl: How Runaway Development Threatens America’s Wildlife; National Wildlife Federation, Smart Growth America, and NatureServe: Washington, DC, USA, 2005. [Google Scholar]
- Seto, K.C.; Güneralp, B.; Hutyra, L.R. Global forecasts of urban expansion to 2030 and direct impacts on biodiversity and carbon pools. Proc. Natl. Acad. Sci. USA 2012, 109, 16083–16088. [Google Scholar] [CrossRef] [Green Version]
- Johnson, E.B.; Klemens, M.W. The Impacts of Sprawl on Biodiversity. In Nature in Fragments: The Legacy of Sprawl; Johnson, E.B., Klemens, M.W., Eds.; Columbia Unviersity Press: New York, NY, USA, 2005; pp. 18–53. [Google Scholar]
- d’Amour, C.B.; Reitsma, F.; Baiocchi, G.; Barthel, S.; Güneralp, B.; Erb, K.H.; Haberl, H.; Creutzig, F.; Seto, K.C. Future urban land expansion and implications for global croplands. Proc. Natl. Acad. Sci. USA 2017, 114, 8939–8944. [Google Scholar] [CrossRef] [PubMed] [Green Version]
- Brueckner, J.K. Urban Sprawl: Diagnosis and Remedies. Int. Reg. Sci. Rev. 2000, 23, 160–171. [Google Scholar] [CrossRef]
- Carruthers, J.I.; Ulfarsson, G.F. Urban Sprawl and the Cost of Public Services. Environ. Plan. B Plan. Des. 2003, 30, 503–522. [Google Scholar] [CrossRef]
- Cervero, R.; Murakami, J. Effects of built environments on vehicle miles traveled: Evidence from 370 US urbanized areas. Environ. Plan. A Econ. Space 2010, 42, 400–418. [Google Scholar] [CrossRef]
- Lee, S.; Lee, B. The influence of urban form on GHG emissions in the U.S. household sector. Energy Policy 2014, 68, 534–549. [Google Scholar] [CrossRef]
- Taylor, B.D.; Miller, D.; Iseki, H.; Fink, C. Nature and/or nurture? Analyzing the determinants of transit ridership across US urbanized areas. Transp. Res. Part A Policy Pract. 2009, 43, 60–77. [Google Scholar] [CrossRef] [Green Version]
- Forsyth, A.; Oakes, J.M.; Schmitz, K.H.; Hearst, M. Does residential density increase walking and other physical activity? Urban Stud. 2007, 44, 679–697. [Google Scholar] [CrossRef]
- New York University. The Land and Housing Survey in a Global Sample of Cities; NYU Urban Expansion Program; New York University: New York, NY, USA, 2016; unpublished. [Google Scholar]
- WorldPop. School of Geography and Environmental Science, University of Southampton. Available online: www.worldpop.org (accessed on 1 September 2020).
- Schiavina, M.; Freire, S.; MacManus, K. GHS Population Grid Multitemporal (1975, 1990, 2000, 2015) R2019A; European Commission, Joint Research Centre (JRC): Ispra, Italy, 2019; Available online: http://data.europa.eu/89h/0c6b9751-a71f-4062-830b-43c9f432370f (accessed on 1 February 2021). [CrossRef]
- Center for International Earth Science Information Network—CIESIN—Columbia University. Gridded Population of the World, Version 4 (GPWv4): Basic Demographic Characteristics, Revision 11. 2018; NASA Socioeconomic Data and Applications Center (SEDAC): Palisades, NY, USA, 2018. [CrossRef]
- Rose, A.N.; McKee, J.J.; Sims, K.M.; Bright, E.A.; Reith, A.E.; Urban, M.L. LandScan 2019; Oak Ridge National Laboratory: Oak Ridge, TN, USA, 2020. Available online: https://landscan.ornl.gov (accessed on 1 February 2021).
- Angel, S.; Sheppard, S.C.; Civco, D.L. The Dynamics of Global Urban Expansion; Transport and Urban Development Department, World Bank: Washington, DC, USA, 2005. [Google Scholar]
- Schneider, A.; Woodcock, C.E. Compact, Dispersed, Fragmented, Extensive? A Comparison of Urban Expansion in Twen-ty-Five Global Cities Using Remotely Sensed Data, Pattern Metrics, and Census Information. Urban Stud. 2008, 45, 659–692. [Google Scholar] [CrossRef]
- Angel, S.; Parent, J.; Civco, D.L.; Blei, A.; Potere, D. The dimensions of global urban expansion: Estimates and projections for all countries, 2000–2050. Prog. Plan. 2011, 75, 53–107. [Google Scholar] [CrossRef]
- Schneider, A.; Mertes, C.M.; Tatem, A.J.; Tan, B.; Sulla-Menashe, D.; Graves, S.J.; Patel, N.N.; Horton, J.A.; Rollo, J.T.; Schelly, I.H.; et al. A New Urban Landscape in East-Southeast Asia. Environ. Res. Lett. 2015, 10, 034002. [Google Scholar] [CrossRef]
- OECD/European Commission. Cities in the World: A New Perspective on Urbanisation; OECD Publishing: Paris, France, 2020. [Google Scholar] [CrossRef]
- Whitehand, J.W.R. The Changing Face of Cities: A Study of Development Cycles and Urban Form; Blackwell: Oxford, UK, 1987. [Google Scholar]
- Wu, Q.; Cheng, J. A temporally cyclic growth model of urban spatial morphology in China: Evidence from Kunming Metropolis. Urban Stud. 2019, 56, 1533–1553. [Google Scholar] [CrossRef]
- Nyström, J. The Cyclical Urbanization Model: A Critical Analysis. Geogr. Ann. Ser. B Hum. Geogr. 1992, 74, 133–144. [Google Scholar] [CrossRef]
- Angel, S.; Blei, A.M.; Lamson-Hall, P.; Galarza-Sanchez, N.; Parent, J.; Civco, D.L. Atlas of Urban Expansion—2016 Edition; Lincoln Institute of Land Policy: Cambridge, MA, USA, 2016. [Google Scholar]
- Blei, A.M.; Angel, S.; Civco, D.L.; Galarza, N.; Kallergis, A.; Lamson-Hall, P.; Liu, Y.; Parent, J. Urban Expansion in a Global Sample of Cities, 1990–2014; Lincoln Institute Working Paper WP18AB2; Lincoln Institute of Land Policy: Cambridge, MA, USA, 2018. [Google Scholar]
- Blei, A.M.; Angel, S. Global Monitoring with the Atlas of Urban Expansion. In Urban Remote Sensing: Monitoring, Synthesis and Modeling in the Urban Environment, 2nd ed.; Yang, X., Ed.; Wiley: Hoboken, NJ, USA, 2021; in press. [Google Scholar]
- Lloyd, C.T.; Chamberlain, H.; Kerr, D.; Yetman, G.; Pistolesi, L.; Stevens, F.R.; Gaughan, A.E.; Nieves, J.J.; Hornby, G.; MacManus, K.; et al. Global spatio-temporally harmonized datasets for producing high-resolution gridded population distribution datasets. Big Earth Data 2019, 3, 108–139. [Google Scholar] [CrossRef] [PubMed] [Green Version]
- Clark, C. Urban population densities. J. R. Geogr. Soc. 1951, 114, 490–496. [Google Scholar] [CrossRef]
- Glaeser, E.L.; Gyourko, J.; Saks, R.E. Urban growth and housing supply. J. Econ. Geogr. 2006, 6, 71–89. [Google Scholar] [CrossRef] [Green Version]
- Hsieh, C.T.; Moretti, E. Housing constraints and spatial misallocation. Am. Econ. J. Macroecon. 2019, 11, 1–39. [Google Scholar] [CrossRef] [Green Version]
- Dawkins, C.J.; Nelson, A.C. Urban containment policies and housing prices: An international comparison with implications for future research. Land Use Policy 2002, 19, 1–12. [Google Scholar] [CrossRef]
- Hall, P. The Containment of Urban England. Geogr. J. 1974, 140, 386–408. [Google Scholar] [CrossRef] [Green Version]
- Downs, A. Have housing prices risen faster in Portland than elsewhere? Hous. Policy Debate 2002, 13, 7–31. [Google Scholar] [CrossRef]
- Quigley, J.M.; Raphael, S. Regulation and the high cost of housing in California. Am. Econ. Rev. 2005, 95, 323–328. [Google Scholar] [CrossRef] [Green Version]
- Gandhi, S. Economics of affordable housing in Indian cities: The case of Mumbai. Environ. Urban. Asia 2012, 3, 221–235. [Google Scholar] [CrossRef]
- Glaeser, E.L.; Kahn, M.; Rappaport, J. Why do the Poor Live in Cities? The Role of Transportation. J. Urban Econ. 2008, 63, 1–24. [Google Scholar] [CrossRef]
- Angel, S.; Lamson-Hall, P.; Shingade, S.; Kumar, S.; Gonzales-Blanco, Z. The anatomy of density: The measurable factors that constitute urban density. Build. Cities 2021, 2, 264–282. [Google Scholar] [CrossRef]
- Angel, S.; Lamson-Hall, P. Anatomy of Density II: A Comprehensive Strategy for Making Room for City Densification; New York University Marron Institute of Urban Management: New York, NY, USA, 2020; Available online: https://ssrn.com/abstract=3744466 (accessed on 13 March 2021). [CrossRef]
- Global Human Settlements Layer. Available online: https://ghsl.jrc.ec.europa.eu/ (accessed on 1 February 2021).
- Dijkstra, L.; Poleman, H. A Harmonized Definition of Cities and Rural Areas: The New Degree of Urbanization; Working Paper WP 01/2014; Regional and Urban Policy, European Commission: Brussels, Belgium, 2014. [Google Scholar]
- Pesaresi, M.; Florczyk, A.; Schiavina, M.; Melchiorri, M.; Maffenini, L. GHS Settlement Grid, Updated and Refined REGIO Model 2014 in Application to GHS-BUILT R2018A and GHS-POP R2019A, Multitemporal (1975-1990-2000-2015), R2019A; European Commission, Joint Research Centre (JRC): Ispra, Italy, 2019; Available online: http://data.europa.eu/89h/42e8be89-54ff-464e-be7b-bf9e64da5218 (accessed on 1 October 2020). [CrossRef]
- Freire, S.; MacManus, K.; Pesaresi, M.; Doxsey-Whitfield, E.; Mills, J. Development of new open and free multi-temporal global population grids at 250 m resolution. In Proceedings of the 19th AGILE International Conference on Geographic Information Science, Helsinki, Finland, 14–17 June 2016; Sarjakoski, T., Santos, M.Y., Sarjakoski, L.T., Eds.; 2016. [Google Scholar]
- Florczyk, A.J.; Corbane, C.; Ehrlich, D.; Freire, S.; Kemper, T.; Maffenini, L.; Melchiorri, M.; Pesaresi, M.; Politis, P.; Schiavina, M.; et al. GHSL Data Package 2019; Publications Office of the European Union: Luxembourg, 2019. [Google Scholar] [CrossRef]
- Blei, A.M.; Angel, S.; Civco, D.L.; Liu, Y.; Zhang, X. Accuracy Assessment and Map Comparisons for Monitoring Urban Expansion: The Atlas of Urban Expansion and the Global Human Settlements Layer; Working Paper WP18AB1; Lincoln Institute of Land Policy: Cambridge, MA, USA, 2018; pp. 1–41. [Google Scholar]
- Angel, S.; Civco, D.L.; Parent, J.; Blei, A.M. Atlas of Urban Expansion; Lincoln Institute of Land Policy: Cambridge, MA, USA, 2012. [Google Scholar]
- City of Minneapolis. Minneapolis 2040 Comprehensive Plan. Available online: https://minneapolis2040.com/ (accessed on 12 February 2021).
- Nesterak, M. Taller, Greener, More Equitable: Minneapolis Releases First Draft of Its 20-Year Vision. MPRNews. 22 March 2018. Available online: https://www.mprnews.org/story/2018/03/22/minneapolis-releases-first-draft-of-20-year-city-plan. (accessed on 12 February 2021).
- Radnovich, C.; Woodworth, W. Oregon Legislature Finally Adjourns But Not without Political Fireworks. Salem Statesman Journal. 30 June 2019. Available online: https://www.statesmanjournal.com/story/news/2019/06/30/oregon-legislature-near-adjournment-amid-republican-walkout-cap-and-trade-brian-boquist/1611534001/ (accessed on 12 February 2021).
- Wiener, S. Senate Bill 10 Planning and Zoning: Housing Development: Density; California Legislature: Sacramento, CA, USA, 2020. [Google Scholar]
- Wiener, S. Senate Bill 50 Planning and Zoning: Housing Development: Streamlined Approval: Incentives; California Legislature: Sacramento, CA, USA, 2018. [Google Scholar]
- Angel, S.; Parent, J.; Civco, D.L.; Blei, A.M. Making Room for a Planet of Cities; Policy Focus Report; Lincoln Institute of Land Policy: Cambridge, MA, USA, 2011. [Google Scholar]
- Lamson-Hall, P.; Angel, S.; Degroot, D.; Tafesse, T.; Martin, R. A New Plan for African Cities: The Ethiopia Urban Expansion Initiative. Urban Stud. 2019, 56, 1234–1249. [Google Scholar] [CrossRef] [Green Version]
Figure 1.
The stratified global sample of 200 cities selected from the universe of cities.

Figure 2.
The classification of circa 1990 Landsat imagery of Addis Ababa, Ethiopia, into built-up (gray), open (light brown) and water pixels (blue), top left; the determination of its circa 1990 urban clusters showing the built-up area (dark red) and the urbanized open space (light green) within it, top right; identifying its “urban extent” circa 1990 using an inclusion rule, bottom left; and superimposing its urban extents for circa 1990 and circa 2014 on each other, bottom right.

Figure 3.
Superimposing a WorldPop population grid on a three-zone map of Addis Ababa, Ethiopia, to estimate population within each zone circa 1990 and 2014.
Figure 3.
Superimposing a WorldPop population grid on a three-zone map of Addis Ababa, Ethiopia, to estimate population within each zone circa 1990 and 2014.

Figure 4.
Urban density in the 1990 footprint of Hyderabad, India, in 1990 (180 people per hectare) represented as the area of the grey rectangle, where its X-axis value equals the zone’s saturation (~0.6) and its Y-axis value equals the zone’s built-up area density (310 p/ha). The thick-outline rectangle represents its urban density in 2014 (200 people per hectare), when in built-up area density declined to 220 p/ha while its saturation increased to 0.9.

Figure 5.
The classification of the 200 cities in the global sample into discrete categories pertaining to the densification of their 1990 urban footprint.
Figure 5.
The classification of the 200 cities in the global sample into discrete categories pertaining to the densification of their 1990 urban footprint.

Figure 6.
Map showing the geographic distribution of cities in the four exclusive categories identified in Figure 6, Figure 7, Figure 8 and Figure 9: cities that lost population (white), 50 cities with population gain that lost population within their 1990 footprint (yellow), 72 cities with “saturation only” densification of their 1990 footprint (red), and 72 cities with “hard densification” of their 1990 footprint (orange).

Figure 7.
Average urban density within the 1990 footprint of Dzerzhinsk, Russian Federation, declined from 39 persons per hectare in 1990 (black outline) to 29 p/ha 2014 (purple). The lower average urban density of 13 p/ha in its expansion area (red) in 2014 reduced the overall urban density in the city to 27 p/ha by that year.

Figure 8.
Average urban density within the 1990 footprint of Berlin, Germany, declined from 72 persons per hectare in 1990 (black outline) to 55 p/ha 2014 (purple). The lower average urban density of 22 p/ha in its expansion area (red) in 2014 reduced the overall urban density in the city to 35 p/ha by that year.

Figure 9.
Average urban density within the 1990 footprint of Hyderabad, India, increased from 180 persons per hectare in 1990 (yellow) to 200 p/ha 2014 (purple). The lower average urban density of 64 p/ha in its expansion area (red) in 2014 decreased the overall urban density in the city to 104 p/ha by that year.

Figure 10.
Average urban density within the 1990 footprint of Marrakesh, Morocco, increased from 72 persons per hectare in 1990 (yellow) to 122 p/ha 2014 (puruple). The lower average urban density of 15 p/ha in its expansion area (red) in 2014 decreased the overall urban density in the city to 54 p/ha by that year.


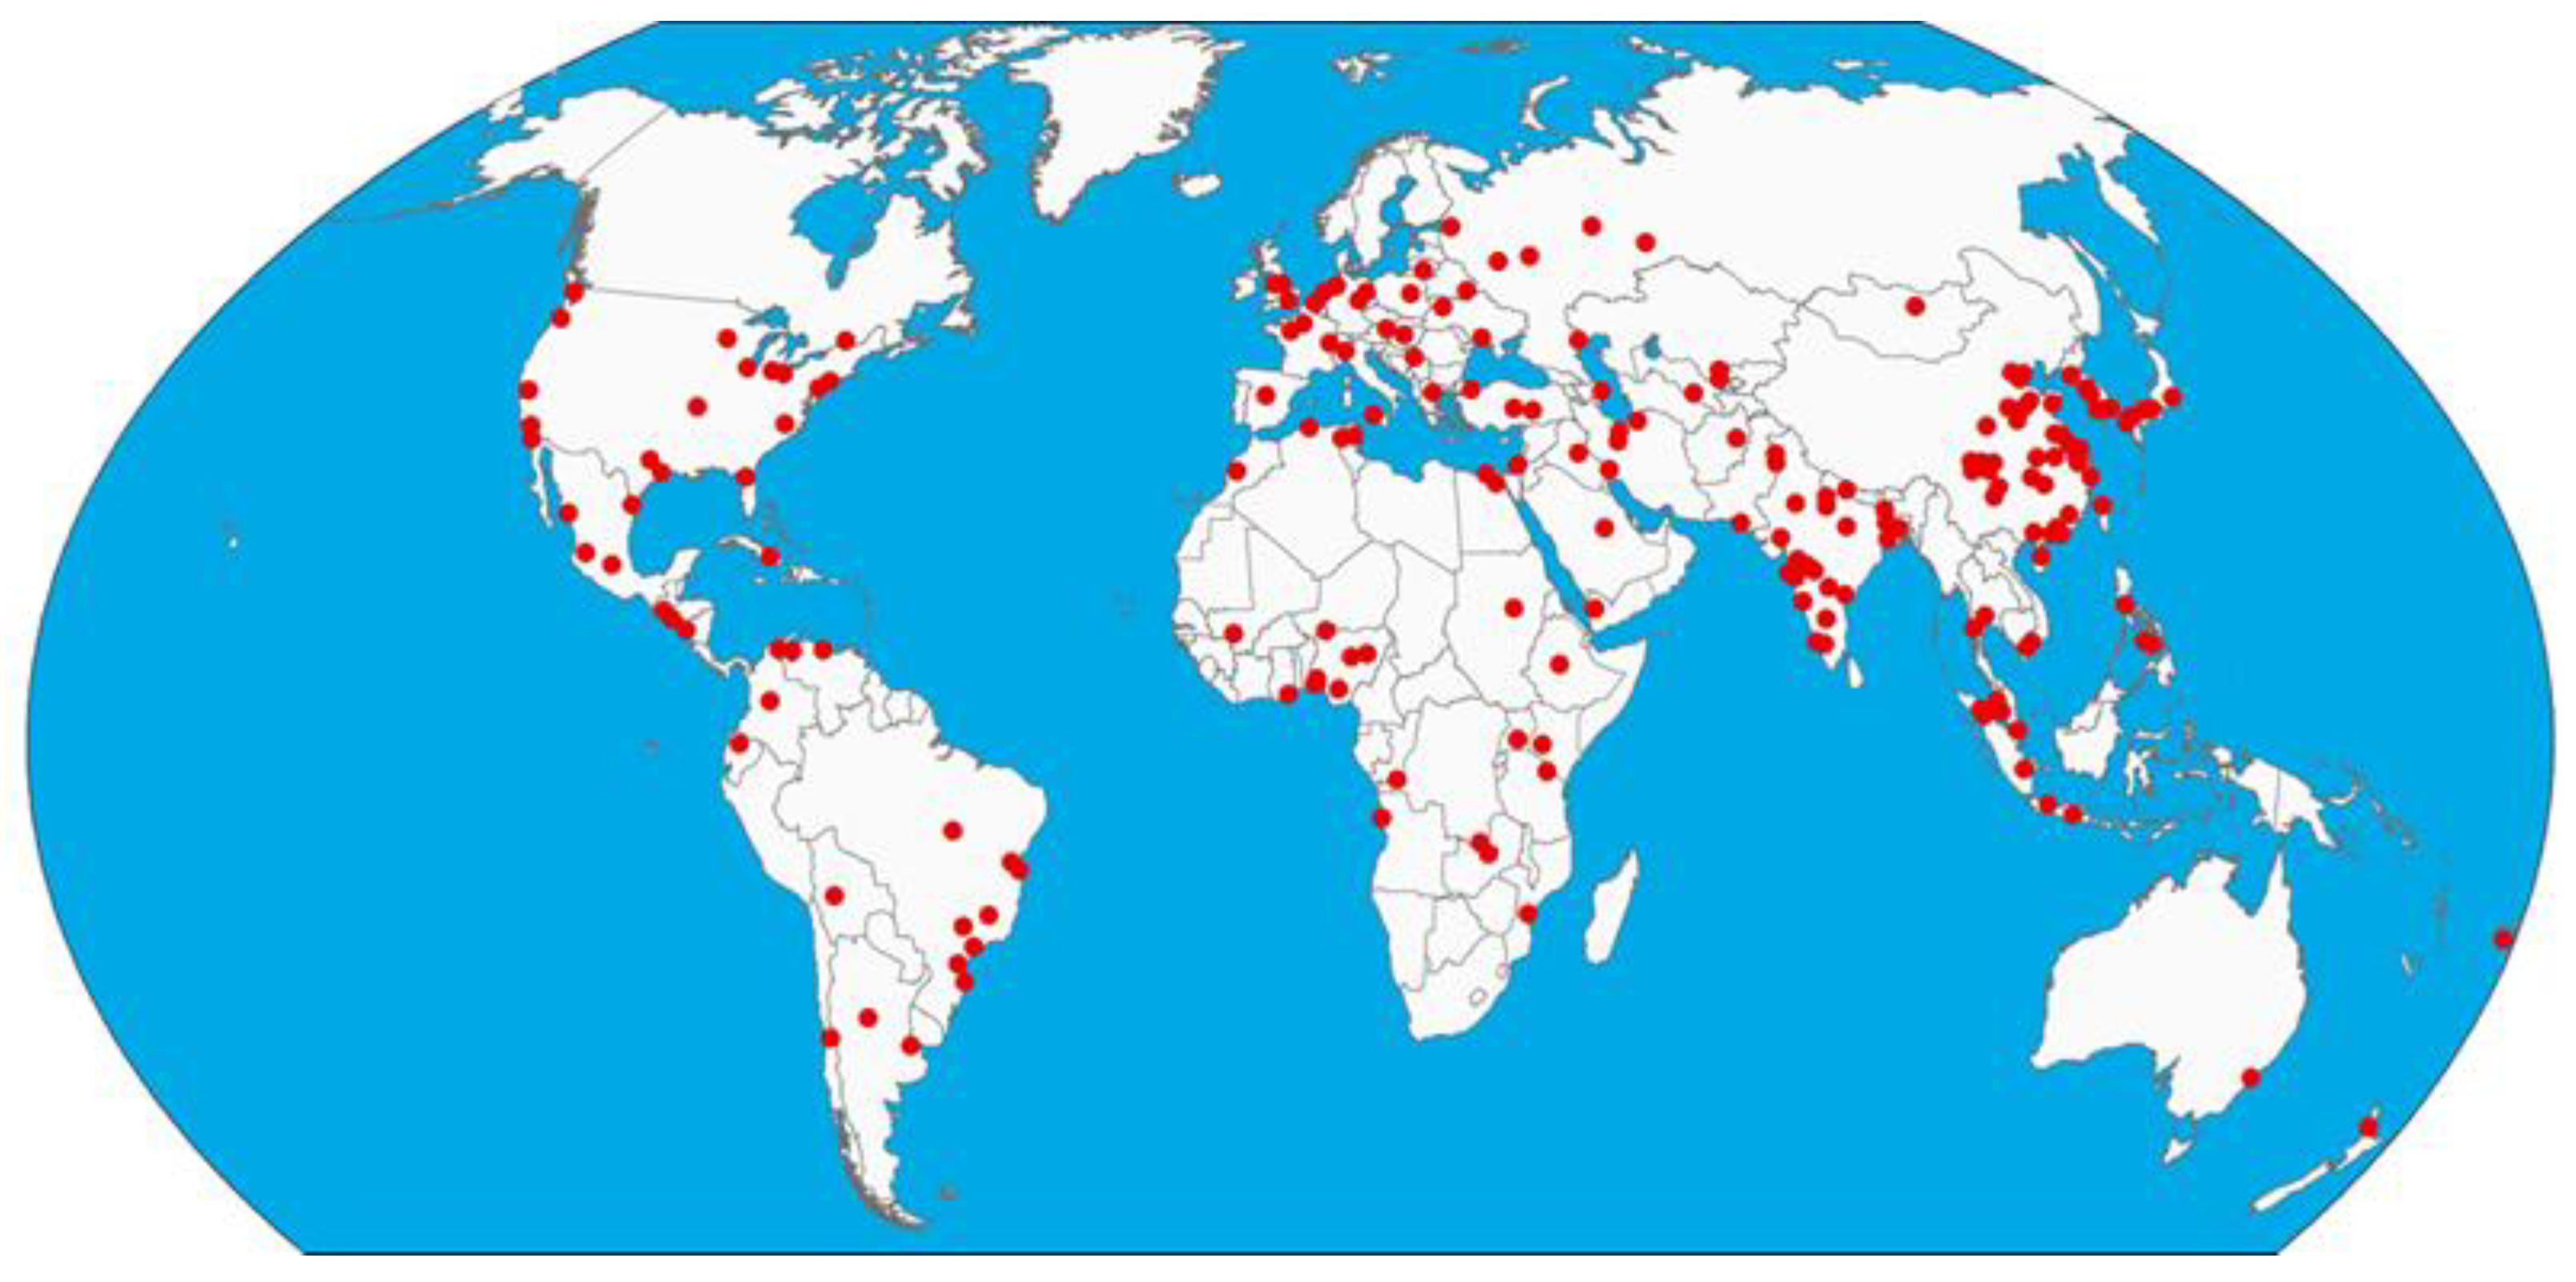
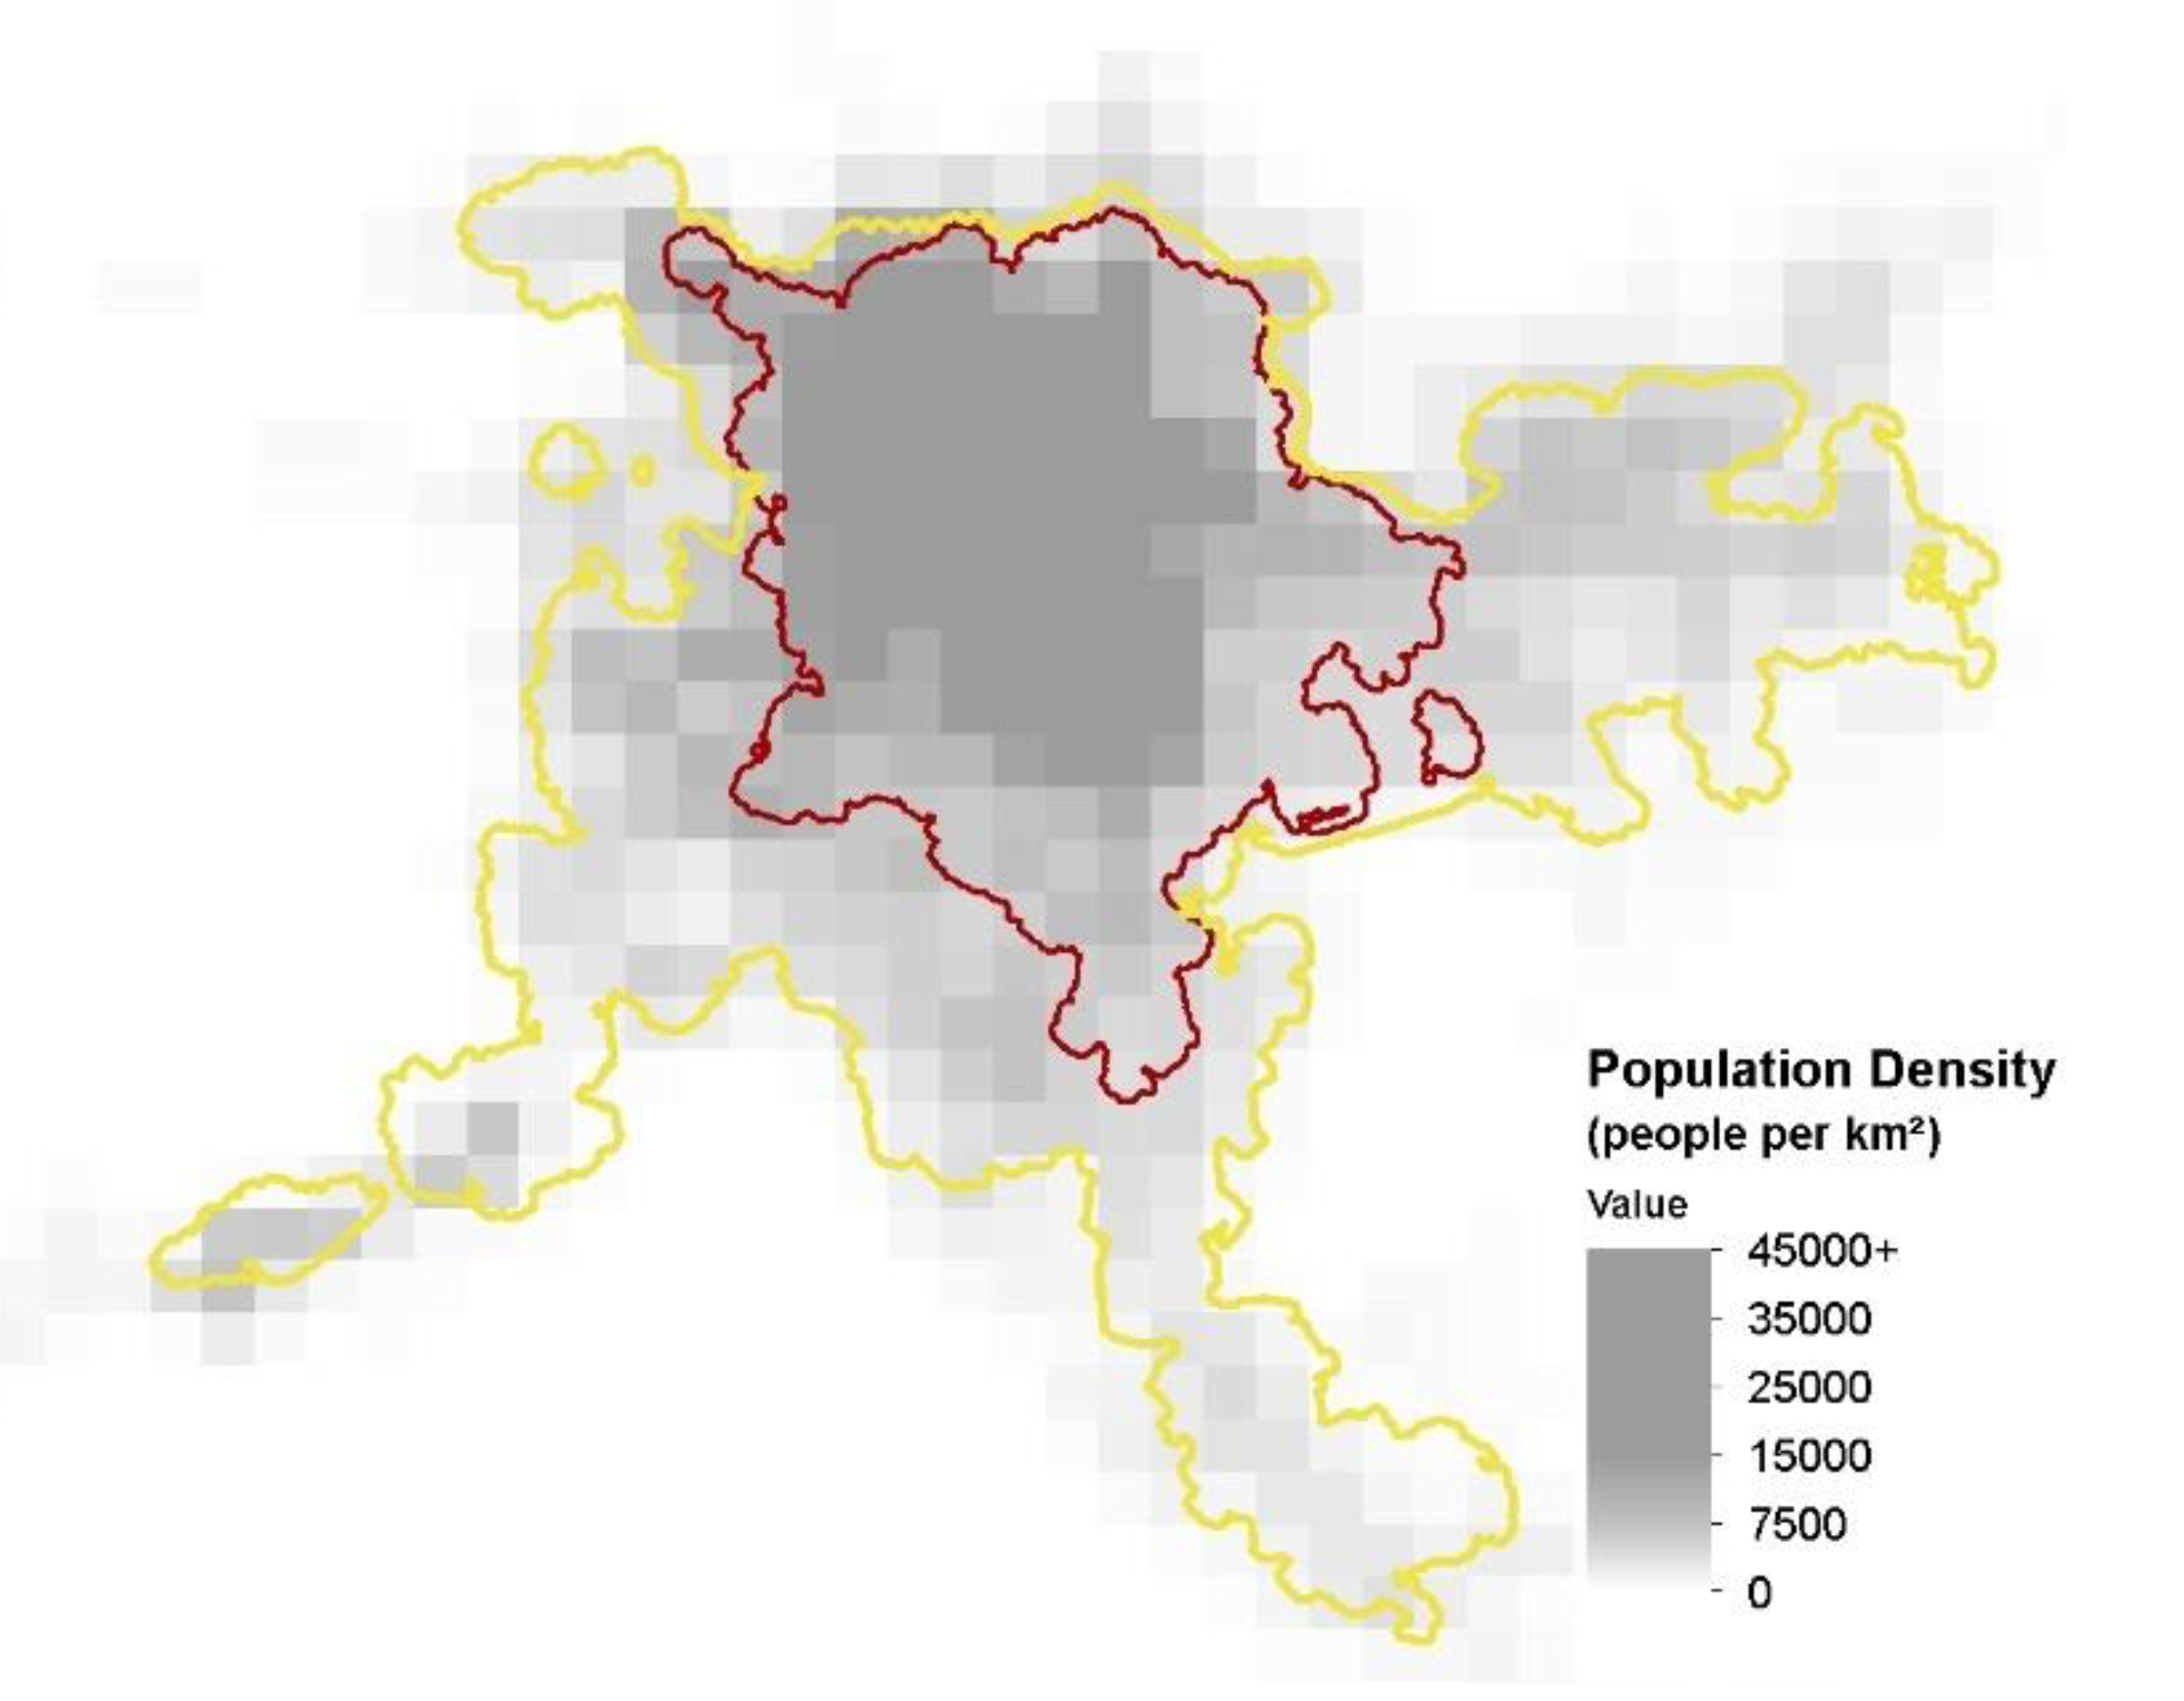
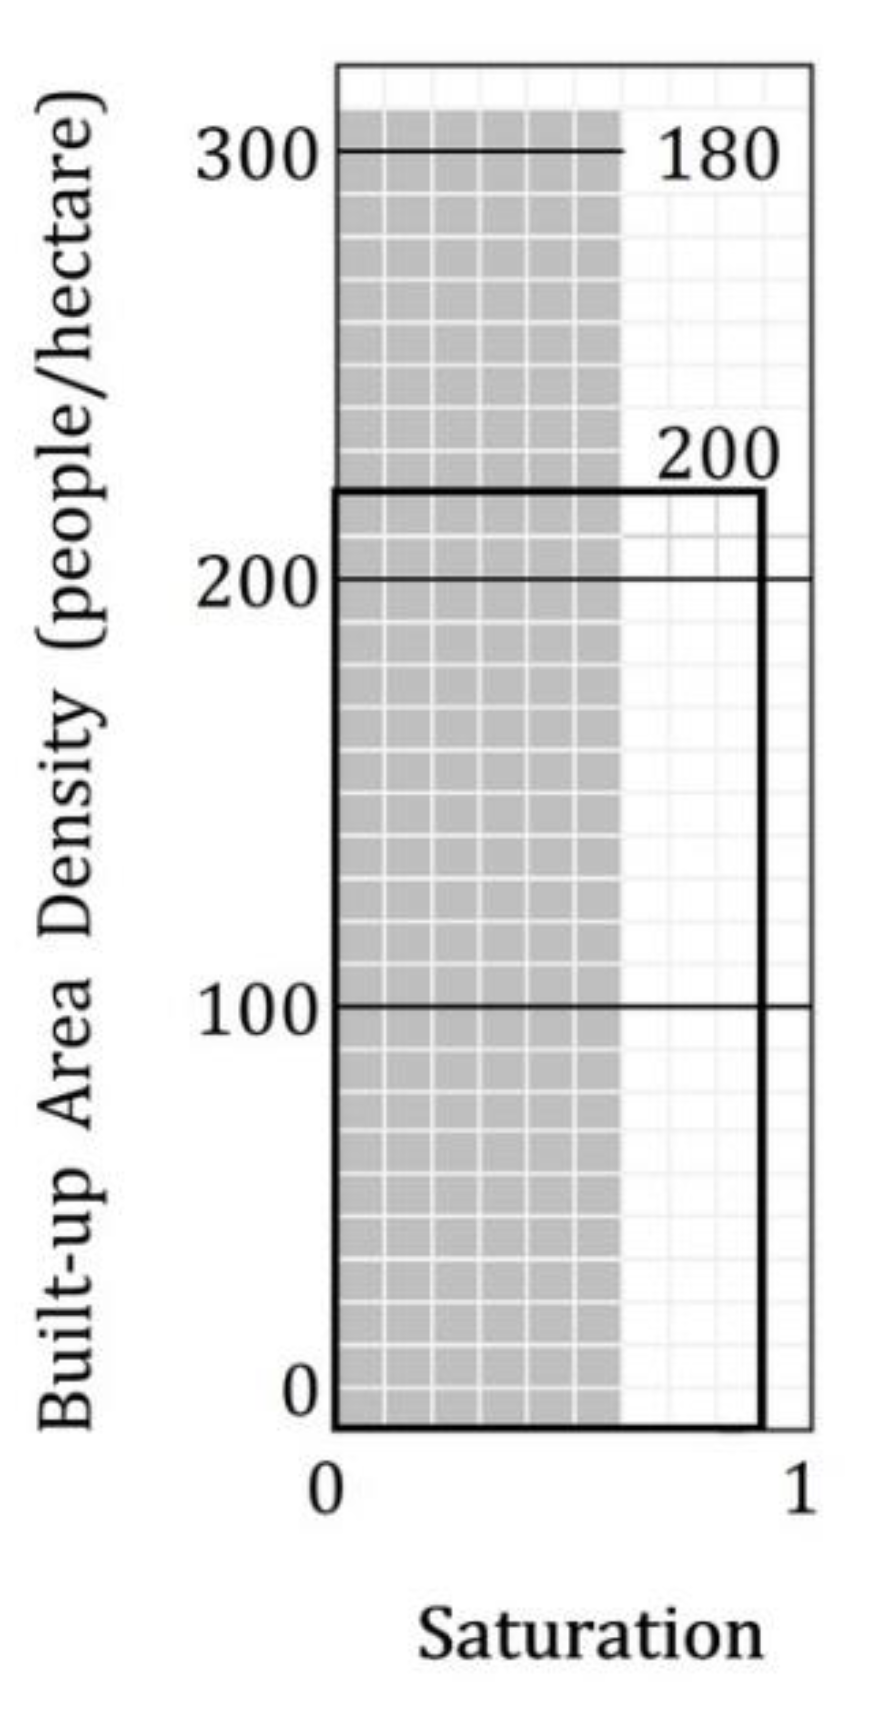
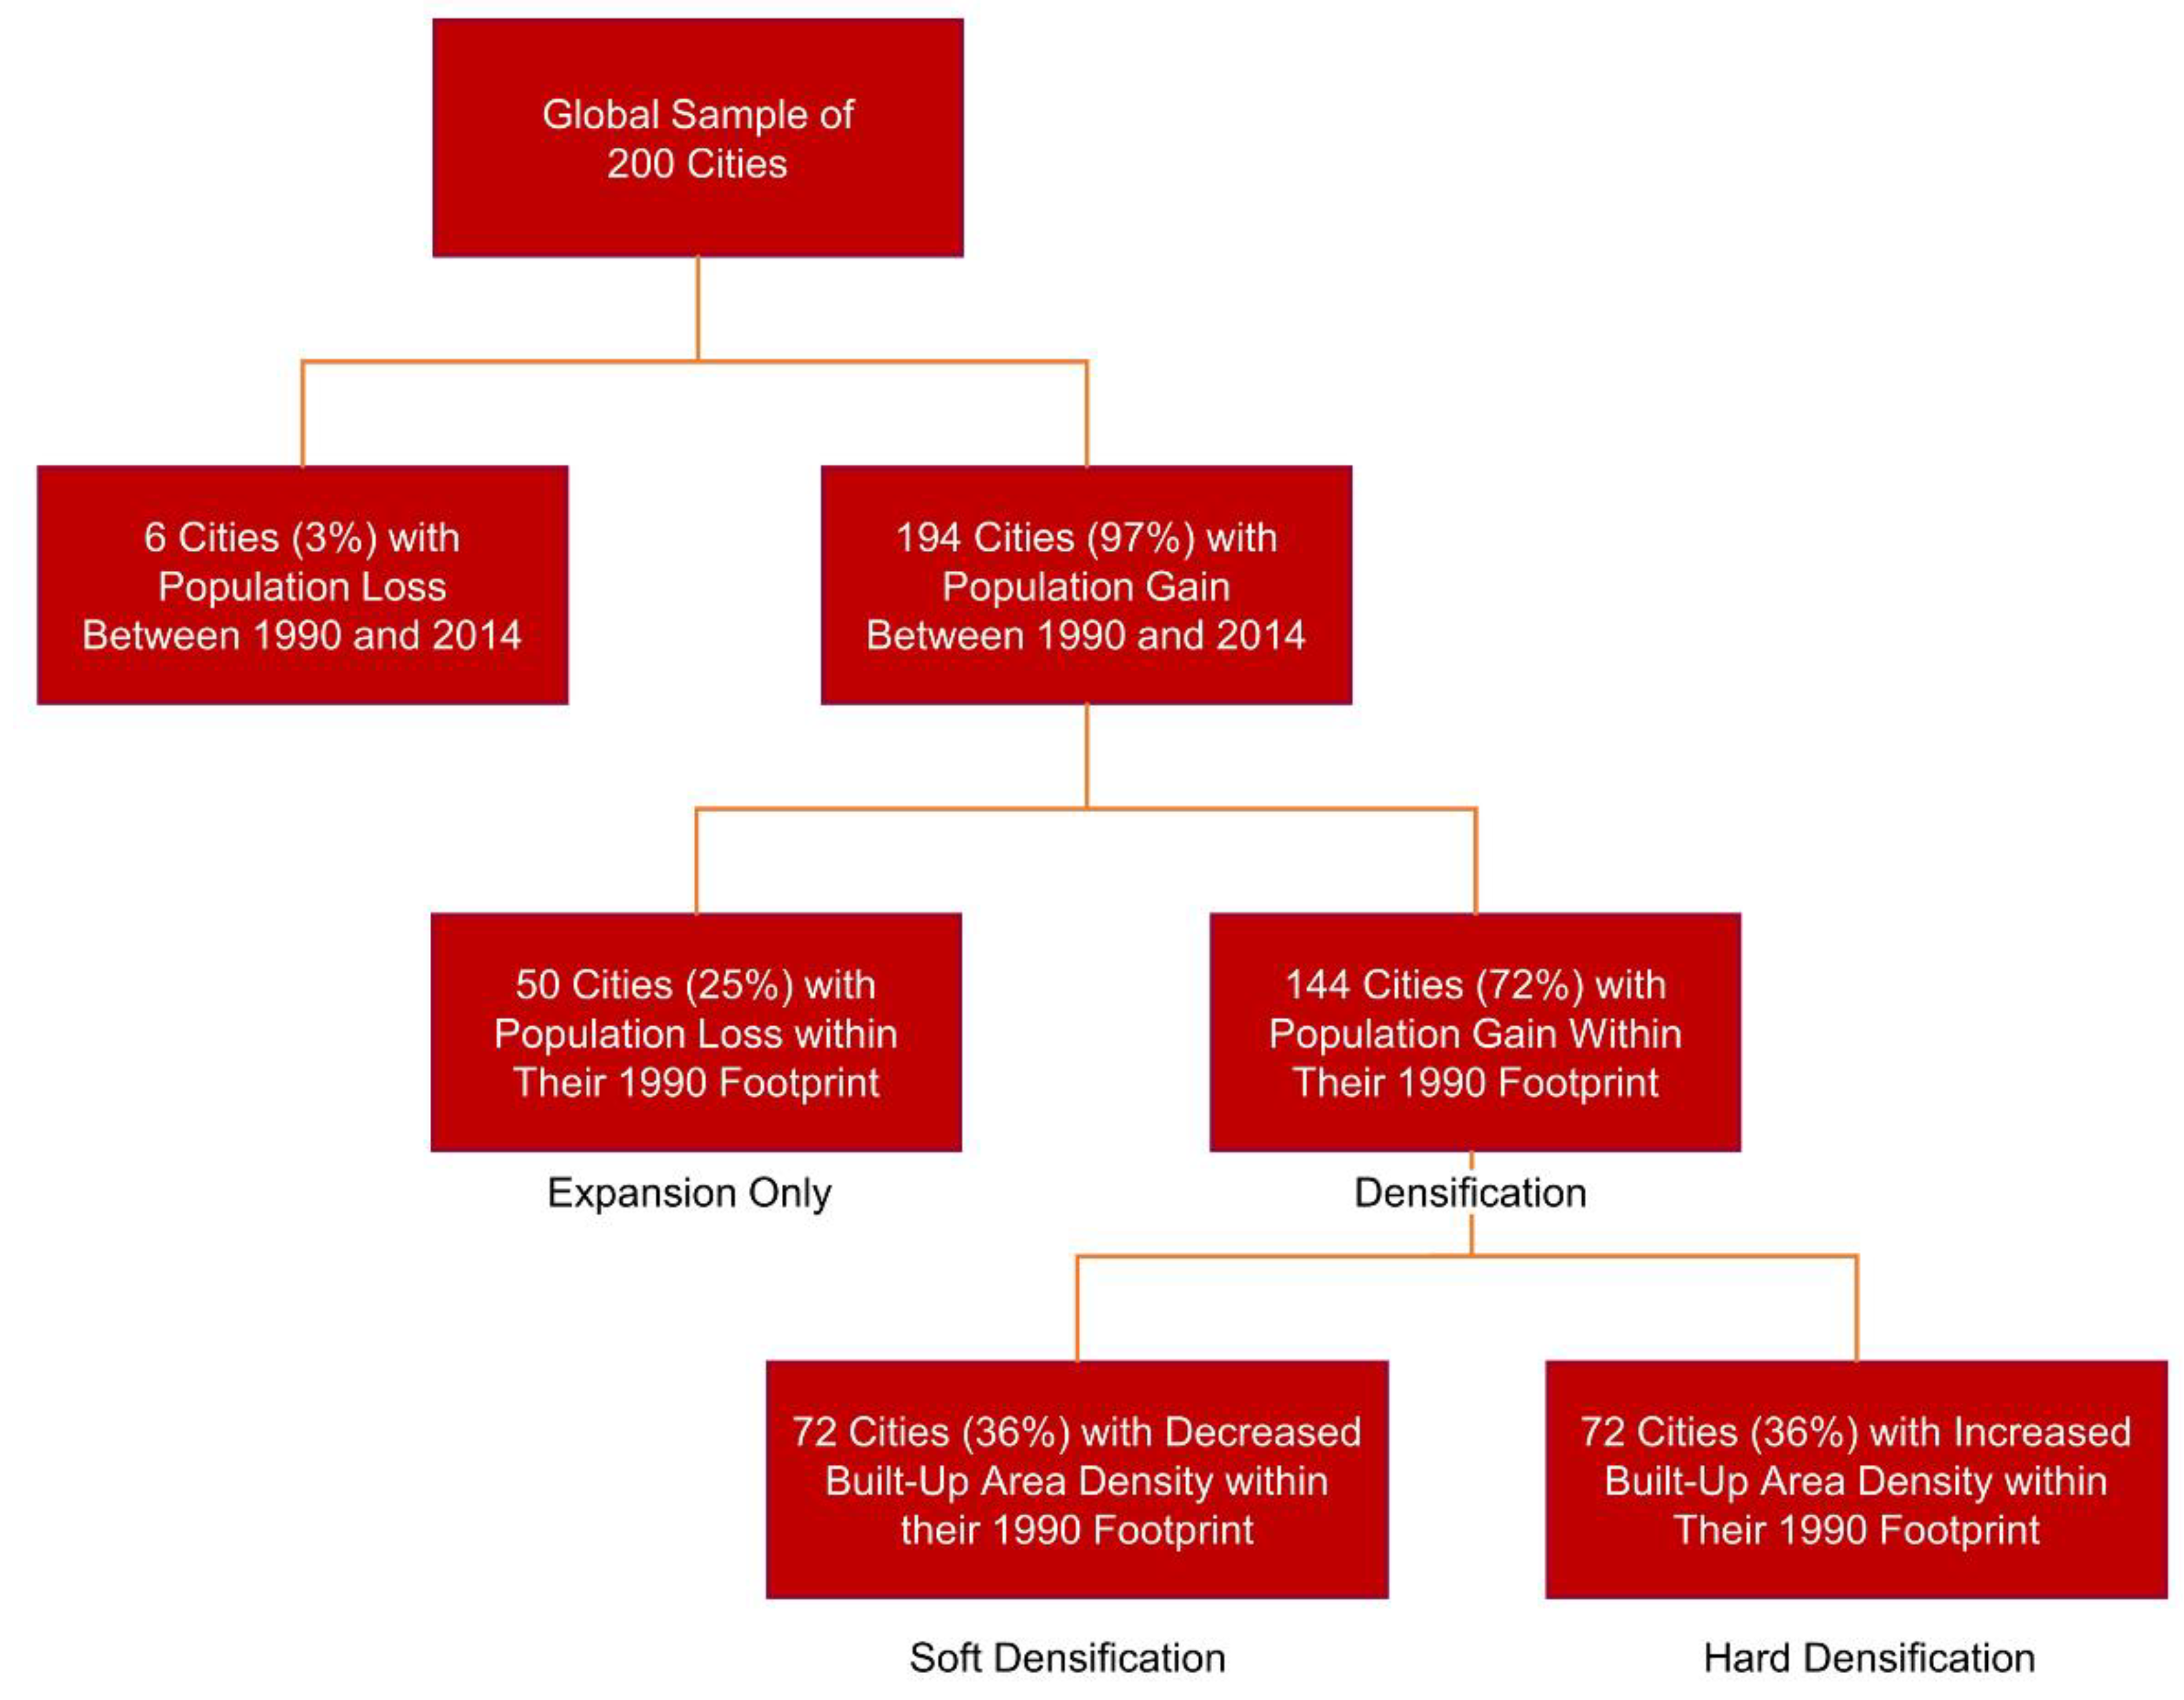
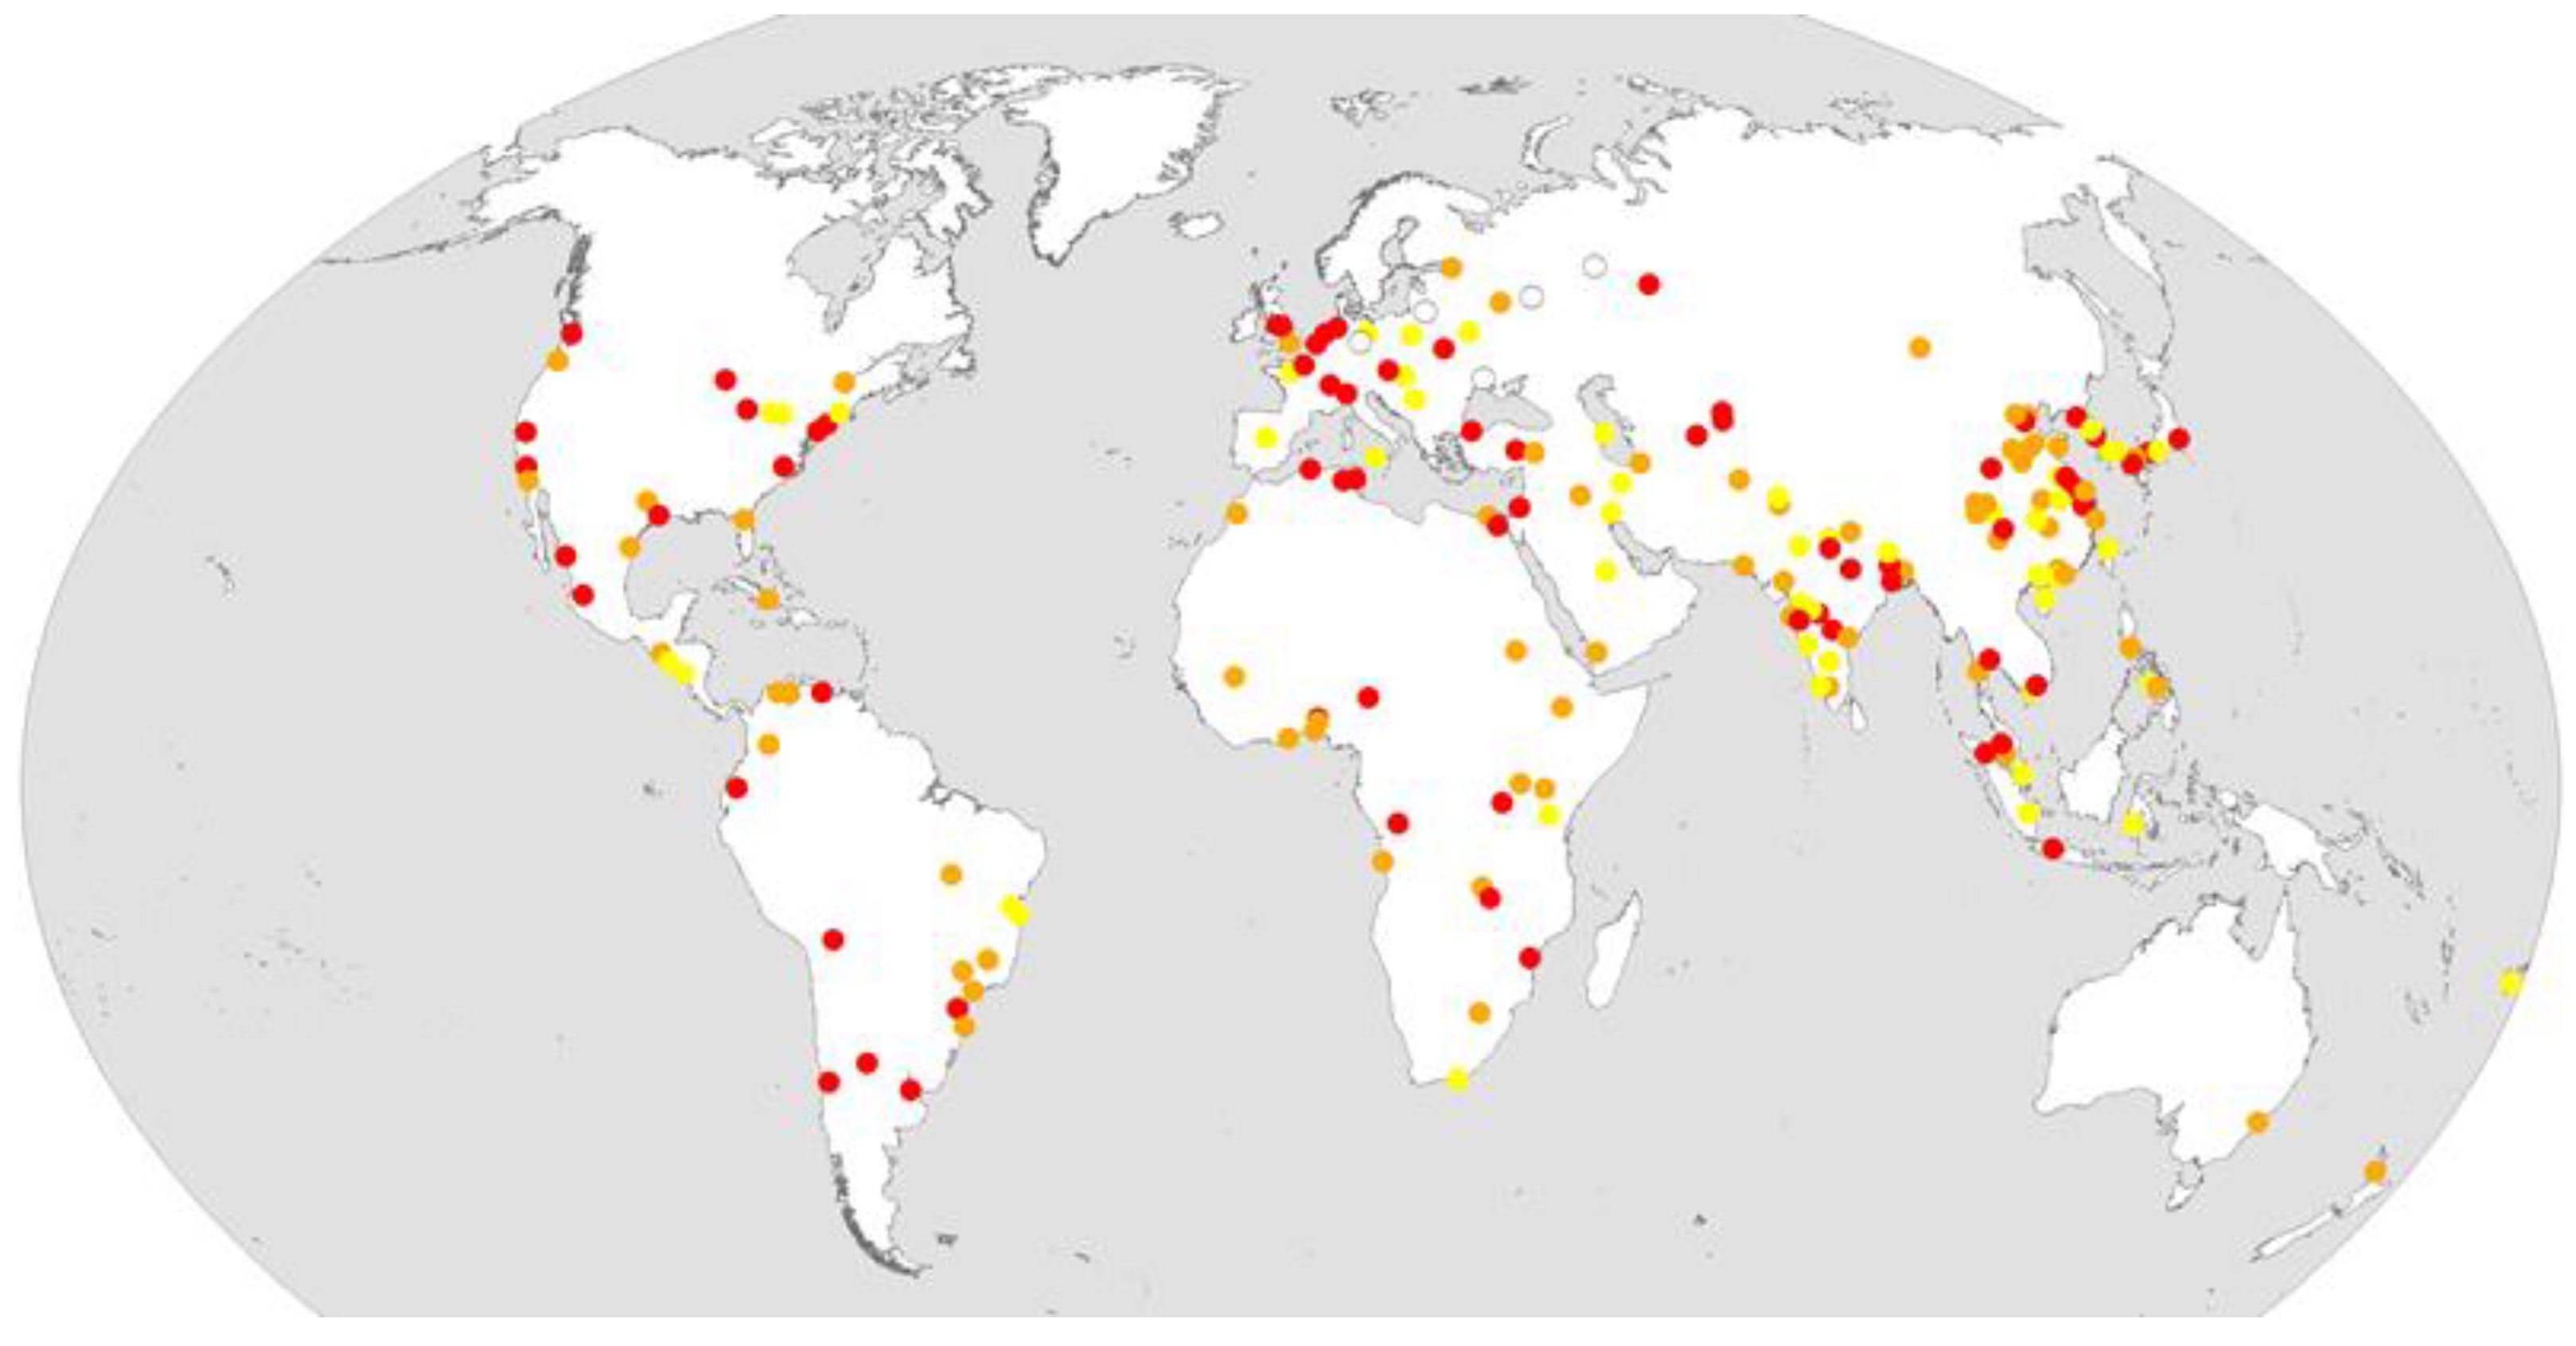
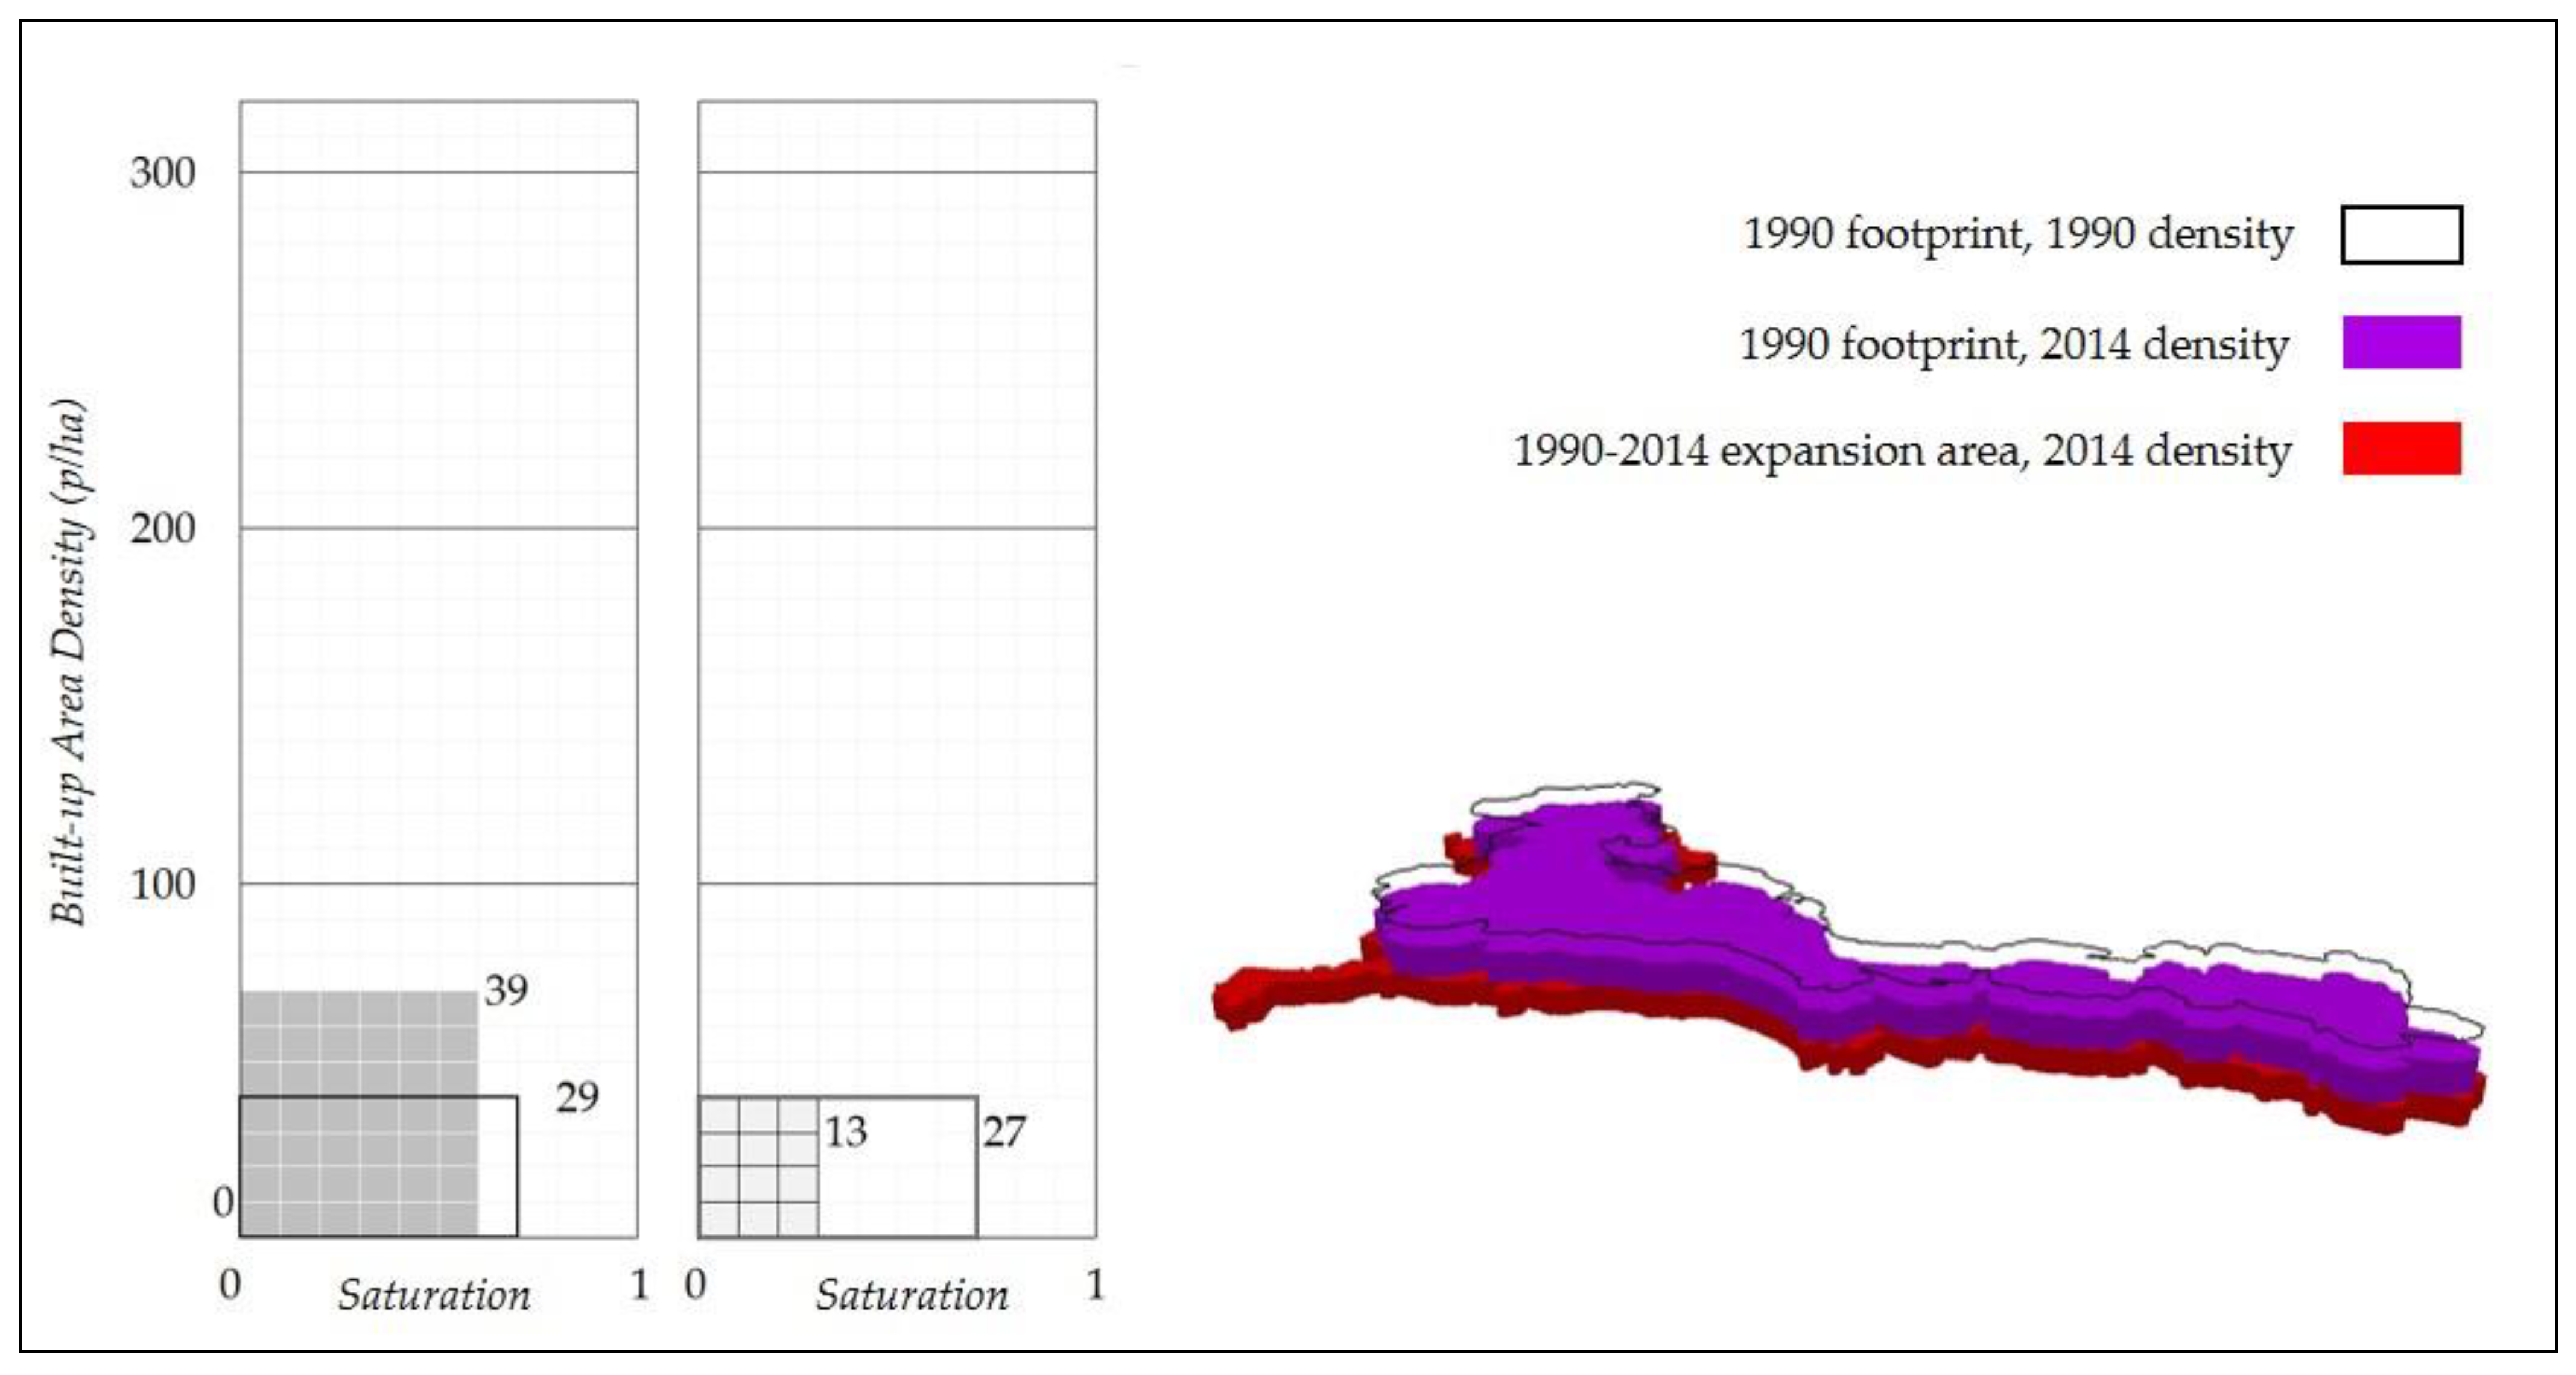
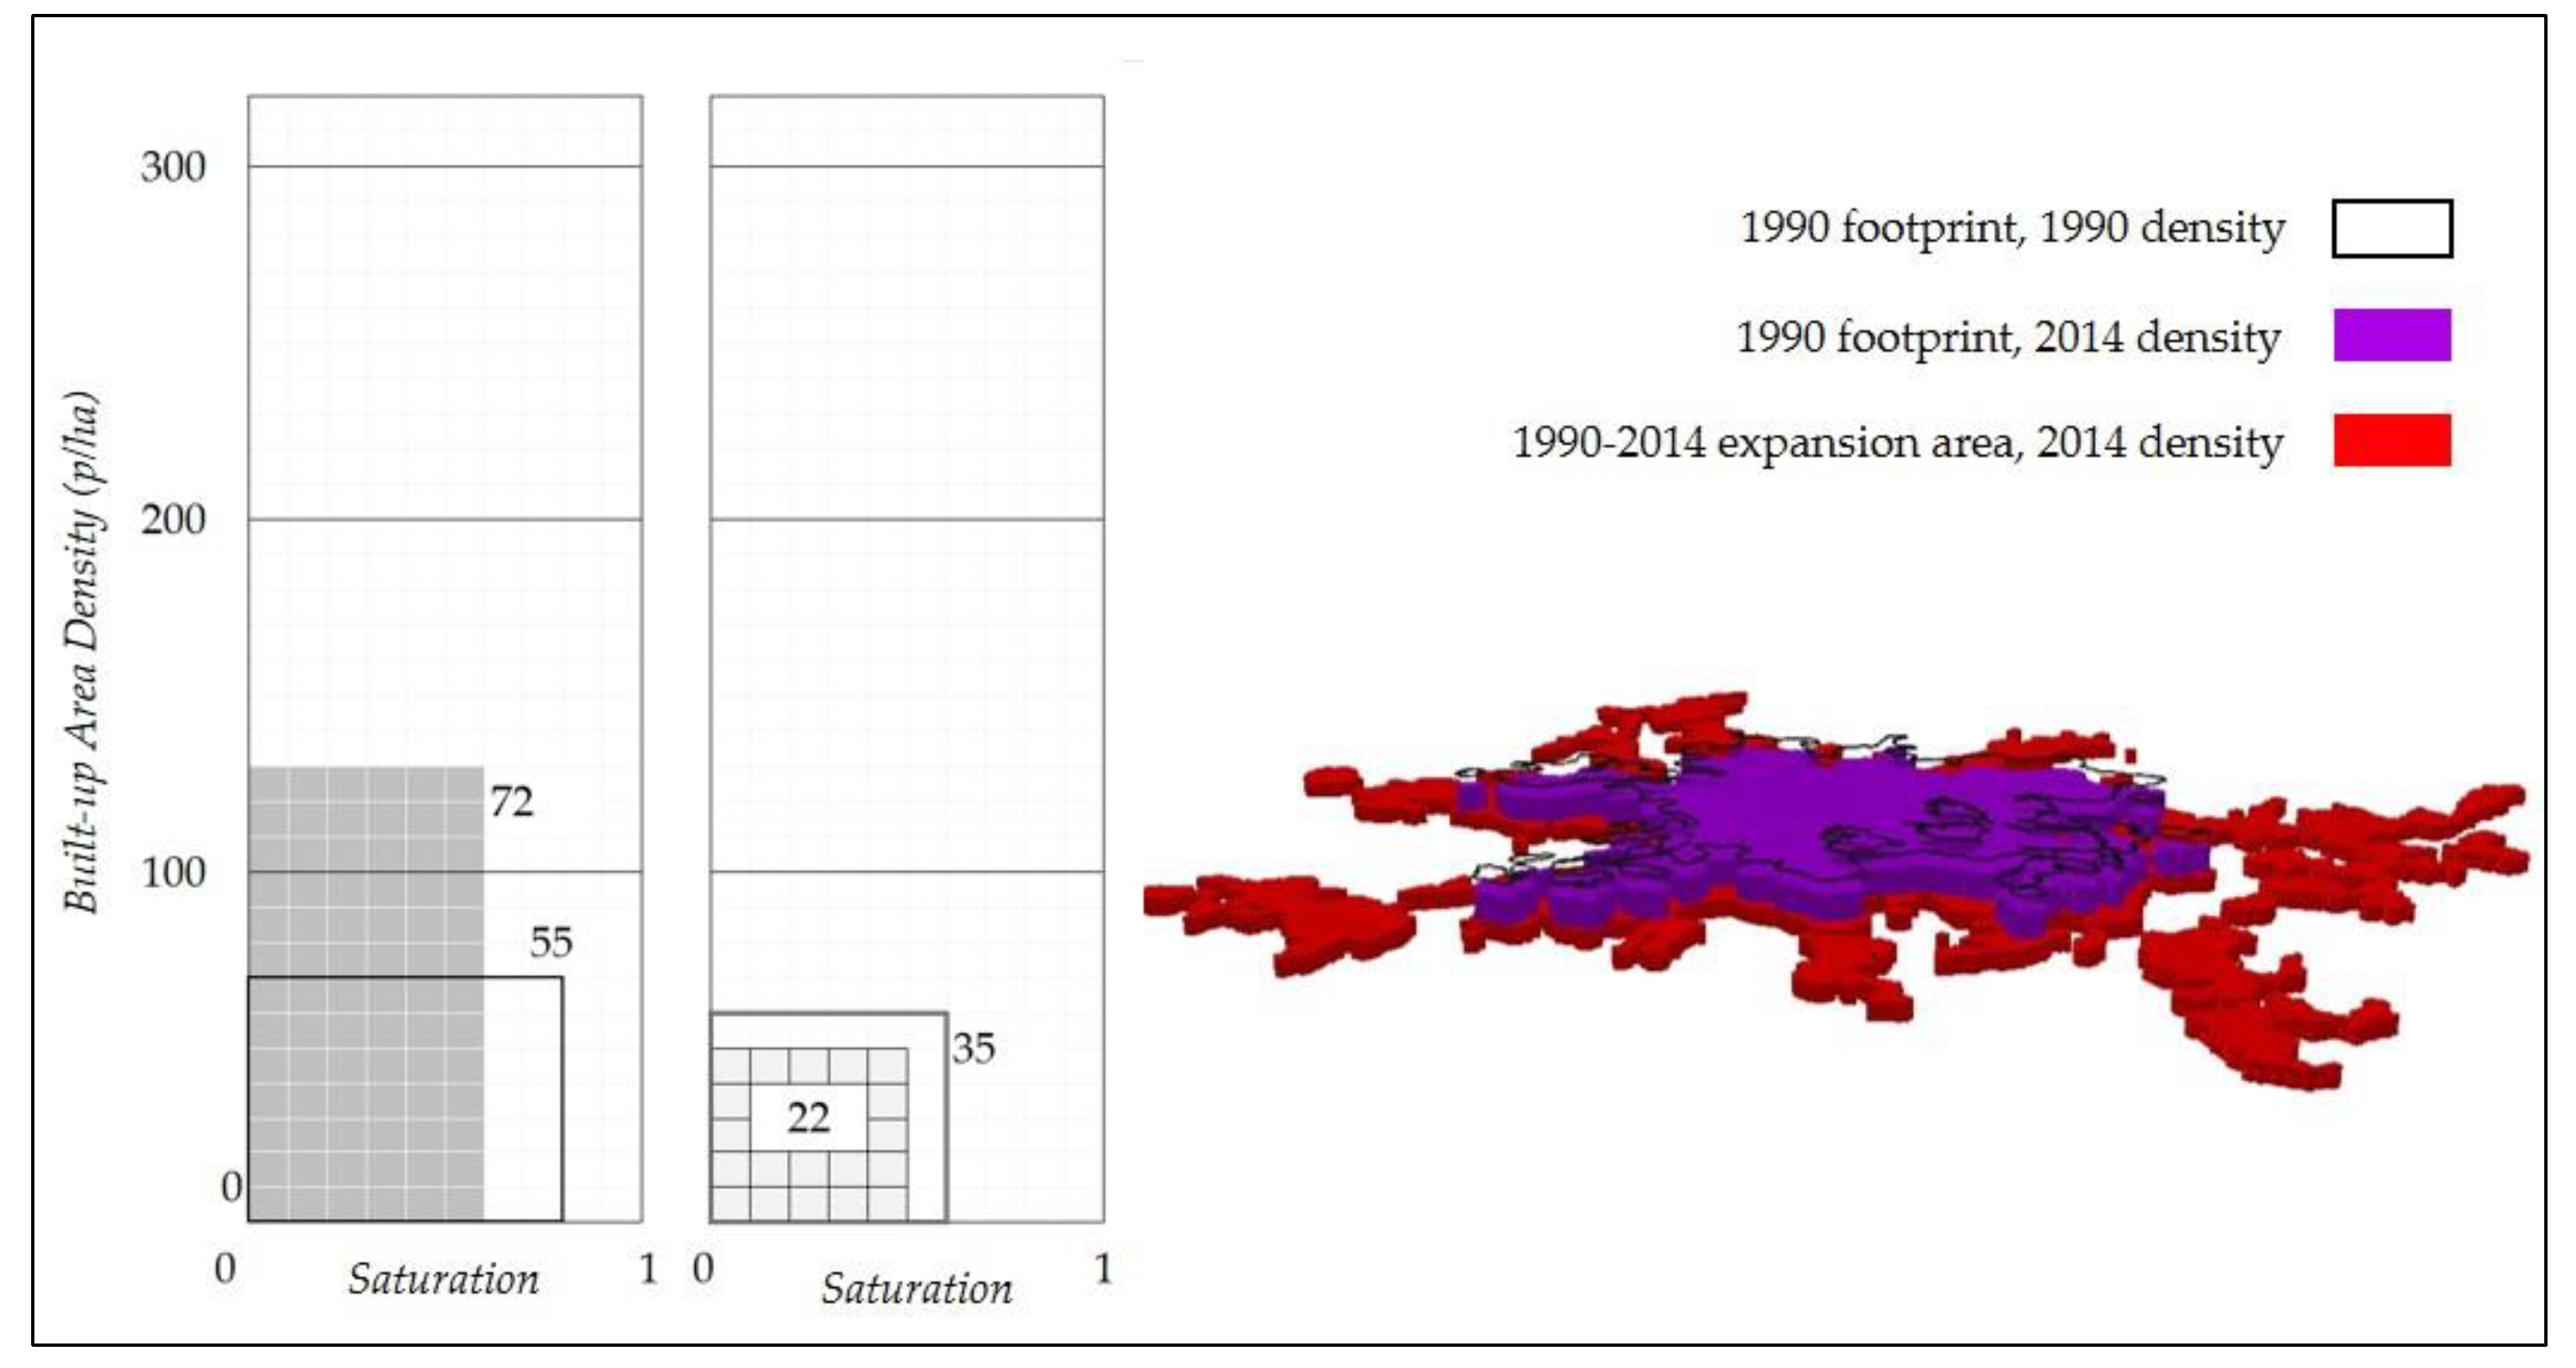
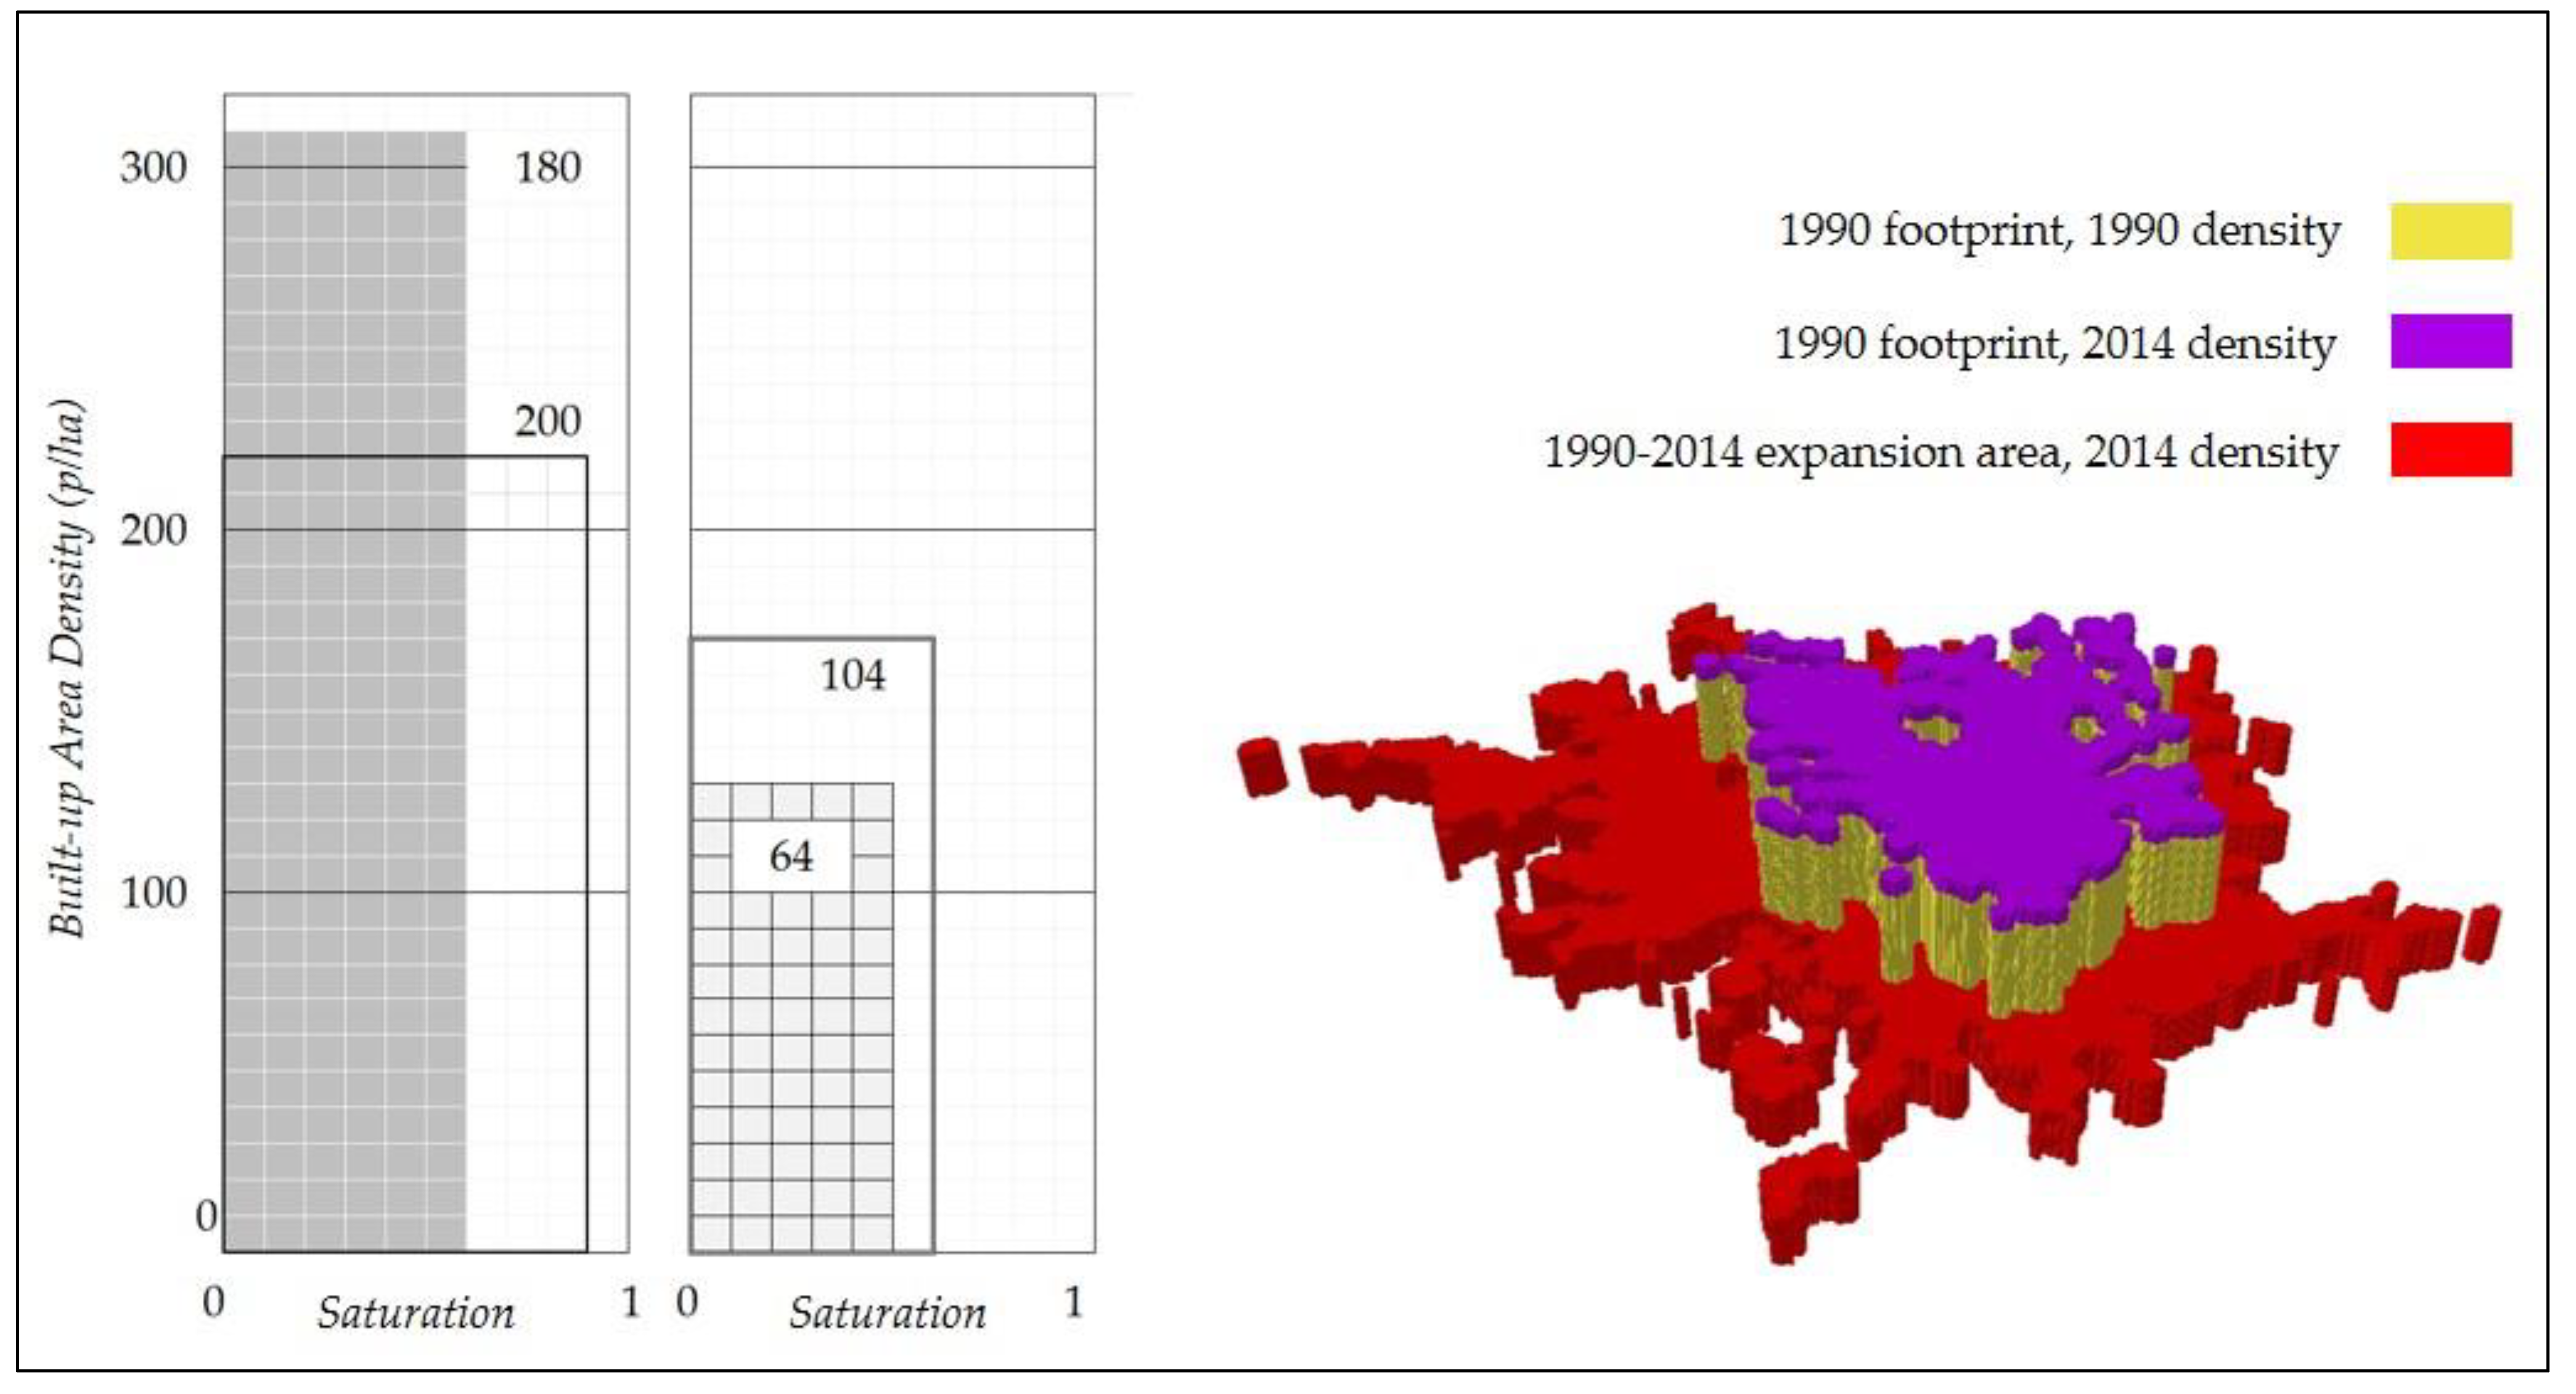
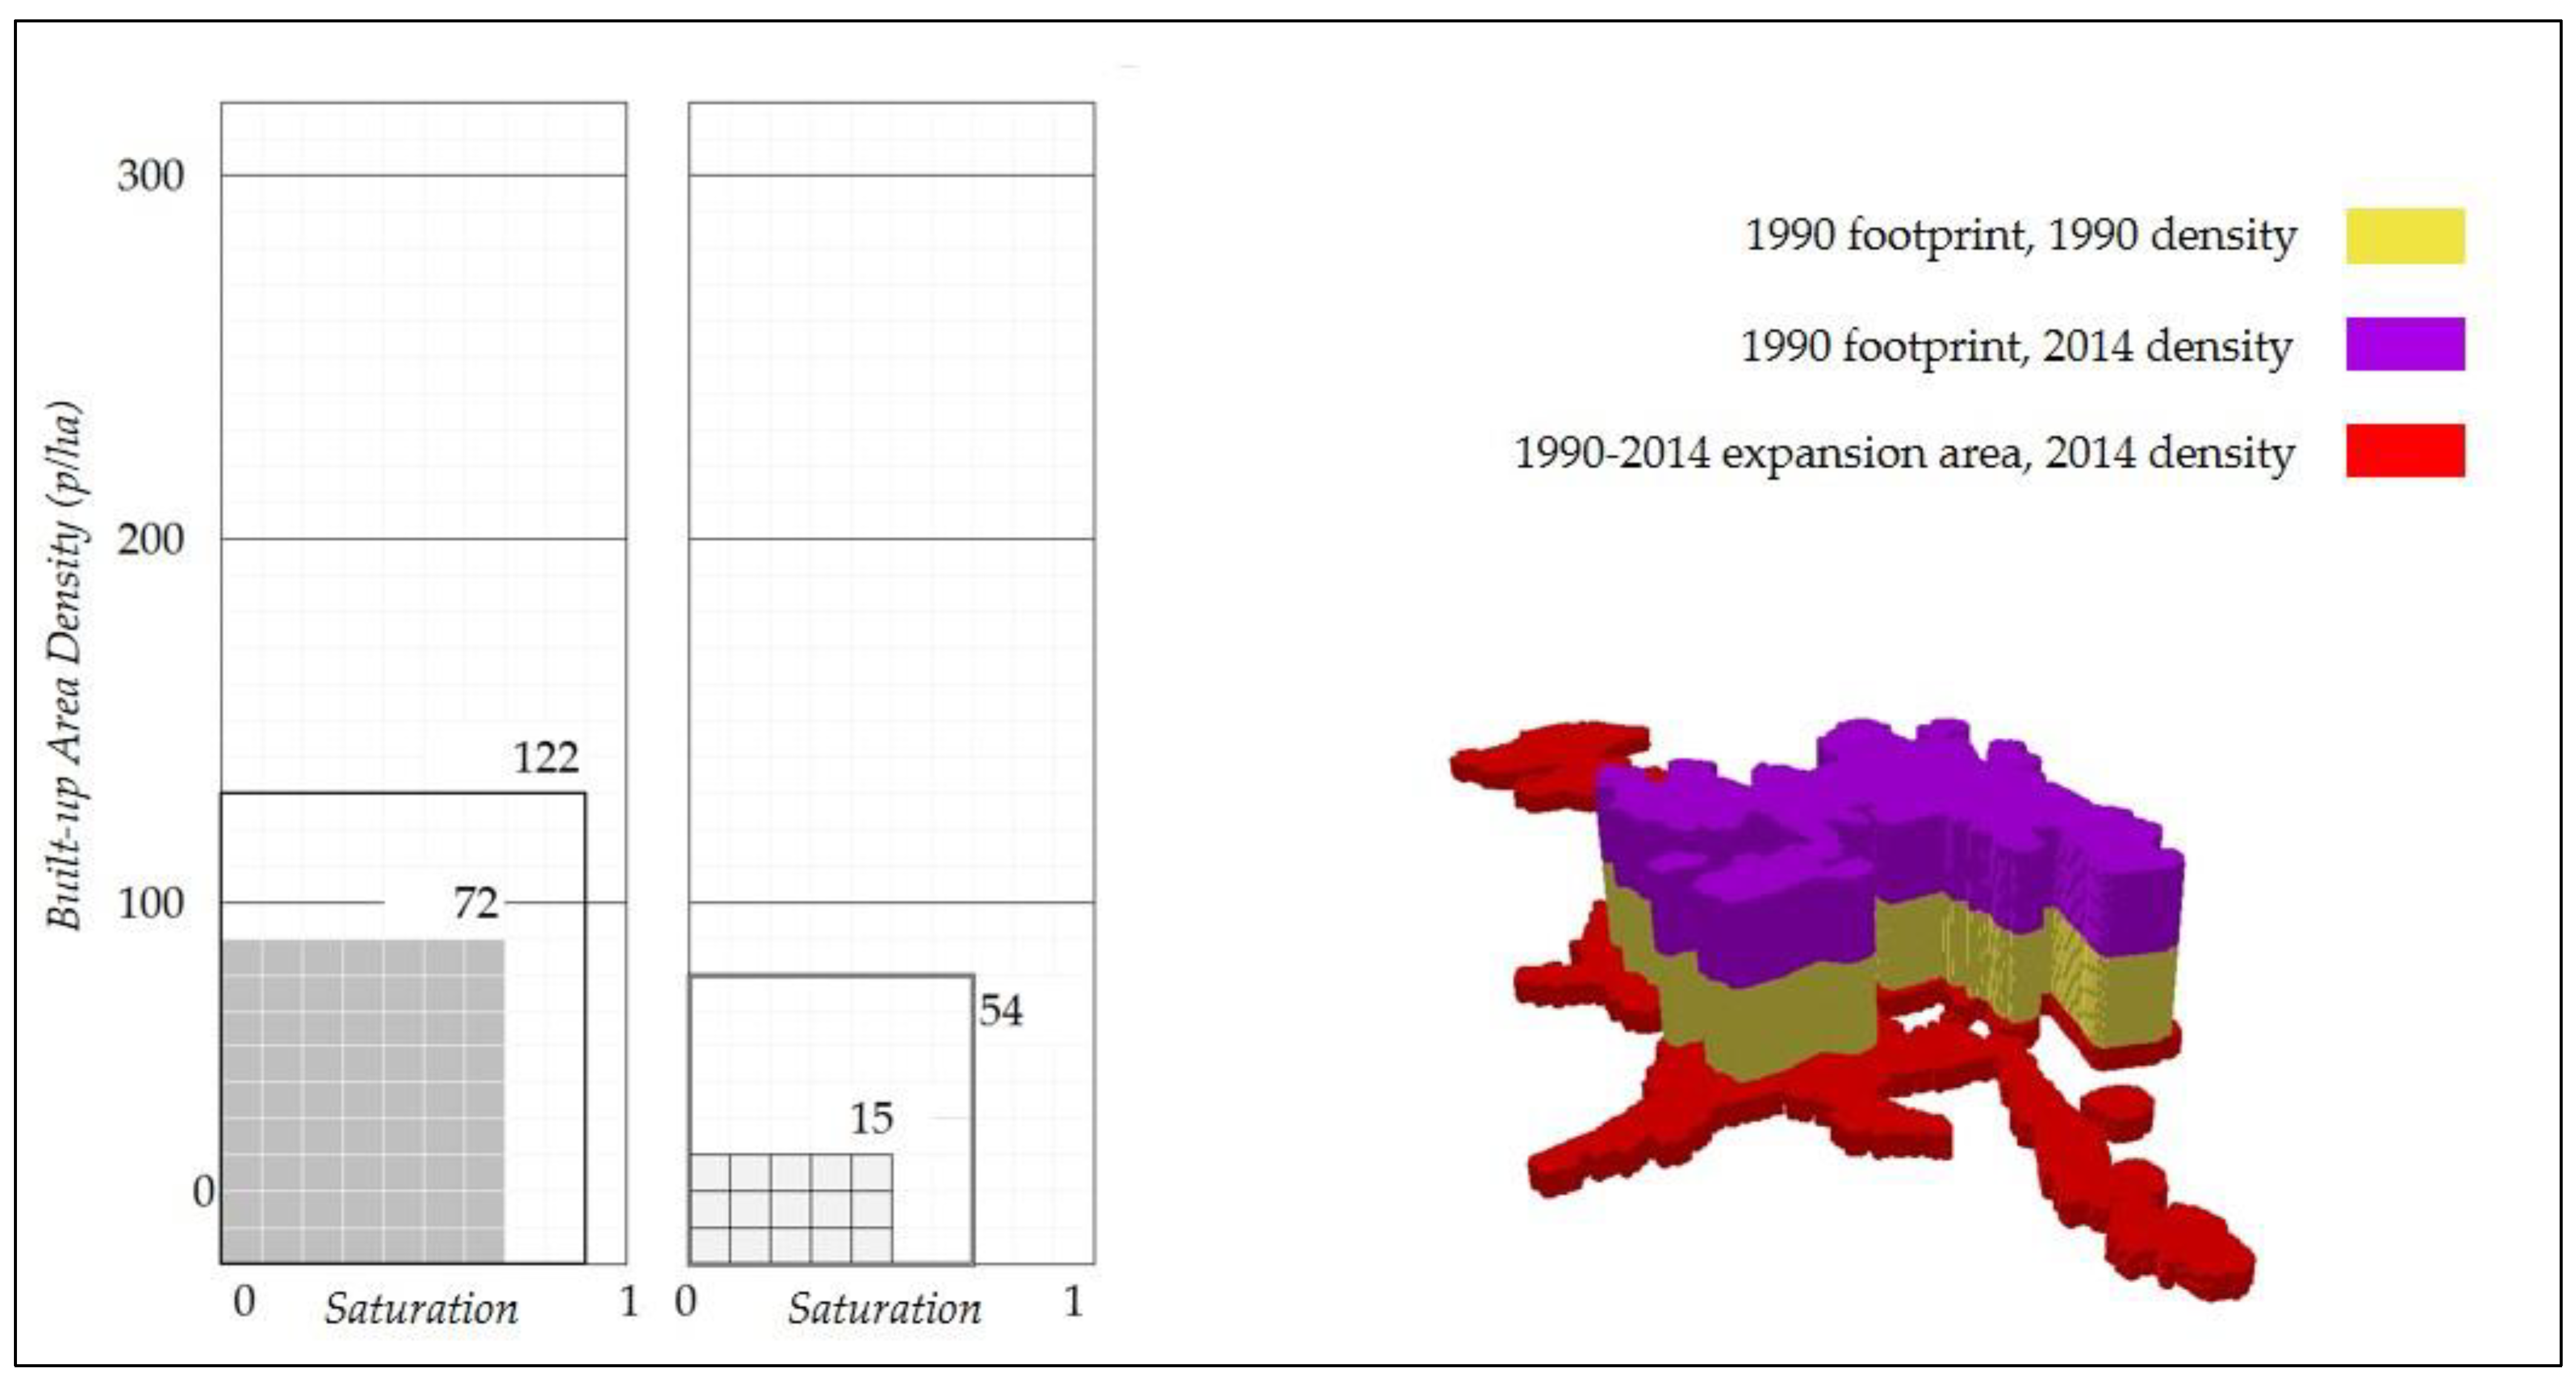
Table 1.
The shares of the population added to cities of different categories that were accommodated within their 1990 footprints and their 1990–2014 expansion areas; their annual rates of change; and their effect on urban density in cities as a whole.
Table 1.
The shares of the population added to cities of different categories that were accommodated within their 1990 footprints and their 1990–2014 expansion areas; their annual rates of change; and their effect on urban density in cities as a whole.
| Category/City | City Gain/Loss in Population 1990–2014 | Change in Urban Density in City as a Whole (p/ha) | ||||||
|---|---|---|---|---|---|---|---|---|
| Population Gain 1990–2014 | Within 1990 Footprint | Within Expansion Area 1990–2014 | ||||||
| Population Share of Gain | Percent Share of Gain | Population Share of Gain | Percent Share of Gain | 1990 | 2014 | Annual % Change | ||
| 200 cities in the Global Sample of Cities (Average) | 1,811,656 | 539,171 | 23 ± 3 | 1,272,485 | 77 ± 3 | 98 | 67 | −1.4 ± 0.3 |
| 6 Cities with Population Loss between 1990 and 2014 (Average) | −41,266 | −65,330 | 0 ± 0 | 24,064 | 100 ± 0 | 56 | 36 | −1.9 ± 0.6 |
| Dzerzhinsk, Russian Federation | −41,499 | −55,712 | 0 | 14,213 | 100 | 39 | 27 | −1.6 |
| 50 Cities with Population Loss within 1990 Footprint (Average) | 600,849 | −117,654 | 0 ± 0 | 718,502 | 100 ± 0 | 132 | 61 | −3.0 ± 0.6 |
| Berlin, Germany | 611,638 | −775,092 | 0 | 1,386,730 | 100 | 72 | 35 | −3.0 |
| Ahvaz, Iran | 480,250 | −24,389 | 0 | 504,639 | 100 | 71 | 62 | −0.5 |
| Singapore, Singapore | 2,385,249 | −252,294 | 0 | 2,637,543 | 100 | 90 | 121 | 1.2 |
| 72 Cities with Decreased Built-up Area Density within 1990 Footprint (“saturation only”) (Average) | 1,616,340 | 404,183 | 22 ± 3 | 1,212,157 | 78 ± 3 | 92 | 60 | −1.5 ± 0.3 |
| Hyderabad, India | 3,702,695 | 419,983 | 11 | 3,282,712 | 89 | 180 | 104 | −2.3 |
| Ndola, Zambia | 167,843 | 30,386 | 18 | 137,457 | 82 | 59 | 57 | −0.2 |
| Los Angeles, USA | 2,783,678 | 1,685,193 | 61 | 1,098,484 | 39 | 25 | 26 | 0.1 |
| 72 Cities with Increased Built-up Area Density within 1990 Footprint (“hard densification”) (Average) | 3,002,222 | 1,180,663 | 40 ± 3 | 1,821,558 | 60 ± 3 | 84 | 80 | −0.1 ± 0.5 |
| Marrakesh, Morocco | 398,838 | 257,553 | 65 | 141,285 | 35 | 72 | 54 | −1.2 |
| Bogotá, Colombia | 3,362,989 | 2,501,964 | 74 | 861,024 | 26 | 138 | 196 | 1.5 |
| Shenzhen, China | 10,489,344 | 3,042,465 | 29 | 7,446,879 | 71 | 33 | 105 | 4.8 |
Table 2.
Differences in density metrics between the 1990 footprints of cities and their expansion areas in 2014.
Table 2.
Differences in density metrics between the 1990 footprints of cities and their expansion areas in 2014.
| Category/City | Change during 1990–2014 Period within 1990 Footprint | ||||||||
|---|---|---|---|---|---|---|---|---|---|
| Urban Density (p/ha) | Saturation | Built-Up Area Density (p/ha) | |||||||
| 1990 | 2014 | Annual % Change | 1990 | 2014 | Annual % Change | 1990 | 2014 | Annual % Change | |
| 200 cities in the Global Sample of Cities (Average) | 98 | 117 | 0.8 ± 0.3 | 0.61 | 0.82 | 1.3 ± 0.1 | 168 | 138 | −0.5 ± 0.3 |
| 6 Cities with Population Loss between 1990 and 2014 (Average) | 56 | 43 | −1.2 ± 0.6 | 0.61 | 0.74 | 0.8 ± 0.5 | 91 | 58 | −1.9 ± 0.9 |
| Dzerzhinsk, Russian Federation | 39 | 29 | −1.2 | 0.57 | 0.73 | 1.1 | 69 | 40 | −2.2 |
| 50 Cities with Population Loss within 1990 Footprint (Average) | 132 | 100 | −1.0 ± 0.4 | 0.59 | 0.82 | 1.4 ± 0.2 | 244 | 123 | −2.4 ± 0.5 |
| Berlin, Germany | 72 | 55 | −1.1 | 0.55 | 0.77 | 1.4 | 22 | 19 | −0.5 |
| Ahvaz, Iran | 71 | 68 | −0.1 | 0.72 | 0.83 | 0.6 | 177 | 123 | −1.5 |
| Singapore, Singapore | 90 | 82 | −0.4 | 0.53 | 0.57 | 0.3 | 171 | 144 | −0.7 |
| 72 Cities with Decreased Built-up Area Density within 1990 Footprint (“soft densification”) (Average) | 92 | 109 | 0.6 ± 0.1 | 0.60 | 0.83 | 1.4 ± 0.2 | 159 | 127 | −0.8 ± 0.2 |
| Hyderabad, India | 180 | 200 | 0.4 | 0.58 | 0.89 | 1.8 | 308 | 224 | −1.3 |
| Ndola, Zambia | 59 | 66 | 0.4 | 0.51 | 0.72 | 1.5 | 117 | 92 | −1.0 |
| Los Angeles, USA | 25 | 29 | 0.5 | 0.72 | 0.84 | 0.6 | 35 | 34 | −0.1 |
| 72 Cities with Increased Built-up Area Density within 1990 Footprint (“hard densification”) (Average) | 84 | 142 | 2.3 | 0.63 | 0.83 | 1.2 ± 0.1 | 130 | 167 | 1.1 ± 0.4 |
| Marrakesh, Morocco | 72 | 122 | 2.2 | 0.74 | 0.90 | 0.8 | 97 | 135 | 1.4 |
| Bogotá, Colombia | 138 | 216 | 1.9 | 0.77 | 0.86 | 0.5 | 181 | 252 | 1.4 |
| Shenzhen, China | 33 | 253 | 8.5 | 0.73 | 0.93 | 1.0 | 45 | 273 | 7.5 |
Table 3.
Average annual rates of change between 1990 and 2014 in Urban Density, Saturation, and Built-up Area Density within the 1990 footprints of cities and in Urban Density in the city as a whole in the seven categories of cities.
Table 3.
Average annual rates of change between 1990 and 2014 in Urban Density, Saturation, and Built-up Area Density within the 1990 footprints of cities and in Urban Density in the city as a whole in the seven categories of cities.
| Category/City | Differences in Density Metrics between 1990 Footprints and Expansion Areas in 2014 | ||||||||
|---|---|---|---|---|---|---|---|---|---|
| Urban Density (p/ha) | Saturation | Built-Up Area Density (p/ha) | |||||||
| 1990 Footprint | Expansion Area | Difference (%) | 1990 Footprint | Expansion Area | Difference (%) | 1990 Footprint | Expansion Area | Difference (%) | |
| 200 cities in the Global Sample of Cities (Average) | 98 | 117 | 0.8 ± 0.3 | 0.61 | 0.82 | 1.3 ± 0.1 | 168 | 138 | −0.5 ± 0.3 |
| 6 Cities with Population Loss between 1990 and 2014 (Average) | 56 | 43 | −1.2 ± 0.6 | 0.61 | 0.74 | 0.8 ± 0.5 | 91 | 58 | −1.9 ± 0.9 |
| Dzerzhinsk, Russian Federation | 39 | 29 | −1.2 | 0.57 | 0.73 | 1.1 | 69 | 40 | −2.2 |
| 50 Cities with Population Loss within 1990 Footprint (Average) | 132 | 100 | −1.0 ± 0.4 | 0.59 | 0.82 | 1.4 ± 0.2 | 244 | 123 | −2.4 ± 0.5 |
| Berlin, Germany | 72 | 55 | −1.1 | 0.55 | 0.77 | 1.4 | 22 | 19 | −0.5 |
| Ahvaz, Iran | 71 | 68 | −0.1 | 0.72 | 0.83 | 0.6 | 177 | 123 | −1.5 |
| Singapore, Singapore | 90 | 82 | −0.4 | 0.53 | 0.57 | 0.3 | 171 | 144 | −0.7 |
| 72 Cities with Decreased Built-up Area Density within 1990 Footprint (“soft densification”) (Average) | 92 | 109 | 0.6 ± 0.1 | 0.60 | 0.83 | 1.4 ± 0.2 | 159 | 127 | −0.8 ± 0.2 |
| Hyderabad, India | 180 | 200 | 0.4 | 0.58 | 0.89 | 1.8 | 308 | 224 | −1.3 |
| Ndola, Zambia | 59 | 66 | 0.4 | 0.51 | 0.72 | 1.5 | 117 | 92 | −1.0 |
| Los Angeles, USA | 25 | 29 | 0.5 | 0.72 | 0.84 | 0.6 | 35 | 34 | −0.1 |
| 72 Cities with Increased Built-up Area Density within 1990 Footprint (“hard densification”) (Average) | 84 | 142 | 2.3 | 0.63 | 0.83 | 1.2 ± 0.1 | 130 | 167 | 1.1 ± 0.4 |
| Marrakesh, Morocco | 72 | 122 | 2.2 | 0.74 | 0.90 | 0.8 | 97 | 135 | 1.4 |
| Bogotá, Colombia | 138 | 216 | 1.9 | 0.77 | 0.86 | 0.5 | 181 | 252 | 1.4 |
| Shenzhen, China | 33 | 253 | 8.5 | 0.73 | 0.93 | 1.0 | 45 | 273 | 7.5 |
Publisher’s Note: MDPI stays neutral with regard to jurisdictional claims in published maps and institutional affiliations. |
© 2021 by the authors. Licensee MDPI, Basel, Switzerland. This article is an open access article distributed under the terms and conditions of the Creative Commons Attribution (CC BY) license (http://creativecommons.org/licenses/by/4.0/).
Share and Cite
MDPI and ACS Style
Angel, S.; Lamson-Hall, P.; Blei, A.; Shingade, S.; Kumar, S. Densify and Expand: A Global Analysis of Recent Urban Growth. Sustainability 2021, 13, 3835. https://0-doi-org.brum.beds.ac.uk/10.3390/su13073835
AMA Style
Angel S, Lamson-Hall P, Blei A, Shingade S, Kumar S. Densify and Expand: A Global Analysis of Recent Urban Growth. Sustainability. 2021; 13(7):3835. https://0-doi-org.brum.beds.ac.uk/10.3390/su13073835
Chicago/Turabian StyleAngel, Shlomo, Patrick Lamson-Hall, Alejandro Blei, Sharad Shingade, and Suman Kumar. 2021. "Densify and Expand: A Global Analysis of Recent Urban Growth" Sustainability 13, no. 7: 3835. https://0-doi-org.brum.beds.ac.uk/10.3390/su13073835
Note that from the first issue of 2016, this journal uses article numbers instead of page numbers. See further details here.