1. Introduction
The development of more efficient and sustainable lighting projects is a practice that contributes significantly to the achievement of more environmentally friendly urban ecosystems. The awareness of the fight against climate change is increasingly widespread at a historical moment in which the concentration of atmospheric CO
2 has reached values higher than 400 ppm
v (compared to the 280 ppm
v existing in the pre-industrial period) [
1]. This increase in the concentration of CO
2 is accompanied by a rise in the global average temperature of 1.2 °C [
2].
Thus, any project that meets the regulatory needs imposed with the minimum consumption of resources, both in the execution phase and in the exploitation phase, favors this objective. This circumstance requires the technical teams involved in the design and development of urban infrastructure projects to carefully analyze each aspect related to achieving the most efficient results possible while covering the purpose for which they are conceived.
Urban installations significantly contribute to the amount of consumption of natural resources required by municipal governments. In a European Union (EU) country such as Spain, Rodríguez and Fernández estimate this percentage at approx. 50% [
3]. The specific case of public lighting, in a situation in which a prevalence of High Pressure Sodium (HPS) discharge bulbs can still be established, but with an increasing massive implantation of LED luminaires, local governments in the EU paid EUR 7.6 billion to light public streets in 2015 [
4]. Specifically, also in Spain, Garrido-Jiménez at al. [
5] established that the total cost dedicated for this porpoise by municipalities is in the range of EUR 1500–2000/(hab yr), with 60–70% dedicated strictly to energy consumption and the rest of that amount used for maintenance. Additionally, in Germany, “street lighting represents a major cost factor, accounting for almost one third of municipal electricity budgets” [
6]. A similar situation can be found in most countries around the world, such as in Brazil, where “the cost of energy for street lighting represents the second most expensive item of most municipalities’ budgets, surpassed only by payroll expenditures” [
7], or in India where “street lighting is one of the largest energy expenses for the city, accounting for upwards of 35–45% of a municipality’s utility budget” [
8].
In these circumstances, any small improvement either in energy efficiency or in dimensioning adjustment results in a substantial economic benefit for the municipal coffers and makes it possible to enhance the sustainability of their ecosystems due to managing smaller installations with lower energy consumption.
In this sense, there are numerous previous works published in the literature that show different proposals for the improvement of street lighting installations. All of them, in general, can be classified within three groups: proposals associated with technology improvements, recommendations to adapt the regulatory requirements to the reality of the vision process and, finally, proposals to optimize planning and design methodologies.
Within the first group, it is possible find studies that either calculate reductions in the operating cost of these installations of between 30 and 60% due to the technology substitution of the light sources (mainly, as indicated before, changing from HPS to LEDs) [
9] or works that achieve efficiency improvements by incorporating photovoltaics generators and batteries [
10] or other equipment related to renewable energy sources in their power grid.
The second group is based on the adaptation of installations to the nature of the vision process of humans. In situations of artificial street lighting, the human vision works in mesopic format [
11]. This is the dominant vision process in the range between 0.01 cd/m² (that marks the end of scotopic vision) and 3.00 cd/m
2 (where the beginning of photopic vision is established) [
12]. In this interval, the light that reaches the retina is not concentrated exclusively in the fovea, where the cone photoreceptors that have low light sensitivity but are in charge of the color perception are mainly grouped. The light extends itself and activates the rod photoreceptors, which have a greater reactivity in low luminance conditions [
13].
Each of these photoreceptors transforms the radiant incidence they perceive into electrical impulses that are processed in the brain. This transformation has a different spectral response depending on the vision system used. Thus, while the maximum sensitivity of the cones can be found around 555 nm (yellow–green), for the rods this maximum appears approximately at 507 nm (green–blue). For this reason, it is not accurate to assume photopic luminance values as normative values to regulate night-time street lighting, since a different vision mode with a different sensitivity response operates in the eye in such conditions. Because of this, the International Commission on Illumination (CIE) proposed, in 2010, an adjustment of the photopic luminance value, indicated by the manufacturer, to an effective luminance value [
14]. This line of work serves as reference for numerous scientific publications [
15,
16,
17].
The last group of proposals raises different optimization methodologies. Thus, it is possible to find development of methods, based on a regression analysis, that guarantee the highest efficiency of an installation based on the fulfillment of some relationships between several geometric parameters of the road and the lighting power to be installed [
18,
19]. There are also methodological proposals, supported by the previous ones, that incorporate, in these proposals, calculation optimization algorithms [
20], or that jointly consider energy and economic aspects [
21]. All these contributions make it clear that there is a wide margin, not only in the improvement in the traditional public lighting installations, but also in the design mechanisms to implement them in an optimized way from the beginning.
The proposal developed in this work is an organized method that can be easily adapted to different contexts and objectives of lighting installations. It provides a range of values of parameters for the installation design that achieve a solution that can be classified as optimized. These values make it possible to pre-evaluate whether a given luminaire is suitable for a specific street design or, on the contrary, it is convenient to choose another model before calculating and simulating the specific results that can be achieved with it. This method takes into consideration the radiant photometry of the light source of the luminaire, the sensitivity curves of human mesopic vision, the geometric conditions of the road (number and width of lanes and height and distance of the light points) and the regulation’s requirements (classification and minimum and maximum photometric values allowed).
The following chapters of this paper describe, in detail, the proposed method, and present the results obtained when it is applied to one common configuration of an urban road setting, a discussion of these results and, finally, the conclusions that summarize the main advantages of the proposed method.
2. Materials and Methods
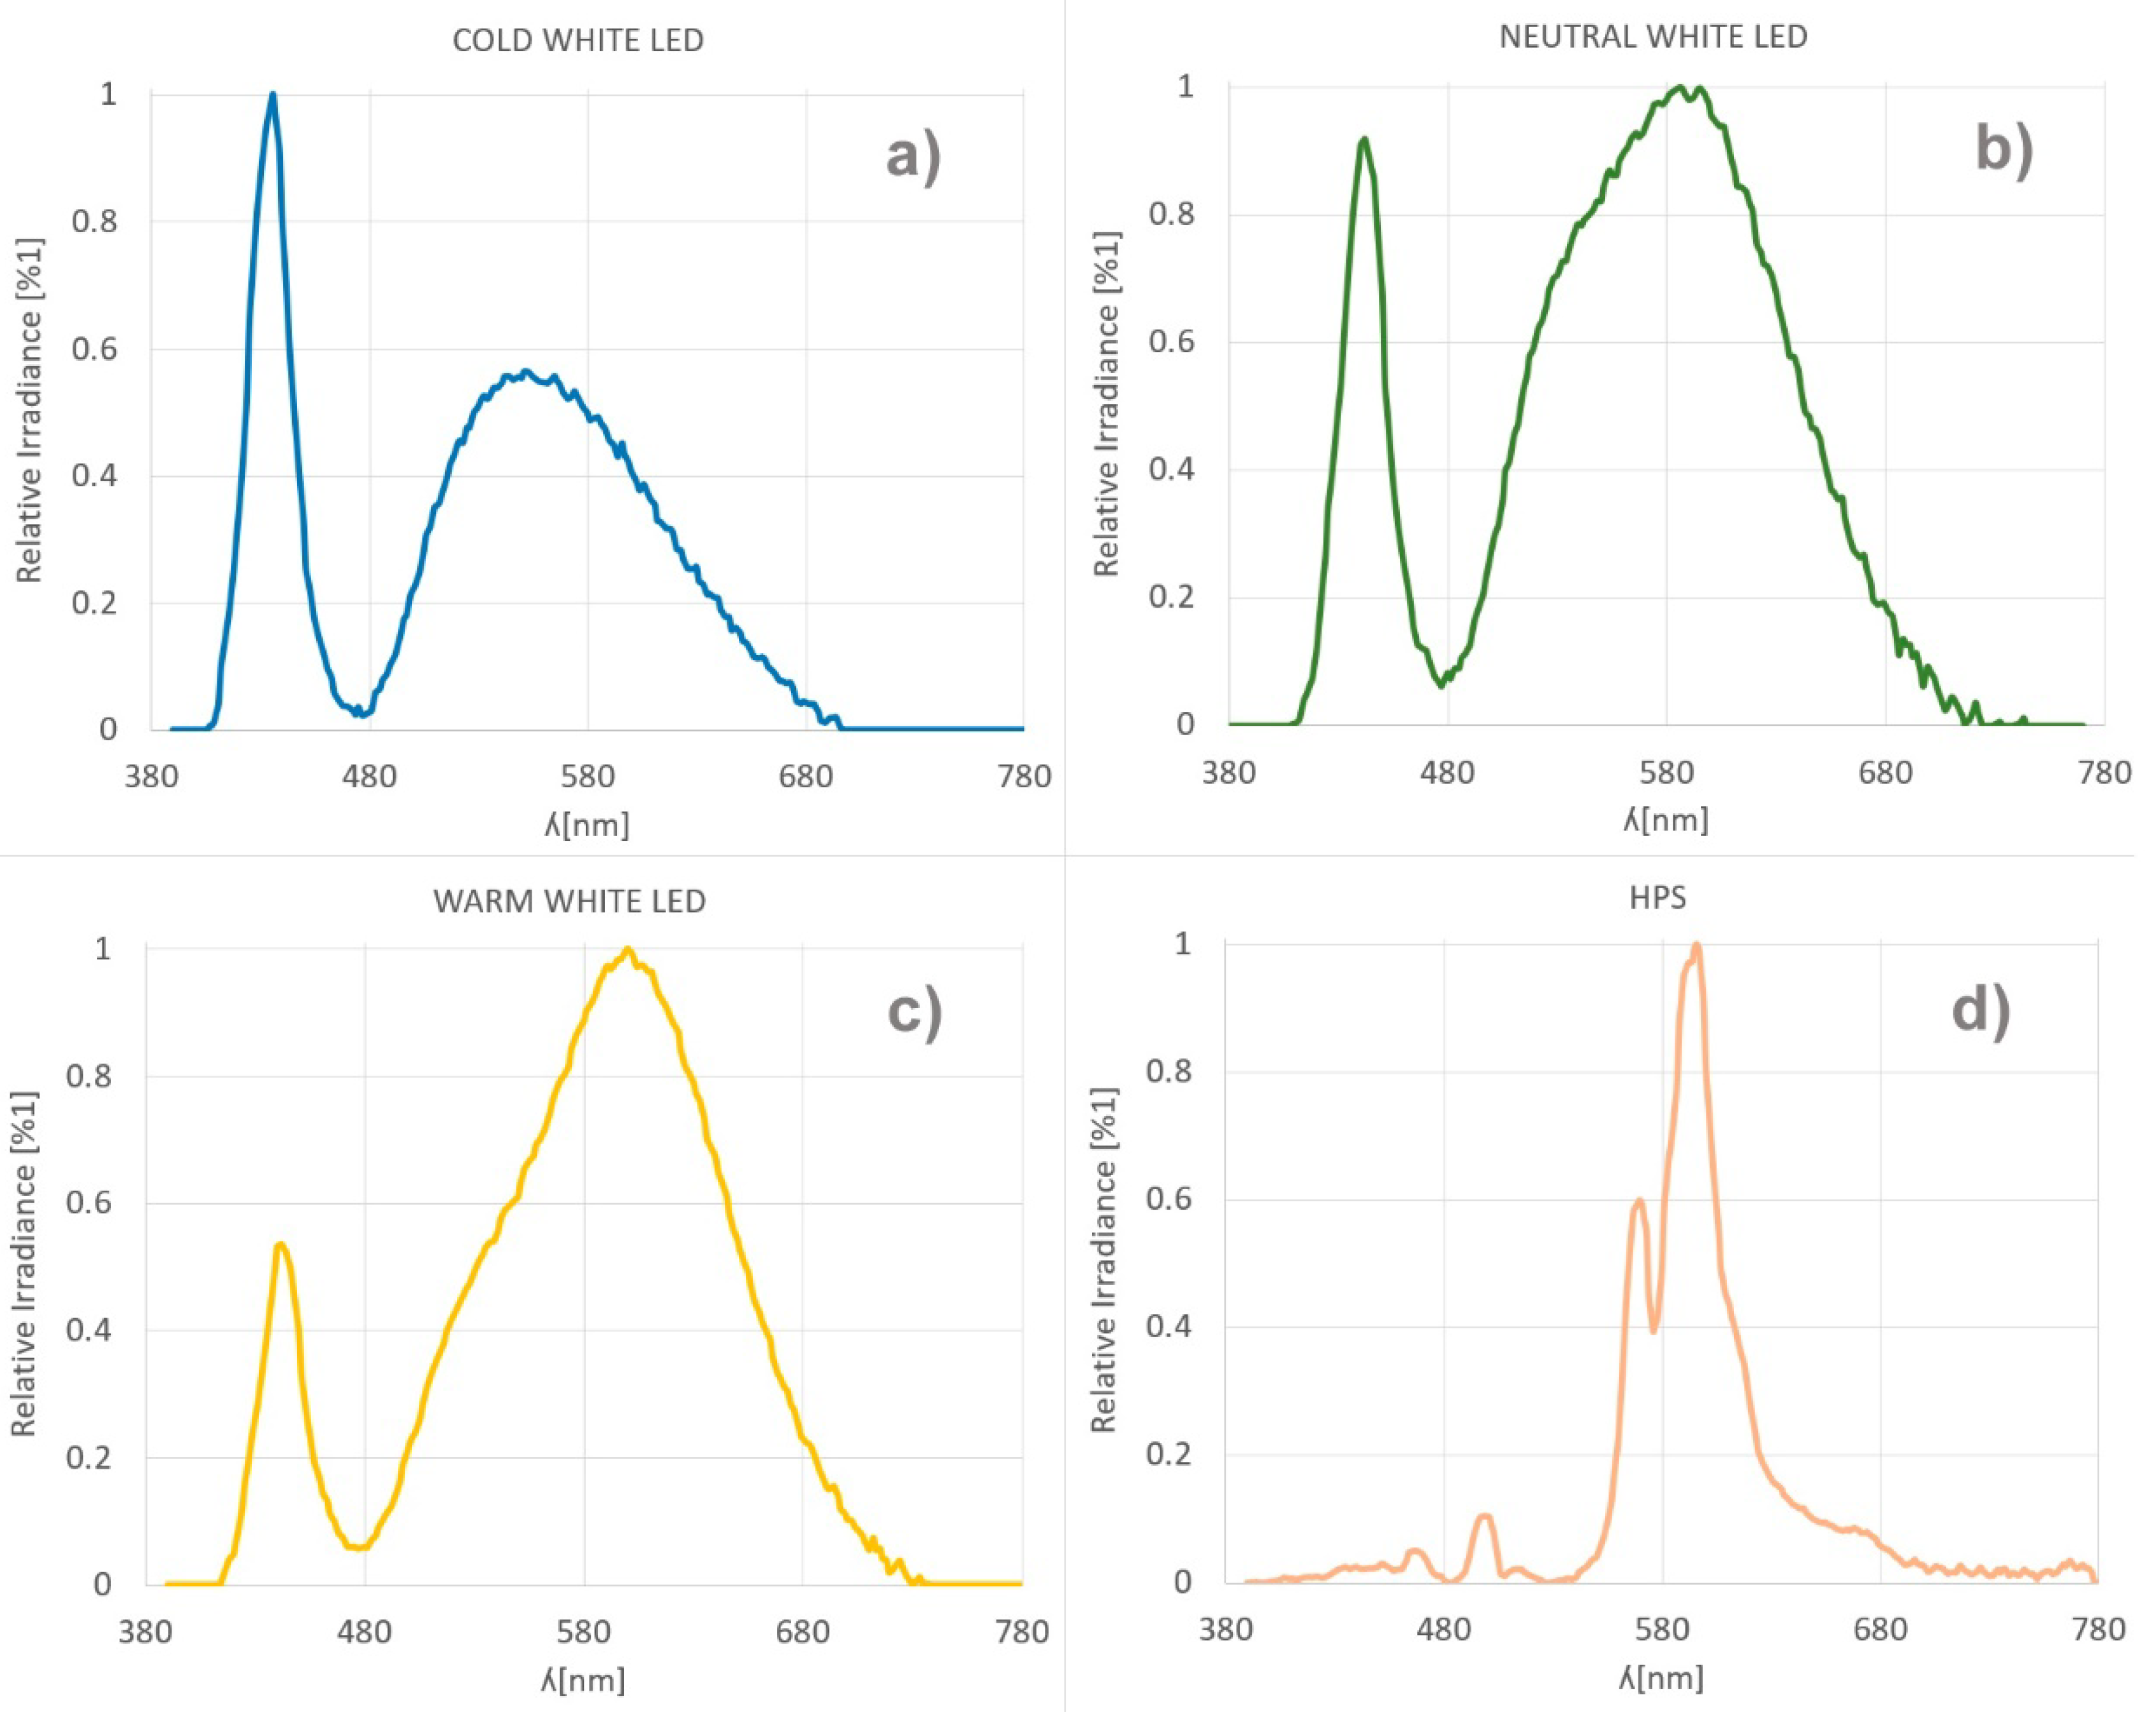
This study was carried out analyzing a selection of 66 outdoor street lighting luminaires engineered using both HPS discharge bulbs with Correlated Color Temperatures (CCT) in the range of 2000 K and lamps implemented with LEDs with CCT in the warm 3000 K, neutral 4000 K and cold 5500 K ranges. All of them have effective luminous fluxes in the range between 1000 and 5000 lm and incorporate type II class photometric diagrams according to the Illuminating Engineering Society of North America (IESNA) classification system for light distribution patterns, as published in its ANSI/IESNA RP-8-14: Road Lighting Standard [
22].
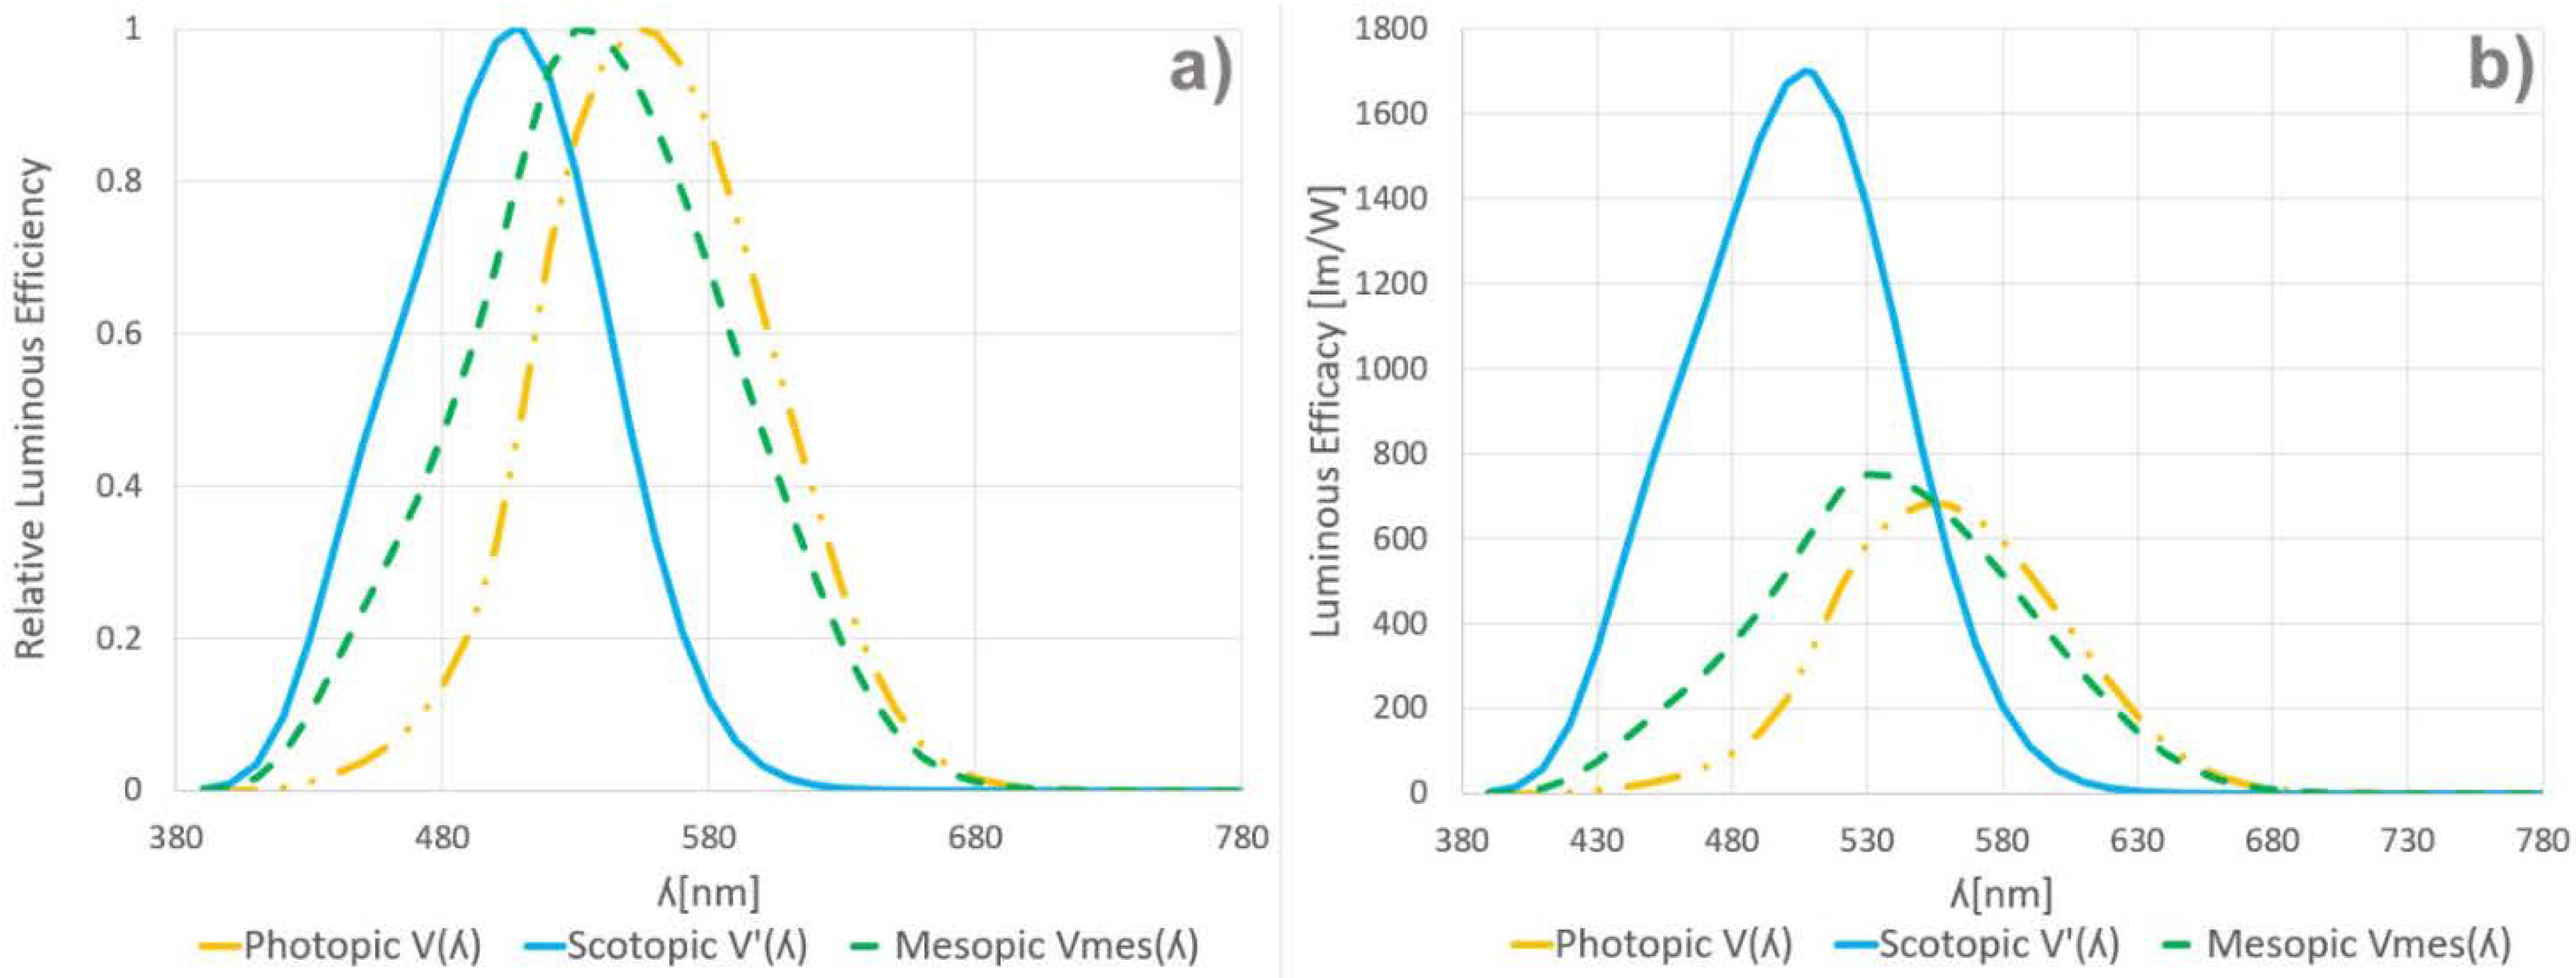
The photometric spectrum of a selection of 12 pieces of sample equipment, including 3 different units with each one of the detailed emission engines, was characterized using a spectrometer model MK350 S Premium Advanced Spectro-Flicker meter by UPRtek. The measurements of each of the luminaires were taken already installed in field. For each group, an average emission spectrum was established with the 3 respective measurements. The values of the curves obtained are represented in
Figure 1.
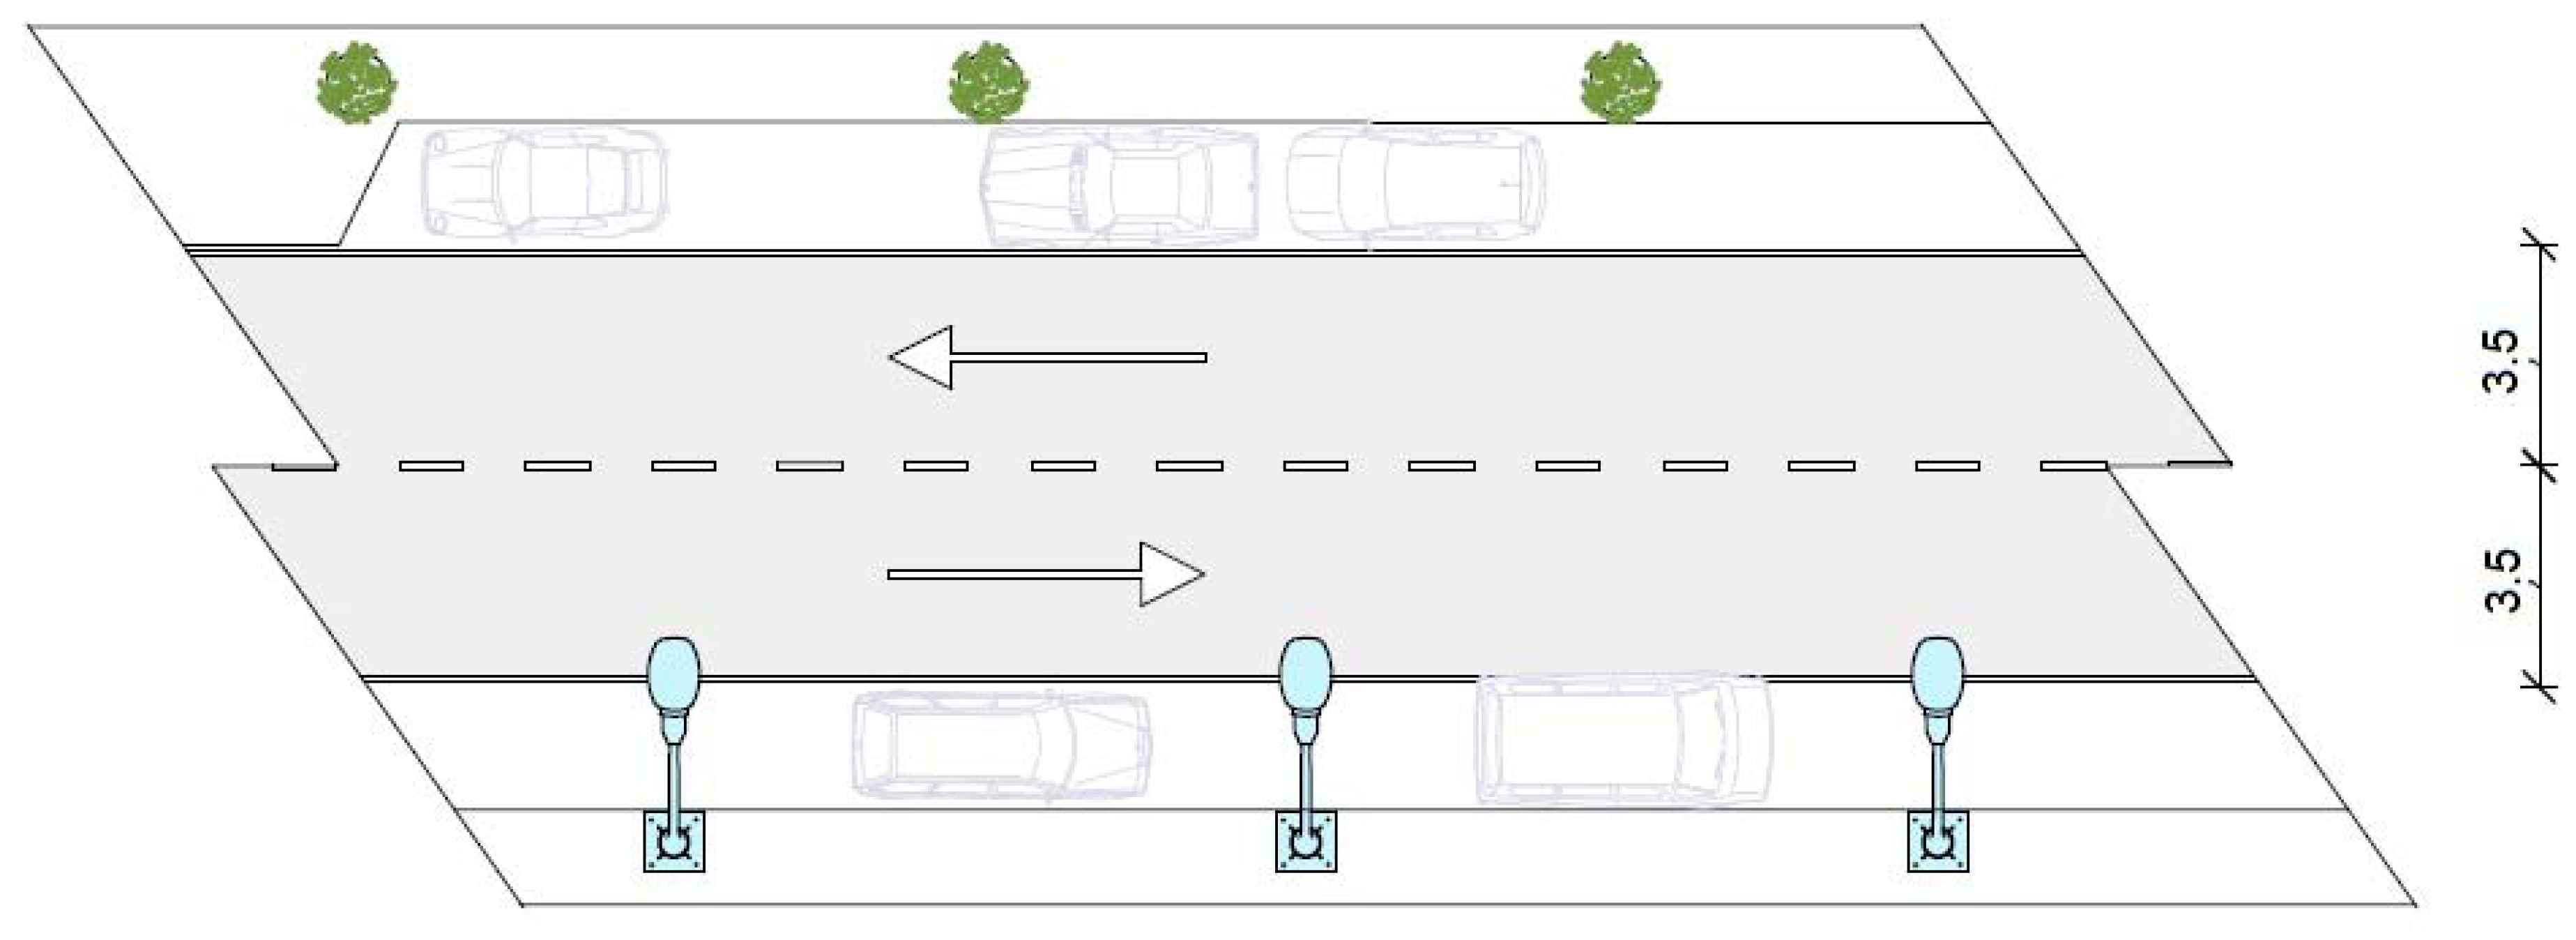
A reference road model was selected for the study. It was classified according to the standard EN 13201-2: 2015, Road lighting–Part 2: Performance requirements [
23]. A street configuration, typical of a residential neighborhood in an urban environment, was used. It consists of a two-lane single road, with low traffic intensity, moderate traffic speed restrictions, low ambient light, absence of major crossroads and vehicle parking on both sides, as presented in
Figure 2.
According to the reference standard selected [
23], our road is classified as an ME6 setting. According to this, a mean luminance (L) from the road surface is required in the range between 0.30 and 0.36 cd/m² (maximum over lighting allowed: 20% surpass of the value assigned to this classification); a minimum value of global uniformity (U
o) of 0.35; a minimum value of longitudinal uniformity (U
l) of 0.40, and a maximum value of the disability glare measured as a threshold increment (f
ti) of 15%.
The proposal uses, as starting data, the photometric parameters required by the standard used as regulatory reference and the emission spectrum diagram of the sources that are being analyzed. Then, the first step needed is to transform the photopic luminous flux provided by the manufacturer of the luminaire into its equivalent mesopic luminous flux. For this purpose, the CIE recommends the use of the MES-2 photometric system [
14]. It works in the 0.005–5.00 cd/m² interval and regulates the transformation according to Equation (1).
where “V
mes(ʎ)”, “V(ʎ)” and “V’(ʎ)” are, respectively, the mesopic, photopic and scotopic efficiency curves. “M(m
2)” is the normalizing function that makes that the mesopic spectral luminous efficiency function “V
mes(ʎ)” reaches the maximum value of 1, and “m
2” is the proportionality factor that determines the contribution factor of each form of vision.
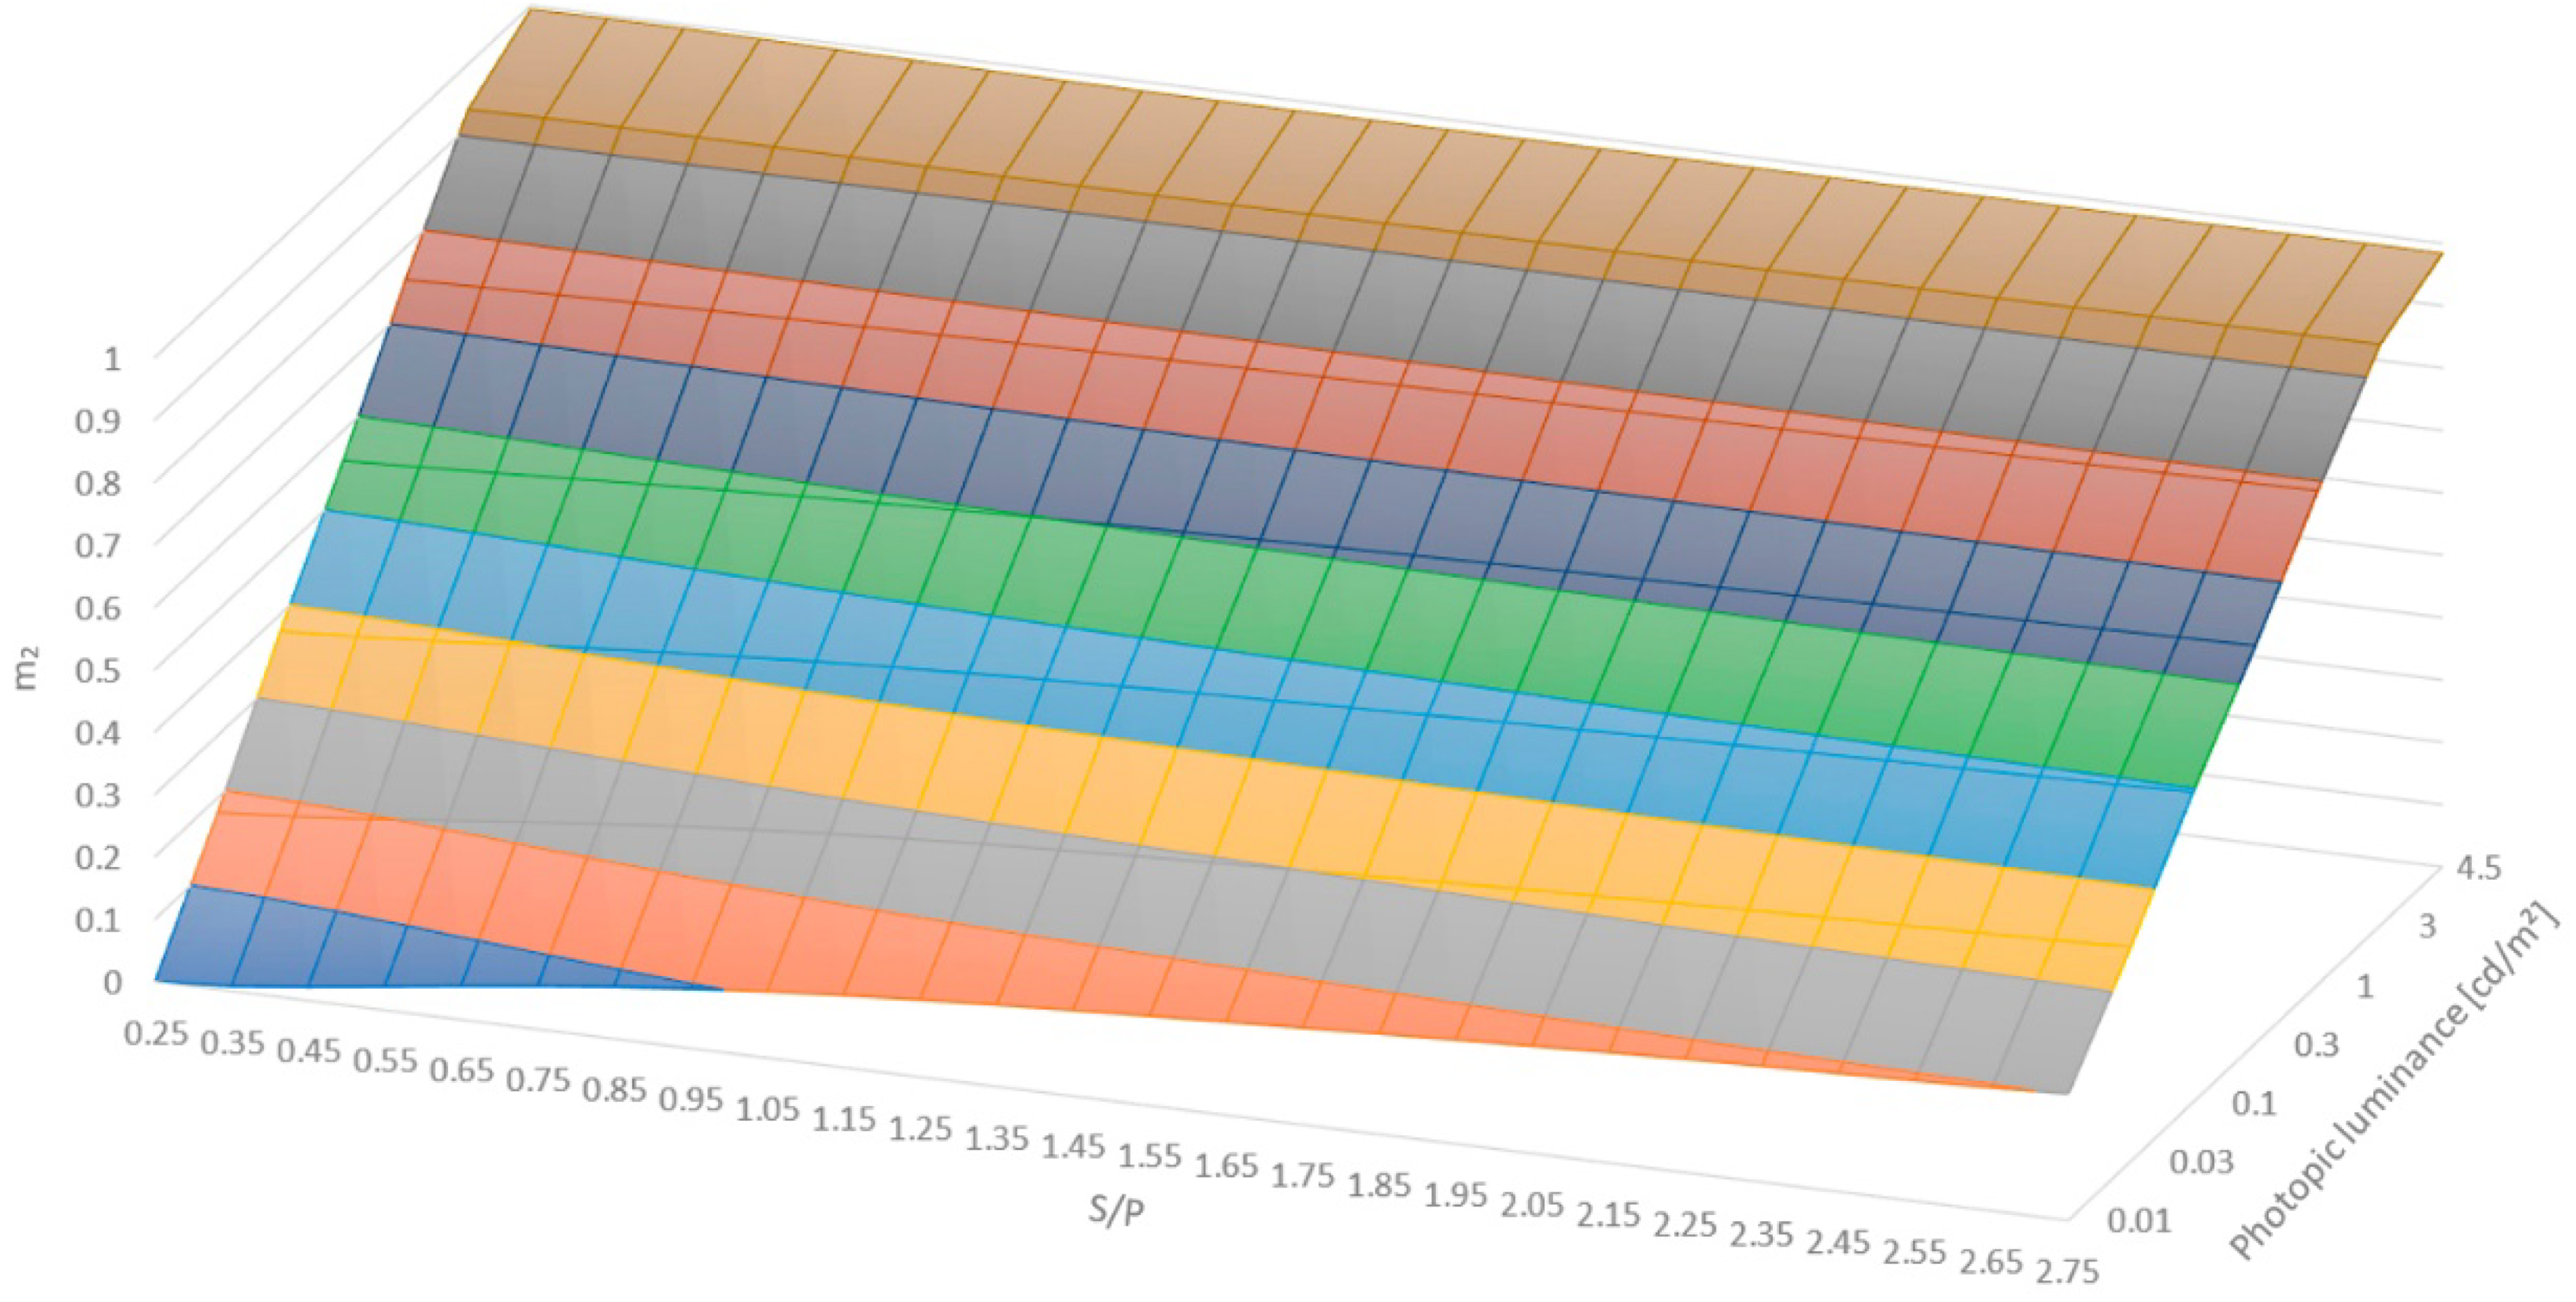
To determine “m
2”, instead of using the iterative procedure established for this MES-2 photometric system, we have constructed a regression surface from the solutions tabulated by this international association [
14]. The mathematical expression that defines said surface, and that allows us to determine the value of “m
2” based on the S/P (Scotopic vs. Photopic) ratio and the photopic luminance required by the EN 13201-2: 2015 [
23], is presented in Equation (2), and the coefficients obtained are listed in
Table 1. This regression adjustment achieves, in all cases, values of the Pearson Product-Moment Correlation Coefficient (PPMCC) greater than 0.98. We graphically represent the surface which generates this equation in
Figure 3.
where “L” is the luminance value (cd/m²) measured on the road.
The S/P ratio is defined as the relationship between the scotopic and photopic luminous flux and is determined by Equation (3) [
13].
where “Φ
e,ʎ” is the relative irradiance of the emitter corresponding to each wavelength value in the range of 390–780 nm, “V’(ʎ)” is the curve of the scotopic luminous efficiency values and “V(ʎ)” the analog evolution of the photopic luminous efficiency values.
Once the luminous efficiency curve “V
mes(ʎ)” was determined, the Mesopic vs. Photopic ratio (M/P) was calculated using Equation (4) analogously.
where “K
m” can be determined applying Equation (5).
Once the M/P ratio of each of the sources included in our study was calculated, we corrected the photopic luminance values provided by the manufacturers through their photometric files. We selected the Eulumdat File Format (ldt extension files) [
24] to operate and we edited them with a specific software tool for this file format: the LDT Editor of the DIAL company. With this application, we modified the original photopic luminance value with the corresponding mesopic values, obtained by multiplying the source luminance values by the M/P ratio adequate in each case.
The original and edited photometric files of the 66 selected luminaires were entered in the Dialux light simulation software (Version 4.13) (also created by the DIAL company) and different schemes for each of the 132 work files were created using its Vial Editing Module. The geometric diagrams of the road and it surrounding elements were adjusted to the testing situation established for this study and given previously in
Figure 2. The arrangement of the light points was planned using the following criteria [
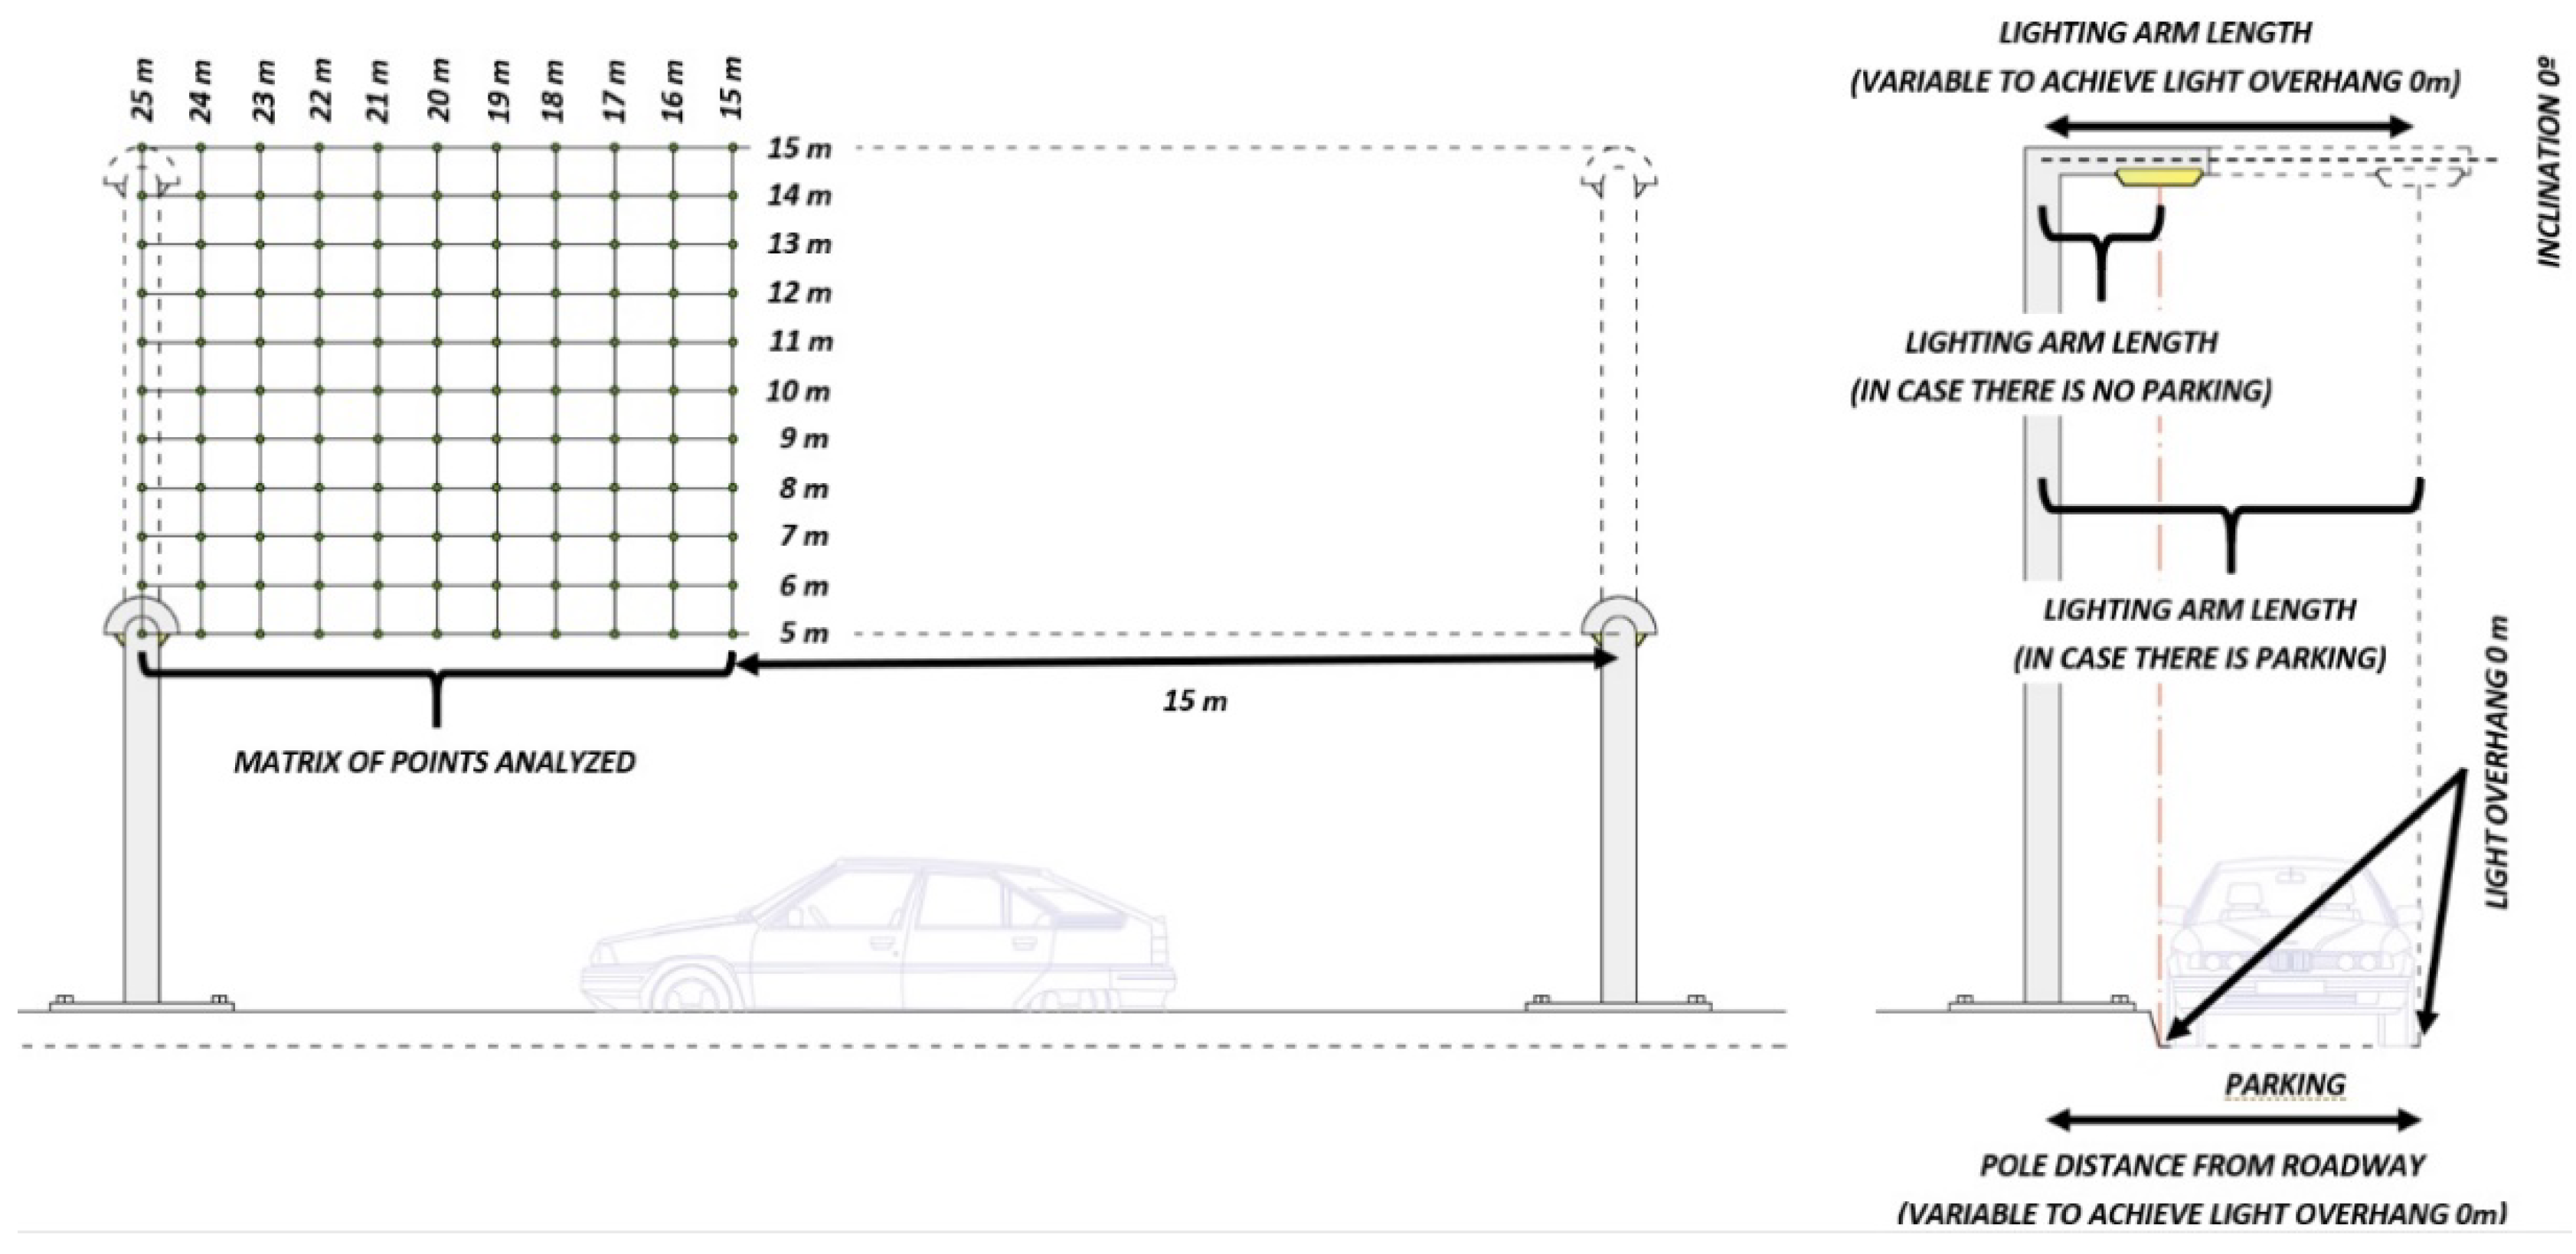
25]: unilateral arrangement if the ratio of road width/mounting height is less than or equal to 1.2, staggered if the ratio is greater than 1.2 and less than or equal to 1.5 and paired for ratios greater than 1.5. In our case, the unilateral disposition was the recommended solution. We establish fixed values of the following parameters: inclination of the luminaire of 0 º and an extension of the point of light over the road of 0 m. We use the distance between the poles and the height of the light point as independent variables with a limited range of variability: the first variable between 15 and 25 m and the second between 5 and 15 m. In both cases, the variation step used was of 1 m. This establishes an analysis matrix with a total of 121 positions, as shown in
Figure 4.
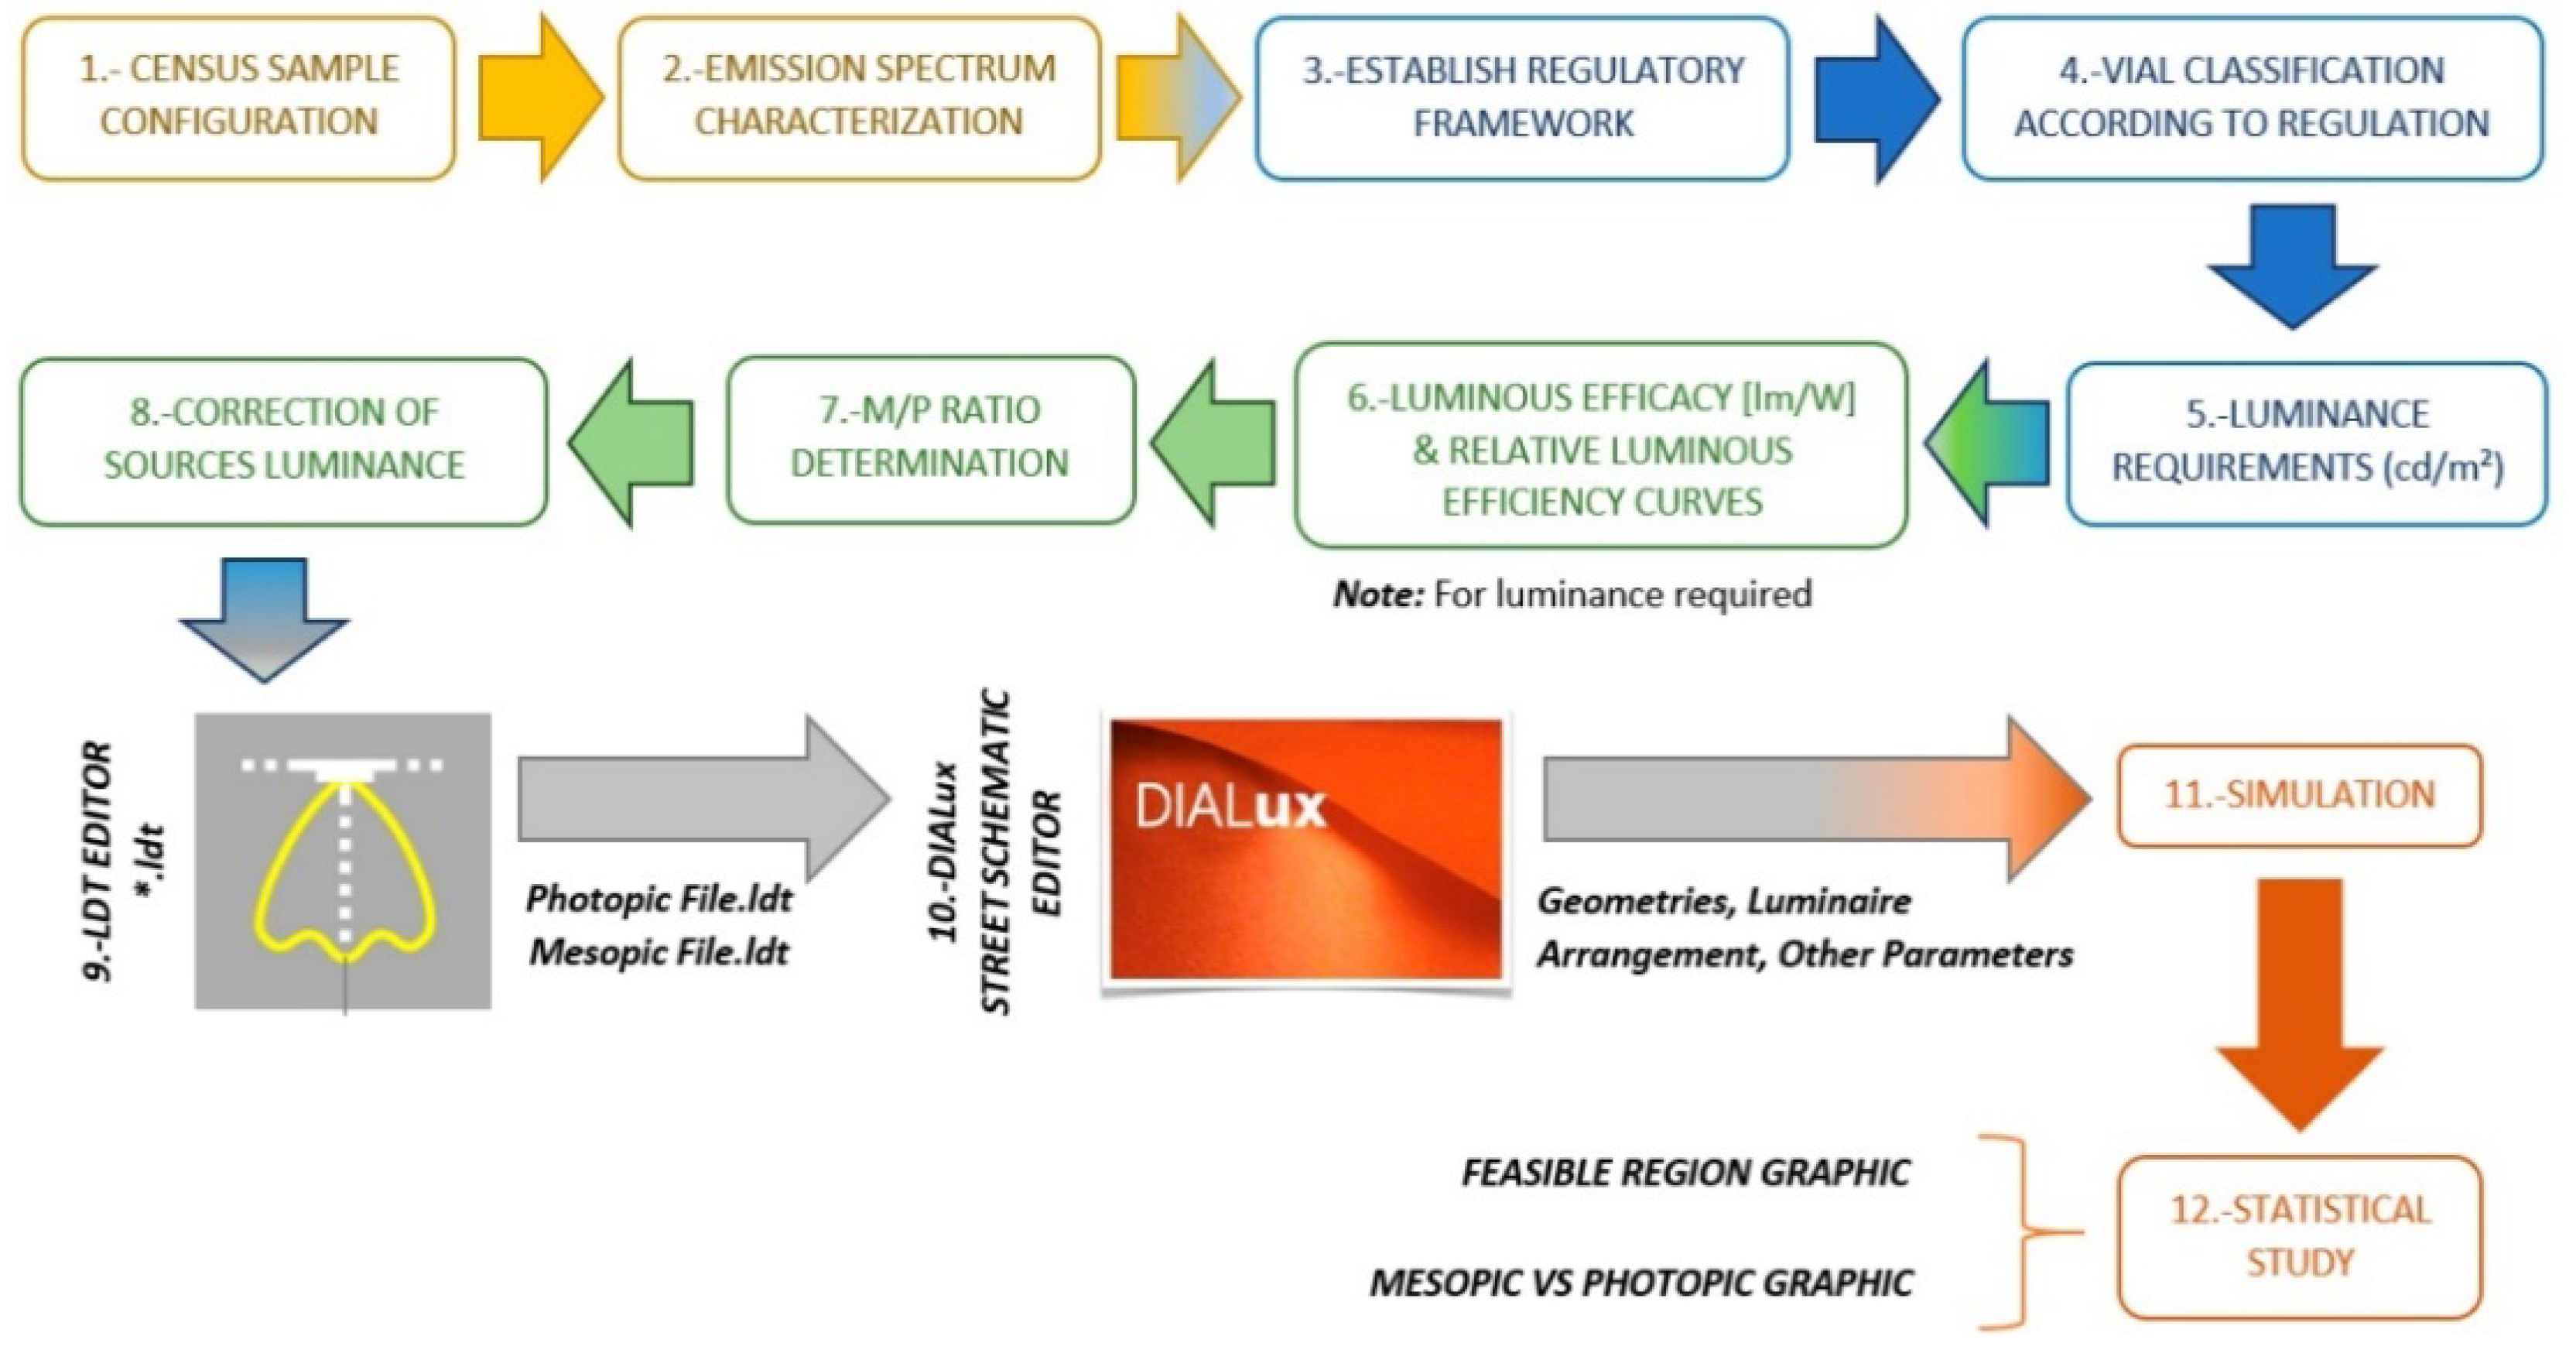
We simulate each of these scenarios, and all the solutions whose interdistance between poles and luminaire height configurations that did not met all the requirements for an ME6 type vial were discarded. With the remaining viable results, a statistical study was conducted. Based on the photopic luminance of the luminaire, we analyze the admissible interdistance range between poles, the interdistance and height ratio and the percentage of variation of the W/m² ratio in case of considering, or not, the mesopic vision mechanism. To summarize the results, the flow diagram of the proposed method is detailed in
Figure 5. Field data collection was carried out, as shown in
Figure 6.
3. Results
The mesopic luminous efficiency and efficacy curves, depending on the proportionality factor m
2, which in turn depends on the S/P ratio of the light source, are different for each of the four classes of luminaires established in this study. However, the variation trend observed in all of them are similar.
Figure 7 shows the calculated variations of these two parameters for the white light LED luminaire profile with a neutral CCT.
The values obtained for the M/P ratio associated with each different type of light source, as grouped in the study, are presented in
Table 2.
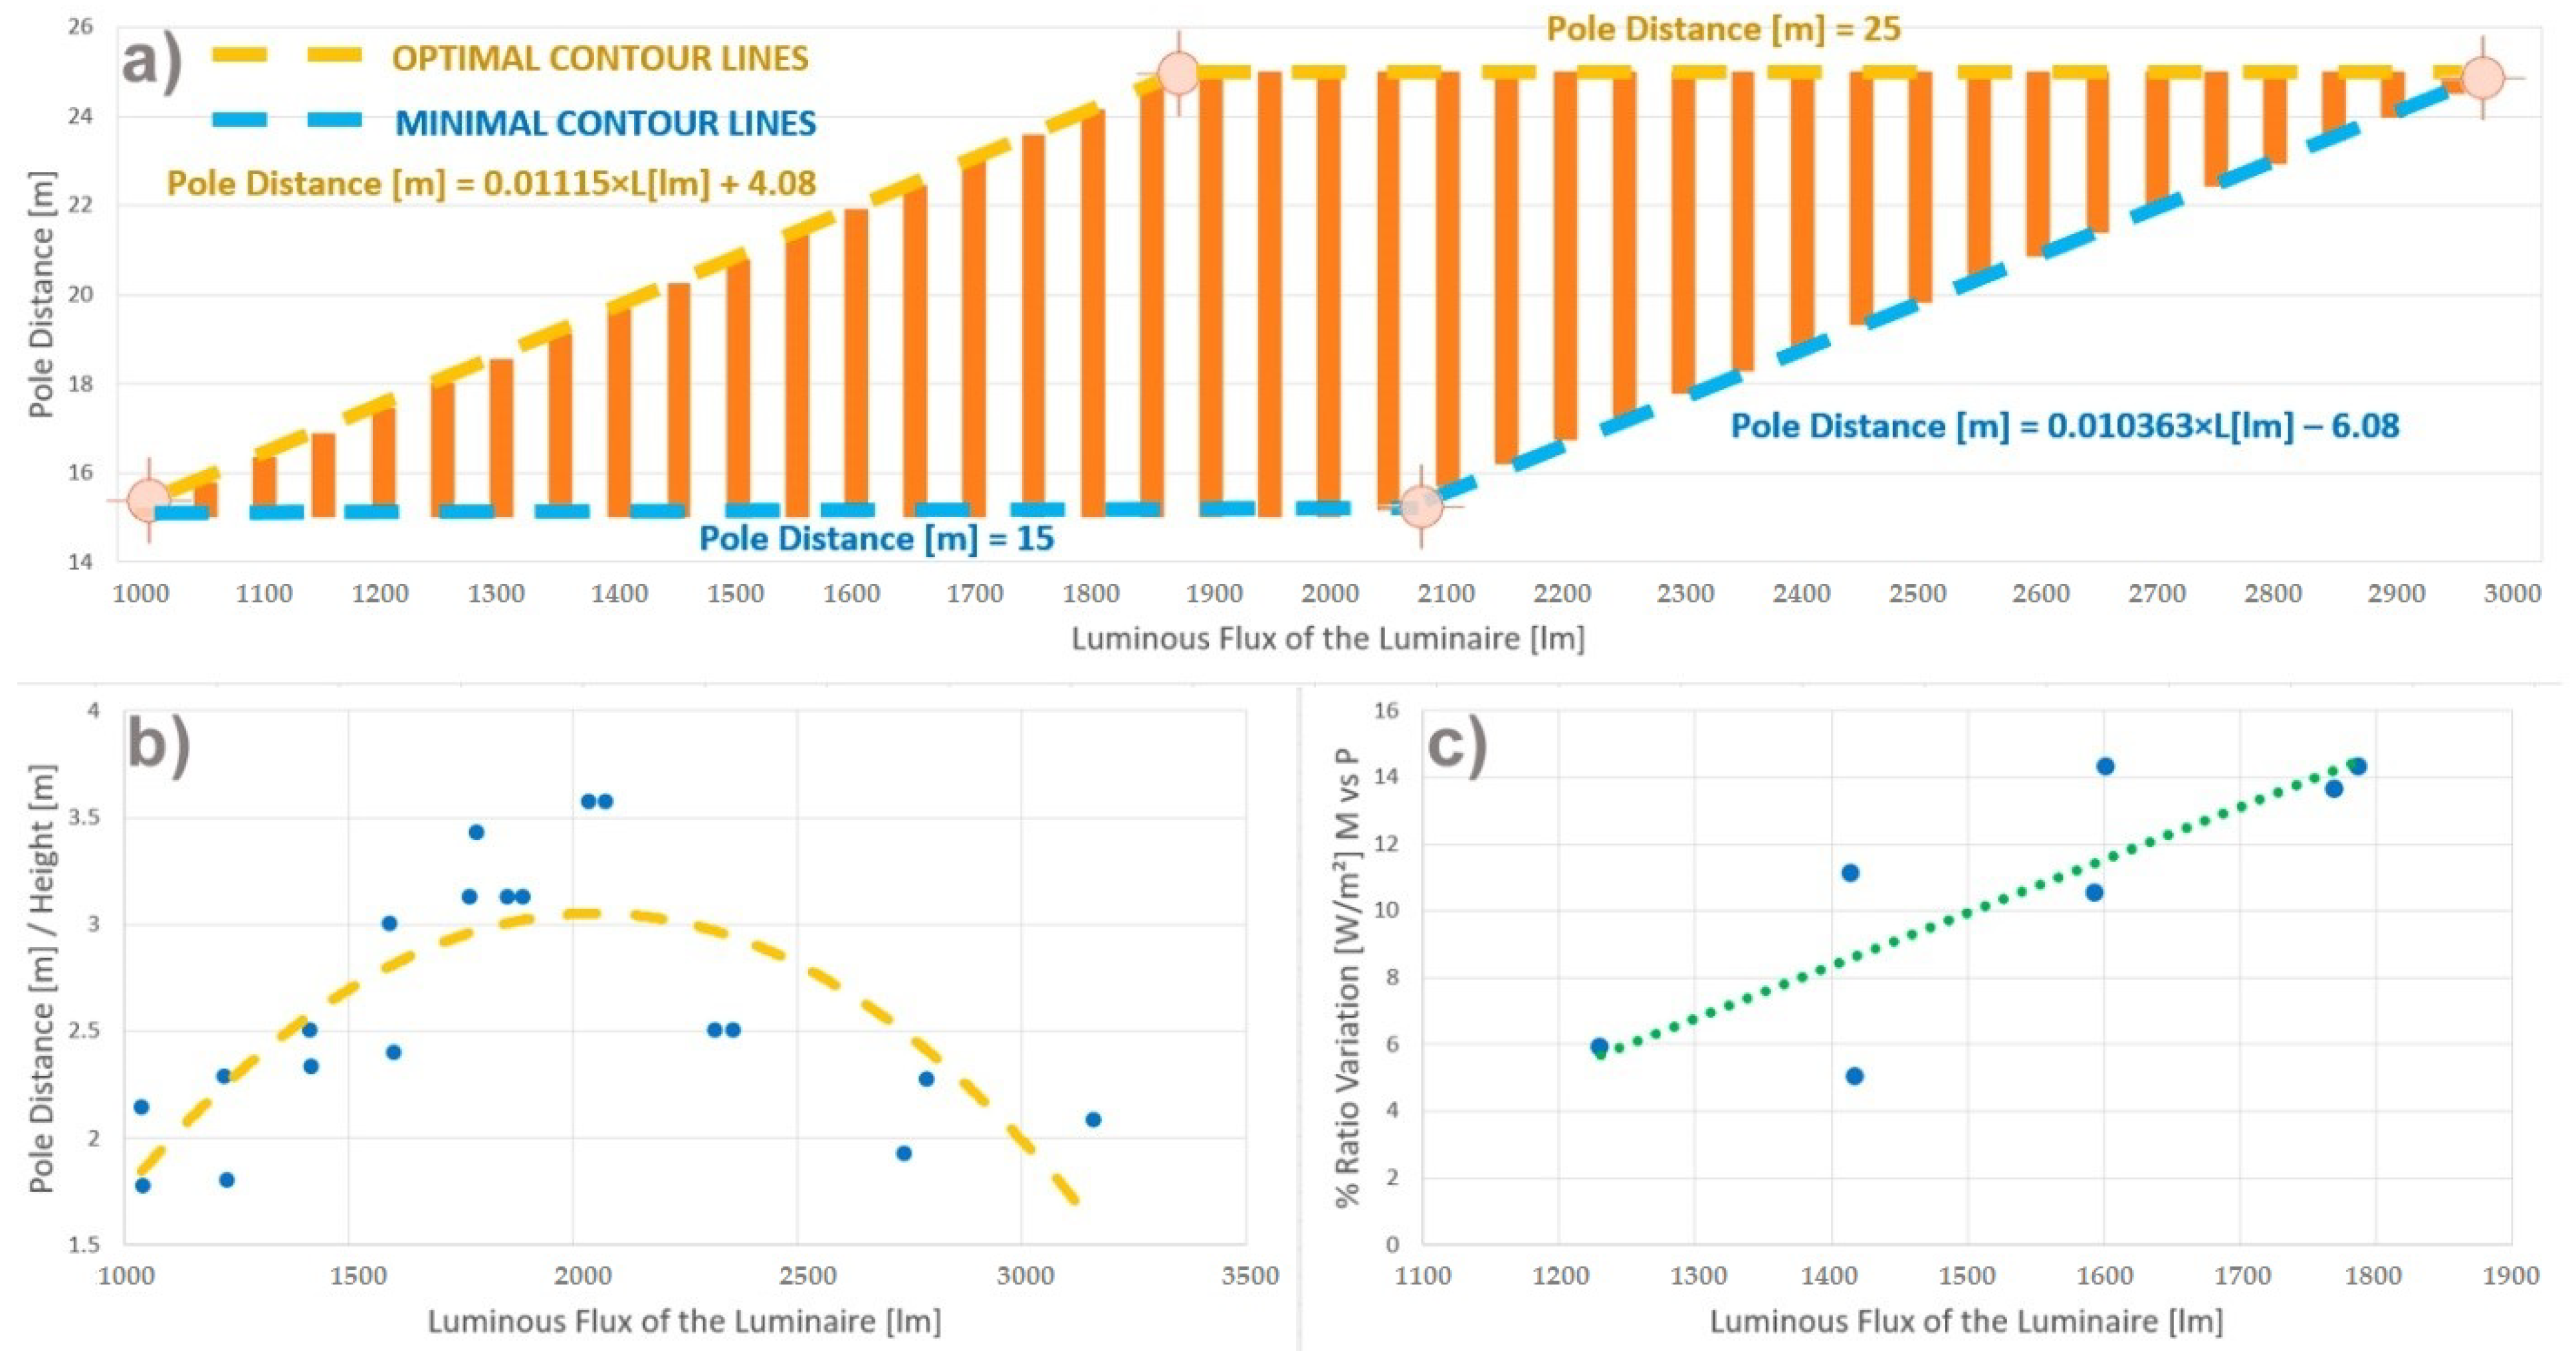
The relationships between the photopic luminance of the lighting equipment and the interdistance value between poles, the percentage of variation of the ratio of energy requirements of the installation using mesopic luminance instead of the initial photopic values, and the quotient between the interdistance and height of the light points (applying the mesopic correction), are collected in three graphs, grouped in both
Figure 8 for HPS luminaires and in the
Figure 9 for neutral white LED luminaires.
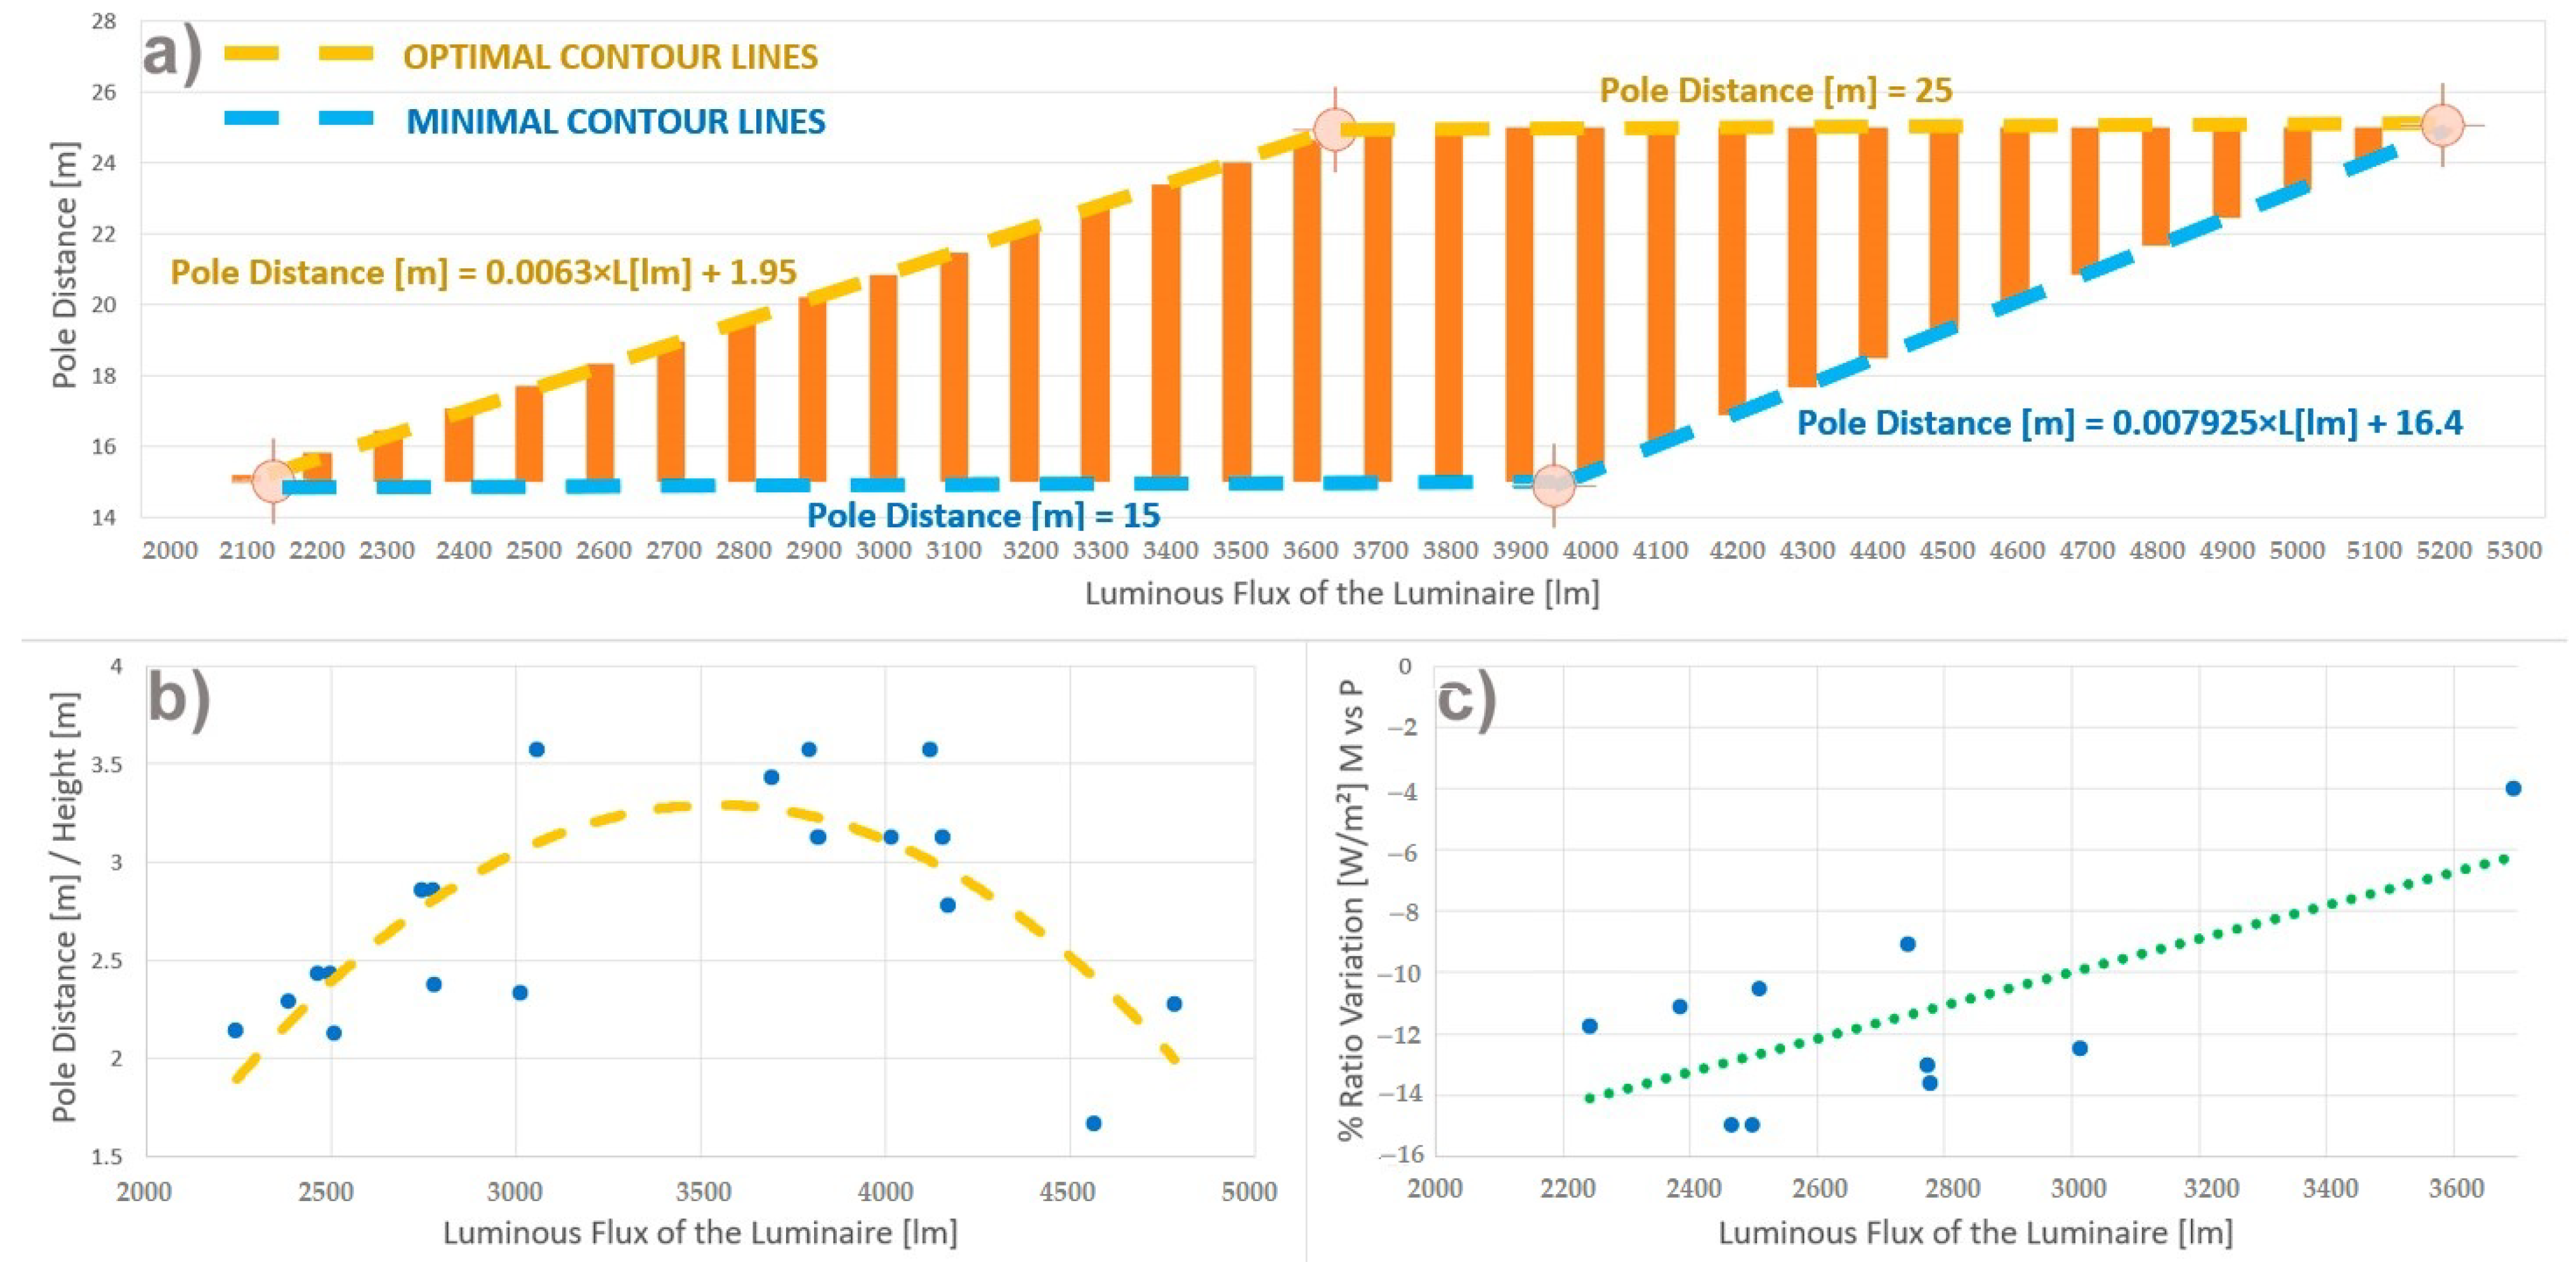
The upper graph in
Figure 8 and
Figure 9 represents the feasible region of solutions that meet our regulatory requirements. The contour of this region is delimited by four lines that include, two by two, the optimal and minimum compliance solutions. The former collects the solutions for each luminaire with the highest interdistance value between poles and minimum height, and the second the solutions with the lowest interdistance between poles and maximum height. The lower left graph shows the evolution of the Pole Distance/Height relationship corresponding to the solutions of the optimal contour lines. The lower right graph shows the evolution of the difference in energy requirements found necessary to fulfill the regulation requirements considering mesopic vision instead of the photopic in the solutions included in the optimal contour lines of each case.
In HPS luminaires, the analysis of the differences in energy requirements, using mesopic criteria corresponding to the simulations in the optimal contour line (see Equation (6)), yields for an average value of 0.48 W/m², a standard deviation of 0.10 W/m², a maximum value of 0.80 W/m² and a minimum value of 0.35 W/m².
Comparing the interdistance values between poles required by the simulations to belong to the same optimum line of Equation (6), in the range of 2200–3000 lm, an average reduction of 2.5 m in this interdistance is found when applying the mesopic criteria instead of the photopic values, worsening the installation cost.
Analogously, from the study of the neutral LED luminaires, the analysis of the differences in energy requirements using mesopic criteria corresponding to the simulations in the optimal contour line (see Equation (7)) yields for an average value of 0.10 W/m², a standard deviation of 0.02 W/m², a maximum value of 0.17 W/m² and a minimum value of 0.07 W/m².
However, comparing the interdistance values between poles found in the simulations included in optimum line of Equation (7), in the range of 1200–2000 lm, a mean increase of 2.0 m is achieved in the simulations using the mesopic luminance compared to the equivalent studies with a photopic configuration.
4. Discussion
LED technology has displaced HSP as the dominant technology in the outdoor lighting equipment market due to the improvement of basic technical parameters that are relevant to this type of installation, such as longer lifetimes, better operational reliability or shorter response times. Moreover, they have enhanced other lighting aspects, as reflected in a more complete and continuous emission spectra that better fits human mesopic vision [
26]. From the results presented in
Figure 8 and
Figure 9, insights can be normatively gained into how to illuminate our vial under study (ME6 classification); photopic luminances in the range of 2100–5200 lm are required in the cases of HPS technology. However, neutral white LED luminaires perform, with the same results, in the range of 1000–3000 lm.
Considering the values presented in
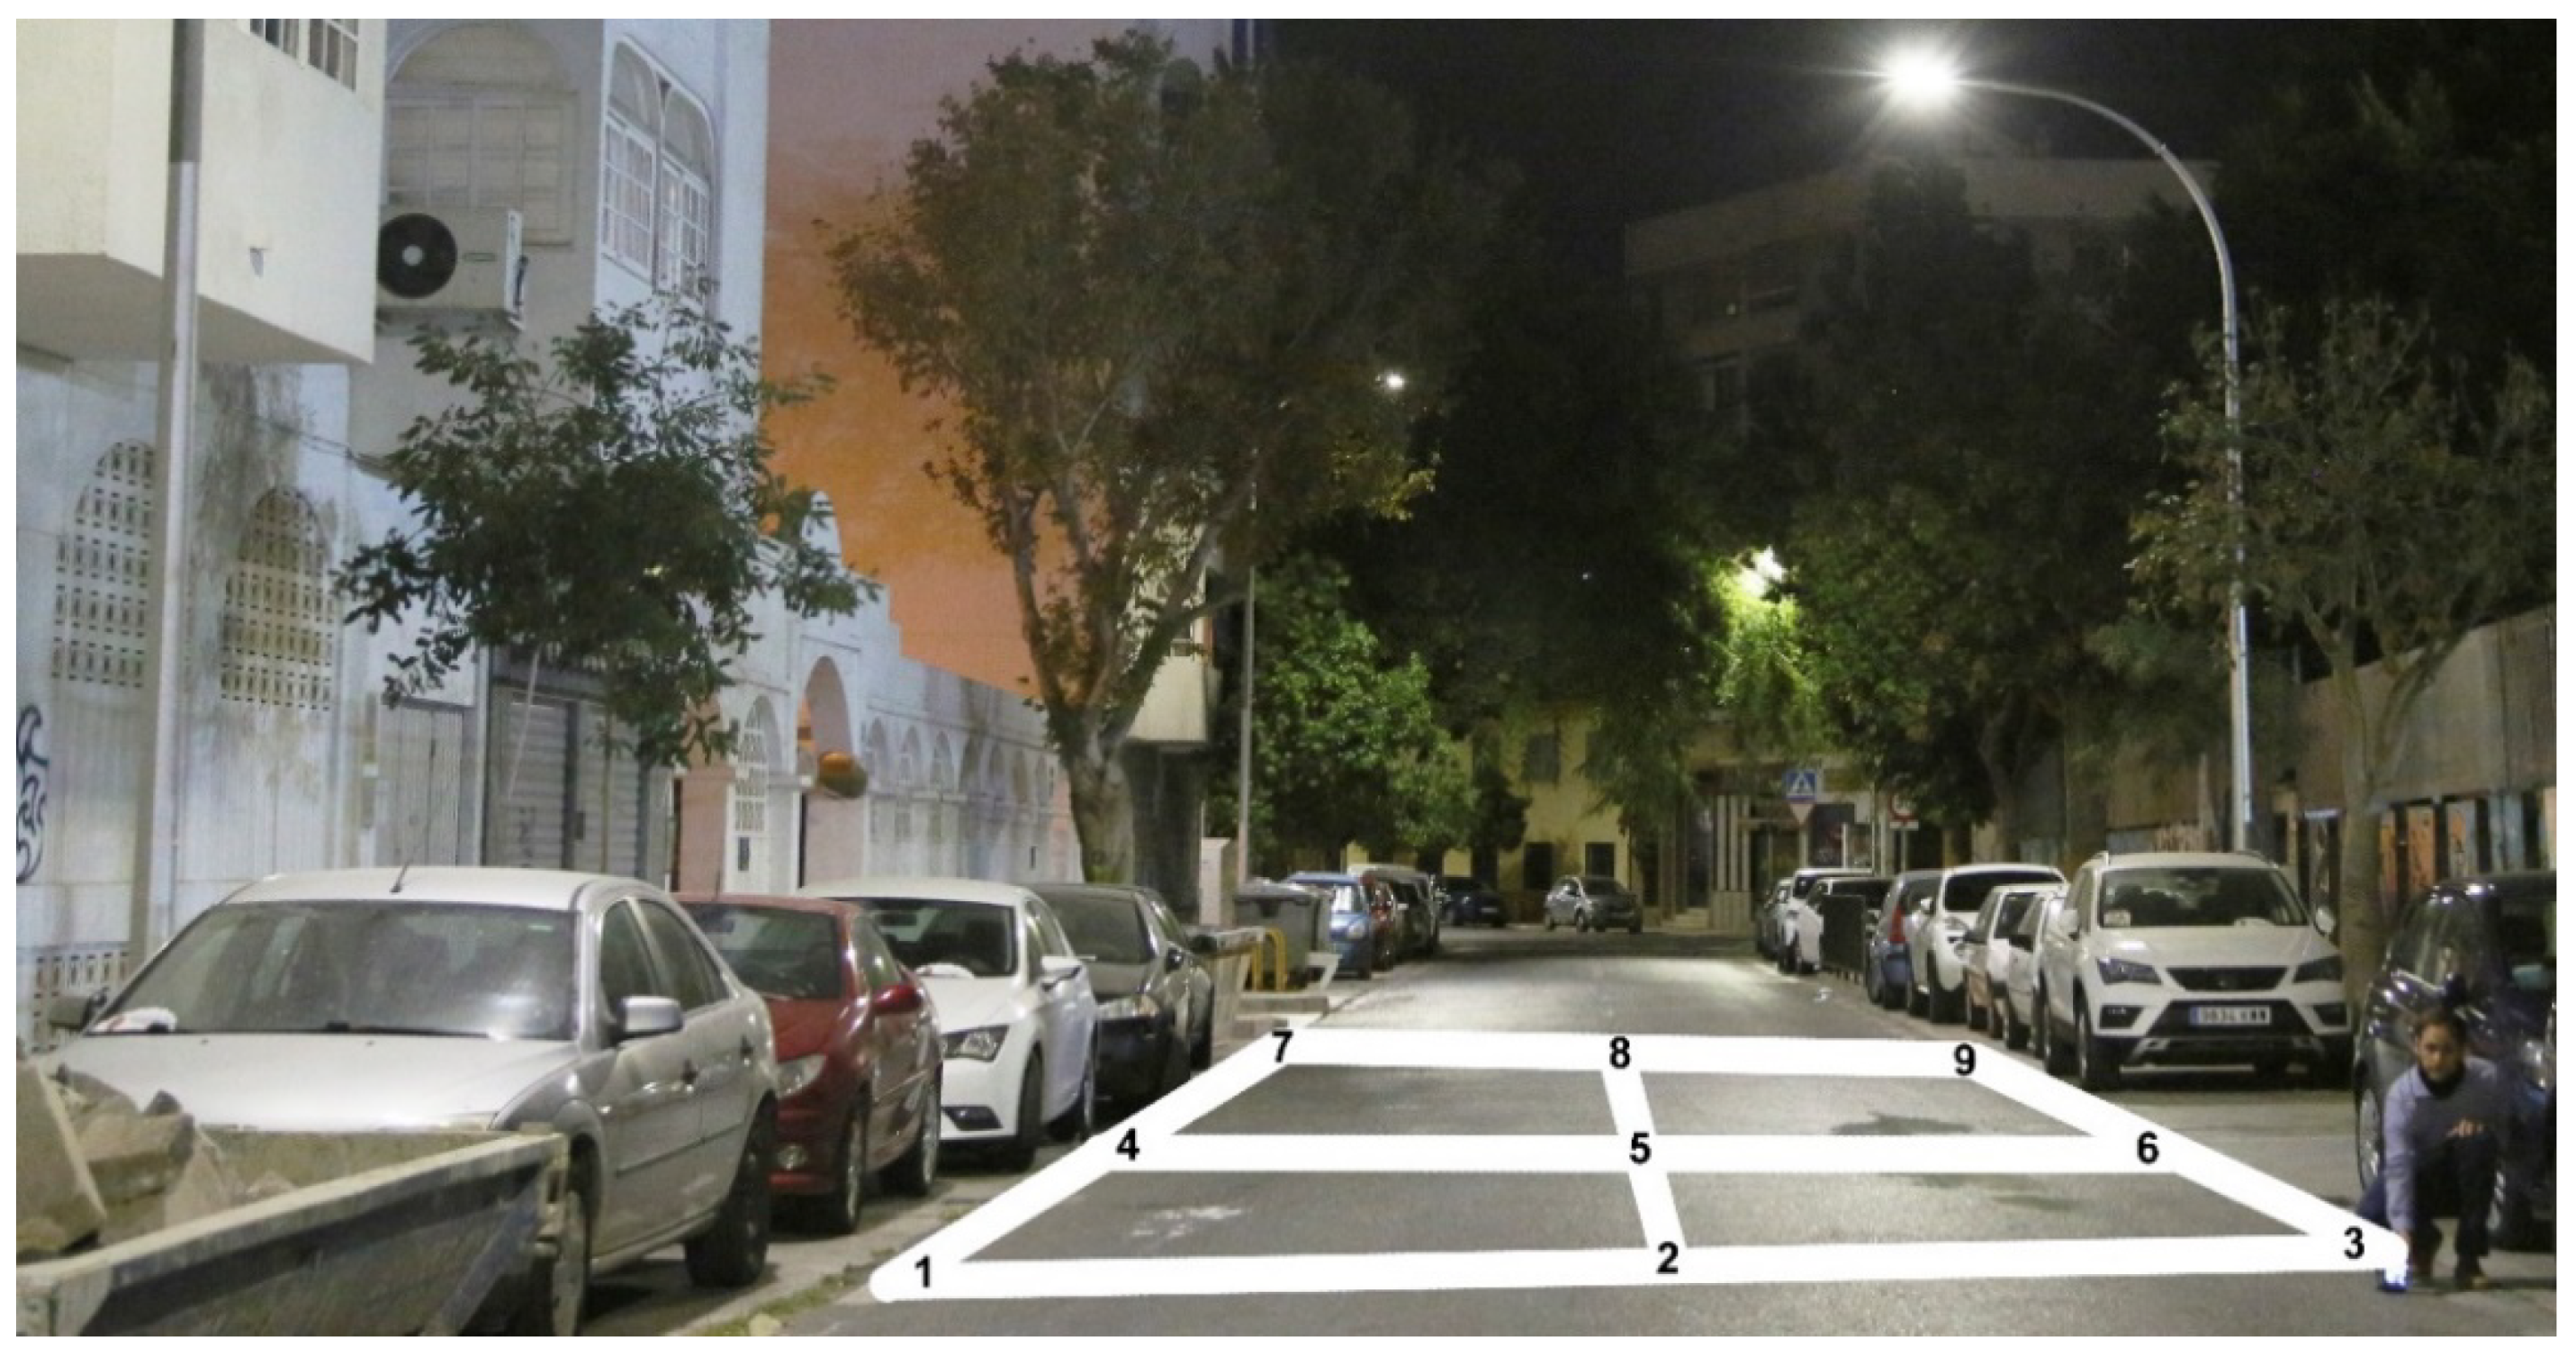
Table 2, we observe a higher value for the M/P ratio in the LED emitters than with the HPS bulbs—which, in this case, is lower than unity. This implies that the consideration of the mesopic vision will suppose a reduction in the effectiveness of the luminous flux from luminaires with these discharge bulbs, and an increment in the case of using LED lighting engines. In this last case, the improvement is proportionally bigger due to the increase in the percentage of spectrum radiated in the blue color region. Therefore, it can be inferred that in the context of artificial lighting of roads, with luminance values between 0.01 and 3.00 cd/m², our eyes see better in environments illuminated by LED sources than by HPS sources, improving the visual perception and increasing the CCT of the emitter for the same illuminance values measured on the road surface.
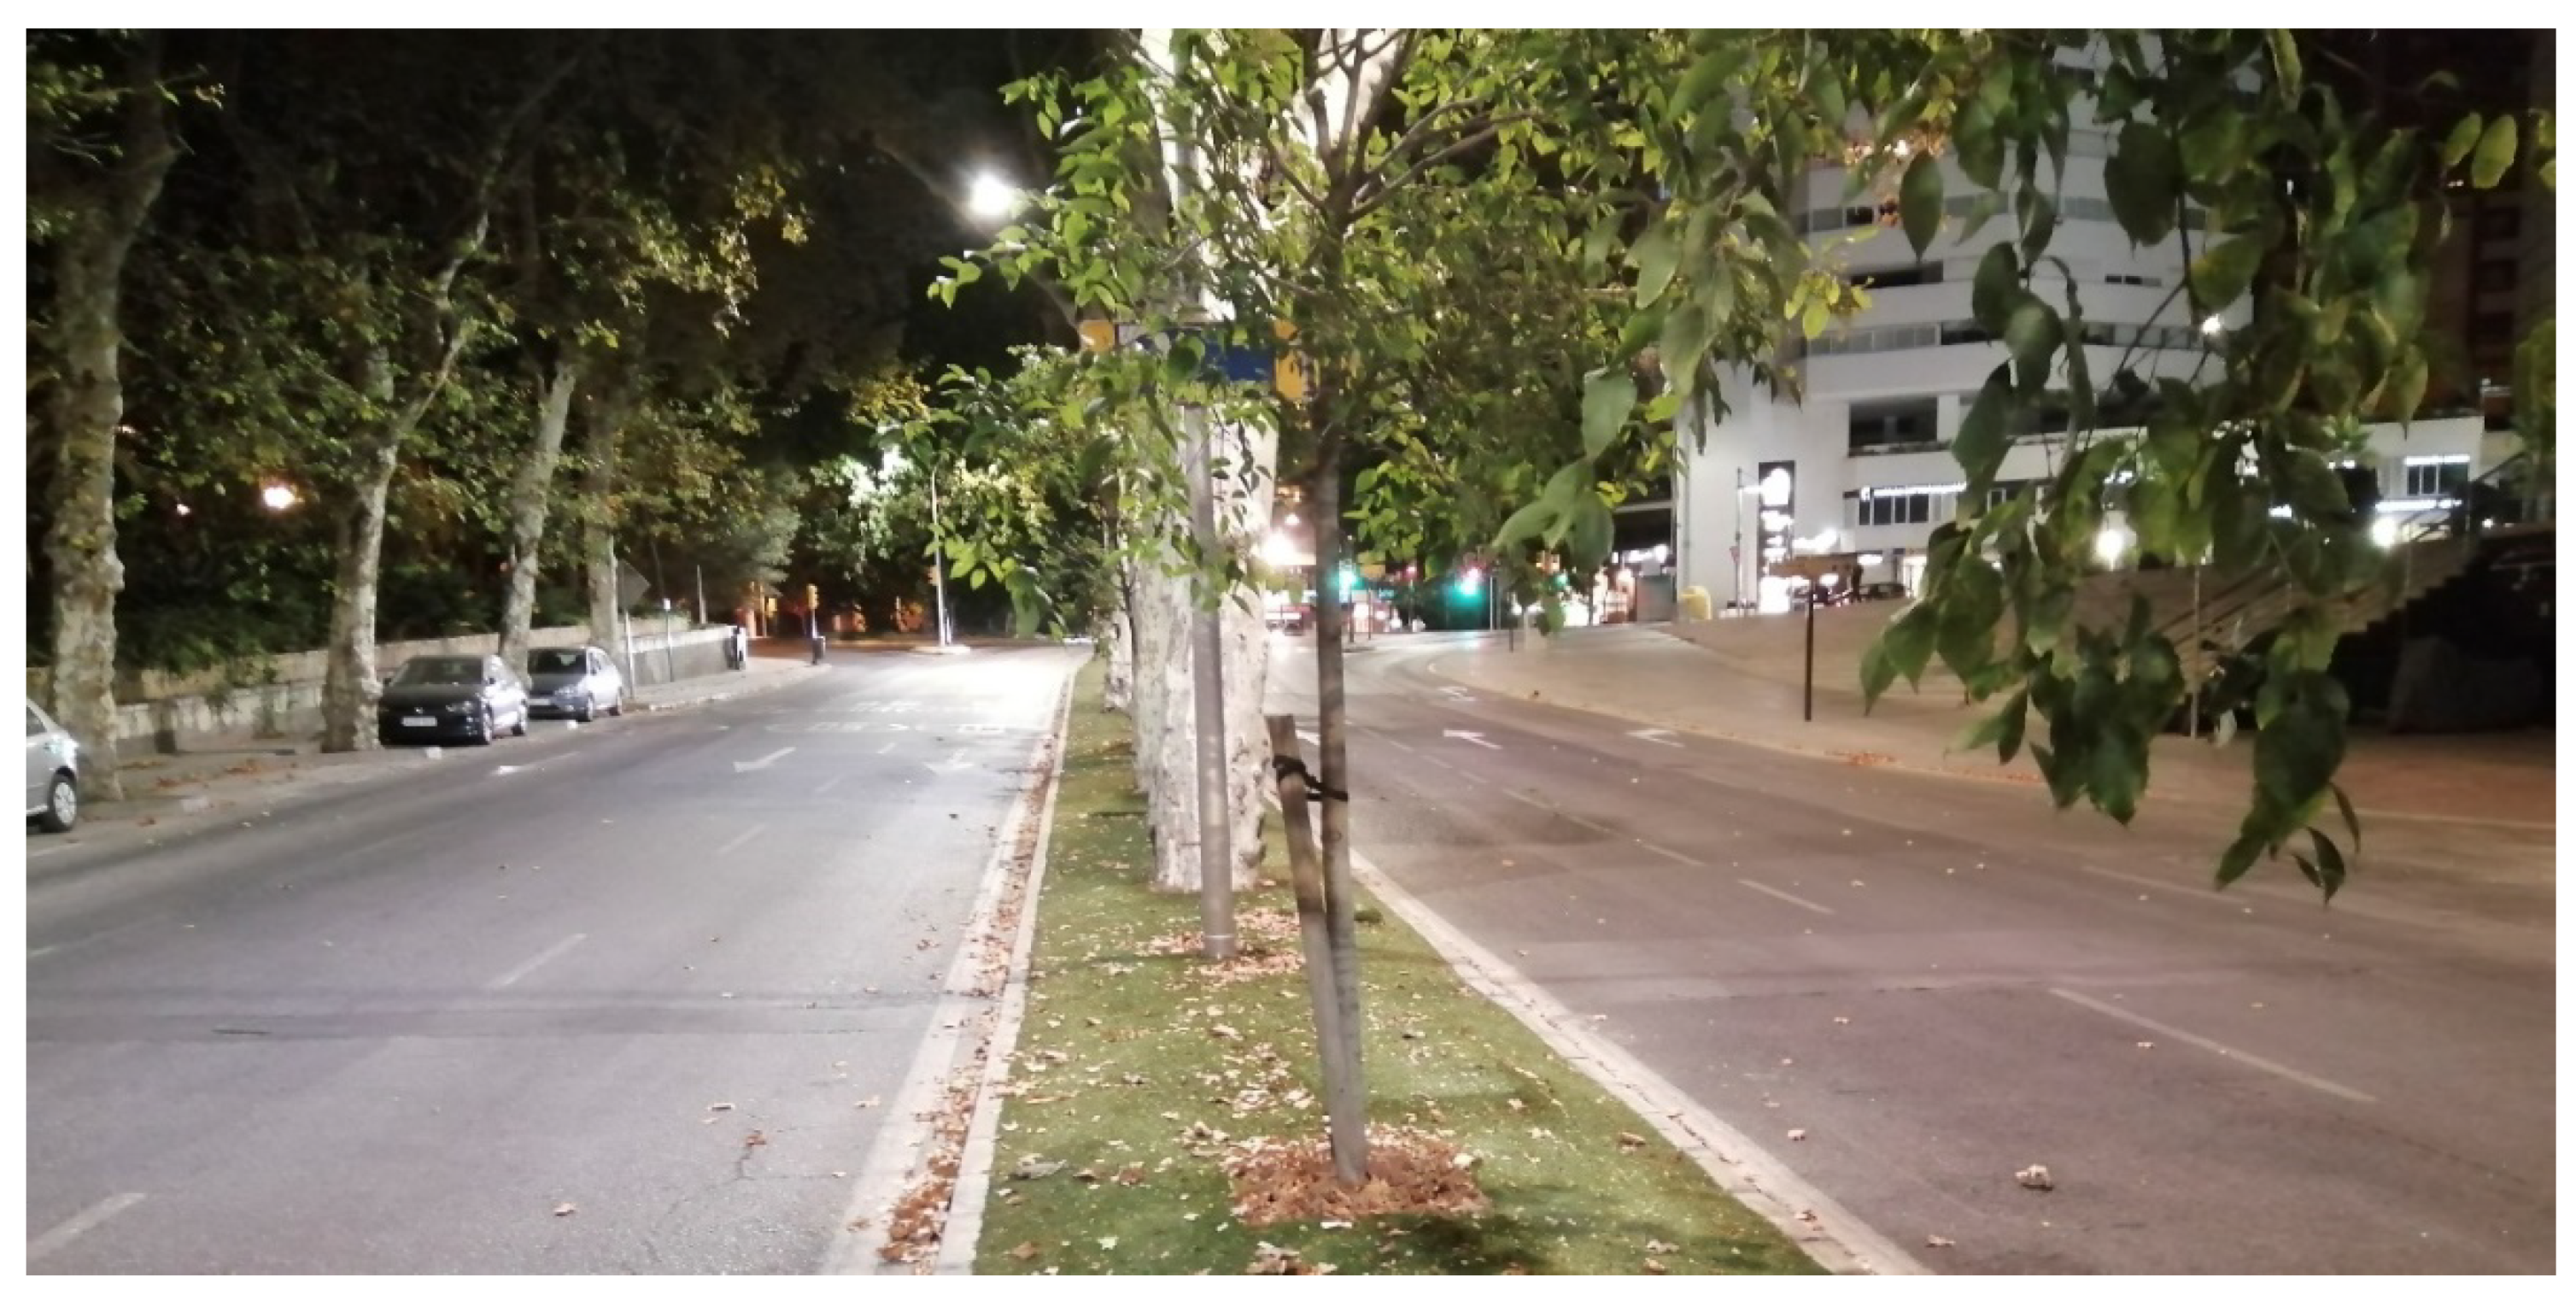
Figure 10 shows a photograph of a circulation road with two carriageways, both with asphalt corresponding to that used in the simulation: R3.007, where the one on the left is illuminated with 4000 K CCT LED luminaires, with an average illuminance (E
av) of 34 lx and a Color Rendering Index (CRI) of 75, and the one on the right with 3000 K LED sources and identical values of average illuminance and CRI. This conclusion is in agreement with the study of Davidovic et al. [
27] that reaches a similar conclusion, in this case, based on a “subjective evaluation of subjects realized through a questionnaire”.
Equally, Yao et al. [
28] reflect a better ability to distinguish shapes and colors in environments illuminated by sources with higher CRI values, and Casagrande et al. [
17] present similar conclusions through a combined analysis of both CRI and CCT values of light sources, proposing a surface equation that yields the best S/P ratios for light sources with higher CRI and CCT.
However, based on our results, the CRI variable, as defined, has relevance in this consideration but this is not major aspect since the red color (which is the major field in the changes of this result in LED luminaires) has a low weight in the Mesopic response curve (see
Figure 1). Spectrums with a greater amount of light in the green–blue range will be desirable, specifically in the wavelength that corresponds to the maximum of the associated mesopic curve according to regulatory requirements of the road under study. The improvement achieved in the quality of vision results in greater driving safety.
The average difference between mesopic and photopic luminance needed to fulfil the requirements of an ME6 road is determined in our analysis.
Table 2 shows that the photopic luminous flux provided by the manufacturer is reduced, in the adaptation to mesopic vision in HPS lamps, by 12%, but that in the case of LEDs this value is increased by 3% in warm CCT, 12% in neutral CCT and 15% in cold CCT ones. The accumulated difference between HPS and neutral LEDs is a total of 24%. This is a very significant percentage, which increases the effective benefits of lighting with diode-based luminaires beyond the superior capacity that is already obtained due to its best utilization factor (directional vs. omnidirectional light emission).
In
Figure 8 and
Figure 9, it can be observed that in the left inclined segment of the optimal contour lines the increase in luminance of the source is accompanied by a raise in the spacing between poles that maintain height values of between 7 and 9 m. The solutions of this line, as expressed in the lower left graphs, present an increasing trend of the pole´s distance/height relationship with the growth in luminance, until the maximum considered value (between 3.0 and 3.5) is reached. In addition, within the optimal contour lines, we find that the upper horizontal line, where the pole distance is equal to 25 m, corresponds to the selection of luminaires with a luminous flux higher than that which is strictly necessary. These cases would allow distances between poles of greater than 25 m, but, due to functionality criteria, this value was established as the maximum step in this study. Given this limitation, the methodology presents this value as constant. In this case, reviewing the lower left graphs, we observe a decreasing trend of the pole distance/height relationship with the increment of the luminance of the luminaires. This aspect is justified by the fact that, in order to avoid an illuminated envelope of the vial, it is necessary to increase the height of the light points. Considering the above, we can present, as the most desirable solution, the one that allows the biggest pole distance/height ratio. Thus, the most suitable solutions to illuminate our road will be those in the vicinity of the cut-off point between the two lines that make up the optimal contour.
Thus, these two figures offer a good evaluation data base to select luminaires for ME6 class roads: HPS luminaires with a photopic flux in the vicinity of 3500 lm and LED equipment with approx., 1900 lm. In these cases, 25 m pole spacing and pole distance/height ratios of above three achieve the best results. The exact values, in every case, will depend on the specific photometry of each piece of equipment, but the results should not evidence large differences if IESNA type II class adapted solutions are used [
22].
Finally,
Figure 8 and
Figure 9 also show us that the improvement or worsening of the energy requirements (in W/m²) associated with public lighting installations, relative to the consideration of mesopic versus photopic luminance, is not constant. We can approximate that percentage of variation to a different line for each technology and CCT as follows: For neutral LED technology, we can assume an average improvement of 10% (14% if the proposed solution is close to the cut of the lines belonging to the optimal contour lines), and, in the case of HPS discharge bulbs, we can assume an average deterioration of 10% (6% if the proposed solution is close to its optimal zone, as in the previous case). Any other specific value can be extracted from the given photopic luminance vs. M/P ratio curves.
5. Conclusions
This work assesses the effect generated by the correction of the photopic luminance of the luminaire to adapt it to a mesopic scenario using an M/P ratio that is obtained, in each case, considering the human mesopic vision, the spectral photometry of the light source to be used and the type of geometry of the road to be illuminated. This correction allows the design of more efficient lighting installations, adjusting them to the operation characteristics of the human eye for the characteristic luminance levels of artificial street lighting. This is an additional reason why HPS technology achieves poorer visual results compared to LED luminaires, as the former is adversely affected by the worse adaptation of its emission spectrum to the mesopic range of vision.
The consideration of the mesopic vision can suppose, for 4000 K LED luminaires with a photopic luminance in the vicinity of 1800 lm, an approximate reduction of 14% in the energy consumption required for an ME6. This is achieved with the reduction in the number of light points necessary to cover the entire length of the road, as the average distance between luminaires is augmented, on average in the simulations generated, by 2 m. This means, considering a distance between poles of 25 m, the elimination of 3.2 luminaires per km.
From the point of view of the calculation process of the electrical installations of these outdoor luminaires, this study has generated a more precise and adjusted power consumption forecast than the common ratios used for the power forecast of street lighting installations of 1.5 W/m². This makes it possible to avoid significant oversizing, which entails undesirable expenses. For an ME6 classification road with the adaptation to a mesopic luminance and the optimization of the height/interdistance ratio of the light points, we obtained the following mean value of energy requirements to meet the regulatory requirements: 0.48 W/m2 for HPS and 0.10 W/m2 for neutral LEDs. This means 77.5% less load forecast for HPS and 93% less for neutral LED compared to the previously indicated value. This same method can be applied to other common road configurations and used as a tool for the estimation and the design of their required installations, favoring effective decision-making from the design phase and contributing to the development of more sustainable and environmentally friendly cities.


 ,
, 


