Article

Socioeconomic Status Changes of the Host Communities after the Rohingya Refugee Influx in the Southern Coastal Area of Bangladesh

1
Department of Environmental Design, Kyushu University, Fukuoka 815-8540, Japan
2
Department of Agricultural Extension Education, Bangladesh Agricultural University, Mymensingh 2202, Bangladesh
3
Department of International Studies, The University of Tokyo, Chiba 277-8581, Japan
4
Faculty of Engineering, Nagasaki University, 1-14, Bunkyomachi, Nagasaki 852-8521, Japan
*
Author to whom correspondence should be addressed.
Sustainability 2021, 13(8), 4240; https://0-doi-org.brum.beds.ac.uk/10.3390/su13084240
Submission received: 13 March 2021 / Revised: 6 April 2021 / Accepted: 9 April 2021 / Published: 11 April 2021

Abstract

:
The refugee influx from Myanmar, known as Rohingya refugees, is a serious concern for global refugee issues. Bangladesh currently hosts one million Rohingya refugees in the coastal district of Cox’s Bazar. Considering the number of the refugees, in addition to the humanitarian concerns, they are also creating pressure on the local host communities. This study explored the socioeconomic changes of the host communities after the refugee influx. In order to fulfill this study’s objectives, 35 villages near the Rohingya refugee camps from the coastal district of Bangladesh were surveyed. In the villages, 10% of households were surveyed in 2016 and also in 2020, covering 1924 and 2265 households, respectively. A temporal comparison of the host community’s socioeconomic status between 2016 and 2020 was conducted in order to determine the changes after the recent refugee influx. This study found that the local community’s socioeconomic status degraded. The annual income decreased by 24%, which is unusual for a country with over 6% gross domestic product (GDP) growth in recent times. The income decreased from all livelihood options except farming, which could be related to the availability of cheap labor and the high demand for commodities. The villages were clustered using k-means, and 20 villages were found to be affected after the refugee influx with degraded socioeconomic status. The host community’s general perception was initially positive, but later turned negative toward the refugees. This study will be important for the government and donor agencies to develop strategies to properly manage the refugee camps and adjacent host communities.

1. Introduction

In Myanmar’s Rakhine state, atrocities resulted in millions of refugees fleeing to other countries, causing tremendous regional disarray. Myanmar’s geopolitical issues affected other neighboring countries in the region, especially Bangladesh. At one point, the refugee exodus to Bangladesh became one of the fastest-growing refugee populations in history [1]. The refugees and the related humanitarian crises have become serious concerns, as the number of refugees is the highest since the Second World War. Worldwide, 79.5 million people have been forcibly displaced, of whom 26 million are refugees [2]. According to the 1951 Convention and the 1967 Protocol therein, a refugee is someone: who owing to a well-founded fear of being persecuted for reasons of race, religion, nationality, membership of a particular social group, or political opinion, is outside the country of his nationality and is unable or, owing to such fear, is unwilling to avail himself of the protection of that country. [3]
Surprisingly, 85% of the refugees are hosted in developing countries, and a staggering 27% are hosted in the least-developed countries [2].
This study focuses on the Rohingya refugees, where millions of displaced Myanmar nationals are stranded in refugee camps in the southeastern coastal area of Bangladesh. The Rohingya are an ethnic minority group from Myanmar’s Rakhine state who are primarily Muslim, and are presently considered “the most persecuted minority in the world” [4,5]. The Rohingya have been systematically denied their civil, political, economic and human rights by their own government since the country’s independence. The Burmese 1982 Citizenship Law institutionalized the Rohingya’s statelessness, as their Islamic religion and Indo-Aryan appearance do not conform with the “Burmese citizenship standard” [6]. Since then, episodes of state-sponsored violence and oppression have been committed against the Rohingya, resulting in hundreds of thousands fleeing the country. The latest episode of violent attacks against the Rohingya was in August 2017, which led many Rohingyas to seek refuge in neighboring countries, and the cumulative number of Rohingya refugees in Bangladesh reached nearly one million [7]. The United Nations High Commissioner for Refugees (UNHCR) is an international organization which has provided coordinated support for refugees worldwide since its formation in 1950, in the context of the refugee crisis due to World War II. The UNHCR considers three options when a large scale refugee displacement occurs: voluntary repatriation, resettlement in a third country, or local integration [8]. In the Rohingya refugee situation in Bangladesh, repatriation failed, resettlement to a third country has not happened as only 1% of the refugees have been resettled to date, and local integration is a complex and long-term process [8,9]. More than three years have passed since the recent refugee influx occurred, but due to the political impasse between the two governments, it is more likely that the refugees will remain in Bangladesh, although repatriation is under negotiation [10]. However, public narratives suggest that the Rohingya refugees are unwilling to return due to their experiences of persecution and violence from their own government. Evidence from past crises illustrates that, once a person is displaced for six months, they are likely to be in exile for years. Eight out of 10 refugee crises last for 10 years or more, and one in five last for more than 30 years [11].
As a result, the short-term humanitarian crisis is evolving into a long-term refugee hosting situation involving more than a million refugees. Beyond humanitarian concerns, the sheer number of refugees creates pressure on the host community. In the case of hosting large number of refugees, the host community also suffers, but attracts less attention [12]. In addition to the direct impact on the host community, studies have strongly affirmed that a large-scale refugee influx can instigate significant environmental changes including deforestation, soil degradation, water resource depletion, and environmental waste [13]. The local community in the Teknaf Peninsula depends on natural resources including forests and farming [14]. Any type of environmental degradation will accumulate burdens on the host community. In order to manage the Rohingya refugees and mitigate their impact on the host community, it is important to understand the host community’s burden and suffering. In the case of hosting the Rohingya refugees, several empirical studies regarding different environmental degradation issues have been published, but there is a lack of empirical research regarding the impact on the host community [15,16,17,18]. This study aims to contribute to this knowledge gap by exploring the socioeconomic change on the host community after the Rohingya refugee influx. Therefore, the following objectives will be pursued: (1) assess the changes of the socioeconomic conditions in the host community after the refugee influx, (2) categorize the villages based on their socioeconomic changes due to the refugee influx, (3) identify the extent of the changes among different livelihoods, and (4) explore the host community’s problems and general perceptions regarding the refugee influx.
To the best of our knowledge, this is among the very few empirical studies conducted by the scientific community with no association with donor agencies considering a large population from the host community, focusing on the socioeconomic toll of hosting nearly one million refugees. Poverty and environmental degradation are closely related, and often create vicious cycles because they are the cause and effect for each other [19]. The host community is among the poorest in the country, living in the coastal area and experiencing prior natural calamities [20]. Hosting more than one million refugees with few natural resources already increased the possibility of environmental degradation by several times. Therefore, understanding the changes in the social structure will be very crucial to the management of the refugees, and for the avoidance of further environmental and social degradation.

2. Theoretical Concept

According to general migration theories, migration should result in people leaving their country of origin for a better quality of life in relatively wealthier countries. However, the recent large-scale refugee displacement showed different outcomes that require different migration theories to understand. Migration is as old as the history of human society, and a variety of theoretical models have been developed to explain why and how migration occurs. Each of these theories considers different concepts, assumptions, and scales, from the global to the individual, to explain migration [21].
The various proportions of the world system, network, institutional, and cumulative causation theories suggest that migration flows acquire a measure of stability and structure over space and time, enabling the identification of stable international migration systems. An international migration system generally includes a core receiving region, which may be country or group of countries, and a set of specific sending countries linked to it by large flows of immigrants [22,23]. Based on these theories, there is a general perception that most migration is from the Global South to the Global North, which to some extent is true, as half of global migration is happening [24]. However, when considering refugees, the situation is different and complex. The terms ‘migrants’ and ‘refugees’ are often used interchangeably, but they have definite legal connotations that are globally accepted [25]. Migrants are simply people living outside their country of origin, whereas refugees are those who fled their own countries due to fears of serious human rights violations and prosecution, giving them no choice but to seek safety in other countries. The clear definitions, consequences, and impact of migrants and refugees are quite different. Migrants account for 3.4% of the total population and share 9.4% of the global GDP [24].
The destiny of refugees is not that impressive. Several studies have reported that worldwide refugees are suffering from discrimination, violence, child abuse, and various other forms of crime [26,27,28]. However, developed countries have examples of refugee inclusion and integration [29,30,31]. However, when refugees are hosted by developing and poor countries, in most cases they have been associated with violence, environmental degradation, and disease propagation [32]. When refugee displacement occurs, it is not only a plight for the refugees but also has serious long-term consequences for the host countries.

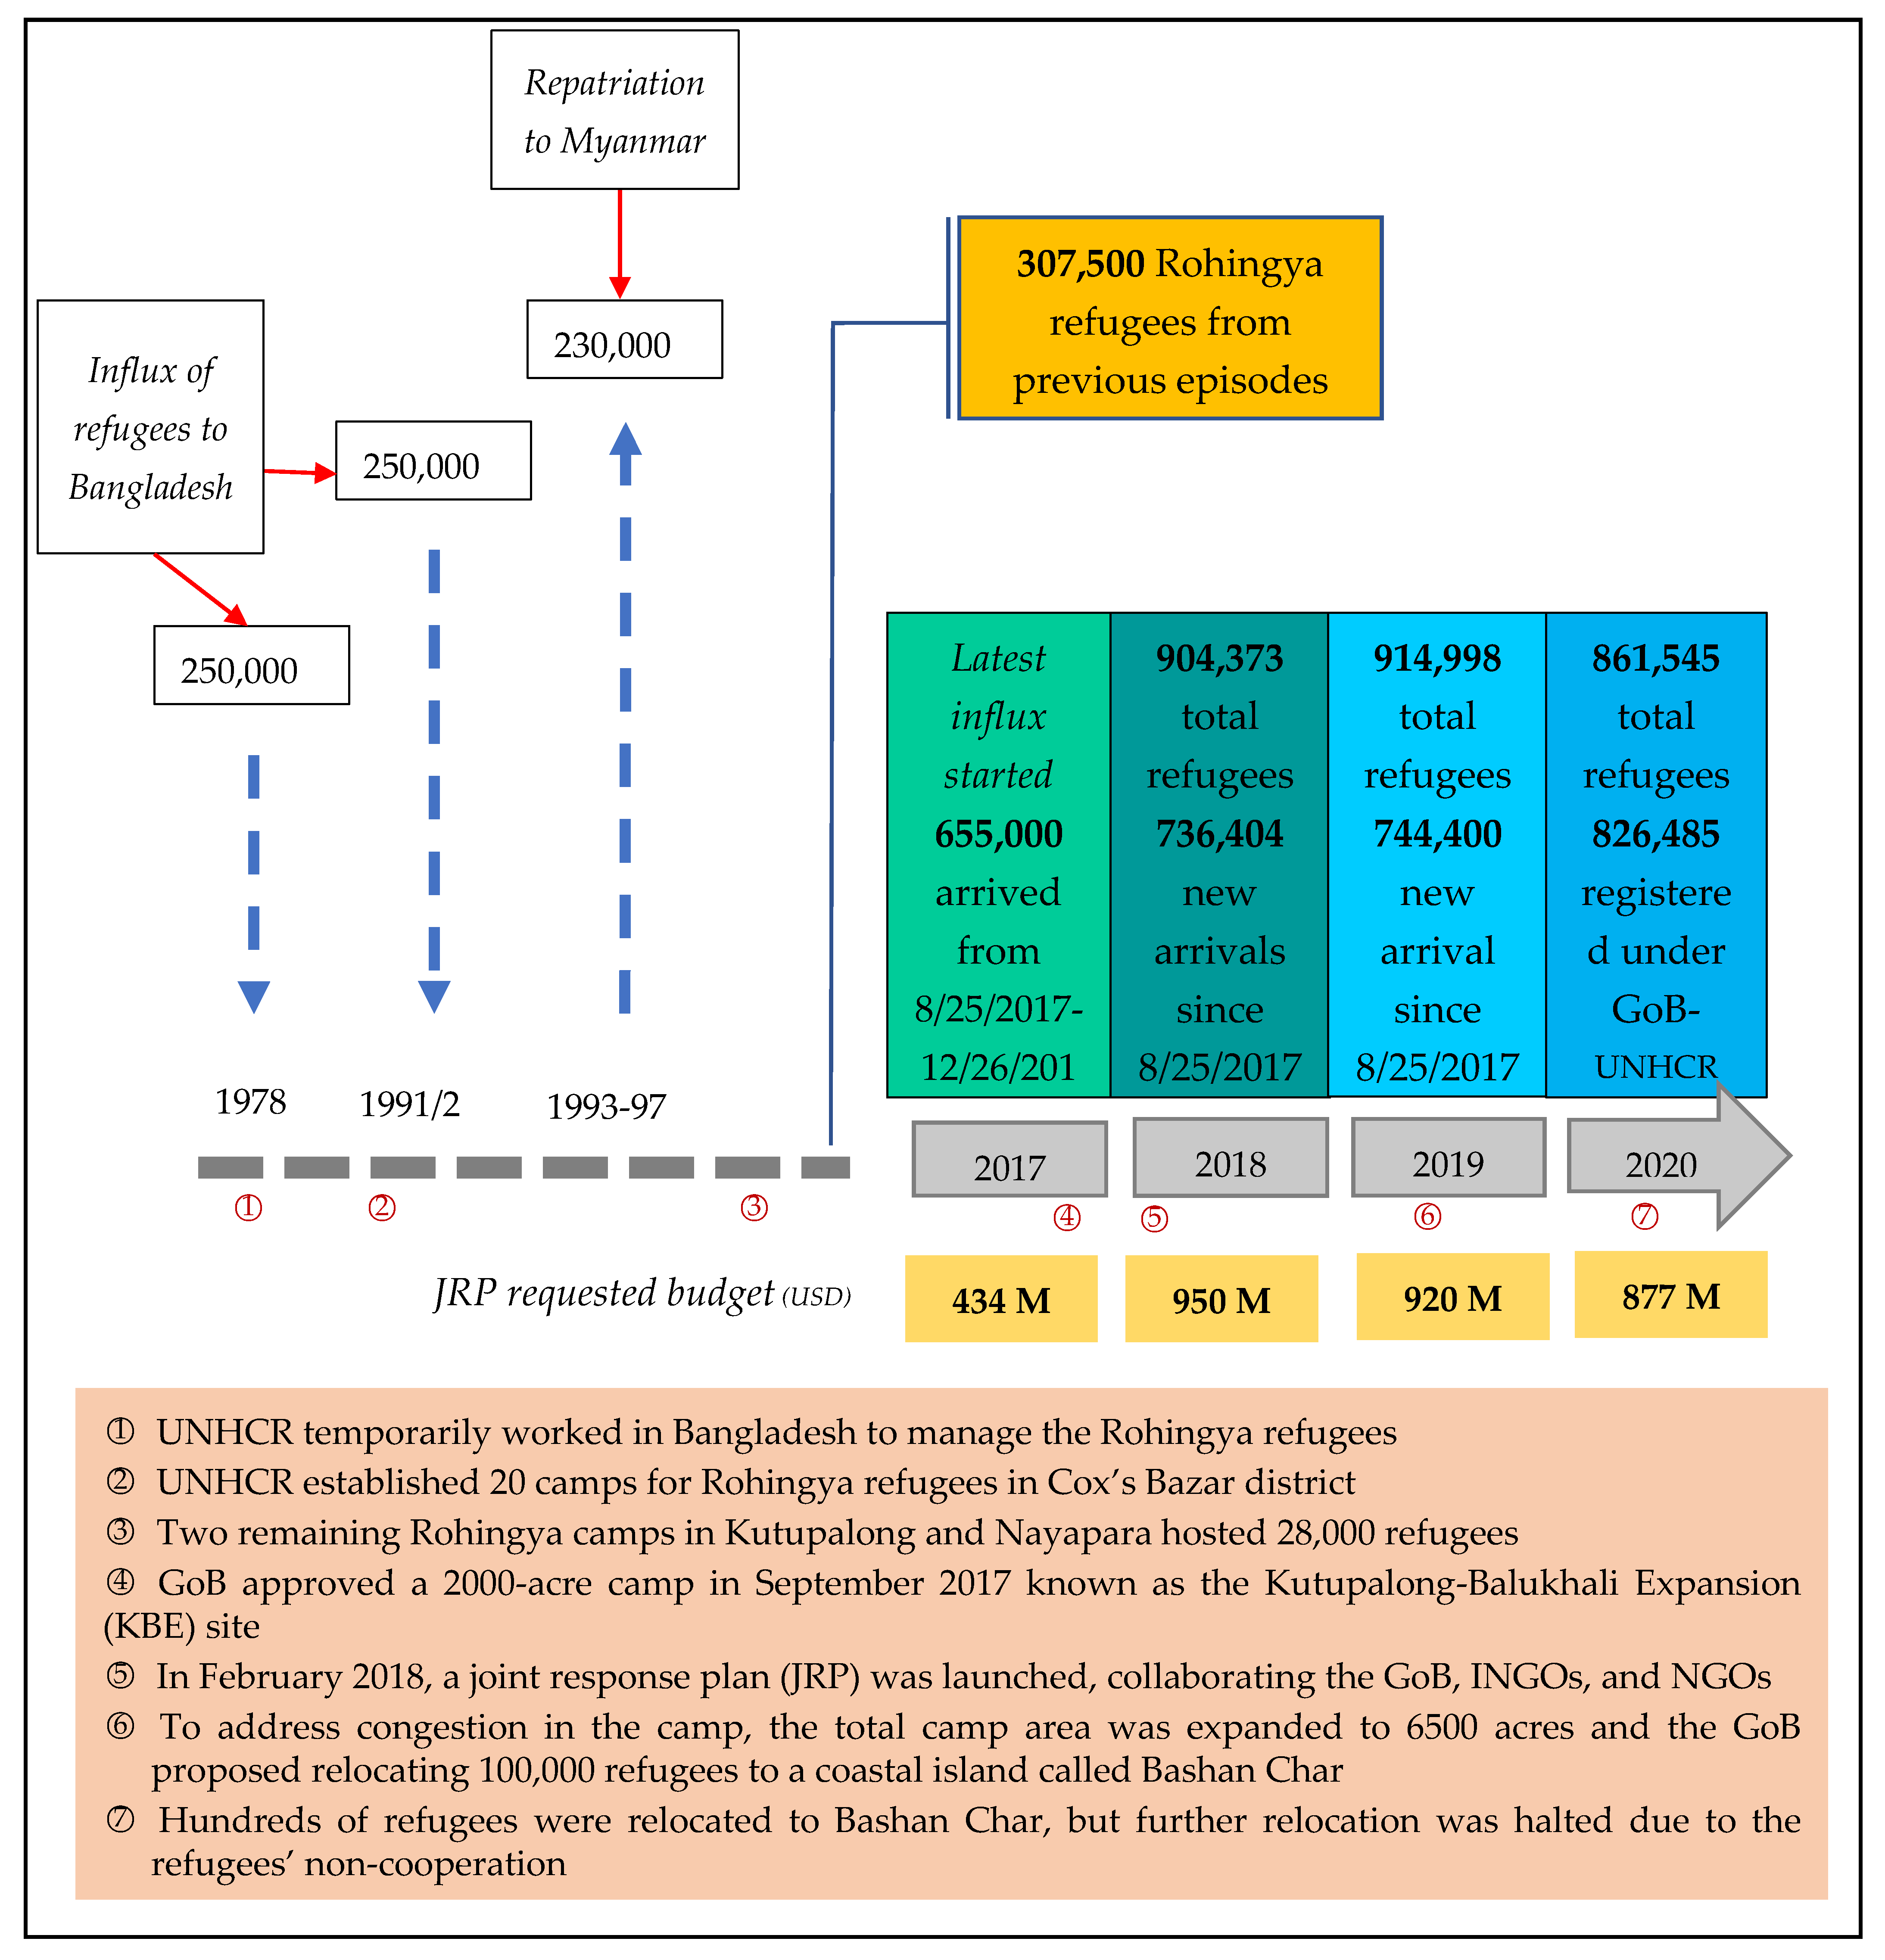
3. Rohingya Refugees in Bangladesh

The recent Rohingya refugee influx to Bangladesh attracted worldwide attention due to the massive number of displaced people. However, Bangladesh has hosted the Rohingya refugees since the beginning of its independence in 1971. A timeline of major events in Bangladesh dealing the Rohingya refugees is presented in Figure 1. Bangladesh shares a border with Rakhine state in Myanmar in the southeast coastal district of Cox’s Bazar. Whenever the Rohingya faced violence and prosecution in Myanmar, they had no choice other than to flee to the neighboring country, and consequently Cox’s Bazar in Bangladesh became a hotspot of Rohingya refugees as their primary shelter. In addition to the continuous flow of small groups of Rohingya refugees, the first waves of Rohingya refugees arrived in 1978 due to Operation Mega-Min, and later waves arrived in 1991–1992 due to Operation Pyi Thaya. These operations resulted in approximately 500,000 Rohingya refugees fleeing to Bangladesh in the early 1990s [33]. The UNHCR supported the refugees by establishing 20 temporary camps in Ukhia and Teknaf in Cox’s Bazar. The government of Bangladesh (GoB) continuously pressured Myanmar to take back the refugees, and as a result, between 1993 to 1997, many Rohingya refugees were repatriated back to Myanmar [33]. Nevertheless, several hundreds of thousands of refugees were also left in Bangladesh.
In response, the UNHCR established two permanent camps in Kutupalong and Nayapara in Cox’s Bazar during the mid-1990s, and continued to support 28,000 Rohingya refugees living in the camps [34]. When the recent influx of Rohingya refugees occurred, Bangladesh already had 28,000 Rohingya refugees in the two camps and nearly 270,000 refugees scattered outside the camps, with an estimation of the total refugee population being about 307,500 [35]. Bangladesh is not a signatory member of the 1951 Refugee Convention or the 1967 Protocol, which ensures refugee recognition and rights [36]. Bangladesh does not recognize the Rohingya as refugees, and is not obliged to follow international rules which protect the basic rights of refugees, including legal status and work permission. The GoB calls the Rohingya refugees who entered before August 2017 “undocumented nationals of Myanmar” (UNM), and allows the UNHCR and other non-governmental organizations (NGOs) to provide support on a limited scale.
During the latest influx of Rohingya refugees, Bangladesh received more refugees in the first three weeks of the influx (in August 2017) than all of Europe received during the recent Syrian crisis [37]. Bangladesh currently hosts 4.7% of the world’s total refugees [1]. Since the GoB does not recognize the Rohingya as refugees, the Rohingya fleeing their country after August 2017 are recognized as Forcibly Displaced Myanmar Nationals (FDMN). FDMN and the previously mentioned UNM are the legal statuses of the Rohingya refugees acknowledged by Bangladesh, which are not equivalent to the worldwide refugee status but a type of recognition that they are not living in Bangladesh undocumented. However, they have limited rights and many regulations to follow. According to the UNHCR, there are currently 861,545 Rohingya refugees living in 34 congested camps in Teknaf and Ukhia upazila in the Cox’s Bazar district, among whom 826,485 are FDMN and 35,060 are UNM [7]. In order to support the UNM, a National Task Force (NFT) formed in 2013—including 29 ministries and other entities, chaired by the Ministry of Foreign Affairs—provided oversight, strategic guidance, and collaboration with the UNHCR and other donor agencies [38].
During the initial days of the latest influx, support was delivered by a multitude of actors including local communities, private donors, the GoB’s local administrations, and even the Bangladeshi army. The GoB, with support from the UNHCR and other international communities, organized temporary shelters in hilly forests, where 2000 acres of forestland known as the Kutupalong-Balukhali Expansion Site was allocated for the refugees by the GoB, and later became the world’s largest refugee camp [39]. As the scale of the refugee influx continued to increase and demand for refugee support soared, the GoB formed a joint task force including the international community, including the UNHCR, International Organization for Migration (IOM), United Nations (UN), and other international and local donor agencies. From the GoB, the Refugee, Relief, and Repatriation Commissioner (RRRC/3RC), under the Ministry of Disaster Management and Relief, was mandated to provide operational coordination with other related GoB entities and international organizations. The international organizations formed a strategic executive group (SEG) co-chaired by Bangladeshi representatives of the UN, UNHCR, and IOM. The SEG and 3RC, along with other national and international organizations, developed and implemented a joint response plan (JRP) [38,39]. Under the JRP, several strategic tasks were established to support the refugees, along with the local community. Funds from the GoB and international donor agencies are managed through the JRP. In 2020, the JRP had an estimated budget of USD877 million to support the refugees, which will provide support through 117 partners [40]. Of the 117 partners, 48 are international NGOs, 61 are national NGOs, and 8 are UN agencies. Through the JRP, almost 100% of the refugees receive food assistance, and a significant portion receive basic living support including education, medical treatment, and clothing [41].
The Rohingya refugee situation in Bangladesh is evolving into a long-term refugee situation with no viable solution on the horizon. In January 2018, the governments of Myanmar and Bangladesh agreed to repatriate 156,000 Rohingya refugees within the next two years [42]. However, their repatriation will not happen until the Myanmar government ensures the Rohingya’s security, civil rights, and recognition as citizens. Although most of the Rohingya refugees want to return to Myanmar if their security and citizenship is ensured, the Myanmar government has failed to guarantee those rights, so no refugees have agreed to willingly return to Myanmar [43,44].

4. Materials and Methods
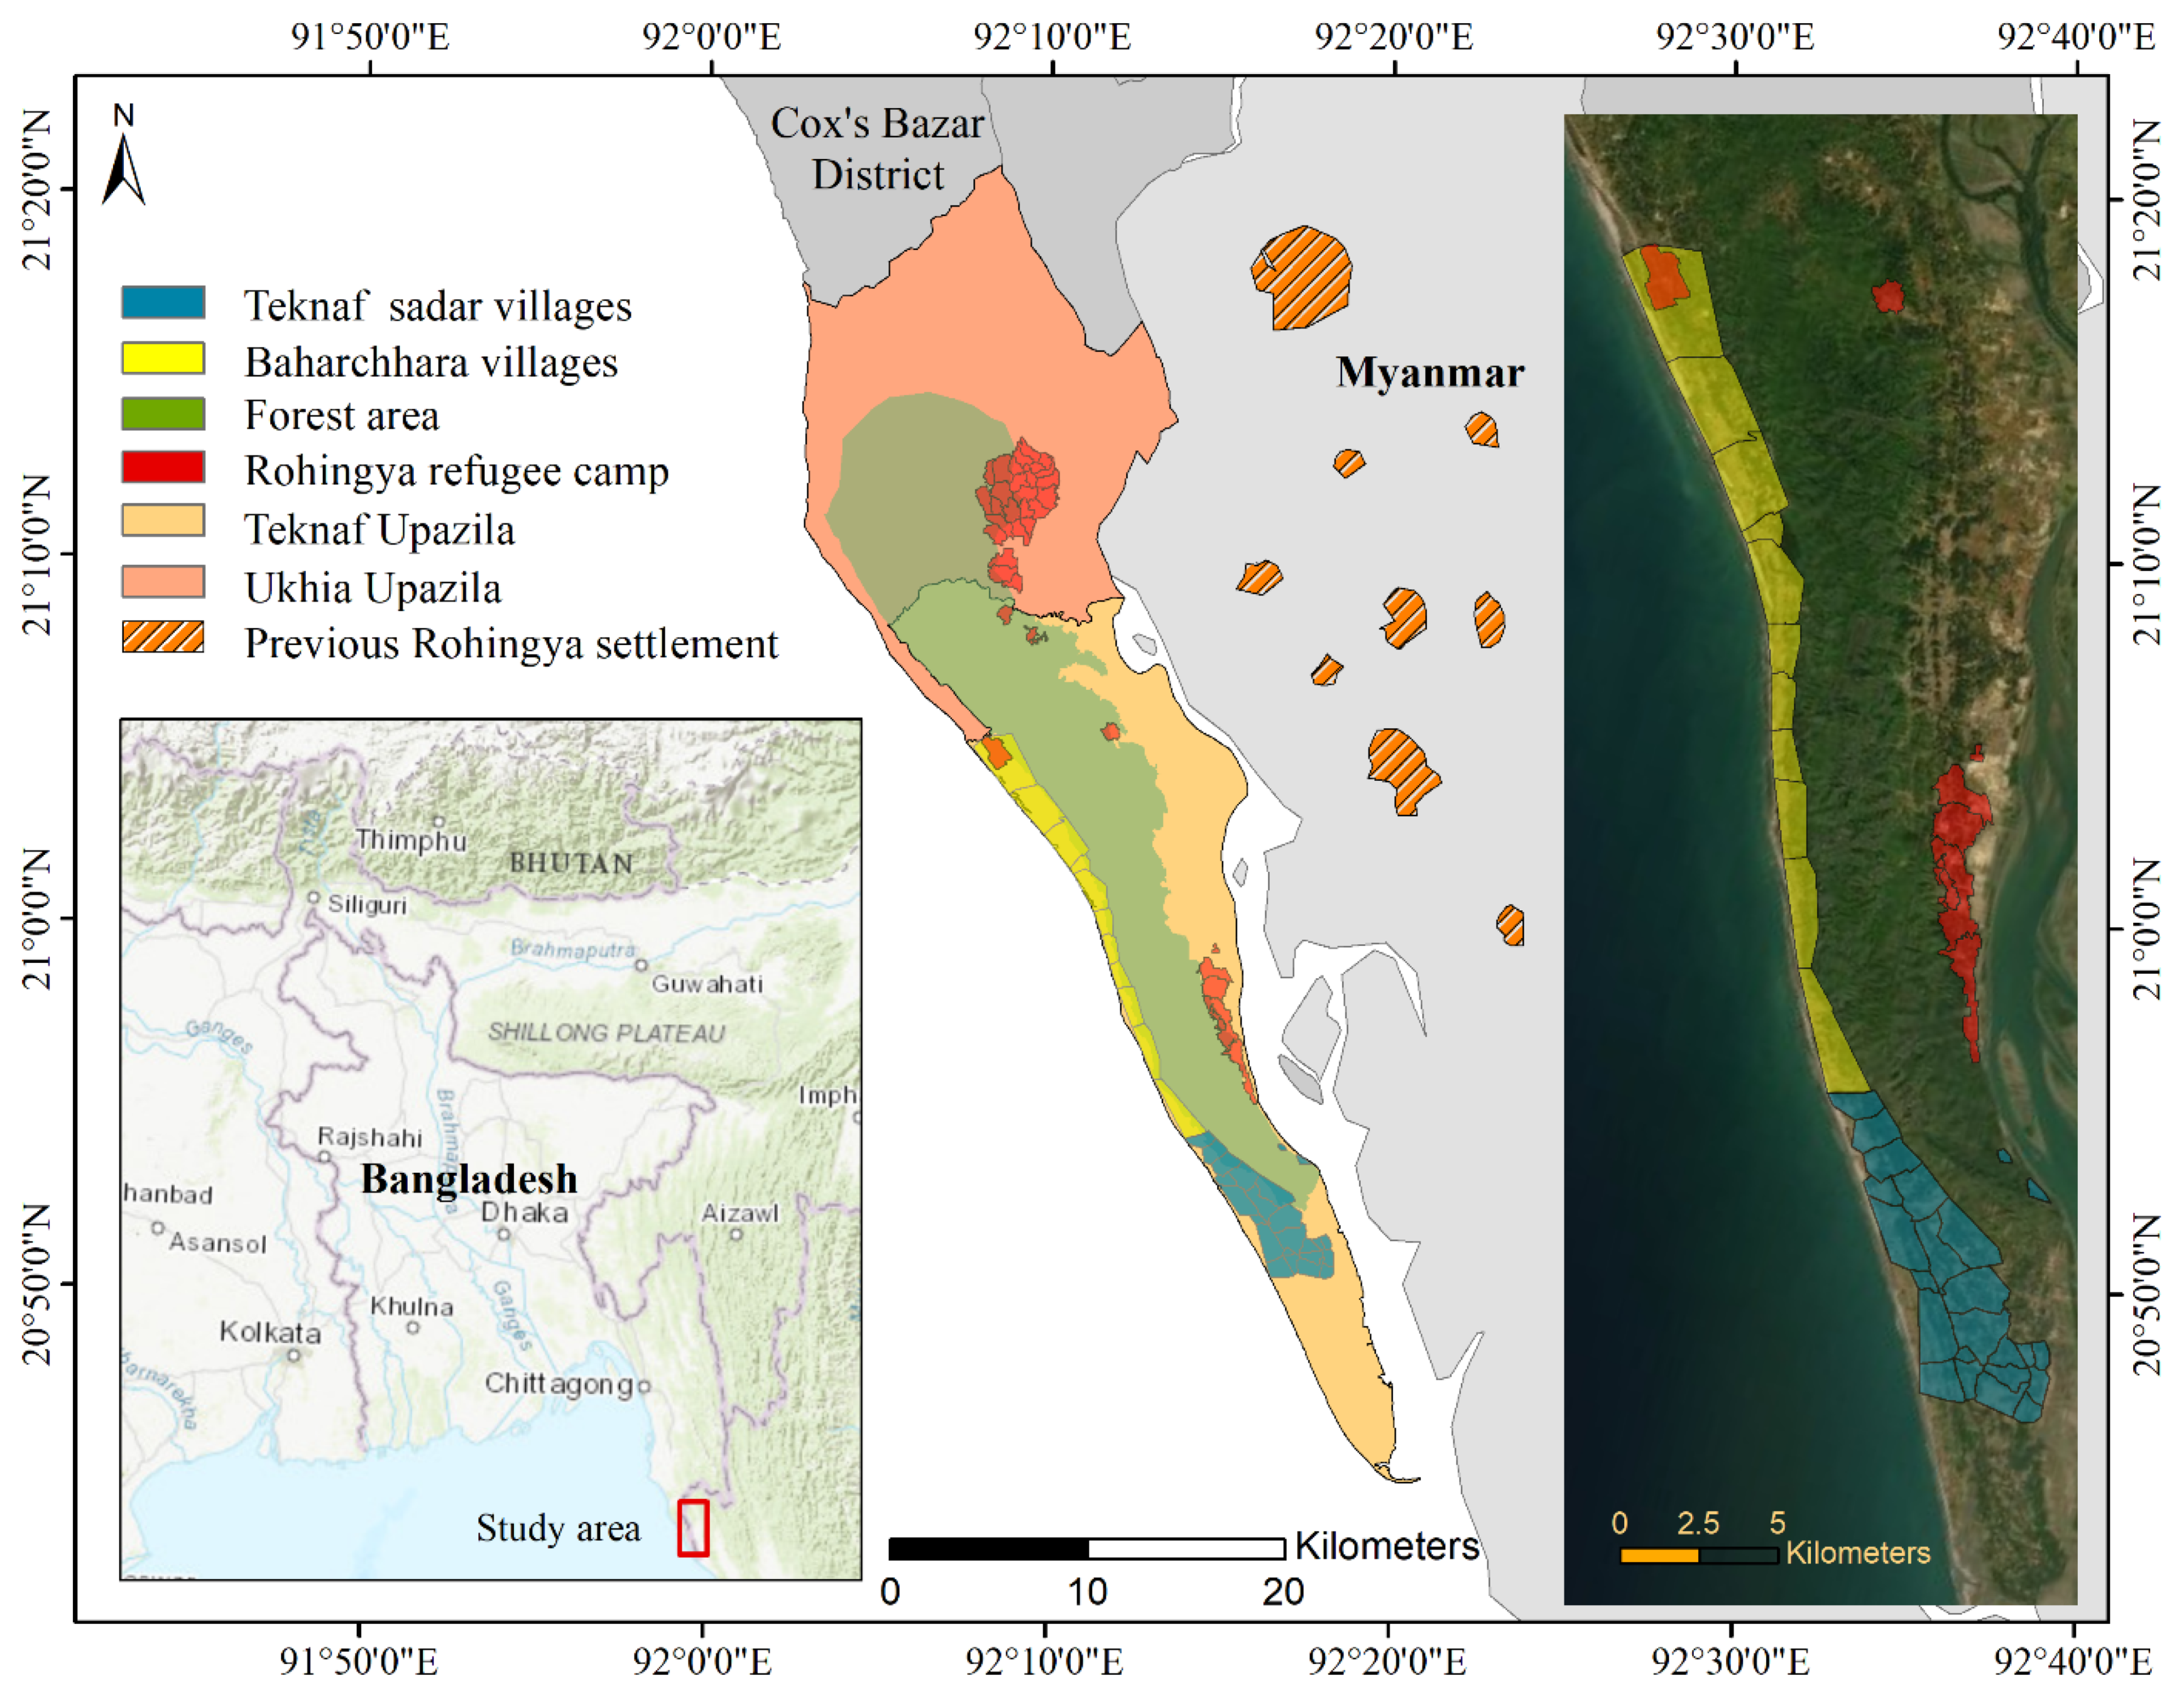
4.1. Study Area

Since the first Rohingya refugee influx, and up until the recent one in 2017, almost all of the Rohingya refugees who fled to Bangladesh have been relocated to the southern district of Cox’s Bazar. Approximately one million Rohingya refugees are presently concentrated in the southern part of Cox’s Bazar in two upazilas, Teknaf and Ukhia. An upazila is an administrative unit under the district’s administration. Upazilas are divided into several unions that are composed of various numbers of villages.
This study focused on two unions in Teknaf upazila, Baharchhara and Teknaf Sadar. Baharchhara has 11 villages, and Teknaf Sadar has 24 villages. The study area encompassed 35 villages, as presented in Figure 2. The total population in the villages was 76,513 before the refugee influx in 2011 [45]. These unions were subjected to refugee influxes even before the latest influx in 2017, and had prior experience hosting refugees in camps since the 1990s. Nayapara is one of the oldest camps managed by the UNHCR, and is in Teknaf Sadar. In Baharchhara, Rohingya refugees formed slum-like camps (not legally authorized by the GoB) on beaches in Shamlapur village. After the recent refugee influx, the UNHCR, with assistance from the GoB, established several camps in Baharchhara and Teknaf Sadar to host the old (UNM) and new (FDMN) refugees. In Teknaf Sadar, refugee camps known as Leda, Jadimura, Nayapar, and Alikhali host 112,572 Rohingya refugees. In Baharchhara, one registered camp—called Shamlapur—hosts 10,286 Rohingya refugees [40]. As the long-term history of the refugee camps is well-known and a significant portion of the camps hosted refugees after the recent influx, the host community in this area is an important and significant place to study the impact of the refugee influx.

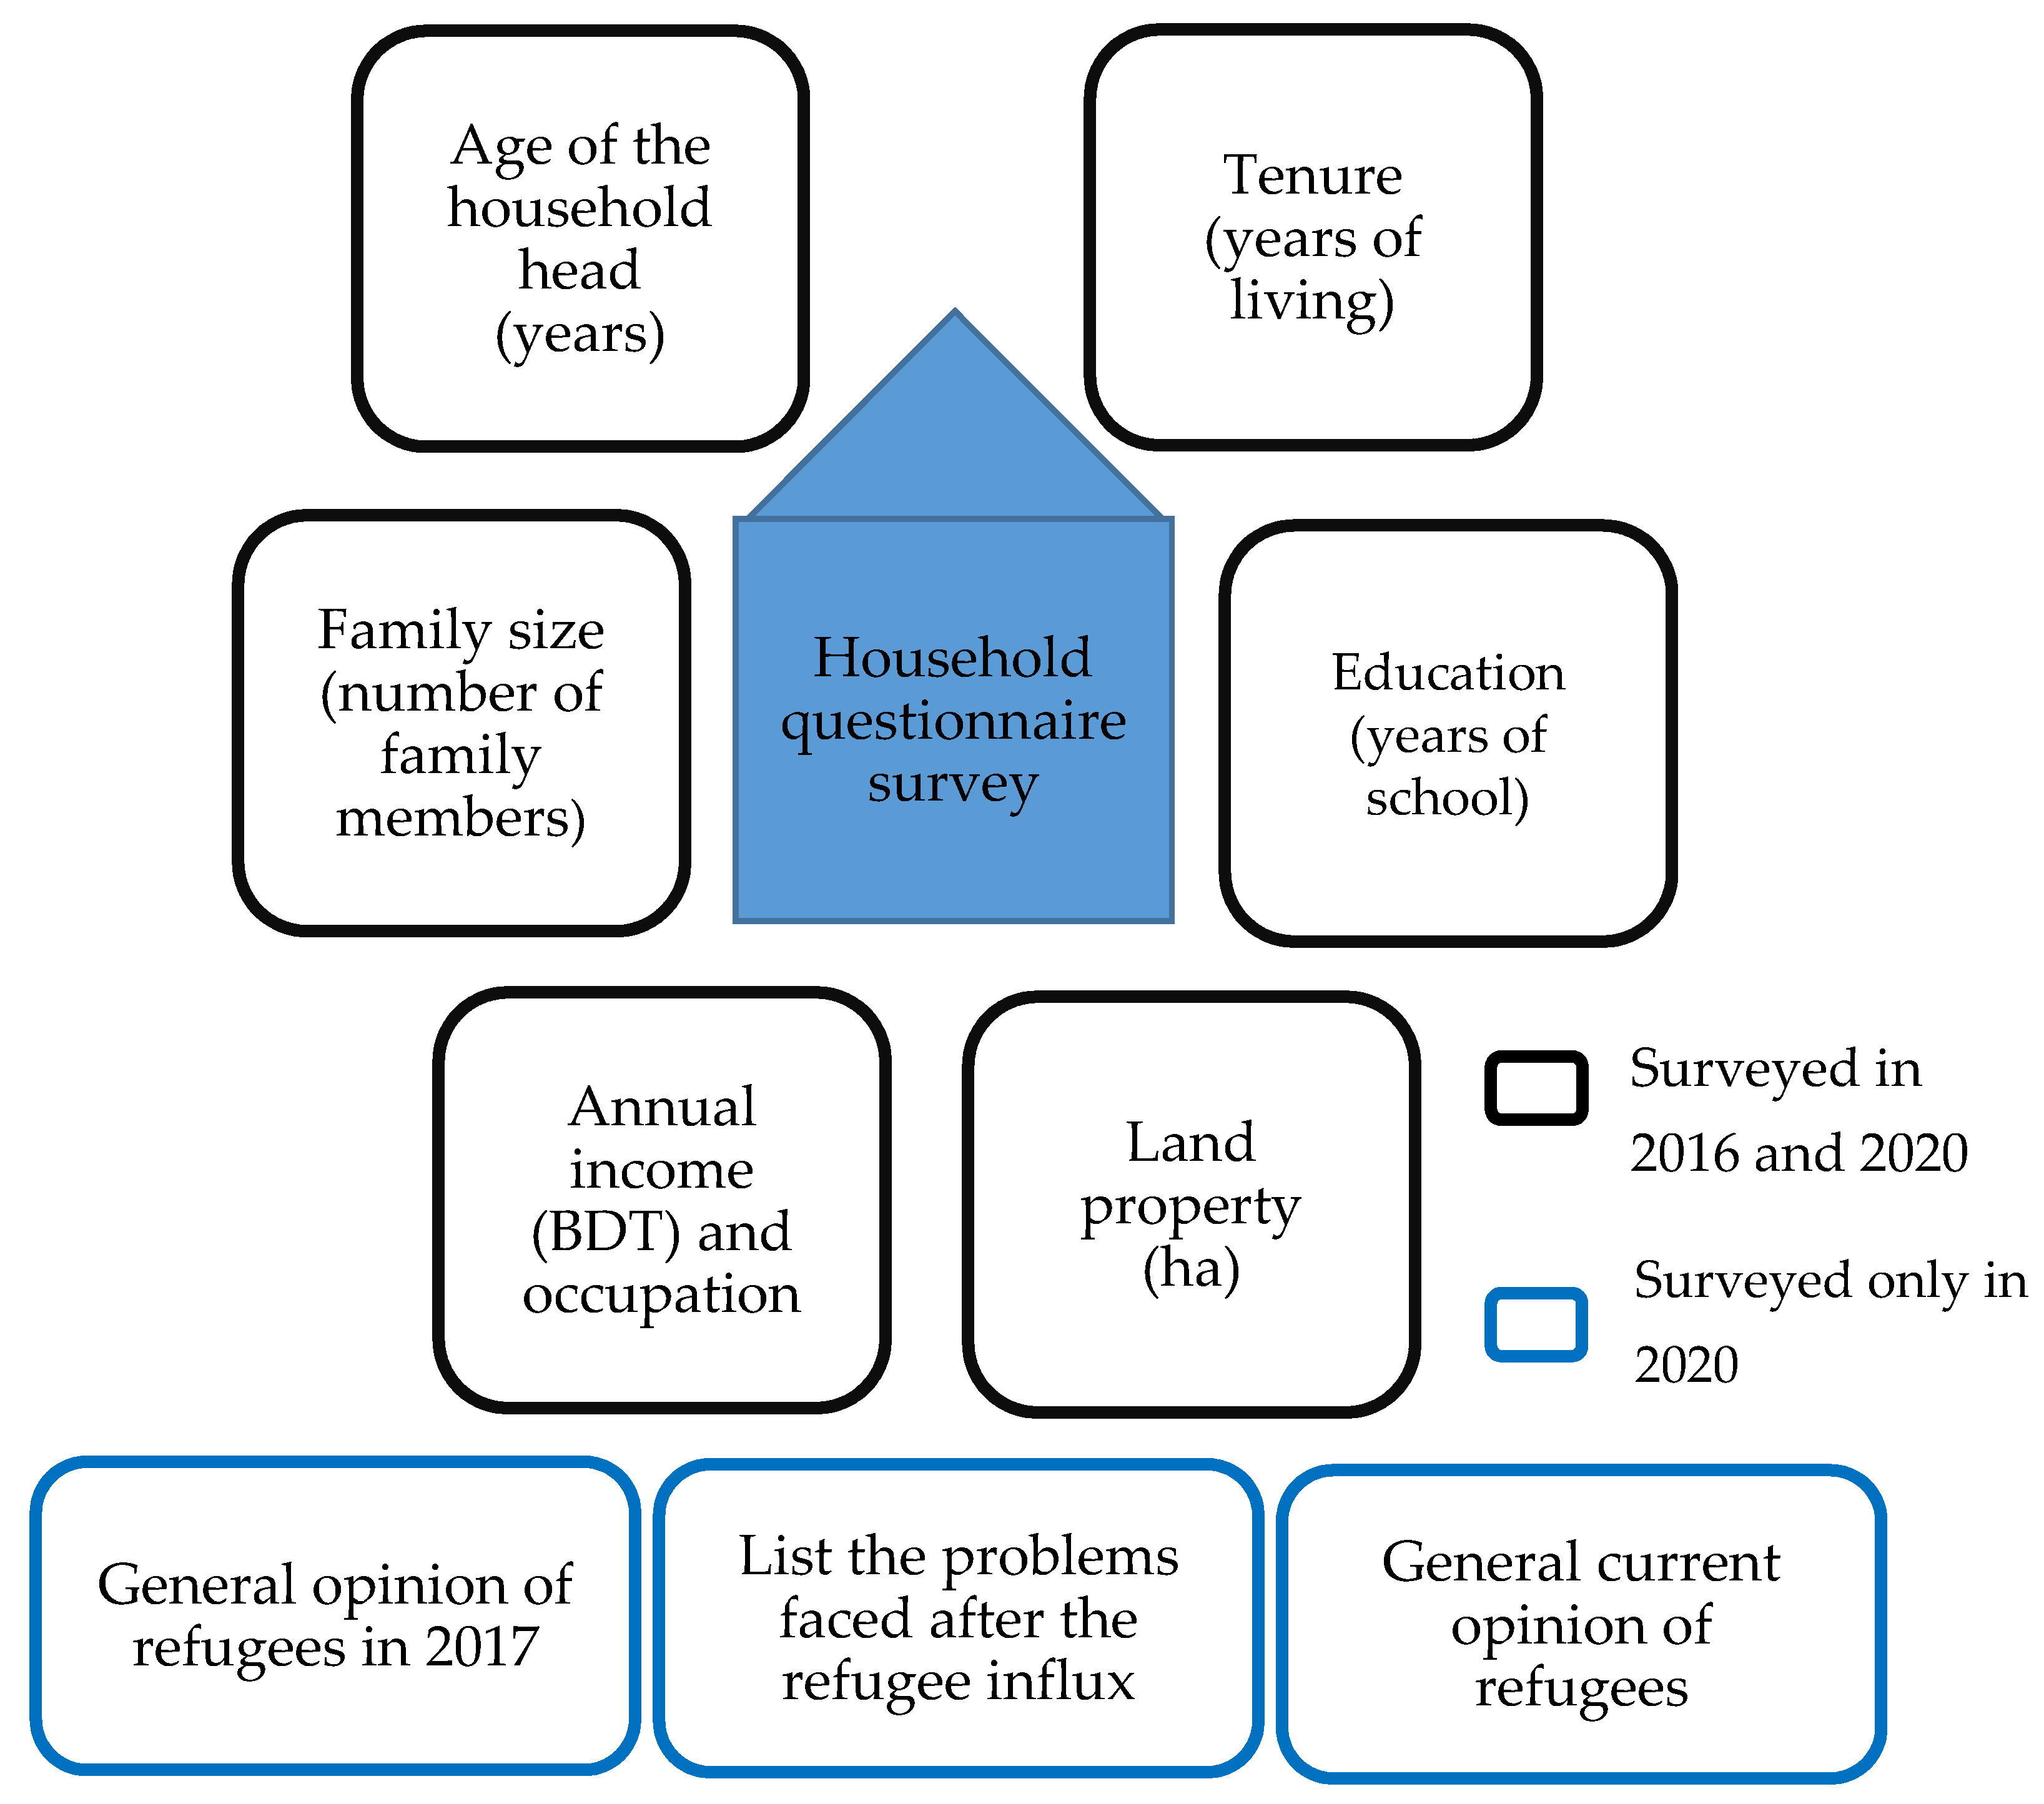
4.2. Sample and Data Collection

This study’s population included all the households in the 35 selected villages in the Baharchhara and Teknaf Sadar unions. Of the total households, 10% were selected as samples for the collection of the socioeconomic data to pursue this study’s objectives. The household survey was conducted in two different time periods in 2016 and 2020 in order to compare the host community’s socioeconomic status before and after the refugee influx in 2017. Systemic sampling was used to select the sample households. First, all of the households in the selected villages were counted and listed with their location information. Every tenth household was listed and counted for the survey and face-to-face interviews. Using this systematic sampling method, 10% of the households were surveyed using a structured questionnaire. The household head (HH) was asked to respond to the questionnaire, and if the HH was unavailable, another adult household member was asked to respond. The structured questionnaire contained questions related to the HH’s age, education status, family size, tenure, annual income, land property, general perception of the refugees, and problems caused by the refugees. The household survey followed the methodological design from [46]. At the end of the survey in Baharchhara, 8674 and 9690 households were found in 2016 and 2020, respectively, among which 856 (in 2016) and 1157 (in 2020) households were surveyed. In Teknaf Sadar, 11,010 and 10,495 were found in 2016 and 2020, respectively. For the household survey in Teknaf Sadar, 1068 households in 2016 and 1108 households in 2020 were assessed. The household surveys in 2016 and 2020 were conducted under the supervision of the research team as a part of several research projects, and the large number of the households were covered by hiring 6 to 10 local research assistants, who were provided with sufficient training and guidance on social surveys.

4.3. Variables and Analysis

The variables used to determine the socioeconomic status are shown in Figure 3. However, variables such as tenure, annual income, and land property require further clarity. In this study, tenure referred to the number of years the family lived together in the current household. Annual income referred to the total gross household income based on the last one-year recall period. While asking about their annual income, the HHs were also asked to identify their main occupation, and based on the responses, the households were categorized as abroad, businesses, farmers, fishermen, laborers, and service workers. ‘Abroad’ refers to households receiving their main income source from a family member working abroad and sending money for their living expenses. ‘Businesses’, ‘farmers’, and ‘fishermen’ referred to households with their main occupations conducting business, farming on their own or rented lands, and fishing on boats as professional fishermen, respectively. ‘Laborers’ referred to households responding with any form of labor, such day laborers, construction laborers, or even farming laborers as their main occupation. All other types of occupations were placed in the service workers category, including teachers, salespeople, and workers in small business and NGOs. ‘Land’ referred to the total accessible land including the household’s homestead area [47]. The accessible land included rented and leased lands.
This study compared the socioeconomic status of the 35 villages before and after the recent refugee influx. The socioeconomic data were analyzed using descriptive statics including frequencies, means, and percentages. Interferential statistical tests, such as the t-test, were used to compare the different socioeconomic parameters. Another focus of this study was to group the villages based on their socioeconomic status. The grouping was carried out using a k-means cluster analysis based on the mean of the 35 villages’ various socioeconomic parameters. The k-means algorithm is a popular data-clustering algorithm [48,49]. The k-means cluster initially partitions data into randomly chosen k clusters, and calculates each cluster’s centroid. Then objects are assigned to the closest cluster. Each assignment updates the centroid, and the process is iterated until the centroids no longer change. The degree of dissimilarity between any two points is measured using the Euclidean distance. Due to the nature of the n-dimension space, the distance between elements is defined in terms of Euclidean metrics; the algorithm formally minimizes the sum of the squared error (SSE) that is used to evaluate the clustering quality [50]:
SSE = i = 1 k   x C i k d i s t ( c i x i ) 2
where k is the number of clusters, x is a set object, Ci is the ith cluster, ci is the centroid of cluster Ci, and dist is the Euclidean distance. Using k-means cluster analysis requires first fixing the number of clusters. However, there is no definite statistical rule to specify the optimum number of classes. Different methods can be followed based on the available data [51,52] and the study’s intended objective. In this study, by following the trial-and-error method, we found that when k = 3, the mean severity levels considerably differed across the clusters. The difference was confirmed by one-way ANOVA tests. The statistical tests were performed using SPSS Statistics for Windows, version 16 (SPSS Inc., Chicago, IL, USA).

5. Results

5.1. Temporal Socioeconomic Status Changes

In this section, the differences in the host community’s socioeconomic status and annual occupational income are elucidated in order to determine the change after the refugee influx. Table 1 shows the socioeconomic status comparison between 2016 and 2020. A two-way t-test provided statistical proof that there were significant changes in the socioeconomic structure from 2016 to 2020. The household heads’ mean age decreased from 39.9 to 37.9 years. The mean family size decreased from 6.2 to 5.5 years. In 2016, the mean tenure was 17.3 years, which decreased to 14.9 years. In contrast to all of the decreased parameters, the average years of school increased from 1.9 to 2.4, which was the only parameter which improved over time. The remaining two variables, annual income and land property, were the most important to the household economic status. However, both significantly decreased after the refugee influx in the region. From 2016 to 2020, the annual income decreased by approximately 24%, from 187,000 BDT to 143,000 BDT, and land decreased by 39%, from 0.13 ha to 0.08 ha. The significant decrease in these important parameters was a clear indication of the overall socioeconomic degradation.
Annual income is an important indicator that is used to assess socioeconomic conditions at the household level. Table 2 presents the mean annual income according to the different main occupations of the host community households. This income did not solely come from the respective main occupations. Instead, it represents the total annual household income categorized according to their main identified occupation. Table 2 also shows the percentage of annual income and the frequency of occupation changes before and after the refugee influx. This study’s findings suggested that, except for farming households, all of the other households’ annual incomes decreased. These changes were statistically significant, with the only exception being abroad-related households. Among the occupational households, the highest income decrease was found in the laborer category. The annual household income decreased by 38%, from 104,000 BDT to 65,000 BDT for laborers. Annual income also decreased in service (34%), business (30%), fishermen (23%), and abroad (23%) households.
Farming was the only occupation in which the annual income increased after the refugee influx. The annual income in households with farming as their main occupation increased by 29%, from 188,000 BDT to 244,000 BDT. However, even after the change in annual income, abroad households remained the highest income source, and laborers remained the lowest income source. The frequency change from 2016 to 2020 in the occupation household category followed an opposite trend to the income change. Whereas laborer income decreased the most, the frequency increased the most (58%). A similar trend of change was found in the service workers, fishermen, and business households, in which income decreased, but the frequency increased by 45%, 33%, and 7%, respectively. Farming was the opposite, and the household frequency in this category decreased by 17%. Aboard was the only exception in which the frequency also decreased (25%) as income decreased. These findings suggested that household income and frequency change had opposite trends. In the decreasing income occupations, the frequency increased, and in the increasing income occupations, the frequency decreased.

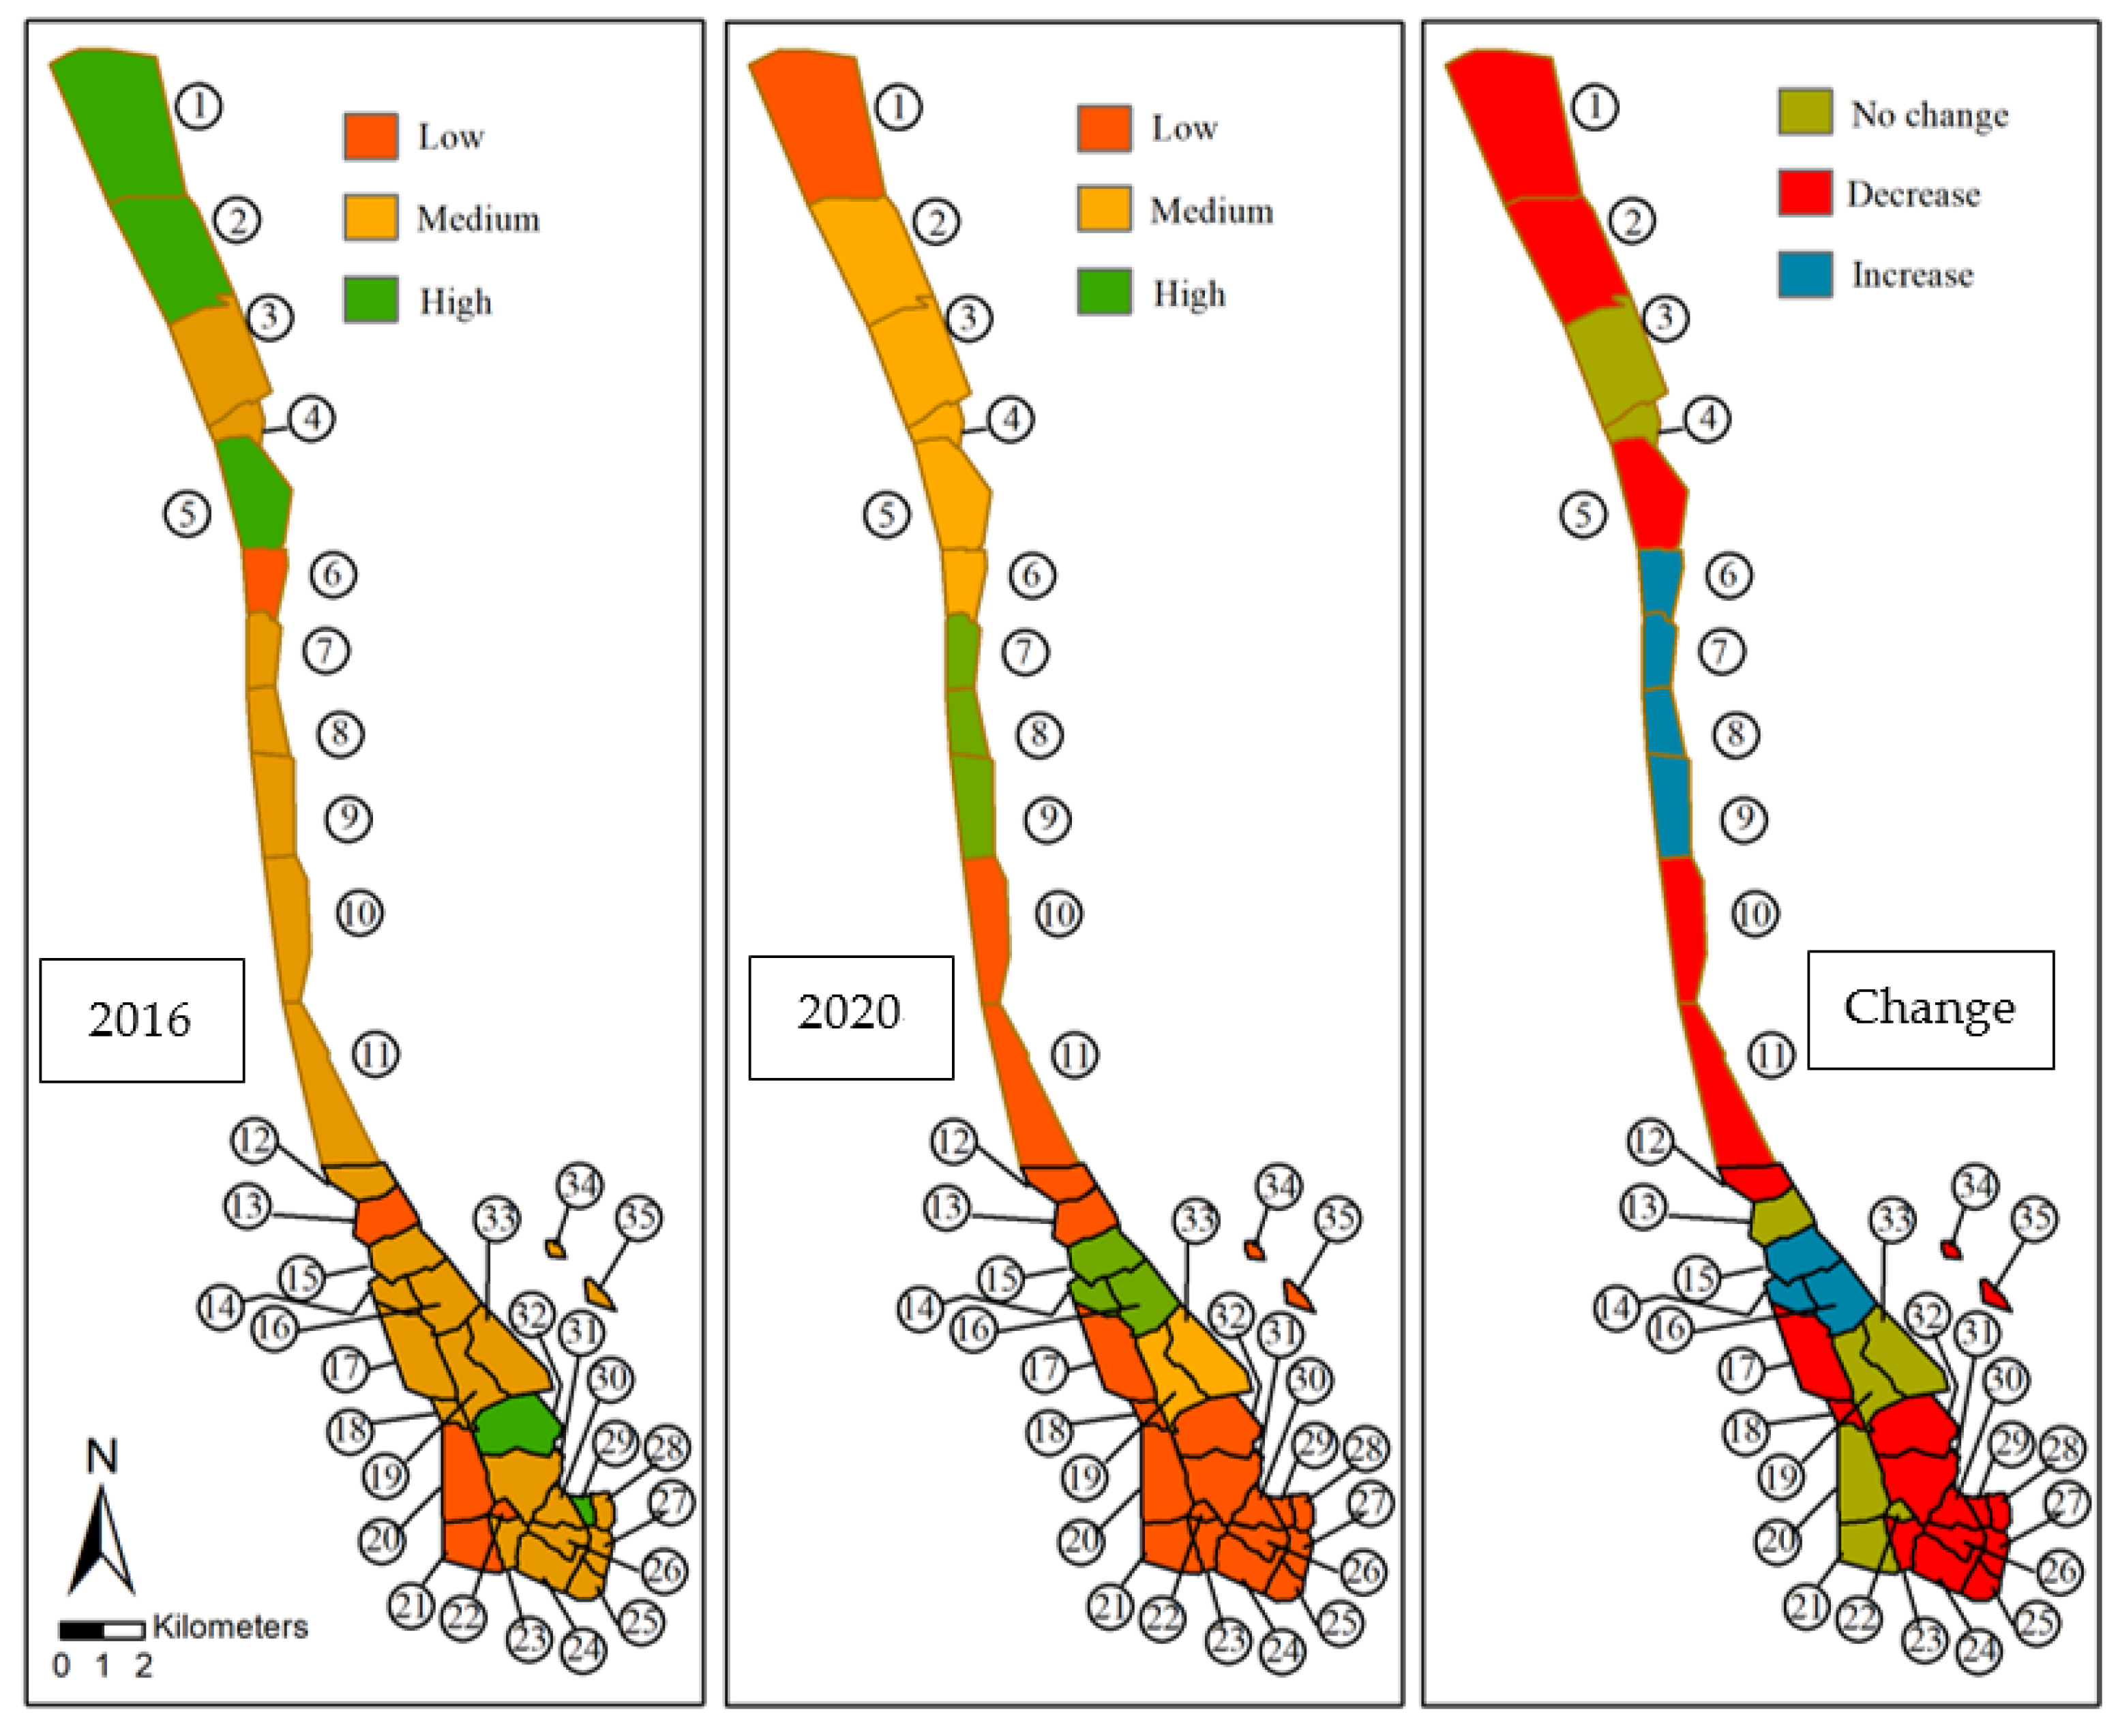
5.2. Village Cluster According to the Changed Socioeconomic Status

5.2.1. Village Cluster

In this study, 35 villages were grouped as low, medium, and high using k-means clustering based on annual income and land property. ‘Low’, ‘medium’, and ‘high’ represented the villages’ socioeconomic structure, from poor to wealthy. Figure 4 presents the villages in each group. The grouping was based on annual income and land property. The average annual income was 87,000, 182,000, and 281,000 BDT, and the average land property was 0.06, 0.14, and 0.15 ha, respectively, in the low, medium, and high village groups. In 2020, six villages were in the high category, eight in the medium category, and 21 in the low category. However, in 2016, the scenario differed, with 25 villages in the medium category, five in the high category, and five in the low category. This study found that, after the refugee influx, only six villages remained in the same group. Seven villages improved in status, among which Bara Dail, Dargachhara, Hatiarghona, Marishbania, Mathabhanga, and Mitta Panirchhara advanced to the high category in 2020. The remaining 22 villages decreased to either the low or medium group. In addition to the villages changing groups over time, the average income and land property also differed between 2016 and 2020. The annual income decreased in the villages in the low category, but increased by 8% and 15% in the medium and high categories, respectively. The land property decreased in all of the groups from 2016 to 2020.

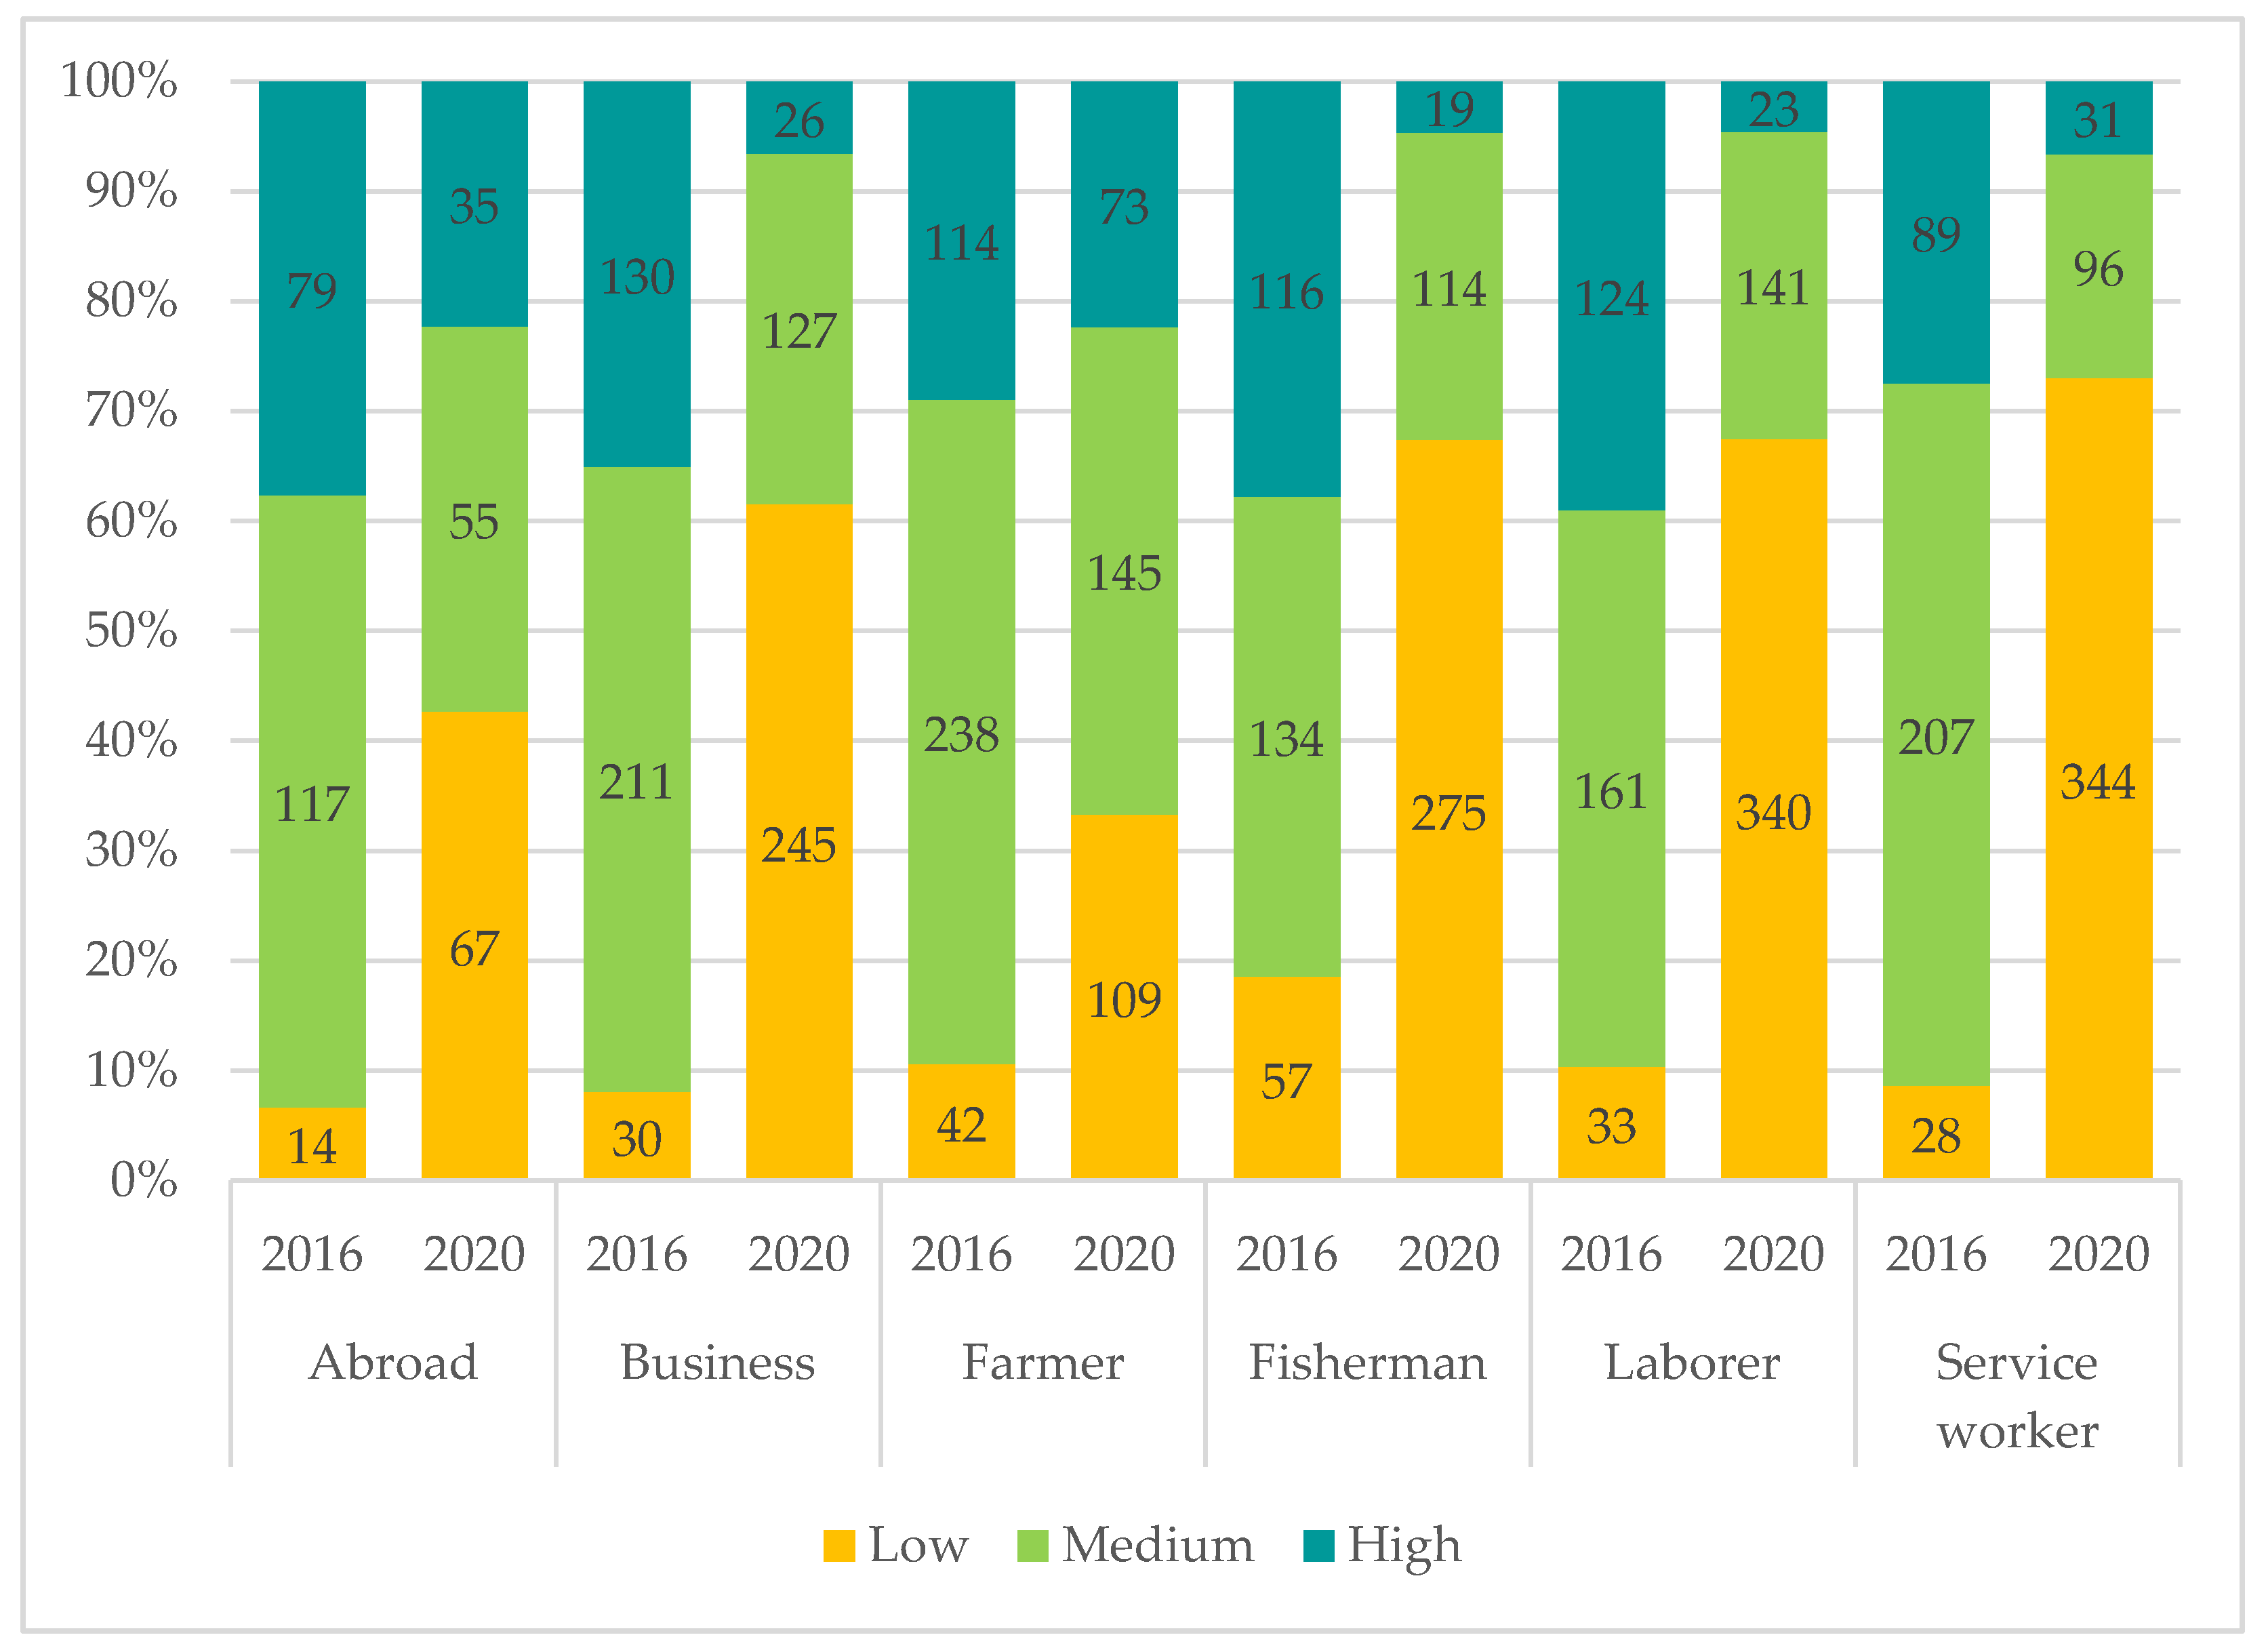
5.2.2. Occupation-Wise Village Group Comparison

Figure 5 presents the occupation-wise household distribution among the village groups, and its changes from 2016 to 2020. Although the villages were grouped based on their annual income and land property, the occupation-wise distribution changes among the groups were useful to understand the specific changes in the livelihood activities after the refugee influx. As the number of villages in the groups changed over time, the number of households also changed accordingly. Appendix A presents a more detailed village socioeconomic status regarding occupation frequency in 2020. The total number of households in the high and medium groups decreased from 652 to 207, and from 1068 to 742, respectively. However, in the low group, the number of households increased by more than 600%, from 204 to 1316. As the total income in the area decreased by 24%, it was expected that the occupations’ frequency would increase in the low group. Figure 5 shows that, from 2016 to 2020, the number of households increased in the low group for all occupations. However, the degree of increase from 2016 to 2020 differed among the occupations. Fishermen, laborer, and service worker households surged in numbers by several folds within the low group between 2016 and 2020, and the number was higher than the other occupational households in 2020. In the abroad, business, and farmer households, the increase was significantly lower compared to fisherman, laborer and service worker households. While considering the low, medium, and high distribution among an occupation category, for service workers, the increase in the low group households was from 9% to 73%. This means that, in 2016, among the service workers, 9% were in the low category, but this changed to 73% in the low category in 2020. For laborers, it was 10% to 68%, and for fishermen it was 18% to 67%. This higher rate of increase in the low group was an indication that these occupations experienced the most socioeconomic degradation after the refugee influx. The significant decrease in annual income in these occupations also supported this argument. Therefore, it can be concluded that when the majority of the host community was engaged in labor, service, or fishing, there was a high possibility that the community had a comparatively low socioeconomic condition.

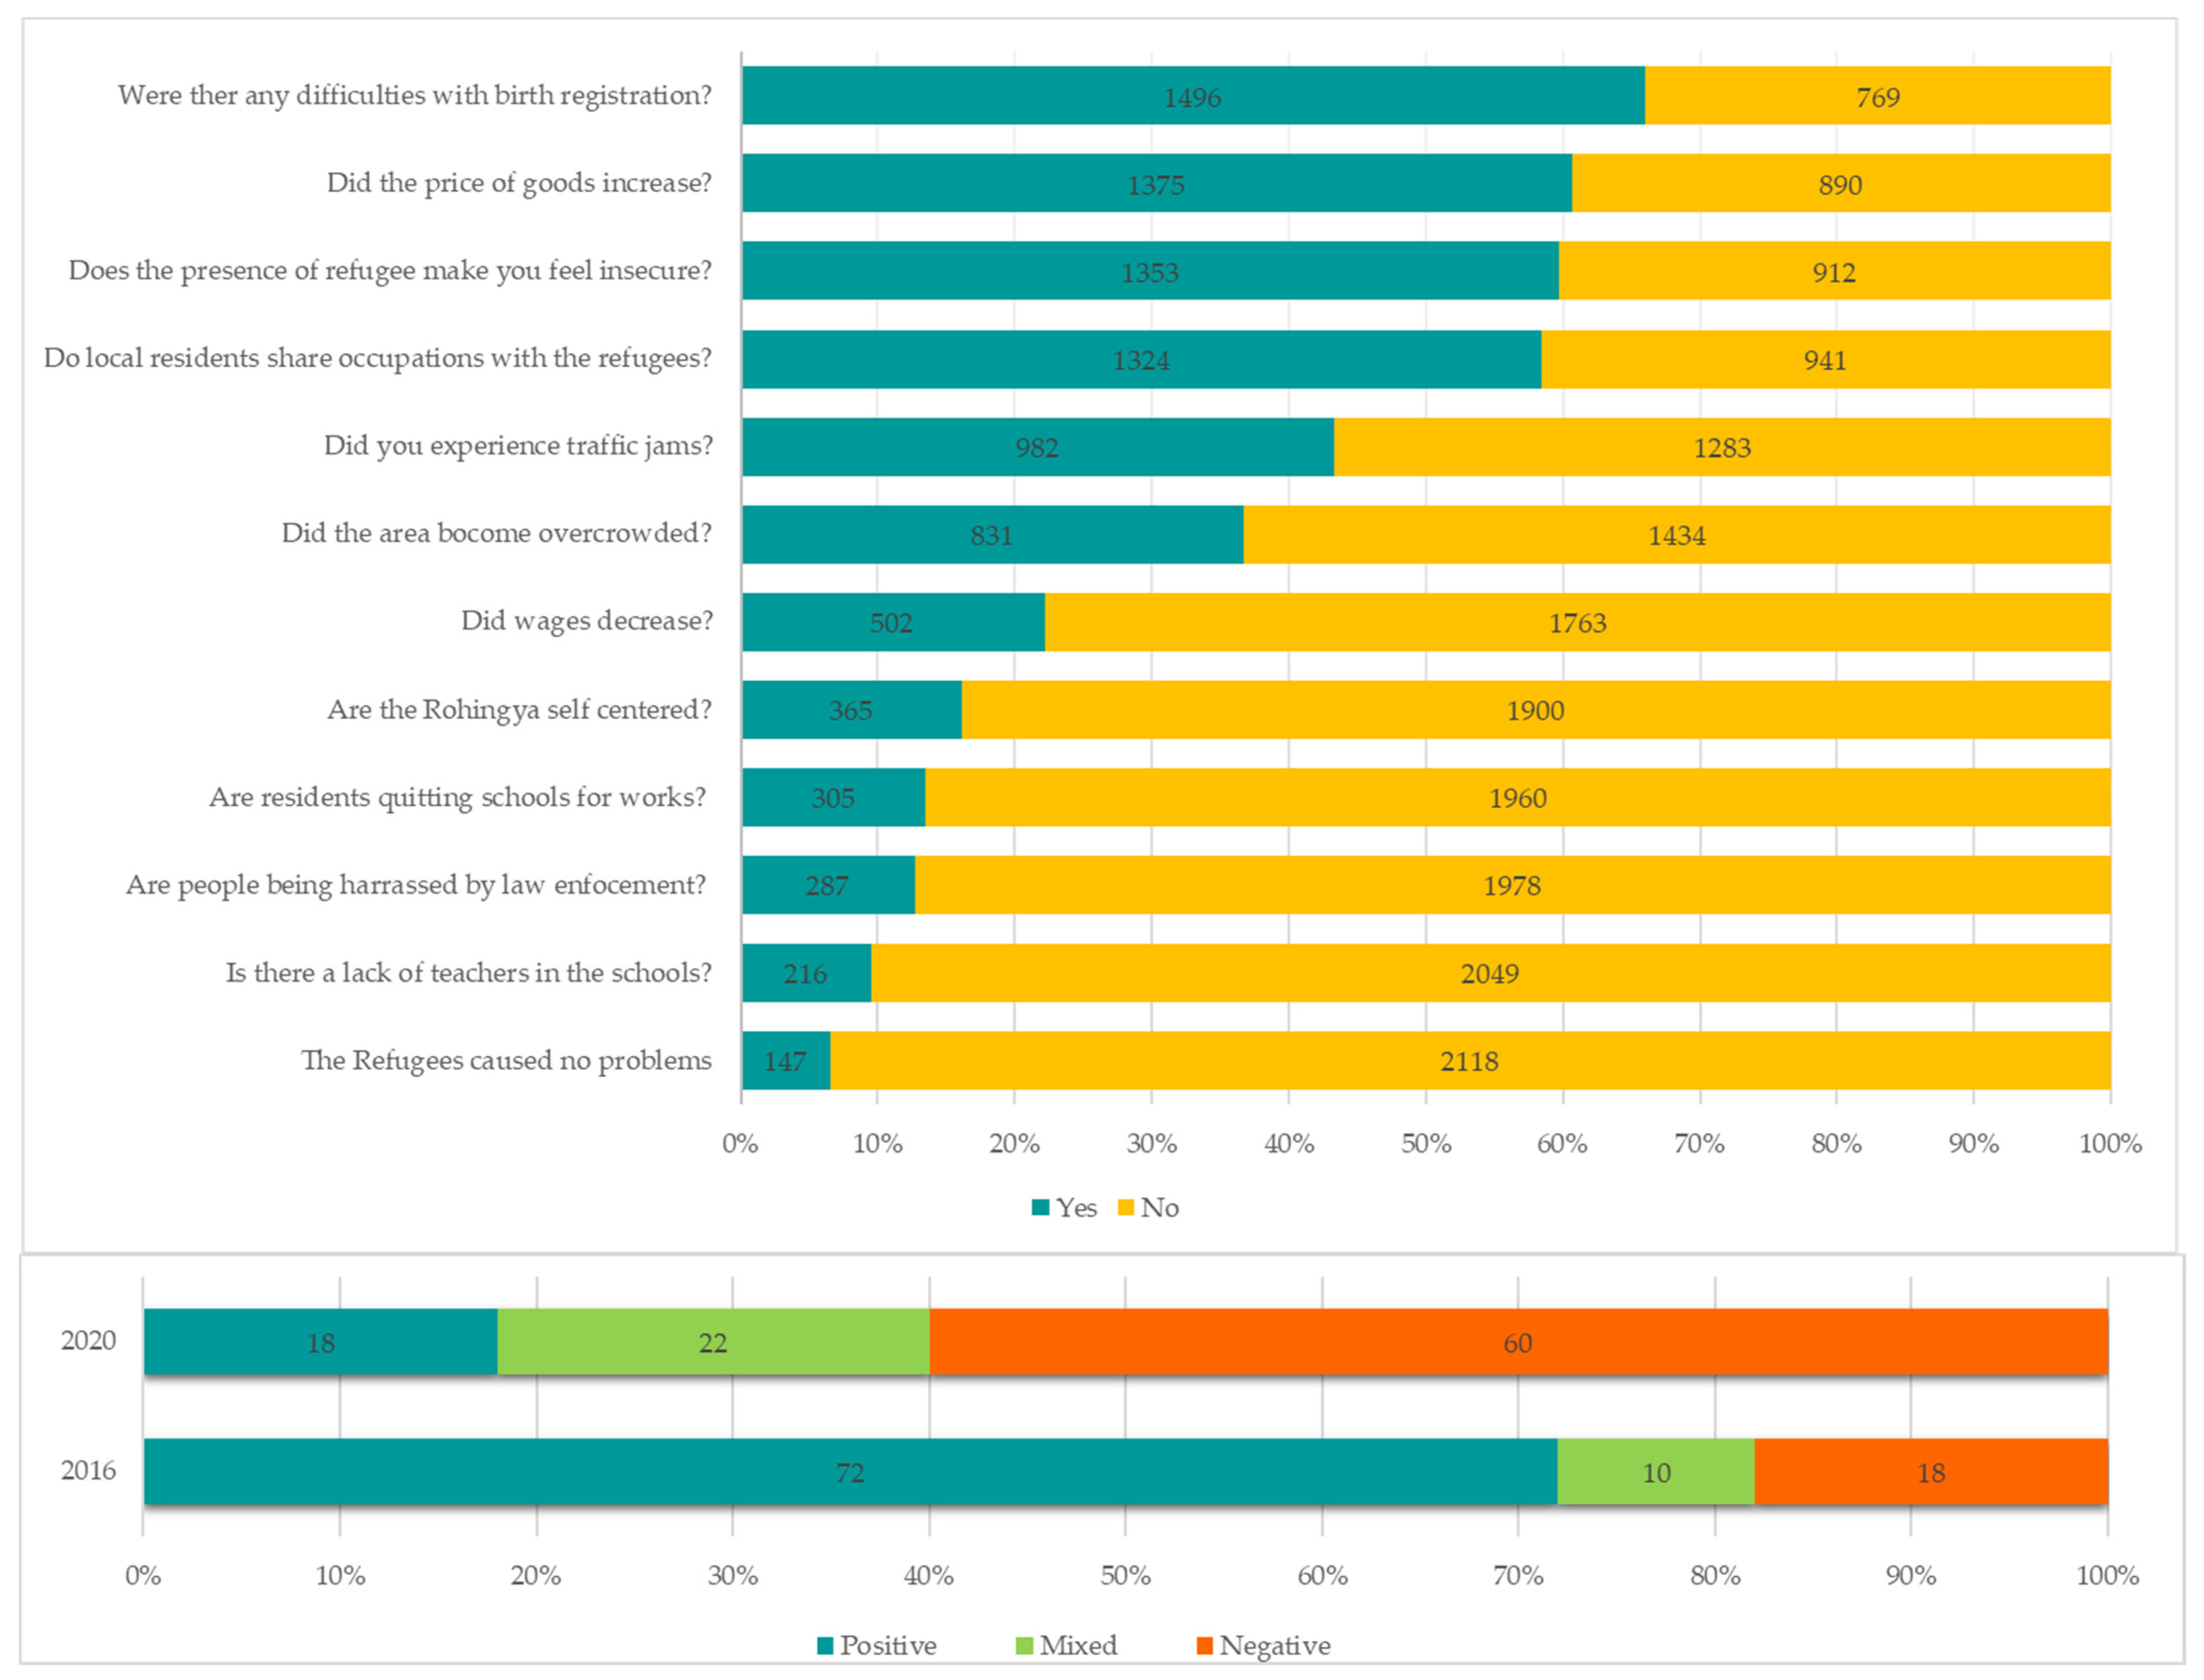
5.3. General Perceptions of and Problems Faced by the Host Community

When the latest Rohingya refugee influx started in August 2017, initially, the host community supported the refugees on the grounds of humanity and empathy. The similar religion, ethnicity, and dialect helped to create a supportive environment with no major conflicts with the local residents. However, as time passed, the number of refugees continued to increase, and the host community started to experience several problems in their daily life, so the situation started to change. Figure 6 shows the host community’s changes in their general view towards the refugees. At the beginning of the recent refugee influx, 72% of the host communities were positive, with 18% negative and 10% mixed feelings toward the refugees. However, this changed drastically in 2020, and 60% of the host communities had negative views, and only 18% had positive views. The extensive change in the general expression was related to the problems the host communities faced. Several problems were listed in the group discussion and included in the structured questionnaire. The respondents were expected to answer ‘yes’ or ‘no’ based on whether or not they thought the problem was affecting the host community. Figure 5 shows a list of problems, along with the host community’s responses. Only 6% of the households responded that they thought the refugee influx was not creating any problems.

6. Discussion

6.1. Consequences and Changes in the Host Community

The Rohingya refugees who fled to Bangladesh were concentrated in Ukhia and Teknaf upazilas. As a result, the refugee population superseded the host population of the two upazilas, and the region’s population ratio was estimated to be three refugees for each local resident [53]. Therefore, the presence of this high number of refugees unequivocally exerted pressure on the local environment, social security, and government services, along with the local community’s livelihood. The impact of the refugee influx is not always the same among the communities, and the outcome of the effect could be negative [13], positive [54] and, in some cases, mixed [55]. The impact of the refugees on the host community depends on various factors, including the number of refugees, the host country’s economic situation, the aid supply from international donor agencies, refugee camp management policies, and the availability of natural resources. This is a complex issue, and prior research on the refugees’ impact on the host community has shown various outcomes. The impact can be the depletion of natural resources [13,32,56,57,58], increased social conflicts [59,60], and the deterioration of the infrastructure [61], or benefiting the host country’s economy [54,62,63]. As the impact of hosting refugees varies and its nature differs due to a range of factors, it is essential to continually monitor and evaluate the refugee situation.
In the case of the Rohingya refugee influx in Bangladesh, some changes in the host community’s’ demographic and economic profile, including age and family size, may have caused statistically significant changes during the considered time, but may not indicate a definitive impact from the refugee influx. Even if refugee families have integrated into the local community to an extent, considering the Rohingya refugees’ younger population (>50% are <18 years) and larger family sizes compared to the local community, more visible changes may have occurred in these characteristics [40]. The average years in school increased from 1.88 years to 2.43 years from 2016 to 2020, but this change was not related to the refugee influx. Teknaf upazila has a comparatively low literacy rate of 36.9% compared to the national average of 69% [64]. However, since 2015, the national literacy rate increased from 65% to 74%, as part of a cumulative effort to increase the education status throughout the country, and the increase in years of school can be explained as part of this effort [65].
Another socioeconomic factor assessed was tenure, which decreased from 17.31 years to 14.89 years during the considered time. The decrease in tenure years indicated the establishment of new houses in the community, as the new houses have lower numbers of tenure years. One of the causes may be the integration of the Rohingya refugees into the local community, but this type of integration has no official record. While pre-testing the questionnaire and having focus group discussions with the local community, some of the participants mentioned unregistered Rohingya refugees living in the local community. In most cases, the unregistered Rohingya refugees were relatives of residents of the host community. Due to their Indo-Aryan appearance and almost-similar dialect, it is not always easy to distinguish the Rohingya and the local residents’ identities. Therefore, there is a possibility that some Rohingya refugees were living outside the camps and renting local houses. However, there is no legal documentation of refugees living outside the camps, so this issue needs further investigation.
Land property followed a similar decreasing trend. Land property decreased from 0.13 to 0.08 ha, and several factors could be responsible. As many NGO offices were established in the Teknaf and Ukhia regions to support the refugees’ aid provision, rent increased by two to three times. Many people rented their houses to NGO offices and moved to district cities for more comfortable lives. These rented households were recorded as having access to the homestead plot, but with no farmland. When renting houses, only a small portion of the homestead lot was rented. Moreover, some large farm families migrated to the district city for security reasons and left their house vacant or rented. These causes contributed to scaling down the average land property by nearly 40%. Thus, the decreased tenure and land property had a probable correlation with the refugee influx; the causation, extent, and nature of the relationship need further study.
Annual income is the gauge that many use to determine a community’s socioeconomic status and well-being. After the Rohingya influx, the annual income decreased by nearly 24% in the considered study area. Since 2006, the rural poverty headcount in Bangladesh decreased from 52% to 27% [66], which is in stark contrast to the declining household income in the Teknaf and Ukhia regions. Besides this, during the comparison time period, no major natural disaster, policy change, political conflict, or regional economic crisis occurred. As such, this income decrease can be related to the impact of hosting nearly one million refugees concentrated in these two upazilas. However, the annual income decline showed varied trends among the different community strata. In order to more precisely determine the impact of the refugee influx, it is important to know which community strata had the most decreased income, and based on this understanding, aid initiatives should be reassessed.
This study found that, occupation-wise, the household annual income changes were not equally proportionate. The annual income from households with laborers and service workers decreased by more than 30%. All of the other income-generating activities also faced moderate declines in annual income. On the contrary, the income from farming increased by 29%. These findings were in line with the existing records on the economic status of the host community showing declining labor wages, whereas production and income improved for agriculture [20,37]. More specifically, the United Nations Development Programme- UNDP (2018) found that the daily wages for casual labor decreased by nearly 65%, from 500–600 BDT to 200 BDT. Occupations related to daily wages, such as labor and service, experienced the greatest decrease in annual income and an upsurge in the number of households. More people engaging in low income-generating activities was also an indication of decaying social structures. These low income-generating activities were often shared with the refugees. Farming and business require financial and/or natural capital, which is difficult for the refugees to manage. Engaging in labor-based income is the only option left for the refugees. Thus, the increased number of households with decreased incomes in these low wage-based occupations indicated poor socioeconomic status and a possible infiltration of the refugee population in these sectors.
When considering the status of villages, most of the villages’ socioeconomic statuses degraded after the recent refugee influx, with few exceptions. More than half of the villages were in the low category, and most shifted to the low category after the refugee influx. Although Teknaf upazila is not among the most prosperous regions in the country, but is a part of a country with continuous GDP growth of nearly 6% since 2011 [67], the decreased socioeconomic status of the households and villages contrasted with the overall trend in the country. Moreover, after the refugee influx, the country did not experience any kind of financial crises, natural calamity, political regime shift, or major policy change. The socioeconomic degradation of most of the villages was due to external and local factors, and in the Teknaf and Ukhia regions, the refugee influx is one of those factors. Several other studies also reported poverty and the socioeconomic degradation of the host community due to the refugee influx [1,37,68], and the findings of this study are in line to relate the socioeconomic change with the recent refugee influx.
However, it is important to understand the causation and factors related to the status change. Understanding the trends in the status decreases of the villages will be helpful for implementing refugee camp management plans. Labor and service-related occupations had the greatest decrease in income, and a higher frequency in the low village groups. Most of the villages in the low group either had at least one labor or service-related household with more than 25% frequency. Conversely, the villages with more than 25% farming households tended to be in the high group. Therefore, it can be concluded that the villages with a higher percentage of laborer and service worker households experienced the most degradation after the refugee influx. This understanding of village grouping will be helpful for distributing benefits and planning social safety net programs to mitigate the impact of the refugee influx on the host community.

6.2. Perception, Problems, and Initiatives Regarding the Refugee Influx

When the recent refugee influx began, large waves of Rohingya refugees started to flee to Bangladesh. This study found that the local community initially welcomed the refugees, but as the numbers of refugees increased, the host community members started to face various difficulties in their day-to-day lives, and their initial sympathy waned. This was reflected in the general perception toward the refugees. In 2017, 72% of the local residents had positive attitudes, which changed to 60% having negative attitudes. Their negative attitudes toward the refugees were common, and can be described by group conflict theory, in which hostile reactions toward out-groups arise when the in-group feels threatened regarding their economic and cultural interests [69,70]. However, there are also exceptions to this theory. Regardless of high GDP and good socioeconomic status, the host communities had negative perceptions of the refugees [71], but in Teknaf, the general perception of the Rohingya refugees shifted from positive to negative over time because the burden of the refugee presence started to alter the livelihoods of the host communities. Among the host communities, 94% of households reported that the Rohingya refugees were responsible for creating problems in the host communities. Among the problems stated by the local communities, difficulties with birth registration, the price increase of goods, security crisis, and sharing livelihoods were often-faced problems. After the refugee influx started, the government stopped online birth registration services in the Teknaf and Ukhia upazilas, and the local residents had to go to the district office in Cox’s Bazar to register new childbirths. Refugee hosting management initiatives should address disruptions in governmental services, and the residents’ basic rights should be maintained even if extra effort is required. Otherwise, frustration among the host community will increase day by day.
Managing nearly one million refugees is a complex task that requires considerable financial support and coordinated efforts from the host country and the international community. Nearly one billion dollars is estimated to be needed for various forms of aid support each year. In order to mitigate the impact and burden on the host communities, the JRP follows a general rule to allocate about 20% of the total annual budget for host communities. In 2020, the JRP targeted 949,000 host community members out of a total population of 2.4 million in Cox’s Bazar in 2020 [41]. The benefits provided to the host communities included supplying cooking fuel in the form of liquid gas, food bags, and establishing wells for drinking water. Some were targeted beneficiary steps only for the affected populations. This included wage support for daily laborers, home gardening kits for affected households, and medication for vulnerable host community members [37]. However, the efforts taken to date cannot compensate for the burdens the host communities are facing. The current mode of aid support by providing goods may hamper the local economy, whereas aid in form of cash for refugees may be beneficial for the local economy [54].
This study’s results elucidated the changes of the socioeconomic status of the host community. Teknaf and Ukhia were already among the poorest regions, where residents depend on natural resources with very limited alternatives for their livelihoods. There are examples of previous large-scale forced migration in poor countries causing serious damage to natural resources [13]. After the refugee influx, natural resources paid a toll to meet the extra demand. In order to meet the demand for the refugees, the ground water intake increased, and nearly 100% of the refugees’ drinking water came from underground wells [18]. Providing sanitation facilities for the high number of refugees in difficult topography was not an easy task, and there was concern for public health and soil degradation [72]. All of the refugee camps were established inside forest areas. When the camps were established, deforestation occurred by clearing the land cover, and due to the continuous presence of refugees inside the forests, the trend in deforestation was expected to continue [73]. Therefore, the threat of environmental degradation coupled with the dwindling socioeconomic status of the host communities increased the possibility of large-scale calamities in the region.

7. Conclusions

This study found significant changes in the socioeconomic structure of the host community in Teknaf after 2017, which indicated some correlations with the large refugee influx, but the relationship is multifaceted and may evolve in the future. However, this study’s findings suggested that most of the host communities responded to having problems due to the refugee influx. Understanding the problems and benefits due to hosting refugees is important, and is also a prerequisite for effectively managing the aid provided by the JRP to the Rohingya refugees and host communities. This study showed that the annual income of the host communities significantly decreased, except for households associated with farming. Labor and service-dependent households were the most affected among the host communities, with a decrease of 38% and 34% in annual income, respectively. Clustering the villages showed that more than half were in the ‘low’ group, which indicated weak socioeconomic conditions, and a substantial number of villages shifted to the ‘low’ group after 2017.
The establishment of temporary Rohingya refugee camps in Bangladesh is evolving into a long-term refugee hosting situation which was initially intended to be a short-term shelter for the refugees. As the Rohingya refugees have no possibility of repatriation in the near future, it is necessary to develop long-term plans regarding the refugees, considering their impact on the surrounding host communities and the environment. In the Rohingya refugee camps, aid is currently provided in the form of goods which are suitable for short-term support [74]. However, strict encampment policies coupled with support provided in goods make refugees more dependent on aid. A less strict encampment policy providing aid in terms of cash could make refugees less dependent on aid, and could contribute to the local economy when they buy goods from local markets. However, in the Rohingya refugee issue, the government is facing a dilemma to determine the refugee support policies. If the refugees are strictly encamped with few opportunities to engage in income-generating activities, they will become more dependent on aid. If the government becomes less strict and lets the refugees work, they may become self-dependent and contribute to the local economy. However, a less strict policy might cause the Myanmar government to persecute the Rohingya remaining in their country and force them to flee to Bangladesh.
The international community and Bangladesh must pressure Myanmar for peaceful repatriation, and must try to mitigate the extra pressure on the host communities and local environment. There is a nexus between poverty and environmental degradation in which the poor become the perpetrators and victims of the situation. Experts are already putting red flags on the local areas hosting the refugees due to possible forest degradation, water scarcity, and waste disposal mismanagement. Moreover, the regions hosting the refugees are in the southern coastal area, and coastal regions are vulnerable to climate change. The preparation and planning for hosting large numbers of refugees in such a vulnerable region needs to be based on empirical evidence, and an in-depth socioeconomic understanding of the local community can be an important part of this effort.

Author Contributions

Conceptualization, methodology, formal analysis, data curation, writing—original draft preparation, S.M.A.U.; supervision, project administration, funding acquisition, M.T.; supervision, K.A., M.M. All authors have read and agreed to the published version of the manuscript.

Funding

This research was funded by JSPS, grant numbers 15H02612, 19H00561 and 20K20020, and the APC was funded by JSPS grant 19H00561.

Informed Consent Statement

Informed consent was obtained from all subjects involved in the study.

Conflicts of Interest

The authors declare no conflict of interest.

Appendix A

Table A1. Presenting the percentage of frequency of the villages in 2020.
VillageAbroadBusinessFarmerFishermanLaborerService Worker
Bara Dail25132612816
Dargachhara51530151520
Hatiarghona1712450719
Marish Bania3123263107
Mathabhanga812600128
Mitta Panirchhara10827211717
Hajam Para B5163716188
Jahajpura1202523247
Shilbania Para06400036
Uttar Shilkhali92212301116
Halbania111724182110
Dakshin Shilkhali7143083011
Jahalia Para5182222331
Lengurbil11257152022
Bara Habib Para01010104030
Baraitali550114732
Chhota Habib Para074112454
Dail Para114400243
Goder Bil6315102821
Habibchhara01810282321
Hajam Para T038038230
Hankar Para136300025
Kachapia884115218
Kachubunia214918948
Kerantali15100104025
Khonkar Para4412441224
Lambori6911371720
Mohish Khalia Para299242530
Moulvi Para013033945
Natun Pallan Para320662244
Nazir Para09094538
Noakhali5726183410
Razarchhara61726111426
Shamlapur6205302613
Tulatali500423221
Sustainability 13 04240 i001

References

  1. Huang, C.; Ash, N.; Marcus, S.; Kate, G. The Rohingya Crisis: Bangladesh Deserves a Win-Win Solidarity Compact; Center for Global Development, 2018. Available online: https://www.cgdev.org/publication/rohingya-crisis-bangladesh-deserves-win-win-solidarity-compact (accessed on 12 November 2020).
  2. UNHCR. Figures at a Glance. Available online: https://www.unhcr.org/figures-at-a-glance.html (accessed on 12 November 2020).
  3. Eurostat. Expert Group on Refugee and Internally Displaced Persons Statistics. In International Recommendations on Refugee Statistics; Eurostat: Luxembourg, 2018; Available online: http://ec.europa.eu/eurostat/about/policies/copyright (accessed on 19 October 2020).
  4. UN Human Rights OHCHR. Human Rights Council Opens Special Session on the Situation of Human Rights of the Rohingya and Other Minorities in Rakhine State in Myanmar. Available online: https://www.ohchr.org/EN/NewsEvents/Pages/DisplayNews.aspx?NewsID=22491&LangID=E (accessed on 22 October 2020).
  5. National Geographic the Rohingya People—Facts and Information. Available online: https://www.nationalgeographic.com/culture/people/reference/rohingya-people/ (accessed on 22 October 2020).
  6. Haque, M.M. Rohingya ethnic muslim minority and the 1982 citizenship law in Burma. J. Muslim Minor. Aff. 2017, 37, 454–469. [Google Scholar] [CrossRef]
  7. UNHCR. Document—UNHCR Bangladesh—Operational Update External—September 2020 (#56). 2020. Available online: https://data2.unhcr.org/en/documents/details/79658 (accessed on 19 October 2020).
  8. UNHCR. Solutions. Available online: https://www.unhcr.org/solutions.html (accessed on 22 October 2020).
  9. JRP. Joint Response Plan: Rohingya Humanitarian Crisis. 2020. Available online: https://reliefweb.int/sites/reliefweb.int/files/resources/jrp_2020_final_in-design_280220.2mb_0.pdf (accessed on 23 October 2020).
  10. IOM. Bangladesh | IOM Bangladesh: Rohingya Refugee Crisis Response; External Update; December 2018. International Organization for Migration, 2019. Available online: https://www.iom.int/sitreps/bangladesh-iom-bangladesh-rohingya-refugee-crisis-response-external-update-december-2018 (accessed on 23 October 2020).
  11. Crawford, N.; Cosgrave, J.; Haysom, S.; Walicki, N. HPG Humanitarian Policy Group. 2015. Available online: https://www.internal-displacement.org/publications/protracted-displacement-uncertain-paths-to-self-reliance-in-exile (accessed on 23 October 2020).
  12. Coast. Host Community Should Be Heard during Humanitarian Intervention in FDMN/Rohingya Relief Operation. 2018. Available online: http://coastbd.net/wp-content/uploads/2020/07/2.7-Flyer.pdf (accessed on 23 October 2020).
  13. Tafere, M. Forced displacements and the environment: Its place in national and international climate agenda. J. Environ. Manag. 2018, 224, 191–201. [Google Scholar] [CrossRef] [PubMed]
  14. Moslehuddin, A.Z.M.; Rahman, M.A.; Ullah, S.M.A.; Moriyama, M.; Tani, M. Physiography, Forests, and People in Teknaf. In Deforestation in the Teknaf Peninsula of Bangladesh; Springer: Singapore, 2018; pp. 11–40. [Google Scholar]
  15. Quader, M.A.; Dey, H.; Malak, M.A.; Sajib, A.M. Rohingya refugee flooding and changes of the physical and social landscape in Ukhiya, Bangladesh. Environ. Dev. Sustain. 2020, 1–25. [Google Scholar] [CrossRef]
  16. Hassan, M.; Smith, A.; Walker, K.; Rahman, M.; Southworth, J. Rohingya Refugee Crisis and Forest Cover Change in Teknaf, Bangladesh. Remote Sens. 2018, 10, 689. [Google Scholar] [CrossRef] [Green Version]
  17. Braun, A.; Fakhri, F.; Hochschild, V. Refugee Camp Monitoring and Environmental Change Assessment of Kutupalong, Bangladesh, Based on Radar Imagery of Sentinel-1 and ALOS-2. Remote Sens. 2019, 11, 2047. [Google Scholar] [CrossRef] [Green Version]
  18. Akhter, M.; Uddin, S.M.N.; Rafa, N.; Hridi, S.M.; Staddon, C.; Powell, W. Drinking water security challenges in rohingya refugee camps of cox’s bazar, Bangladesh. Sustainability 2020, 12, 7325. [Google Scholar] [CrossRef]
  19. Duraiappah, A.K. Poverty and environmental degradation: A review and analysis of the Nexus. World Dev. 1998, 26, 2169–2179. [Google Scholar] [CrossRef]
  20. ISCG. Joint Multi-Sector Needs Assessment (J-MSNA): Host Communities in Teknaf and Ukhiya Upazilas—September 2019. 2019. Available online: https://reliefweb.int/report/bangladesh/joint-multi-sector-needs-assessment-j-msna-host-communities-teknaf-and-ukhiya (accessed on 27 November 2020).
  21. Massey, D.S.; Arango, J.; Hugo, G.; Kouaouci, A.; Pellegrino, A.; Taylor, J.E. Theories of international migration: A review and appraisal. Popul. Dev. Rev. 1993, 19, 431–466. [Google Scholar] [CrossRef]
  22. Kritz, M. International Migration Systems: A Global Approach; Oxford University Press: Oxford, UK, 1992; ISBN 9780198283560. [Google Scholar]
  23. Fawcett, J.T. Networks, linkages, and migration systems. Int. Migr. Rev. 1989, 23, 671–680. [Google Scholar] [CrossRef]
  24. Jonathan, W.; Anu, M.; Khaled, R.; Frank, M.; Jacques, B.; James, M.; Tarek, E.; Amadeo, D.L.; Ashwin, H. People on the Move: Global Migration’s Impact and Opportunity. 2016. Available online: https://www.mckinsey.com/~/media/McKinsey/Featured Insights/Employment and Growth/Global migrations impact and opportunity/MGI-People-on-the-Move-Full-report.pdf (accessed on 21 October 2020).
  25. Amnesty International Refugees, Asylum-Seekers and Migrants | Amnesty International. Available online: https://www.amnesty.org/en/what-we-do/refugees-asylum-seekers-and-migrants/ (accessed on 21 October 2020).
  26. Noh, S.; Beiser, M.; Kaspar, V.; Hou, F.; Rummens, J. Perceived racial discrimination, depression, and coping: A study of Southeast Asian refugees in Canada. J. Health Soc. Behav. 1999, 40, 193–207. [Google Scholar] [CrossRef]
  27. Cho, W.; Ho, A.T. Does neighborhood crime matter? A multi-year survey study on perceptions of race, victimization, and public safety. Int. J. Law Crime Justice 2018, 55, 13–26. [Google Scholar] [CrossRef]
  28. Timshel, I.; Montgomery, E.; Dalgaard, N.T. A systematic review of risk and protective factors associated with family related violence in refugee families. Child Abus. Negl. 2017, 70, 315–330. [Google Scholar] [CrossRef]
  29. Korac, M. Integration and How We Facilitate it. Sociology 2003, 37, 51–68. [Google Scholar] [CrossRef]
  30. De Vita, G.; Oppido, S. Inclusive Cities for Intercultural Communities: European Experience. Procedia Soc. Behav. Sci. 2016, 223, 134–140. [Google Scholar] [CrossRef] [Green Version]
  31. Pressé, D.; Thomson, J. The Resettlement Challenge: Integration of Refugees from Protracted Refugee Situations. Refug. Can. J. Refug. 2007, 48–53. [Google Scholar] [CrossRef]
  32. Maystadt, J.-F.; Hirvonen, K.; Mabiso, A.; Vandercasteelen, J. Impacts of Hosting Forced Migrants in Poor Countries. Annu. Rev. Resour. Econ. 2019, 11, 439–459. [Google Scholar] [CrossRef]
  33. Rahman, U. The Rohingya refugee: A security dilemma for Bangladesh. J. Immigr. Refug. Stud. 2010, 8, 233–239. [Google Scholar] [CrossRef]
  34. UNHCR. UNHCR—Living Silence: Rohingya Refugees in Bangladesh. Available online: https://www.unhcr.org/news/press/2010/6/57c966087/living-silence-rohingya-refugees-in-bangladesh.html (accessed on 11 November 2020).
  35. UNHCR. Document—Weekly Operational Update, External; UNHCR: Cox’s Bazar, Bangladesh, 2017; Available online: https://data2.unhcr.org/en/documents/details/61455 (accessed on 19 October 2020).
  36. Ahmed, I. The Plight of the Stateless Rohingyas: Responses of the State, Society & the International Community; The University Press Limited: Dhaka, Bangladesh, 2010; ISBN 9789845060158. [Google Scholar]
  37. UNDP. Impacts of the Rohingya Refugee Influx on Host Communities—Bangladesh | ReliefWeb. 2018. Available online: https://reliefweb.int/report/bangladesh/impacts-rohingya-refugee-influx-host-communities (accessed on 12 November 2020).
  38. ISCG 2019 Joint Response Plan for Rohingya Humanitarian Crisis—January to December | HumanitarianResponse. Available online: https://www.humanitarianresponse.info/en/operations/bangladesh/document/2019-joint-response-plan-rohingya-humanitarian-crisis-january (accessed on 11 November 2020).
  39. ISCG Humanitarian Response Plan [September 2017–February 2018]—Final Report | HumanitarianResponse. Available online: https://www.humanitarianresponse.info/en/operations/bangladesh/document/humanitarian-response-plan-september-2017-february-2018-final-report (accessed on 11 November 2020).
  40. ISCG 2020 Joint Response Plan for Rohingya Humanitarian Crisis—January to December | HumanitarianResponse. Available online: https://www.humanitarianresponse.info/en/operations/bangladesh/document/2020-joint-response-plan-rohingya-humanitarian-crisis-january-0 (accessed on 11 November 2020).
  41. ISCG. Situation Report Rohingya Refugee Crisis; ISCG: Cox’s Bazar, Bangladesh, 2020; Available online: https://reliefweb.int/report/bangladesh/iscg-situation-report-rohingya-refugee-crisis-cox-s-bazar-september-2020 (accessed on 11 November 2020).
  42. Wake, C.; Yu, B. HPG Humanitarian Policy Group the Rohingya Crisis Making the Transition from Emergency to Longer-Term Development. 2018. Available online: https://odi.org/en/publications/the-rohingya-crisis-making-the-transition-from-emergency-to-longer-term-development/ (accessed on 11 November 2020).
  43. Habib, M.; Jubb, C.; Ahmad, S.; Rahman, M.; Pallard, H. Forced Migration of Rohingya: The Untold Experience; Ontario International Development Agency: Ottawa, ON, Canada, 2018; ISBN 9780986681516. [Google Scholar]
  44. XCHANGE Xchange Explores What Return Means for the Rohingya in Latest Repatriation Survey | Xchange. Available online: http://xchange.org/xchange-explores-what-return-means-for-the-rohingya-in-latest-repatriation-survey/ (accessed on 11 November 2020).
  45. BBS. Population and Housing Census 2011. 2011. Available online: http://203.112.218.65:8008/PageWebMenuContent.aspx?MenuKey=446 (accessed on 12 November 2020).
  46. Angelsen, A.; Overgaard, H.L.; Lund, J.F.; Carsten, S.-H.; Wunder, S. Measuring Livelihoods and Environmental Dependence: Methods for Research and Fieldwork; Center for International Forestry Research (CIFOR): New York, NY, USA, 2011. [Google Scholar]
  47. Ribot, J.C.; Peluso, N.L. A Theory of Access. Rural Sociol. 2003, 68, 153–181. [Google Scholar] [CrossRef]
  48. Setyaningsih, S. Using Cluster Analysis Study to Examine the Successful Performance Entrepreneur in Indonesia. Procedia Econ. Financ. 2012, 4, 286–298. [Google Scholar] [CrossRef] [Green Version]
  49. Halkidi, M.; Batistakis, Y.; Vazirgiannis, M. On clustering validation techniques. J. Intell. Inf. Syst. 2001, 17, 107–145. [Google Scholar] [CrossRef]
  50. Tan, P.; Steinbach, M.; Karpatne, A.; Kumar, A. (Eds.) Data Mining Cluster Analysis: Basic Concepts and Algorithms. In Introduction to Data Mining, 2nd ed.; Pearson: London, UK, 2019; ISBN 013312890. [Google Scholar]
  51. Groot, W. Adaptation and scale of reference bias in self-assessments of quality of life. J. Health Econ. 2000, 19, 403–420. [Google Scholar] [CrossRef]
  52. Layes, A.; Asada, Y.; Kepart, G. Whiners and deniers—What does self-rated health measure? Soc. Sci. Med. 2012, 75, 1–9. [Google Scholar] [CrossRef]
  53. Post, L.; Landry, R.; Huang, C. Moving beyond the Emergency: A Whole of Society Approach to the Refugee Response in Bangladesh, CDG-IRC Note. 2019. Available online: https://www.ohchr.org/EN/HRBodies/HRC/Pages/NewsDetail.aspx?NewsID=23475&Lan- (accessed on 15 November 2020).
  54. Taylor, J.E. Research: Refugees Can Bolster a Region’s Economy. Available online: https://hbr.org/2016/10/research-refugees-can-bolster-a-regions-economy (accessed on 25 November 2020).
  55. Bakewell, O. Repatriation and self-settled refugees in Zambia: Bringing solutions to the wrong problems. J. Refug. Stud. 2000, 13, 356–373. [Google Scholar] [CrossRef]
  56. Leach, M. Dealing with Displacement: Refugee-Host Relations, Food and Forest Resources in Sierra Leonean Mende Communities during the Liberian Influx, 1990–1991; Institute of Development Studies, 1992. Available online: https://www.ids.ac.uk/publications/dealing-with-displacement-refugee-host-relations-food-and-forest-resources-in-sierra-leonean-mende-communities-during-the-liberian-influx-1990-91/ (accessed on 25 November 2020).
  57. Black, R. Forced migration and environmental change: The impact of refugees on host environments. J. Environ. Manag. 1994, 42, 261–277. [Google Scholar] [CrossRef]
  58. Solomon, N.; Birhane, E.; Gordon, C.; Haile, M.; Taheri, F.; Azadi, H.; Scheffran, J. Environmental impacts and causes of conflict in the Horn of Africa: A review. Earth Sci. Rev. 2018, 177, 284–290. [Google Scholar] [CrossRef]
  59. Dick, S. Responding to Protracted Refugee Situations: A Case Study of Liberian Refugees in Ghana. 2002. Available online: https://www.unhcr.org/research/evalreports/3d40059b4/responding-protracted-refugee-situations-case-study-liberian-refugees-ghana.html (accessed on 25 November 2020).
  60. Crisp, J. Forms and sources of violence in Kenya’s refugee camps. Refug. Surv. Q. 2000, 19, 54–70. [Google Scholar] [CrossRef]
  61. Makanya, S.T. The desire to return. In When Refugees Go Home; Morshink, H., Allen, T., Eds.; Africa World Press: Laurenceville, GA, USA, 1994; ISBN 0865434336. [Google Scholar]
  62. Rutinwa, B.; Kamanga, D. Impact of Refugees in Northwestern Tanzania. 2003. Available online: https://repositories.lib.utexas.edu/handle/2152/4679?show=full (accessed on 25 November 2020).
  63. Boateng, A. A Mixed Methods Analysis of Social Capital of Liberian Refugee Women in Ghana. J. Sociol. Soc. Welf. 2009, 36, 59–81. [Google Scholar]
  64. BBS. Bangladesh Statistics 2018; BBS: Dhaka, Bangladesh, 2018. Available online: http://bbs.portal.gov.bd/sites/default/files/files/bbs.portal.gov.bd/page/a1d32f13_8553_44f1_92e6_8ff80a4ff82e/BangladeshStatistics-2018.pdf (accessed on 27 November 2020).
  65. The World Bank Literacy Rate, Adult Total (% of People Ages 15 and above)—Bangladesh | Data. Available online: https://data.worldbank.org/indicator/SE.ADT.LITR.ZS?locations=BD (accessed on 23 November 2020).
  66. World Bank. Bangladesh Poverty Assessment; World Bank: Washington, DC, USA, 2019. [Google Scholar]
  67. The World Bank GDP per Capita Growth (Annual %)—Bangladesh | Data. Available online: https://data.worldbank.org/indicator/NY.GDP.PCAP.KD.ZG?locations=BD (accessed on 27 November 2020).
  68. Babu, K.-E.-K. The impacts and challenges to host country Bangladesh due to sheltering the Rohingya refugees. Cogent Soc. Sci. 2020, 6, 1770943. [Google Scholar] [CrossRef]
  69. Blumer, H. Race Prejudice as a Sense of Group Position. Pac. Sociol. Rev. 1958, 1, 3–7. [Google Scholar] [CrossRef]
  70. Blalock, H.M. Toward a Theory of Minority-Group Relations; Wiley: New York, NY, USA, 1967. [Google Scholar]
  71. Ruist, J. How the macroeconomic context impacts on attitudes to immigration: Evidence from within-country variation. Soc. Sci. Res. 2016, 60, 125–134. [Google Scholar] [CrossRef] [PubMed]
  72. UNHCR. Bangladesh: Rohingya Refugee Response Factsheet—WASH-ReliefWeb. 2020. Available online: https://reliefweb.int/report/bangladesh/bangladesh-rohingya-refugee-response-factsheet-wash-31-december-2019 (accessed on 31 January 2021).
  73. Hasan, M.E.; Zhang, L.; Dewan, A.; Guo, H.; Mahmood, R. Spatiotemporal pattern of forest degradation and loss of ecosystem function associated with Rohingya influx: A geospatial approach. Land Degrad. Dev. 2020, ldr.3821. [Google Scholar] [CrossRef]
  74. De Bruin, N.; Becker, P. Encampment and Cash-Based Transfer: Concord and Controversy in the World Food Programme’s Pilot Project in Nyarugusu Refugee Camp in Tanzania. J. Immigr. Refug. Stud. 2019, 17, 492–508. [Google Scholar] [CrossRef]
Figure 1. Timeline of events during the refugee influx in Bangladesh.
Sustainability 13 04240 g001
Figure 2. Maps showing the study area with the refugee camps and concerned villages.
Sustainability 13 04240 g002
Figure 3. Host community household survey framework, with variables.
Sustainability 13 04240 g003
Figure 4. Map showing the village groups in 2016 and 2020, with the changes. Here, villages number 1 to 11 are under Baharchhara union, and 12 to 35 are under Teknaf Sadar union. ① Shamlapur, ② Uttar Shilkhali, ③ Dakshin Shilkhali, ④ Halbania, ⑤ Jahajpura, ⑥ Hajam Para, ⑦ Mathabhanga, ⑧ Marishbania, ⑨ Baradail, ⑩ Kacchapia, ⑪ Noakhali, ⑫ Razarchhara, ⑬ Habibchhara, ⑭ Dargachhara, ⑮ Mitta Panirchhara, ⑯ Hatiarghona, ⑰ Lambori, ⑱ Tulatali, ⑲ Lengurbil, ⑳ Mahishkhalia Para, ㉑ Khonkar Para, ㉒ Hajam Para, ㉓ Kachubania, ㉔ Bara Habib Para, ㉕ Moulvi Para, ㉖ Choto Habib Para, ㉗ Nazir Para, ㉘ Hankar Para, ㉙ Shilbania Para, ㉚ Dail Para, ㉛ Goder Bil, ㉜ Natun Pallan Para, ㉝ Jahalia Para, ㉞ Kerantali, ㉟ Baraitali.
Sustainability 13 04240 g004
Figure 5. Occupational household distribution among the village groups from 2016 to 2020.
Sustainability 13 04240 g005
Figure 6. Problems faced by the host community, and their general opinion towards refugees.
Sustainability 13 04240 g006
Table 1. Socioeconomic differences in the host communities between 2015 and 2020.
VariableYearNMeanStd. Deviationt Valuep Value
Age2015192439.911.9995.2190.000
2020226537.912.451
Family size201519246.22.45610.9980.000
202022655.52.082
Tenure2015192417.321.4084.3260.000
2020226514.914.561
Education201519241.93.373−5.2660.000
202022652.43.367
Annual income20151924187,352165,239.2759.2090.000
20202265142,884147,214.723
Land201519240.130.1910.4410.000
202022650.080.12
Table 2. Occupational mean differences in the host communities.
YearNumberMeant Valuep ValueIncome ChangeFrequency Change
Abroad2015210407,6611.5810.115−23%−25%
2020157314,943
Business2015371269,1245.0260.000−30%7%
2020398187,773
Farmer2015394188,603−4.3990.00029%−17%
2020327244,234
Fishermen2015307129,7002.5080.012−23%33%
202040899,566
Laborer2015318104,3149.2110.000−38%58%
202050465,020
Service worker2015324159,8156.0920.000−34%45%
2020471106,262
Publisher’s Note: MDPI stays neutral with regard to jurisdictional claims in published maps and institutional affiliations.

