Article

Critical Determinants of Household Electricity Consumption in a Rapidly Growing City

by
Sharif Shofirun Sharif Ali
1,2,
Muhammad Rizal Razman
2,*,
Azahan Awang
3,
M. R. M. Asyraf
4,
M. R. Ishak
4,
R. A. Ilyas
5,6 and
Roderick John Lawrence
7
1
School of Government, College of Law, Government and International Studies (COLGIS), Universiti Utara Malaysia (UUM), Sintok 06010, Malaysia
2
Research Centre for Sustainability Science and Governance (SGK), Institute for Environment and Development (LESTARI), Universiti Kebangsaan Malaysia (UKM), Bangi 43600, Malaysia
3
School of Social, Development and Environmental Studies, Faculty of Social Science and Humanities, Universiti Kebangsaan Malaysia (UKM), Bangi 43600, Malaysia
4
Department of Aerospace Engineering, Faculty of Engineering, Universiti Putra Malaysia (UPM), Serdang 43400, Malaysia
5
Sustainable Waste Management Research Group (SWAM), School of Chemical and Energy Engineering, Faculty of Engineering, Universiti Teknologi Malaysia, Johor Bahru 81310, Malaysia
6
Centre for Advanced Composite Materials (CACM), Universiti Teknologi Malaysia, Johor Bahru 81310, Malaysia
7
Geneva School of Social Sciences (G3S), University of Geneva, 4 1211 Geneva, Switzerland
*
Author to whom correspondence should be addressed.
Sustainability 2021, 13(8), 4441; https://0-doi-org.brum.beds.ac.uk/10.3390/su13084441
Submission received: 2 March 2021 / Revised: 30 March 2021 / Accepted: 9 April 2021 / Published: 15 April 2021
(This article belongs to the Special Issue Energy Consumption and Sustainable Urban Environment)

Abstract

:
Despite growing urban electricity consumption, information on actual energy use in the household sector is still limited and causal factors leading to electricity consumption remain speculative due to urban expansion and its growing complexity, particularly in developing countries such as Malaysia. This study aims to examine the critical determinants of household electricity consumption by evaluating the patterns and flows of consumption and analysing relationships and their effects on electricity usage among 620 urban households in Seremban, Malaysia. Results suggest that the average urban household electricity consumption is 648.31 kWh/month; this value continues to grow with the increase in the household monthly income (r = 0.360; p < 0.01) and number of rooms (r = 0.360; p < 0.01) as quality of life improves. A large portion of electricity is allocated for kitchen/home consumption, followed by cooling and lighting. Multiple linear regressions revealed that married households with a high monthly income and living in spacious houses together with three to five people are important predictors of electricity consumption in Seremban. This study empirically identified that the number of rooms is the most critical factor of electricity consumption and strategies to increase energy efficiency, maintain resource sustainability and minimise greenhouse gas threat on the urban ecosystem are vital. Therefore, promoting low carbon initiatives for energy conservation and technology improvement and implementing policies in the domestic sector are essential to achieve the greatest potential energy consumption reduction in urban regions.

1. Introduction

Research on energy consumption has become a focal point recently, with various aspects of energy being investigated, particularly in emerging economic countries. Malaysia is a developing country that is highly dependent on energy. The share of primary energy supply has been increasing considerably to ensure the sustainability of economic development. Natural gas represented approximately 41.9% of the Malaysian primary energy supply in 2017, followed by crude oil (27.9%) and coal (21.1%) (Figure 1). Rapid economic growth and a high concentration of urban inhabitants have resulted in high energy consumption in urban regions [1,2,3]. Such high urban electricity consumption has resulted in a significant threat to and degradation of the urban environment, as exhibited by urban heat islands and intensified greenhouse gas emissions [4,5,6,7].
Asian countries, particularly China (27%), India (6.8%) and Japan (3.3%), contribute to approximately 53% of global emissions [8]. The Association of Southeast Asia Nations (ASEAN) region contributed approximately 1298 Mt of carbon emissions in 2016, which was mainly generated by Indonesia, Thailand and Malaysia [9]. Therefore, energy efficiency policies and energy savings among households for this sector are becoming important issues in all economic sectors with the continuous expansion of urban regions. Urban regions are a significant user of energy and materials due to high population and economic growth [10,11,12]. Megacities such as Shenzhen utilise approximately 87% of electricity power in end use consumption, followed by Osaka (85%), Tokyo (77%) and Sao Paolo (67%) [13]. As a result, megacities such as Tokyo release approximately 60 million tons of energy-related carbon dioxide (CO2), equivalent to 5.1% of Japan’s domestic emission [14]. In the context of Malaysia, electricity consumption in Peninsular Malaysia increased from approximately 73,987 GWh in 2005 to 116,529 GWh (45.2%) in 2016 [15]. In the same period, electricity consumption per capita grew from 3560 kWh to 4662 kWh, correlating to an increase of approximately 30.95%, in line with the population and economic growth of Malaysia. The domestic sector represented approximately 21.61% of the total electricity consumption in Malaysia [2]. This sector is projected to grow by 2.9% from approximately 10 million tons of oil equivalent (Mtoe) in 2013 to 22 Mtoe in 2040, with the major electricity demand expected to come from the building sector, which is expected to make up 68% of the total electricity demand in 2040 [16].
Figure 1. Share of Malaysia primary energy supply (a) and electricity supply (b) in 2017 [15].
Sustainability 13 04441 g001
Numerous studies have indicated that electricity consumption is significantly related to socioeconomic background [17,18,19,20,21], housing characteristics [22,23,24], climatic conditions [25,26,27], economic growth [28,29,30] and behavioural factors [18,31,32,33]. The links between electricity consumption and income have been found in numerous studies [34,35,36]. Chen et al. [18] found that young households consumed more electricity than elderly households. This finding explained approximately 28.8% of the variation in energy consumption, particularly for heating and cooling among Chinese households. Huebner et al. [37] revealed that the highest variability in energy consumption was explained by building factors. Similarly, a significant relationship was found between dwelling factors and electricity consumption [38]. Several studies focused on identifying factors related to household electricity consumption and the perception of the household towards resource efficiency at home. In this case, the electricity consumption can be determined by the household income, the size of the household and the number of appliances owned [39]. Wahlstrom and Harsman [40] indicated that household size also significantly contributes to the high electricity consumption in residential areas because a larger household would require more energy than a smaller household, especially for heating and cooling. Numerous studies have also proven that the age of the household significantly affects electricity consumption [40,41], whereas few studies indicated contrary findings [42,43]. Other studies found that housing characteristics, such as housing size, age of household, type of house and appliance usage, significantly influence electricity consumption [43,44].
This study produces important findings in the field of residential energy consumption in a rapidly growing city in a developing country like Malaysia. Moreover, it provides an understanding of the urban energy consumption characteristics and critical factors that affect consumption.
Huang et al. [22] applied regression analysis to identify the factors that influence electricity consumption in Taiwan. Chen [45] investigated the factors of electricity consumption from the perspective of socioeconomics and consumption. Desipri et al. [46] analysed the factors that influence electricity consumption and behaviour by using chi-square analysis of 221 households in Greece. Yalcintas and Kaya [47] conducted multiple regression analysis to study the role of income and household size on electricity consumption in Hawaii. Similarly, Wijaya and Tezuka [48] conducted multiple regression analysis in investigating the relationship among income, household size, education level, time spent at home, floor area, the use of cooling appliances and electricity bills in Indonesia.
Despite the growing urban electricity consumption, information on the actual energy use in the household sector is still limited and the causal factors leading to electricity consumption remain speculative due to urban expansion and its growing complexity, especially in developing countries such as Malaysia. Therefore, the objective of this study is to investigate the critical factors of household electricity consumption in a rapidly growing city; Seremban is selected for the case study. The study has three aims: to understand the patterns and flows of household electricity consumption in a rapidly growing city; to investigate the relationship and effects of the socioeconomic profile and housing characteristics in household electricity consumption; and to explain the critical determinants of household electricity consumption and their implications in the urban residential building sector.
The limitations of this study are as follows: It does not include all factors of electricity consumption in urban regions. It focuses only on the socioeconomic profile of households and housing characteristics due to time constraints and financial issues because these variables are rarely considered in determining the critical factors of electricity consumption in a growing city. Economic, social and behavioural factors should be considered in future studies to provide a full picture of electricity consumption in a growing city. Moreover, quantitative analysis has shown a significant relationship in urban electricity consumption and the number of rooms has been identified as the critical factor in electricity consumption. However, in terms of electrical appliances, only 11 appliances were considered due to time and space limitations. Considering other appliances would be more informative and represent electricity consumption in urban areas as a whole.
Unlike previous research, this study focuses on electricity consumption in the domestic sector as the main electricity consumer in Malaysia. This study would provide additional information and new findings on the issues of urban electricity consumption for future energy planning. Seremban is selected as the case study because it is experiencing rapid urban development. Studying electricity consumption will contribute to increased energy efficiency and sustainable electricity consumption in urban regions. Lastly, this study provides critical determinants of electricity consumption that policymakers, industry players and consumers can engage to improve energy-related policies in Malaysia.

2. Materials and Methods
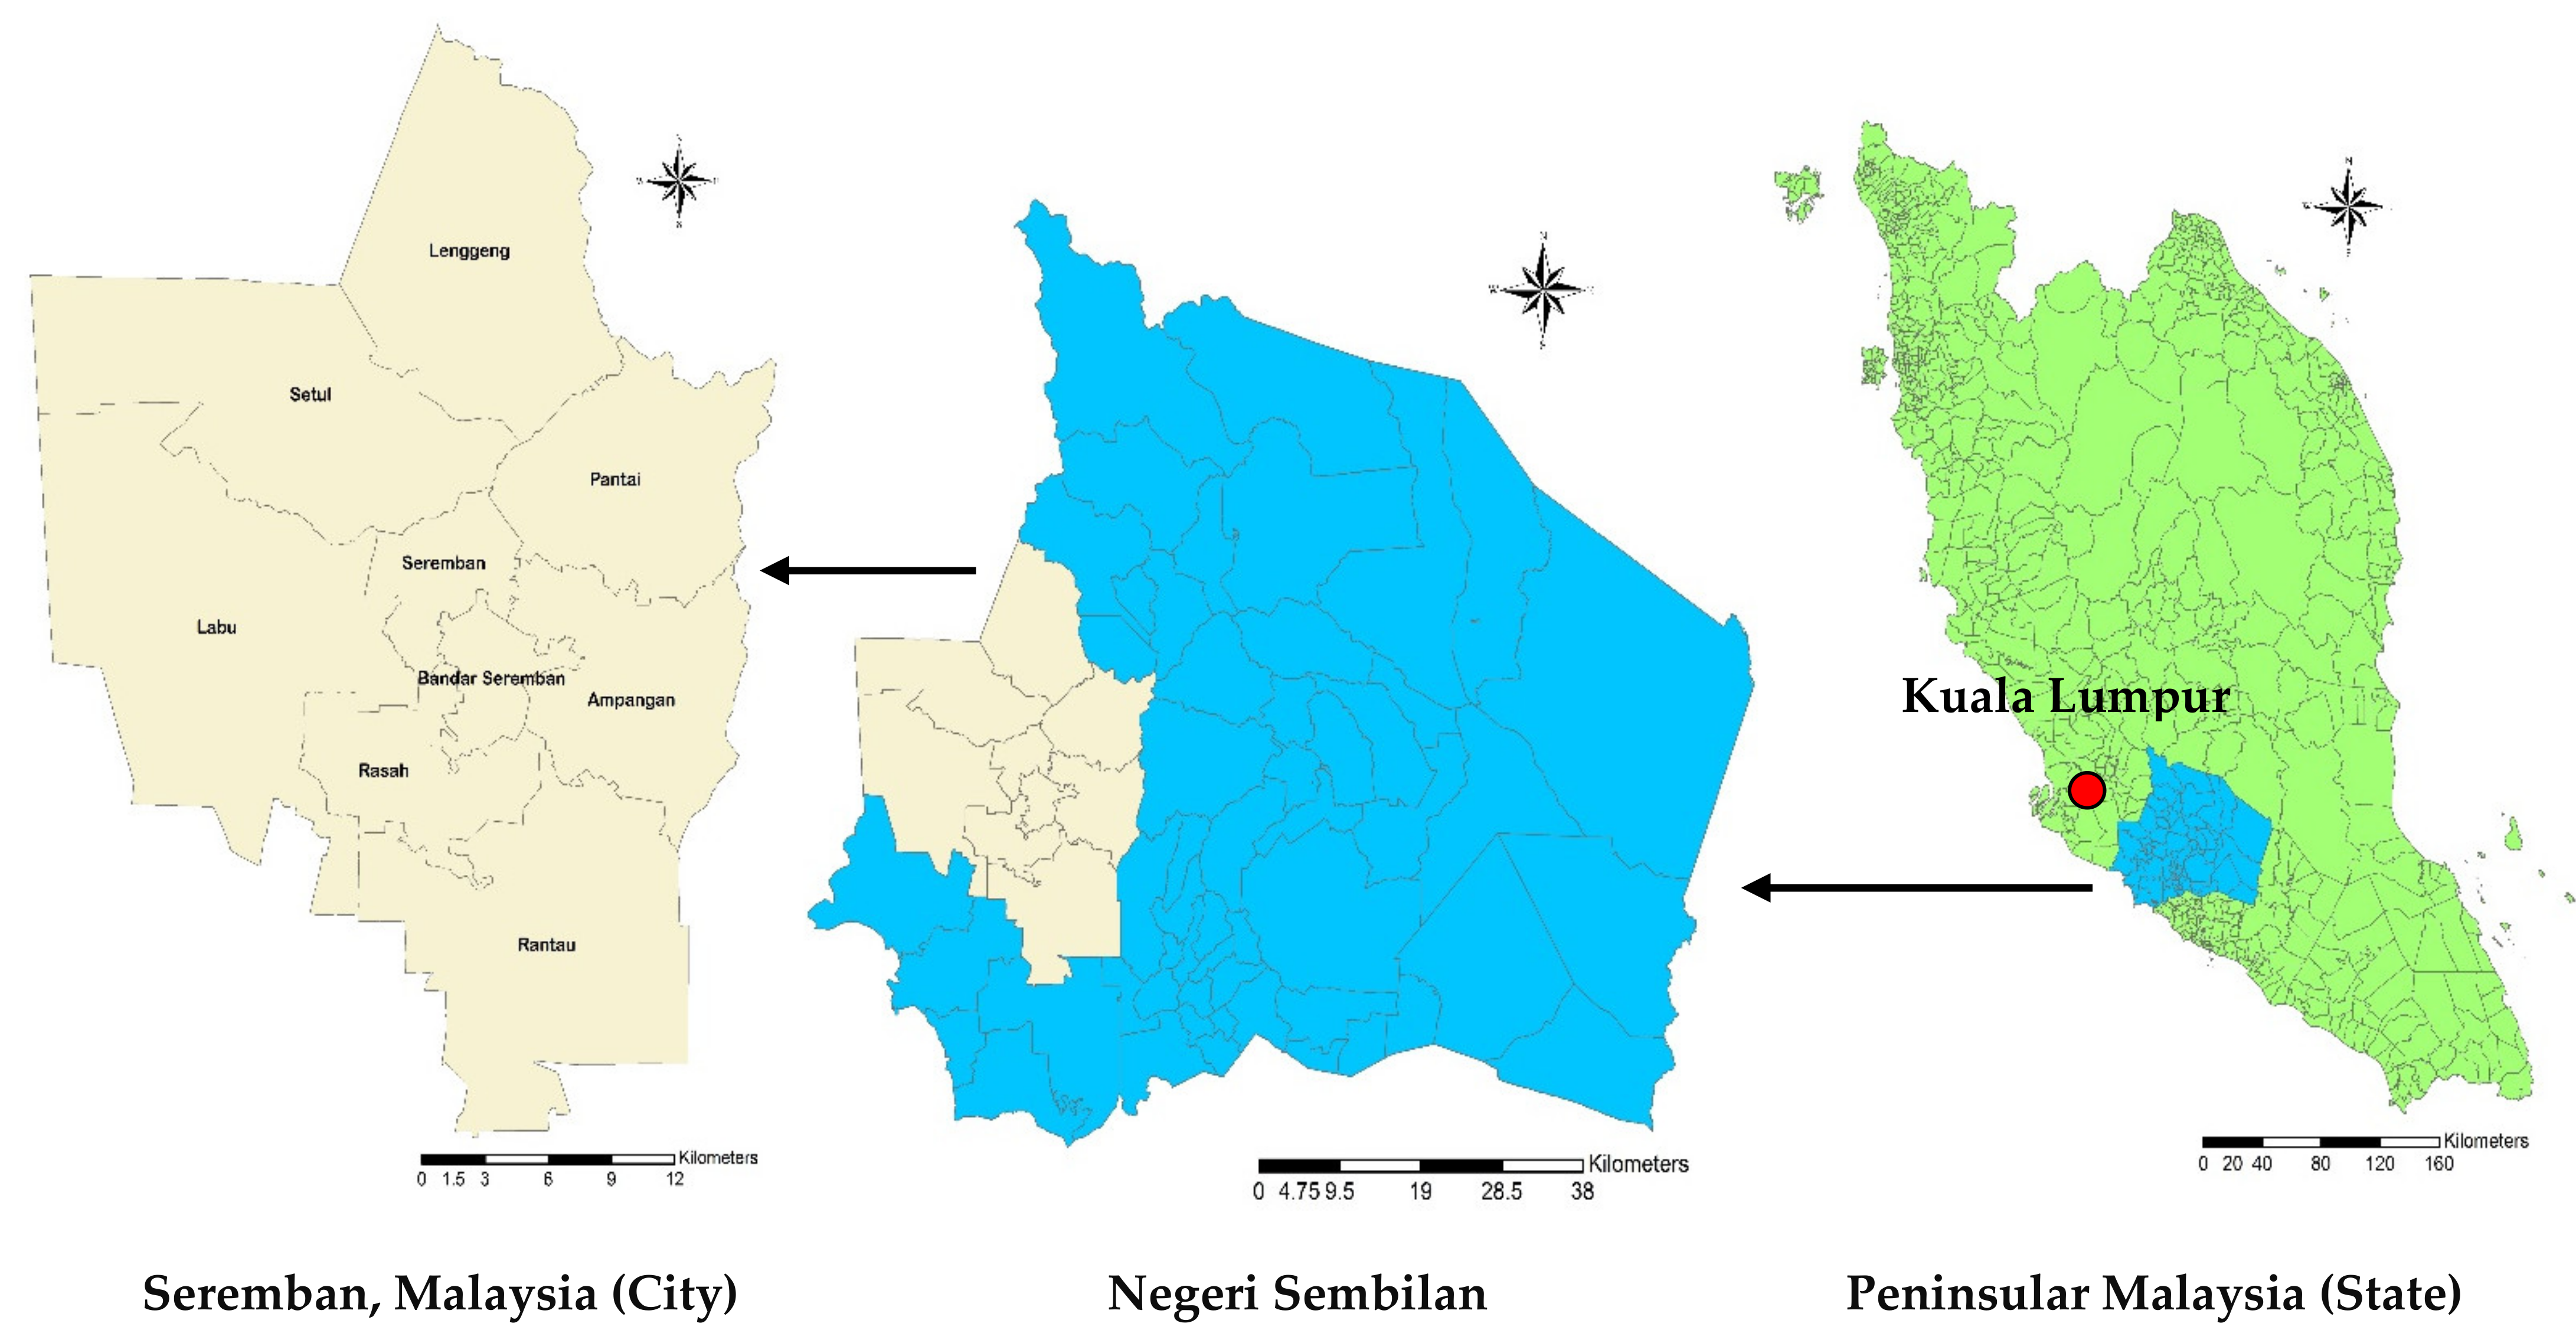
2.1. Study Area

Seremban (Figure 2) is situated in Malaysia’s most developed region and is experiencing rapid economic development due to its high population, thereby requiring more physical and social development. It is located 60 km south of Kuala Lumpur, with a high degree of accessibility to the central business district area. Seremban has a high-quality transportation system, making it one of the most liveable cities in Malaysia. Its population increased to 65.07% in 2016, reaching a total population of 633,100 [49]; most of the city spaces are residential areas. The housing sector is the third largest land use in Seremban after agriculture and forestry [50]. The study commenced with the classification of residential areas based on the types of houses built, such as traditional/village, single-storey terrace, double-storey terrace, semi-detached, bungalow and flat unit, as indicated by the Seremban City Council. Identifying the energy consumption patterns in a growing city such as Seremban is crucial to formulate essential energy policies and strategies to increase the sustainable consumption of resources. Identifying these patterns can minimise the dependency on physical resources and increase material and energy efficiency.

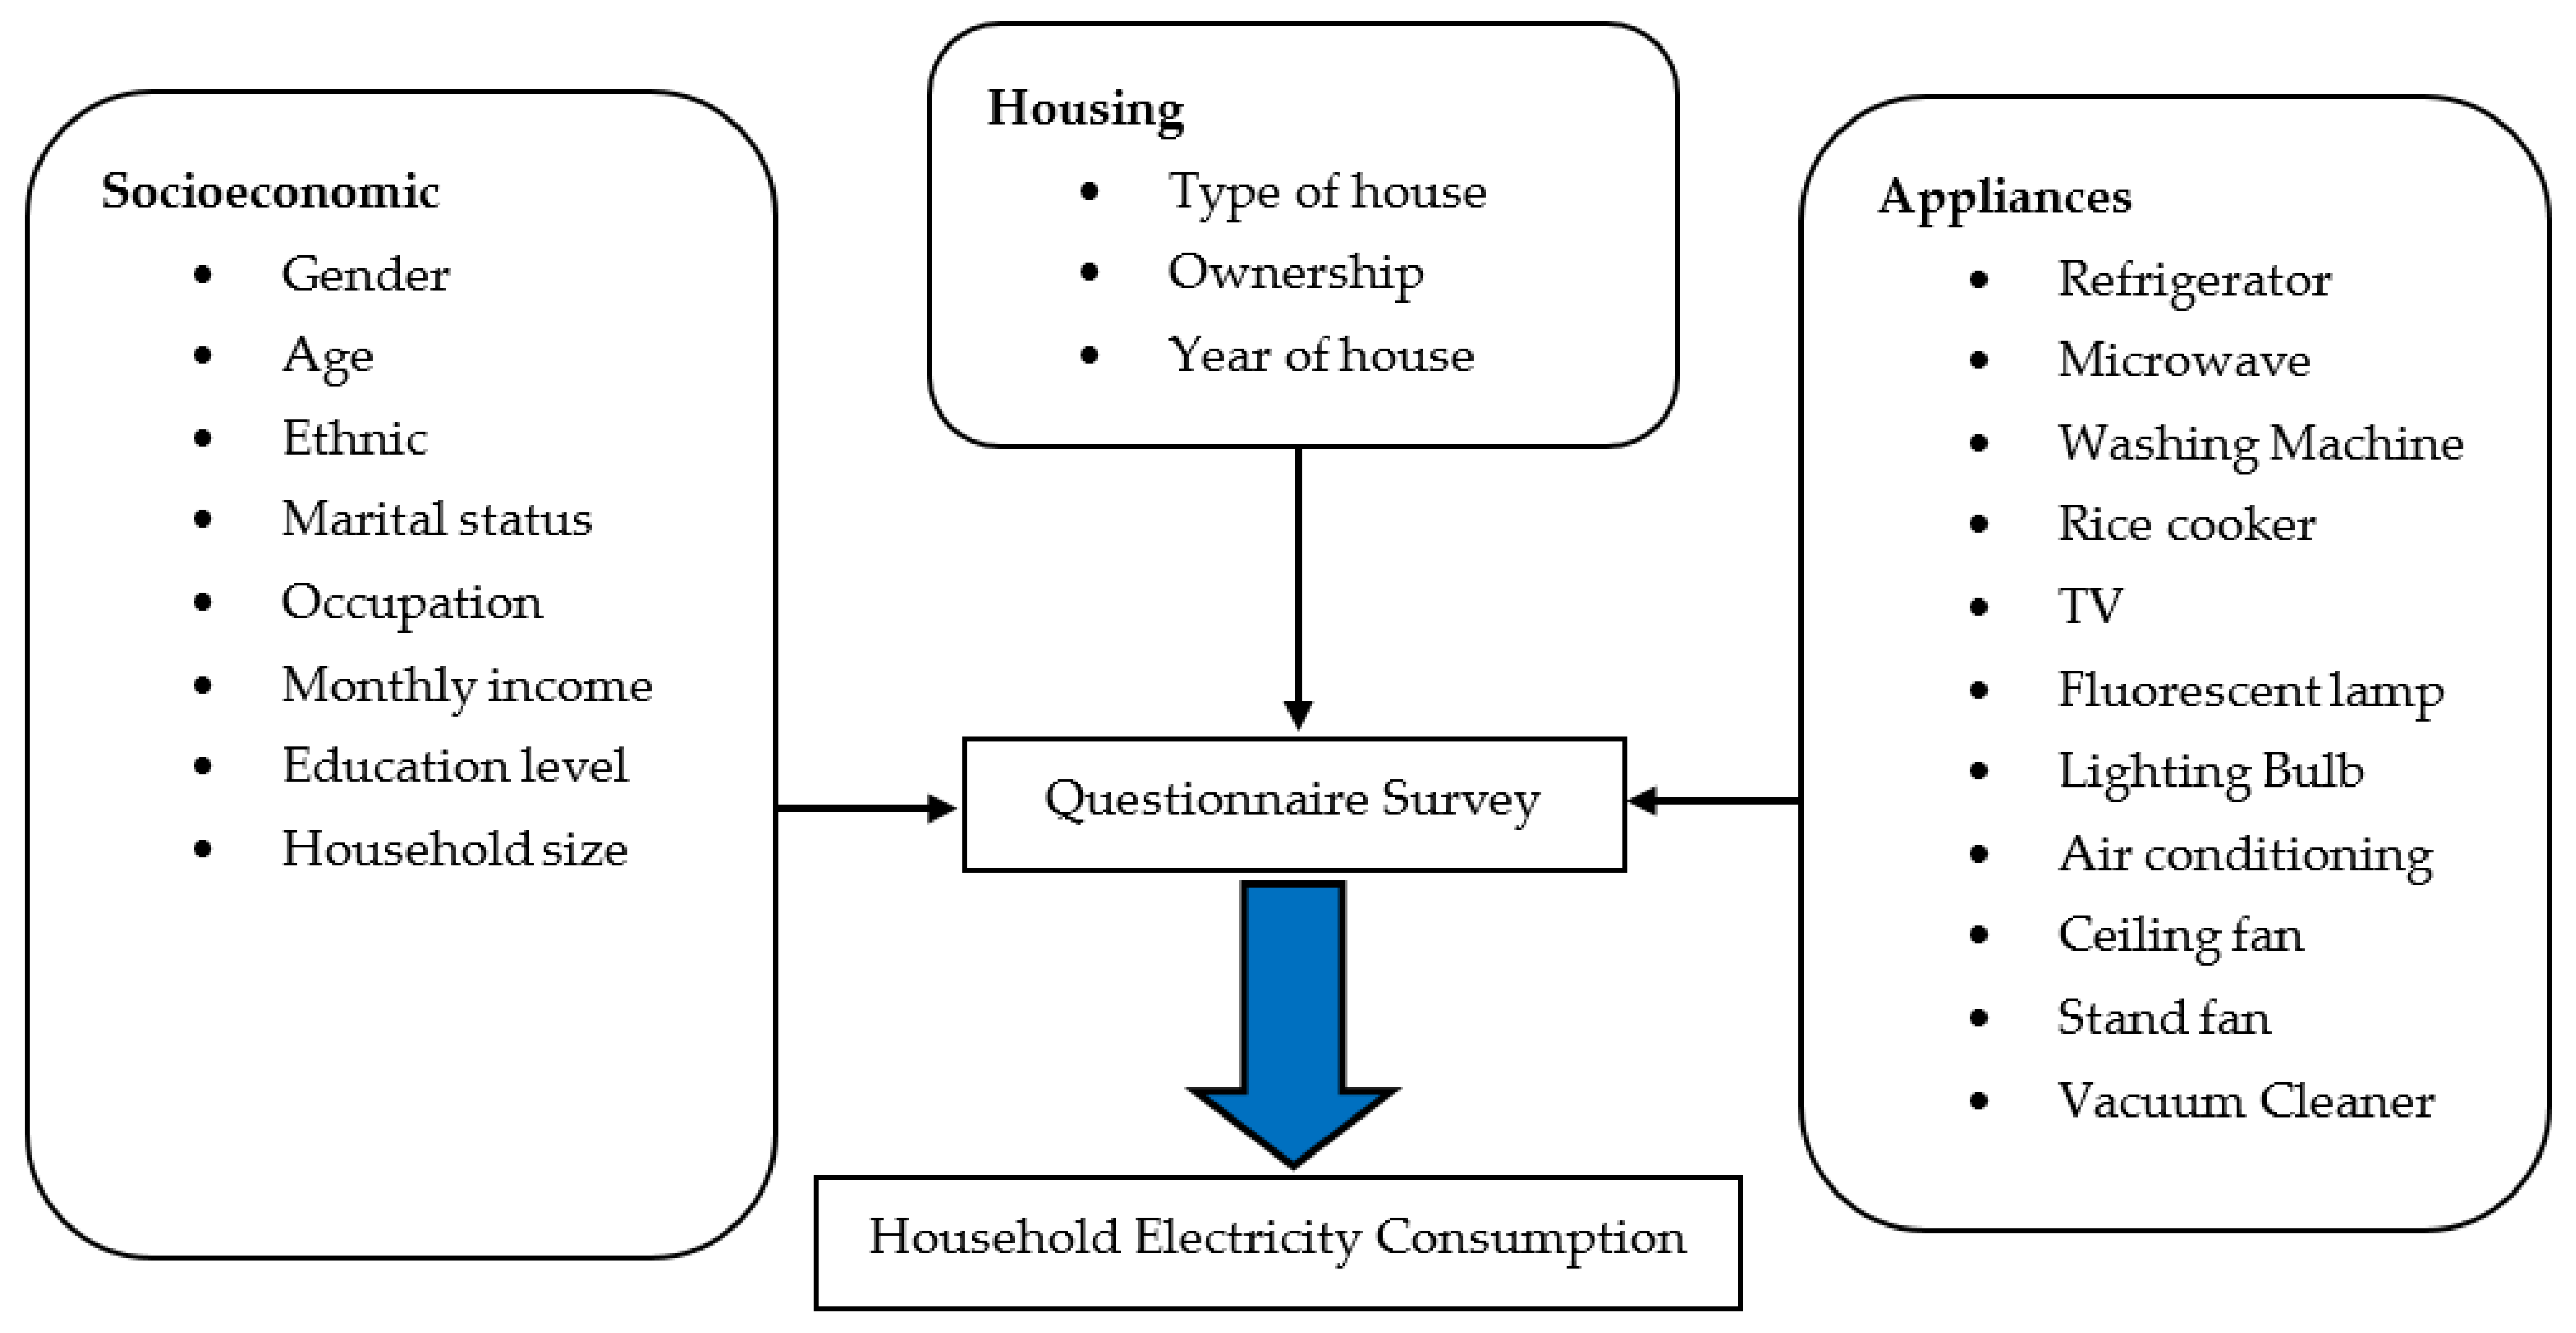
2.2. Survey Design and Data Collection

Previous studies indicated that various factors such as socioeconomic and dwelling characteristics [52,53] could determine residential electricity consumption. Therefore, to understand the electricity usage among households in a growing city, the survey was designed to cover every aspect of users, including socioeconomic background, appliance ownership and housing characteristics, as shown in Figure 3.
The electricity consumption of each appliance can be calculated using the following formula:
Electricity Consumption (kWh/month) = Power Rating × Working Hours × Number of Items × 30 days / 1000
The sample size was determined using the methodology provided by Creative Research Systems [54], whereby the respondents were selected using proportionate stratified random sampling based on the type of house in the study area. Therefore, the unit of analysis in this study is the urban household. For this research, a questionnaire survey was distributed to 620 respondents. However, only 400 completed questionnaires were considered, reaching a 64.51% response rate. In Section A (socioeconomic background) of the questionnaire, the respondents were asked about their socioeconomic profile and housing characteristics, such as gender, age, race, marital status, occupation, monthly income, education level, household size, type of house and number of rooms. In Section B (appliances ownership and consumption), the respondents were required to provide related information about electricity consumption, such as appliance ownership, frequency of using the appliances and duration of consumption. The details of the appliance ownership are shown in Table 1.
These appliances were grouped into three major categories (cooling, lighting and kitchen/home appliances), as indicated in Figure 3. The electricity consumption per month was calculated manually using the methodology provided by Olaniyan et al. [55].

2.3. Data Analysis

Statistical analysis was carried out using SPSS software [56]. All the data were checked to avoid technical errors and missing values in the dataset. Cronbach’s alpha was used to determine the normality of the data. The pattern of the total electricity consumption for each appliance was calculated manually. Then, the data were used in mapping the energy consumption flow, which could be generated using a Sankey diagram. For this purpose, an online Sankey diagram generator was used. Correlation analysis was applied to determine the nature of the relationship between variables [57]. Direct and indirect relationships were determined using this analysis. Regression analysis can predict and explain the value of a dependent variable on one or more independent variables [58]. Therefore, multiple linear regressions were applied to investigate the contribution of the independent variables on the dependent variable. The independent variables were represented by the respondents’ socioeconomic profiles (age, race, monthly income, marital status, occupation, education level and household size), housing characteristics (type of house and number of rooms) and appliance ownership. The dependent variable was represented by total electricity consumption (kWh/month). Multiple linear regressions can be conducted using the following equation:
Y = β0 + β1 X1 + β2 X2 + β3 X3…. + βn Xn + ε
where Y is the total electricity consumption (kWh/month), X1, X2, …, Xn are the predictor variables with n as the number of variables, β0, β1, …, βn represent the regression coefficients and ε represents error [59]. The identification of critical determinant factors depends on the studied variables, which were grouped into energy, socioeconomic profile and housing characteristics, in line with the classification by Chen et al. [18]. The validity of parametric tests is highly dependent on the assumption of normality [60]. The variables in the current dataset were proven to be normally distributed because the value of skewness and kurtosis was smaller than 2 and 7, respectively. These values were applied for sample sizes greater than 300 [61], as displayed in Table 2.

3. Results

3.1. Demographic Background

The average age of the household head was between 40 and 49 years old. Most of the respondents were married and working in the government sector. The average monthly income of the respondents ranged from RM 3001 to RM 4000 and the lowest educational level was diploma. The average household size was three to five persons. In terms of housing characteristics, most of the respondents lived in single-storey terrace houses with an average of four rooms.

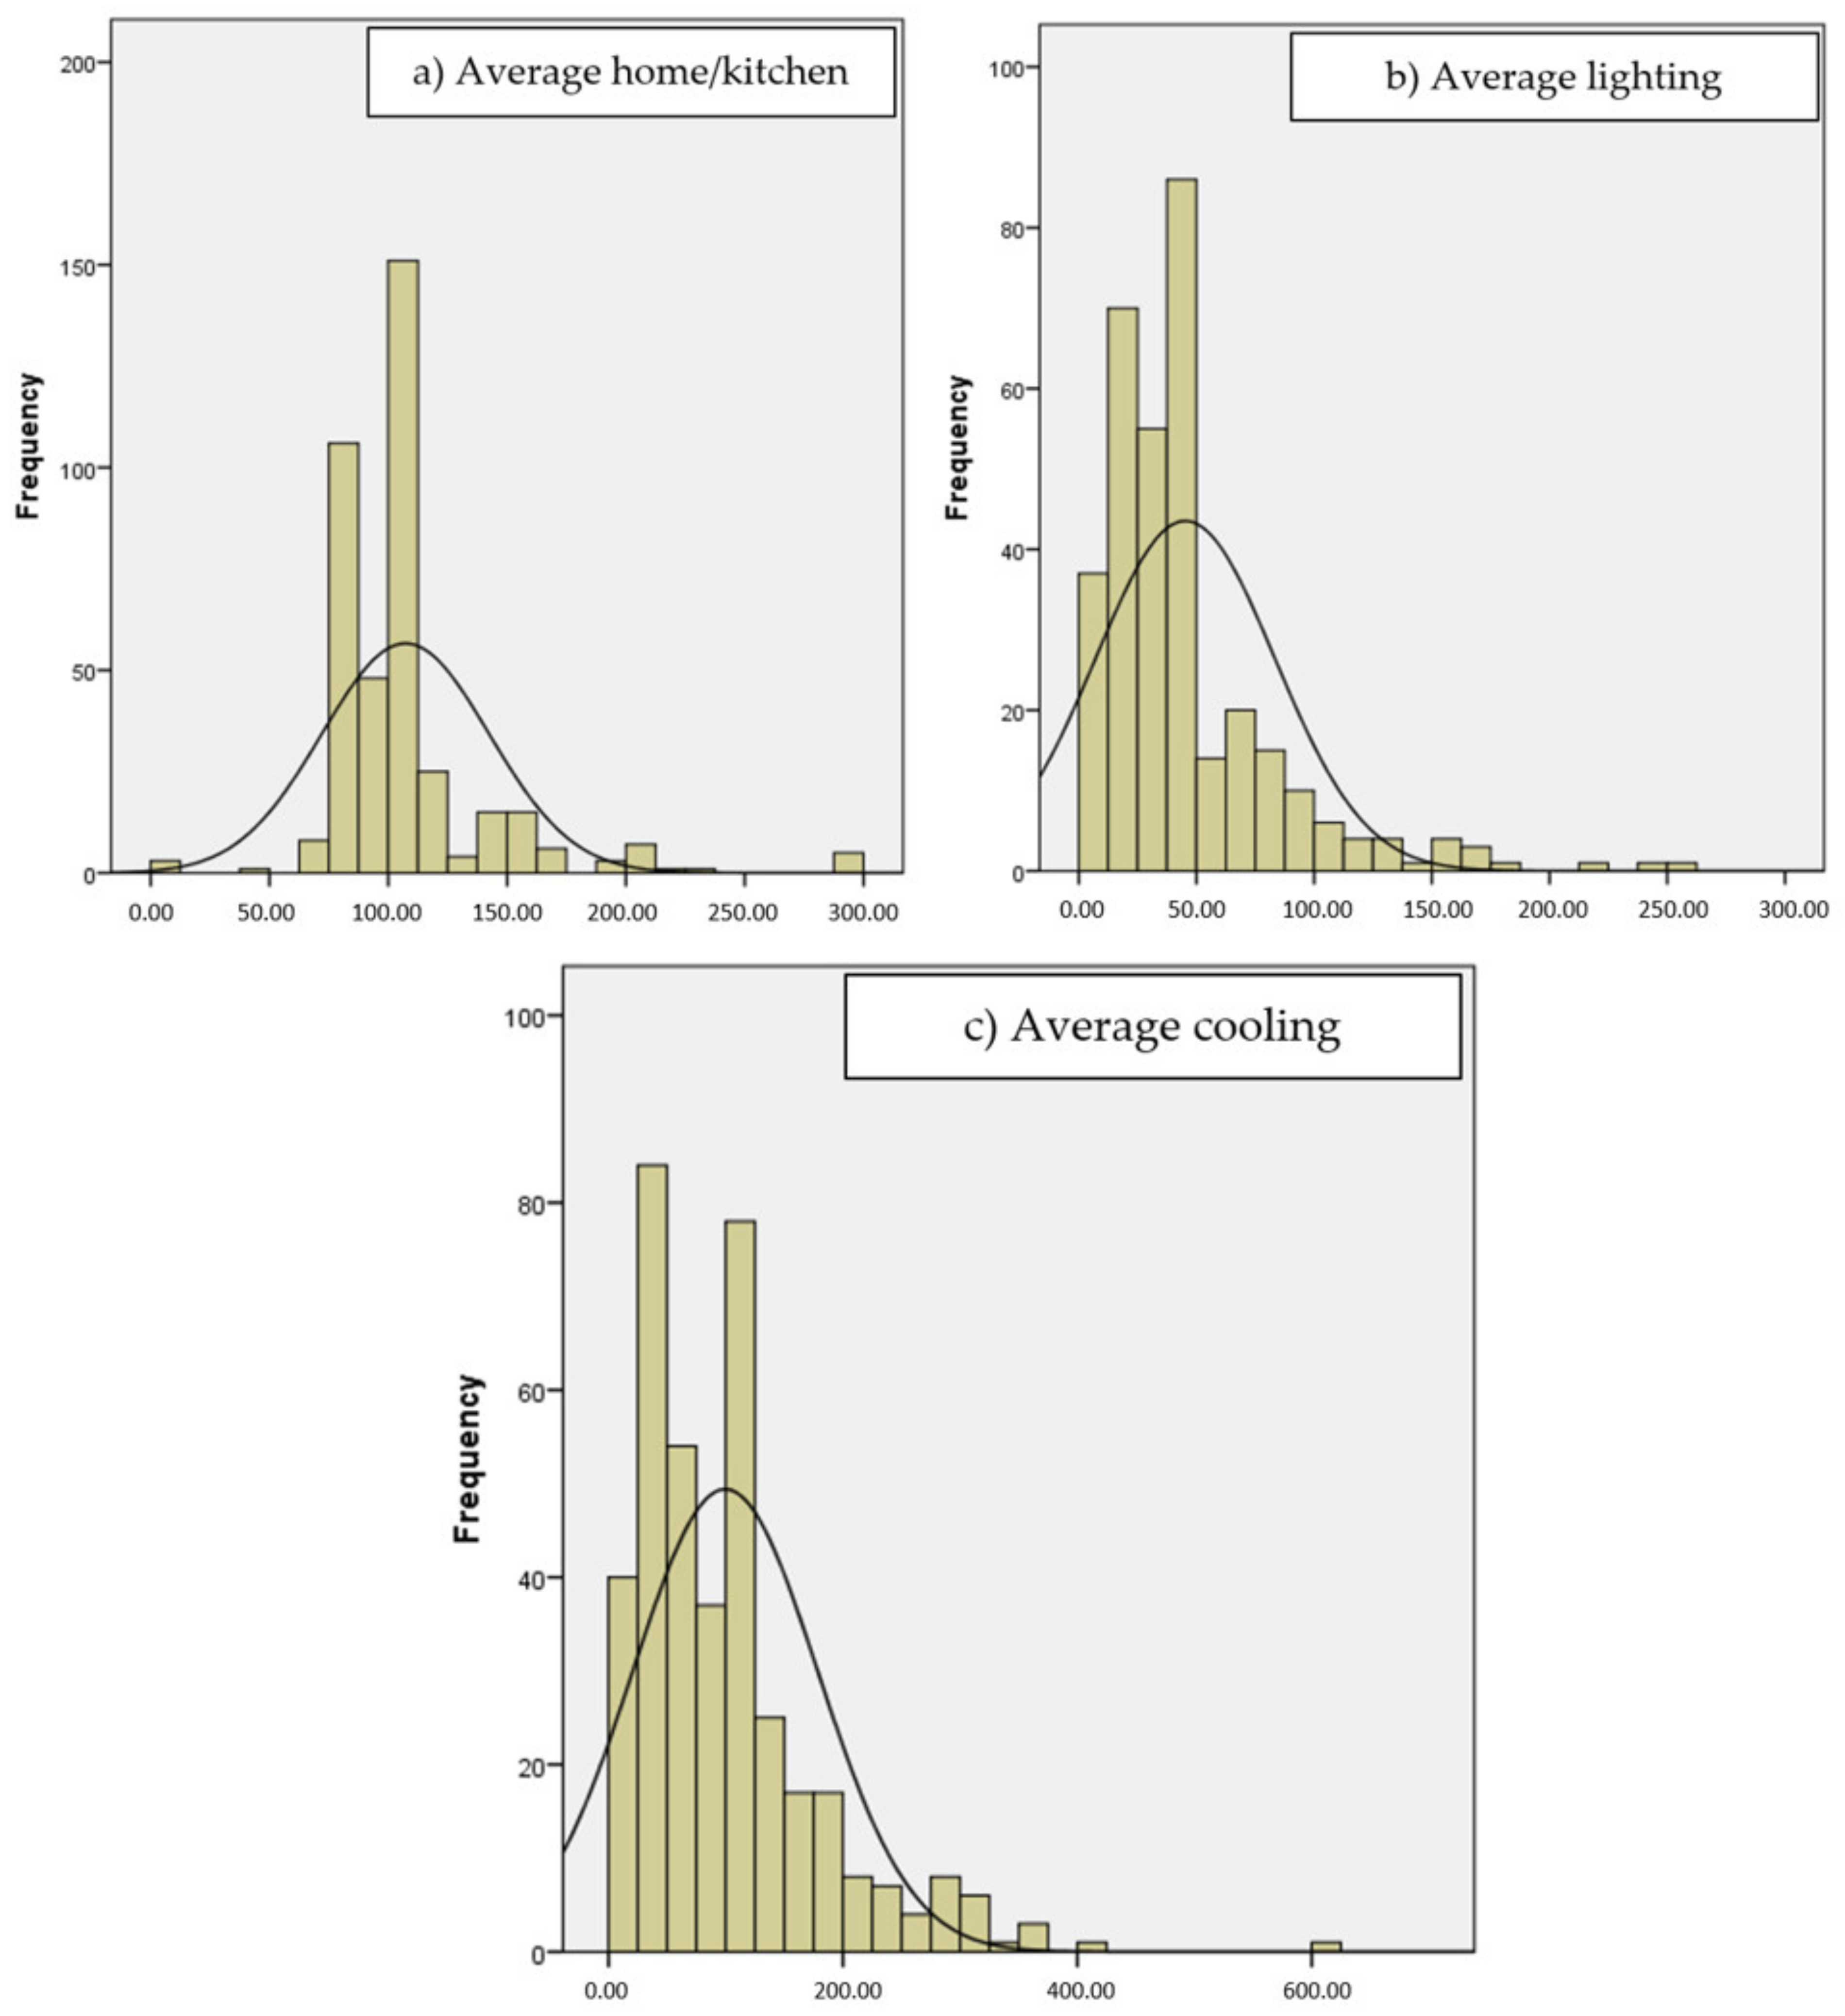
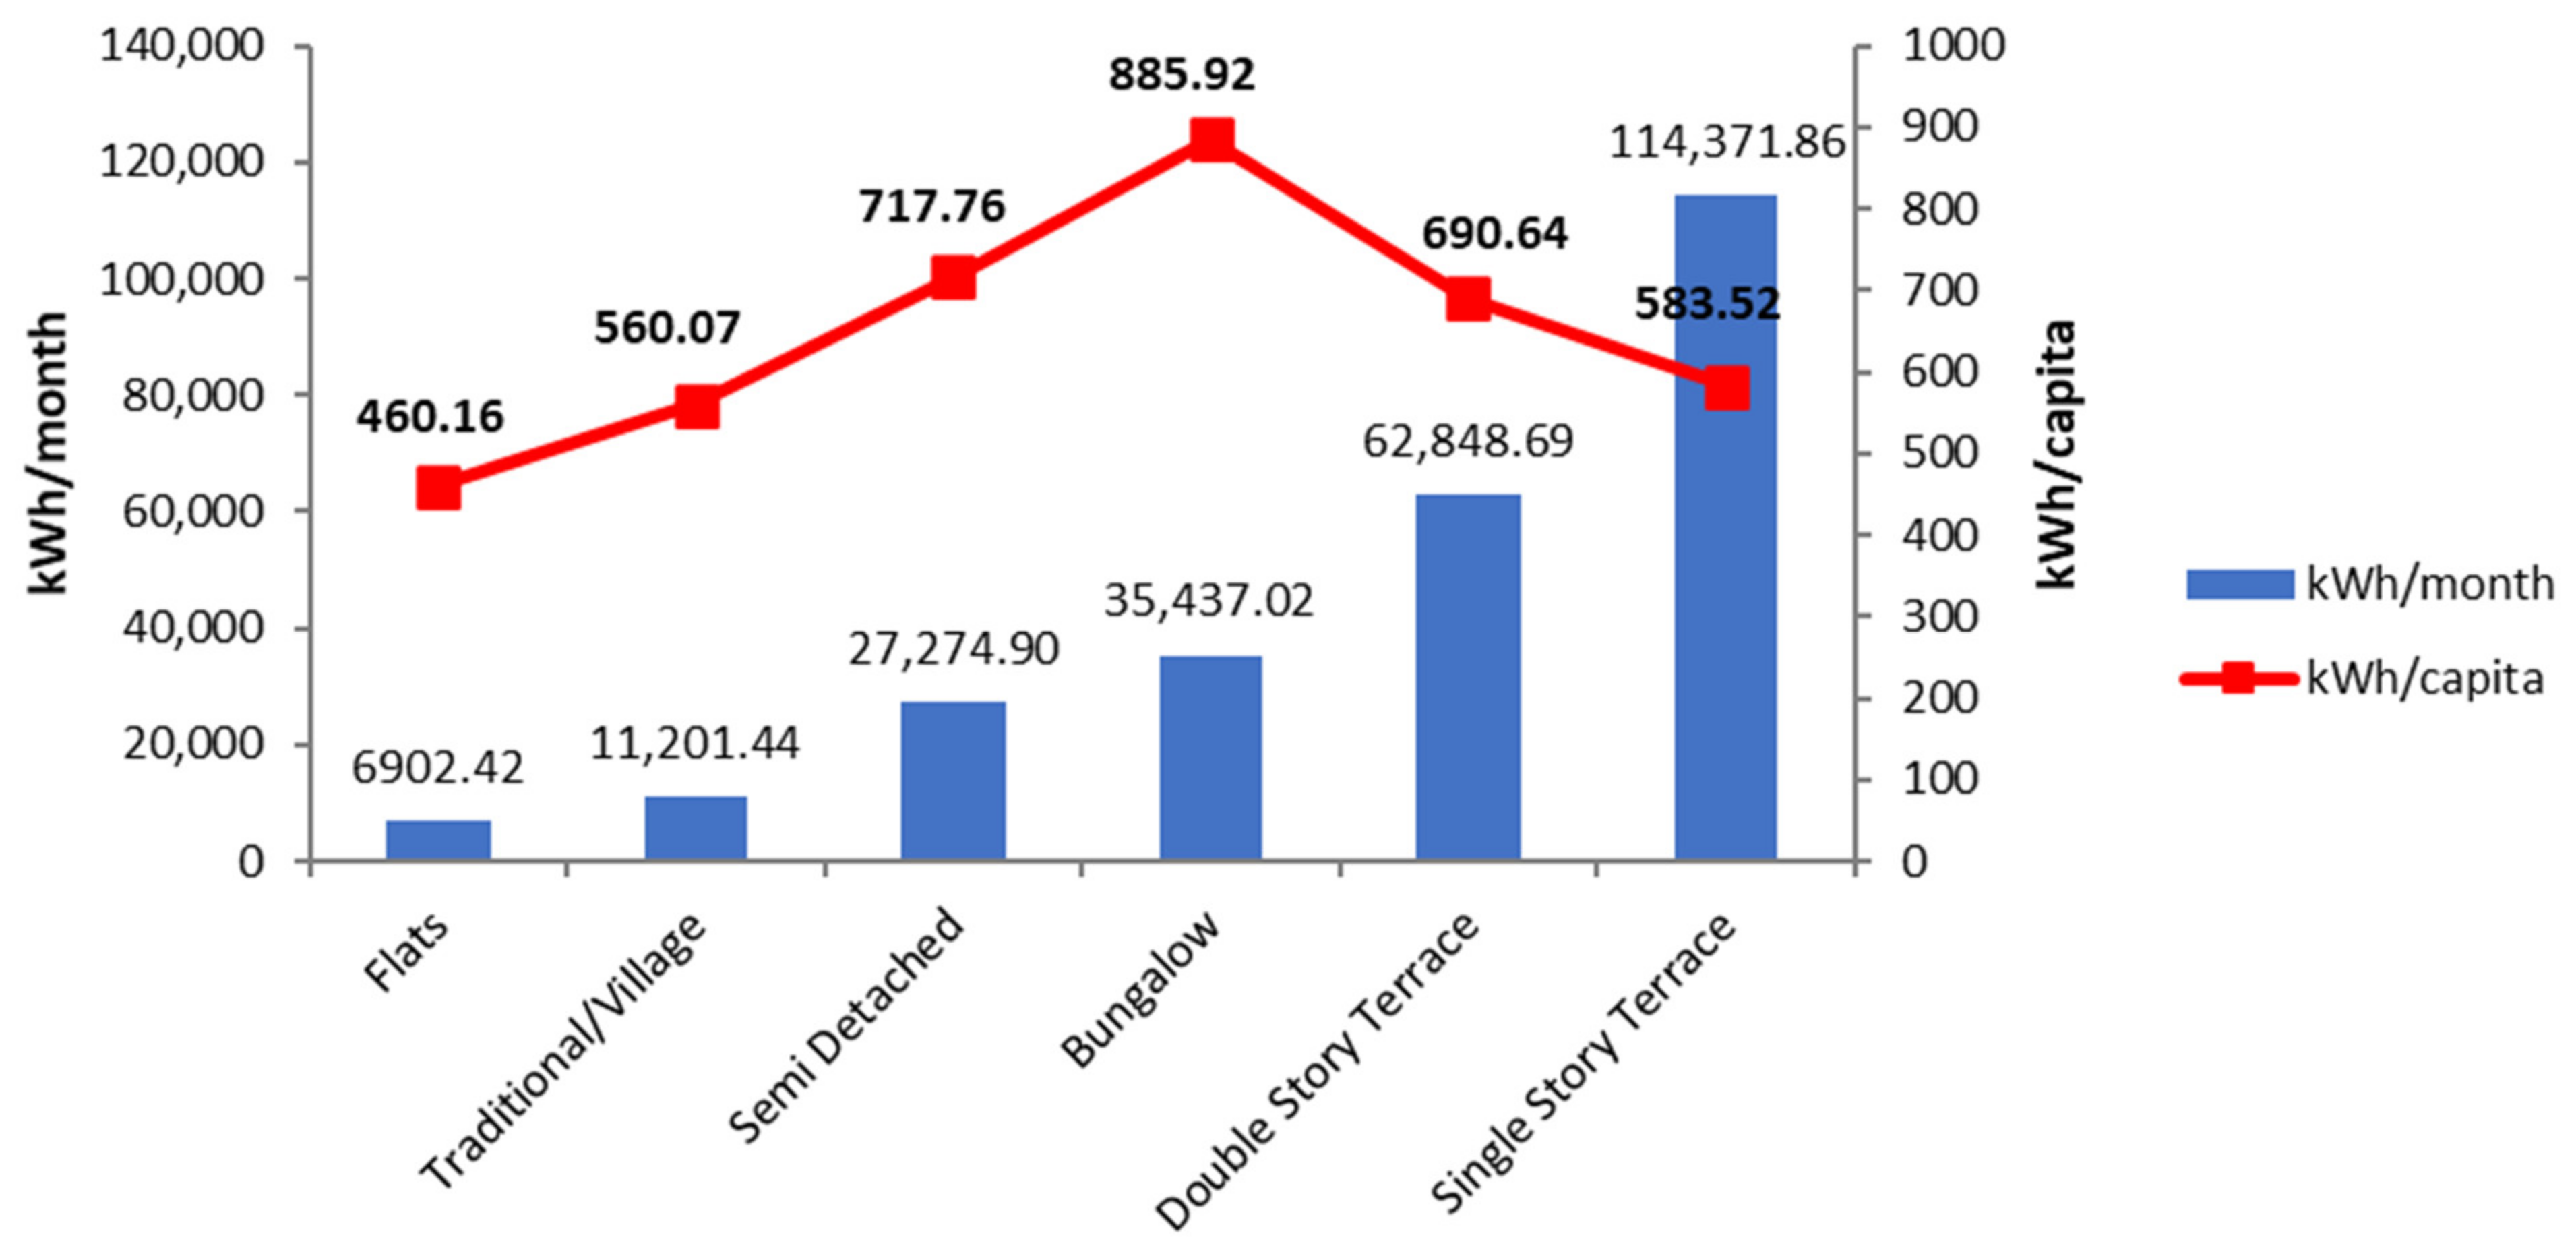
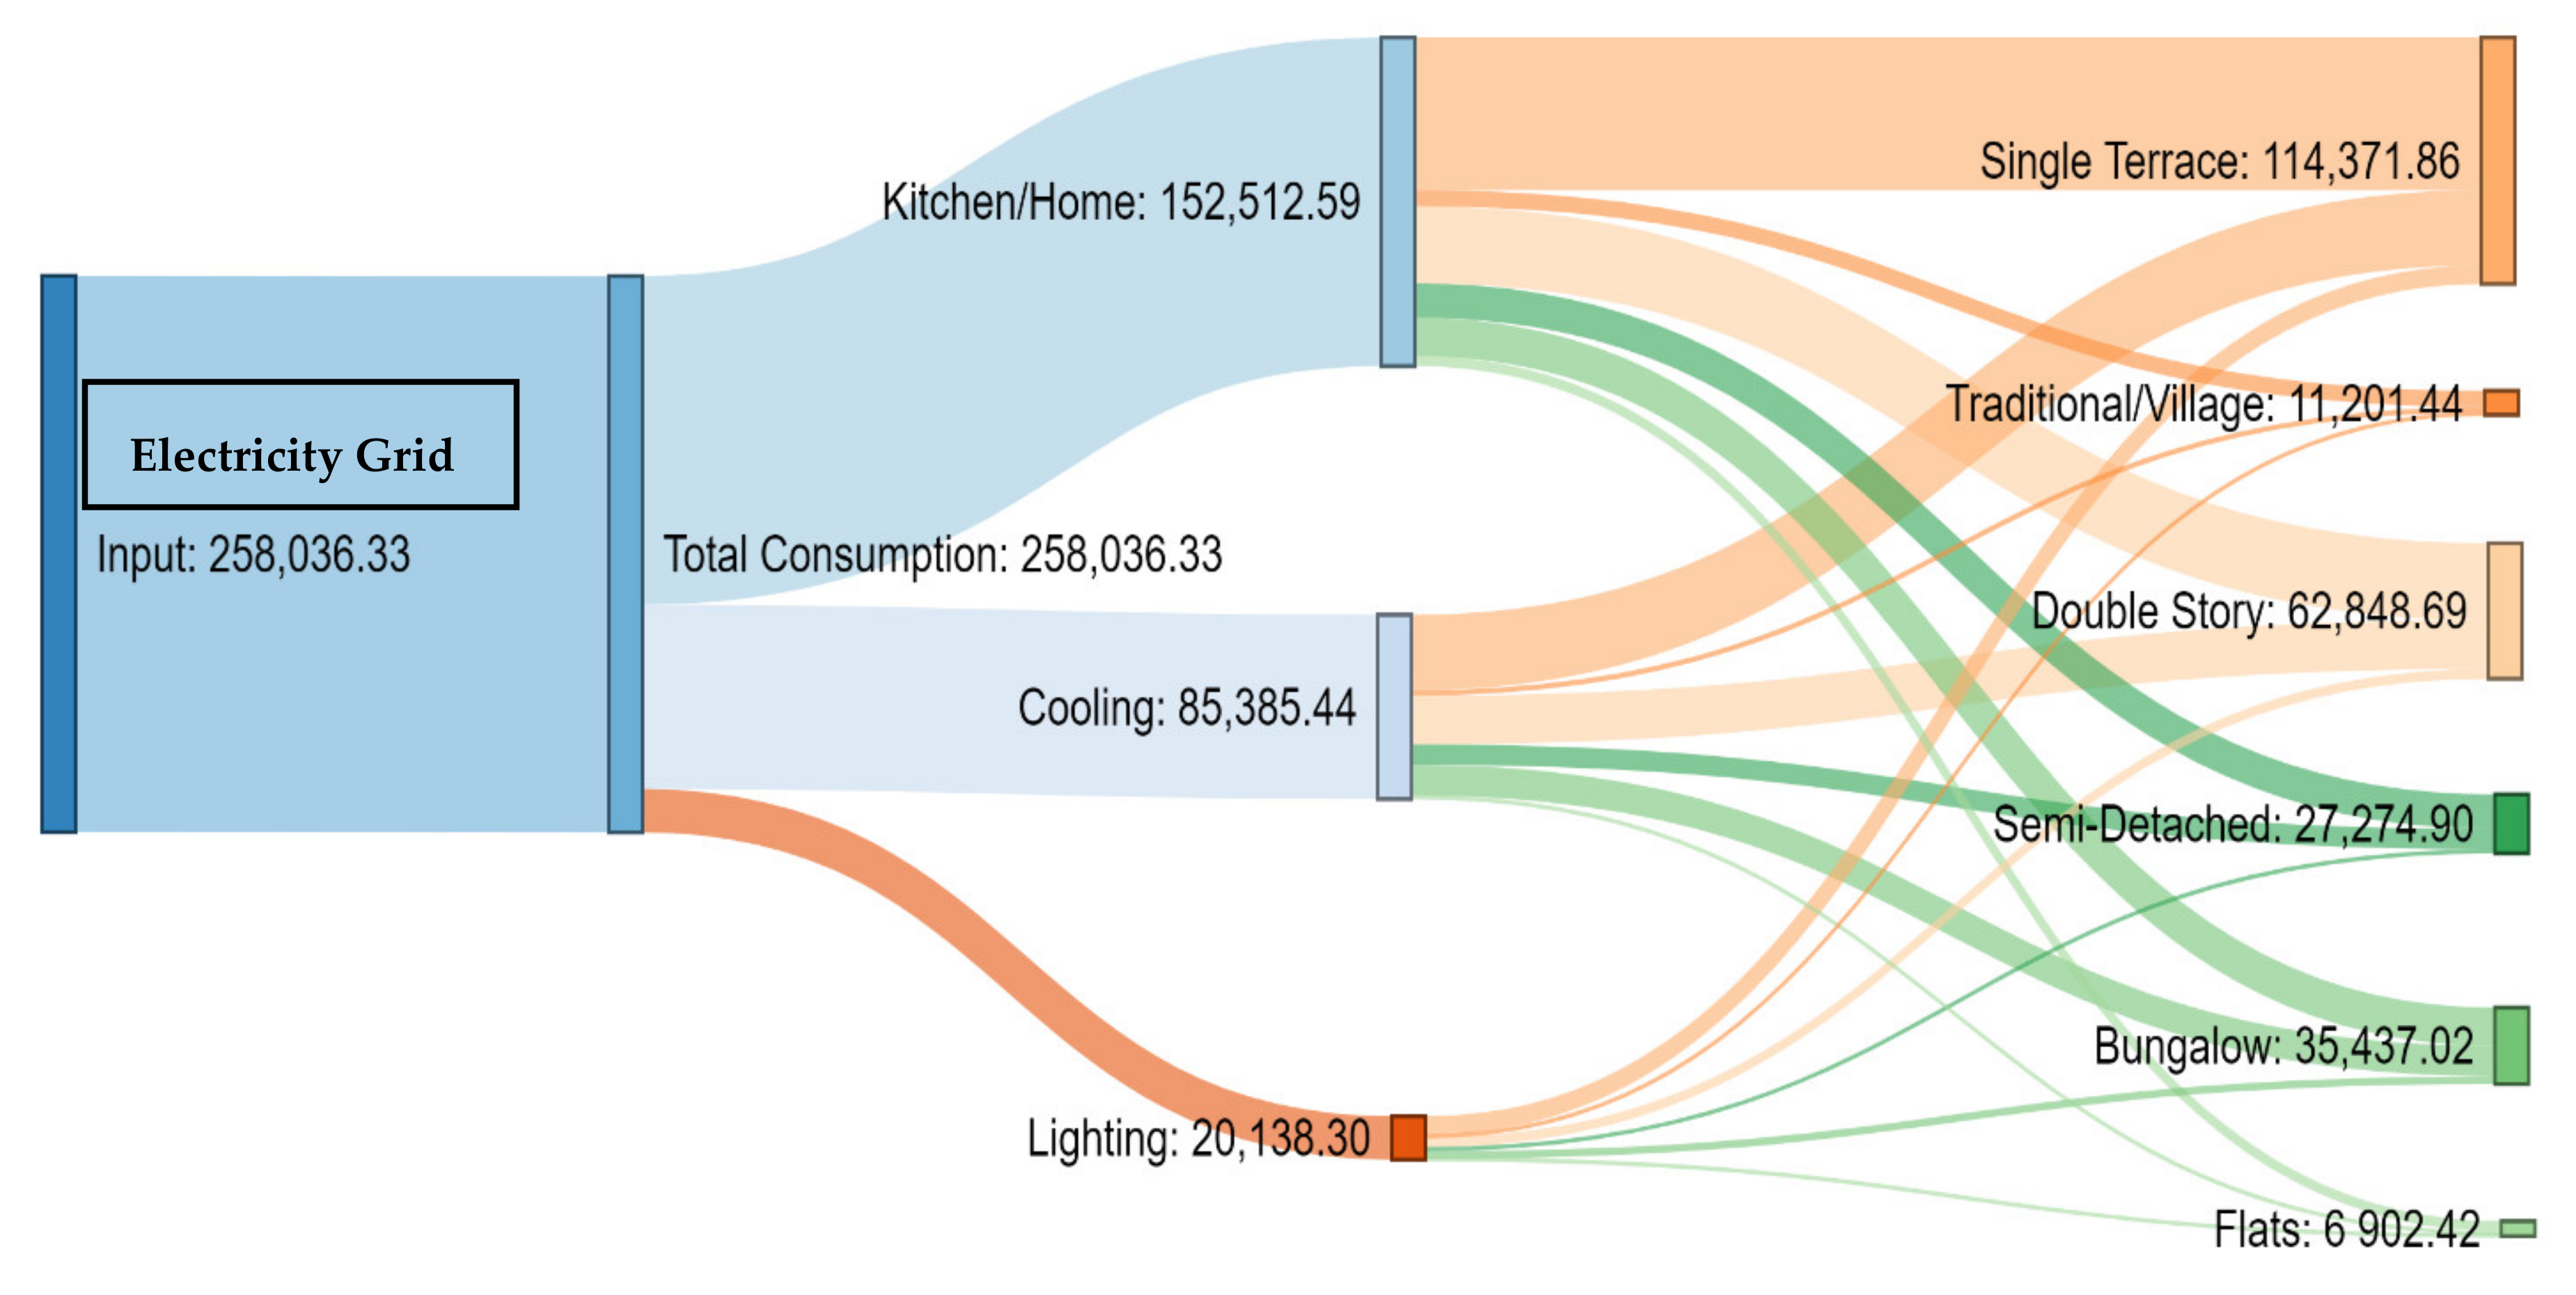
3.2. Measuring Electricity Consumption

Pattern and Flows of Consumption

The average household electricity consumption per month was 648.31 kWh with a standard deviation of 280.22 kWh. Electricity was allocated mainly for kitchen/home appliances (107.22 kWh), followed by cooling (99.58 kWh) and lighting (45.22 kWh) (Figure 4). Refrigerators consumed a large amount of electricity, with an average consumption of approximately 308.41 kWh/month, followed by air conditioners (206.63 kWh/month), ceiling fans (80.96 kWh/month) and other appliances (Table 1). Figure 5 presents the electricity consumption per month and per capita according to the type of house. Single-storey terrace houses had a high total electricity consumption per month (114,371.86 kWh) because a high sample size was obtained from this housing type, which was also identified as the main housing type in Seremban. This finding may have contributed to the high total electricity consumption of this housing type. Double-storey terrace houses consumed approximately 62,848.69 kWh/month, followed by bungalows (35,437.02 kWh/month), semi-detached houses (27,274.9 kWh/month), traditional/village houses (11,201.44 kWh/month) and flats (6902.42 kWh/month). Bungalows recorded the highest electricity consumption per capita (885.95 kWh/month) probably due to their size and the number of appliances. The high electricity consumption of bungalows is probably due to cooling and lighting because the respondents from this type of house usually have a high socioeconomic background.
Flats had the lowest total electricity consumption per month and per capita possibly due to the small sample size and the limited appliance ownership. Therefore, the size of the house (spacious and small) significantly affects the amount of electricity consumed, as discussed in Wijaya and Tezuka [48] and Kubota and Ahmad [62]. A Sankey diagram was developed to portray the overall picture of electricity consumption flow in the study area (Figure 6).

3.3. Measuring Relationship

Pearson’s correlation analysis measures the linear relationship between two variables [57]; it refers to an association, connection or any form of relationship [63] and is measured using a value ranging from −1 to +1. The strength of the correlation coefficient can be classified as weak, moderate, strong or very strong [64]. If the value of the correlation is close to −1 or +1, then the relationship is very strongly correlated. A value close to zero indicates a weak relationship or no relationship.

3.3.1. Socioeconomic Profile vs Electricity Consumption

As presented in Table 3, the electricity consumption in Seremban was significantly correlated with the age of the household (r = 0.108; p < 0.05), monthly income (r = 0.360; p < 0.01), education level (r = 0.227; p < 0.01) and household size (r = 0.210; p < 0.01). Monthly income had the largest positive correlation with electricity consumption, followed by education level, household size and age of household. Thus, as household age, monthly income, education level and household size increase, electricity consumption also increases. However, the results indicated that race, marital status and occupation have no relationship with electricity consumption. Although these variables are uncorrelated, they might still be indirectly correlated with electricity consumption. For instance, marital status (r = 0.360; p < 0.01) and occupation (r = 0.162; p < 0.01) were significantly correlated with the age of the household, which subsequently contributed to electricity consumption. Income significantly affects electricity consumption because it is significantly correlated with all seven variables.
A similar result was found by Chen et al. [18]. Monthly household income explained approximately 12.9% of the variation in monthly electricity consumption (kWh). Education level also significantly affected electricity consumption, accounting for 5.2% of the variation in electricity consumption per month. Other important variables are household size and age of the household, which accounted for 4.4% and 1.2% of the variation in monthly electricity consumption, respectively; other variables presented insignificant results. In summary, household income, education level, household size and age were significantly correlated with electricity consumption. This finding indicates that the increment in each of these variables would lead to high electricity consumption.

3.3.2. Housing Characteristics vs Electricity Consumption

As presented in Table 4, the number of rooms had the most significant correlation (r = 0.376; p < 0.01), followed by the type of house (r = 0.209; p < 0.01). The linear relationship between the variables shows that a house becomes more spacious as its number of rooms increases, thereby increasing electricity consumption significantly. The number of rooms and type of house accounted for 14.2% and 4.4% of the variation in electricity consumption, respectively.

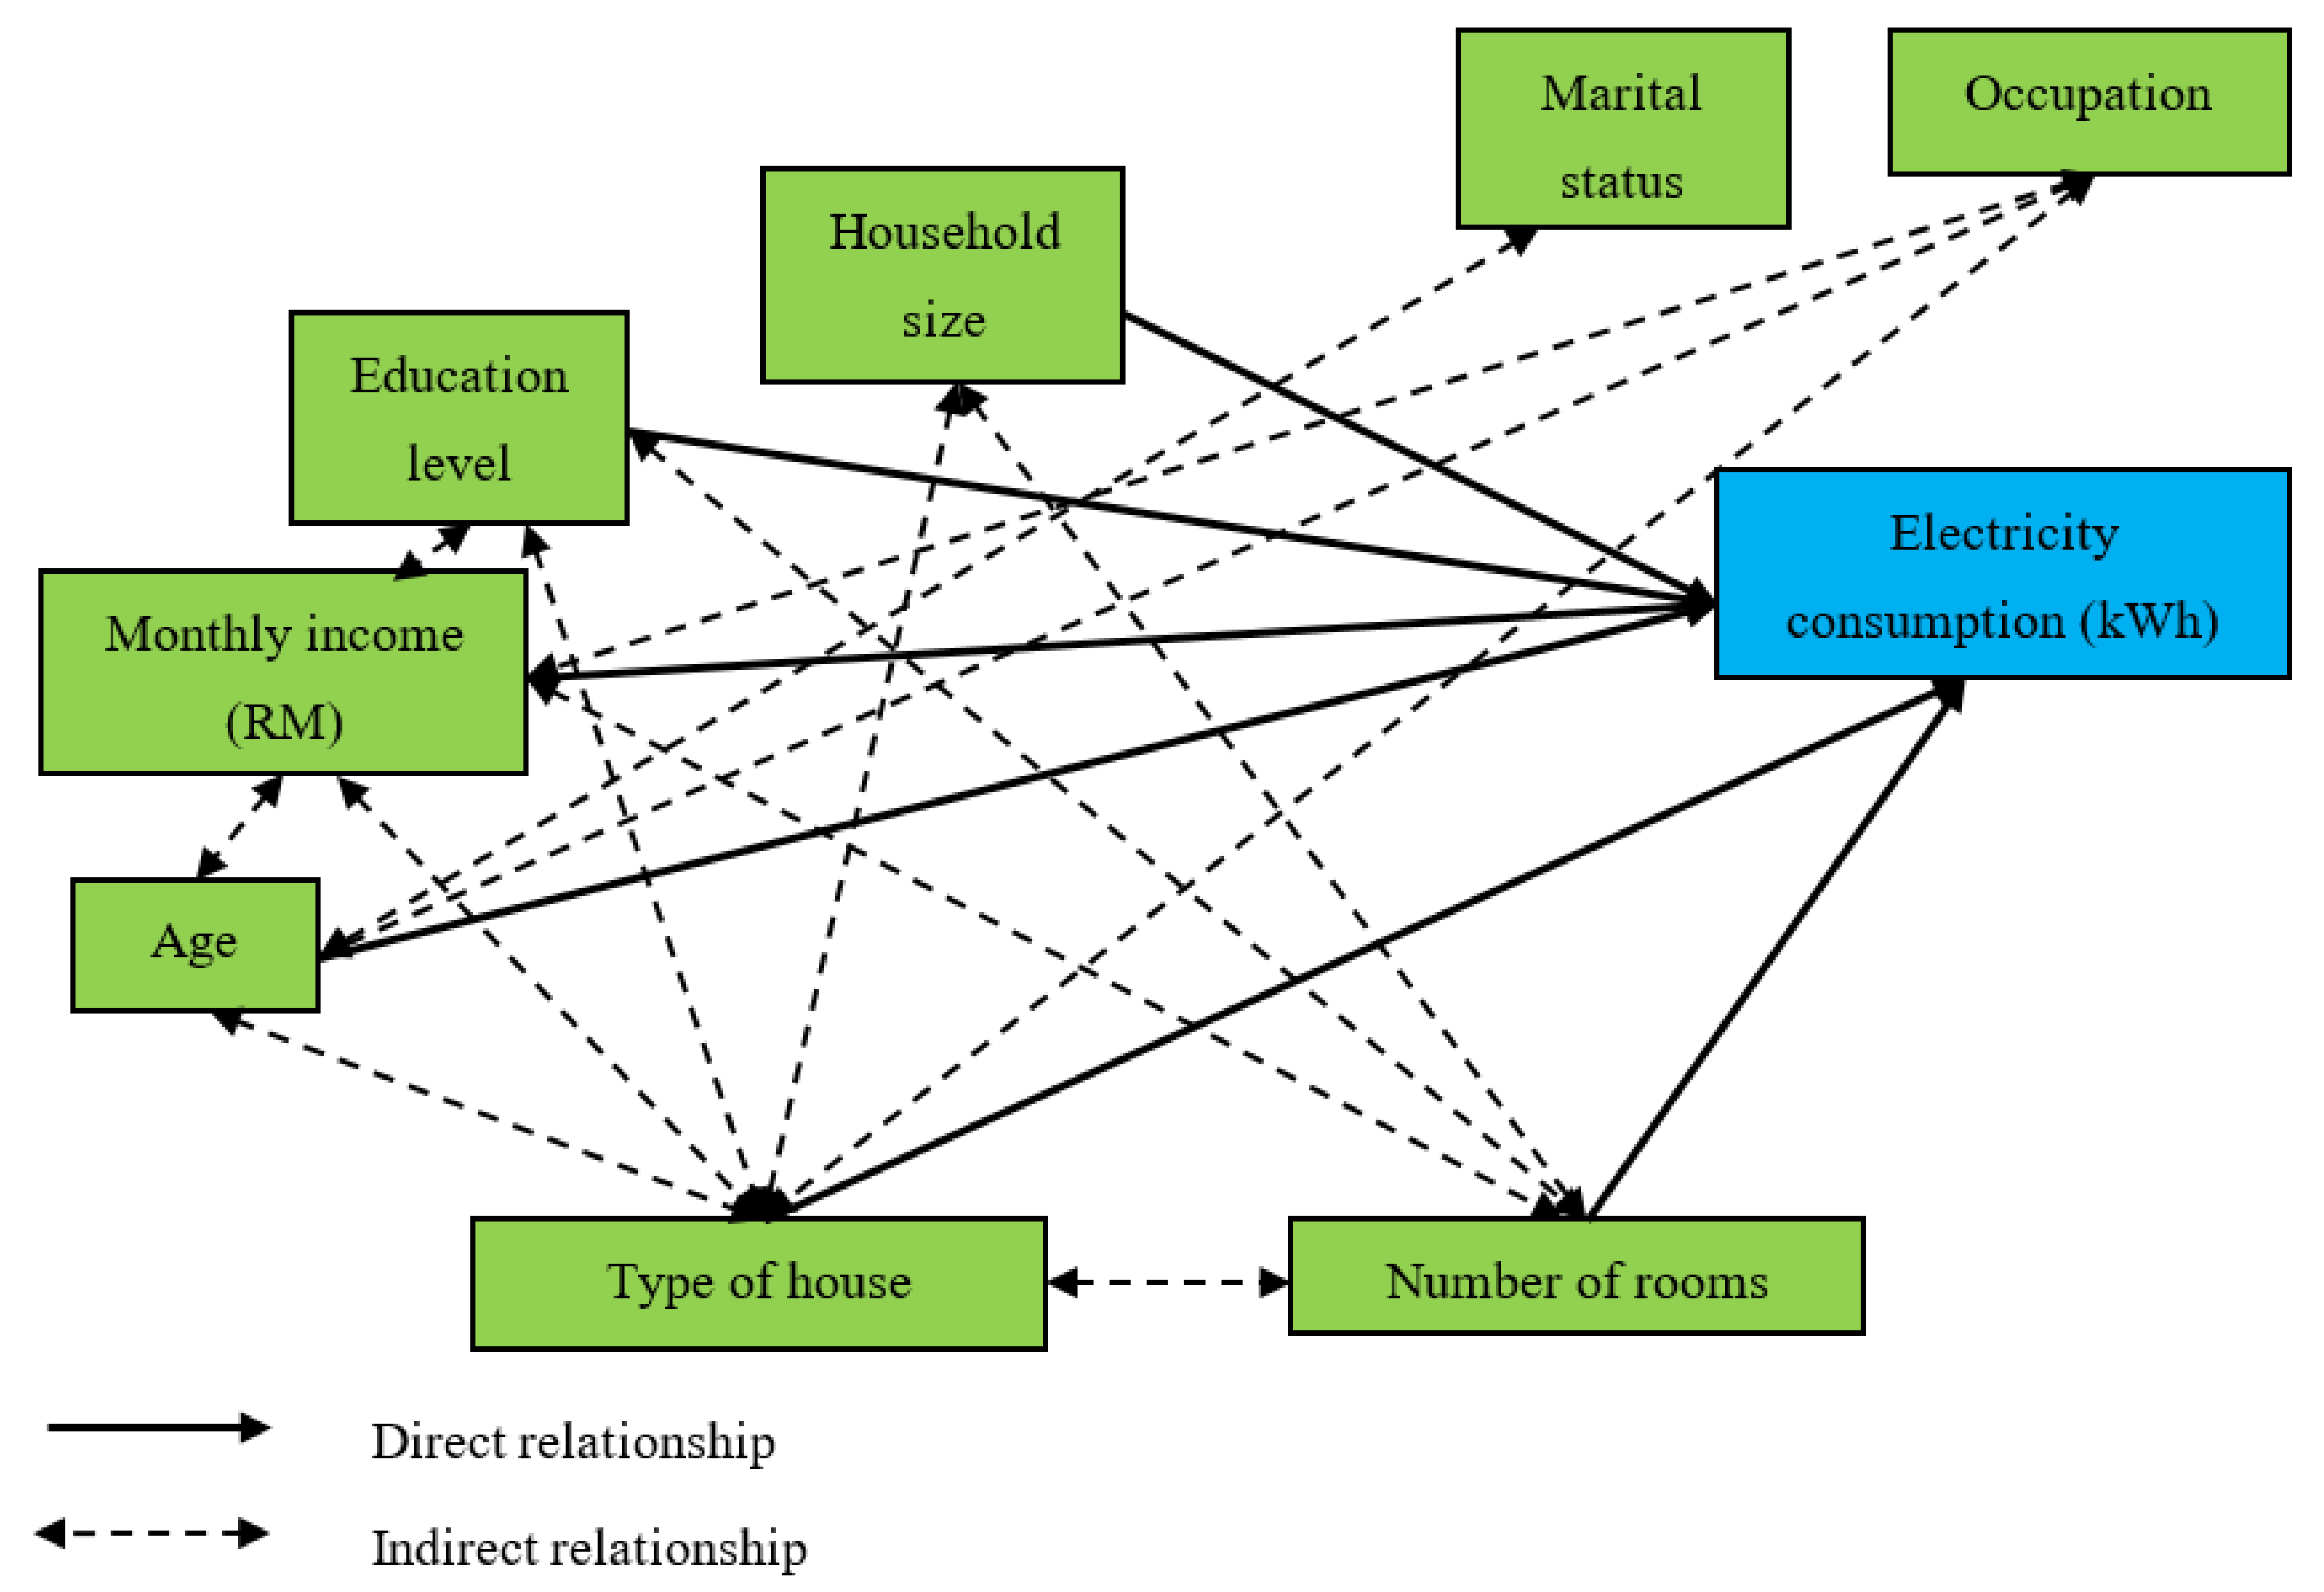
3.3.3. Socioeconomic Profile and Housing Characteristics vs Electricity Consumption

The age of the respondent, monthly income, education level, household size, type of house and number of rooms had a significant direct relationship with electricity consumption (Table 5). Correlation analysis also revealed the significant indirect relationship. For instance, monthly income was significantly correlated with education level (r = 0.470; p < 0.01), occupation (r = 0.332; p < 0.01), number of rooms (r = 0.330; p < 0.01), age (r = 0.202; p < 0.01), type of house (r = 0.198; p < 0.05), household size (r = 0.151; p < 0.01), marital status (r = 0.131; p < 0.01) and race (r = 0.126; p < 0.05). Among these variables, educational level, occupation and number of rooms had a greater correlation with monthly income. A similar result was found for housing characteristics. Although the type of house exhibited a direct relationship with electricity consumption, other variables also had an indirect relationship. The type of house was significantly correlated with educational level (r = 0.232; p < 0.01), monthly income (r = 0.198; p < 0.01), occupation (r = 0.153; p < 0.01) and age (r = 0.122; p < 0.05). Therefore, the type of house is improved as education level, monthly income, occupation level and age of respondents increase, subsequently influencing electricity consumption (Figure 7).

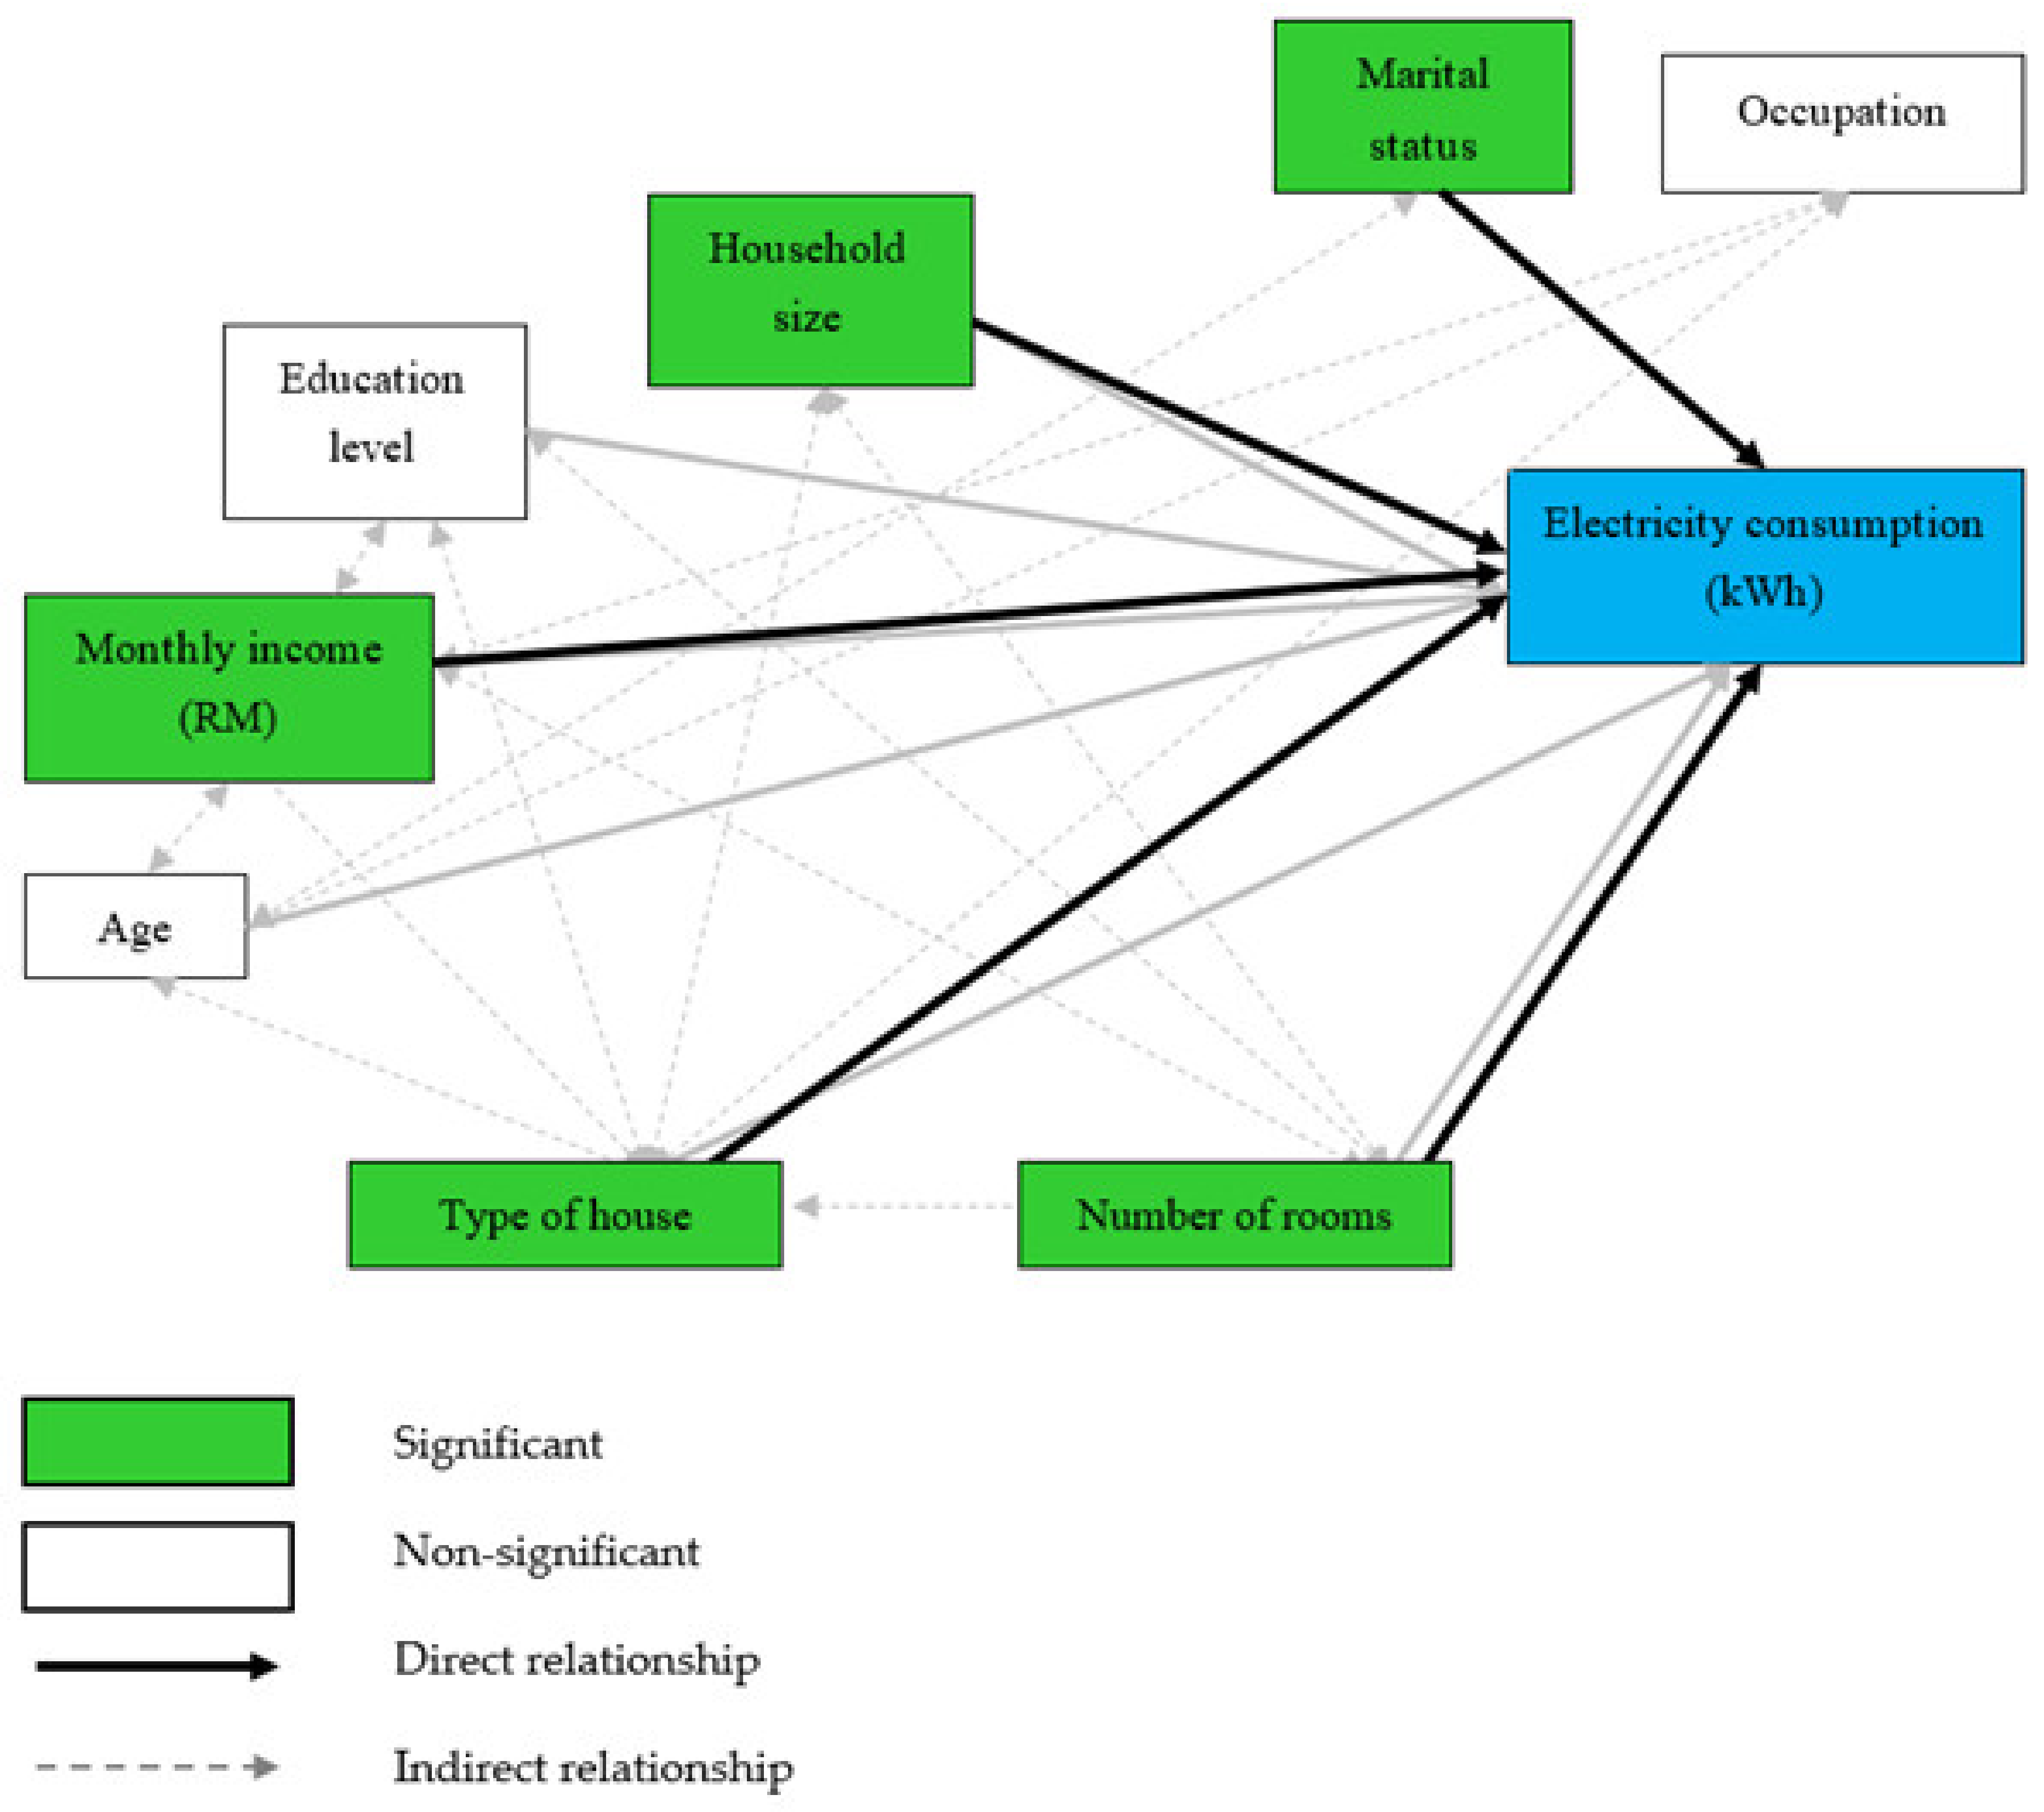
3.4. Determining Critical Factor

The critical factors that affect electricity consumption were analysed. Multiple linear regression analysis was performed to determine the overall effects of respondents’ socioeconomic profile and housing characteristics on electricity consumption in an urban region. The variables were considered the categorical factors in the model; thus, a dummy variable was created to represent an attribute that belongs two or more categories [65]. A stepwise technique in a three-step regression model was applied to investigate the critical factors of electricity consumption. In the first model, socioeconomic profiles, such as race, marital status, occupation, education level, age, income and household size, were included. In the second regression model, housing characteristic variables, including the type of house and number of rooms, were tested. In the third model, both socioeconomic profile and housing characteristics were combined in the regression model to identify the critical determinants of electricity consumption in the study area. The results of the regression analysis are presented in Table 6, Table 7 and Table 8.
The first model of the regression analysis indicates that the socioeconomic profile explained approximately 15.4% of the variation in electricity consumption (Table 5). This finding shows that a household with a high monthly income tends to consume more electricity because it has more stable financial resources and a stronger ability to purchase and own many electrical appliances compared with other income groups. The income factors (>RM 5001) were the largest and most significant contributor (β = 0.378, p = 0.000; p < 0.05) to electricity consumption. Therefore, each unit increment in household income leads to an increment of approximately 0.378 kWh in monthly electricity consumption. Similarly, married households consumed a high amount of electricity, which might probably be due to the greater sample size (81.3%) in the current dataset. Therefore, high-income households tend to consume more electricity than low-income households in an urban region. The contribution of the socioeconomic profile can be expressed by the following equation:
Y (Electricity Consumption) = 504.025 (Constant) + 240.655X1 (>RM5001) + 114.493X2 (Married) + 136.242X3 (RM4000-RM5000) + 90.680X4 (RM3001-RM4000) − 70.861X5 (Government) + 34.553 (Std, Error)
In the second model, the housing characteristic variables explained approximately 16.1% variation of electricity consumption in an urban region (Table 6). A house with more than five rooms was the largest contributor to electricity consumption (β = 0.323, p = 0.000; p < 0.05). This result indicates that for each unit increment in the number of rooms, electricity consumption increases by 0.323 kWh/month. Therefore, spacious houses with a greater number of rooms, such as bungalows, consume a higher amount of electricity, especially for cooling; this finding is similar to that of other studies [48,62]. The contribution of the housing variables can be expressed by the following equation:
Y (Electricity Consumption) = 567.194 (Constant) + 283.200X1 (>5 rooms) + 106.565X2 (4 rooms) + 117.858X3 (Bungalow) + 17.578 (Std. Error)
Lastly, the socioeconomic profile and housing characteristic variables were combined to set up the final model of electricity consumption (Table 7). Interestingly, after all variables in the model were combined, both variables (socioeconomic profile and housing characteristics) explained approximately 25.3% of electricity consumption in the study area.
Specifically, married households with a high income and a spacious house with three to five people were important predictors of electricity consumption in Seremban. The model also showed that houses with more than five rooms were the largest contributor to electricity consumption (β = 0.316, p = 0.000; p < 0.05). Hence, electricity consumption increases by 0.316 kWh with each additional unit in a house with more than five rooms. Therefore, the number of rooms is the critical factor of electricity consumption in a rapidly growing city. This finding is essential in energy management and important for limiting the negative effect of greenhouse gas emissions in urban regions. The contribution of the variables can be expressed by the following equation:
Y (Electricity Consumption) = 414.554 (Constant) + 277.499X1 (>5 rooms) + 121.610X2 (>RM5001) + 129.468X3 (Married) + 62.733X4 (3–5 people) + 69.789X5 (4 rooms) + 97.571X6 (Bungalow) + 31.853 (Std, Error)

4. Discussion

The analysis focused solely on explaining the critical factors of electricity consumption in a rapidly growing city. The dependent and independent variables were tested using statistical analysis among 620 urban households.

4.1. Summary and Relation to Previous Study

As indicated by Chen et al. [18], energy consumption is unique and can be distinguished based on certain characteristics of the user, such as race, sociocultural norms, climate and behaviour. The respondents’ socioeconomic profile and housing characteristics were significantly related to electricity consumption in Seremban. Factors such as monthly income (r = 0.360; p < 0.01), educational level (r = 0.227; p < 0.01), household size (r = 0.210; p < 0.01), age (r = 0.108; p < 0.05), type of house (r = 0.209; p < 0.01) and number of rooms (r = 0.376; p <0.01) were directly associated with electricity consumption, whereas other factors had an indirect correlation only. Similar results were found in numerous studies, e.g., Rahman et al. [66], Huang [22], Tewathia [19] and Khattak et al. [67]. Rahman et al. [66] found that housing characteristics, such as the type of house (r = 0.221), number of rooms (r = 0.176), housing size (r = 0.221), monthly income (r = 0.183) and household size (r = 0.161), were significantly correlated with electricity cost. Tewathia [19] found different results and indicated that housing size and household size were moderately correlated with electricity consumption. Huang [22] found that high-income households consumed twice as much electricity compared with low-income households. However, in terms of electricity consumption per capita, low-income households had higher consumption than high-income households. This study revealed that income was the most significant socioeconomic factor that influences electricity consumption in Seremban. For instance, household income had a significant correlation with electricity consumption (r = 0.360; p < 0.01). Thus, the increment in household income would lead to increased electricity usage. This result is probably due to the respondents’ educational level (r = 0.470; p < 0.01) and household size (r = 0.151; p < 0.01), given that these variables are directly correlated with household income and indirectly correlated with electricity usage. The reason for this finding is that high-income households commonly have a greater number of occupants who live in spacious houses and own a wide range of appliances [68]. According to Nielsen [69], a 1% increment in appliance ownership contributes to an approximately 0.35% increment in electricity consumption. Bedir et al. [70] added that appliance ownership explained approximately 21% of the variation in domestic electricity consumption. Thus, the current findings show that household income significantly determines the electricity consumption in Seremban.
This study also found that the number of rooms was the most significant housing variable that influences electricity consumption in Seremban, denoting a linear relationship, i.e., a higher number of rooms corresponds to higher electricity consumption. The Pearson’s correlation test indicated a significant relationship between the number of rooms and the type of house, which is why these factors are assumed to complement each other, i.e., a spacious house correlates to more rooms. Bedir et al. [70] indicated that the number of rooms was significantly correlated with electricity consumption, particularly for study/hobby rooms in the Netherlands. They found that electricity expenditure increased by more than 11% as the number of rooms increased [71]. However, Brounen et al. [43] and Wiesmann et al. [72] found that the number of rooms has an insignificant effect. Similarly, the multiple linear regression analysis conducted in the present study revealed that high-income married households living in a spacious house with three to five people were important predictors that affect the electricity consumption in Seremban. The regression model indicated that the number of rooms was the largest contributor to electricity consumption, hence implying that the number of rooms determines the usage of electricity, particularly for heating and cooling, as it is the most significant component that affects household electricity consumption [17,18]. The effect of respondents’ socioeconomic profile and housing variables on electricity consumption is shown in Figure 8.

4.2. Comparison with Other Countries and Cities

The average electricity consumption in various countries is shown in Figure 9 [73], which indicates that the electricity consumption of Malaysian households is slightly higher than that of China and the world. A comparison with other ASEAN countries shows that the average electricity consumption of Malaysia is double that of Thailand and lower than that of Brunei and Singapore probably because the urban population of both countries is higher than that of Malaysia. Meanwhile, other countries, such as Vietnam, Indonesia, the Philippines and Myanmar, have lower electricity usage than Malaysia.
The influence of urban population in electricity consumption was also tested, as shown in Figure 10. The scatterplot reveals that the value of R2 is 0.7943 or 79.43% variation in electricity consumption. This finding indicates that the urban population contributed almost 80%, whereas the nonurban population contributed approximately 20% in global electricity consumption. Therefore, electricity consumption reduction in urban areas should be the first priority in developing countries, particularly for the domestic sector because their consumption is highly influenced by the urban population density. In summary, countries with a high urban population density consumes more electricity than less developed countries do.
Figure 11 shows the electricity consumption per capita for several cities. The data were gathered from previous studies, particularly in Southeast Asian countries [74,75]. The average electricity consumption per capita in Seremban is 648.31 kWh/month, which is slightly higher than the average electricity consumption per capita in Singapore and slightly lower than the average electricity consumption in Manila, Kuala Lumpur and Jakarta.

4.3. Implications of the Study Findings

The results imply that the number of rooms is the critical determinant that explains residential electricity consumption in a rapidly growing city. On the basis of electricity consumption, most electricity is allocated for kitchen/home, cooling and lighting appliances. The survey results identified that energy-saving appliances are not fully utilised. Therefore, a detailed ownership of energy-saving devices is significant to understand electricity consumption. Furthermore, the number of energy-saving appliances in the market is limited. Currently, only five appliances comply with the energy efficiency rating of the Malaysian Energy Commission, namely, refrigerators, televisions, microwave ovens, air conditioners and washing machines. In addition, the energy demand from the residential sector is projected to increase significantly due to rapid urban development. Therefore, improving the energy efficiency of appliances should be used as a way to reduce carbon emissions in urban regions.
This study also identified room for improvement of energy conservation and management at the household scale. The result of the Sankey diagram portrays the energy flows in the urban residential sector. This study offers a great opportunity for power saving through energy-saving appliances, given that the majority of electricity is allocated for kitchen/home and cooling appliances. Therefore, electricity consumption can be controlled and managed for the household sector. However, this approach involves large financial investments in energy efficient products.

5. Conclusions

This study focused only on the effect of respondents’ socioeconomic profile and housing characteristics on electricity consumption. Future studies should investigate other factors, including the effect of human attitude and behaviour and climatic conditions on electricity consumption. Previous works considered consumer behaviour a significant determinant of residential electricity consumption because electricity consumption is related not only to building characteristics but also to human activities in the building. Therefore, these variables need to be studied further because they have different and complex effects on electricity consumption.
This study focused only on the effect of respondents’ socioeconomic profile and housing characteristics on electricity consumption. Future studies should investigate other factors, including the effect of human attitude and behaviour and climatic conditions on electricity consumption. Previous works considered consumer behaviour a significant determinant of residential electricity consumption because electricity consumption is related not only to building characteristics, but also to human activities in the building. Therefore, these variables need to be studied further because they have different and complex effects on electricity consumption.

Author Contributions

Conceptualization, M.R.R., A.A. and R.J.L.; methodology, S.S.S.A., M.R.R. and A.A.; software, S.S.S.A.; validation, M.R.R. and A.A.; formal analysis, S.S.S.A., M.R.R. and A.A.; investigation, S.S.S.A.; resources, M.R.R.; data curation, S.S.S.A. and M.R.R.; writing—original draft preparation, S.S.S.A.; writing—review and editing, S.S.S.A., M.R.M.A., R.A.I. and M.R.I.; visualization, S.S.S.A. and M.R.R.; supervision, M.R.R. and A.A.; project administration, M.R.R.; funding acquisition, M.R.R. All authors have read and agreed to the published version of the manuscript.

Funding

This research was funded by Universiti Kebangsaan Malaysia (UKM) for the financial support through research grants, Dana Pecutan Penerbitan–LESTARI UKM: PP/LESTARI/2021 and XX-2018-008.

Institutional Review Board Statement

Not applicable.

Informed Consent Statement

Not applicable.

Data Availability Statement

The data used to support the findings of this study are included within the article.

Acknowledgments

The authors are very thankful to the Institute for Environment and Development (LESTARI), Universiti Kebangsaan Malaysia (UKM) for providing facilities to conduct the research. It is also dedicated to the late Associate Professor Shahruddin Idrus who instigated the research that is presented before his sudden death in January 2017.

Conflicts of Interest

The authors declare no conflict of interest.

References

  1. Ali, S.S.S.; Razman, M.R.; Awang, A. The nexus of population, GDP growth, electricity generation, electricity consumption and carbon emissions output in Malaysia. Int. J. Energy Econ. Policy 2020, 10, 84–89. [Google Scholar] [CrossRef]
  2. Tan, C.S.; Maragatham, K.; Leong, Y.P. Electricity energy outlook in Malaysia. IOP Conf. Ser. Earth Environ. Sci. 2013, 16, 012126. [Google Scholar] [CrossRef]
  3. Ali, S.S.S.; Razman, M.R.; Awang, A. The estimation and relationship of domestic electricity consumption and appliances ownership in Malaysia’s intermediate city. Int. J. Energy Econ. Policy 2020, 10, 116–122. [Google Scholar] [CrossRef]
  4. Santamouris, M. On the energy impact of urban heat island and global warming on buildings. Energy Build. 2014, 82, 100–113. [Google Scholar] [CrossRef]
  5. Santamouris, M.; Cartalis, C.; Synnefa, A.; Kolokotsa, D. On the impact of urban heat island and global warming on the power demand and electricity consumption of buildings—A review. Energy Build. 2015, 98, 119–124. [Google Scholar] [CrossRef]
  6. Asyraf, M.R.M.; Rafidah, M.; Ishak, M.R.; Sapuan, S.M.; Yidris, N.; Ilyas, R.A.; Razman, M.R. Integration of TRIZ, Morphological Chart and ANP method for development of FRP composite portable fire extinguisher. Polym. Compos. 2020, 41, 2917–2932. [Google Scholar] [CrossRef]
  7. Asyraf, M.R.M.; Rafidah, M.; Azrina, A.; Razman, M.R. Dynamic mechanical behaviour of kenaf cellulosic fibre biocomposites: A comprehensive review on chemical treatments. Cellulose 2021, 28, 2675–2695. [Google Scholar] [CrossRef]
  8. Ritchie, H.; Roser, M. Our World in Data: CO₂ and Greenhouse Gas Emissions. Creative Commons: England, United Kingdom. 2020. Available online: https://ourworldindata.org/co2-and-other-greenhouse-gas-emissions#citation (accessed on 15 April 2021).
  9. Sandu, S.; Yang, M.; Mahlia, T.M.I.; Wongsapai, W.; Ong, H.C.; Putra, N.; Ashrafur Rahman, S.M. Energy-related CO2 emissions growth in ASEAN countries: Trends, drivers and policy implications. Energies 2019, 12, 4650. [Google Scholar] [CrossRef] [Green Version]
  10. Han, W.; Geng, Y.; Lu, Y.; Wilson, J.; Sun, L.; Satoshi, O.; Geldron, A.; Qian, Y. Urban metabolism of megacities: A comparative analysis of Shanghai, Tokyo, London and Paris to inform low carbon and sustainable development pathways. Energy 2018, 155, 887–898. [Google Scholar] [CrossRef]
  11. Asyraf, M.R.M.; Ishak, M.R.; Sapuan, S.M.; Yidris, N. Conceptual design of creep testing rig for full-scale cross arm using TRIZ-Morphological chart-analytic network process technique. J. Mater. Res. Technol. 2019, 8, 5647–5658. [Google Scholar] [CrossRef]
  12. Asyraf, M.R.M.; Ishak, M.R.; Sapuan, S.M.; Yidris, N. Conceptual design of multi-operation outdoor flexural creep test rig using hybrid concurrent engineering approach. J. Mater. Res. Technol. 2020, 9, 2357–2368. [Google Scholar] [CrossRef]
  13. Facchini, A.; Kennedy, C.; Stewart, I.; Mele, R. The energy metabolism of megacities. Appl. Energy 2017, 186, 86–95. [Google Scholar] [CrossRef]
  14. Wakabayashi, M.; Kimura, O. The impact of the Tokyo Metropolitan Emissions Trading Scheme on reducing greenhouse gas emissions: Findings from a facility-based study. Clim. Policy 2018, 18, 1028–1043. [Google Scholar] [CrossRef]
  15. Energy Commission. Malaysia Energy Statistics Handbook; Energy Commission: Putrajaya, Malaysia, 2019. [Google Scholar]
  16. APERC. APEC Energy Demand and Supply Outlook, 6th ed.; APERC: Tokyo, Japan, 2016. [Google Scholar]
  17. Yun, G.Y.; Steemers, K. Behavioural, physical and socio-economic factors in household cooling energy consumption. Appl. Energy 2011, 88, 2191–2200. [Google Scholar] [CrossRef]
  18. Chen, J.; Wang, X.; Steemers, K. A statistical analysis of a residential energy consumption survey study in Hangzhou, China. Energy Build. 2013, 66, 193–202. [Google Scholar] [CrossRef]
  19. Tewathia, N. Determinants of the household electricity consumption: A case study of Delhi. Int. J. Energy Econ. Policy 2014, 4, 337–348. [Google Scholar]
  20. Rahut, D.B.; Das, S.; De Groote, H.; Behera, B. Determinants of household energy use in Bhutan. Energy 2014, 69, 661–672. [Google Scholar] [CrossRef]
  21. Zheng, X.; Wei, C.; Qin, P.; Guo, J.; Yu, Y.; Song, F.; Chen, Z. Characteristics of residential energy consumption in China: Findings from a household survey. Energy Policy 2014, 75, 126–135. [Google Scholar] [CrossRef]
  22. Huang, W.H. The determinants of household electricity consumption in Taiwan: Evidence from quantile regression. Energy 2015, 87, 120–133. [Google Scholar] [CrossRef]
  23. Hu, Y.C. Electricity consumption prediction using a neural-network-based grey forecasting approach. J. Oper. Res. Soc. 2017, 68, 1259–1264. [Google Scholar] [CrossRef]
  24. Heinonen, J.; Junnila, S. Residential energy consumption patterns and the overall housing energy requirements of urban and rural households in Finland. Energy Build. 2014, 76, 295–303. [Google Scholar] [CrossRef]
  25. Kavousian, A.; Rajagopal, R.; Fischer, M. Determinants of residential electricity consumption: Using smart meter data to examine the effect of climate, building characteristics, appliance stock, and occupants’ behavior. Energy 2013, 55, 184–194. [Google Scholar] [CrossRef]
  26. Santamouris, M.; Papanikolaou, N.; Livada, I.; Koronakis, I.; Georgakis, C.; Argiriou, A.; Assimakopoulos, D.N. On the impact of urban climate on the energy consuption of building. Sol. Energy 2001, 70, 201–216. [Google Scholar] [CrossRef]
  27. Asyraf, M.R.M.; Ishak, M.R.; Sapuan, S.M.; Yidris, N.; Rafidah, M.; Ilyas, R.A.; Razman, M.R. Potential application of green composites for cross arm component in transmission tower: A brief review. Int. J. Polym. Sci. 2020, 2020, 1–15. [Google Scholar] [CrossRef]
  28. Shiu, A.; Lam, P.L. Electricity consumption and economic growth in China. Energy Policy 2004, 32, 47–54. [Google Scholar] [CrossRef]
  29. Wolde-Rufael, Y. Electricity consumption and economic growth: A time series experience for 17 African countries. Energy Policy 2006, 34, 1106–1114. [Google Scholar] [CrossRef]
  30. Yoo, S.-H. The causal relationship between electricity consumption and economic growth in the ASEAN countries. Energy Policy 2006, 34, 3573–3582. [Google Scholar] [CrossRef]
  31. Vassileva, I.; Wallin, F.; Dahlquist, E. Analytical comparison between electricity consumption and behavioral characteristics of Swedish households in rented apartments. Appl. Energy 2012, 90, 182–188. [Google Scholar] [CrossRef]
  32. Jaafar, M.H.; Arifin, K.; Aiyub, K.; Razman, M.R.; Ishak, M.I.S.; Samsurijan, M.S. Occupational safety and health management in the construction industry: A review. Int. J. Occup. Saf. Ergon. 2018, 24, 493–506. [Google Scholar] [CrossRef]
  33. Arham, A.F.; Razman, M.R.; Amin, L.; Mahadi, Z.; Ern, L.K.; Zakaria, S.Z.S.; Mokhtar, M. Integrated research framework approaches to the control of dengue diseases for achieving sustainable development goals in Malaysia. Indian J. Public Health Res. Dev. 2018, 9, 1231. [Google Scholar] [CrossRef]
  34. Cayla, J.M.; Maizi, N.; Marchand, C. The role of income in energy consumption behaviour: Evidence from French households data. Energy Policy 2011, 39, 7874–7883. [Google Scholar] [CrossRef]
  35. Kowsari, R.; Zerriffi, H. Three dimensional energy profile: A conceptual framework for assessing household energy use. Energy Policy 2011, 39, 7505–7517. [Google Scholar] [CrossRef]
  36. Özcan, K.M.; Gülay, E.; Üçdoǧruk, Ş. Economic and demographic determinants of household energy use in Turkey. Energy Policy 2013, 60, 550–557. [Google Scholar] [CrossRef]
  37. Huebner, G.M.; Hamilton, I.; Chalabi, Z.; Shipworth, D.; Oreszczyn, T. Explaining domestic energy consumption—The comparative contribution of building factors, socio-demographics, behaviours and attitudes. Appl. Energy 2015, 159, 589–600. [Google Scholar] [CrossRef] [Green Version]
  38. Suleiman, J.H.; Balubaid, S.; Zakari, N.M.; Ituma, E.E. Dwelling factors effect on residential building energy consumption. J. Teknol. 2015, 77, 41–45. [Google Scholar] [CrossRef] [Green Version]
  39. Hara, K.; Uwasu, M.; Kishita, Y.; Takeda, H. Determinant factors of residential consumption and perception of energy conservation: Time-series analysis by large-scale questionnaire in Suita, Japan. Energy Policy 2015, 87, 240–249. [Google Scholar] [CrossRef]
  40. Wahlström, M.H.; Hårsman, B. Residential energy consumption and conservation. Energy Build. 2015, 102, 58–66. [Google Scholar] [CrossRef] [Green Version]
  41. Liddle, B. Impact of population, age structure, and urbanization on carbon emissions/energy consumption: Evidence from macro-level, cross-country analyses. Popul. Environ. 2014, 35, 286–304. [Google Scholar] [CrossRef] [Green Version]
  42. Liddle, B.; Lung, S. Age-structure, urbanization, and climate change in developed countries: Revisiting STIRPAT for disaggregated population and consumption-related environmental impacts. Popul. Environ. 2010, 31, 317–343. [Google Scholar] [CrossRef] [Green Version]
  43. Brounen, D.; Kok, N.; Quigley, J.M. Energy literacy, awareness, and conservation behavior of residential households. Energy Econ. 2013, 38, 42–50. [Google Scholar] [CrossRef]
  44. Ntona, E.; Arabatzis, G.; Kyriakopoulos, G.L. Energy saving: Views and attitudes of students in secondary education. Renew. Sustain. Energy Rev. 2015, 46, 1–15. [Google Scholar] [CrossRef]
  45. Chen, Y.T. The factors affecting electricity consumption and the consumption characteristics in the residential sector—a case example of Taiwan. Sustainability 2017, 9, 1484. [Google Scholar] [CrossRef] [Green Version]
  46. Desipri, K.; Legaki, N.Z.; Assimakopoulos, V. Determinants of domestic electricity consumption and energy behavior: A Greek case study. In Proceedings of the IISA 2014—5th International Conference on Information, Intelligence, Systems and Applications, Chania, Greece, 7–9 July 2014. [Google Scholar]
  47. Yalcintas, M.; Kaya, A. Roles of income, price and household size on residential electricity consumption: Comparison of Hawaii with similar climate zone states. Energy Reports 2017, 3, 109–118. [Google Scholar] [CrossRef]
  48. Wijaya, M.E.; Tezuka, T. A comparative study of households’ electricity consumption characteristics in Indonesia: A techno-socioeconomic analysis. Energy Sustain. Dev. 2013, 17, 596–604. [Google Scholar] [CrossRef]
  49. Jabatan Perangkaan Malaysia. Laporan Sosioekonomi Negeri Sembilan; DSM: Putrajaya, Malaysia, 2019. [Google Scholar]
  50. Unit Perancang Ekonomi Negeri Sembilan. Data Sosioekonomi Negeri Sembilan (Socioeconomic Data of Negeri Sembilan); EPU NS: Seremban, Negeri Sembilan, Malaysia, 2019. [Google Scholar]
  51. Department of Survey and Mapping Malaysia. Electronic Map (eMap); JUPEM: Kuala Lumpur, Malaysia, 2001. [Google Scholar]
  52. Kim, M.J. Understanding the determinants on household electricity consumption in Korea: OLS regression and quantile regression. Electr. J. 2020, 33, 106802. [Google Scholar] [CrossRef]
  53. Kim, M.J. Determining the relationship between residential electricity consumption and factors: Case of Seoul. Sustainability 2020, 12, 8590. [Google Scholar] [CrossRef]
  54. Creative Research Systems. Sample Size Formulas for Our Sample Size Calculator; CRS: Sacramento, CA, USA, 2019. [Google Scholar]
  55. Olaniyan, K.; McLellan, B.C.; Ogata, S.; Tezuka, T. Estimating residential electricity consumption in Nigeria to support energy transitions. Sustainability 2018, 10, 1440. [Google Scholar] [CrossRef] [Green Version]
  56. IBM. IBM Corp IBM SPSS Statistics for Windows, version 26.0; IBM: Armonk, NY, USA, 2019. [Google Scholar]
  57. Bluman, A.G. Elementary Statistics: A Step by Step Approach, 8th ed.; McGraw Hill: New York, NY, USA, 2012; ISBN 9788578110796. [Google Scholar]
  58. Lay, Y.F.; Khoo, C.H. Introduction to Statistical Analysis in Social Sciences Research; Venton Publishing: Selangor, Malaysia, 2009. [Google Scholar]
  59. Fumo, N.; Rafe Biswas, M.A. Regression analysis for prediction of residential energy consumption. Renew. Sustain. Energy Rev. 2015, 47, 332–343. [Google Scholar] [CrossRef]
  60. Ghasemi, A.; Zahediasl, S. Normality tests for statistical analysis: A guide for non-statisticians. Int. J. Endocrinol. Metab. 2012, 10, 486–489. [Google Scholar] [CrossRef] [PubMed] [Green Version]
  61. Kim, H.-Y. Statistical notes for clinical researchers: Assessing normal distribution (2) using skewness and kurtosis. Restor. Dent. Endod. 2013, 38, 52–54. [Google Scholar] [CrossRef]
  62. Kubota, T.; Ahmad, S. Questionnaire Survey on Behavior for Natural Ventilation and Electricity Consumption in Terraced Houses: A case study of Johor Bahru City. In Proceedings of the Asian Planning Schools Association (APSA) Conference 2005, Penang, Malaysia, 11–14 September 2005. [Google Scholar]
  63. Mukaka, M.M. Statistics corner: A guide to appropriate use of correlation coefficient in medical research. Malawi Med. J. 2012, 24, 69–71. [Google Scholar] [PubMed]
  64. Rosenthal, J.A. Statistics and Data Interpretation for the Helping Professions; Cengage Learning, Inc.: Belmont, CA, USA, 2001. [Google Scholar]
  65. Skrivanek, S. The Use of Dummy Variables in Regression Analysis; More Steam, LLC.: Powell, OH, USA, 2009. [Google Scholar]
  66. Rahman, K.A.; Hariri, A.; Leman, A.M.; Yusof, M.Z.M.; Najib, M.N.M. Energy consumption in residential building: The effect of appliances and human behaviour. AIP Conf. Proc. 2017, 1831, 020018. [Google Scholar]
  67. Khattak, N.U.R.; Tariq, M.; Khan, J. Determinants of household’s demand for electricity in district Peshawar. Eur. J. Soc. Sci. 2010, 14, 7–16. [Google Scholar]
  68. Yohanis, Y.G.; Mondol, J.D.; Wright, A.; Norton, B. Real-life energy use in the UK: How occupancy and dwelling characteristics affect domestic electricity use. Energy Build. 2008, 40, 1053–1059. [Google Scholar] [CrossRef]
  69. Nielsen, L. How to get the birds in the bush into your hand. Results from a Danish research project on electricity savings. Energy Policy 1993, 21, 1133–1144. [Google Scholar] [CrossRef]
  70. Bedir, M.; Hasselaar, E.; Itard, L. Determinants of electricity consumption in Dutch dwellings. Energy Build. 2013, 58, 194–207. [Google Scholar] [CrossRef]
  71. Tiwari, P. Architectural, Demographic, and Economic Causes of Electricity Consumption in Bombay. J. Policy Model. 2000, 22, 81–98. [Google Scholar] [CrossRef]
  72. Wiesmann, D.; Lima Azevedo, I.; Ferrão, P.; Fernández, J.E. Residential electricity consumption in Portugal: Findings from top-down and bottom-up models. Energy Policy 2011, 39, 2772–2779. [Google Scholar] [CrossRef]
  73. The World Bank. Electric Power Consumption (kWh per capita); TWG: Washington, DC, USA, 2021. [Google Scholar]
  74. ASEAN Centre for Energy. ASEAN Electricity Sector: 2019 Highlights; ACE: Jakarta, Indonesia, 2020. [Google Scholar]
  75. ASEAN Centre for Energy. ASEAN Energy Database System (AEDS); ACE: Jakarta, Indonesia, 2019. [Google Scholar]
Figure 2. Study area (altered based on ref. [51]).
Sustainability 13 04441 g002
Figure 3. Survey design.
Sustainability 13 04441 g003
Figure 4. Histogram of (a) average home/kitchen, (b) average lighting and (c) average cooling (kWh/month).
Sustainability 13 04441 g004
Figure 5. The electricity consumption per month and per capita in different type of house.
Sustainability 13 04441 g005
Figure 6. Energy flows in Seremban (kWh/month).
Sustainability 13 04441 g006
Figure 7. Direct and indirect relationship of variables and electricity consumption.
Sustainability 13 04441 g007
Figure 8. Relationship model of household electricity consumption in Seremban, Malaysia.
Sustainability 13 04441 g008
Figure 9. Average household electricity consumption of countries.
Sustainability 13 04441 g009
Figure 10. Scatter plot between electricity consumption and urban population.
Sustainability 13 04441 g010
Figure 11. Urban electricity consumption per capita.
Sustainability 13 04441 g011
Table 1. Appliances considered in the study.
AppliancesNumber of EquipmentAverage
Consumption (kWh)
Power RatingAverage
Operating (hour/day)
Total Consumption (kWh)
Refrigerator395308.4140024121,824
Microwave17715.0715000.252668.78
Washing Machine38216.7142526384.49
Rice Cooker38020.9573017961.46
Television37229.43150510,948.01
Fluorescent Lamp29247.730513,930.32
Lighting Bulb17934.683636207.98
Air Conditioning237206.63750648,973.39
Ceiling Fan37880.96100630,606.3
Stand Fan22925.357545805.75
Vacuum Cleaner22012.39122012725.85
Total3241798.28541657.25258,036.33
Table 2. Variables, mean and standard deviation.
VariablesMeanStandard DeviationSkewnessKurtosis
EnergyElectricity consumption (kWh/month)648.31280.221.9165.814
Socioeconomic ProfileAge of household head (years old)2.600.9860.122−1.139
Marital status1.920.5291.2466.325
Occupation1.490.9371.8342.043
Monthly income (RM)4.091.508−0.211−1.035
Education Level3.571.389−0.231−1.140
Household size (person)1.930.7100.105−1.006
Housing CharacteristicsType of house2.821.2221.0160.204
Number of rooms2.540.7410.455−0.404
Table 3. Correlations between socioeconomic variables and electricity consumption.
Electricity Consumption (kWh)AgeRaceMarital StatusOccupationMonthly Income (RM)Education LevelHousehold Size
Electricity consumption (kWh)1
Age0.108 *1
Race0.097−0.0111
Marital status0.0310.370 **−0.0571
Occupation−0.0010.162 **−0.061−0.0261
Monthly income (RM)0.360 **0.202 **0.126 *0.131 **−0.332 **1
Education level0.227 **−0.127 **0.204 **−0.096−0.168 **0.470 **1
Household size0.210 **0.188 **−0.0920.0520.0120.151 **−0.0471
* Correlation is significant at the 0.05 level (2-tailed); ** Correlation is significant at the 0.01 level (2-tailed).
Table 4. Correlations between housing variables and electricity consumption.
Electricity Consumption (kWh)Type of HouseNumber of Rooms
Electricity consumption (kWh)1
Type of house0.209 **1
Number of rooms0.376 **0.328 **1
** Correlation is significant at the 0.01 level (2-tailed).
Table 5. Correlations between socioeconomic profile, housing characteristics and electricity consumption.
VariablesAgeRaceMarital
Status
OccupationMonthly
Income
(RM)
Education
Level
Household
Size
Type of HouseNumber of Rooms
Age1
Race−0.0111
Marital Status0.370 **−0.0571
Occupation0.162 **−0.061−0.0261
MonthlyIncome (RM)0.202 **0.126 *0.131 **0.332 **1
Education level−0.127 **0.204 **−0.0960.168 **0.407 **1
Household size0.188 **−0.092−0.0520.0120.151 **−0.0471
Type of house0.122 *0.067−0.0020.153 **0.198 **0.232 **0.0451
Number of rooms0.0840.095−0.0370.0310.330 **0.340 **0.203 **0.328 **1
* Correlation is significant at the 0.05 level (2-tailed); ** Correlation is significant at the 0.01 level (2-tailed).
Table 6. Regression model for socioeconomic variables.
ModelBStd. ErrorBetaSig.R2
(Constant)504.02534.553 0.000
>RM5001240.65534.5190.3780.0000.088
Married114.49334.0560.1600.0010.119
RM4001–RM5000136.24241.1310.1730.0010.132
RM3001–RM400090.68035.8860.1340.0120.142
Government−70.86130.621−0.1120.0210.154
Table 7. Regression model for housing characteristics variables.
ModelBStd. ErrorBetaSig.R2
(Constant)567.19417.578 0.000
>5 rooms283.20049.3530.3230.0000.117
4 rooms106.56528.1260.1810.0000.151
Bungalow117.85850.8340.1260.0210.161
Table 8. Regression model for socioeconomic and housing characteristics variables.
ModelBStd. ErrorBetaSig.R2
(Constant)414.55431.853 0.000
>5 rooms277.49947.4910.3160.0000.117
>RM5001121.61030.0640.1910.0000.186
Married129.46831.8980.1810.0000.222
3–5 people62.73324.9250.1120.0120.233
4 rooms69.78938.3480.1190.0140.245
Bungalow97.57148.5330.1050.0450.253
Publisher’s Note: MDPI stays neutral with regard to jurisdictional claims in published maps and institutional affiliations.

