1. Introduction
In terms of energy efficiency, the European building stock is particularly distant from the objectives set by the European Commission’s 2050 roadmap. According to data revealed by the Energy Performance Certifications (EPC) in 16 Member States and collected by the Buildings Performance Institute Europe (BPIE), less than 10% of the buildings have an energy performance equivalent to the first two classes of EPC systems, and only 2.7% is in class “A”. In order to reach the objectives of the 2050 roadmap of the European Commission, it is essential to have a highly efficient building stock, so it will be necessary to work on approximately 97% of the currently occupied buildings [
1]. The European Commission recently proposed a set of innovative strategies for the building sector called “Renovation Wave”. They are focused at delivering faster and deeper renovation for better buildings. One of the lead actions crucial to enable a step change in the depth and scale of renovations is strengthening information, legal certainty and incentives for public and private owners and tenants [
2]. It notes the concept that the definition of the most suitable strategy is based on accurate knowledge of the building, necessary to accurately estimate the current building energy performance and evaluate the benefits of the improvement interventions. Currently, it is instead common to deal with the lack of documentation on the real constructive layout of existing buildings (in terms of components, installations, plants etc.), together with the limited instruments and methodologies to survey their current use profile (energy behavior, real consumptions etc.) and maintenance conditions (conservation status, previous maintenance works, compliance with current regulations etc.). These obstacles cause a deep inefficiency in the planning, programming and controlling of requalification and retrofit works.
The energy audit is a process aimed at understanding how energy is used inside the building, its use profiles and the construction and material characteristics that affect its energy consumption [
3]. This process focuses on the collection and evaluation of many and varied data and information relating to different areas of expertise. Carrying out an effective energy audit consists in collecting a large amount of data of different nature. The correct structure and organization of what is collected will make it possible to understand the energy profile of the building and to choose the most appropriate retrofit scenarios.
Despite the emerging new data capturing technologies and advanced modeling systems, the process of digital twin modeling for existing buildings still lacks a systematic framework [
4].
In particular, the application of BIM methods and tools in the context of improving the energy performance of existing buildings, although very promising, has to overcome a number of critical issues, such as the identification of necessary information for retrofitting, the collection and proper interpretation of monitored data, the handling of uncertainty and the long time and extensive resources required for the creation of the model of an existing building [
5]. For interventions on existing buildings, the information model must be generated from the ”as-built” state starting from a very poor documentation [
6].
On the other hand, the growing use of BEMS (Building Energy Management Systems) and BACS (Building Automation and Control Systems) in buildings provides a large amount of data on consumption, internal and external environmental conditions and use profiles that can be of great help in energy audit procedures. It also frequently integrates the various building components of sensors that are able to collect data on internal thermal conditions [
7]. However, choosing an appropriate method for sensor data visualization is important as it may help users to intuitively understand and work with the data faster and easier.
Starting from these premises, the Department of Civil Engineering, Environment and Architecture of Cagliari (DICAAR), in collaboration with the Department of Electrical and Electronic Engineering (DIEE) Department of Cagliari, has been conducting for some years research work to test the application of Building Information Modeling for the management of existing buildings. In PRELuDE
3 project [
8], the research group is involved in testing the paradigm of digital twin to manage energy audit activity. The goal is to make the energy audit procedures on the existing building stock more efficient, capitalizing the results in an information model. The model allows for a faithful representation of the building to plan the most appropriate intervention on a shared basis of knowledge.
1.1. Literature Review
The application of Building Information Modeling for the energy performance assessment of existing buildings has begun to take its first steps. In [
9], both technical and financial viability of Net Zero Energy Buildings (NZEB) for ”existing” buildings is highlighted using a novel hierarchy flow chart coupled with a Building Information Model. This BIM model is used to thoroughly visualize each option, promote collaboration among stakeholders and accurately estimate associated costs and associated technical issues encountered with producing an NZEB in a predetermined location. Amoruso et al. [
10] show the improvement of thermal comfort for the renovation of an exemplary apartment building based on an integrated Building Information Model and parametric software framework. The existing apartment was reconstructed with BIM software, and the virtual model was utilized for a parametric building energy simulation to calculate the thermal comfort condition of occupants during the entire year. The paper [
11] presents a BIM protocol aimed at supporting decision making by social housing owners. It adopts BIM to simulate alternative retrofit options by considering (a) potential reductions in energy consumption, (b) 4D BIM for retrofit planning and reduction of users’ disruption and (c) simulation of costs.
The concept of BIM and IoT integration is quite new in the literature [
12]. The integration of BIM with real-time data from the Internet of Things (IoT) devices is already a powerful paradigm for numerous applications to improve construction and operational efficiencies. This integration has the potential to disrupt the way we interact with the built environment [
12]. BIM models represent information concerning building’s functional and physical characteristics such as geometry, material properties etc. IoT data can enhance this information set by providing real-time data concerning the actual status of the building [
13]. The existing literature focuses on many aspects of BIM and IoT integration such as energy management, monitoring of construction activities, health and safety management, and building facility management. However, BIM and IoT integration research is still in an early stage and therefore is mostly theoretically proposed [
14]. In the implementation of Post Occupancy Evaluation (POE) procedures, the use of BIM to store and manage data coming from sensors has been proved to be valuable to keep information accurate and available [
15,
16]. The implementation of smart components in buildings is another application area for BIM methodologies and instruments. It can be useful to provide support to the accurate modeling of smart components, but more than this, it can go further and give a static representation of a single status and can contain accurate dynamic data of the smart components [
17]. The research on the link between environmental condition sensors and BIM are of particular interest for the purposes of the present work. They showed that, if BIM models are supplemented with real-time temperature and humidity values, they can provide a rich User Interface (UI) [
18], able to reduce health hazards inside buildings [
19] or infrastructures [
20]. On the other hand BIM can provide a useful environment to collect, elaborate, store and visualize data on energy consumption and performance of buildings [
21].
Therefore, is now clear that a new approach that integrates BIM data with IoT sensors can create a shared data environment for improving the building’s energy and indoor environmental performance while reducing the operational costs and consumptions.
1.2. Research Contribution
The experimentation phase of the PRELuDE
3 project is conducted on a case study of historical–architectural interest: the “Mandolesi” Pavilion of the Faculty of Engineering and Architecture of the University of Cagliari. Starting from the results of the previous tests, the aim of the last step of the research was to integrate the BIM model developed for the case study with the data on the internal conditions of the building and on its energy consumption. Integration of the Revit model and sensor data was obtained through the use of Dynamo visual programming [
22,
23].
The novelty of this study focuses on the real-time monitoring of a set of data coming from low-cost sensors within the parametric model of an existing building of high historical and architectural value, specifically created to facilitate energy audit procedures. The complexity of the building requires a complete and detailed framework to set the most correct and respective retrofit action. Few studies focus on the use of compatible and low-cost remote sensing technology for the retrofit intervention on historic buildings [
24,
25,
26], but none of them refer to the BIM model.
The paper is organized as follows.
Section 2, Materials and Methods, presents and discusses methodology and tools employed to integrate BIM and IoT systems for the existing building monitoring. Moreover, this section presents the case study and a detailed workflow.
Section 3 presents the results in terms of data management and visualization, together with the overall framework created. Finally, conclusions and future work are presented in
Section 4.
2. Materials and Methods
2.1. Case Study: The Mandolesi Pavilion of the University of Cagliari
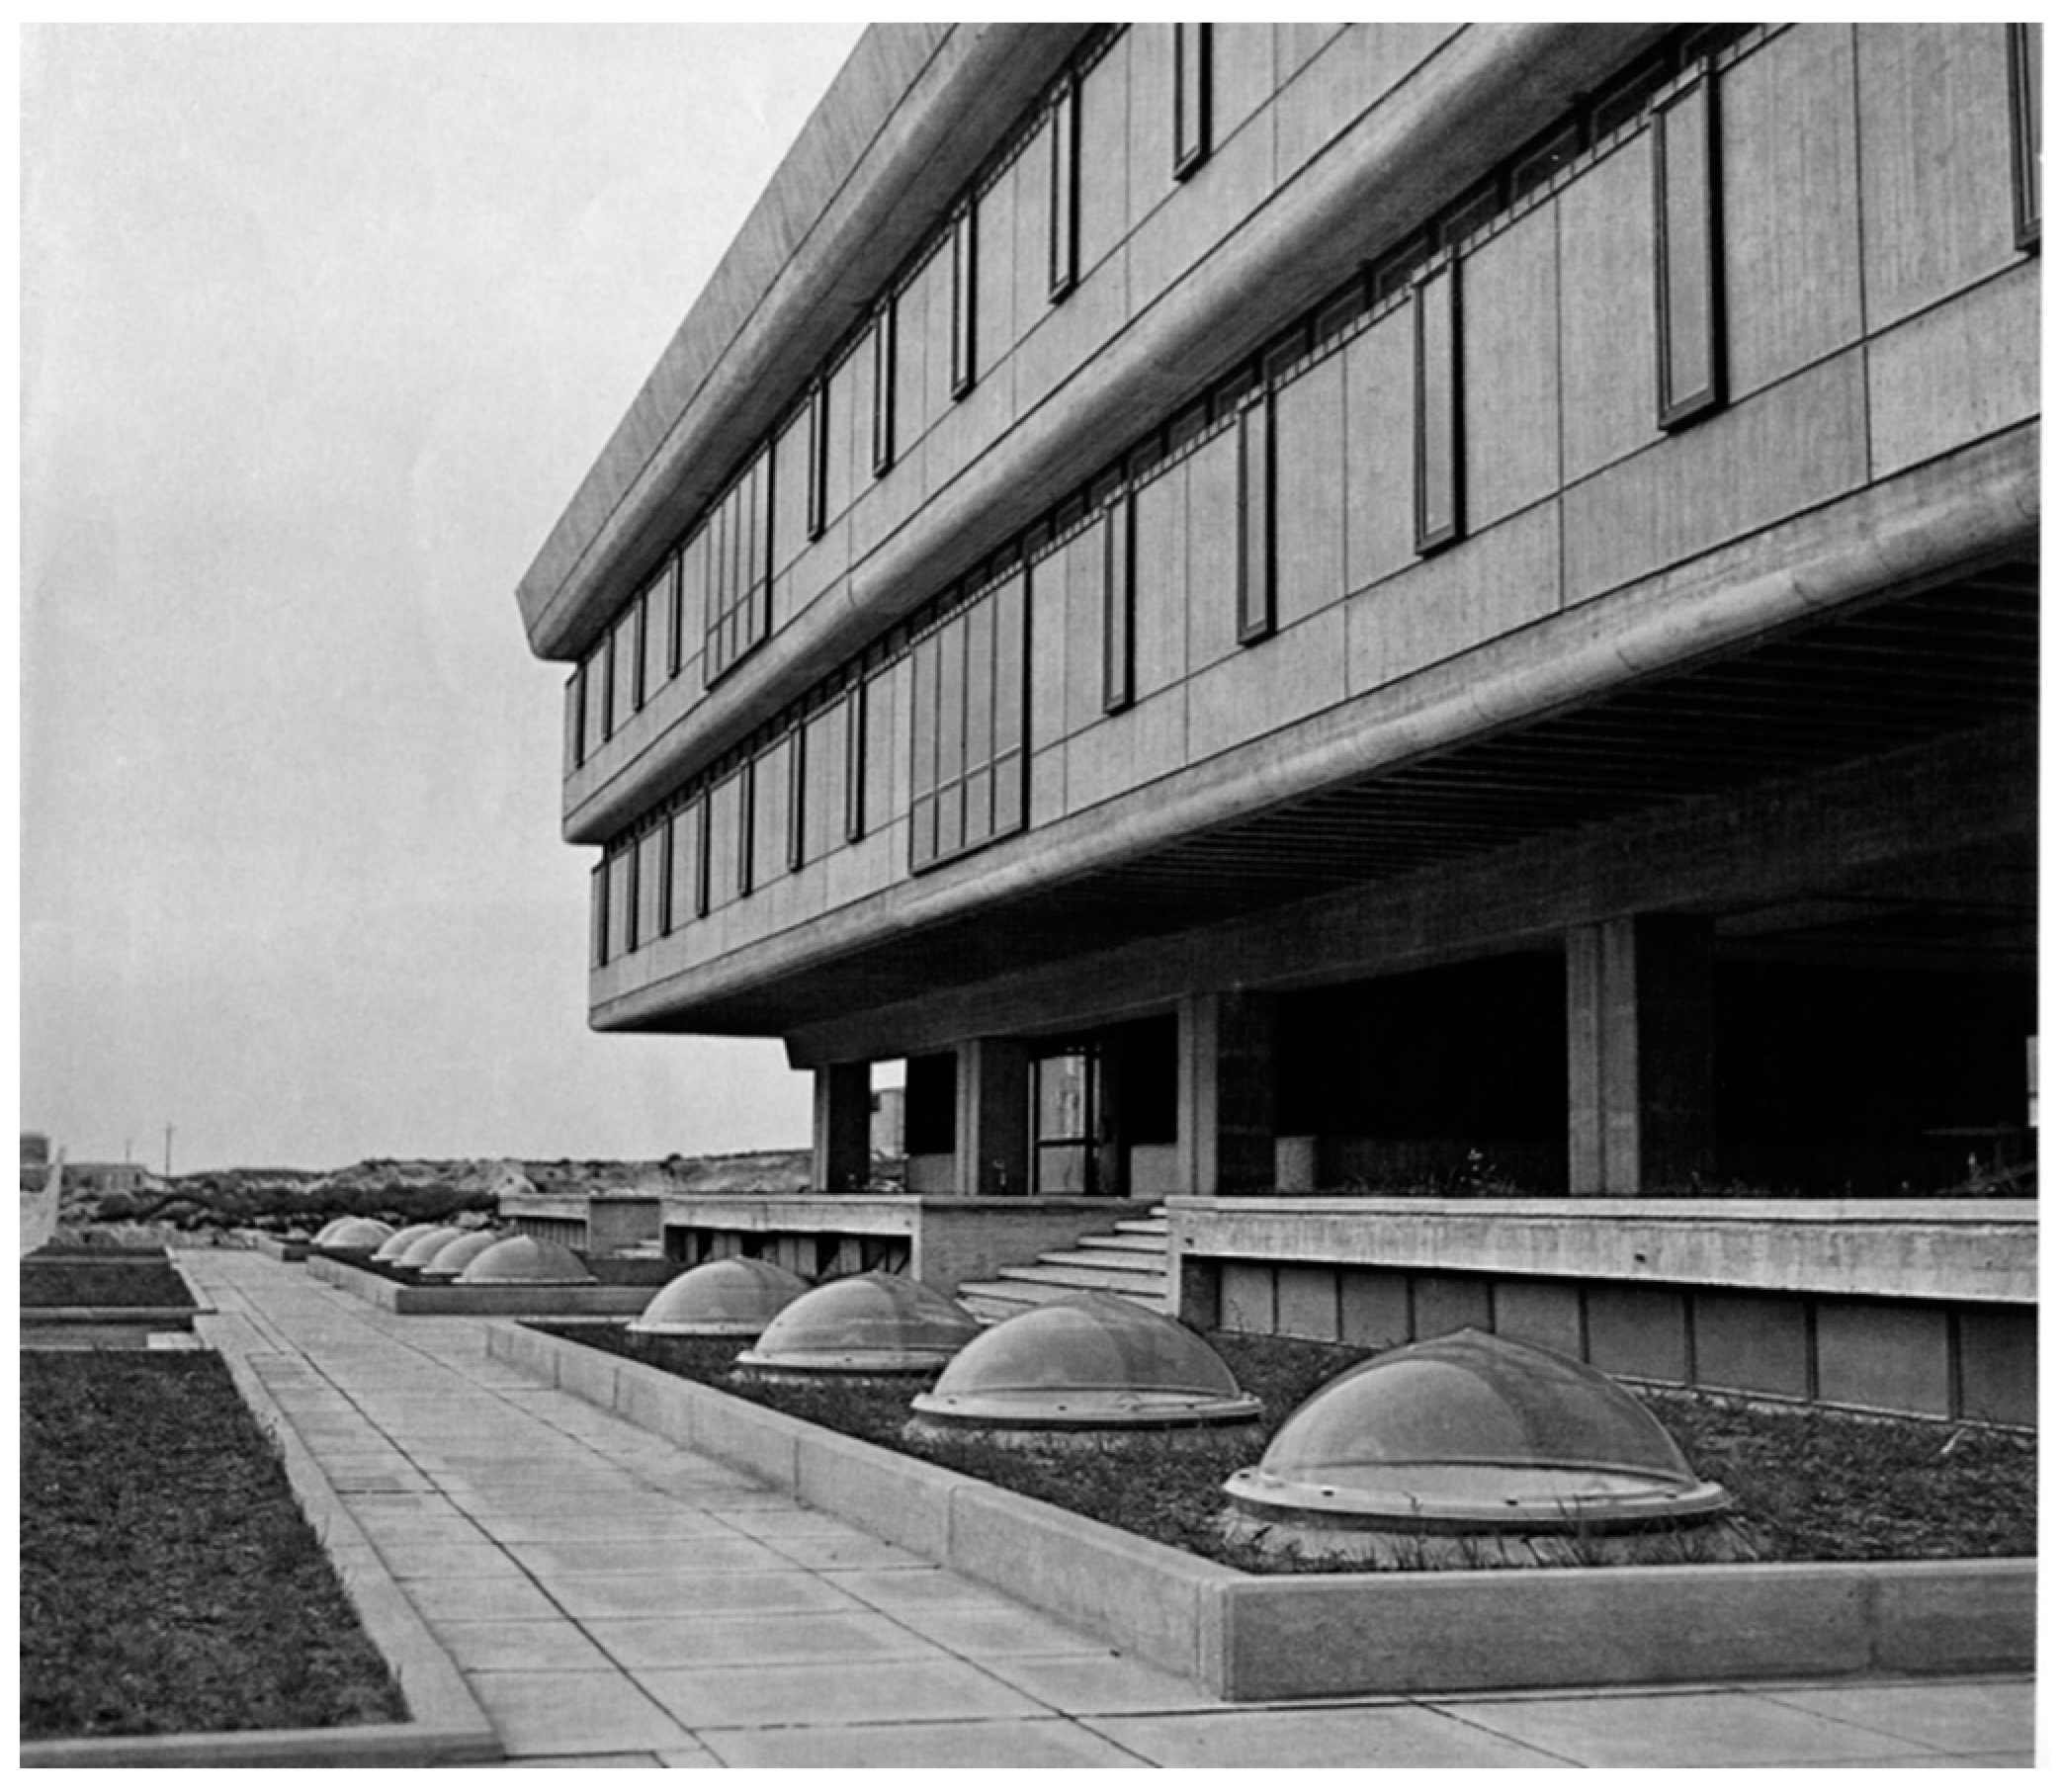
Between the 1960s and 1970s, industrialized building systems in Italy had a concrete application. The innovative Pavilion V of the Faculty of Engineering and Architecture of Cagliari, designed by Enrico Mandolesi, belongs to this scenario (
Figure 1). As in much of Mandolesi’s work, including this building, it is possible to notice a continuous experimentation in the field of building industrialization: from research in the field of prefabrication, to studies on the evolution of production and construction systems and their relationship with the architectural language. From this point of view, the Pavilion is based on the principles of Brutalism, with the unconditional use of exposed concrete, and of the movement of Kenzo Tange’s Megastructuralism, whose cardinal principle involves the construction of complexes that are not so extensive, but are on a fixed load-bearing structure and smaller removable units. Pavilion V was designed in 1962 and inaugurated in 1970, and occupies the fifth and sixth lots of the university complex of the Faculty of Engineering and Architecture of Cagliari, the latter designed in 1944 by Salvatore Rattu.
The building is divided into four floors: one underground, one pilotis and two in elevation. The pilotis floor is one of the clearest references to the Unitè d’Habitation, where the large concrete pillars allow the structure to be raised above the street level, thus ensuring an open space. In the pilotis floor, there are some classrooms characterized by large windows with a brise-soleil shading system, which act as a filter between the service blocks to access the upper floors and the outdoor area. The planimetric distribution of the two upper floors is characterized by three functional bands: a perimeter band, which contains a series of rooms for study and research; a central with five laboratories/classrooms, alternating with six cloisters for their lighting and service blocks; and an intermediate band that acts as a connective space. The internal distribution asset of the building space is based on the realization of a strong integration between the areas for research and teaching. The wide corridors and the glazed doors of study and teaching spaces ensure smooth relationships and constant visual contact with experimental laboratories that are located in the core.
The terrace and the pilotis floor are reserved for common space, for socialization and relaxation. The basement floor has a distribution disconnected from the compositional rules of the facade. It only responds to the requirements imposed by the use of machinery. The plans of the building do not have the same projection on the ground, but the building expands as the height increases, with overhangs that strongly characterize all sides. The windows can be divided into four categories: a ribbon window that runs along all sides below the overhangs of the second floor and the roof; a series of vertically cut windows that illuminate the perimeter studies on the longer sides; large windows along the main heads and the classrooms facing the internal cloisters; and a window system similar to the latter, but with brise soleil, which delimits the classrooms of the pilotis floor. The load-bearing structure is made up of eighteen reinforced concrete pillars divided into two rows that support longitudinal beams each 90 m long, with a “T” section. After 50 years from its construction, the building has serious shortcomings in terms of energy performance and indoor comfort, intrinsically due to the technological choices, but also to inefficient maintenance processes, which have strongly accentuated the degradation of some components, such as windows.
2.2. Data Monitoring System
2.2.1. IoT Sensors
The solution proposed for the real-time measurement and monitoring of environmental parameters and energy consumption inside the building (Mandolesi case study) is one innovative part of this paper, in particular for existing buildings with important architectural constraints. In these cases, it is essential that the monitoring systems are easily integrable into the building, from the installation/architectural point of view, low-cost, easy to find on the market and easily manageable even by a nonexpert user. Among the different available technologies, the choice is directed towards wireless products, which make it possible to avoid the costly system modifications imposed by wired solutions, and in particular those that use the “Z-Wave” radio standard, which are widespread internationally [
27]. The “Z-Wave” standard allows for easily setting up a wireless sensor network, which can be reconfigured and expanded, characterized by reduced electricity consumption, and can also be powered by common batteries. In general, the possible solutions adopted for the power supply of the sensors are of two types:
The first solution allows for taking advantage of existing “socket points” for powering the devices, with no modification of the electrical system required. Even if this solution involves simple implementation, it binds/restricts the sensor to specific points. The second solution allows the sensors to be installed anywhere, provided that the radio signal is strong enough to reach the device. In carrying out the project activities, it was decided to employ a technology that uses a mixed power supply system (wired and wireless) and allows the control of all the sensors installed inside the building and at the same time, guaranteeing optimal consumption management of battery-powered devices. As far as the protocol is concerned, it should be emphasized that the Z-Wave is a wireless communication protocol through which it is possible to generate a so-called “mesh network”, which is a network made up of all mutually communicating devices, and it uses low energy for the exchange of information between all the devices of the network [
28]. Each sensor device communicates with a central device, called a controller/gateway (HUB), either directly or through another node on the same network. The controller/gateway, the real heart of the sensor network, is a radio device that manages the configuration of the network and the transmission of the detected data (environmental, energy or other measurements) to the outside world. The data collected is then made available on cloud platforms and remotely accessible through smartphones, tablets and computers.
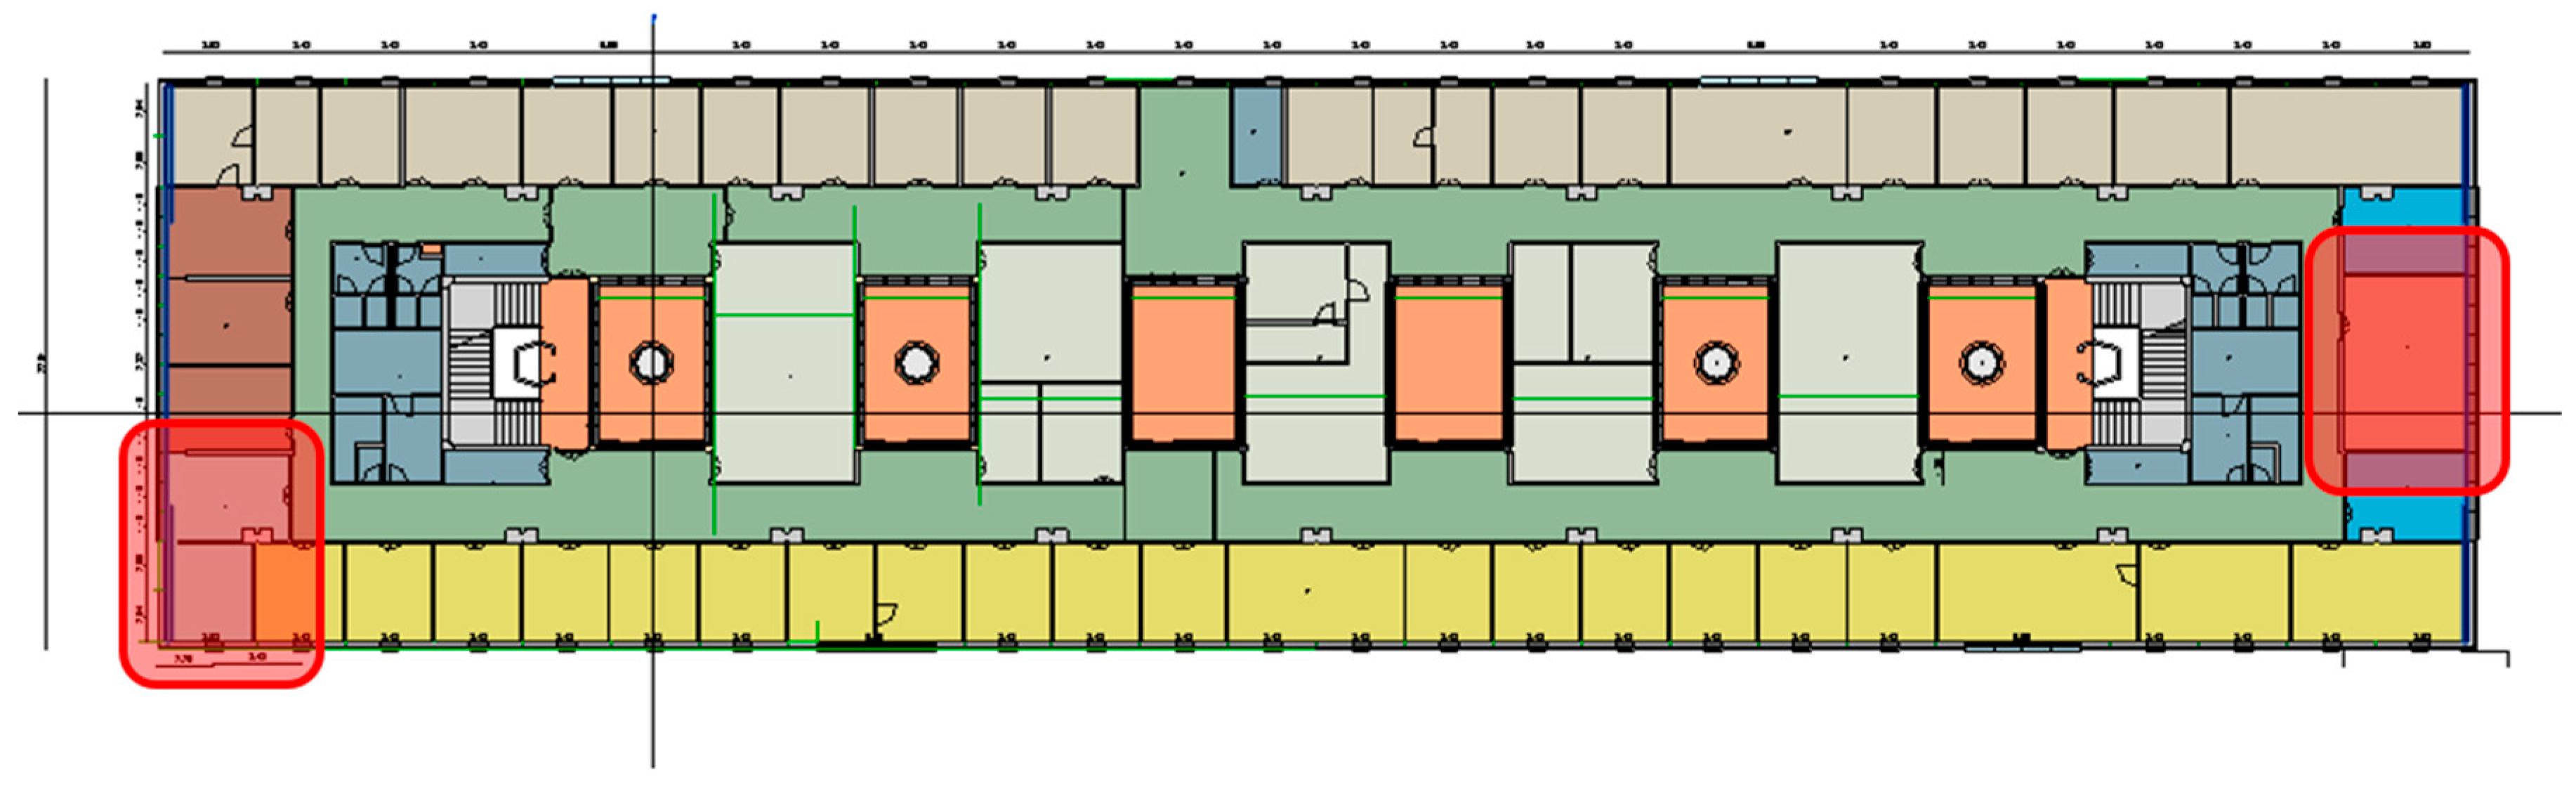
The simplicity of the system configuration, its coverage range (about 100 m), the possibility of expansion (modularity) and the low cost of the devices have made the use of this technology extremely interesting and it is constantly expanding. In carrying out the project activities, some Z-Wave devices from different manufacturers were selected in order to compare from an economic point of view. At the end of this phase, WiDom products that are manufactured by a Sardinian company specialized in products and solutions for home automation were chosen. The WiDom sensor selected is a Z-Plus certified device that integrates a brightness, humidity, temperature and noise level sensor in the same box. In addition, the Energy Driven Switch Z-Wave sensor was also installed, which is a device that can be used both as an intelligent switch (Relay Switch) with integrated power meter, and as an Energy Meter at the input of the electrical system or on a portion of the latter. In this case, we also opted for the WiDom sensor that reveals, when compared to the others analyzed, an interesting feature in terms of size. In fact, its small dimension allows an easy “integration setting” of the sensor, even in particular environments such as historic buildings with particular architectural constraints. The sensor measures the effective value of the voltage and current, the value of the power and energy and the power factor. In the building chosen as the case study, two rooms were identified within which a data network was created. Inside the premises, the sensors described above were installed. These sensors are associated with the HUBs (concentrators/gateways), which have the function of collecting data from the sensors present in each room and channeling them to an IoT platform for real-time recording of data from Z-Wave devices (controller/gateways and sensors). The monitored rooms are located on the first floor and positioned inside the building, as indicated in
Figure 2. Each room houses inside sensors that record, since March 2018, the values of electricity consumption every five minutes (both with reference to the heat pump and to the lighting), the temperature, relative humidity, illuminance and noise values.
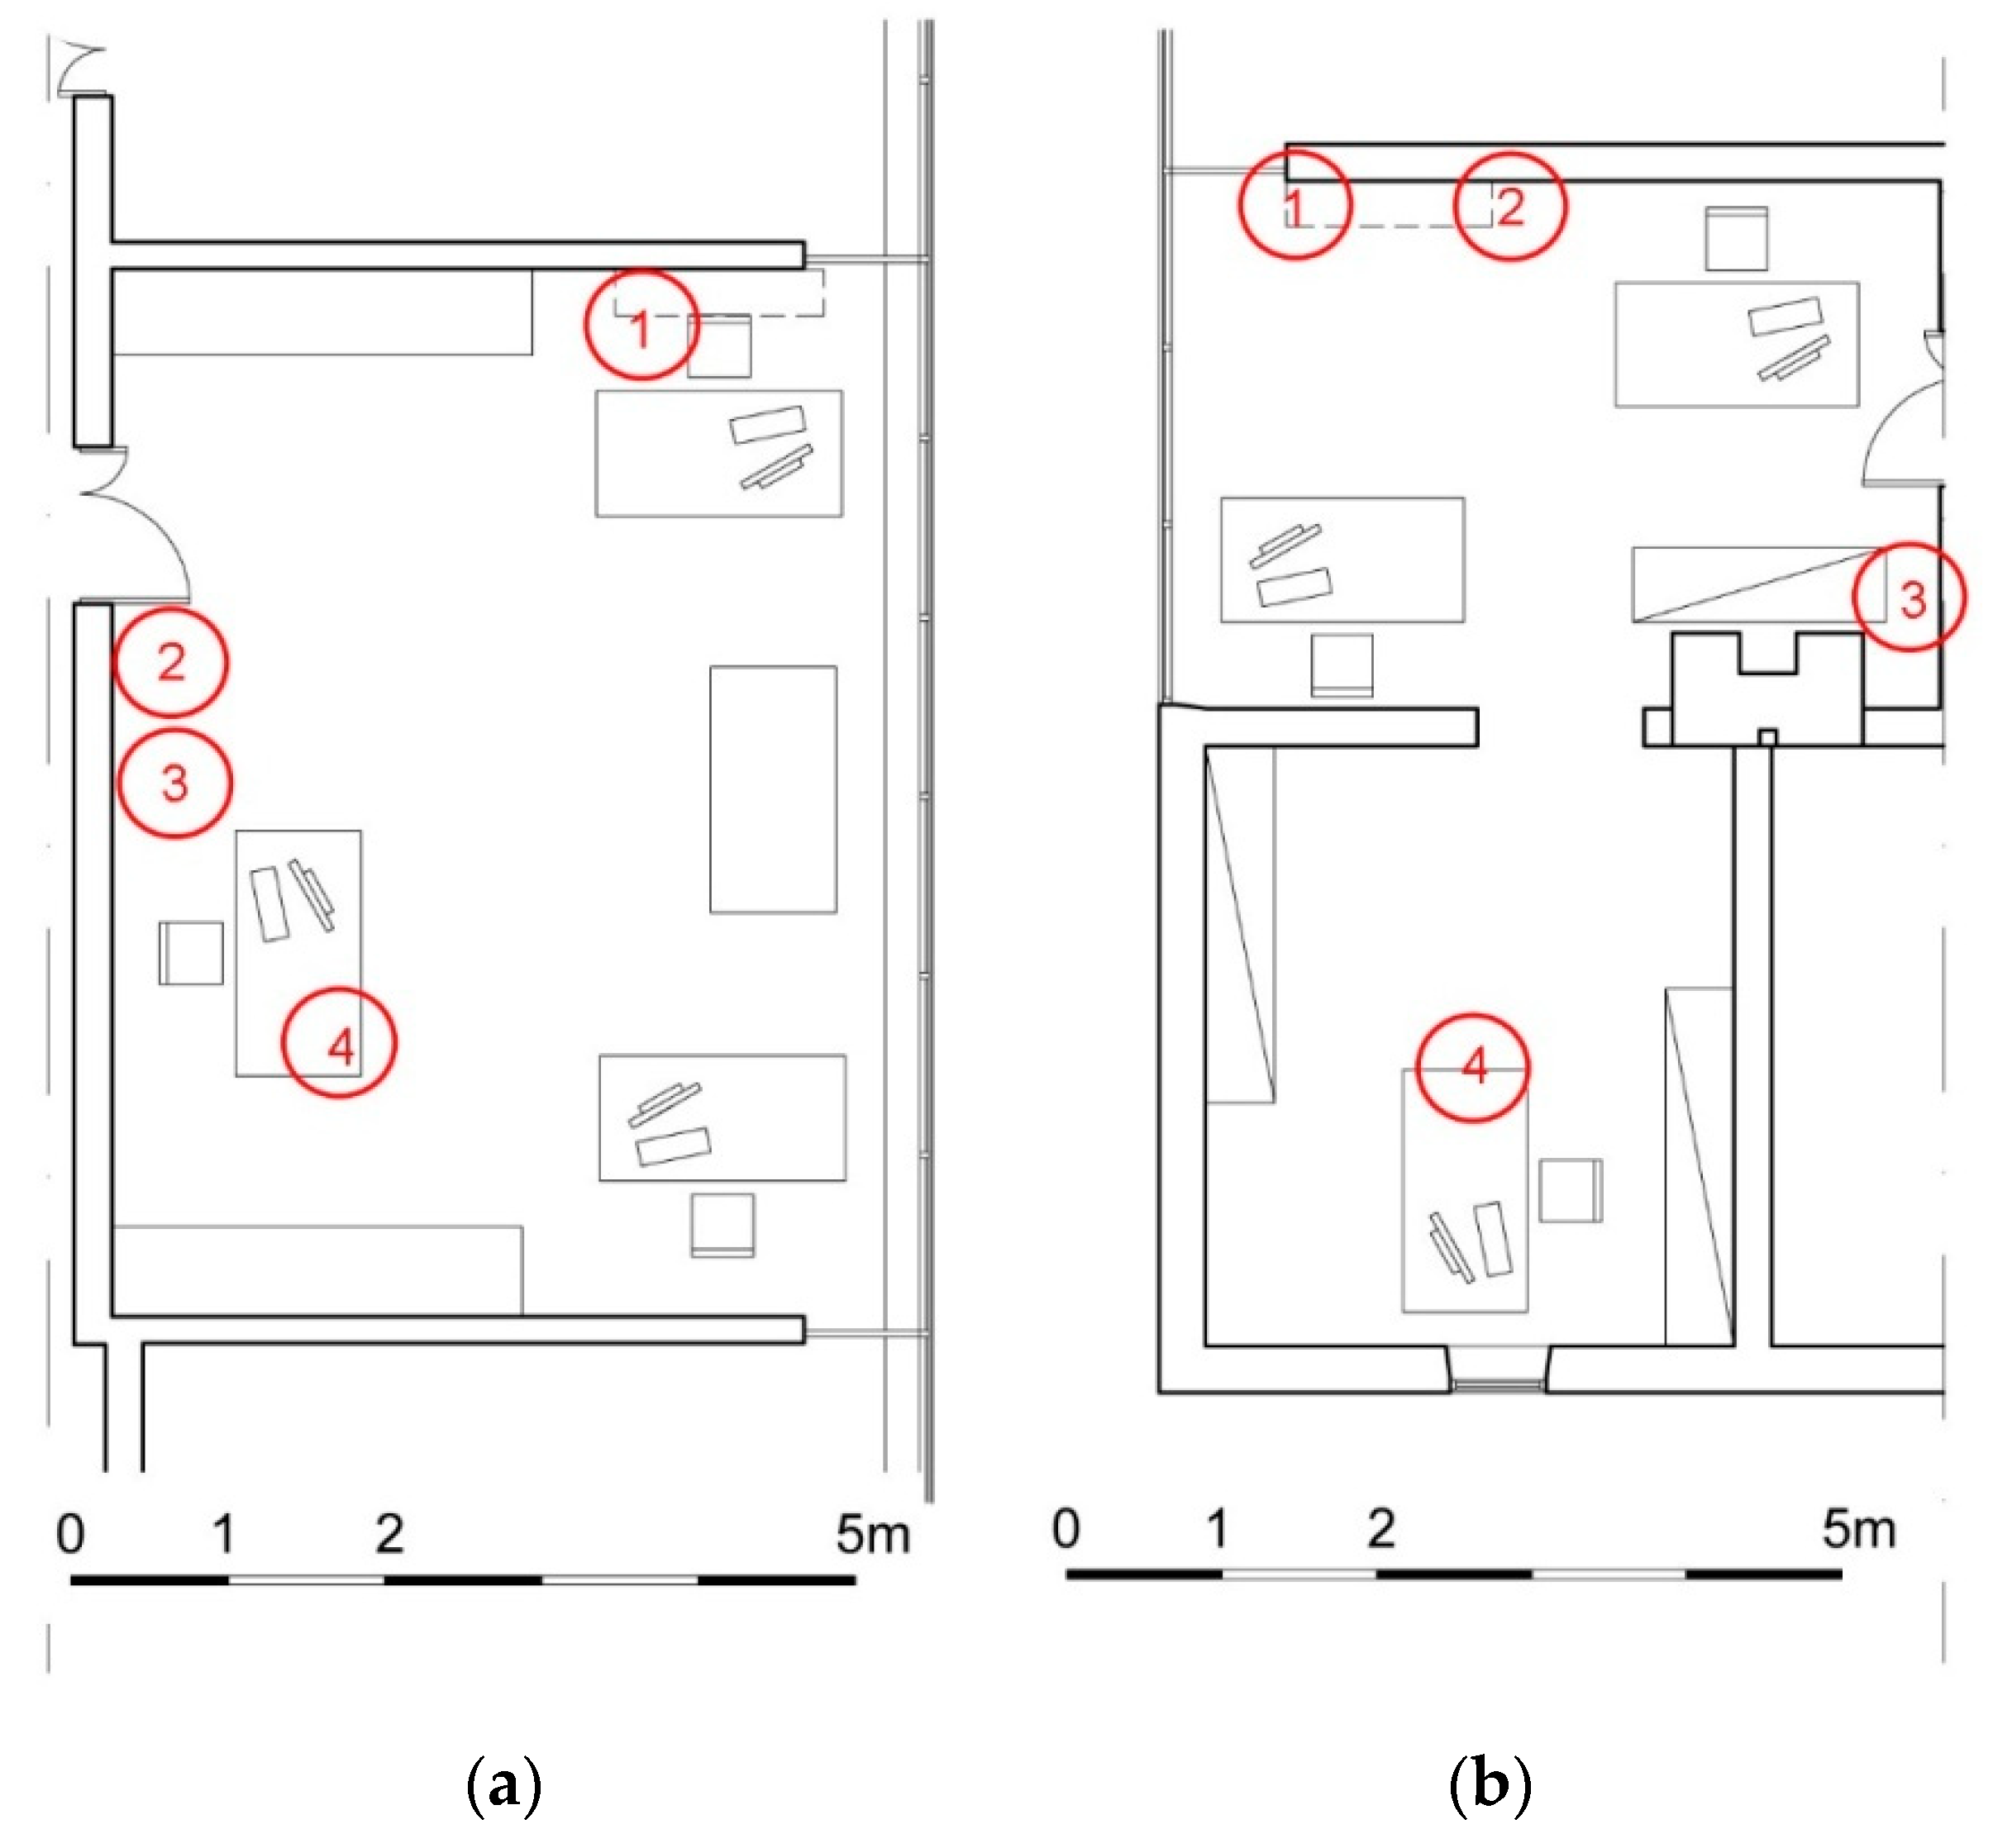
The position of the actual and future sensors, inside of the two rooms, is shown in
Figure 3. In particular, the actual sensors are (1) heat pump, (2) and (3) electrical energy meters and (4) luminance sensor. The sensors to be installed in the future are the (5) window sensor, (6) presence sensor and (7) Volatile Organic Compound (VOC) and CO
2 sensors.
2.2.2. IoT Platform
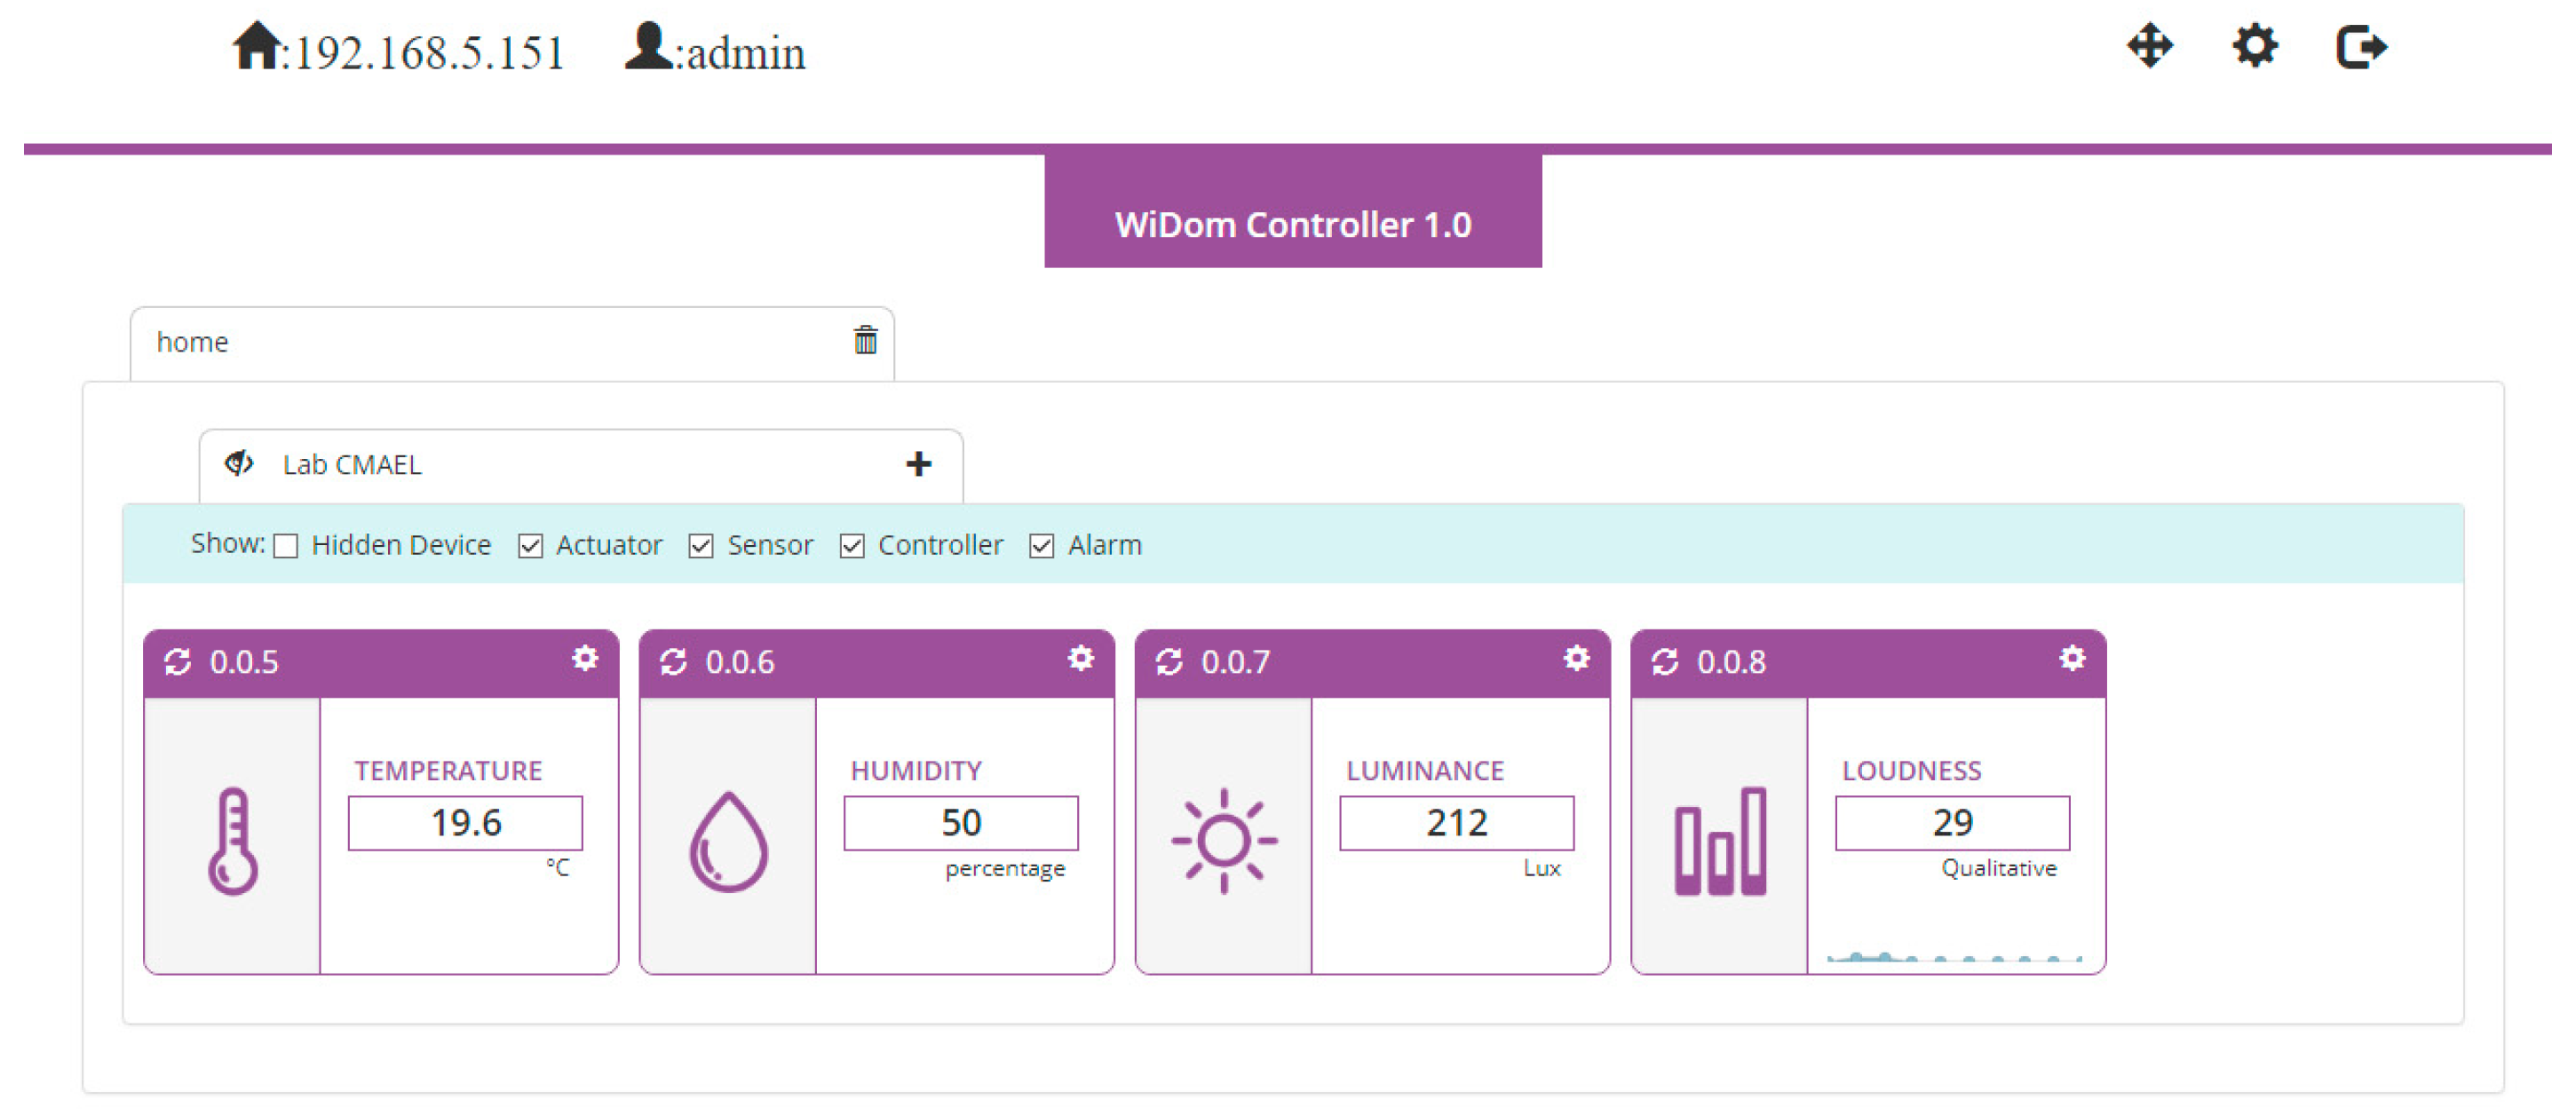
This article also reports the results of the experimentation activities conducted on the Cloud portal, made available by the manufacturer of the WiDom sensors (
Figure 4). Through a simple configuration of the controller/gateway, it provides both monitoring of the associated devices and their management.
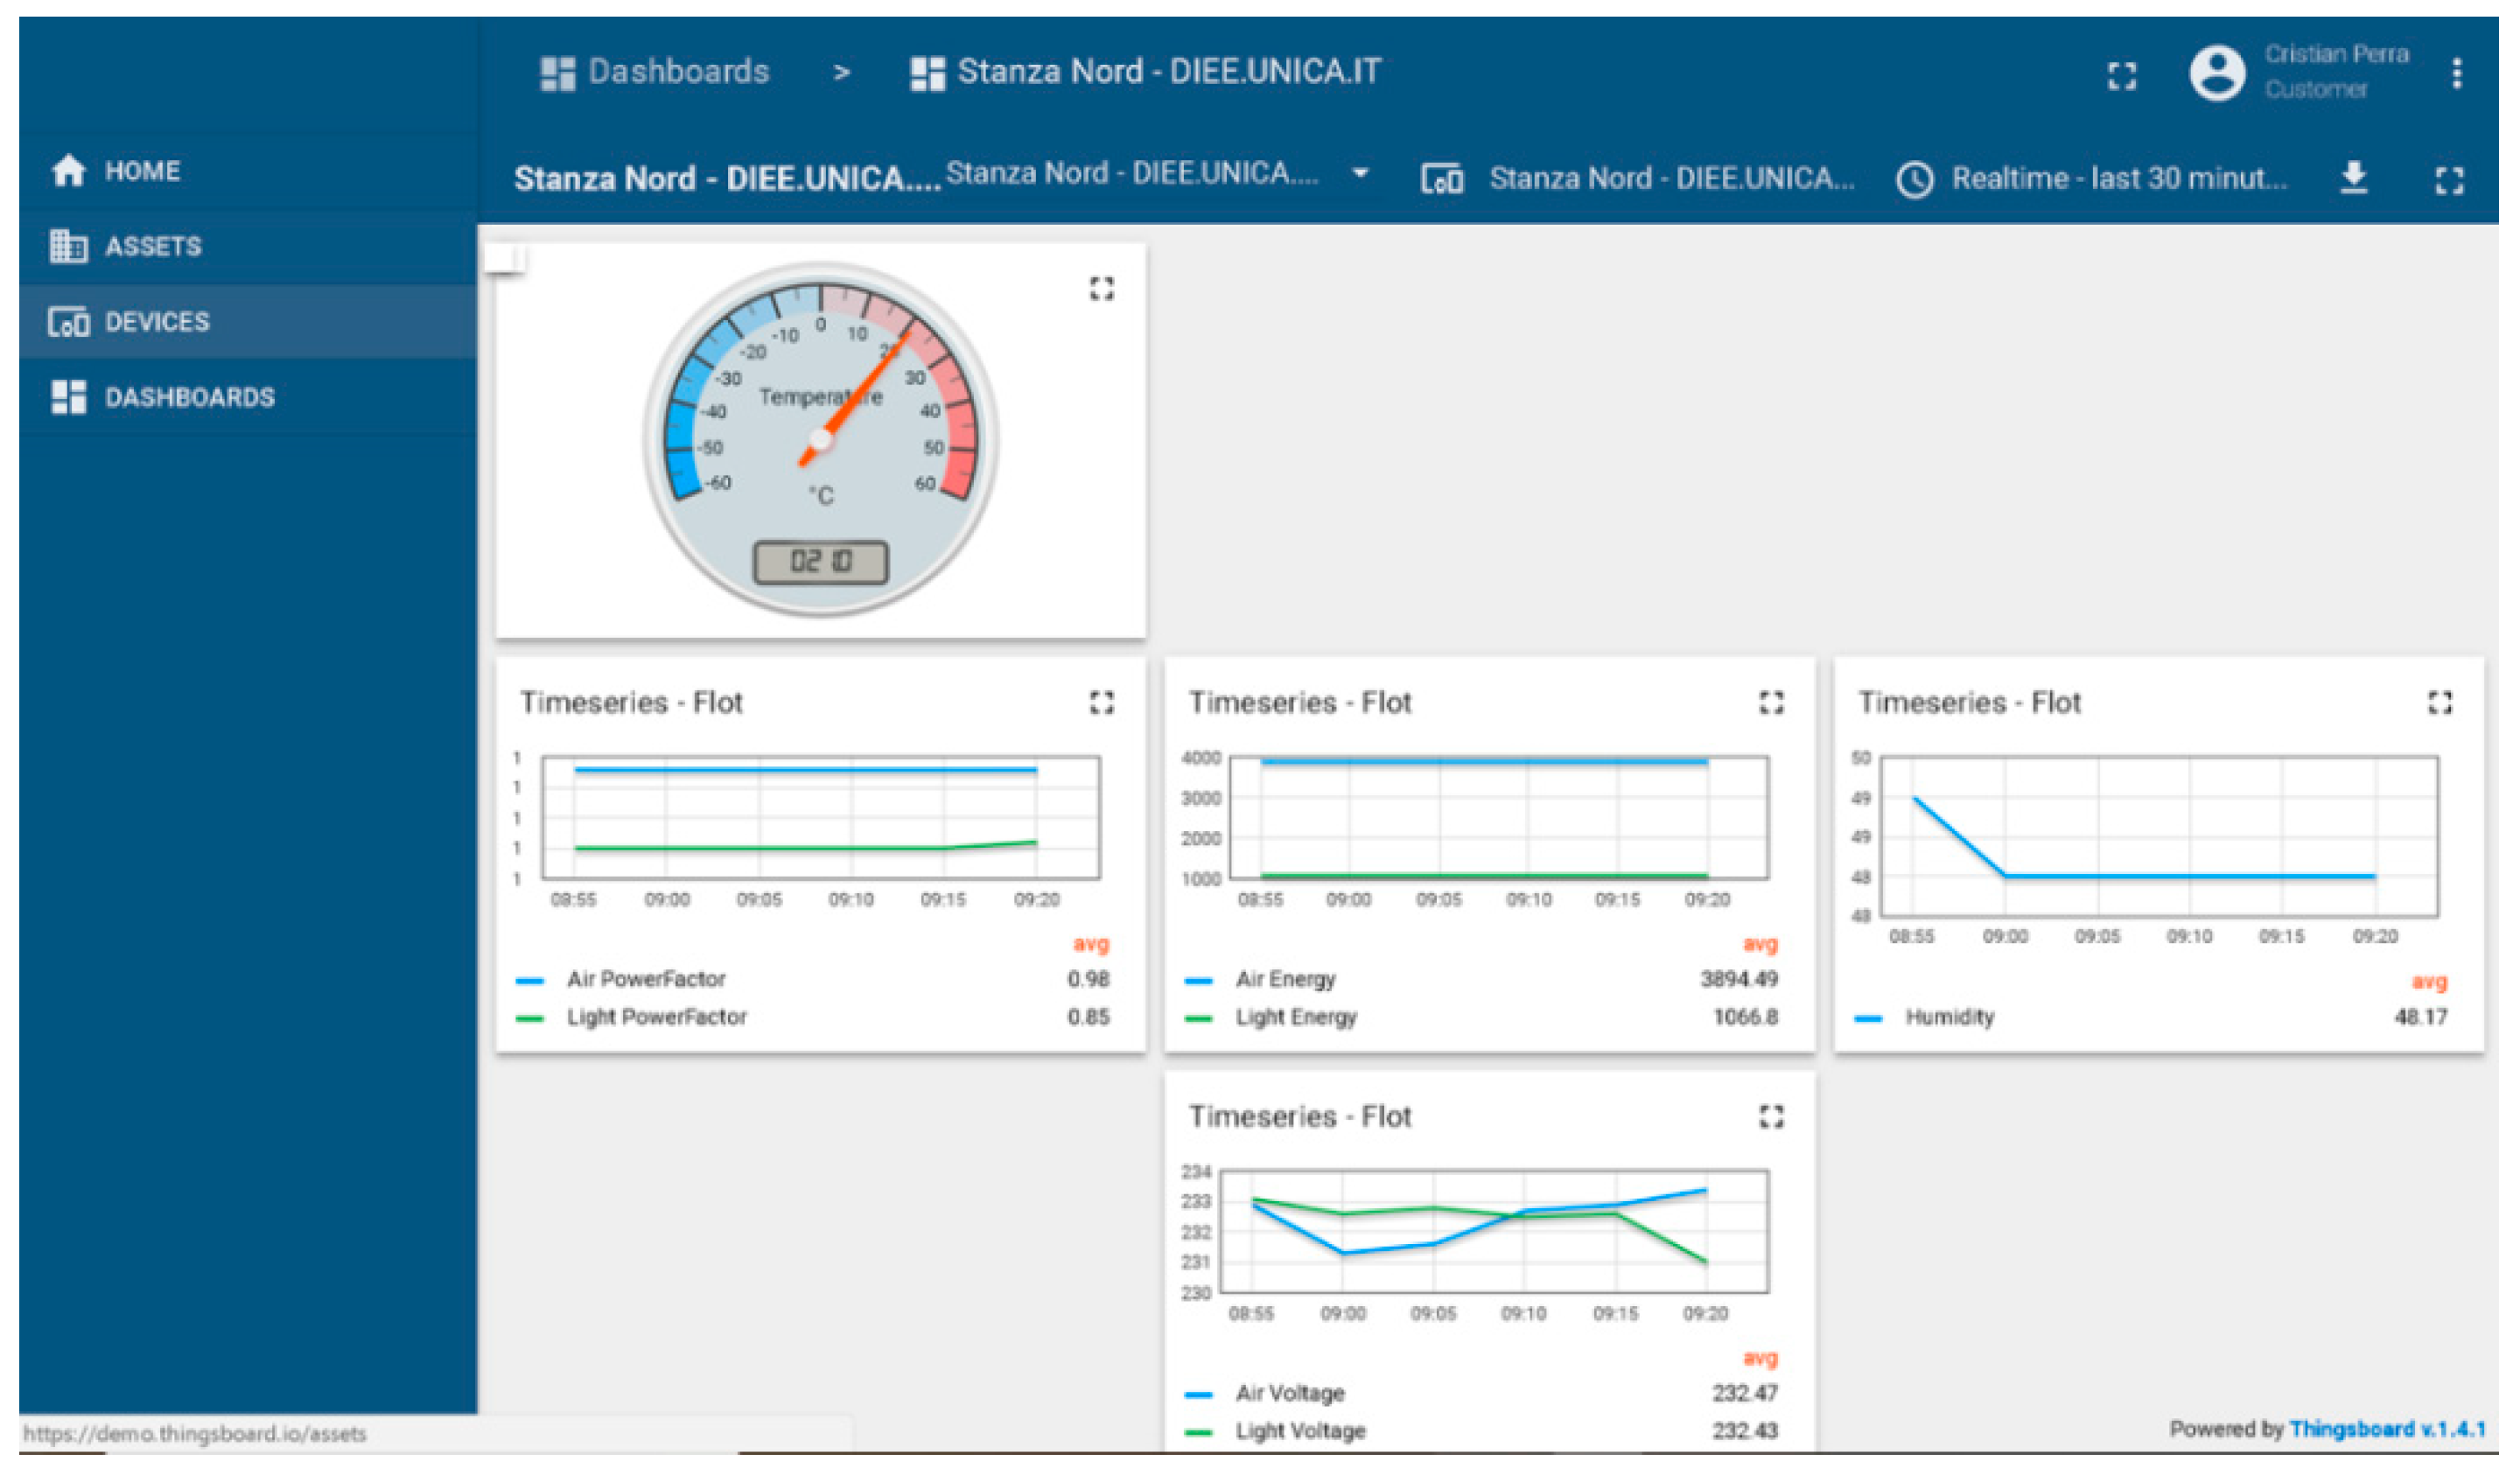
The platform selected is “ThingsBoard”, one of the main open source IoT platforms for the collection, processing, visualization and management of data. It provides device connectivity through industry standard IoT protocols and supports both cloud and local deployments. “ThingsBoard” combines scalability, fault tolerance and performance, so data are seldom lost. It securely provides IoT entity provisioning, monitoring and control using advanced server-side APIs. This platform permits data monitoring through built-in or custom widgets and flexible dashboards. Furthermore, it is possible to view the history of the acquired data also through practical graphs, as shown in
Figure 5. The IoT platform was installed and configured on a server at the University of Cagliari.
2.3. Building Information Model
In the PRELuDE
3 project [
8], the research goal is to make the energy audit procedures on the existing building stock more efficient, capitalizing the results in an information model. The model allows a faithful representation of the building to plan the most appropriate intervention on a shared basis of knowledge. For this reason, the first steps of the research project focused on the building’s recognitive analysis to achieve a deep knowledge of it [
29]. Then, the selection of the information to be capitalized was carried out and the development of the informative model started (the tool used was Revit Autodesk). Each virtual element (families) that represents the real component of the building was defined in terms of shape, dimension and thickness. In this stage of the modeling activity, the strategy followed was to respect the irregularity of the components of the building for the faithful representation of the geometric peculiarity. Avoiding excessive simplifications made it possible to preserve important details for the planning of restoration and refunctionalization work. Then, each virtual element was integrated by information and data that referred to function, material features, techniques and constructive technologies used, level and type of degrade, residual performances and indications for maintenance interventions [
30,
31]. The choice of the most suitable code of each virtual object represented another important step of the work. The quality of communication and interoperability among all the subjects of the building process depends on this choice. In this case, the code system was created, beginning from the UNI 8290 standard, which was increased to select for each instance object the exact position within the digital twin of the building. Finally, the modeled and “informed” digital objects were inserted into the specific template to create the digital twin of the building.
To further explain the definition method for each virtual component of the information model, we can refer to the concepts of LOD (level of graphic detail) and LOI (level of information detail). Although the ISO 19,650 standard (2018) replaced these concepts with the new one of LoIN (level of information required) without any predetermined scale, here the use of LOD and LOI concepts can be very supportive. The BIM model developed for the management and maintenance phase of the building is characterized by different levels of graphic detail (LOD) and information (LOI). Referring to the British school, the level of graphic detail corresponds to a LOD 3, while the level of information detail corresponds to a LOI 6. For the management and maintenance of the building, it was considered sufficient and much more sustainable to use an intermediate graphic detail level (LOD 3), to which eventually associate nodes and 2D views that better specify the object. Instead, it was considered necessary to go further into the information detail that clearly specifies both the residual performance of the component and the indications for any maintenance interventions.
Thus, the first phase of PRELuDE3 project provides an informative model that allows us to record and manage the information relating to the architectural and historical features of the building, its current status, materials, techniques and constructive technologies used, the results of diagnostic surveys, the conditions of degradation in terms of type and severity, interventions and treatments performed, restrictions relating to its particular architectural value and degrees of freedom for new interventions. An important feature of the model is that it can be updated and integrated at any time in the life of the building. This aspect solves a further critical issue, namely the difficulty of ensuring the “information requirements” for the management of the building after the completion of the restoration. The model creates the structure, which organizes all the data and information that are produced during any new intervention work and that is functional to the innovative management of the building.
To improve the building audit process, it was considered strategic to develop a monitoring system that continuously measures the indoor parameters and the energy consumption of the building. It is the development of this system and its integration with the BIM model defined for the case study that is the aim of the second phase of the PRELuDE3 project. The creation of an effective control panel that can be updated in real-time on the internal conditions of the building and on consumption data is the goal pursued. To this end, the BIM model of the case study was adapted and integrated. The creation of a virtual model for the sensors located inside the building was not considered necessary. It was considered much faster as well as sustainable to associate the monitoring data to the “local” Revit object. This is a space delimited by the virtual objects of the BIM model, such as walls, floors and ceilings. Within Autodesk Revit Software the “locals” are considered “objects” to which associate various data and information: constraints, dimensions (area, volume and perimeter), number, name, destination etc. To represent the monitoring data within the model, shared parameters were created for the “local” object.
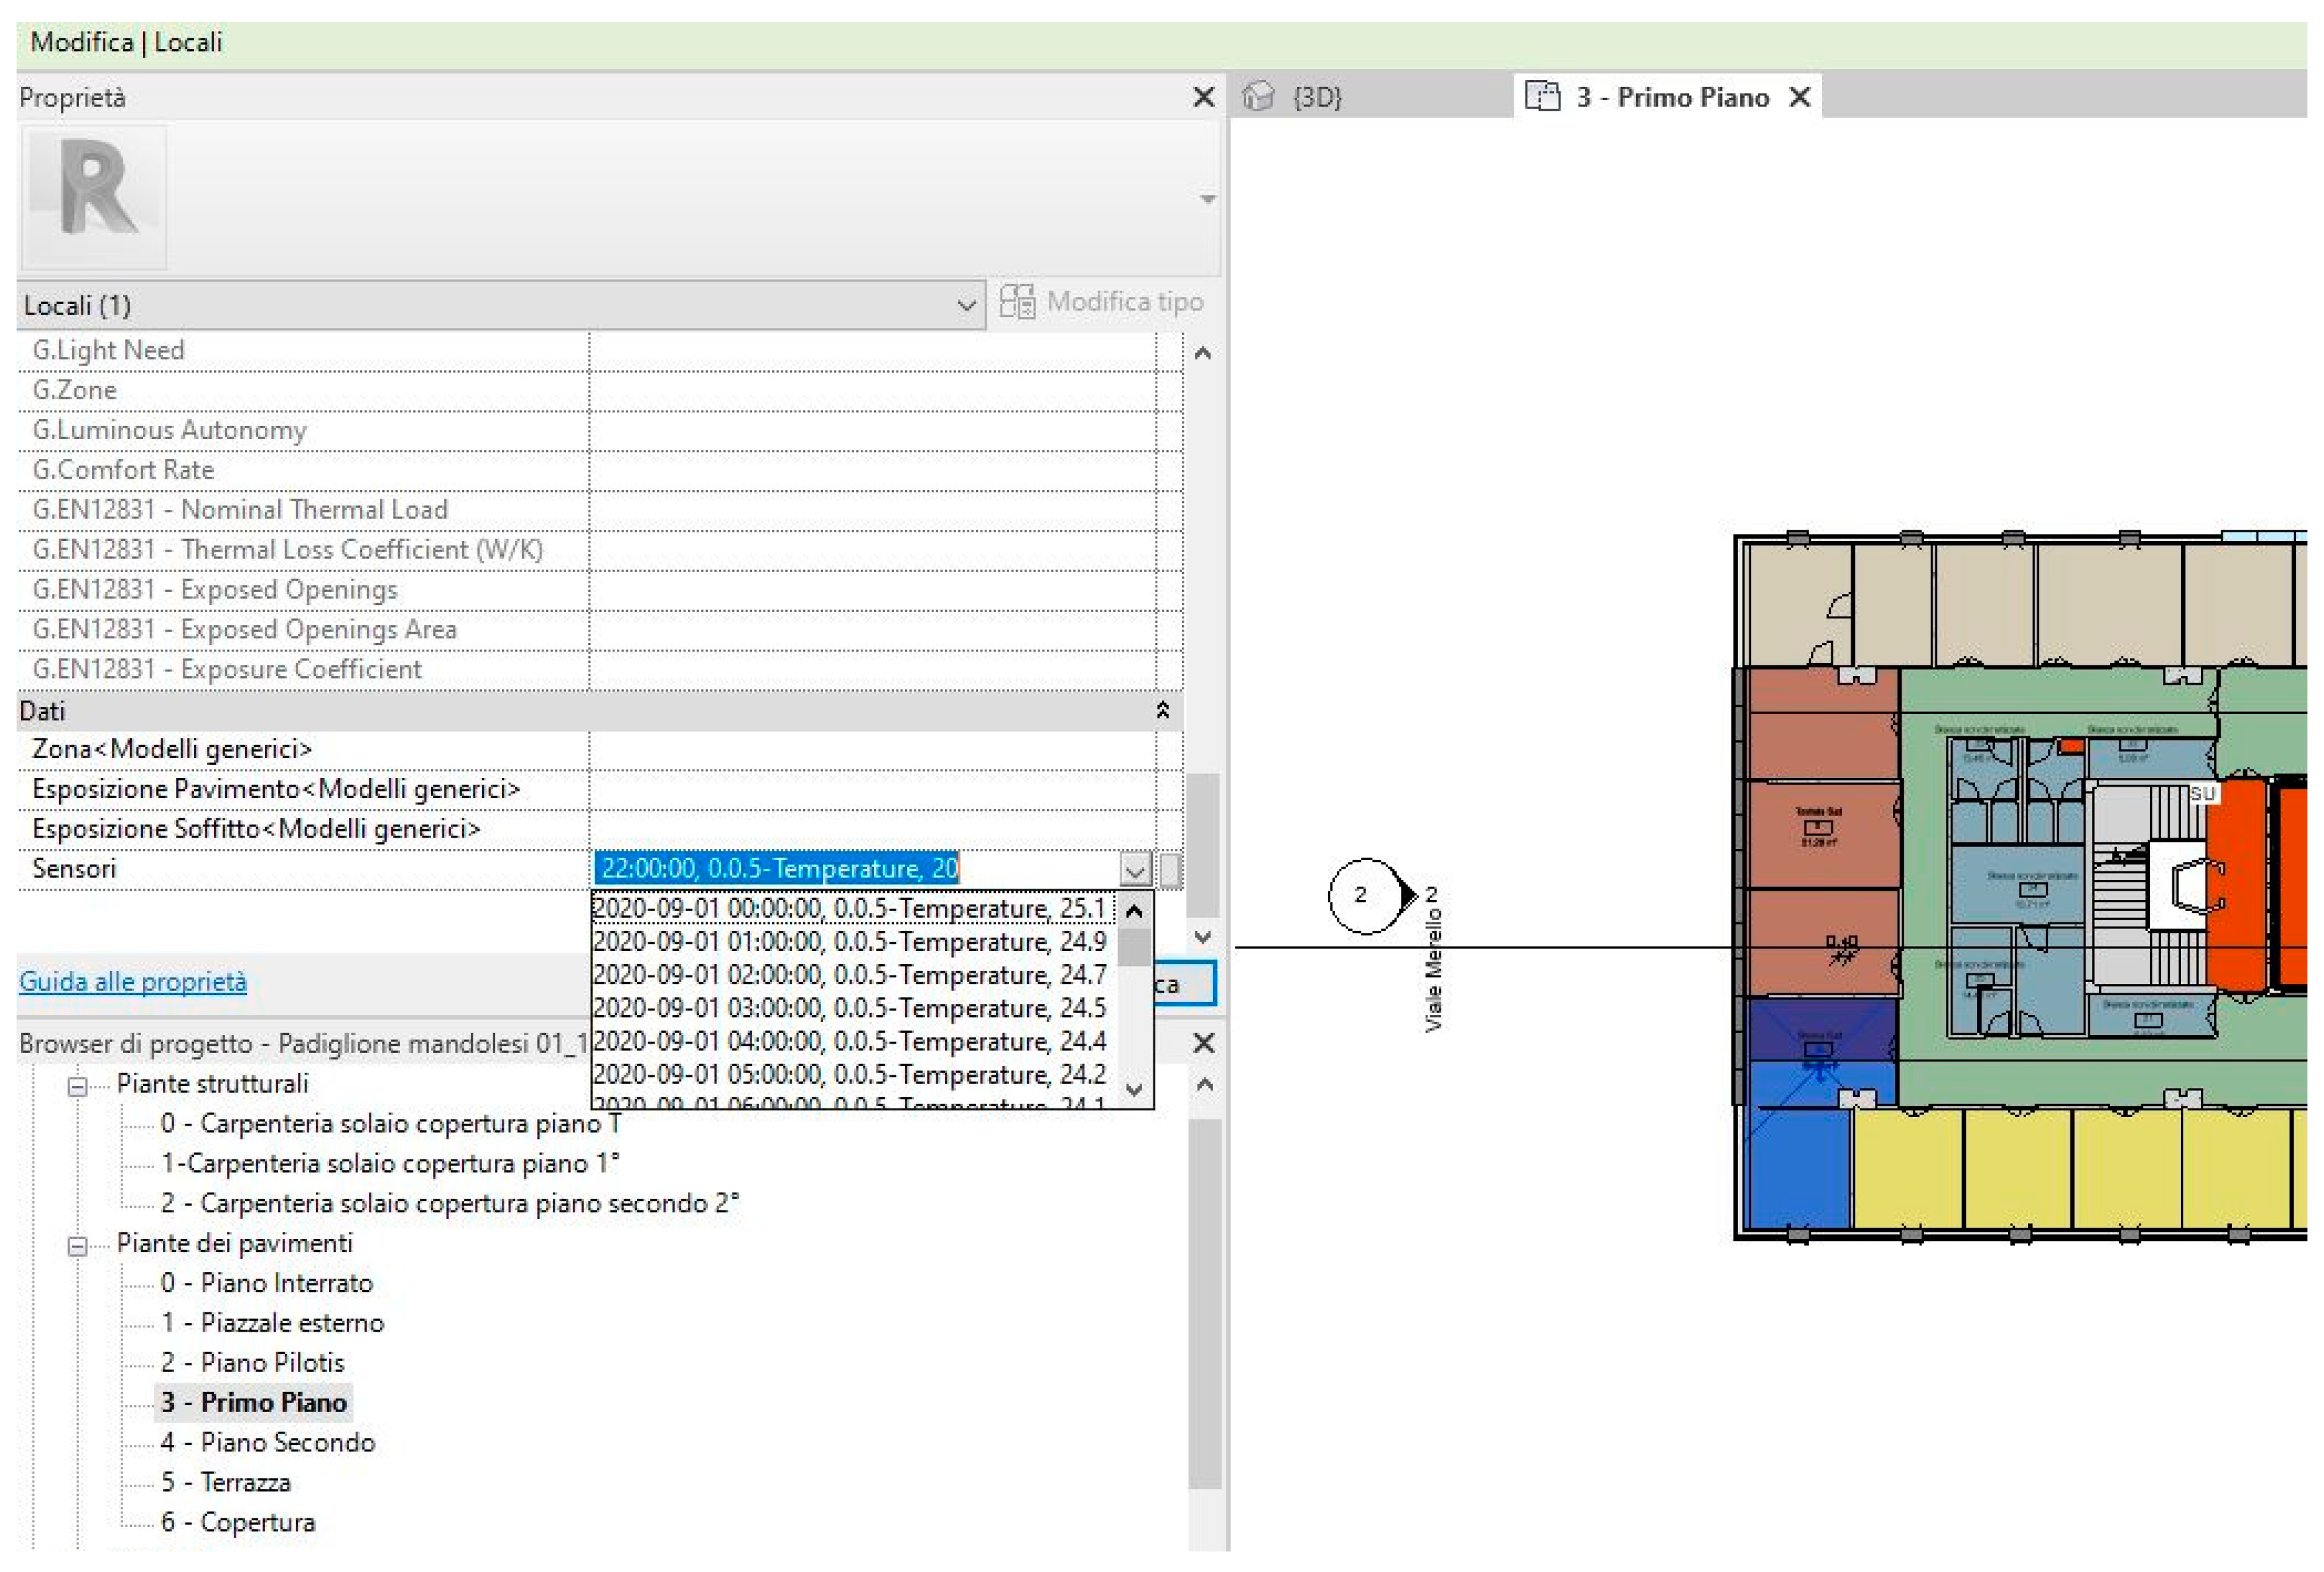
2.4. Revit/Dynamo Integration for Sensors Data Management: The Workflow
To obtain a dynamic and automated exchange of data between sensors and the BIM model, the Revit software was integrated with the Dynamo visual programming platform. Visual programming is an operating mode that does not involve the typing of a code list, but the connection and processing of graphic entities. The visual approach simplifies the development of applications by isolating the complexity of coding to the main users of Revit (architects, designers, engineers, companies etc.). More precisely, nodes are used, connected to each other via inputs and outputs containing pieces of code through which specific tasks are performed.
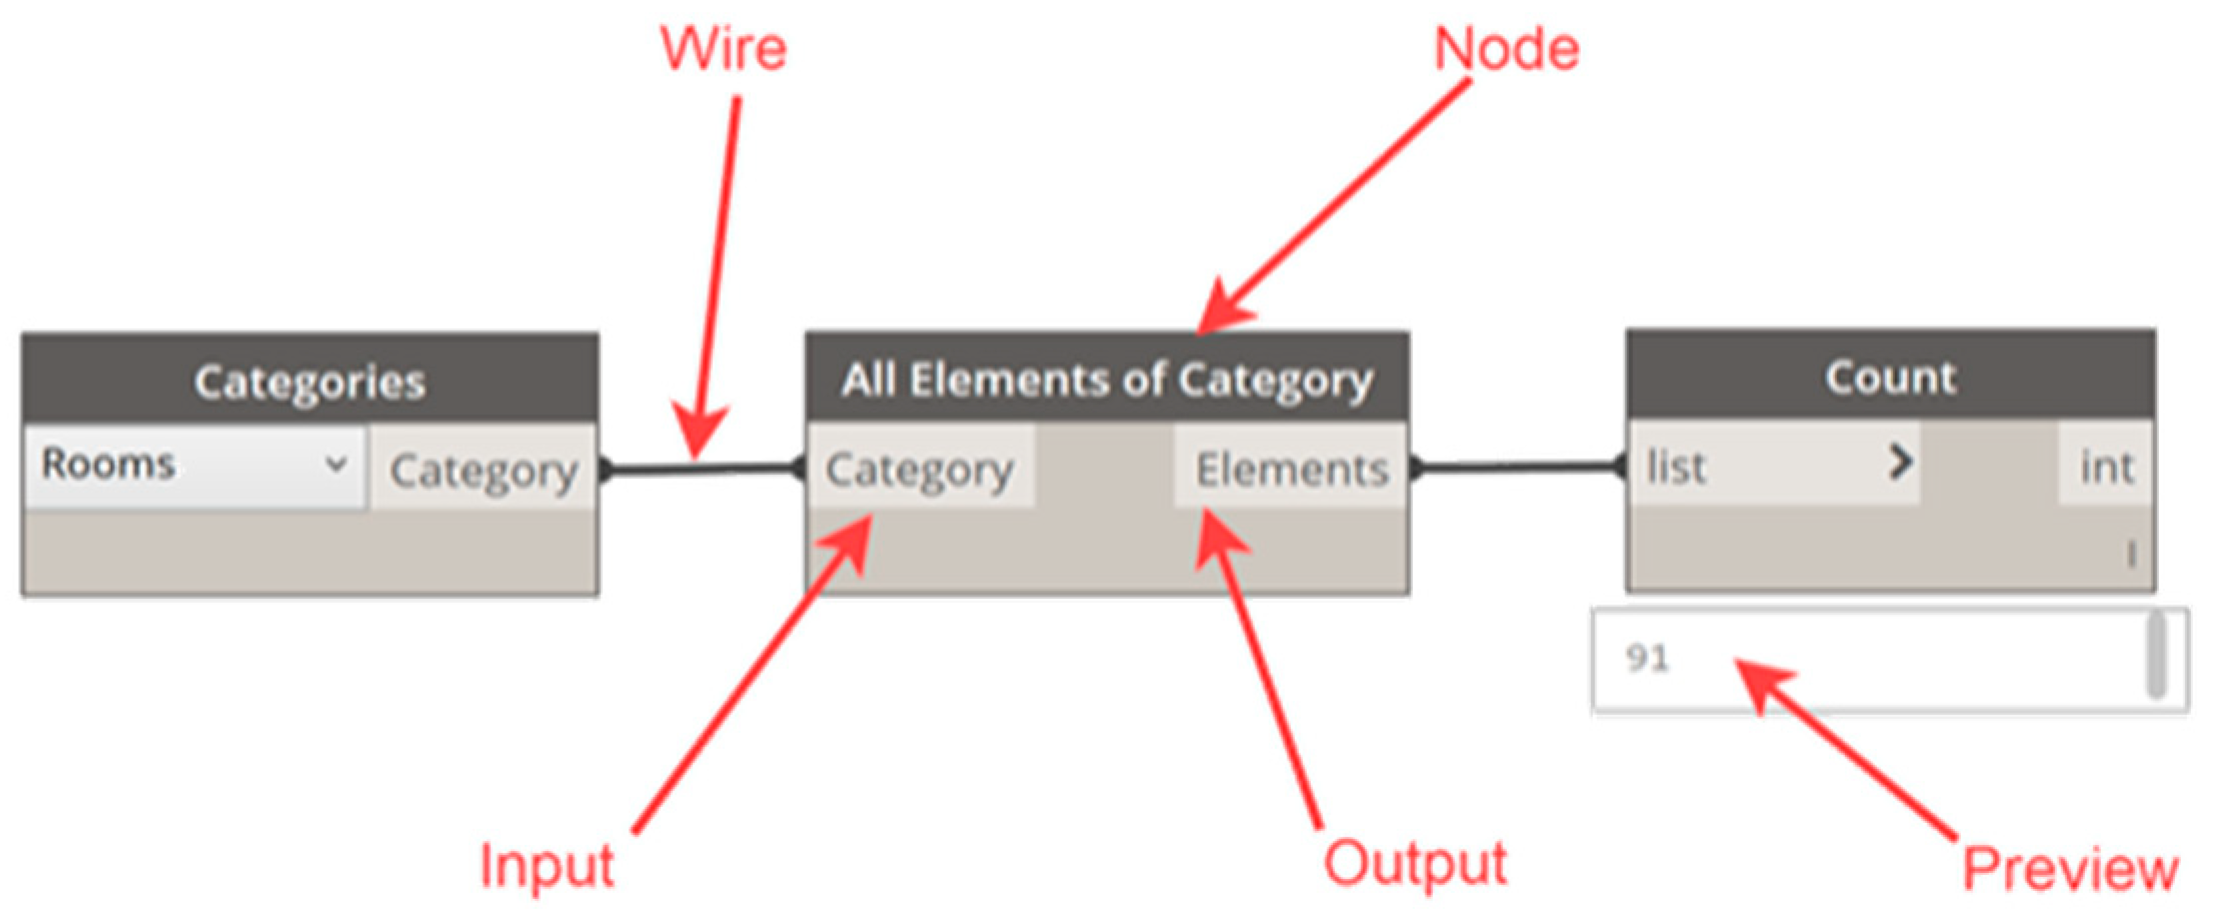
Figure 6 shows an example of nodes and links in visual programming on Dynamo.
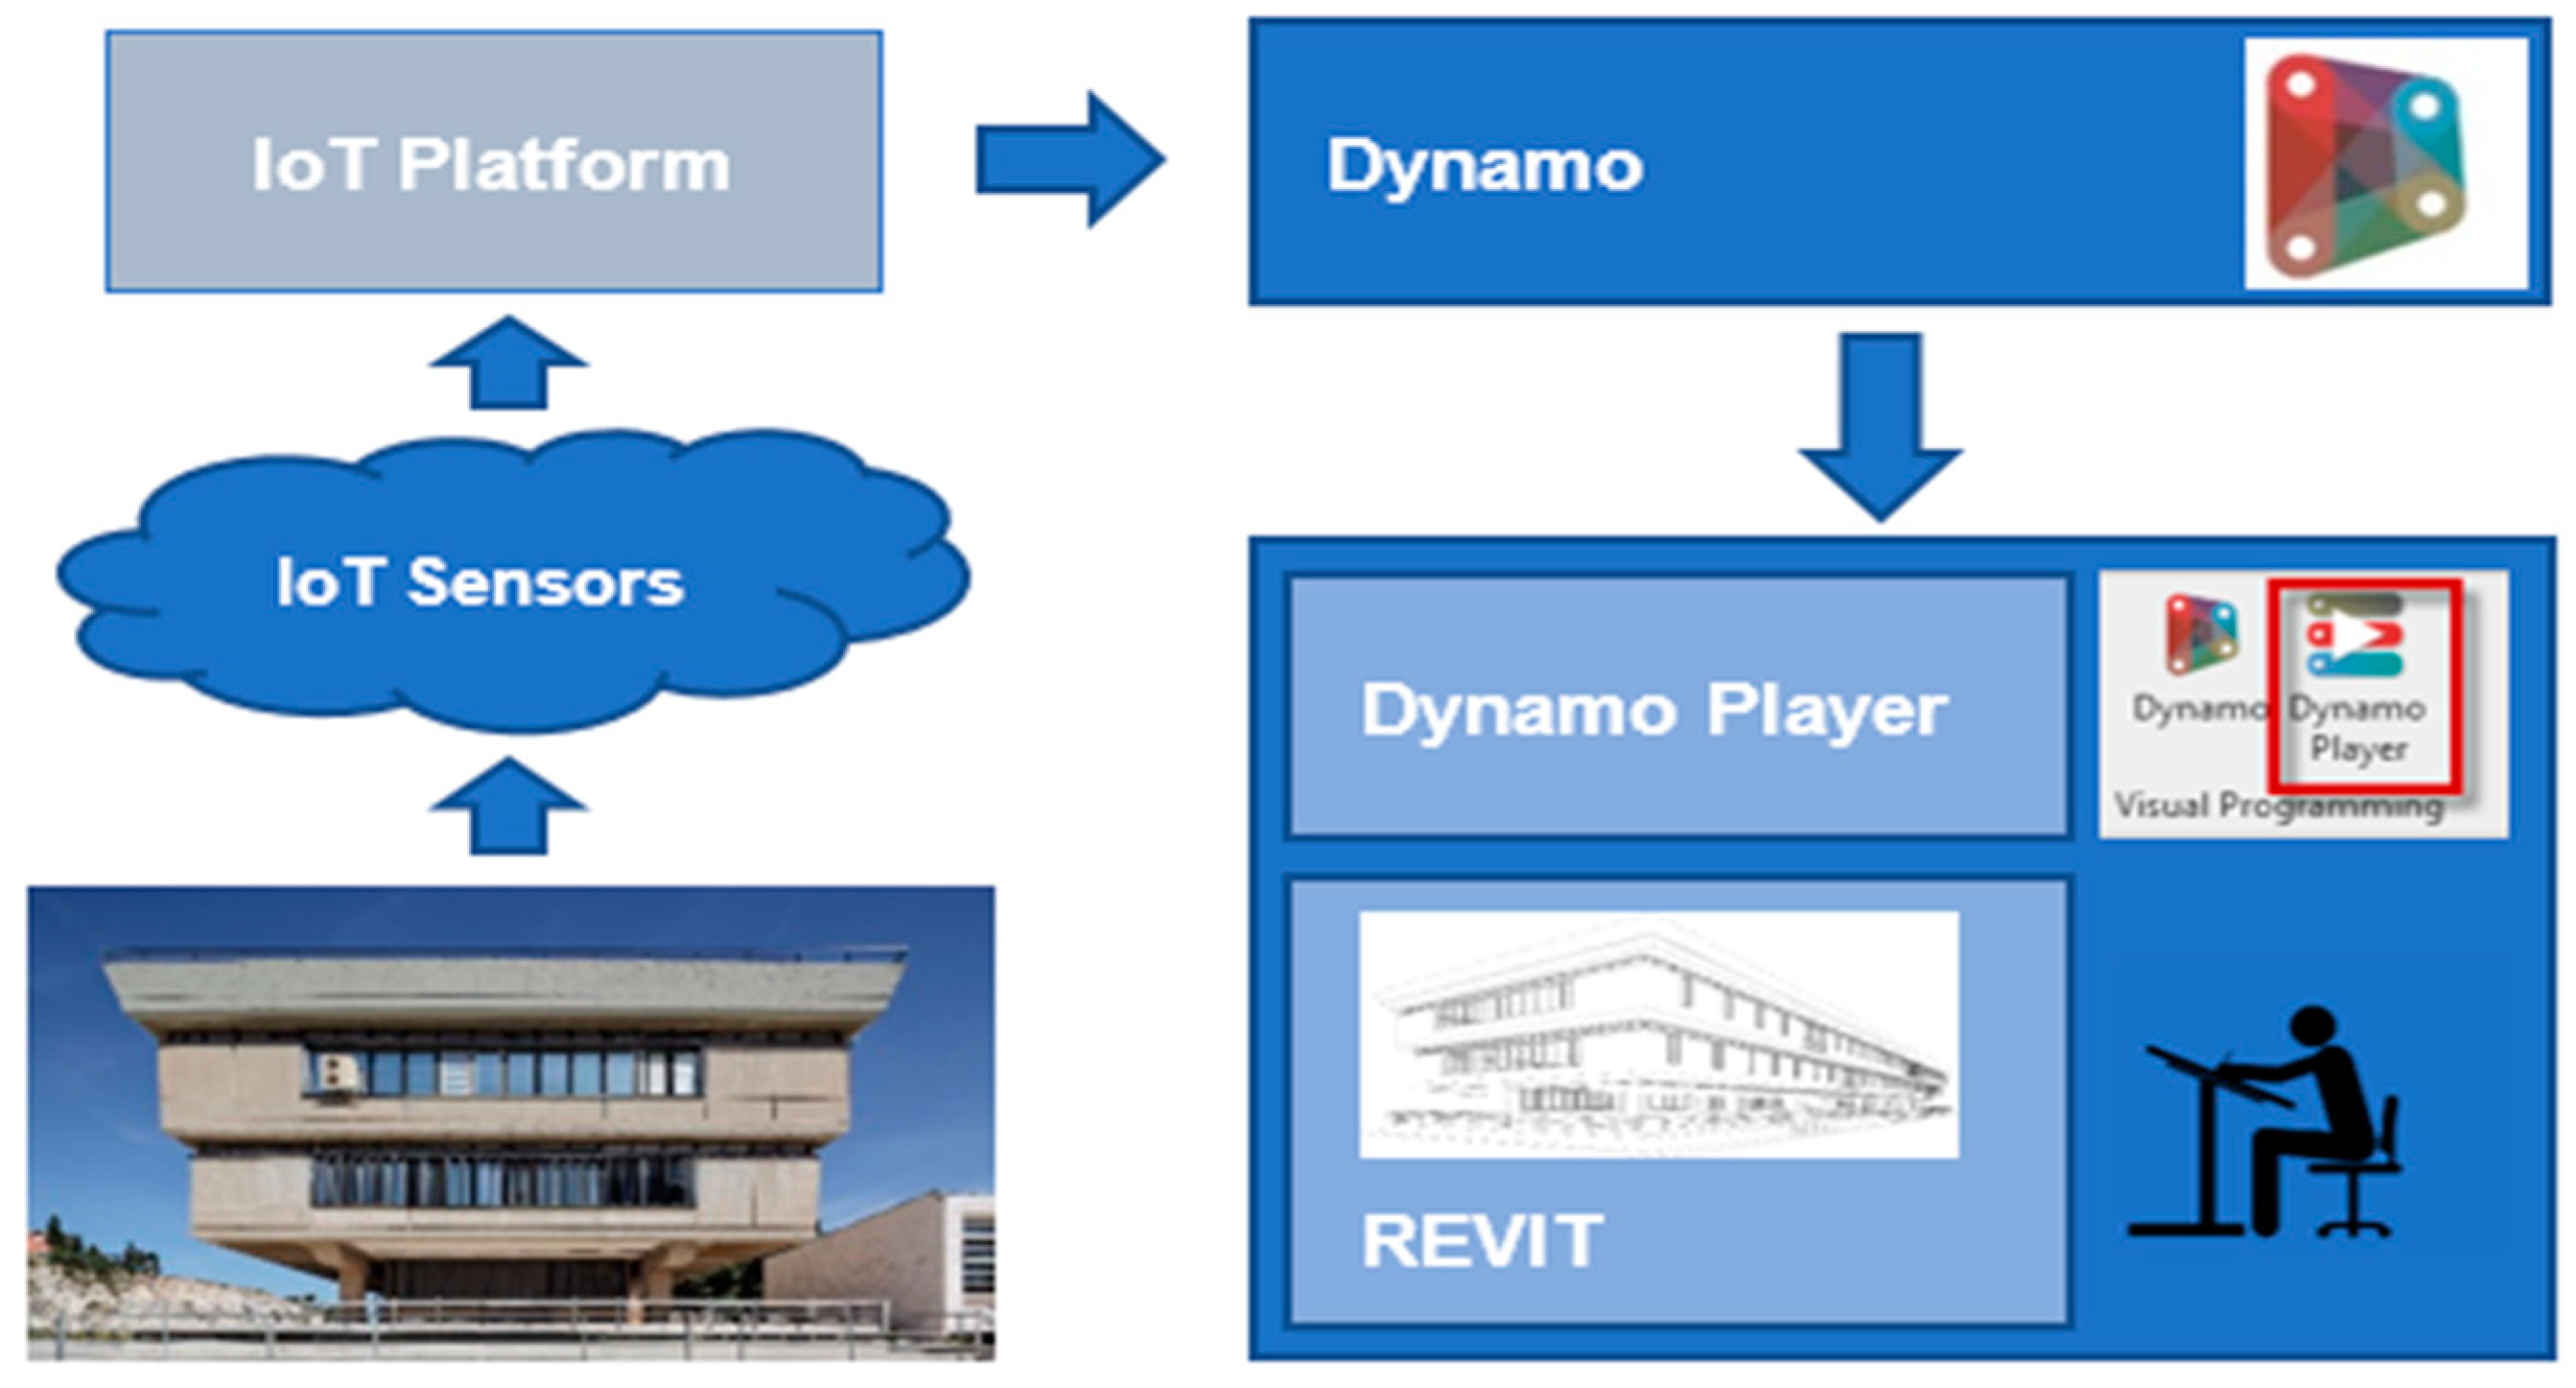
Nodes are the elementary entities in Dynamo; they are portions of programming code dedicated to carrying out specific operations which, combined, generate an algorithm. This process will produce a script capable of automating workflows, allowing, for example, direct input from an existing Excel file and the automatic compilation of parameter fields within Revit. The Dynamo work environment is accessible directly from Revit in the Manage > Visual programming section. From Dynamo/Revit, the access to sensor data provided by the IoT platform takes place by the APIs that provide time series of the sensor positioned in a room. The acquired time series can then be managed internally through Dynamo procedures.
Figure 7 schematically represents the flow of monitoring data from the acquisition rooms to the end user. Thanks to the development of a Dynamo script, it was possible to manage and connect, within the Revit information model, the data collected by the sensors, making this process both automatic and dynamic.
The workflow is specified by the Dynamo script shown in
Figure 8.
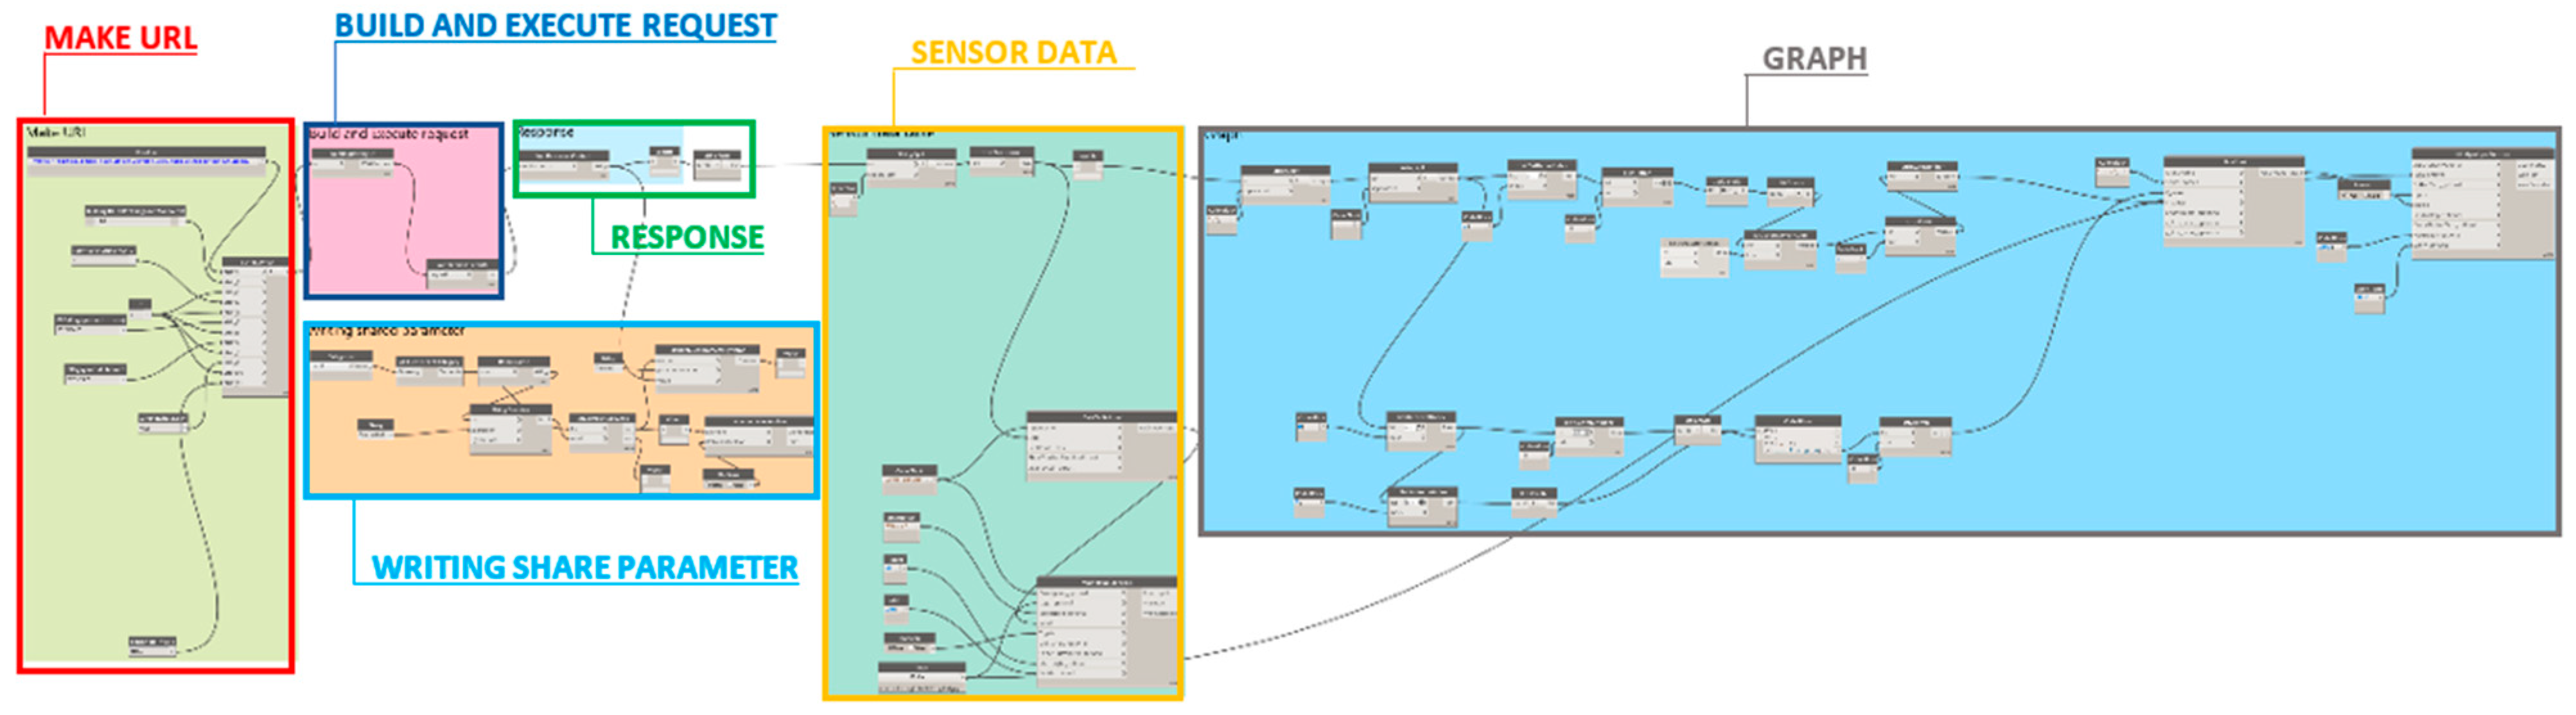
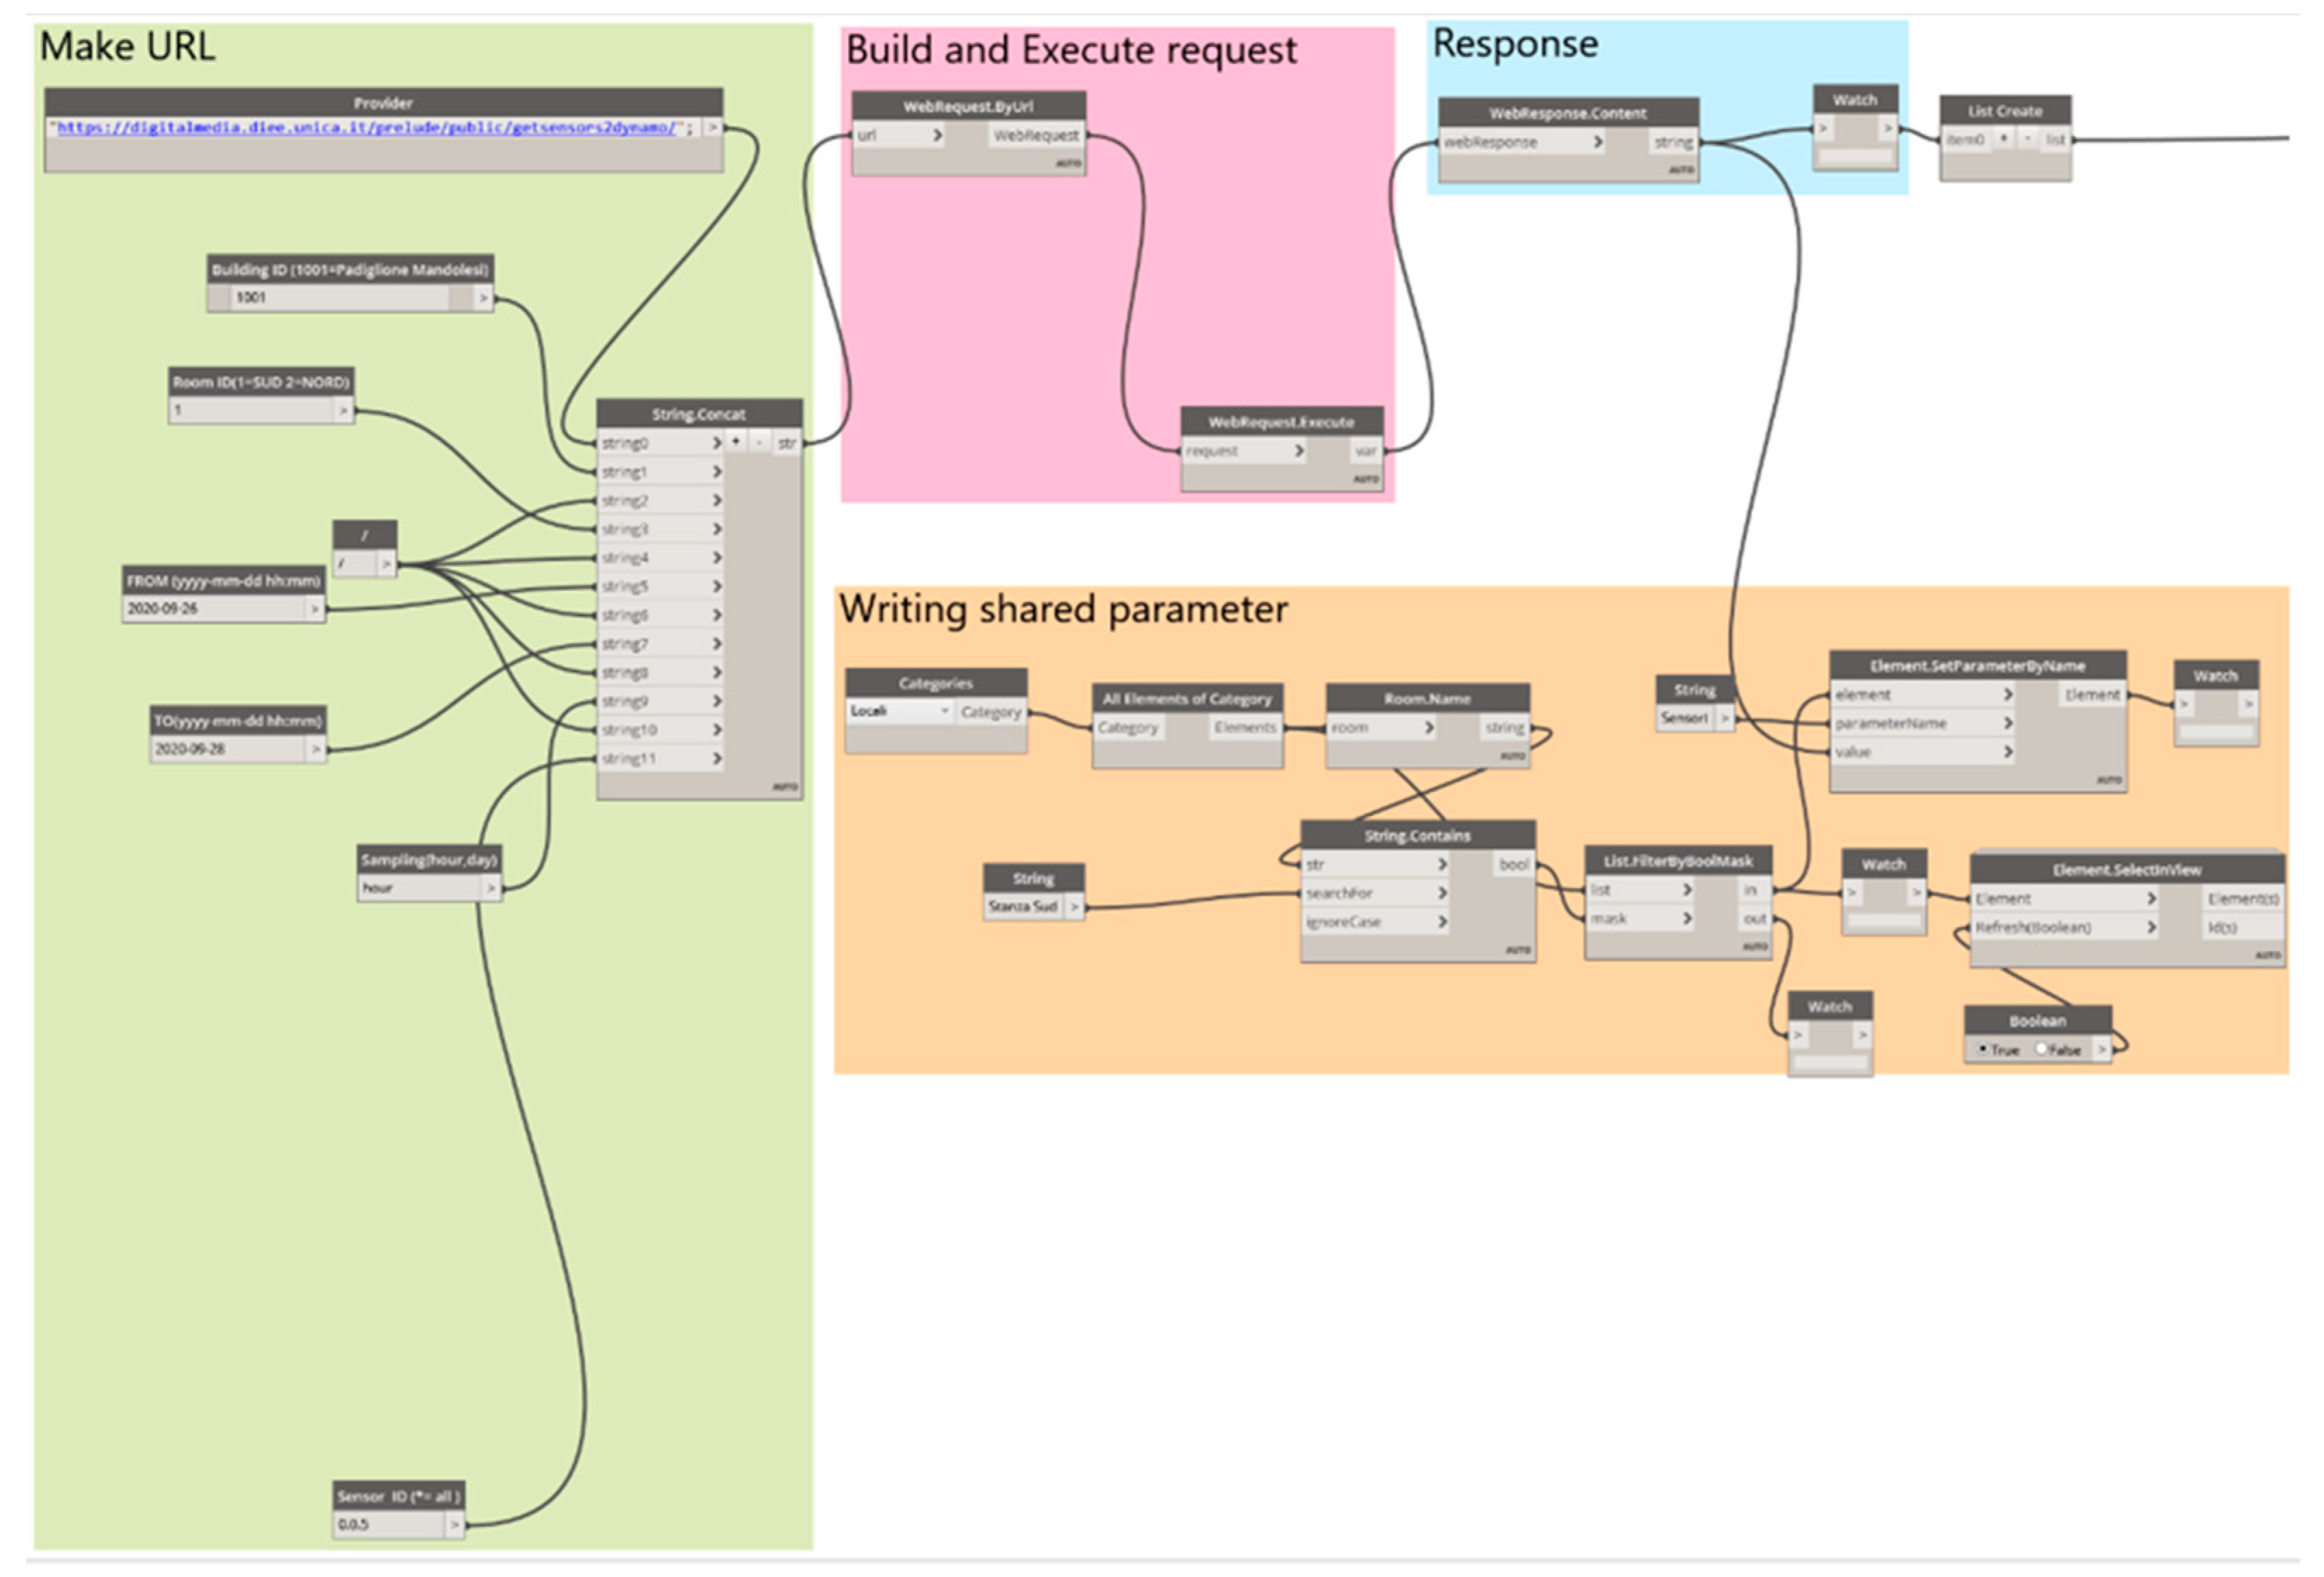
In the first part of the Dynamo script (
Figure 9), the nodes group “Make URL” refers to the access to sensor data, obtained through an API realized with a web application on a Linux server accessible by the Internet. The nodes group permits selection of the Mandolesi building (node: Building ID), the building room (node: Room ID), the sensor whose data are to be viewed (node: Sensor ID), their time range (nodes: From e To) and, finally, their time sampling (node: Sampling). The node “String.Concat” permits joining the text strings from the nodes described above and to compose the URL that allows for reaching the desired data: URL/getsensors2dynamo/{building}/{room}[/{from}[/{to}[/{sampling}[/{sensorID}]]]].
The nodes groups “Build and Execute request” and “Response” are part of the DynaWeb package, designed to ensure integration between Dynamo and web services. In this case, through the nodes group “Build and Execute request”, the web request is performed while the nodes group “Response” provides the response from the web. The last part of the script, the nodes group “writing share parameter”, permits association of the selected data sensor to the specific room of the Revit model. This is possible if the shared parameter “sensor” is defined within the information model developed with Revit and if it is associated with the rooms of the model. This nodes group permits identification and isolation of the category of interest (node: Categories), in this case “rooms”, to obtain the complete list of rooms present in the Revit information model (node: All Elements of category). Through the node “Room.Name”, the name and the number of each room is detected. Through the node “String.Contains”, a specific room is searched for among those of the list; the node “List.FilterByBoolMask” permits filtering the rooms of the list to isolate the specific room. The node “Element.SetParameterByName” permits association of the sensor data to the specific parameter “sensors” of the selected room.
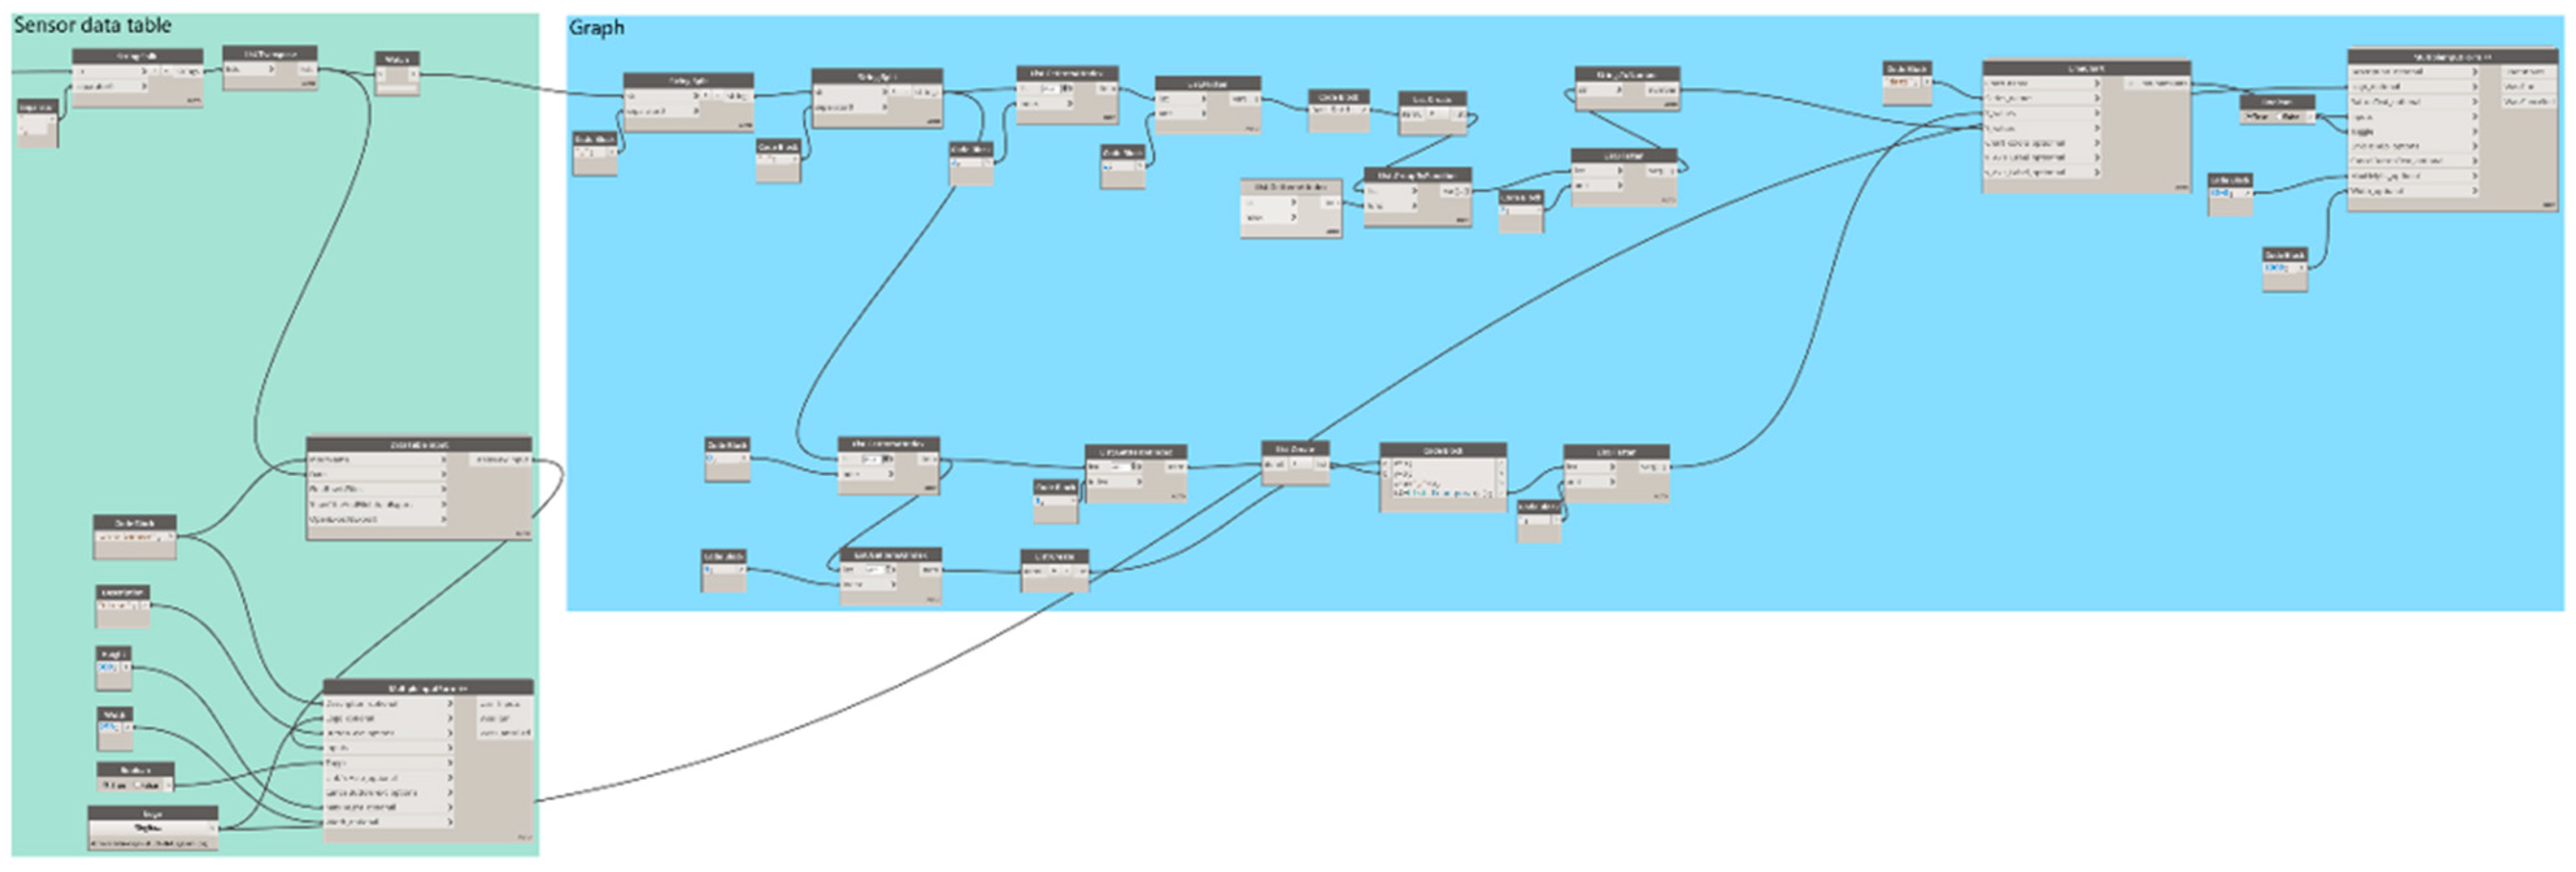
The second part of the script, shown in
Figure 10, exploits the potential of the Dynamo “Data Shape” package. The first nodes group “Sensor data table” allows for viewing the required data, referred to the specific room, through a “message box”, which gives an immediate output in .xlm format in order to execute elaborations in other environments. The last nodes group “Graph” is structured to provide a graphic representation of the trend of the values recorded by the sensors in the time range set at the start.
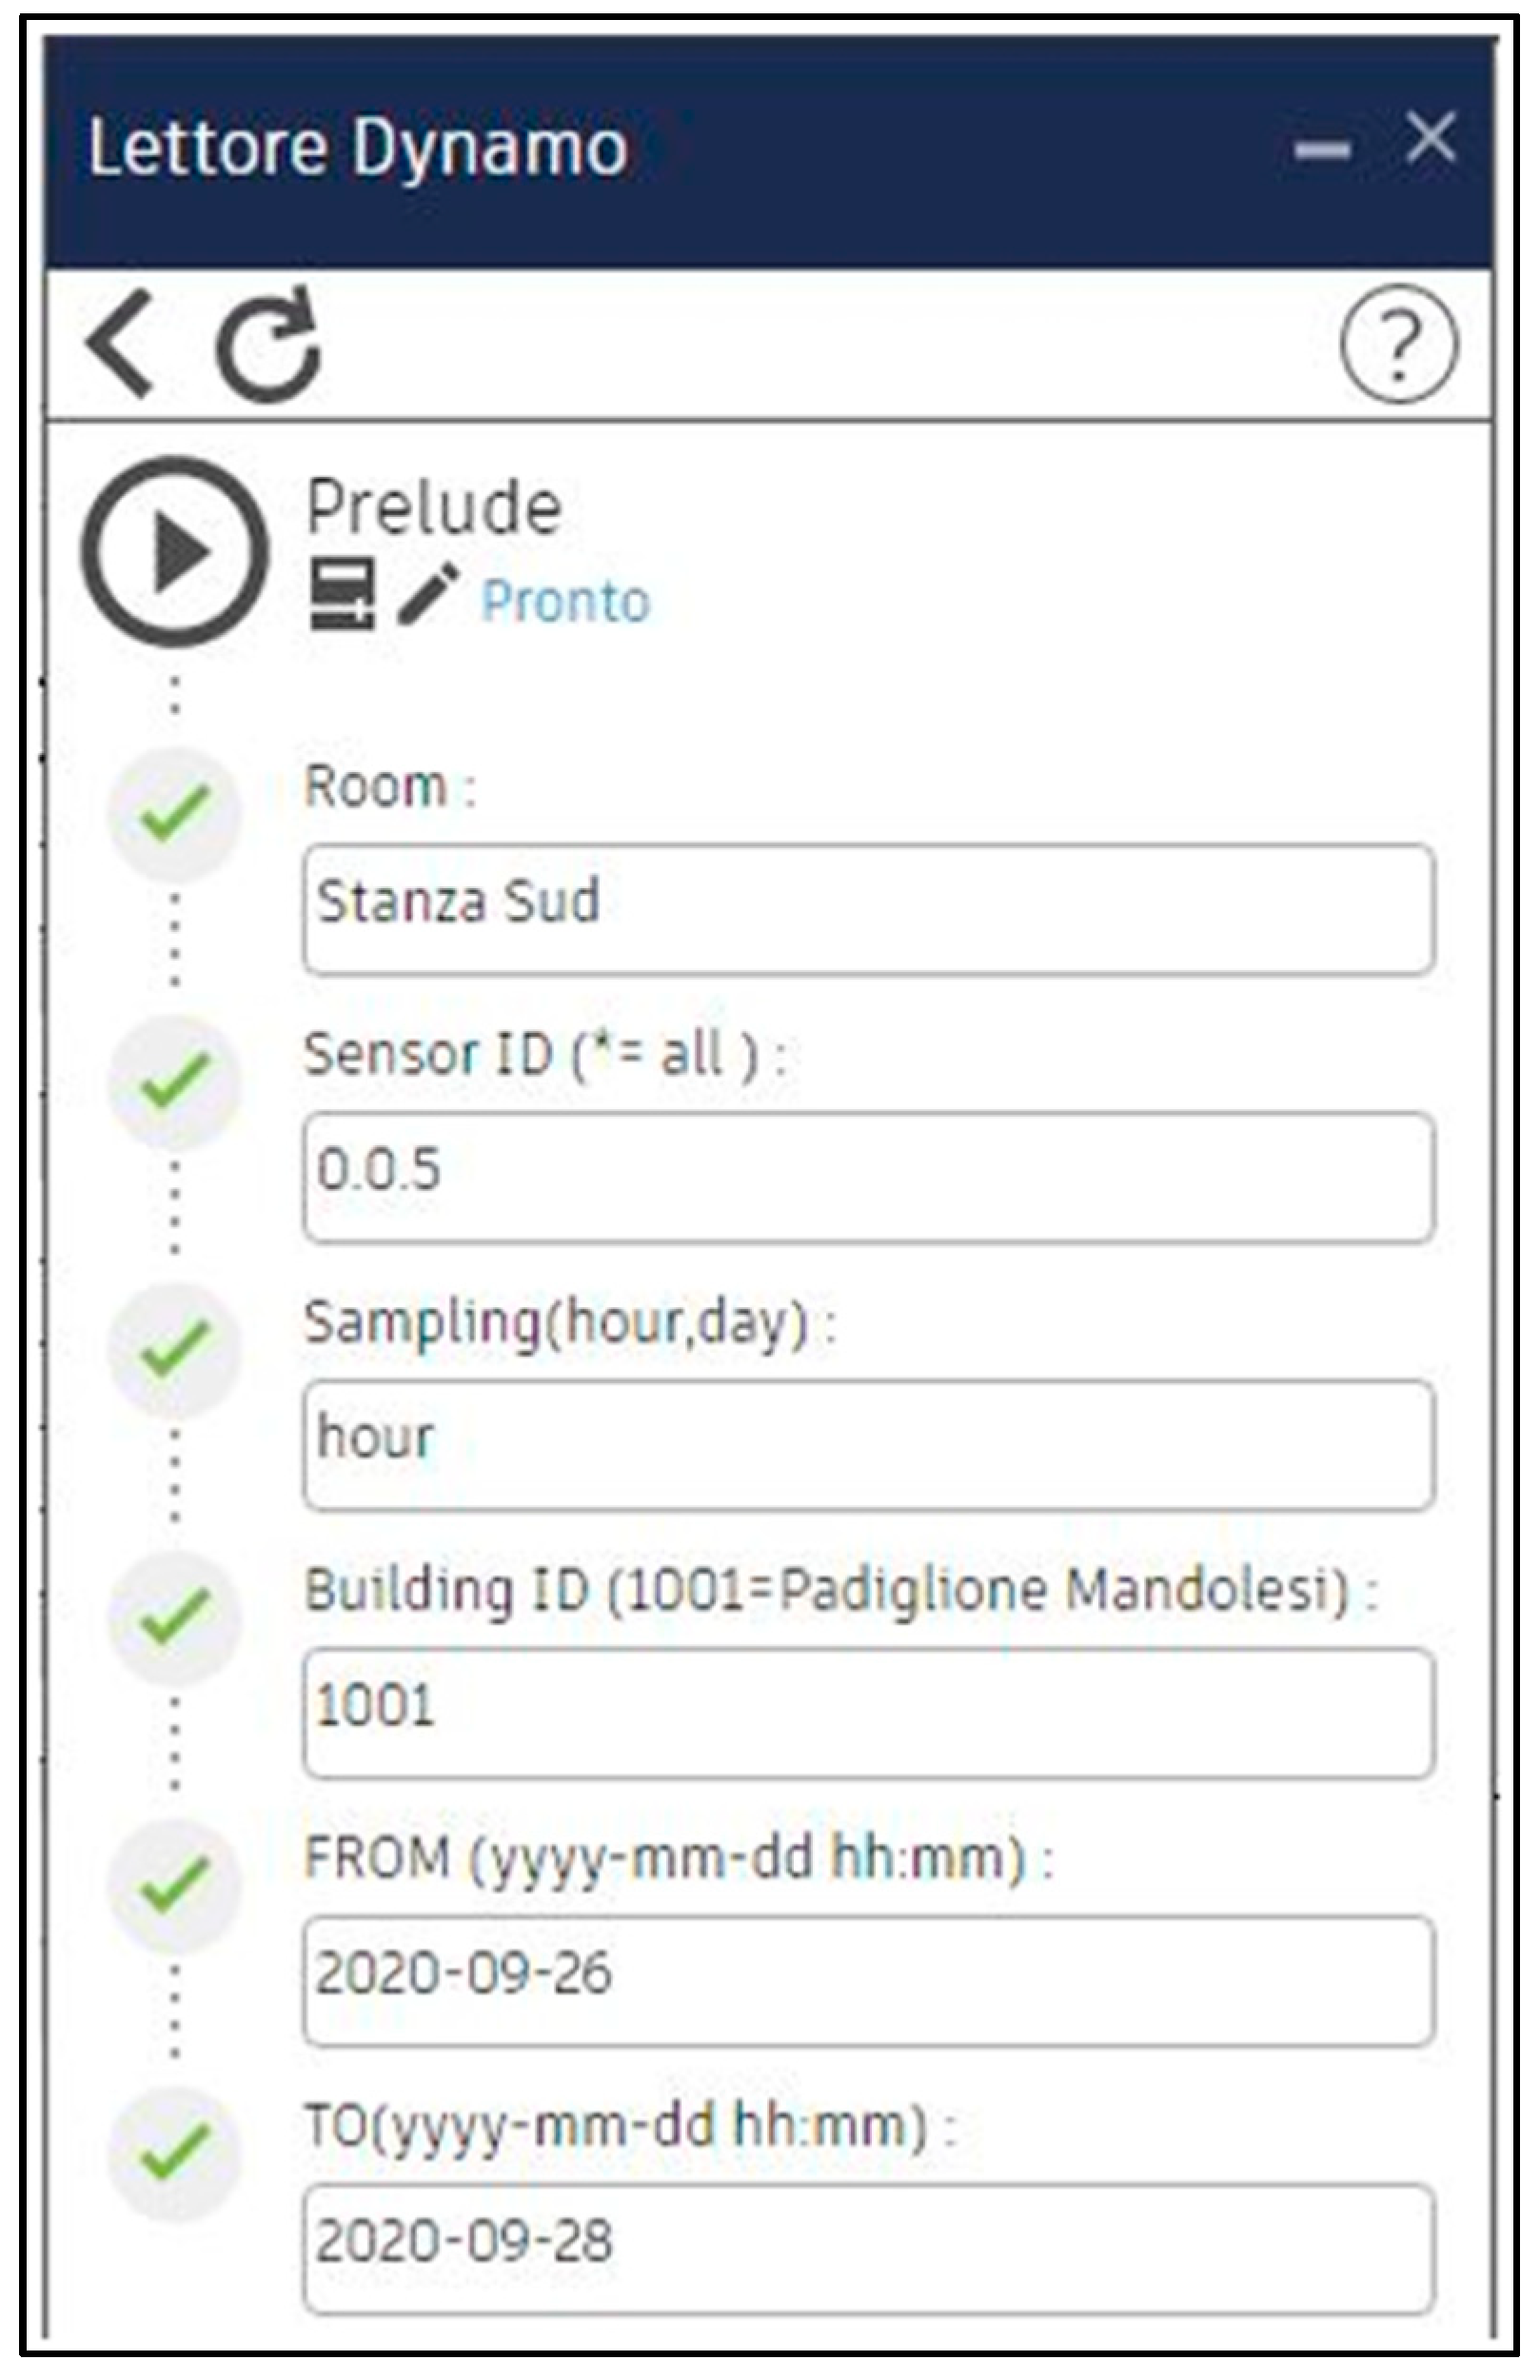
3. Results
The procedure proposed creates “a bridge” between the IoT platform and the informative model of the building. The Dynamo script can be run by the player on the Revit interface. The operator can choose the room, one or more measured parameters (such as temperature, relative humidity, electrical consumption etc.), the time range and sampling (
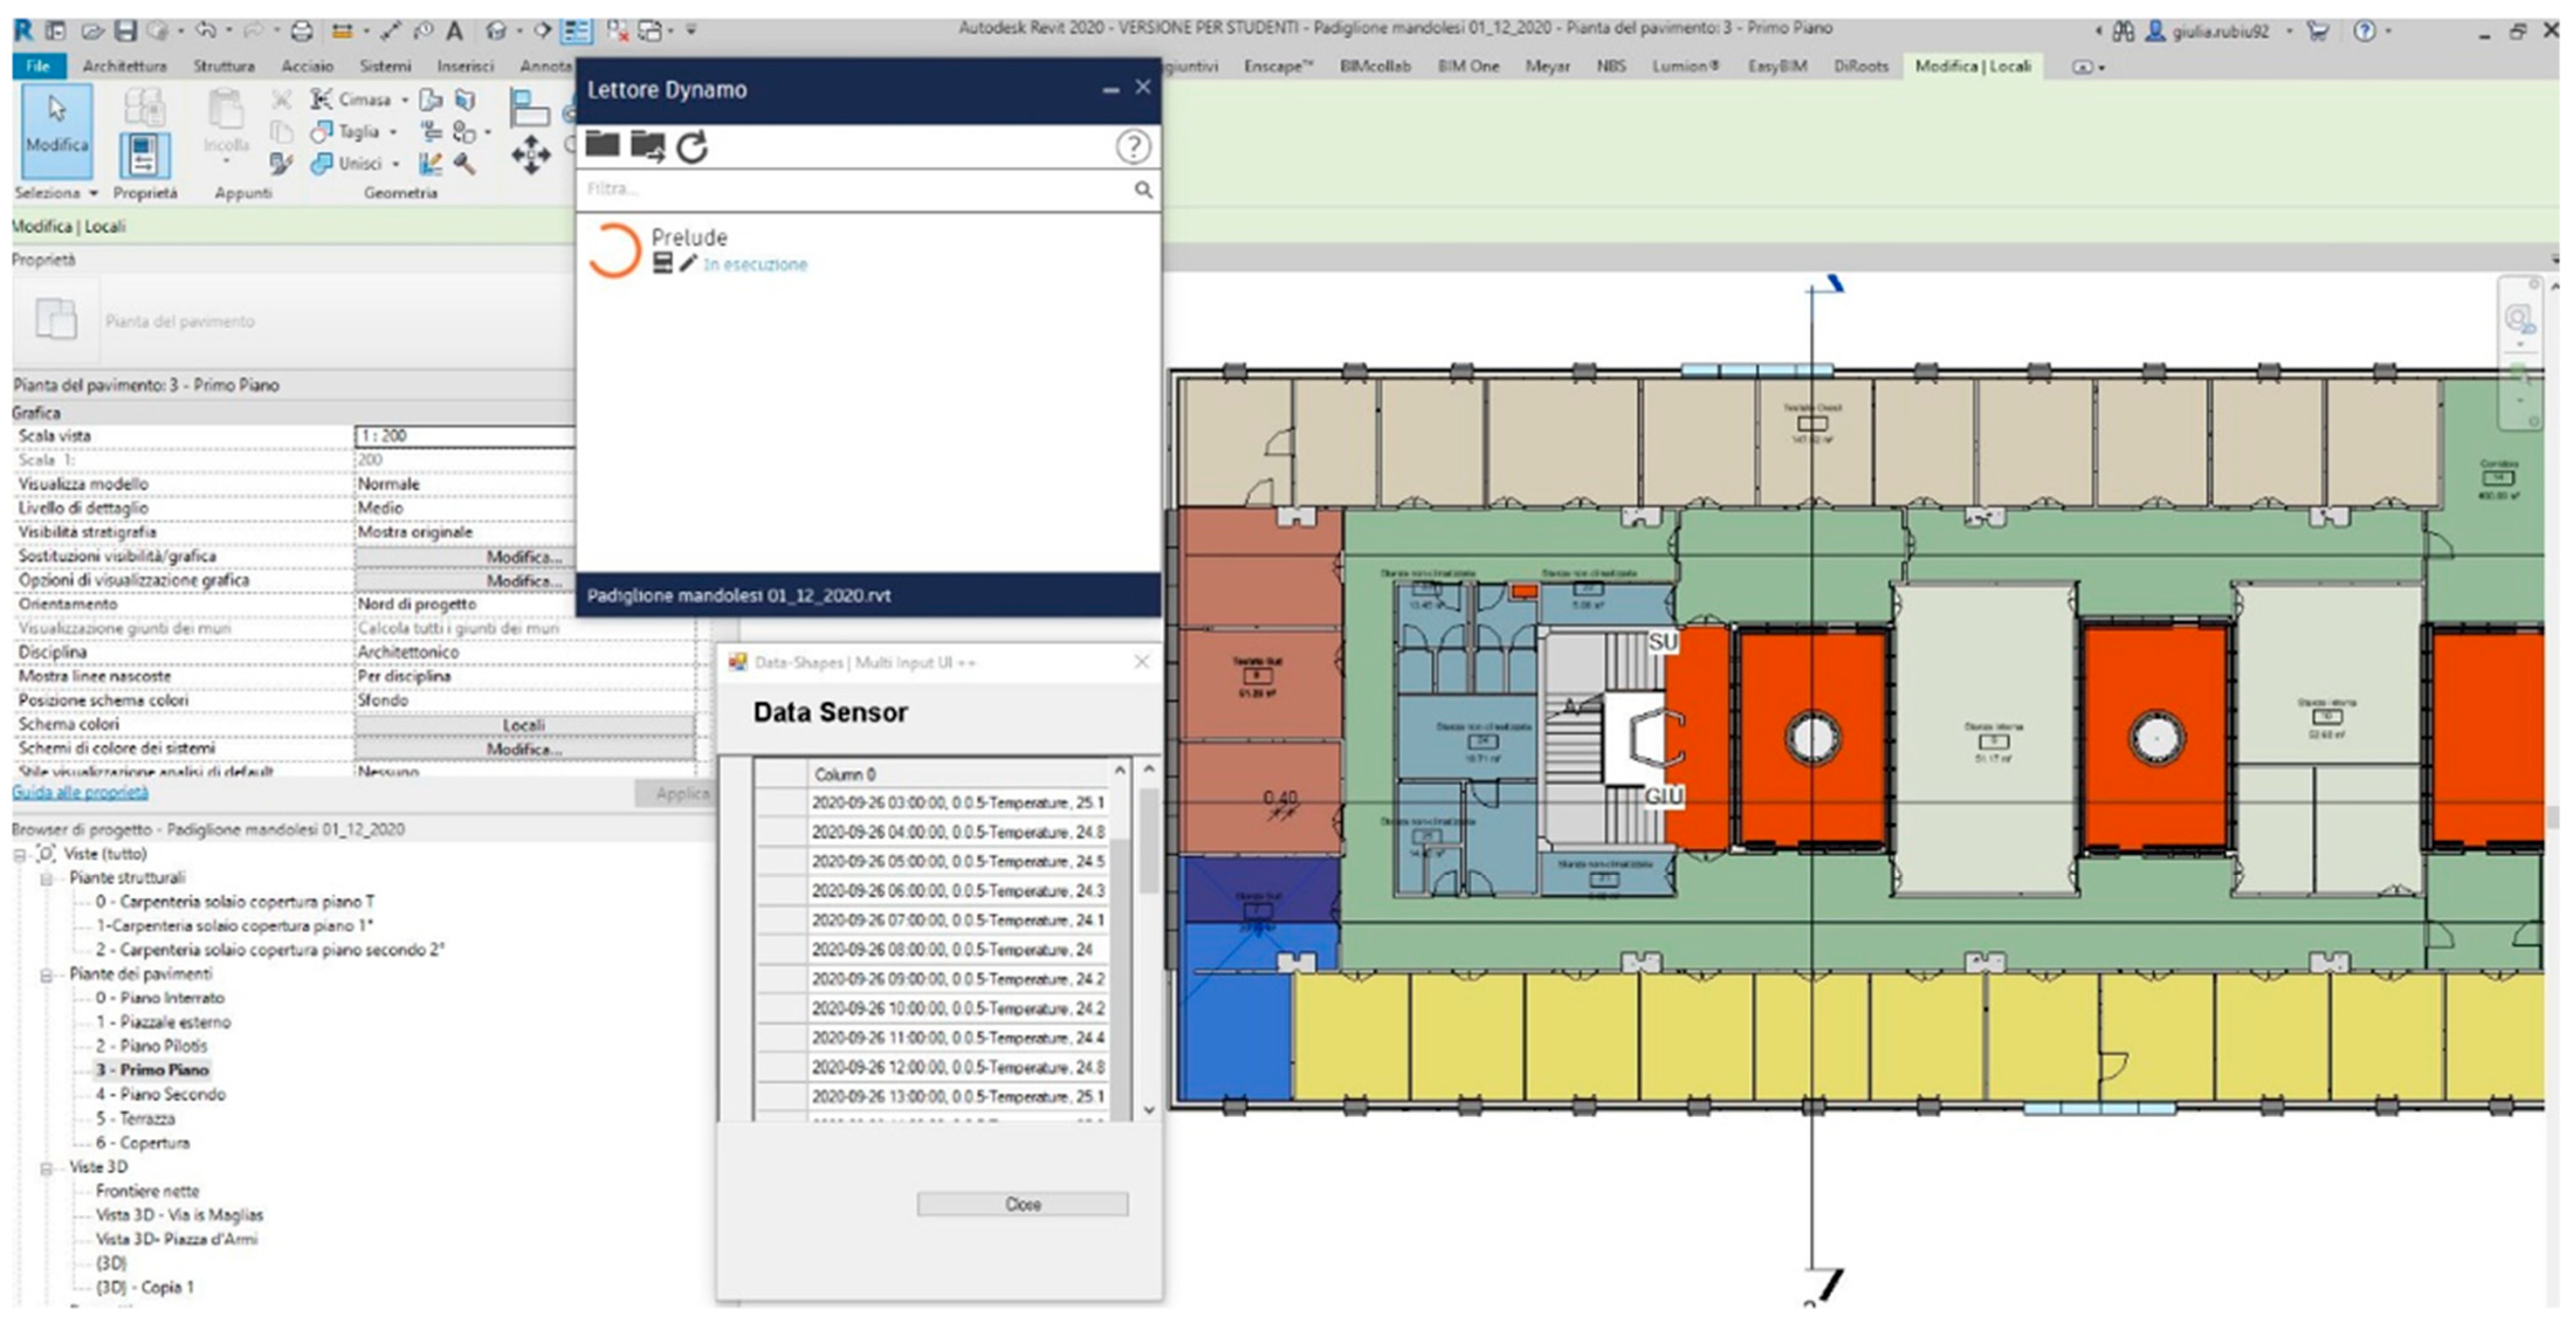
Figure 11). The selected values can be seen directly within the model (
Figure 12). The script automatically associates the data from the sensors placed in the room to its schedule (
Figure 13). It also produces quick and direct graphs of the values that allow users to have an overview of the monitored parameters.
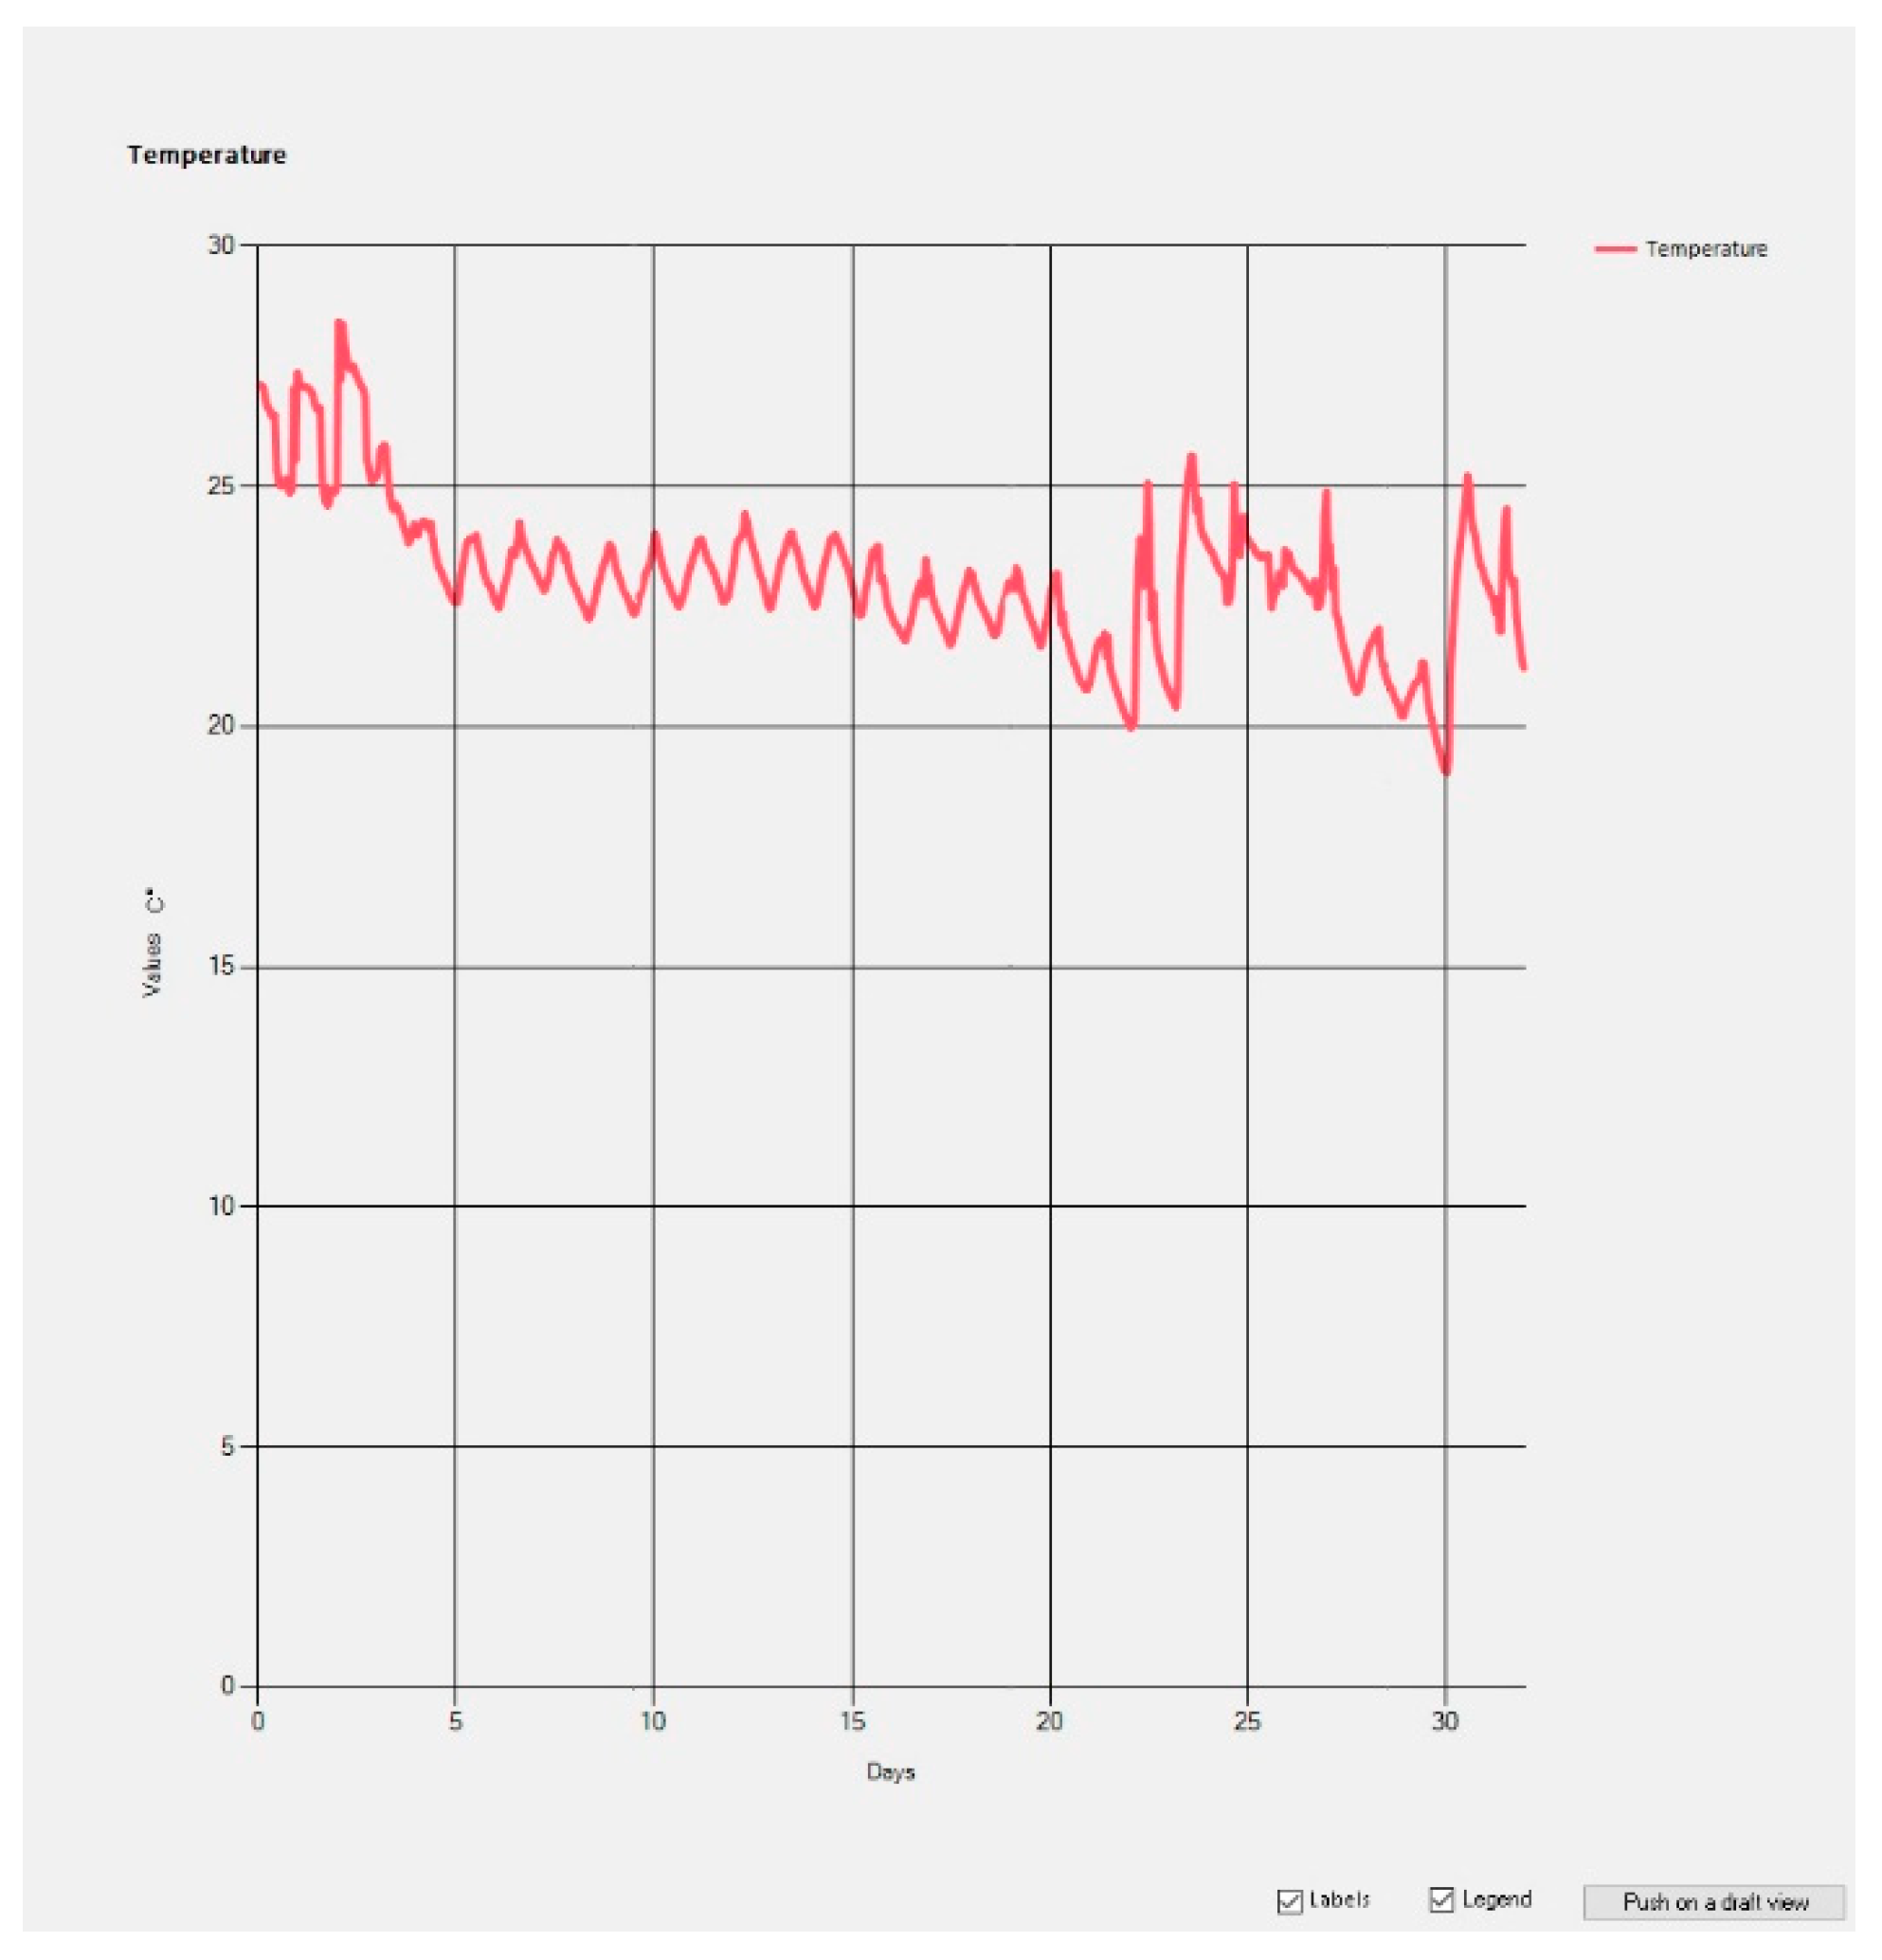
These can give useful information on environmental conditions and energy consumption. In the following examples, monthly graphs related to the northern room analyzed are illustrated. A summer and winter month (August 2018 and February 2019) were chosen.
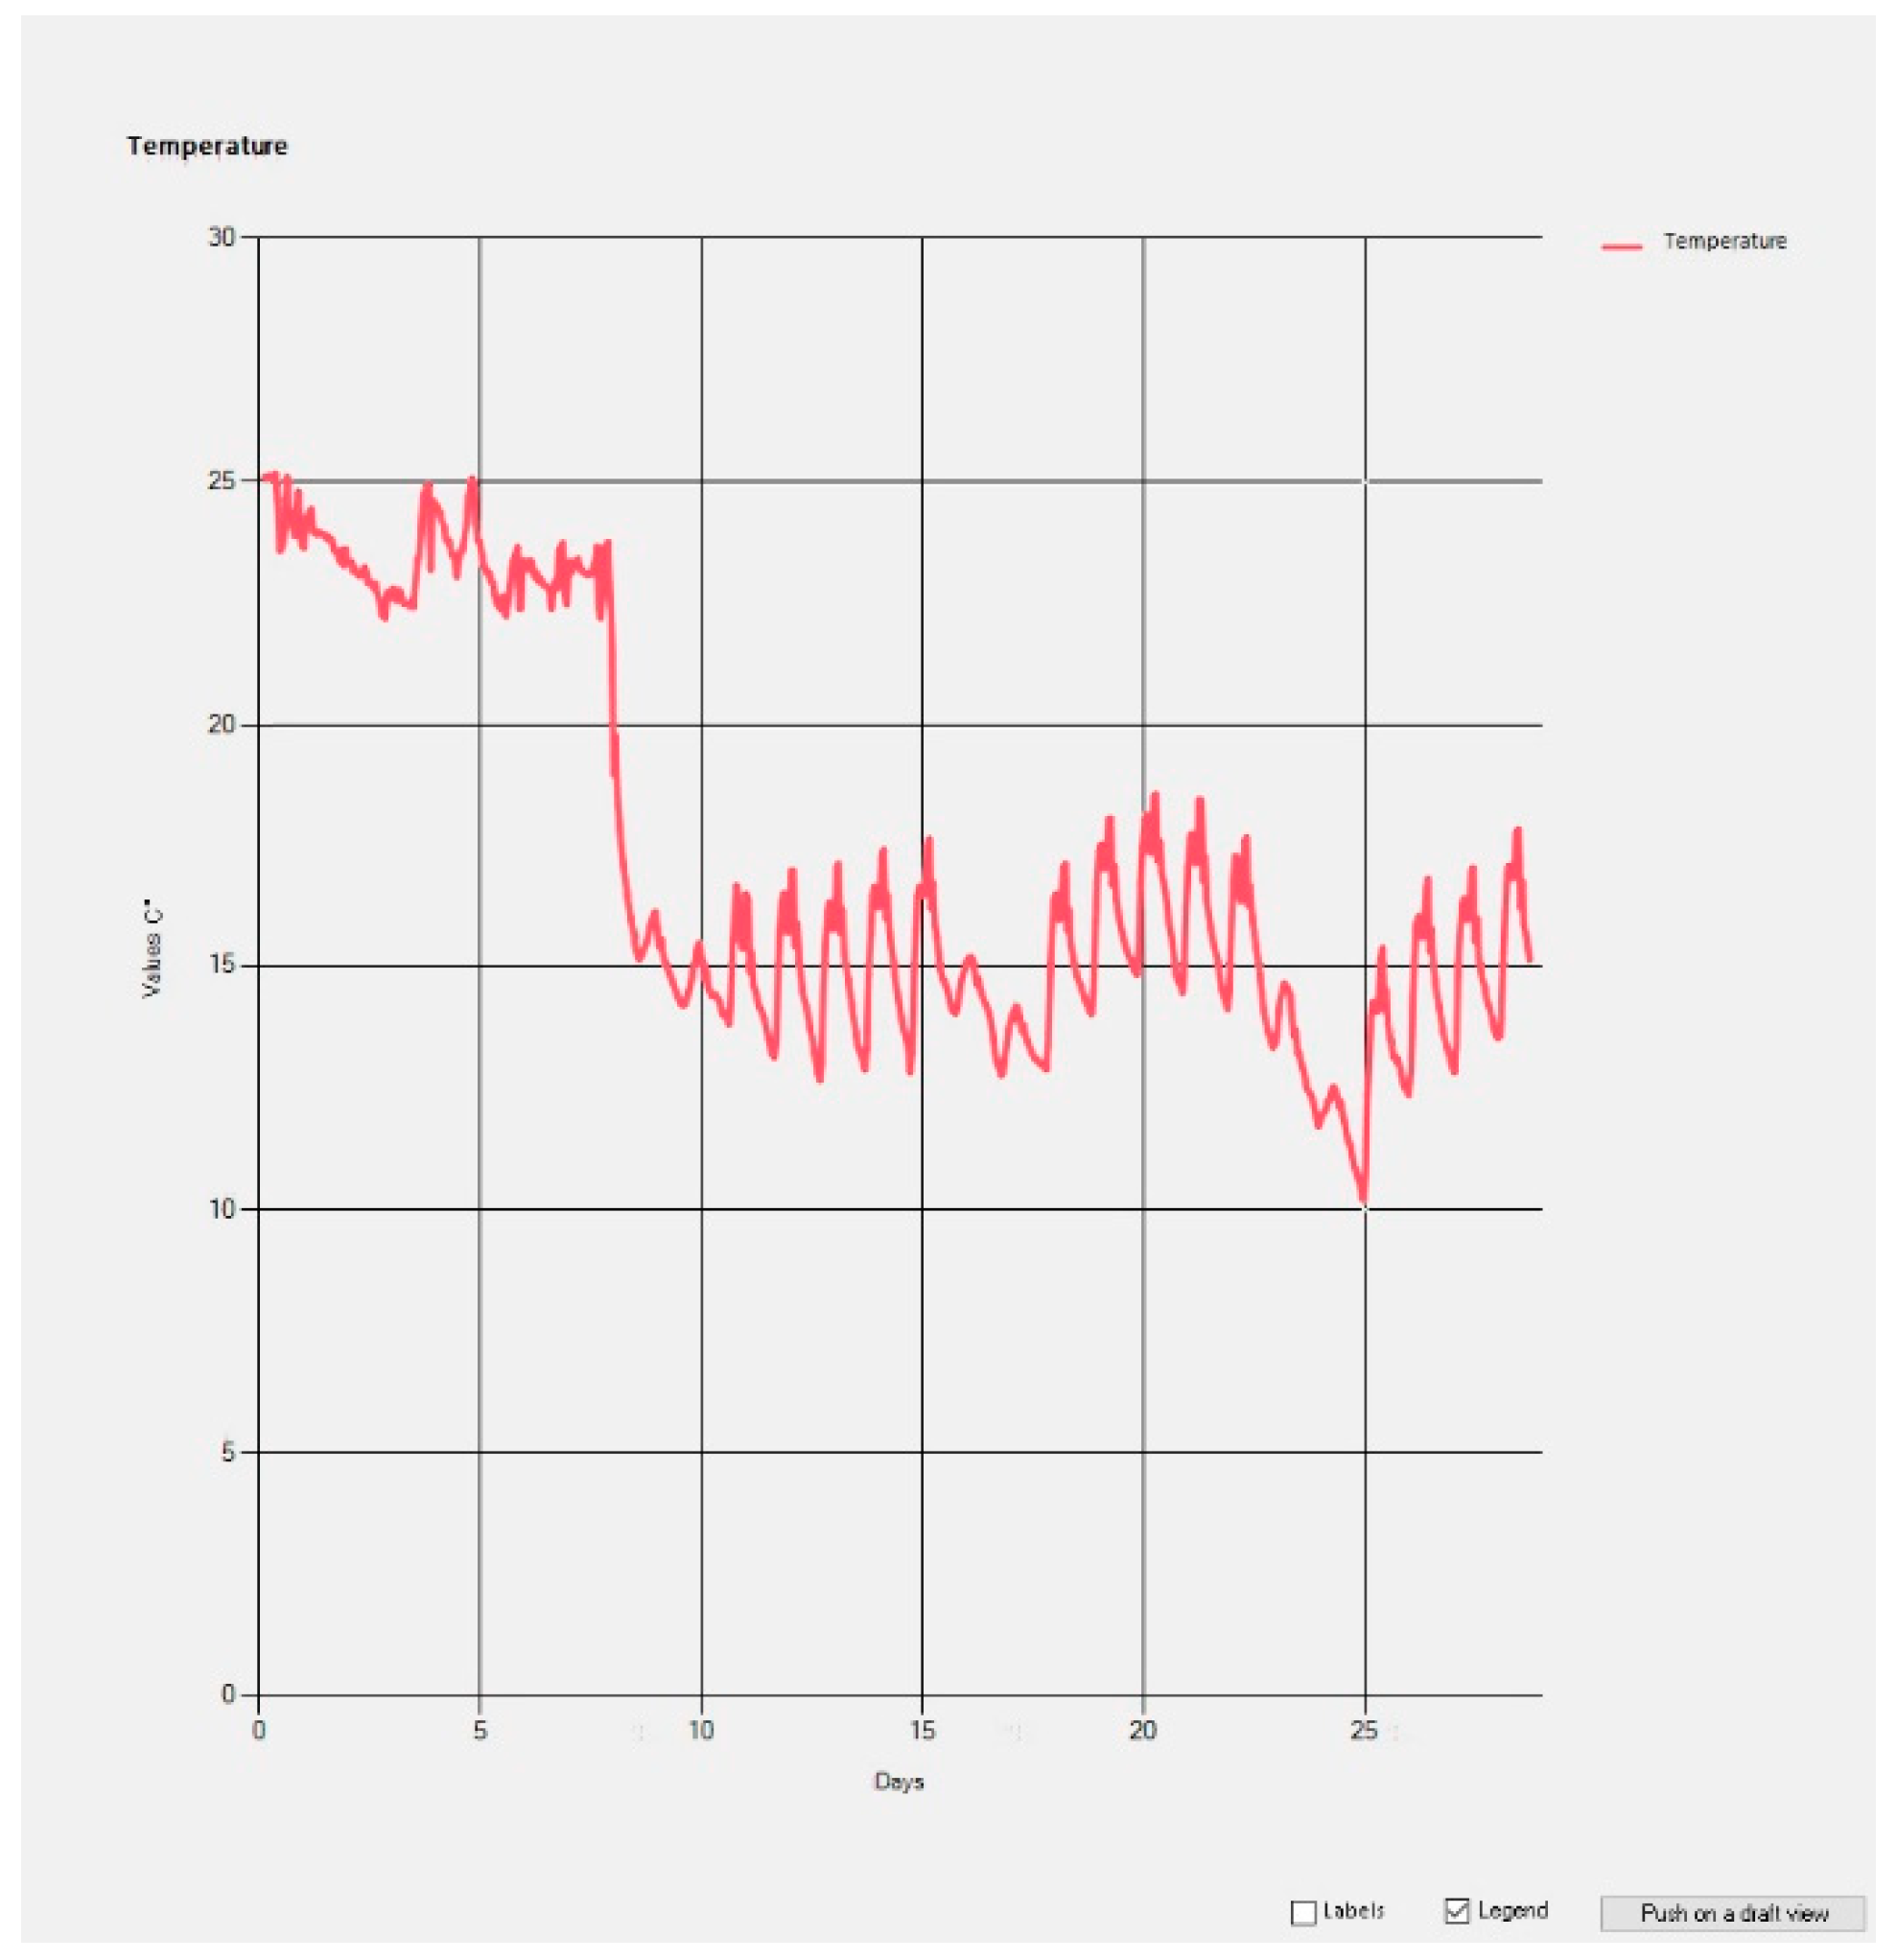
The temperatures during a summer period range from 27 to 19 °C, but are mostly between 25 and 20 °C (
Figure 14). This graph can give a preliminary evaluation on comfort conditions. After a short period of three days when the temperature is always above 25 °C, for about two weeks it is quite stable and oscillates between 24 and 23 °C. The oscillation then increases up to 5 °C (25–20 °C). Comfort requirements are never met [
32]. In the first period, the temperature is too high, then it starts oscillating around an average that is too low. It suggests excessive use of air conditioning.
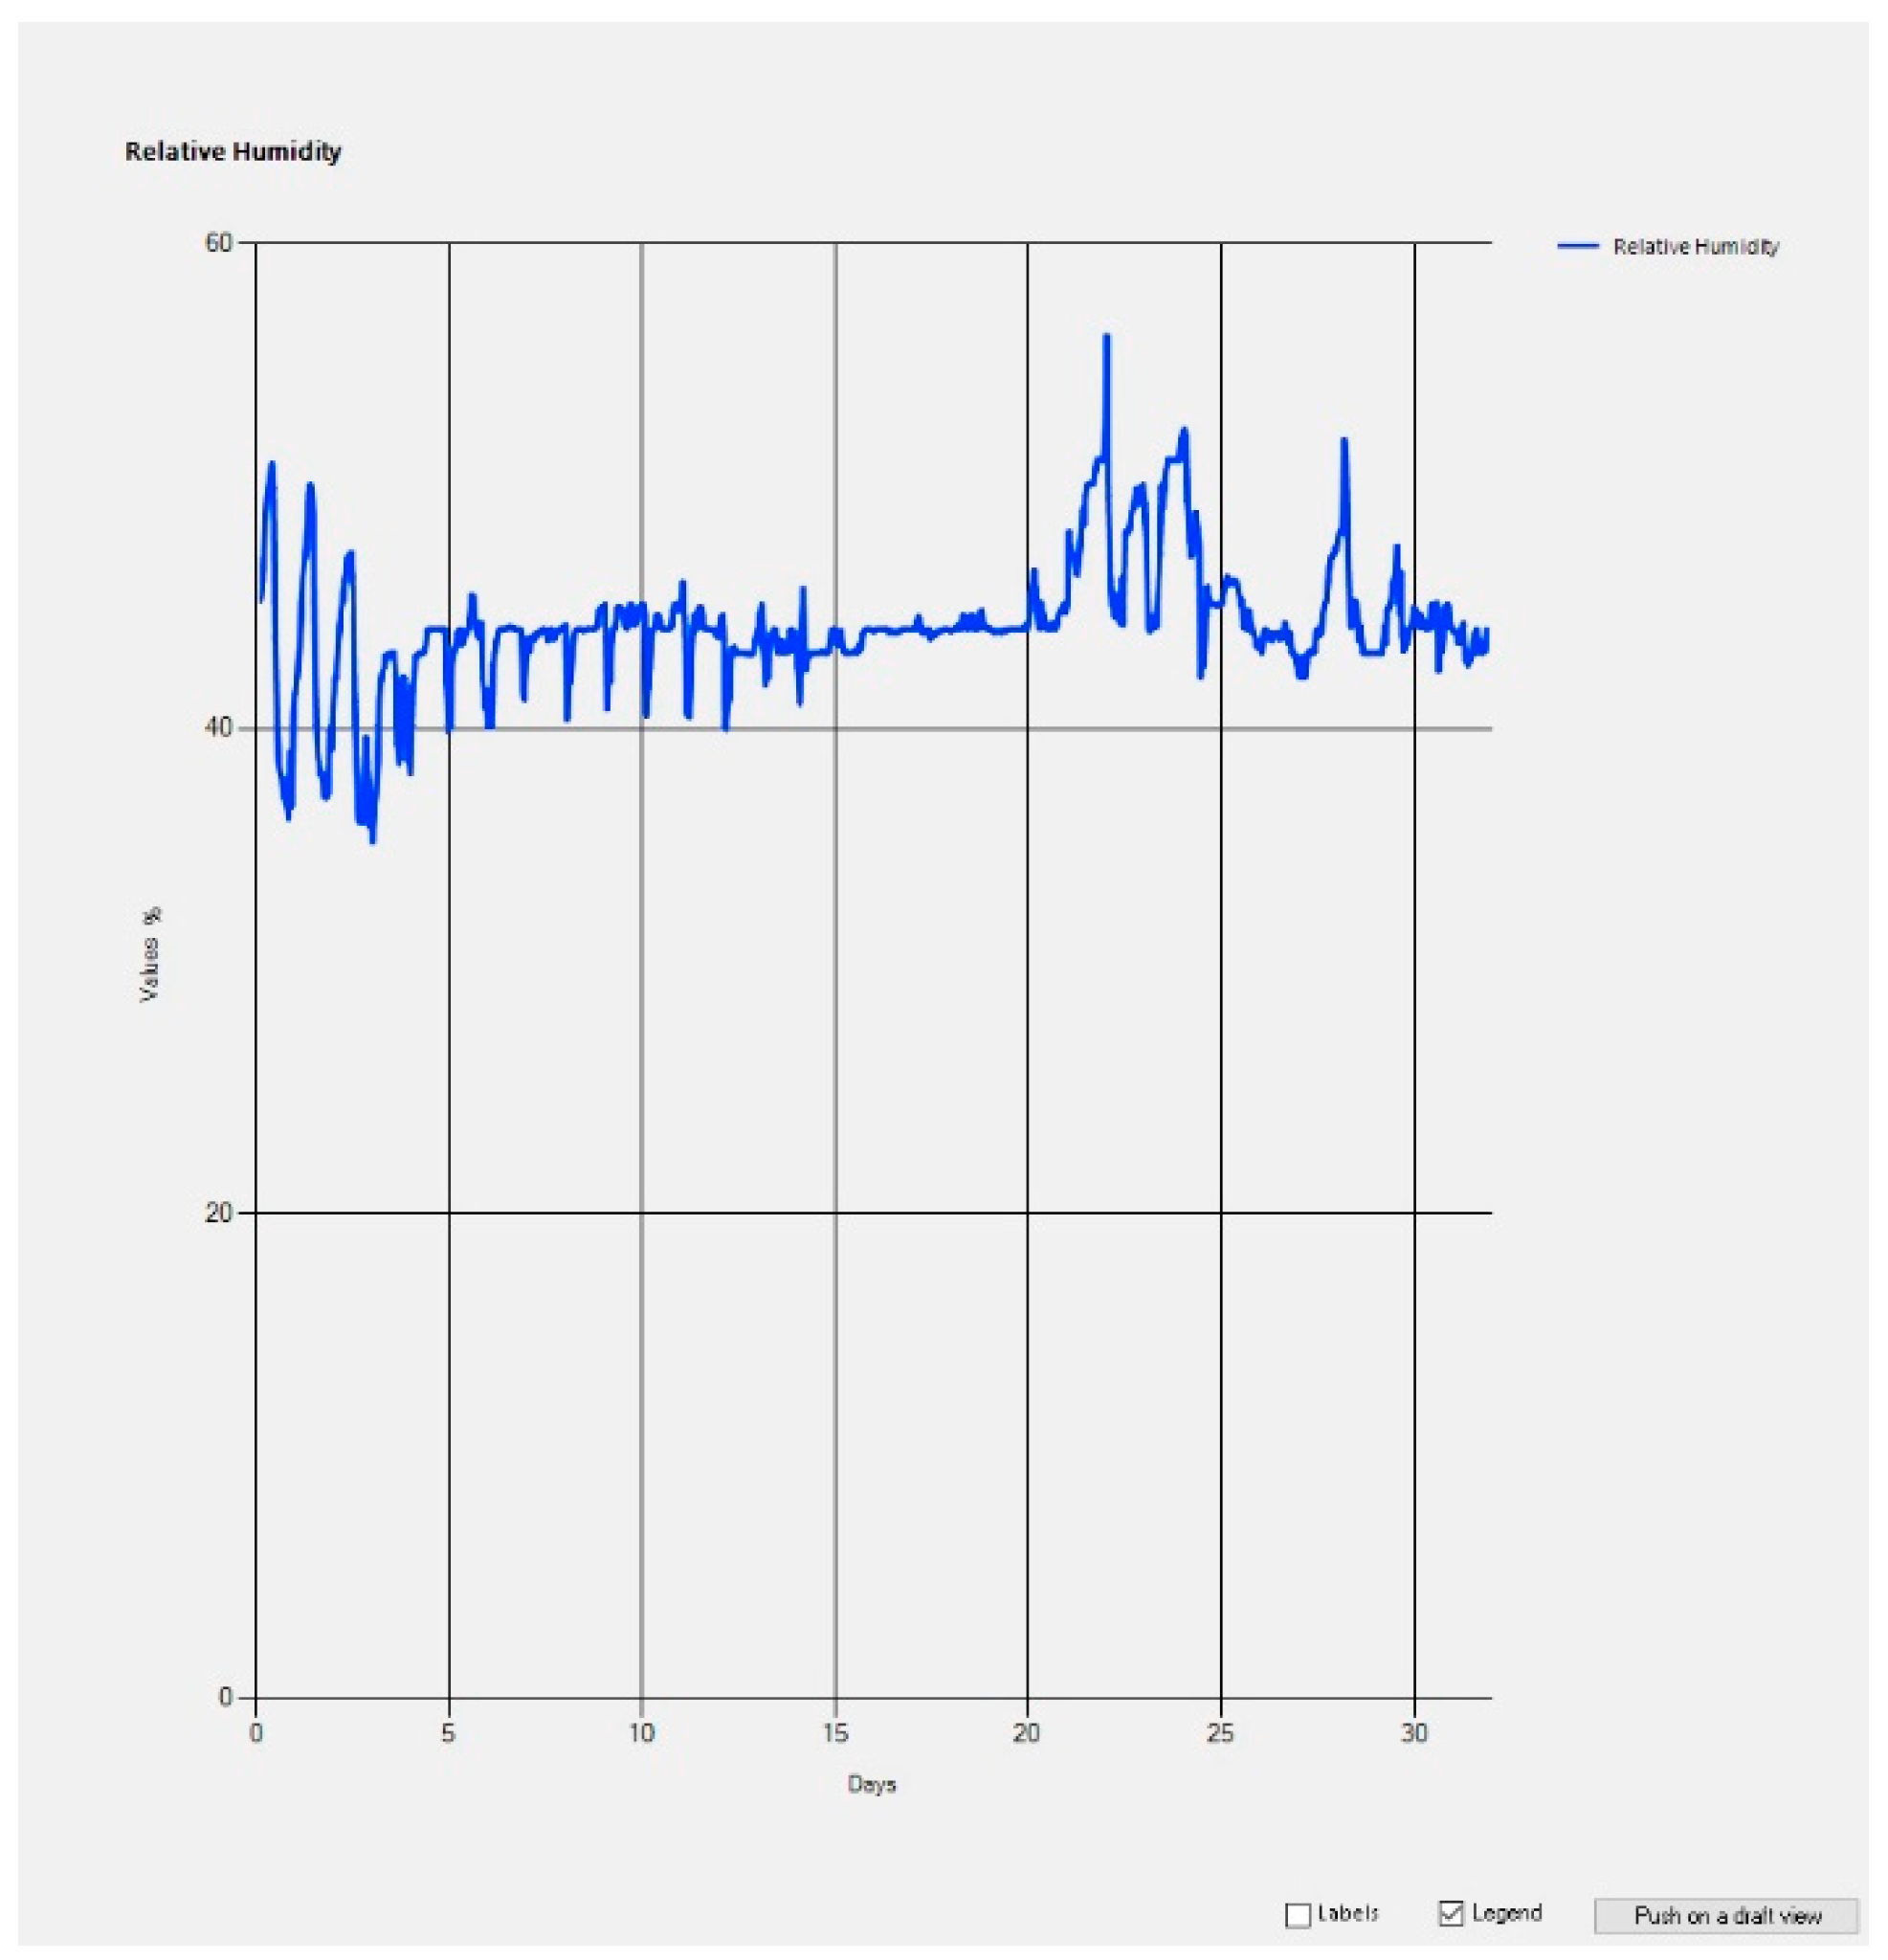
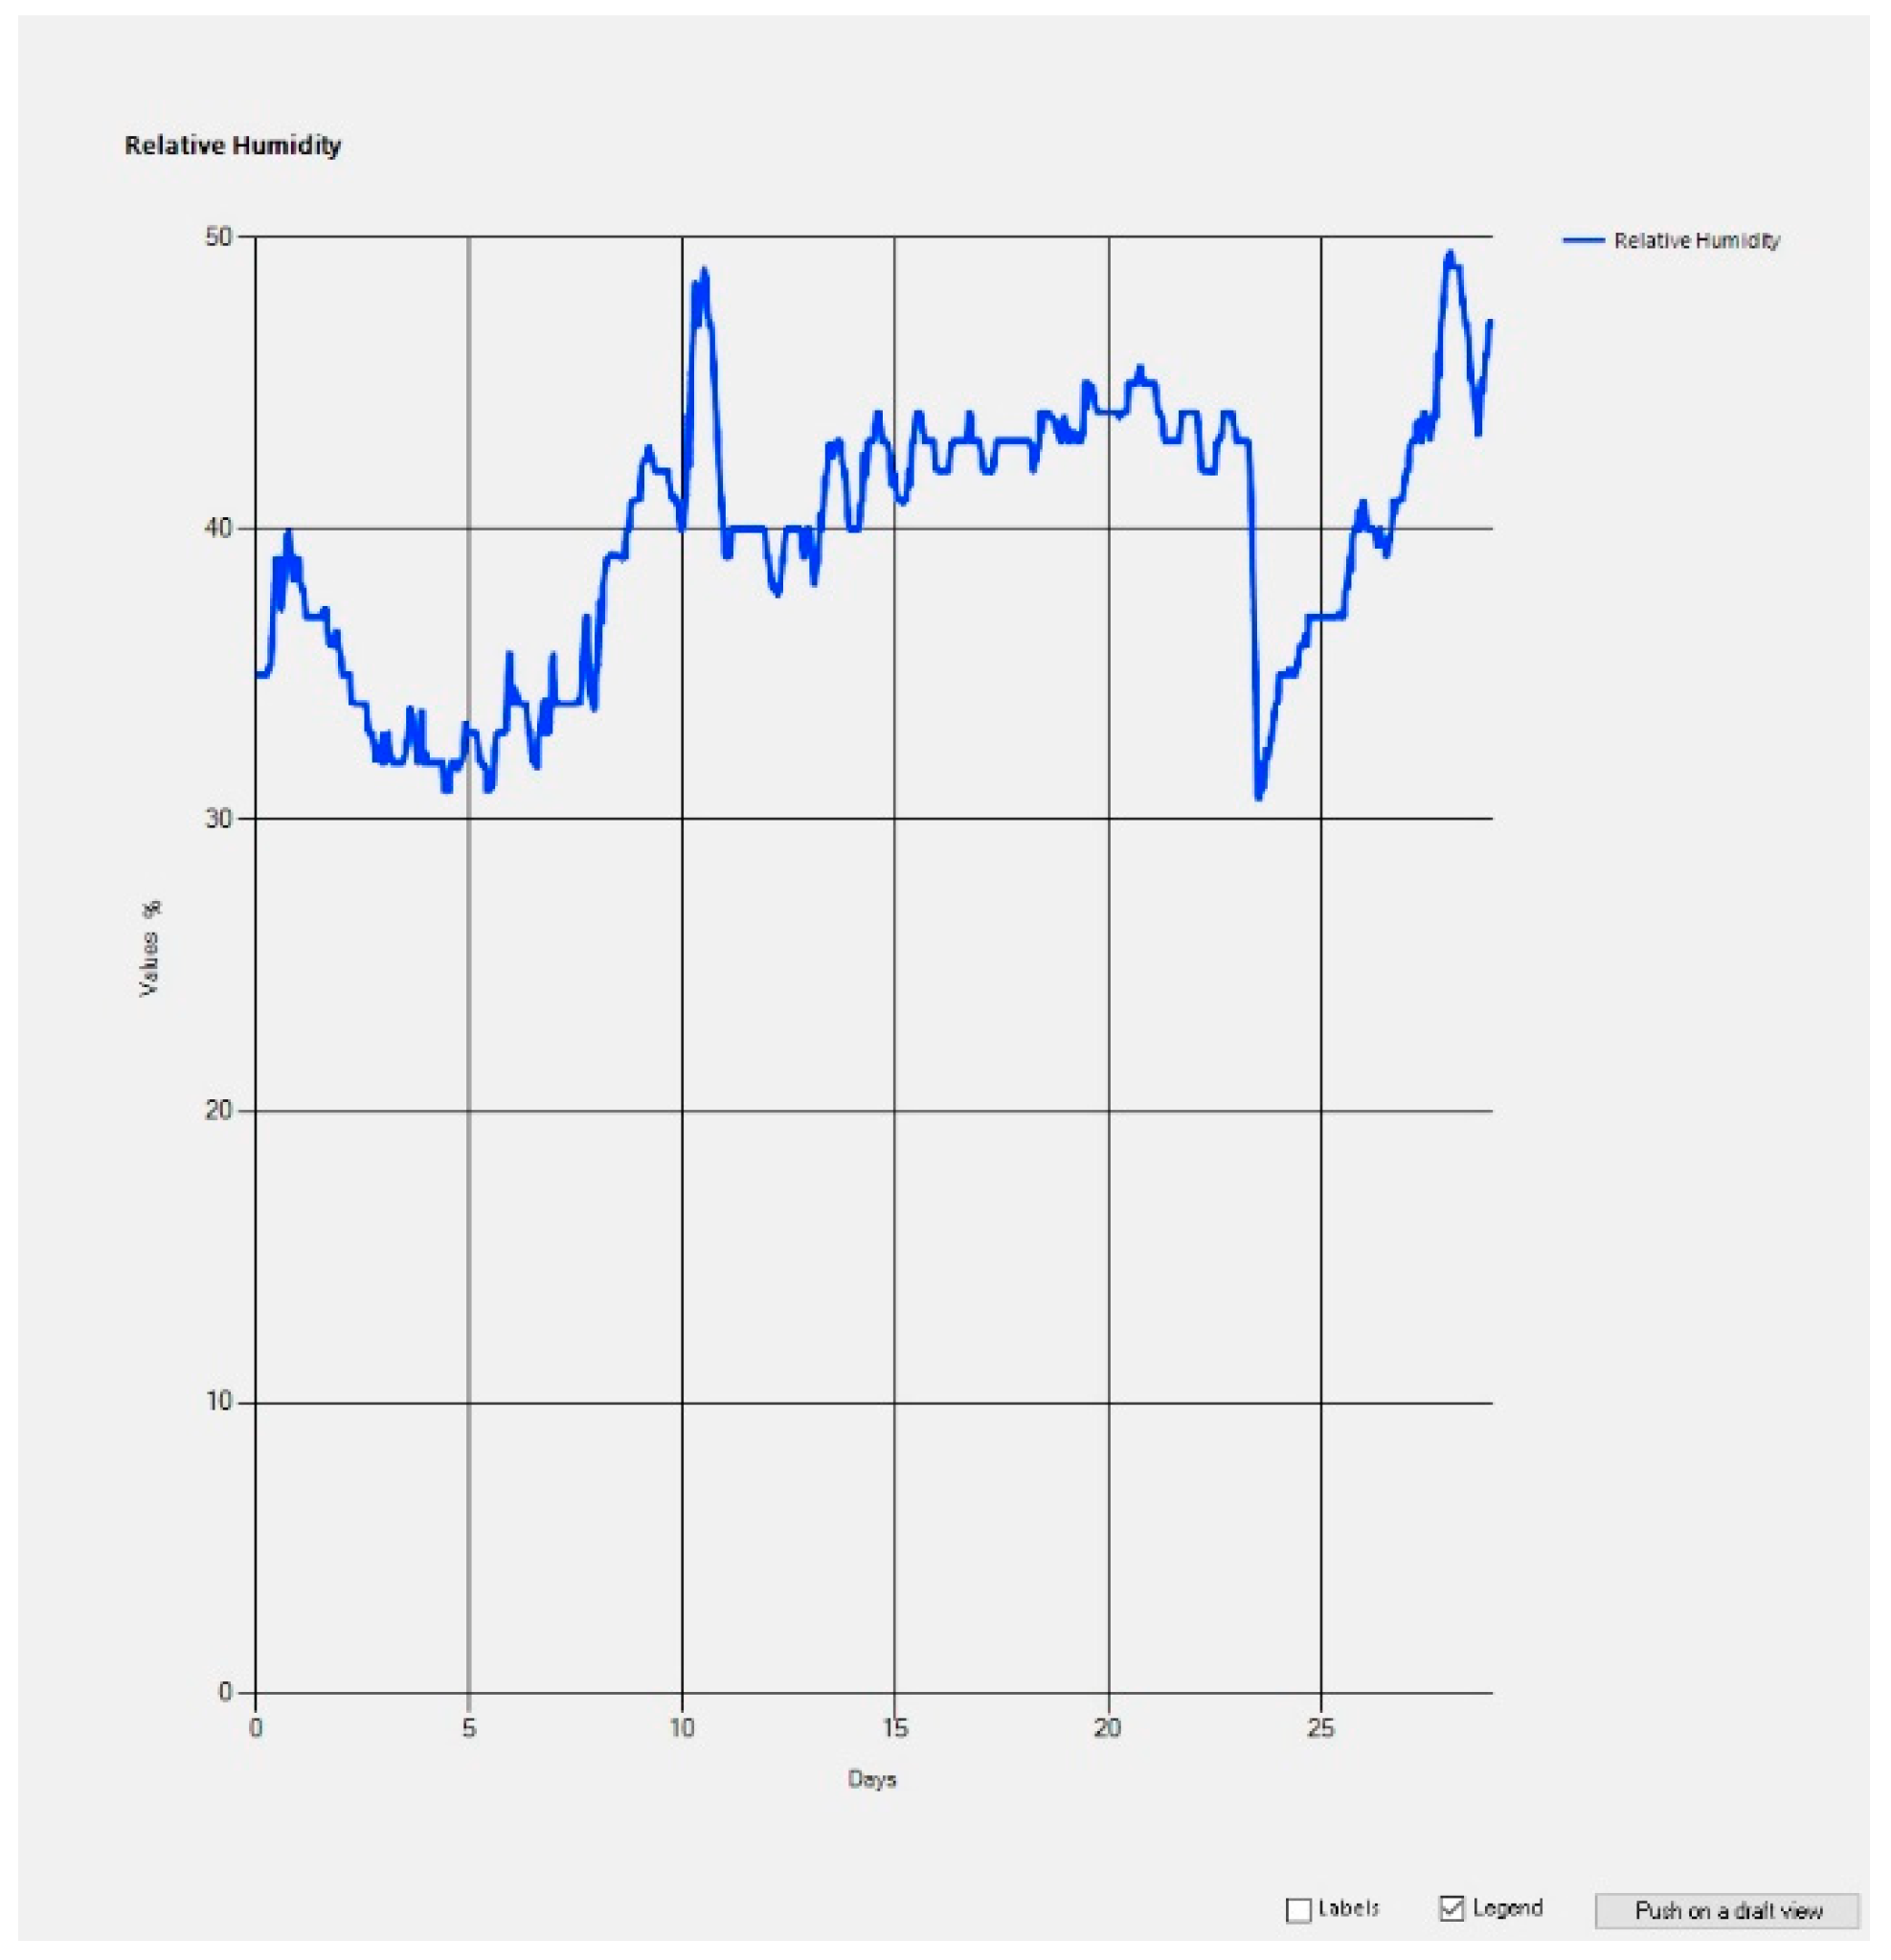
The second graph is related to relative humidity registered during the summer period (
Figure 15). The values are generally between 40 and 50%, which are considered within comfort limits. Only during the first days does it reach values lower than 40%, getting near the 30% prescribed limit [
32]. Considering the absence of humidity control in the Air Conditioning (AC) system, the values can be considered entirely acceptable.
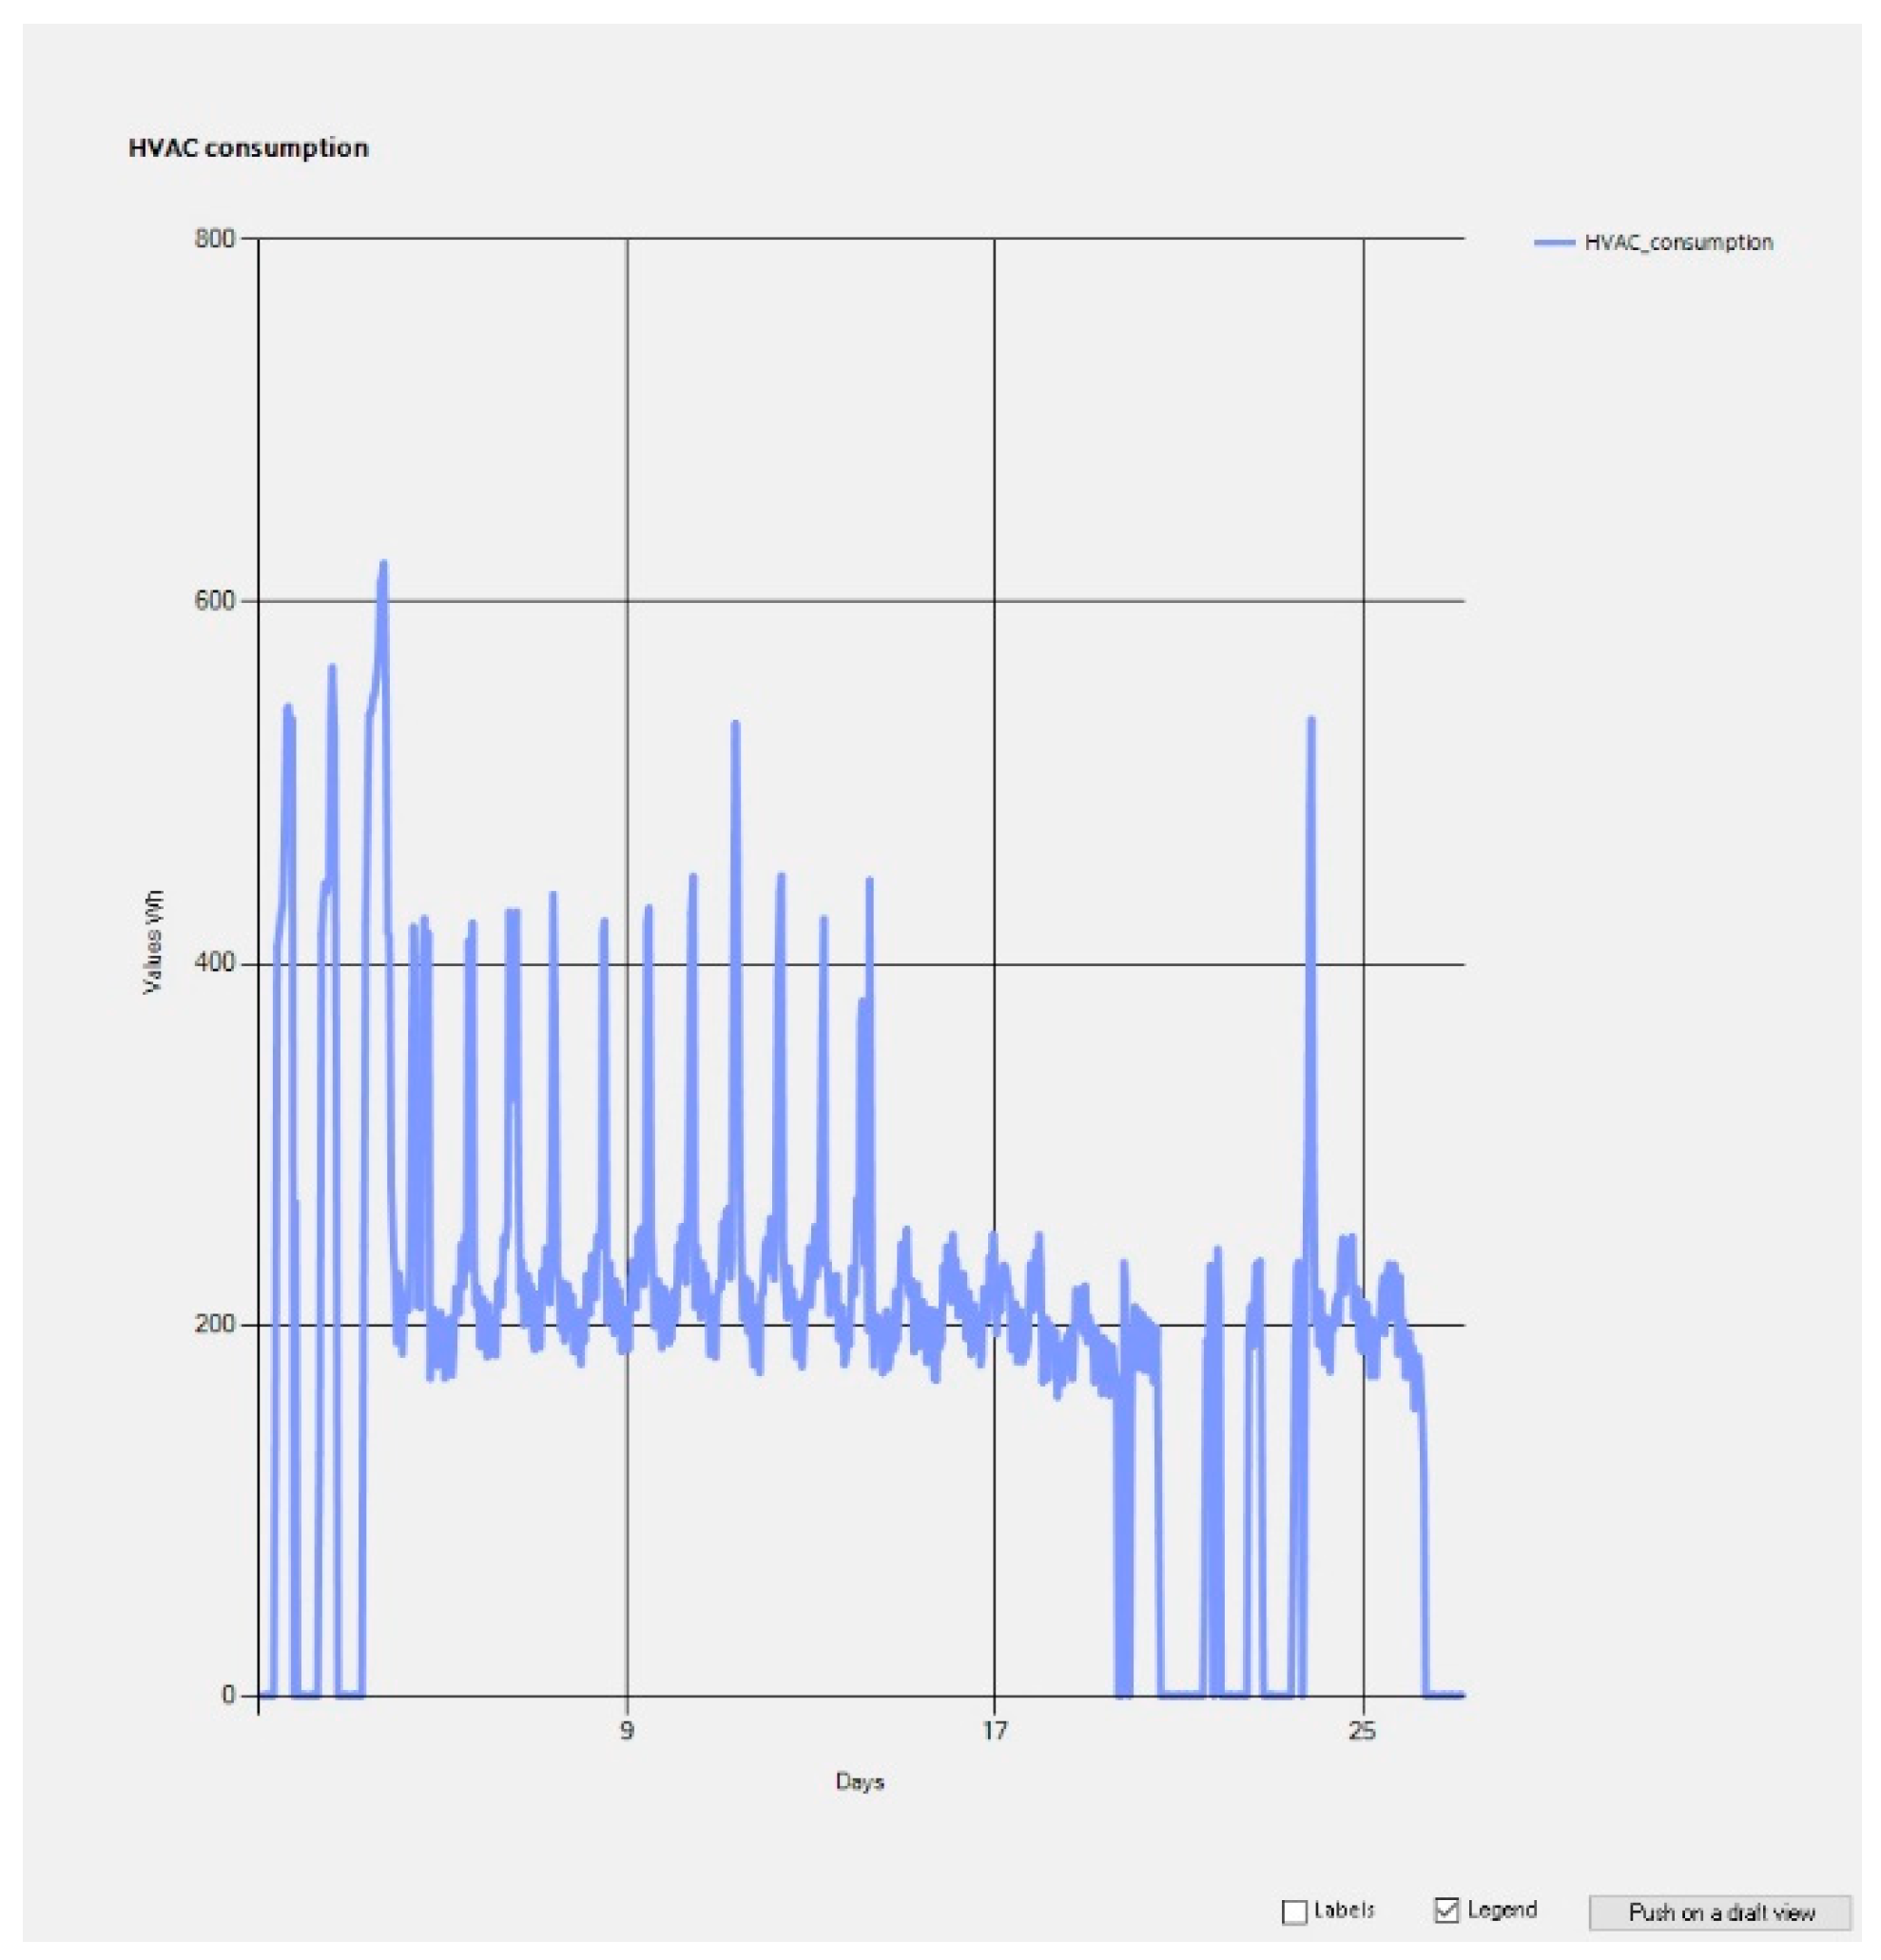
The following graph (
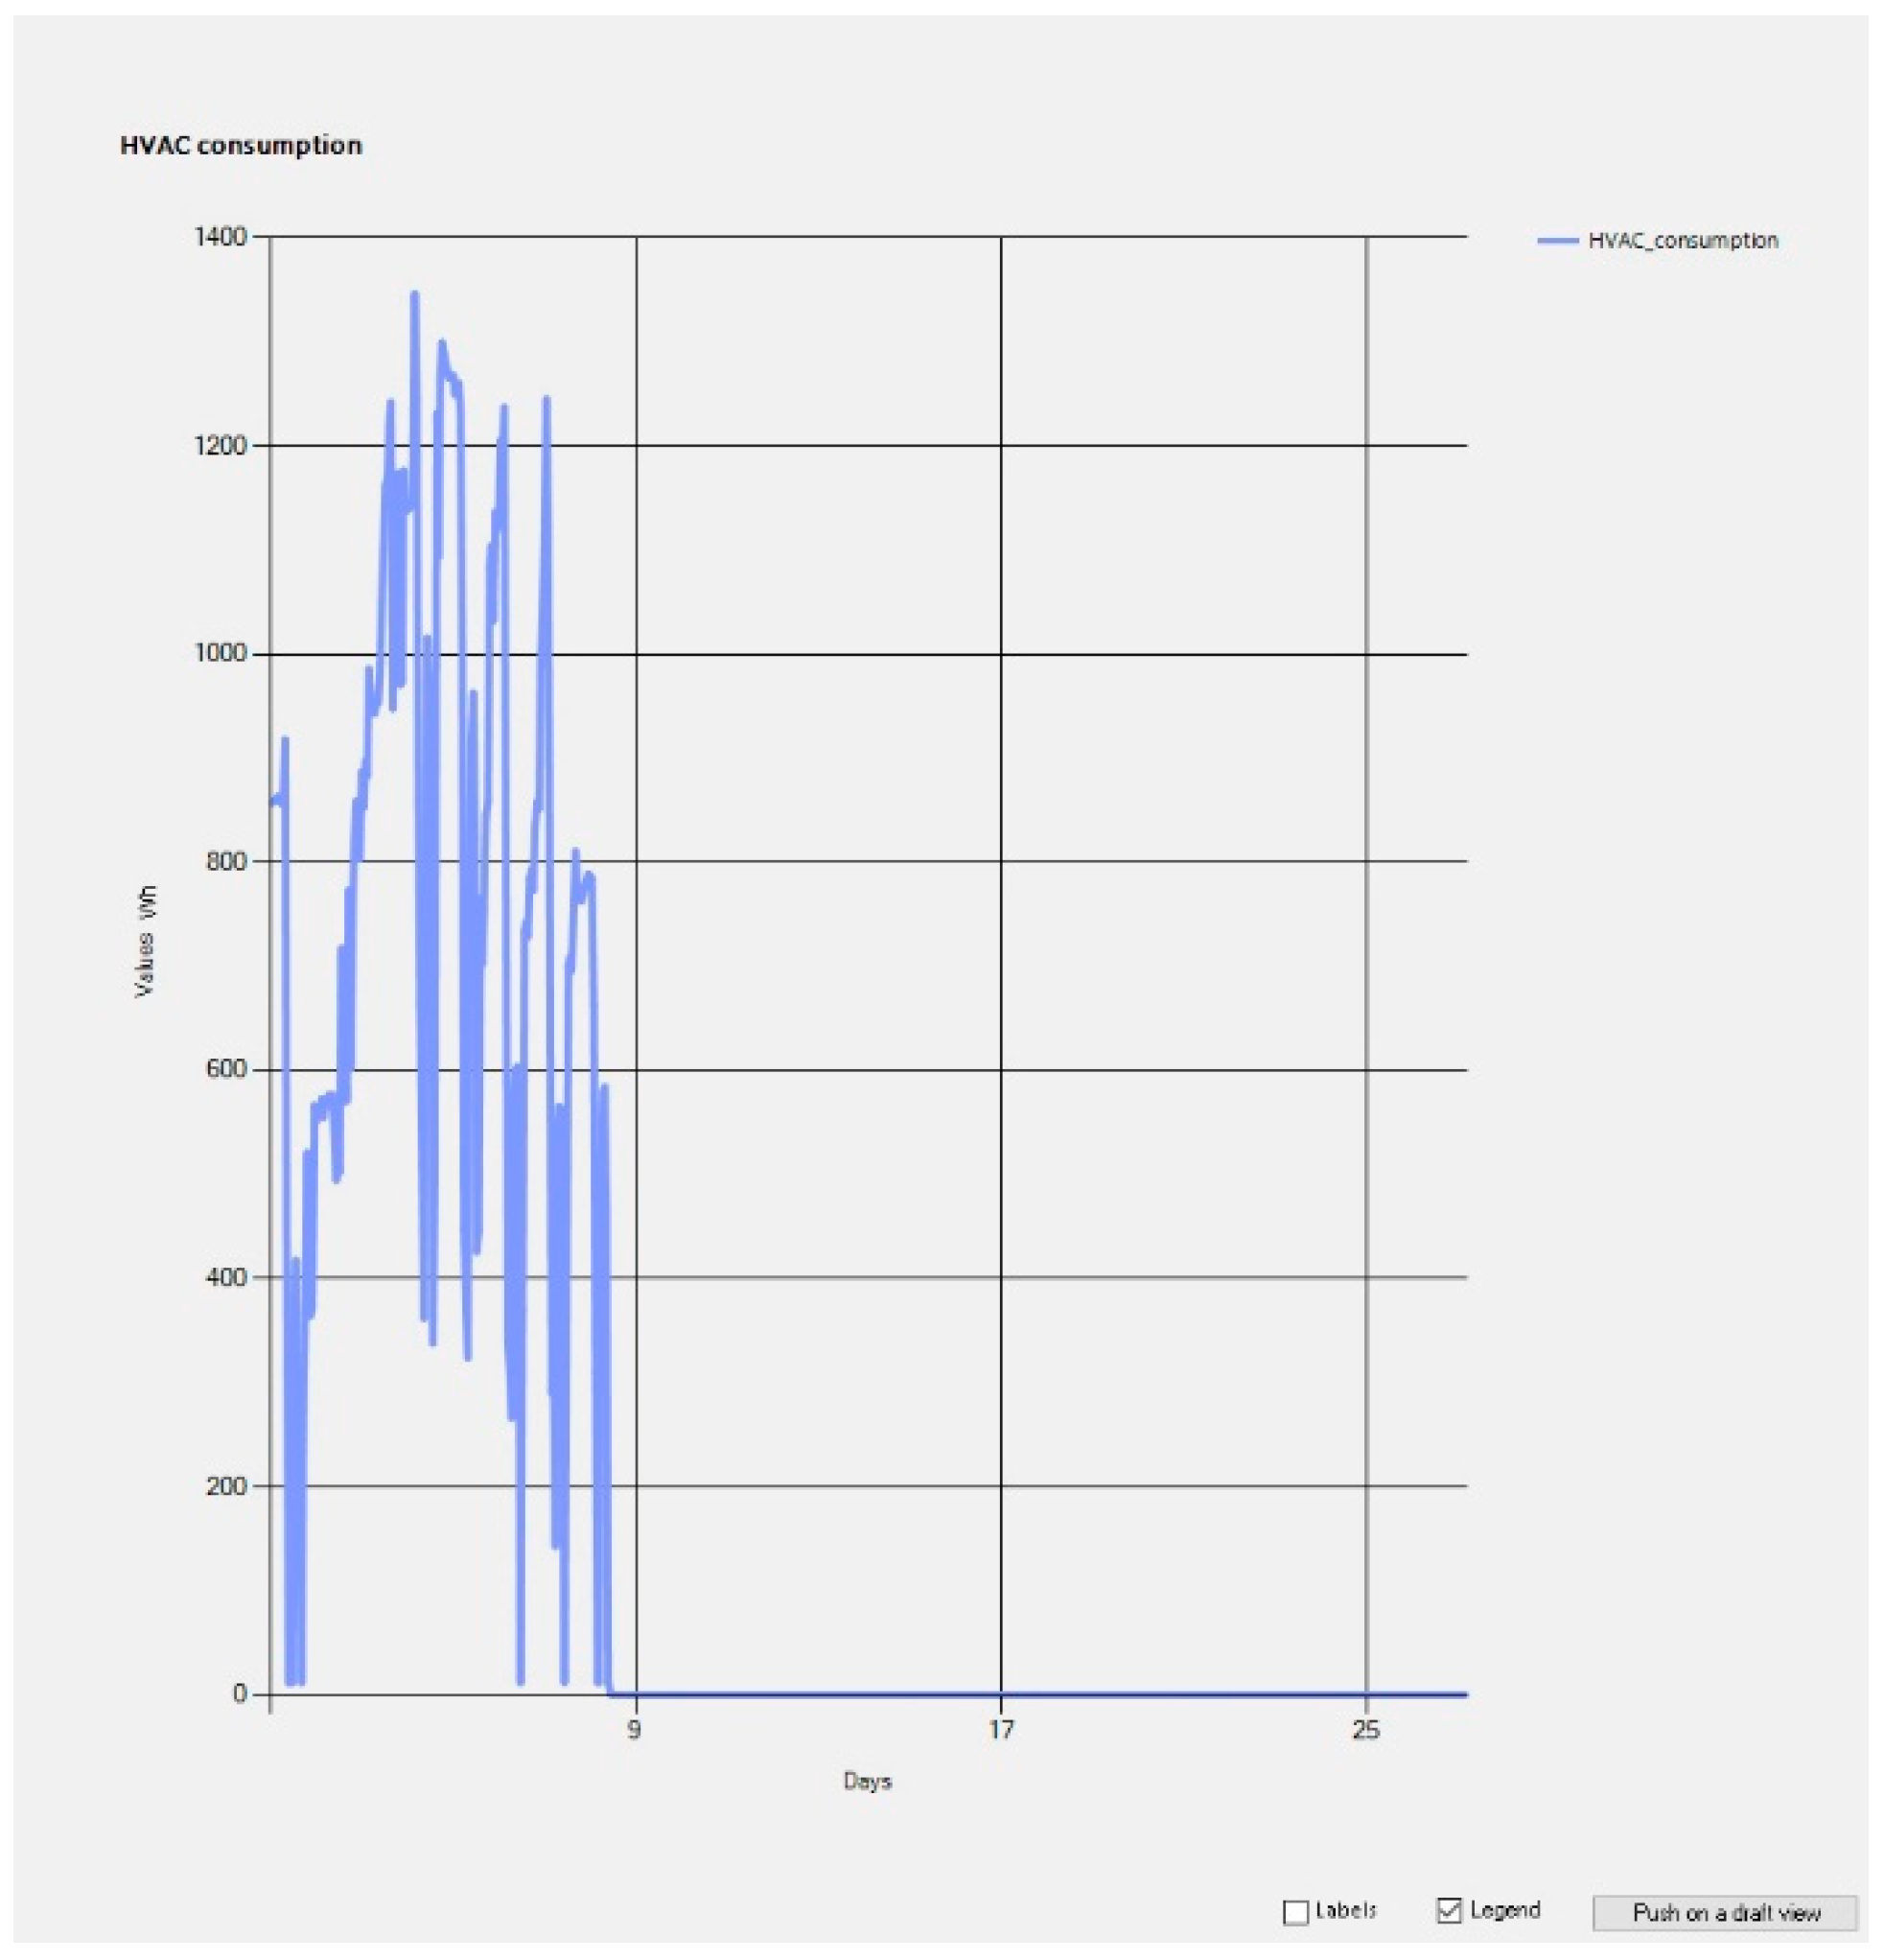
Figure 16) is related to electrical consumption of the mono-split air conditioning unit registered during the summer period.
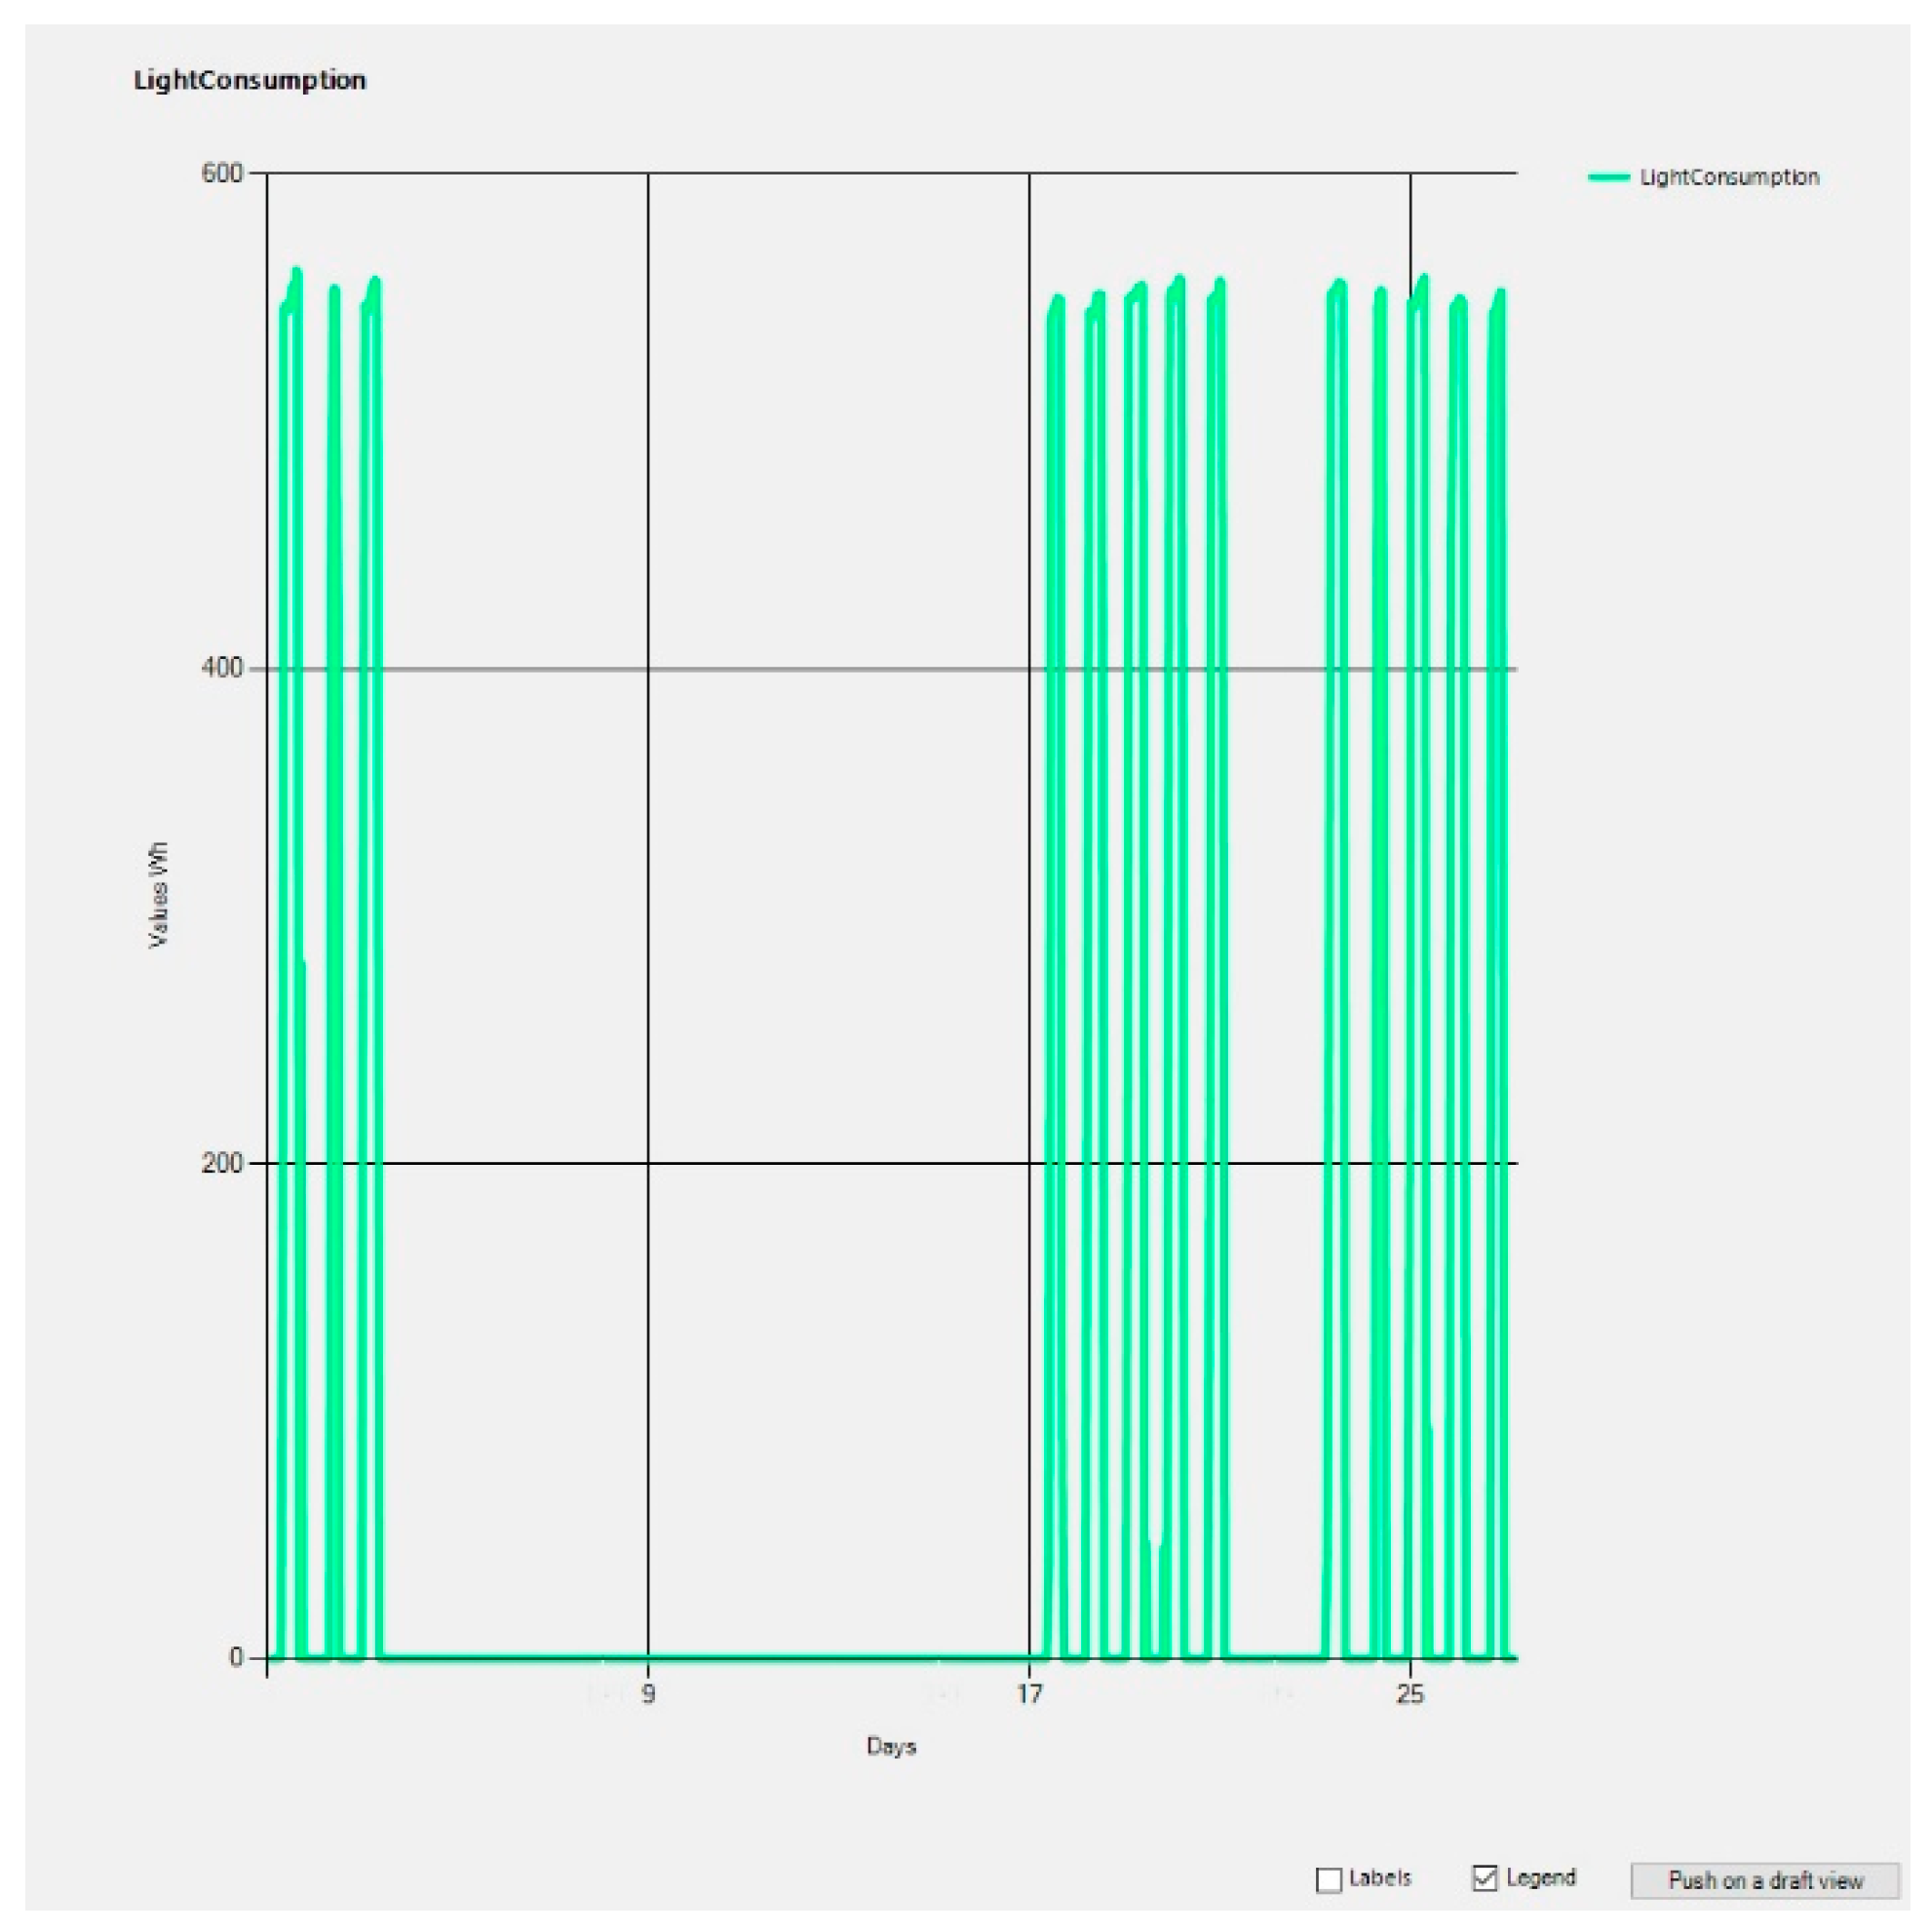
It is interesting associating these graphs with the Heating, Ventilation and Air Conditioning (HVAC) system energy consumption. During the first three days, the unit is switched on at the beginning of a workday and off at the end. It is then kept operating continuously until the 20th of the month, even if all these days are usually holidays and consequently the room is likely unoccupied. It corresponds to the trend of indoor temperature that is nearly constant in the same period. It means that air conditioning is kept working even if no one is in the room, with a probable waste of energy.
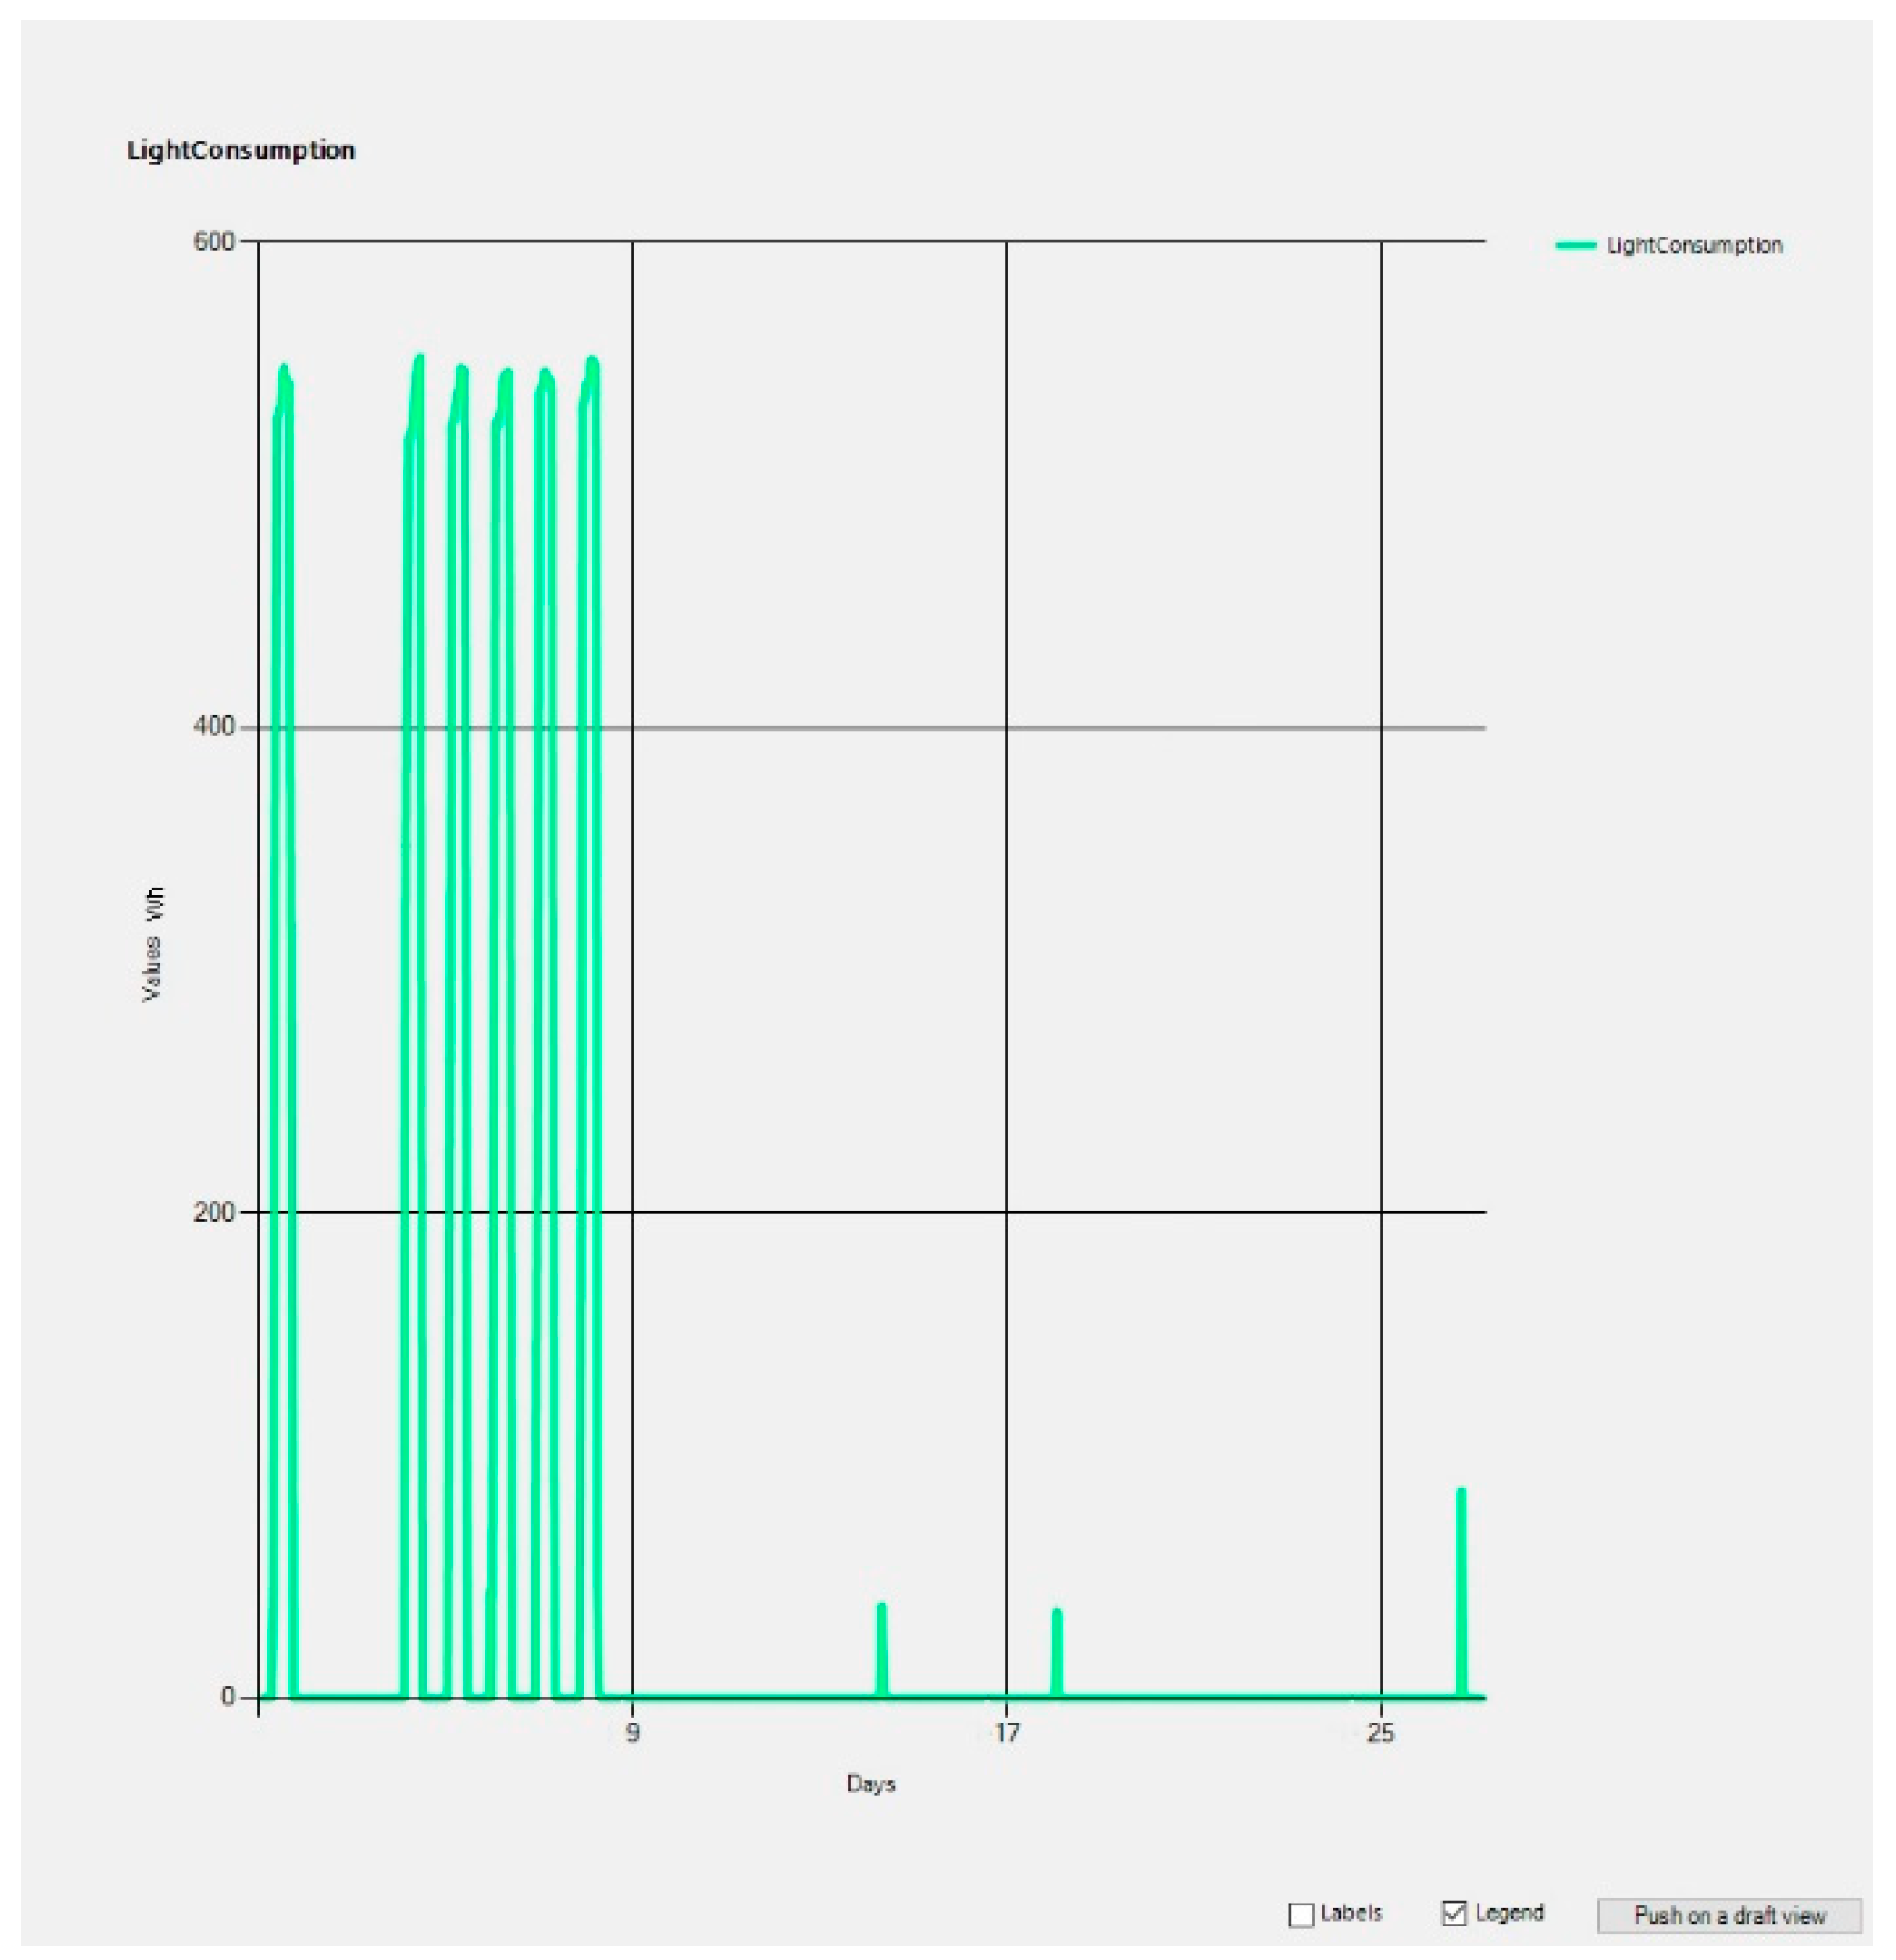
The previous assumption is confirmed by the data on electrical lighting consumptions (
Figure 17). From 3rd to 17th, these are null, indicating the absence of users.
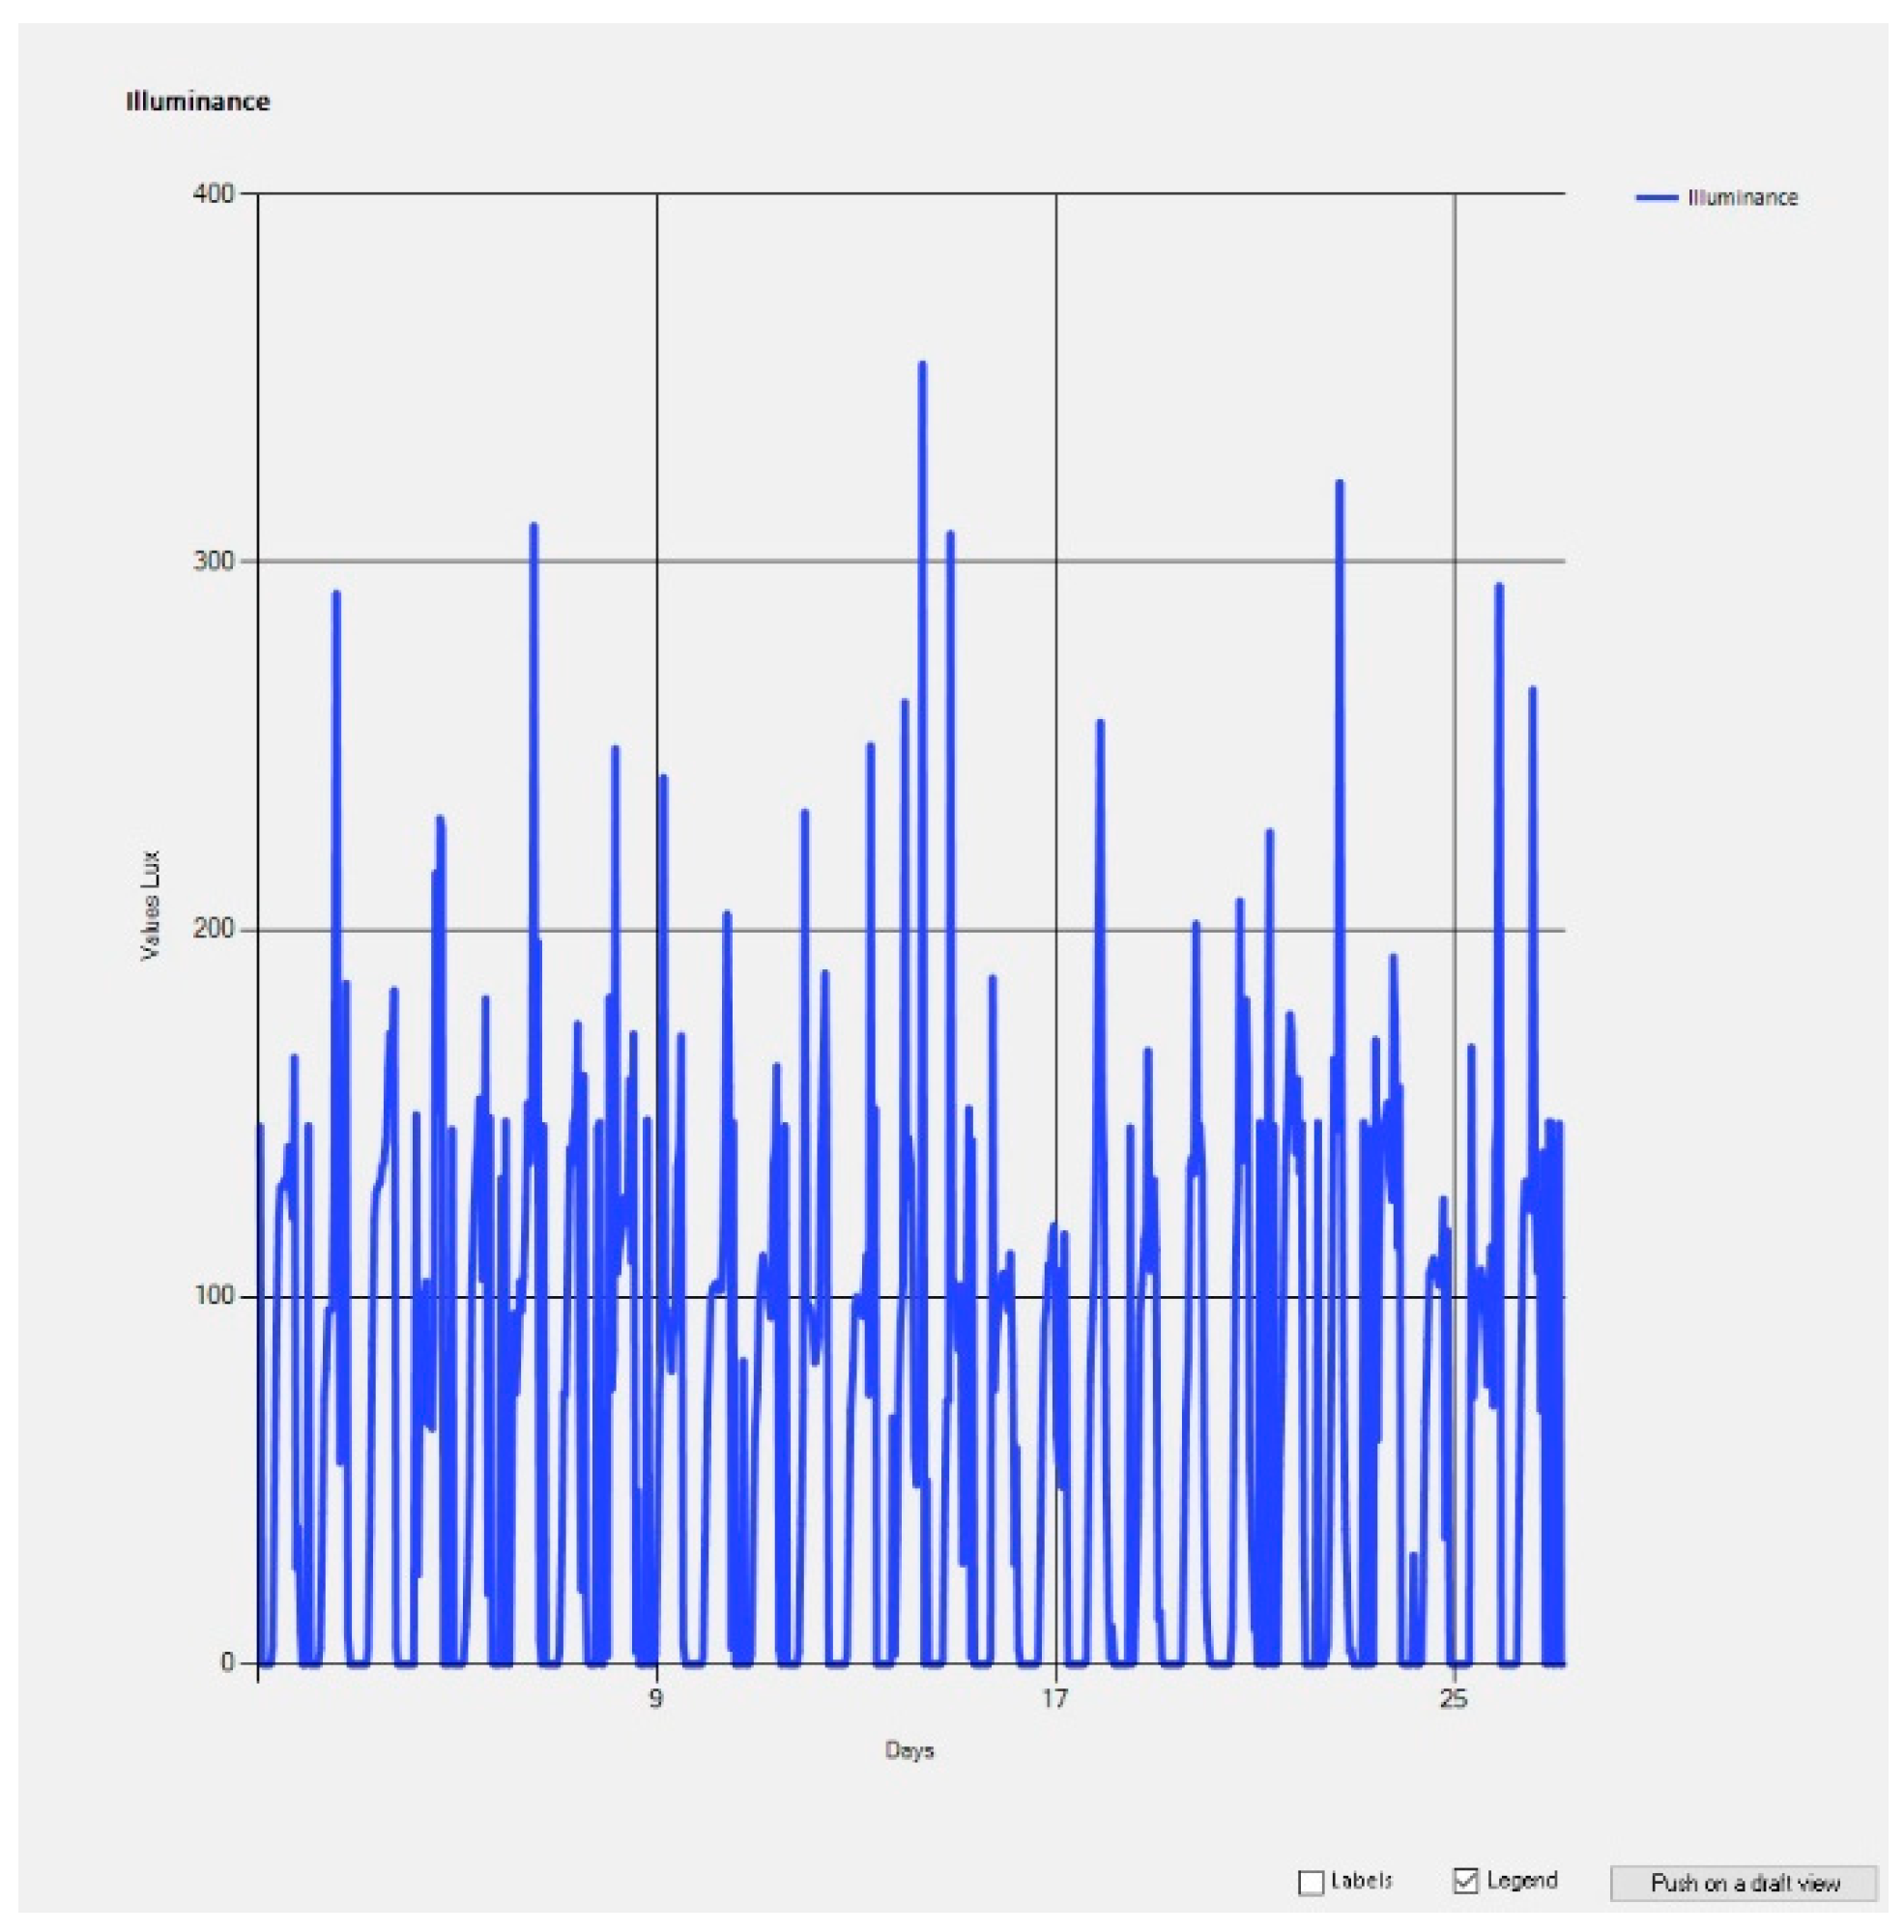
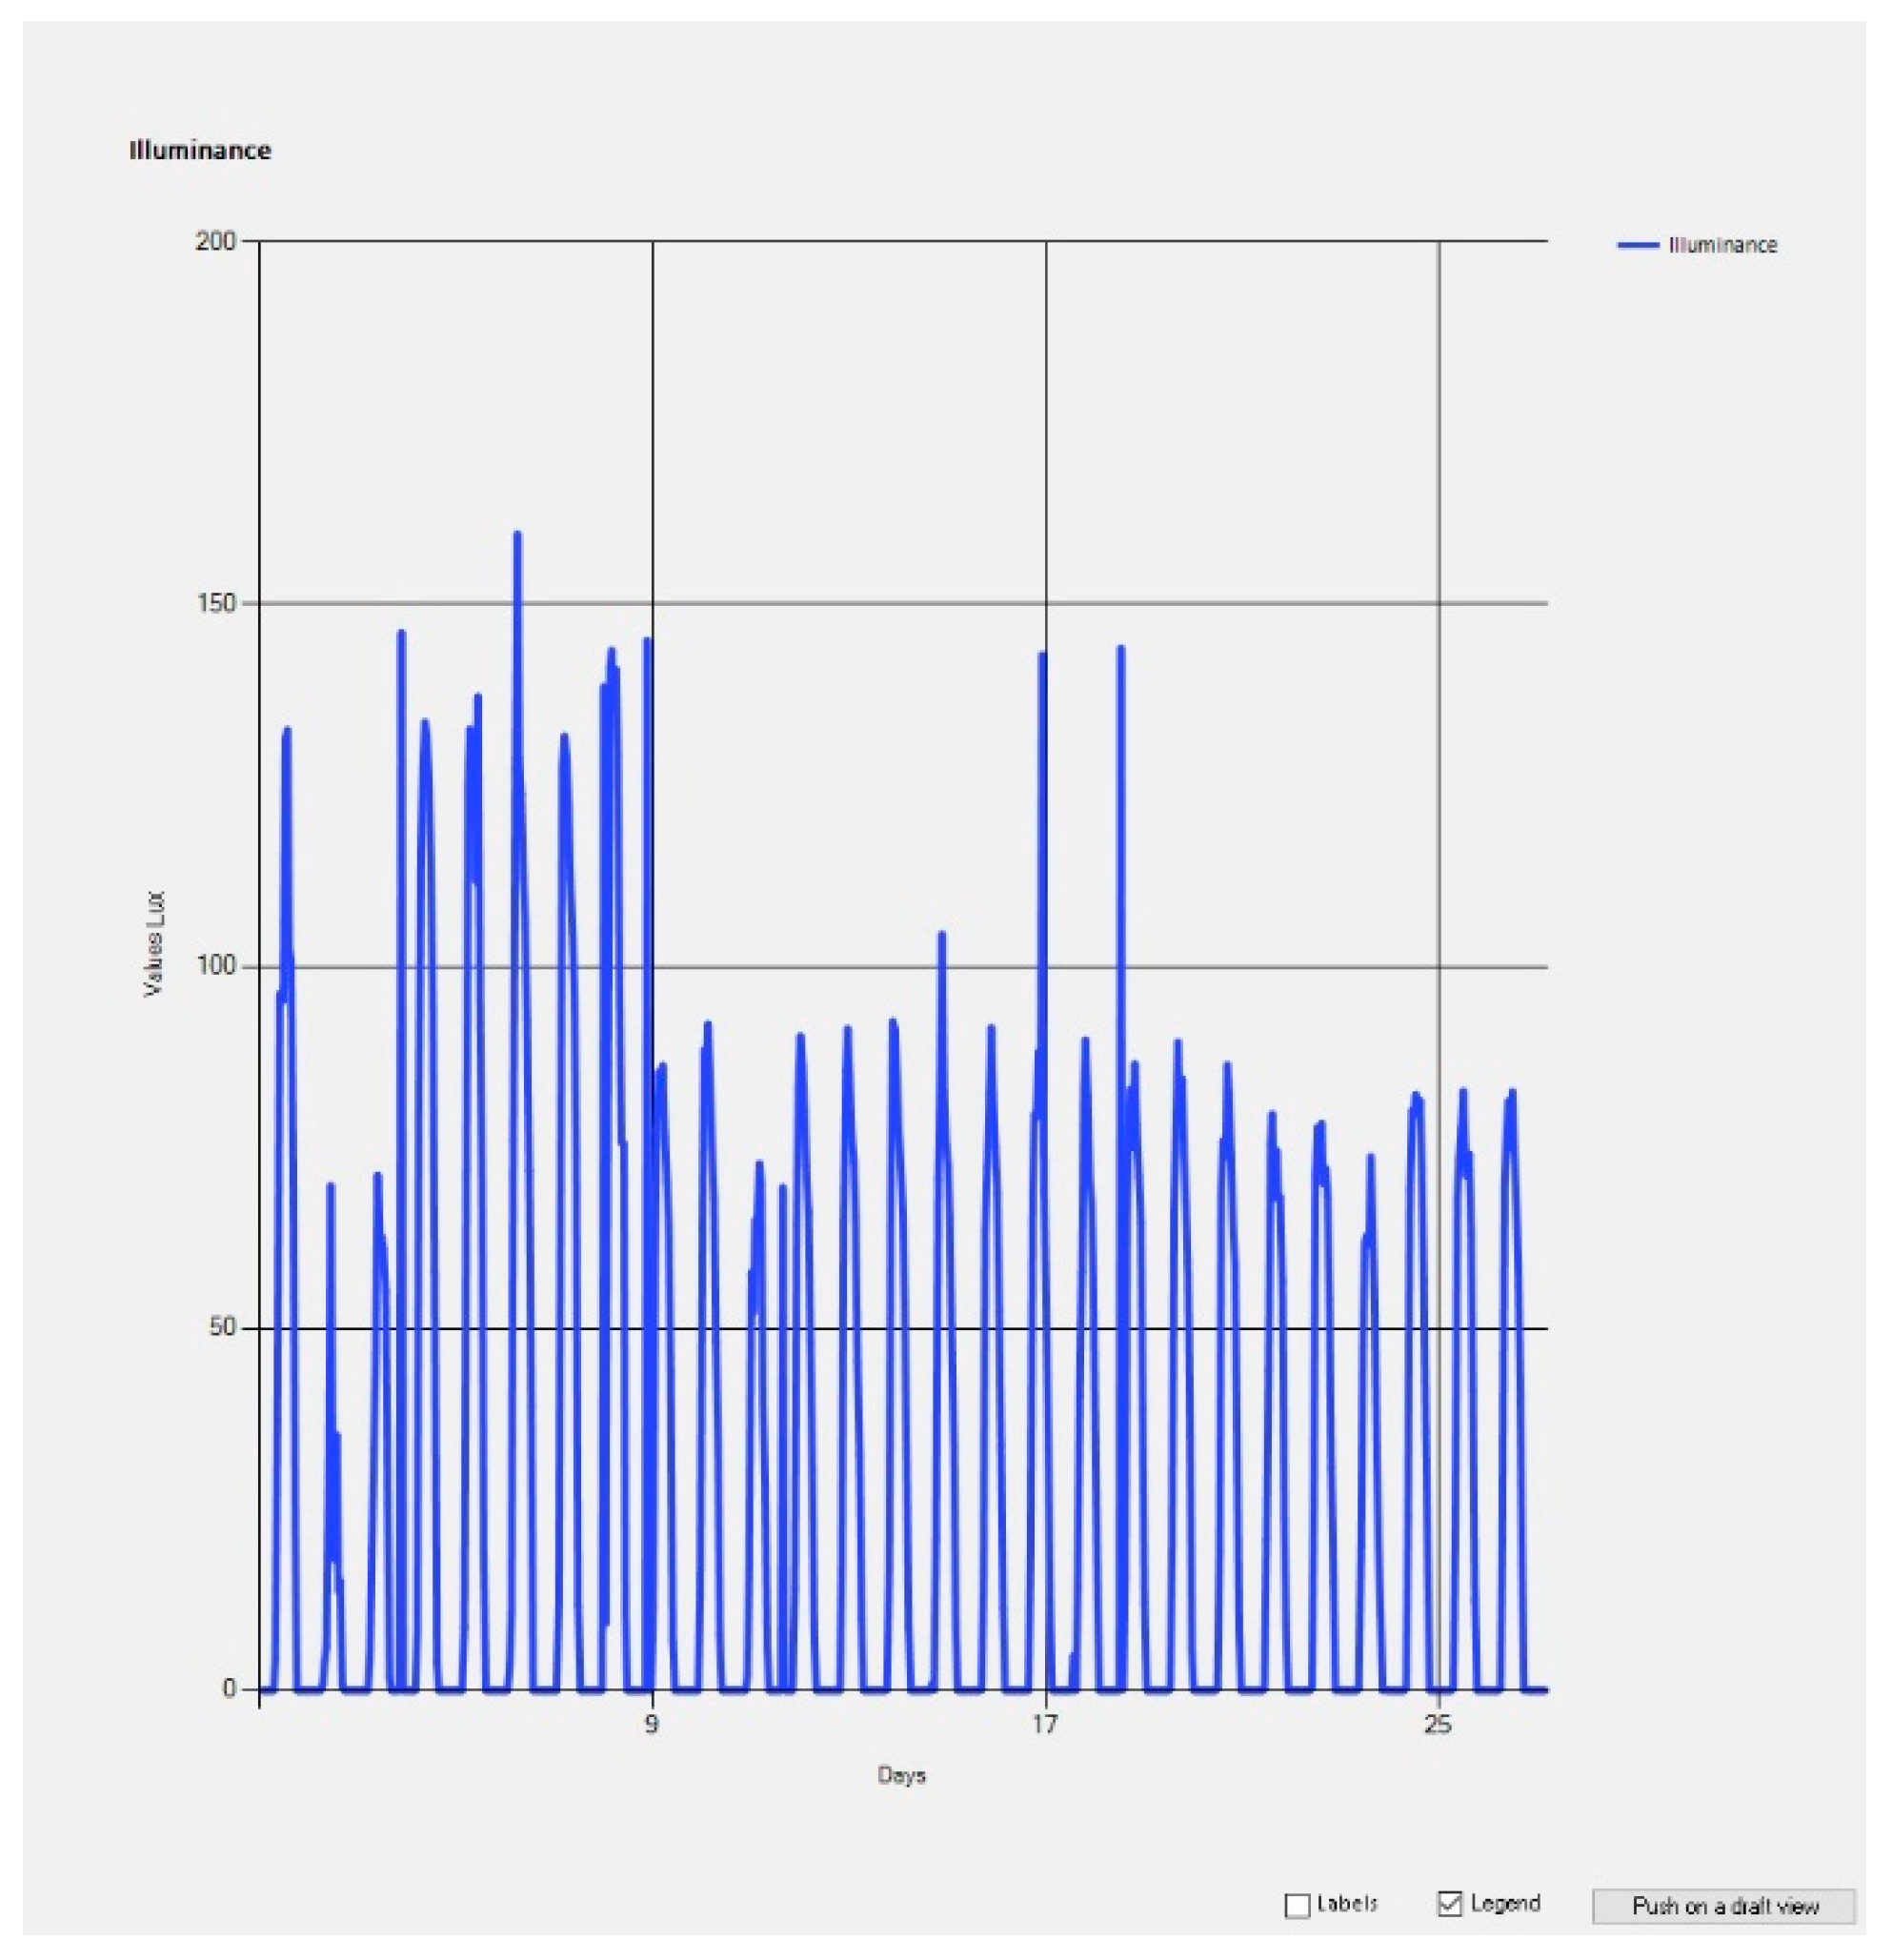
The illuminance values are illustrated in
Figure 18. They are always below 300 lux, far from acceptable limit of 500 required for office workstations [
33]. The comparison with lighting consumptions shows that even when the lights are on, the values are not different from the unoccupied period, proving to be scarcely effective. Thus, a quick analysis of data can reveal some critical issues in the room lighting system.
The temperature data from February 2019 (
Figure 19) show an evident decrease during the 8th day. After that, the temperature ranges between 10 and 18 °C, clearly under comfort conditions. It is probably due to an extended period of the room inoccupation. It must be said that during the occupation period, the temperature reaches 25 °C, too hot for a winter comfort condition. It highlights an excessive use of the mono-split air conditioner in heating mode.
The data from relative humidity (RH) sensor show that during the heating period RH is kept between 30 and 40% (
Figure 20). Even if slightly low, they are still in comfort range. When heating is off, RH rises to 50%, a more acceptable value. It means that the mono-split system is not able to control RH and when on, it tends to dry the room air.
Figure 21 illustrates the electrical consumption of the mono-split unit in heating mode. The room is unoccupied for most of the month, as inferred from the analysis of temperature data. The mono-split unit consumes more-or-less than twice the energy required for cooling (
Figure 16). During the inoccupation period, the system is correctly switched off, unlike August. In the very first days of February, however, only once are the consumptions null. It highlights that during some nights the heating was left on, consequently wasting energy.
The lighting system consumption (
Figure 22) highlights that during the 2nd and 3rd days the room was likely unused. It substantiates the heating energy waste described above.
The illuminance data (
Figure 23) confirm the lighting system’s inefficiency, also shown by the summer values. In this case, the contribution of artificial lights is more evident, due to the lack of natural illumination, but insufficient. When the system is off, illuminance is about 100 lux. When it is on, illuminance increases but reaches a maximum of 150 lux, which is critical if compared with minimum requirements.
This quick overview of some graphic examples shows how the procedure and the instrument created can provide effective information on the use profile of the building spaces and on the energy required for their heating, air conditioning and lighting. The association of data to the building information model allows for an unmistakable identification of monitored values within the rooms referred to. Moreover, the use of automatic routines within the model allow operators not skilled in monitoring devices (such as designers, maintenance technicians etc.) to have access to data that are crucial to plan renovation, retrofit or simply maintenance work.
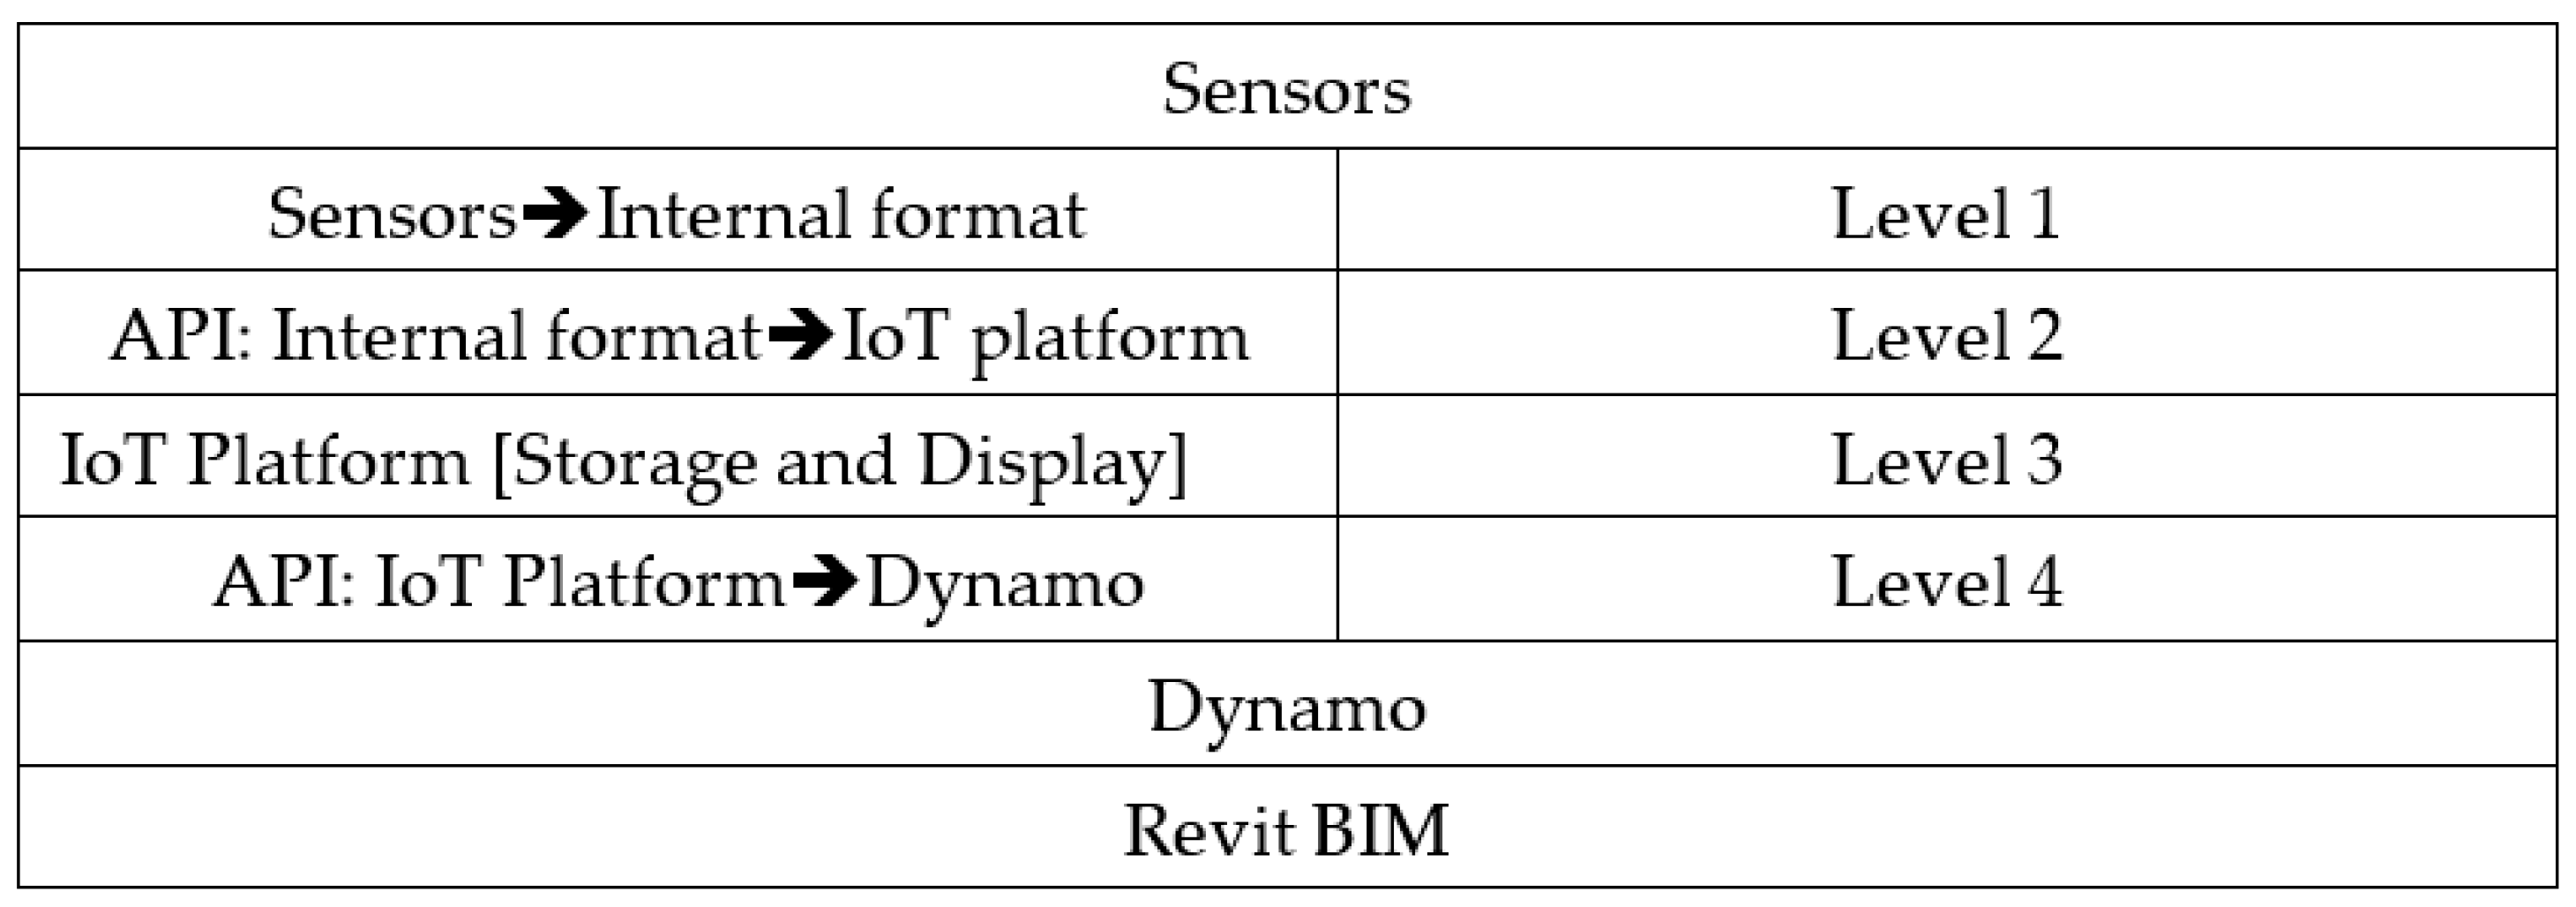
The experimentation phase conducted made it possible to define the framework represented in
Figure 24. This framework is organized into four levels. Level 1 provides a service for converting the expected formats of the sensors to a data representation (Internal format) compatible with the adjacent level. Level 2 provides the APIs to convert the internal data format into a format compatible with the IoT platform, and transfers them to the latter (Level 3), which manages data storage and display. Level 4 defines the APIs from the IoT platform to Dynamo for the visualization of the data in the BIM models created with Revit.
The authors are aware that research/experimentation activities conducted on a single case study often lead to intrinsically limited results/solutions that are difficult to generalize. However, the work carried out was aimed at structuring a workflow and a framework applicable to a wide range of existing buildings of historical–architectural value for monitoring indoor comfort and energy consumption. The workflow and framework developed are not related to the type of sensor chosen, and they can be used for monitoring a wide range of buildings. In our case, the choice fell on WiDom sensors that are manufactured by a Sardinian company specializing in products and solutions for home automation. We opted for the WiDom sensor that reveals, when compared to the others analyzed, an interesting feature in terms of size. In fact, its small dimension allows an easy “integration setting” of the sensor, even in particular environments such as historic buildings with architectural constraints. The workflow does not require deep modeling of the sensor; definition of the shared parameters within the BIM tool allows us to associate the data coming from the sensors directly to the family of Revit “rooms”, which digitally represent the real sensorized environments. The use of “rooms” objects for the representation in the BIM model of the data from the sensors makes the system independent of the monitored building and the type and brand of the sensors used. “Rooms” are Revit system families that require the same creation and insertion procedure for any building.
The platform used for the collection and organization of sensor data is open source and can be used with a wide range of sensors for monitoring activity.
Finally, the workflow and the framework developed include the use of Dynamo, which is an open source visual programming application. The Dynamo script created allows for creating a bridge between the BIM model of the building and the Thing Board platform. It links the data coming from the sensors and collected in the Thing Board with the “rooms” objects of the Revit model. It follows that the script developed is totally independent of the specific building and the type of sensor chosen.
Finally, a very interesting aspect of the work consists in the fact that the Dynamo script developed for monitoring indoor comfort data and energy consumption can be easily shared through the Dynamo platform. Sharing can take place by publishing on a company server or by publishing on the network. In the first case, the script can be shared within a specific company that must monitor and manage all of its real estate assets; in the second case, the spread on the network allows the use of the script by external users who have the same needs for monitoring buildings.
The aspect that represents a constraint to the workflow and to the structured framework is linked to the need to use the BIM Revit Autodesk commercial tool. The latter is fundamental for its ability to interface effectively with Dynamo and for its great flexibility in data management.
To conclude, although the workflow and the framework presented in this paper refer to a specific building, the Mandolesi pavilion, they have been developed with a strong focus on the flexibility of application.
4. Conclusions and Future Work
The adoption of Building Information Modeling methodology on renovation and retrofitting projects can provide a great support but is still at a basic level [
34]. Despite the urgent need to improve the quality and the functionality of the existing building stock, all the processes related to its transformation are still carried out with traditional analogical methods and instruments. The main cause is that an efficient application of BIM methodology needs to overcome a number of critical issues, such as the identification of necessary information for retrofitting, the collection and proper interpretation of monitored data, the handling of uncertainty and the long time and high resources required for creation of the model of an existing building [
35]. The energy audit is the process aimed at understanding the use of energy inside the building and the user profiles and the construction and material characteristics that affect its use. This leads to the conclusion that the energy audit must be an essential part of a knowledge process aimed at promoting redevelopment actions on the existing building stock. This complex process focuses on the collection and evaluation of data and information relating to different areas of competence. The structuring and organization of what has been collected is fundamental to define the most suitable retrofit scenarios. To this end, the use of the Building Information Modeling methodology was successful, which, in the context of the research project PRELuDE
3 [
8], has allowed an effective capitalization and structuring of many information sets aimed at defining the actual building configuration. To achieve knowledge in terms of energy consumption and internal comfort conditions, it was necessary to associate a capillary network of monitoring sensors with the BIM methodology and tools.
This paper presents an approach for the integration of the IoT sensors and the BIM process to provide a common data platform for the visualization of building indoor conditions (e.g., temperature, luminance etc.) and of energy consumption parameters that would enable facility operators to obtain important information. Integration of IoT sensors with the Revit model utilizing Dynamo and a specific API is an easy and straightforward approach that can provide building managers with real-time information about the energy consumption and the indoor conditions of the buildings, but it also allows for viewing the historical sensor data table and creating graphical historical sensor data. Nevertheless, this approach is limited in that it only provides 2D data visualization, which makes it difficult to perceive the areas surrounding the space of interest.
Future research will include the development of a 3D visualization of the parameters to rapidly identify the problematic areas of a building. The use of color scheme will help to highlight building areas where comfort conditions (both thermohygrometric and lighting) are not met or overcome for an unacceptable amount of time, and where a misuse or excess of energy consumption is discovered by the sensor. It will be of more help for building engineers and designers or maintenance operators to reach a better knowledge of an existing building to assure its best operative status or plan for suitable interventions to achieve it.


 ,
, 


