Article

Life Cycle Assessment of Electric Vehicles and Hydrogen Fuel Cell Vehicles Using the GREET Model—A Comparative Study

1
Department of Supply Chain and Information Management, School of Decision Sciences, The Hang Seng University of Hong Kong, Hong Kong, China
2
Department of Construction Technology and Engineering, Faculty of Science and Technology, Technology and Higher Institute of Hong Kong (THEi), Hong Kong, China
3
Department of Design, Faculty of Design and Environment, Technology and Higher Institute of Hong Kong (THEi), Hong Kong, China
*
Author to whom correspondence should be addressed.
Sustainability 2021, 13(9), 4872; https://0-doi-org.brum.beds.ac.uk/10.3390/su13094872
Submission received: 31 January 2021 / Revised: 14 April 2021 / Accepted: 22 April 2021 / Published: 26 April 2021

Abstract

:
Facing global warming and recent bans on the use of diesel in vehicles, there is a growing need to develop vehicles powered by renewable energy sources to mitigate greenhouse gas and pollutant emissions. Among the various forms of non-fossil energy for vehicles, hydrogen fuel is emerging as a promising way to combat global warming. To date, most studies on vehicle carbon emissions have focused on diesel and electric vehicles (EVs). Emission assessment methodologies are usually developed for fast-moving consumer goods (FMCG) which are non-durable household goods such as packaged foods, beverages, and toiletries instead of vehicle products. There is an increase in the number of articles addressing the product carbon footprint (PCF) of hydrogen fuel cell vehicles in the recent years, while relatively little research focuses on both vehicle PCF and fuel cycle. Zero-emission vehicles initiative has also brought the importance of investigating the emission throughout the fuel cycle of hydrogen fuel cell and its environmental impact. To address these gaps, this study uses the life-cycle assessment (LCA) process of GREET (greenhouse gases, regulated emissions, and energy use in transportation) to compare the PCF of an EV (Tesla Model 3) and a hydrogen fuel cell car (Toyota MIRAI). According to the GREET results, the fuel cycle contributes significantly to the PCF of both vehicles. The findings also reveal the need for greater transparency in the disclosure of relevant information on the PCF methodology adopted by vehicle manufacturers to enable comparison of their vehicles’ emissions. Future work will include examining the best practices of PCF reporting for vehicles powered by renewable energy sources as well as examining the carbon footprints of hydrogen production technologies based on different methodologies.

1. Introduction

The need for sustainable low-carbon transport and logistics has become a top priority of many countries since emission targets were set at the Conference of Parties to the United Nations Framework Convention on Climate Change (COP21). Several countries have enacted policies to ban new petrol and diesel cars by 2030 or 2040 [1,2,3]. Carbon mitigation in transport and logistics was emphasized at the recent World Economic Forum because this sector is the world’s second-largest carbon emitter, growing from 22% of global carbon emissions in 2011 to 23% in 2015 [4,5]. Thus, exploring the use of renewable energy for major vehicles and mitigating vehicle emissions are critical for sustaining a long-term decarbonization strategy for a smart city with low-carbon transport and logistics [6,7].
The measurement of vehicular carbon emissions is a growing research focus. Global, national, and corporate studies have indicated the necessity of analyzing carbon emissions at the product level. In achieving zero emission low-carbon transport and banning of new petrol and diesel cars, analysis on vehicular carbon emissions is a growing research focus, in particular at a product level. Previous analyses of product carbon footprints (PCFs) have mainly focused on fast-moving consumer goods, such as computers, groceries, and textile products. In contrast, there is a lack of research on complex automotive products, which feature large numbers of components, complex operational processes, and globalized manufacturing and car-parts assembly [8,9]. In assessing the total carbon footprint of a vehicle, the availability of information is a critical aspect potentially hampering the completeness of emission inventory. These availability of data in the emission from peripheral and supporting activities as well as assembly would affect the accuracy when assessing the total carbon footprint using life-cycle assessment (LCA) and PCF [10,11,12].
In evaluating the carbon emission of a product, basic principles and framework for product LCA could be found in an international standard ISO14040 while ISO14067 provides a standard with guidelines and criteria in quantifying, monitoring, reporting, and verifying carbon footprint of a product. Publicly available specification (PAS) 2050 is the first CF accounting protocol at a product level. GHG protocol product standard (GHG protocol) was established later on based on ISO standards and PAS 2050. ISO14040 focuses on LCA while ISO14067, GHG protocol, and PAS2050 specifies on product carbon footprint. ISO14067 provides guidelines for organisational and product levels [13]. The organisational-level ISO14067 method lacks a process-oriented approach for product-level evaluation. In addition to the cradle-to-gate processes of metal working and forming, painting and coating, assembly and testing, and shipping and distribution, other subsequent processes—such as consumer usage, after-sales services, repair and maintenance, and disposal and recycling—should also be considered, especially when evaluating the cradle-to-grave carbon emission activities of a vehicle. The total PCF is calculated with reference to the foundation of capturing all the carbon emitted along the product life-cycle
Total   carbon   footprint = i n AD i × EF i × GWP i ,
where AD is activity data, EF is emission factor, GWP is global warming potential, which captures the direct and indirect greenhouse gas emissions from the ith GHG emission activity to the nth GHG emission activity. AD captures the human activities that have been taken place, e.g., a vehicle consuming diesel during traveling in litres (L), gigajoules (GJ) electricity consumption for a furnace. An EF is a coefficient which allows to convert activity data into GHG emissions, quantifying the emissions or removals per unit activity. It is the average emission rate of a given source, relative to units of activity or process/processes. A GWP is a measure of a particular GHG’s contribution to global warming. The scale is a ratio of the contribution of global warming relative to that of the similar mass of carbon dioxide, thus allowing the expression of all GHG emissions as carbon dioxide equivalents. The total carbon footprint of vehicle includes the emissions along the cradle-to-grave processes involving vehicle and fuel cycles as well as incorporating direct and indirect carbon emission along the product life cycle.
Assessing the carbon footprints of electric vehicles (EVs) has been a focus of research in recent years [14,15,16]. However, as the charging times and energy consumption costs of hydrogen fuel cell cars, a rival technology, have become competitive with respect to EVs, the development of hydrogen-powered cars and their environmental impact analysis have also attracted increasing attention [17]. This paper reviews the carbon footprint assessment and LCA procedures of two types of vehicle product: EVs and hydrogen fuel cell vehicles (HFCVs). A specific comparison of the carbon footprint of a Tesla Model 3 EV and a Toyota MIRAI HFCV are then carried out, with reference to the GREET (greenhouse gases, regulated emissions, and energy use in transportation) LCA model. The next section presents a literature review on EVs and hydrogen vehicles and the LCA and PCF assessment of cars and lorries. The process of vehicle PCF assessment is discussed in Section 3. A comparison of the carbon footprints of the Tesla Model 3 and Toyota MIRAI, with an investigation on fuel cycle, is analyzed in Section 4 and Section 5, followed by a conclusion in Section 6.

2. Emerging Use of Hydrogen Fuel Cell and Battery Electric Vehicles

The logistics and transport sector covers various ranges of vehicles, including light, medium, and heavy. Light duty vehicles (LDVs), which account for the highest proportion of vehicles, are generally categorised into two types. The first type includes traditional internal combustion engine vehicles (ICEVs) that use diesel or petrol as fuel, and hybrids that combine a petrol engine with an electric motor [18]. The ICEV fleet also includes natural gas vehicles (NGVs) and those powered by biofuels (flex-fuels). The second type involves the use of alternative fuels, which are gradually being introduced for zero emission transport. For example, the US Department of Energy expects the use of alternative fuels such as biofuels to grow, thus diversifying the nation’s energy sources into a cleaner, more affordable and sustainable portfolio [19]. The third type of LDV comprises EVs, which are divided into battery electric vehicles (BEVs) and plug-in hybrid electric vehicles (PHEVs). Both of the latter are charged by plugging into an electric outlet. In comparison to petrol, biomass fuels reduce greenhouse gas (GHG) emissions by as much as 52% (corn ethanol) or even 78% (sugarcane ethanol) [20]. Fuel cell electric vehicles (FCEVs) such as hydrogen fuel cell vehicles (HFCVs) currently represent a very small market but have attracted increasing attention in various countries—e.g., the United States, Japan, and China—due to their zero emissions during vehicle usage, fast charging times and lower energy consumption [21,22]. Currently, there are 15 hydrogen refuelling stations in China, and it is expected that there will be over 1 million FCEVs running on the road by 2037 [23]. Table 1 summarizes a comparison of alternative battery and fuel cell technologies [18].
The emergence of cleaner vehicles and changing work patterns is a real opportunity to embrace healthier and safer transport networks. Businesses such as retailers may rethink their last-mile delivery strategies to reduce emissions and meet customer expectations. A World Economic Forum report [24] in January 2020 forecasted that emissions from last-mile deliveries will increase by more than 30% in 10 years–up to 25 million tonnes per year–as the number of urban dwellers and online shoppers grows, particularly after the COVID-19 pandemic, which is shifting a significant part of the retail business online as people stay at home. The research underpinning the report found that the demand for urban last-mile deliveries will grow 78% by 2030, leading to a 36% rise in delivery vehicles in inner cities. The report [24] presented a transition roadmap towards the use of EVs for inner-city delivery and argued that an integrated ecosystem approach would optimise the last mile for both private and public players while minimising customer disruption. The proposed plan could reduce CO2 emissions by 30%, congestion by 30% and delivery costs by 25% by 2030 when compared to a ‘do nothing’ baseline.
A shift to cleaner vehicles, e.g., EVs and HFCVs, is evident. In September 2019, Amazon announced the goal of going completely emissions-free on half of all shipments by 2030 and said it had undertaken an extensive project to develop its own ‘advanced scientific model’ to map its carbon footprint [25]. Hydrogen-powered buses are being put to the test in many cities in the US, and Amazon is the first company to use hydrogen-powered forklifts in its warehouses. IKEA Australia has announced a commitment to use only EVs for all of its operations and services by 2025, with the roll-out having already started in 2019. In partnership with transport service providers, the company commits to using EVs for home deliveries and assembly services [26]. Although the large-scale viability of HFCVs in terms of both cost and infrastructure support is several years away, exploratory initiatives are underway [27]. The amount of hydrogen produced from renewable resources has increased, with a recent finding that the production of hydrogen is becoming more economical due to the sharp decline in the price of renewable energy. In fact, the cost of renewable hydrogen could be as low as US$3.92 kg−1 in niche applications, making it relatively cost-competitive [28].
A fuel cell device uses a proton exchange membrane to convert chemical potential energy (energy stored in molecular bonds) into electrical energy [29]. The two electrodes, namely the anode (positive) and cathode (negative), are separated by an electrolytic medium, with hydrogen acting as the fuel carrier in the case of an HFCV. A hydrogen fuel cell enables the combination of hydrogen with oxygen to form water, releasing electricity and heat in the process. This synthesis can be described by the following chemical reaction scheme
Cathode: O2 + 4H+ + 4e → 2H2O
Anode: 2H2 → 4H+ + 4e
Overall: 2H2 + O2 → 2H2O + Energy
This produces electrons, which are captured to create a DC potential. Figure 1 depicts the above chemical reaction of a hydrogen fuel cell [29].
The electron flow can then be used to recharge a battery. The electrons, meanwhile, flow through the outer circuit and also feed electric motors directly. The battery can be located in a car to feed the electrical engine, which is essentially the operating method of an HFCV. Because H2 production requires energy, a sustainable energy source is crucial to maintain the sustainability of the overall operating life cycle. This can be any type of renewable electricity source, including hydroelectricity, biomass, geothermal, wind, wave, tidal and solar.

3. Carbon Footprint Methodologies for HFCVs and EVs

3.1. Process-Based Life Cycle Assessment of Vehicles

Measuring the carbon footprints of HFCVs and EVs are critical for estimating their impacts with respect to the transport, logistics, and supply chain sectors [30]. The complex manufacturing operations of automotive vehicles involve multiple locations of production and assembly, and such vehicles emit comparatively high emissions in the use phase, compared with other types of product. Models for quantifying the supply-chain carbon footprints of automotive products can be categorised into several major stages:
  • Product identification: determine the automotive product to be evaluated and analyse its specifications based on its list of components and bill of materials.
  • Process mapping of multiple manufacturing sites: identify and map the life cycle process of the automotive product and its whole supply chain across various suppliers, manufacturing sites, distributors, and retailers.
  • Data collection and computation: measure the direct and indirect carbon emissions at each stage of the life cycle, collect the relevant data on carbon emissions and calculate the direct and indirect carbon emissions from the supply chain throughout the life cycle of the automotive product.
  • Distribution logistics, consumer usage analysis, after-sales, and repair service analysis: analyze the emissions produced during the product’s dynamic distribution and transport along the supply chain and its usage by consumers from purchase, storage, repair, and maintenance to disposal and recycling.
  • Data aggregation and reporting: select appropriate computed figures on the direct and indirect emissions released during each stage of the supply chain in the life cycle of the automotive product and calculate the carbon emitted per functional unit of each automotive product.
The major processes in analysing the life cycle and carbon footprint of HFCVs consider the key stages in manufacturing and consumer usage. The processes of metal working and forming, painting and coating, assembly and testing, and shipping and distribution in a vehicle cycle are shown in Figure 2. The processes highlighted in pink are those for which the method of measuring carbon emissions is comparatively complex. The use of renewable energy as a replacement for traditional diesel necessitates estimations and modeling simulations to obtain the emissions inventory. In the production stages, the car parts are typically manufactured and assembled at various locations, making it necessary to incorporate the effects of globalization. This raises the complexity of measuring the emissions. Besides these stages, consumer usage, after-sales services, repair and maintenance, and disposal and recycling should be carefully analyzed when evaluating the cradle-to-grave carbon emission activities of a vehicle.

3.2. The GREET Model

The environmental impacts of goods and services such as EVs can be quantified using the LCA approach, which covers their complete production and value chains [8]. The ISO standards (ISO:14040 2010) provide a protocol to estimate the PCFs of EVs by performing LCA. Additionally, specific LCA guidelines for the assessment of PHEVs and FCVs can be considered with reference to [31]. The environmental impacts are assessed over the entire life cycle of the vehicle, including production and disposal; a well-to-wheel fuel assessment; fuel combustion; non-exhaust emissions during use due to tire, road, and brake wear; and road provision and maintenance. GREET is a suitable model for analyzing both the life cycle emissions and environmental impact of fuel and vehicles. This model considers the emissions associated with both the fuel cycle and the vehicle cycle [32]. Figure 3 shows the main life cycle stages covered by the fuel cycle module (GREET1) and the vehicle cycle module (GREET2).
GREET1 evaluates well-to-wheels (WTW) energy use and emissions of vehicle/fuel systems. The GREET1 module [33] calculates the energy use and emissions associated with the recovery (or growth in the case of biofuels, while the use of biofuels was discussed in Section 2) of the primary feedstock (FC1); transportation of the feedstock (FC2); production of the fuel from the feedstock (FC3); and transportation, distribution (FC4), and use of the fuel during vehicle operation (VC4) (or tank-to-wheels [TTW]) activities.
FCGREET1 = FCFuel Production + FCFuel Concumption = FC1 + FC2 + FC3 + FC4 + VC4
Meanwhile, the GREET2 module [4] calculates the energy use and emissions associated with the production (VC1) and processing of vehicle materials (VC2), the manufacturing and assembly of the vehicle (VC3), and the end-of-life decommissioning and recycling of vehicle components (VC5).
VCGREET2 = VCVehicle Production + VCVehicle Operation + VCVehicle End-of-life
= VC1 + VC2 + VC3 + VC4 + VC5

4. Case Analysis of Carbon Footprint of HFCVs and EVs

The challenge of capturing and measuring vehicle pollutant emissions in the use phase has come to the attention of both industry and academia. Increasing evidence indicates that the current approaches to laboratory emission testing, such as the New European Driving Cycle (NEDC) and the associated test protocol, cannot reliably and accurately capture on-road vehicle emissions. For example, ref. [34] reported that seven Euro 4–6 diesel cars tested with portable emissions measurement systems (PEMS) in their study emitted twice as much NOX on the road than the amount measured during certification using the NEDC. Ref. [35] estimated the gap between certification and reality in the pollutant emissions of three vehicles using simulations and found that the NEDC could have underestimated carbon emissions by a third on average. The Worldwide harmonised Light vehicles Test Procedure (WLTP), an improved laboratory test that replaced the NEDC, was also found to underestimate carbon emissions by 13% [35] To complement the WLTP, the Real Driving Emissions (RDE) test, performed by means of PEMS, has been developed to measure the emission of pollutants such as NOX by cars while driving on the road. The RDE could potentially close the gap between lab and road tests [36].
Tesla adopted the LCA approach to review the carbon emissions of its Model 3 EV [37] (See Table 2). Tesla’s PCF evaluation of the Model 3 was divided into manufacturing and use phases. A cradle-to-gate assessment was performed for the manufacturing phase. For the use phase, instead of adopting one of various efficiency testing cycles such as the NEDC or WLTP, Tesla used the on-road driving approach to estimate the carbon footprint of these cars. According to Tesla, average energy consumption data, including energy losses during the charging process, have been collected for over 4 billion miles traveled by Model 3s to date [37].
Toyota also adopted the LCA approach to evaluate the emissions and environmental impact of the MIRAI. The review process included a life cycle inventory analysis, inventory analysis and life cycle impact assessment [38]. According to the accompanying report, the defined scope of the assessment takes all energy, materials, substances, and processes into consideration. However, detailed figures are only provided in the fuel production and fuel generation phases, which coincide exactly with the scope of GREET1. Hence, the comparison in this study focuses exclusively on the fuel cycle component, i.e., the WTW cycle of the GREET model.

5. Comparison of ICEVs, EVs, and HFCVs

5.1. Functional Comparison

Researchers, environmentalists and vehicle owners, among others, are keen to know whether EVs produce lower GHG emissions or have smaller carbon footprints than ICEVs. Public disclosure of relevant information by vehicle manufacturers, such as the LCA models and standards adopted and the data collection and analysis methods, is vital for a comparison of different vehicles’ PCFs. Many environmental reports, especially those from manufacturers, emphasise the environmental impact of their products in the consumption phase, arguing that the vast majority of emissions generated by vehicles today occur in the product-use phase (VC4 of the GREET1 model in Figure 3), i.e., when consumers are driving their vehicles [37]. However, this does not reflect the full environmental impact of such products from an end-to-end view, i.e., from cradle to grave. Nonetheless, there are some exceptions to this reporting practice, including Toyota, which focuses on emissions from the manufacturing phase of products and future goals for energy consumption [38]. Toyota presents scenarios and figures that quantify both the consumption of fossil resources for energy supply to produce the vehicles during the manufacturing phase, including materials, parts, and vehicle transport, and to produce the energy to propel the vehicles during the use phase in units of annual consumption/reserve. Although this is encouraging, it is not sufficient. As suggested by the GREET model, determining the environmental impact of EVs by comparing their lifetime impacts with those of ICEVs requires looking at the entire lifecycle, from raw materials to vehicle usage to disposal, rather than just the emissions resulting from vehicle usage. Therefore, examining the energy efficiency of fuel generation is an equally important part of the LCA. Table 3 exhibits a comparison on the techno-economic parameters of gasoline-driven ICEVs, lithium-battery PHEVs, Compressed gaseous hydrogen tank-based vehicle (HFCV1) and solid-state hydrogen storage fuel cell vehicles (HFCV2) [39].

5.2. Defining Scope and Goal of Analysis

LCA is a useful tool for quantifying the overall environmental impact of a product, process or service. However, careful definition of the scientific scope and boundaries is important to ensure accurate LCA results. The objective of this research is to present an insightful discussion on the emissions, i.e., carbon footprints, of LDVs fuelled by major fuel types, including ICEVs, PHEVs and, more importantly, HFCVs, using a meaningfully defined system boundary. By using the GREET modeling methods [32], we aim to provide a consistent LCA platform based on reliable, widely accepted methods and protocols. As mentioned in Section 3.1, a GREET model consists of two modules [33] (1) GREET1 evaluates the well-to-wheels (WTW) energy use and emissions of vehicle/fuel systems; and (2) GREET2 evaluates the energy use and emissions of the vehicle manufacturing cycle.
Modeling of the various vehicle technologies evaluated in this study was conducted using publicly available data and models. Ref [38] claims to define the scope of the assessment to include all energy, materials, substances and processes, for which its in-house development and manufacturing divisions provide the necessary data to assess all life cycle phases of all new parts. However, the report actually provides inventory results in the form of bar-charts showing the patterns under specific cases but does not provide detailed data that can be used for comparison. Emission figures are only provided in the use phase. Similar to the Tesla report [37], Toyota’s system boundary focuses on the use phase. Hence, the system boundary is defined by (a) the fuel production phase and (b) the fuel consumption phase, which can be represented by the following equation as indicated in Figure 3, where FC stands for the emissions of the respective phase.
FCGREET1 = FCFuel Production + FCFuel Consumption
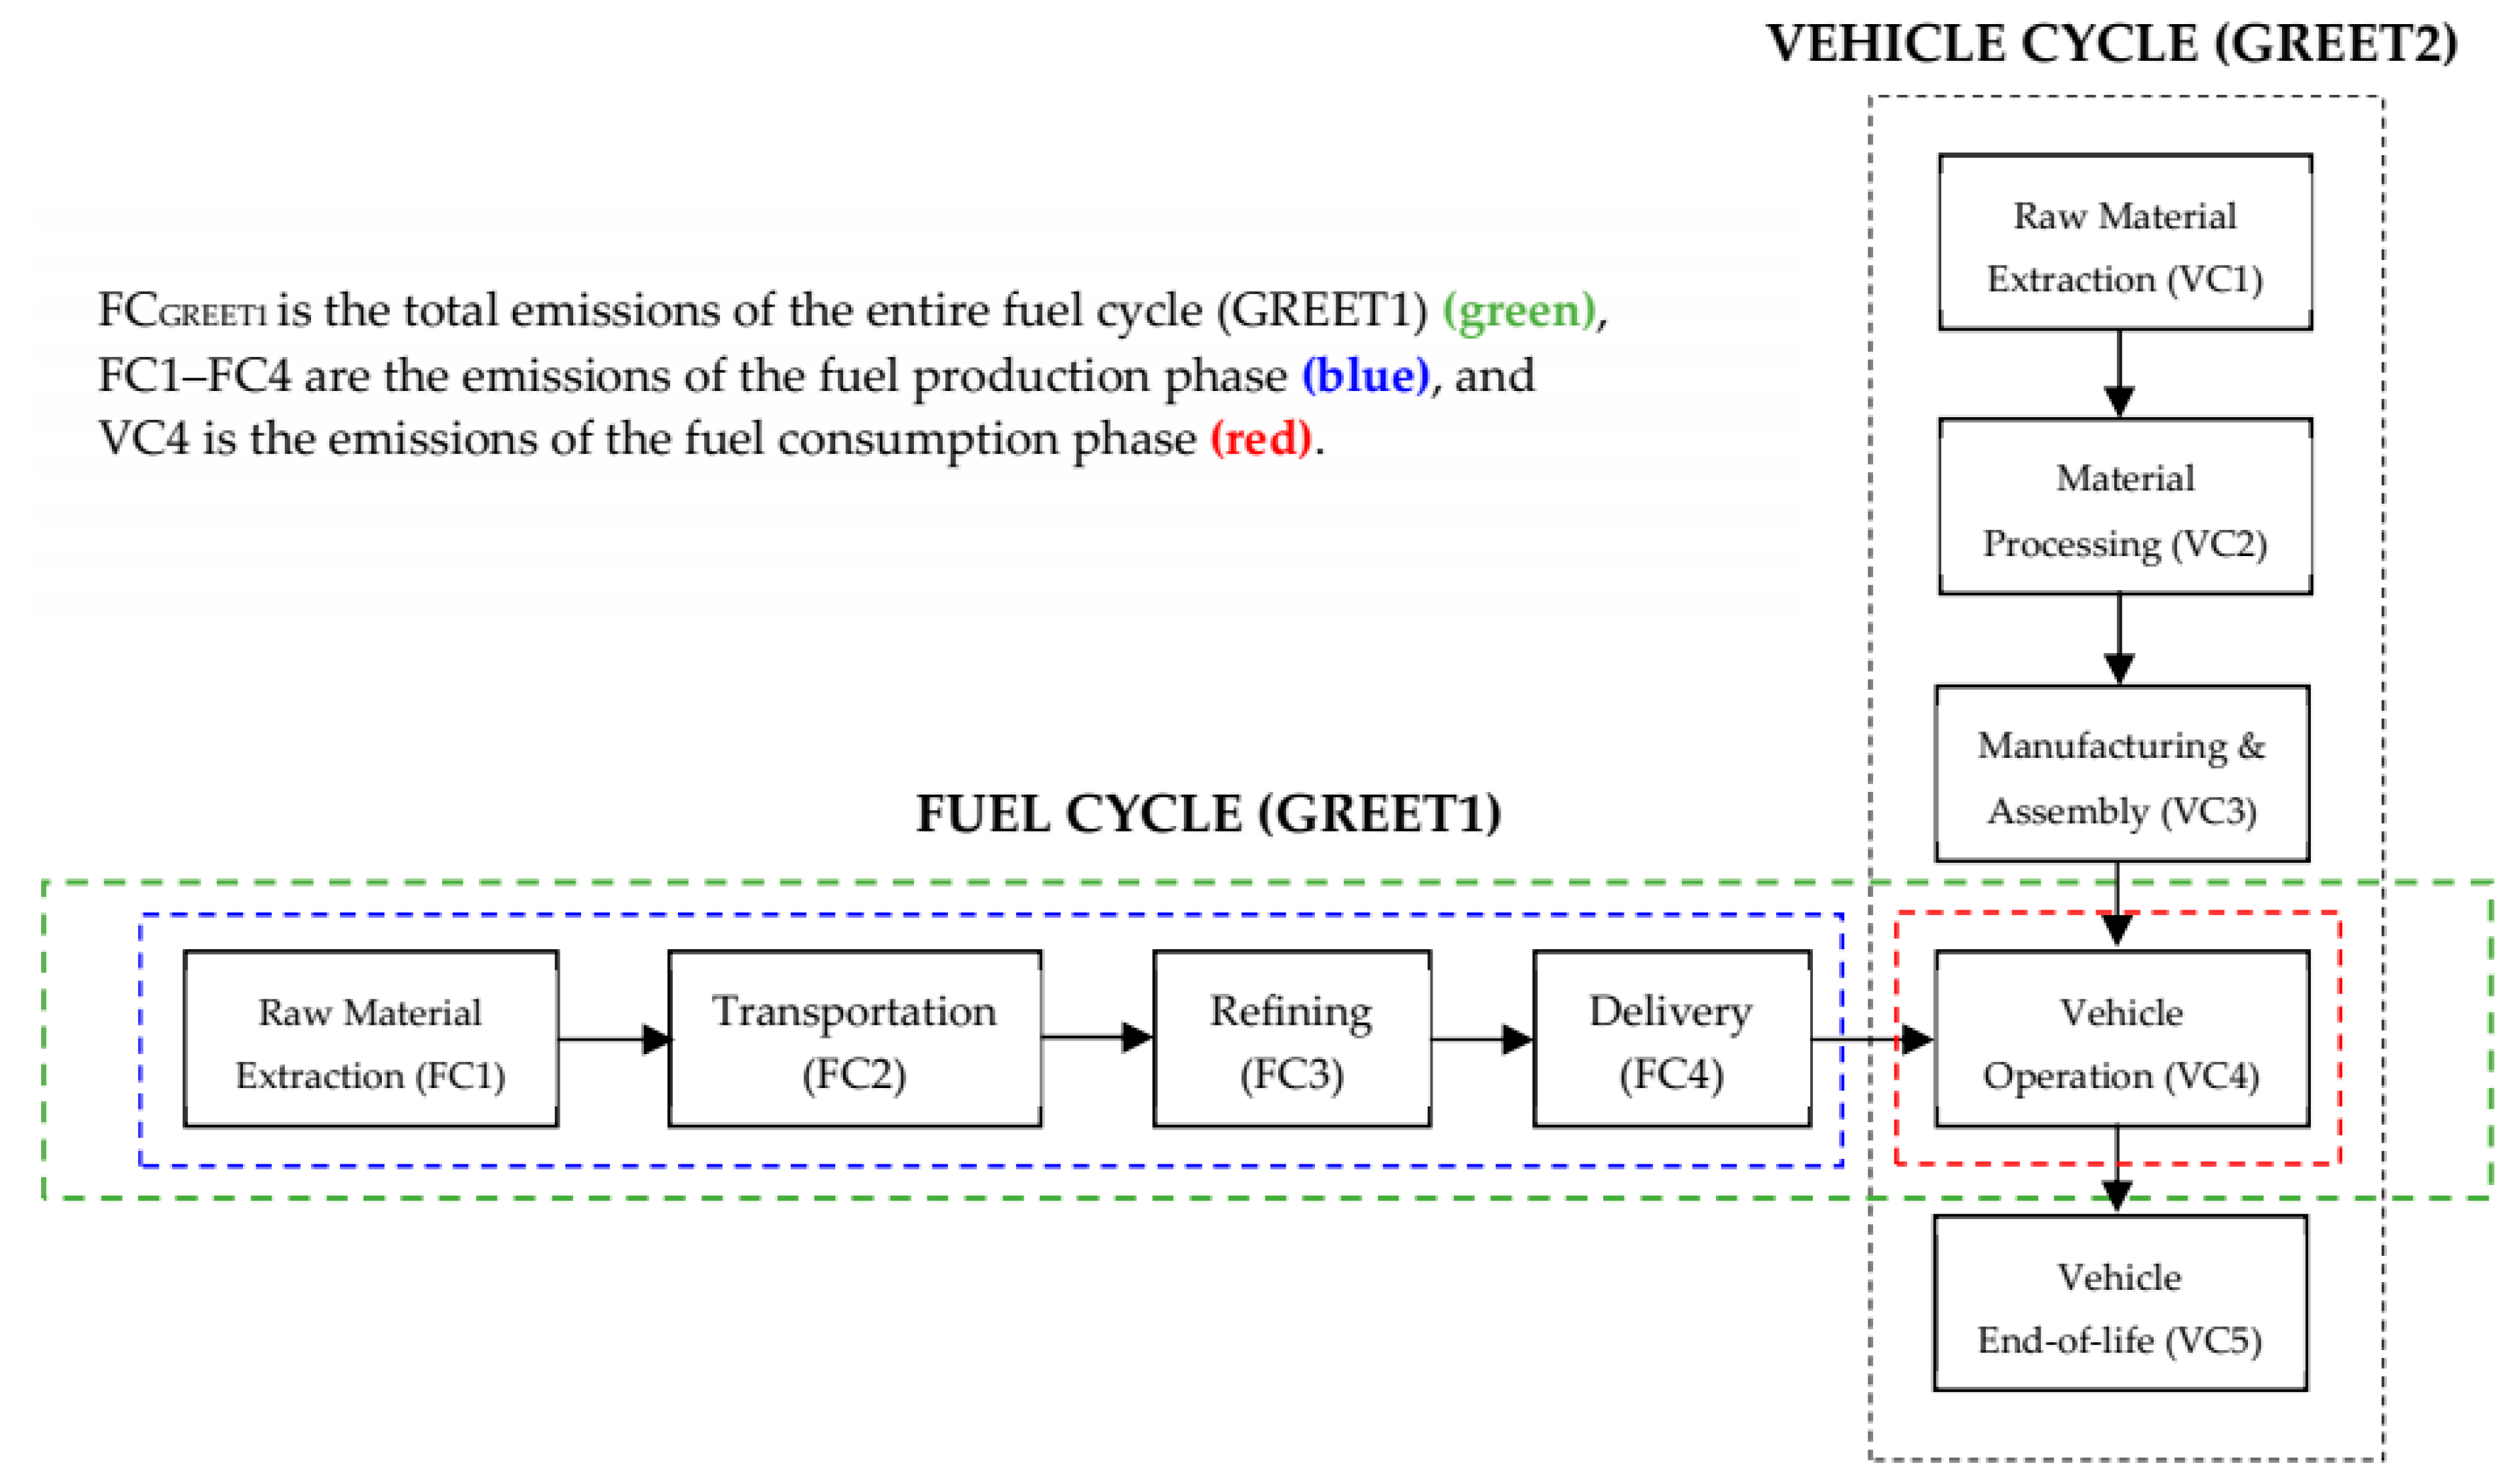
  • The fuel production phase represents the average emissions produced during the four phases of GREET1 before vehicle operation (FC1 to FC4 in Figure 3), from either one of the two hydrogen production pathways, i.e., natural gas and renewable electrolysis.
  • The CO2 emission figures of the fuel consumption phase (i.e., the vehicle operation phase in GREET1) are provided in the reports.

5.3. Fuel Cycle (GREET1)

The hydrogen pathways assumed in this analysis are those used in the first launch countries of the MIRAI according to [38] i.e., the UK, Germany and Denmark. One pathway is central reforming from natural gas piped from the North Sea and from Russia, and the other pathway is electrolysis using renewable energy from wind power. For the CO2 emissions of both pathways, data are obtained from the European Commission Joint Research Centre (JRC) [38] JEC defines upstream emissions including all GHG emissions taking place before the raw material for the fuel enters a refinery or processing plant and emissions from production and processing operations. The upstream emission factors are adopted from a study conducted by European member states [40] For other fuels and renewables—such as peat, municipal and industrial wastes, hydropower, geothermal, solar, wind, and tidal power—the upstream emission factors are considered to be negligible [40]. Nevertheless, wind turbine which was used in electrolysis for producing hydrogen in this study, has the life-cycle emissions between 0.009 and 0.018 kg of CO2 equivalent per kilowatt-hour [40]. Therefore, the emission figures of renewable electrolysis are included in Table 4 for comparative purpose. A comparison of the emissions of ICEV, PHEV, and HFCV based on the GREET methodology is summarised in Table 4.
The LCA results of the GREET model indicate that the emissions of an HFCV depend very much on the fuel production mechanisms. According to the manufacturers’ data, the CO2 emissions in the fuel consumption phase are zero across all models of HFCV. However, the amount of emissions from fuel production depends on the type of hydrogen production pathway. When natural gas is used, the total mass of CO2 emitted to produce one tank of hydrogen for an HFCV is 70.7 kg, but this falls to 11.9 kg, a reduction factor of 8.2, when electrolysis with wind-powered renewable energy is used. A recent study conducted in Australia [43] compared the technologies of conventional ICEVs, EVs and HFCVs using the grid, which is supported by non-renewable energy sources. The results showed that HFCVs only slightly outperformed conventional ICEVs. The authors suggested that significant reductions in GHG emissions from HFCV use in Australia will only be possible if the country makes a fundamental shift towards an almost 100% renewable energy system. This drawback concurs with the findings of this study. With reference to the results in Table 4, the emissions of hydrogen fuel production pathway using NG is about 6 times the emissions using RE, about 2 times the emissions of ICEV using gasoline, and 3.4 times the emissions of PHEV. This indicates that the emissions of hydrogen production pathway for HFCV outperform those of the fuel production cycle for ICEV and PHEV if RE is used which depends so much on a country’s energy strategy. A national pro-renewable energy strategy enables higher availability of relevant power supply and infrastructure. Hence, it is a strategic decision for choosing a production base in a country that supports green hydrogen strategy (i.e., hydrogen produced using renewable energy) as it affects the availability of associate hydrogen production pathway which ultimately affects the overall environmental impact of the WTT cycle. In view of this great opportunity, there are nearly 320 green hydrogen production demonstration projects being announced worldwide and a total of about 200 MW of electrolyzer capacity [44] Table 5 is a list of countries with national energy strategies to provide clear long-term investment in green hydrogen.
According to the International Energy Agency’s Hydrogen Projects Database, new green hydrogen projects are being added on almost a weekly basis [44] HFCV manufacturers such as Toyota may seize the first mover advantage to produce and market their products in the countries rolling out green hydrogen strategies. It is also suggested to explore alternative low emission hydrogen production methods such as steam methane reforming of natural gas, water electrolysis, and biomass gasification as an alternative solution of electrolysis.

6. Conclusions

Zero emission transport is a more environmentally friendly solution for reducing CO2 emission and air pollutants emissions in the vehicle operations cycle where HFCV is one of the most promising one comparing to conventional vehicles such as ICEV using gasoline and EV in hybrid form (PHEV) based on the results in this study. Most of the studies in vehicle carbon footprint adopts LCA approach, mainly focusing on vehicle cycle. With the initiative of exploring zero emission vehicles, research on fuel cycle is becoming more important. Investigations on combining vehicle PCF and fuel cycle will certainly assist in analyzing the impact of vehicles towards the environment. The GREET model is adopted in this research to analyse the fuel cycle, with a focus on different hydrogen production pathways for fuelling up HFCVs. Drawing upon data disclosed by vehicle manufacturers, this study used the GREET LCA model to compare the PCFs of vehicles of different fuel types, including ICEVs (vehicles powered by traditional fuel), the Tesla Model 3 (a PHEV) and the Toyota MIRAI (an HFCV). The results indicate that the fuel cycle calculated by GREET1 contributes significantly to the vehicles’ PCFs. The cleaner the production of hydrogen, the lower the environmental impact of the vehicles’ emissions. HFCV reduces emissions of WTT cycle significantly using green hydrogen. Hence, HFCV manufacturers could enhance their competitive advantage to produce and market their products in countries rolling out green hydrogen strategies such as Japan, South Korea, and European Union, which could produce synergy if they can work hand-in-hand towards emission mitigation. This study also found that vehicle manufacturers need to disclose relevant data on the PCF methodology more transparently to allow comparisons of their vehicles’ emissions. Future research could further be explored on the best practices of PCF reporting for vehicles powered by renewable energy sources, including private cars and trucks. The carbon footprints of hydrogen production technologies based on different methodologies—such as steam methane reforming of natural gas, water electrolysis, and biomass gasification—will be comprehensively evaluated.

Author Contributions

Conceptualization, E.Y.C.W., D.C.K.H., S.S. and E.M.H.C.; Methodology, D.C.K.H. and S.S.; Literature review, E.Y.C.W., D.C.K.H. and S.S.; Validation, C.-W.T. and E.M.H.C.; Data analysis, D.C.K.H. and S.S.; Writing—E.Y.C.W., D.C.K.H. and S.S.; Writing—review and editing, C.-W.T. and E.M.H.C.; Visualisation, S.S.; Supervision, E.Y.C.W.; Project administration, S.S.; Funding acquisition, E.Y.C.W. All authors have read and agreed to the published version of the manuscript.

Funding

The work described in this paper was partially supported by a grant from the Research Grants Council of the Hong Kong Special Administrative Region, China (UGC/IDS(C)14/B01/19).

Institutional Review Board Statement

Not applicable.

Informed Consent Statement

Not applicable.

Data Availability Statement

Data can be found in the [37, 38, 41].

Acknowledgments

The authors acknowledge the Research Grants Council of the Hong Kong Special Administrative Region, China for providing the research grant supporting this project. The work described in this paper was partially supported by a grant from the Research Grants Council of the Hong Kong Special Administrative Region, China (UGC/IDS(C)14/B(E)01/19).

Conflicts of Interest

The authors declare no conflict of interest.

References

  1. Clover, C. China Eyes Eventual Ban of Petrol and Diesel Cars. Financial Times. 10 September 2017. Available online: https://www.ft.com/content/d3bcc6f2-95f0-11e7-a652-cde3f882dd7b (accessed on 3 January 2018).
  2. McKinnon, A. (Ed.) Decarbonizing Logistics: Distributing Goods in a Low Carbon World; Kogan Page Publishers: New York, NY, USA, 2018. [Google Scholar]
  3. Vaughan, A. Ban New Petrol and Diesel Cars in 2030, Not 2040, Says Thinktank. The Guardian. 18 March 2018. Available online: https://www.theguardian.com/environment/2018/mar/18/uk-should-bring-2040-petrol-and-diesel-car-ban-forward-2030-green-alliance (accessed on 30 December 2020).
  4. International Energy Agency (IEA). CO2 Emissions from Fuel Combustion; Highlights; OECD/IEA: Paris, France, 2012. [Google Scholar]
  5. International Energy Agency (IEA). CO2 Emissions from Fuel Combustion 2017; OECD/IEA: Paris, France, 2017. [Google Scholar]
  6. Alaswad, A.; Baroutaji, A.; Achour, H.; Carton, J.; Al Makky, A.; Olabi, A. Developments in fuel cell technologies in the transport sector. Int. J. Hydrogen Energy 2016, 41, 16499–16508. [Google Scholar] [CrossRef] [Green Version]
  7. Environment Bureau. Hong Kong’s Climate Action Plan 2030+; Environment Bureau: Hong Kong, 2017. Available online: https://www.enb.gov.hk/sites/default/files/pdf/ClimateActionPlanEng.pdf (accessed on 2 September 2020).
  8. Hawkins, T.R.; Singh, B.; Majeau-Bettez, G.; Stroman, A.H. Comparative environmental life cycle assessment of conventional and electric vehicles. J. Ind. Ecol. 2013, 17, 53–64. [Google Scholar] [CrossRef]
  9. Zhao, Y.; Onat, N.C.; Kucukvar, M.; Tatari, O. Carbon and energy footprints of electric delivery trucks: A hybrid multi-regional input-output life cycle assessment. Transp. Res. Part D Transp. Environ. 2016, 47, 195–207. [Google Scholar] [CrossRef]
  10. Candelaresi, D.; Valente, A.; Iribarren, D.; Dufour, J.; Spazzafumo, G. Comparative life cycle assessment of hydrogen-fuelled passenger cars. Int. J. Hydrogen Energy 2021. [Google Scholar] [CrossRef]
  11. Chen, Y.; Hu, X.; Liu, J. Life Cycle Assessment of Fuel Cell Vehicles Considering the Detailed Vehicle Components: Comparison and Scenario Analysis in China Based on Different Hydrogen Production Schemes. Energies 2019, 12, 3031. [Google Scholar] [CrossRef] [Green Version]
  12. Yang, Z.; Wang, B.; Jiao, K. Life cycle assessment of fuel cell, electric and internal combustion engine vehicles under different fuel scenarios and driving mileages in China. Energy 2020, 198, 117365. [Google Scholar] [CrossRef]
  13. Valente, A.; Iribarren, D.; Candelaresi, D.; Spazzafumo, G.; Dufour, J. Using harmonised life-cycle indicators to explore the role of hydrogen in the environmental performance of fuel cell electric vehicles. Int. J. Hydrogen Energy 2020, 45, 25758–25765. [Google Scholar] [CrossRef]
  14. Hao, H.; Qiao, Q.; Liu, Z.; Zhao, F. Impact of recycling on energy consumption and greenhouse gas emissions from electric vehicle production: The China 2025 case. Resour. Conserv. Recycl. 2017, 122, 114–125. [Google Scholar] [CrossRef]
  15. Petrauskienė, K.; Skvarnavičiūtė, M.; Dvarionienė, J. Comparative environmental life cycle assessment of electric and conventional vehicles in Lithuania. J. Clean. Prod. 2020, 246, 119042. [Google Scholar] [CrossRef]
  16. Wu, Z.; Wang, C.; Wolfram, P.; Zhang, Y.; Sun, X.; Hertwich, E. Assessing electric vehicle policy with region-specific carbon footprints. Appl. Energy 2019, 256, 113923. [Google Scholar] [CrossRef]
  17. Xiong, S.; Song, Q.; Guo, B.; Zhao, E.; Wu, Z. Research and development of on-board hydrogen-producing fuel cell vehicles. Int. J. Hydrogen Energy 2020, 45, 17844–17857. [Google Scholar]
  18. Albrahim, M.; Al Zahrani, A.; Arora, A.; Dua, R.; Fattouh, B.; Sieminski, A. An overview of key evolutions in the light-duty vehicle sector and their impact on oil demand. Energy Transit. 2019, 3, 81–103. [Google Scholar] [CrossRef] [Green Version]
  19. DOE. Biofuels & Greenhouse Gas Emissions: Myths Versus Facts; The U.S. Department of Energy (DOE): Washington, DC, USA, 2008. Available online: https://www.energy.gov/sites/prod/files/edg/media/Myths_and_Facts.pdf (accessed on 24 January 2021).
  20. Wang, M.; Wu, M.; Huo, H. Life-cycle energy and greenhouse gas emission impacts of different corn ethanol plant types. Environ. Res. Lett. 2007, 2, 024001. [Google Scholar] [CrossRef]
  21. International Energy Agency (IEA). Electric Vehicles Initiative: Accelerating the Introduction and Adoption of Electric Vehicles Worldwide; International Energy Agency (IEA): Paris, France, 2020; Available online: https://www.iea.org/reports/tracking-energy-integration/hydrogen (accessed on 2 September 2020).
  22. Kane, M. There Are 6500 Hydrogen Fuel Cell Cars Worldwide (Half in California). 2020. Available online: https://insideevs.com/news/38]564/there-are-6500-hydrogen-fuel-cell-cars-worldwide-half-in-california/ (accessed on 2 September 2020).
  23. World Nuclear Association. Hydrogen Production and Uses; Updated February 2021; World Nuclear Association: London, UK, 2021; Available online: https://www.world-nuclear.org/information-library/energy-and-the-environment/hydrogen-production-and-uses.aspx (accessed on 27 December 2020).
  24. WEF. The Future of the Last Mile Ecosystem Report: Transition Roadmaps for Public- and Private-Sector Players; The World Economic Forum (WEF): Cologny, Switzerland, 2020. [Google Scholar]
  25. CNBC. Jeff Bezos Unveils Sweeping Plan to Tackle Climate Change. CNBC News. 19 September 2019. Available online: https://www.cnbc.com/2019/09/19/jeff-bezos-speaks-about-amazon-sustainability-in-washington-dc.html (accessed on 7 September 2020).
  26. MHD. IKEA Deliveries to be All Electric by 2025. MHD Supply Chain Solutions. 15 March 2019. Available online: http://mhdsupplychain.com.au/2019/03/15/ikea-deliveries-to-be-all-electric-by-2025/ (accessed on 7 September 2020).
  27. SmartCitiesWorld. Retailers Rethink Last-Mile Deliveries to Reduce Emissions and Meet Customer Expectations. SmartCitiesWorld. 21 February 2020. Available online: https://www.smartcitiesworld.net/news/retailers-rethink-last-mile-deliveries-to-reduce-emissions-and-meet-customer-expectations-5051 (accessed on 7 September 2020).
  28. Glenk, G.; Reichelstein, S. Economics of converting renewable power to hydrogen. Nat. Energy 2019, 4, 216–222. [Google Scholar] [CrossRef]
  29. Hydrogenics. Fuel Cells. Hydrogenics. 2020. Available online: https://www.hydrogenics.com/technology-resources/hydrogen-technology/fuel-cells/ (accessed on 2 September 2020).
  30. He, B.; Liu, Y.; Zeng, L.; Wang, S.; Zhang, D.; Yu, Q. Product carbon footprint across sustainable supply chain. J. Clean. Prod. 2019, 241, 118320. [Google Scholar] [CrossRef]
  31. Miotti, M.; Hofer, J.; Bauer, C. Integrated environmental and economic assessment of current and future fuel cell vehicles. Int. J. Life Cycle Assess. 2017, 22, 94–110. [Google Scholar] [CrossRef] [Green Version]
  32. ANL. Greenhouse Gases, Regulated Emissions, and Energy use in Transportation (GREET) Model; Argonne National Laboratory (ANL): Lemont, IL, USA, 2014. Available online: https://www.energy.gov/sites/prod/files/2014/06/f16/fcto_sa_factsheet_greet.pdf (accessed on 2 September 2020).
  33. ANL. Cradle-to-Grave Lifecycle Analysis of U.S. Light-Duty Vehicle-Fuel Pathway: A Greenhouse Gas & Economic Assessment of Current (2015) & Future (2025–30) Technologies; Energy Systems Division, Argonne National Laboratory (ANL): Lemont, IL, USA, 2016. Available online: https://publications.anl.gov/anlpubs/2016/05/127895.pdf (accessed on 2 September 2020).
  34. Degraeuwe, B.; Weiss, M. Does the New European Driving Cycle (NEDC) really fail to capture the NOX emissions of diesel cars in Europe? Environ. Pollut. 2017, 222, 234–241. [Google Scholar] [CrossRef]
  35. Fontaras, G.; Ciuffo, B.; Zacharof, N.; Tsiakmakis, S.; Marotta, A.; Pavlovic, J.; Anagnostopoulos, K. The difference between reported and real-world CO2 emissions: How much improvement can be expected by WLTP introduction? Transp. Res. Procedia 2017, 25, 3933–3943. [Google Scholar] [CrossRef]
  36. Hooftman, N.; Messagie, M.; van Mierlo, J.; Coosemans, T. A review of the European passenger car regulations—Real driving emissions vs local air quality. Renew. Sustain. Energy Rev. 2018, 86, 1–21. [Google Scholar] [CrossRef]
  37. Tesla. Impact Report; Tesla: Fremont, CA, USA, 2019; Available online: https://www.tesla.com/impact-report/2019 (accessed on 28 August 2020).
  38. Toyota. The MIRAI Life Cycle Assessment Report for Communication; Toyota: Tokyo, Japan, 2015; Available online: https://global.toyota/en/sustainability/esg/challenge2050/challenge2/lca-and-eco-actions/ (accessed on 28 August 2020).
  39. Offer, G.; Howey, D.; Contestabile, M.; Clague, R.; Brandon, N. Comparative analysis of battery electric, hydrogen fuel cell and hybrid vehicles in a future sustainable road transport system. Energy Policy 2010, 38, 24–29. [Google Scholar] [CrossRef] [Green Version]
  40. Moro, A.; Lonza, L. Electricity carbon intensity in European Member States: Impacts on GHG emissions of electric vehicles. Transp. Res. Part D Transp. Environ. 2018, 64, 5–14. [Google Scholar] [CrossRef] [PubMed]
  41. HMD. Toyota MIRAI: MIRAI Means “The Future” (a Comparison with Hyundai, Mercedes-Benz, and Honda). H2 MOBILITY Deutschland GmbH & Co. KG (HMD). 2020. Available online: https://h2.live/en/wasserstoffautos/toyota-mirai#:~:text=The%20carbon%20fibre%2Dreinforced%20plastic,a%20range%20of%20500%20km (accessed on 12 September 2020).
  42. Nikolaidis, P.; Poullikkas, A. A comparative overview of hydrogen production processes. Renew. Sustain. Energy Rev. 2017, 67, 597–611. [Google Scholar] [CrossRef]
  43. Smit, R.; Whitehead, J.; Washington, S. Where are We Heading with Electric Vehicles? Air Qual. Clim. Chang. 2018, 52, 18–27. [Google Scholar]
  44. Patel, S. Countries Roll Out Green Hydrogen Strategies, Electrolyzer Targets. Power: News & Technology for the Global Energy Industry. 1 February 2021. Available online: https://www.powermag.com/countries-roll-out-green-hydrogen-strategies-electrolyzer-targets/ (accessed on 21 March 2021).
Figure 1. Operating principles of a hydrogen fuel cell [29].
Sustainability 13 04872 g001
Figure 2. The major stages of process-based PCF estimation on the vehicle cycle of a hydrogen fuel cell car.
Sustainability 13 04872 g002
Figure 3. GREET model [33].
Sustainability 13 04872 g003
Table 1. Comparison on technological development challenges on alternative batteries and fuel cell technologies.
Alternatives to Li-ion BatteriesBatteriesFuel Cell
Li-SulphurZn-AirLi-AirSolid-State
Current technological roadblocks
  • Sulphur lacks electro-conductivity to be overcome with expensive carbon coating.
  • Cycle life
  • Charging not energy efficient
  • Large size and weight of battery
  • Lifespan
  • High costs
  • Safety: fire hazard
  • Insufficient power due to slow chemical reactions
  • Lifespan
  • High costs of layering electrolyte
  • Unreliable production process
  • Charging and distribution infrastructure
  • High cost of fuel cell and H2
  • CO2 being emitted in fuel cell generation on H2
Potential timing for automotive2025–2030 and beyond2025–2030 and beyond2025–2030 and beyond~20252025–2030 and beyond
Table 2. LCA Methodology for PCF assessment of Tesla Model 3.
Manufacturing Phase Emissions for Model 3
Activities ExaminedActivities Not Examined
·
Raw and semi-finished material production
·
transportation,
·
mechanical processing and shaping,
·
battery manufacturing,
·
vehicle assembly and paint shop,
·
all fuels and energy (natural gas, electricity, etc.),
·
other auxiliaries (lubricants, water, etc.), and
·
end-of-life disposal.
·
capital goods (e.g., machinery, buildings), infrastructure
·
(e.g., roads, power transmission systems),
·
employee commute,
·
external charging
·
equipment and infrastructure,
·
maintenance and service during use,
·
packaging,
·
transport to recycler,
·
disposal of manufacturing waste, inbound transportation from Tier 1 suppliers, and distribution to customers.
Use Phase Emissions for Model 3
·
Use phase emissions for grid charging are based on Model 3 delivery-weighted state-level grid mix based on DOE estimates of state-level grid carbon intensity (https://afdc.energy.gov/vehicles/electric_emissions.html) (accessed on 15 December 2020).
·
Emissions of ~120 gCO2e/mi are a result of calculating the geographic distribution of the Model 3 in the U.S. based on Tesla’s delivery data which weights state-level carbon intensity figures and assumes no change in grid mix into the future.
Source: Tesla Impact report 2019 [37].
Table 3. Comparison on the techno-economic parameters of ICEVs, PHEVs, HFCV1, and HFCV2 (Offer et al., 2019).
ItemsICEVPHEVHFCV1HFCV2
Fuel WeightLightHeavyMediumHeavy
Safety considerationsExplosion limit 1.2–7.1% (Note 1)Risk of battery explosionPossible gas leakage. Explosion limit 4–75%Very safety–release on demand. No explosion limits
Charging or refueling time3–5 min5 h3–5 min<1 min
Energy consumption~USD0.045/MJ
(for a car with a tank of 6 L)
~USD3.6/MJ~USD0.0024
(for a car with a tank of 5 L)
USD0.0048
(for a car with a tank of 10 L)
Note 1: Explosion limt of ICEV depend on the type of fuel to be used, which can be petroleum, diesel, or natural gas.
Table 4. Comparison of emissions among ICEV (gasoline), PHEV (Tesla Model 3), and HFCV (Toyota MIRAI).
Well-To-Tank (WTT)Tank-To-Wheel (TTW)
CO2 Emission (kg CO2 per 5 kg Tank Hydrogen) (Note 5)CO2 Emission (kg CO2 per 5 kg Tank Hydrogen) (Note 6)
Hydrogen production pathwaysFuel Production Cycle
(Note 1,2,3,4,5)
Fuel Consumption Phase
(Vehicle Operations) (Note 7)
Hydrogen (Toyota)ICEV (Gasoline)PHEV
(Hybrid)
Hydrogen (Toyota)ICEV (Gasoline)PHEV
(Hybrid)
NG70.735.720.80202.3101
RE11.90
Notes: 1. The MIRAI’s fuel cell is backed with a battery that also stores the braking energy. With a tank capacity of 5 kg, the MIRAI achieves a range of 500 km [41]. 2. Current best processes for water electrolysis have an effective electrical efficiency of 70–80%, so that producing 1 kg of hydrogen (which has a specific energy of 143 MJ/kg or approximately 40 kWh/kg) requires 50–55 kWh of electricity [42]. Thus, it requires about 900–990 MJ to produce 5 kg of hydrogen gas. 3. According to [38], the three countries use the following hydrogen production pathways. (a) UK: 100% piped natural gas from the North Sea, no central reforming; (b) Denmark: 100% electrolysis with wind-powered renewable energy; (c) Germany: 50% piped natural gas from the North Sea or from Russia, with central reforming; 50% electrolysis with wind-powered renewable energy. 4. According to [38], the CO2 emissions of hydrogen production pathway using natural gas (NG) and renewable electrolysis (RE) are 98.86 g/MJ and 12.10 g/MJ, respectively. Thus, the CO2 emissions corresponding to the production of a 5-kg tank of hydrogen are approximately 70.7 kg and 8.6 kg, respectively. 5. The EV used for comparison is hybrid plug-in battery vehicle. It has a gasoline engine in addition to an electric motor. A hybrid battery vehicle has direct emissions which produces evaporative emissions from the fuel system as well as tailpipe emissions when operating on gasoline. 6. The emissions of CO2 were calculated based on the tank capacity of MIRAI. As indicated in Note 7, while the emissions figures of PHEV and ICEV were estimated based on the emission inventory provided by Toyota [38]. The assessment criteria provided by Toyota was conducted with the vehicle weight inclusive driver (68 kg) and luggage (7 kg) as well as with fuel tank 90% full, determined in accordance with Directive 92/21/EEC.
Table 5. Countries rolling out green hydrogen strategies [44]
CountriesGreen Hydrogen Strategies
Japan
Japan became one of the first countries to roll out a basic hydrogen strategy in 2017.
It has also set out concrete cost and efficiency targets per application, targeting electrolyzer costs of $475/kW, efficiency of 70% or 4.3 kWh/Nm 3 by 2030.
South Korea
In January 2019, South Korea announced its Hydrogen Economy Roadmap.
It outlines a goal of producing 6.2 million fuel cell electric vehicles, rolling out at least 1200 refilling stations by 2040, and supplying 15 GW of fuel cells for power generation by 2040.
Germany
In June 2020, Germany rolled out a national hydrogen strategy that eyes a 200-fold increase in electrolyzer capacity—of up to 5 GW by 2030.
European Union
A hydrogen strategy published in July 2020 sets explicit electrolyzer capacity targets of 6 GW by 2024 and 40 GW by 2030.
Spain
Issued in October 2020, Spain’s hydrogen strategy foresees installations of 4 GW of electrolyzer capacity by 2030, with near term goals of at least 300 MW to 600 MW by 2024.
Publisher’s Note: MDPI stays neutral with regard to jurisdictional claims in published maps and institutional affiliations.

