Article

Operational and Safety Management at Intersections: Can the Turbo-Roundabout Be an Effective Alternative to Conventional Solutions?

Department of Civil Engineering, University of Calabria, Arcavacata Campus (CS), 87036 Arcavacata, Italy
*
Author to whom correspondence should be addressed.
Sustainability 2021, 13(9), 5103; https://0-doi-org.brum.beds.ac.uk/10.3390/su13095103
Submission received: 25 March 2021 / Revised: 16 April 2021 / Accepted: 28 April 2021 / Published: 1 May 2021
(This article belongs to the Special Issue Sustainable and Safe Roundabouts)

Abstract

:
The European Union policy strategies on the sustainability of the transport system pursue the goals of maximizing safety and environmental benefits and reducing the severity and frequency of crashes, congestion, and pollutant emission rates. A common issue is the planning of the most effective solution for operational and safety management at intersections. In this study, an egg turbo roundabout is proposed as the alternative solution to a conventional roundabout in Southern Italy which suffers from traffic congestion. A comparative analysis is carried out using microsimulation techniques to investigate the safety effects and operational improvements of converting a traditional priority intersection into standard roundabout or turbo roundabout layout. In particular, the VISSIM software is used to explore the most relevant operational performance measures: queue length, travel times and delays. The lowest values of these measurements are recorded for the simulated turbo roundabout, thus making this scheme more appropriate in terms of operational performances. With regard to safety analysis, the Surrogate Safety Assessment Model (SSAM) is used to collect information on the predicted number of conflicts, the probability, and severity of the potential collisions. The results suggest that, for the specific case study, the safety levels of the standard roundabout and the turbo roundabout are approximately comparable.

1. Introduction

The recent European policy strategies on sustainability of the transport system pursue the goal of a mobility based on safety, connection, and air quality [1]. EU legislative initiatives for the decade 2021 to 2030 contribute to the development of mutual relationships between safety and sustainability measures with the purpose of increasing the safety potential and reducing both congestion and pollutant emission rates [2].
The highest social costs are associated with the road transport system: traffic accident occurrence, congestion phenomena, and the emission of air pollutants are the most relevant issues [3]. Road safety management plans are primarily aimed at improving the safety levels of the road transport system, reducing the severity and frequency of crashes, thus being strictly related to the high priority of minimizing the social and economic costs associated with traffic accidents.
Accident data analysis provides statistical evidence that four typologies of accidents result in the highest number of road fatalities: run-off the road, head-on and rear-end crashes, collisions involving unprotected road users, and collisions in the intersection areas [4]. The presence of several conflict points and the absence of adequate forms of speed control translate into the transformation of intersections in accident hotspots.
Roundabouts can be a suitable and efficient type of intersection control and traffic regulation. Furthermore, a higher safety level is internationally recognized as the key benefit of the implementation of the roundabout solution [5].
Improving vehicle flows at intersections can help maximize environmental benefits too. Pollutant emission rates as well as vehicle fuel consumption are strictly related to several factors depending on characteristics of the vehicle, traffic, road, travel, weather conditions, and driver’s behaviour. Vehicle acceleration and speed profiles are two crucial variables for the definition of emission prediction models [6]. This implies a significant and direct influence of acceleration and deceleration patterns on the accumulation of pollutants in the intersection areas. For example, specific traffic conditions in the range of a roundabout can lead to an increase in emission of CO2, THC, CO, and NOx, thus impacting negatively the air quality [7].
However, the advantages and disadvantages of the replacement of traditional junctions with the roundabout layout cannot be generalised, given the dependency on specific traffic contexts. Sometimes, the transformation of conventional intersections in a roundabout scenario does not lead to an upgrade of the level of service or the safety potential.
A deep bibliographic analysis of previous studies showed that, in some circumstances, turbo roundabouts can overcome the problem, improving operational performances and creating safer environments.
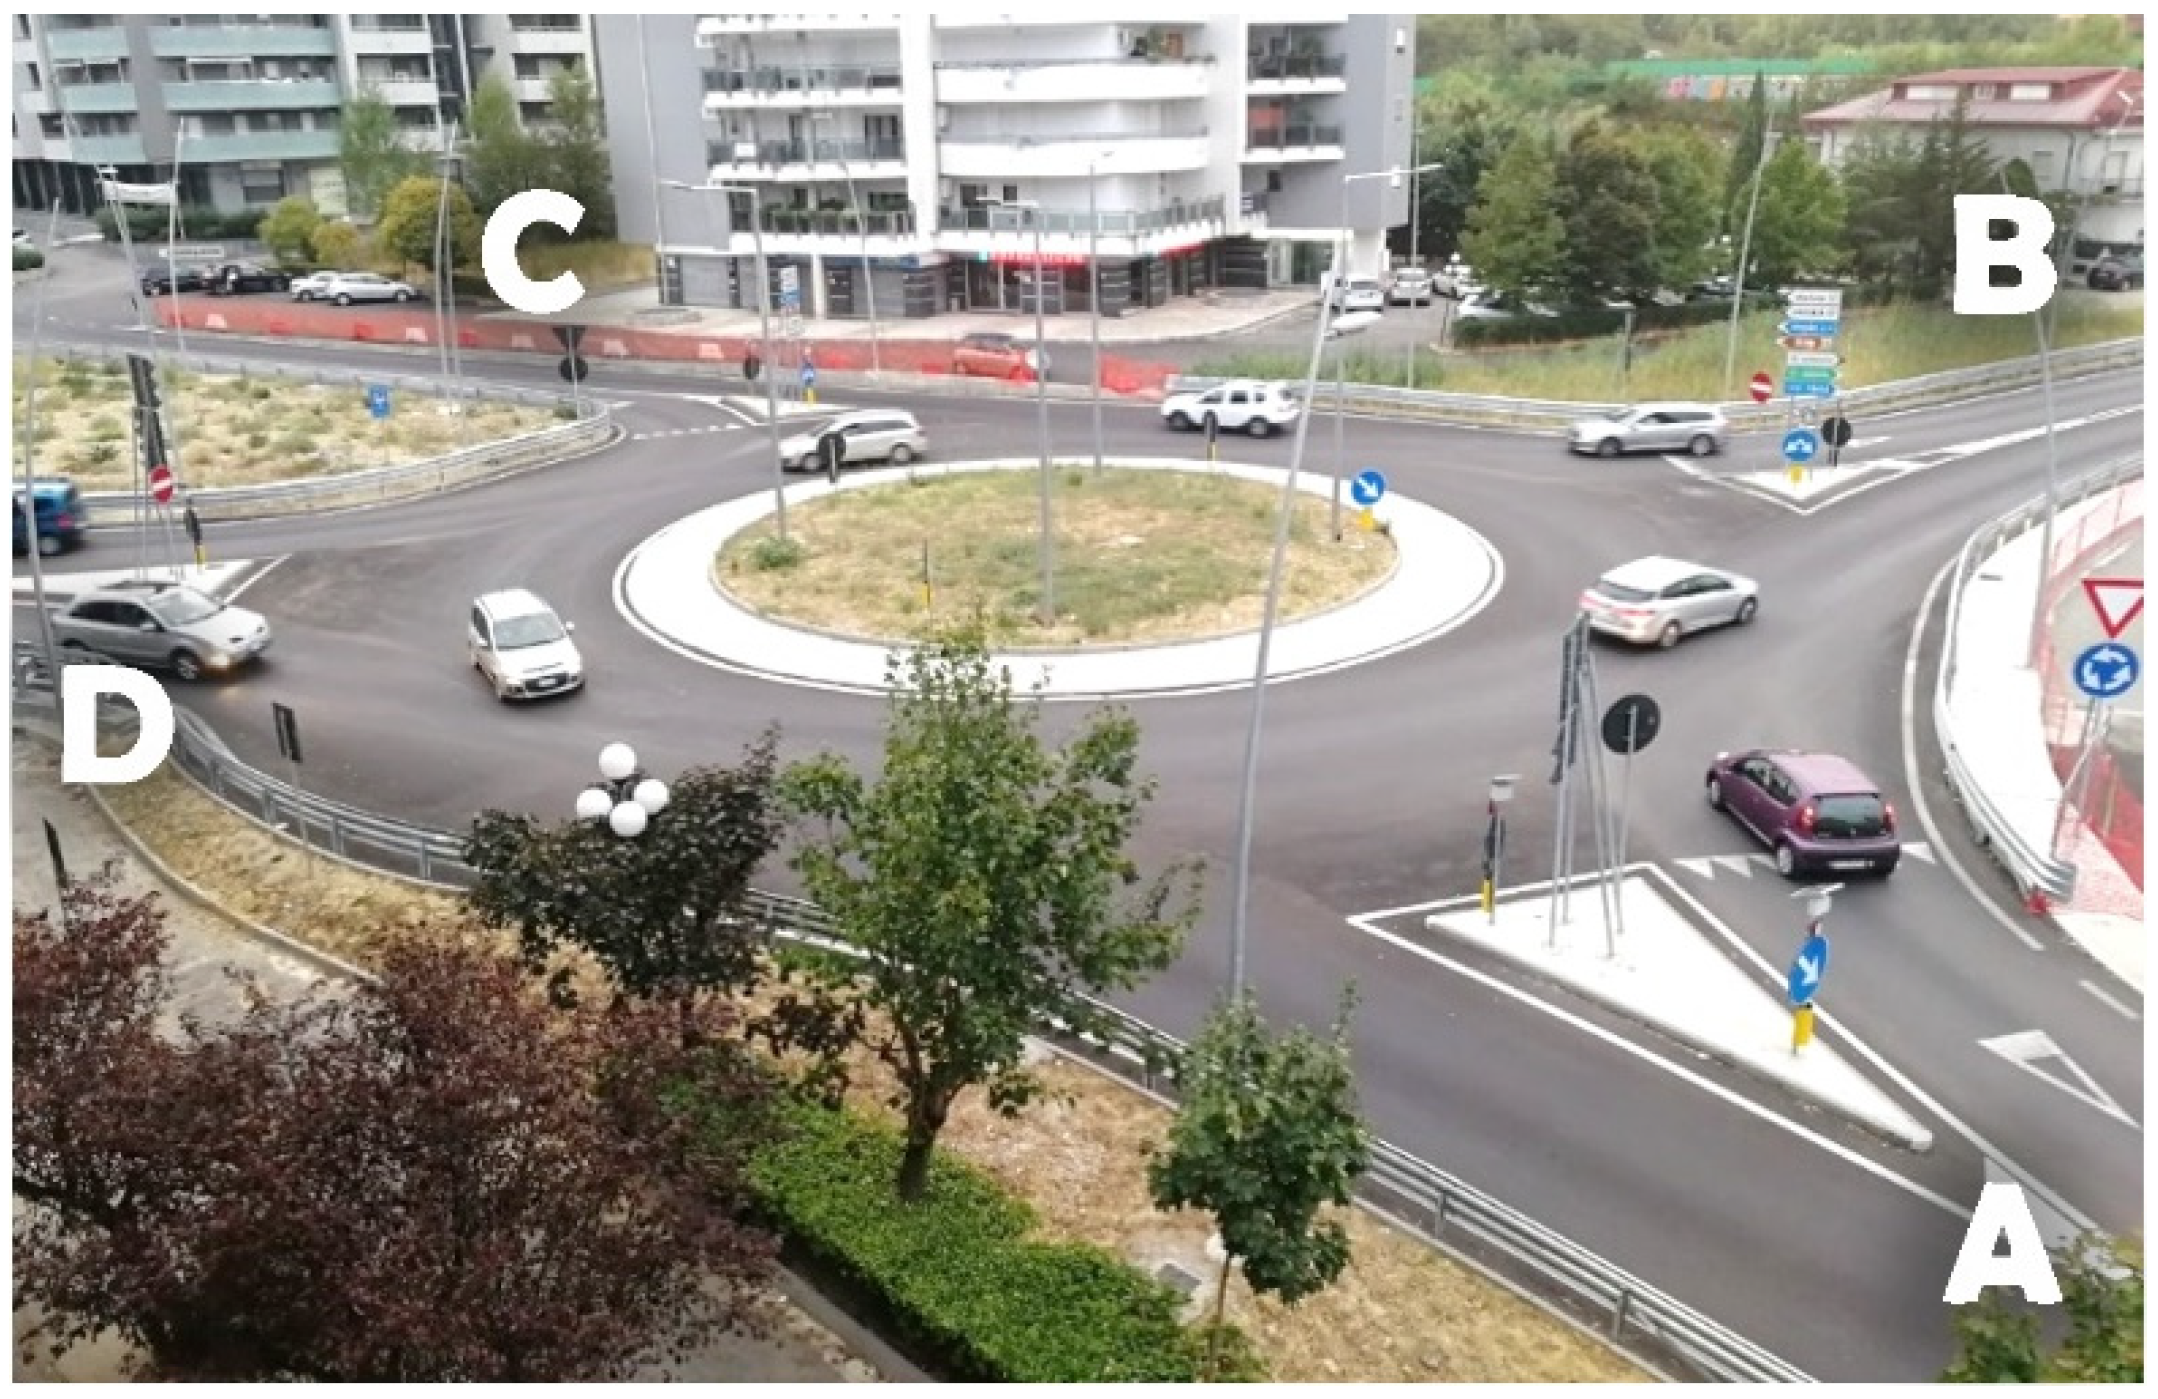
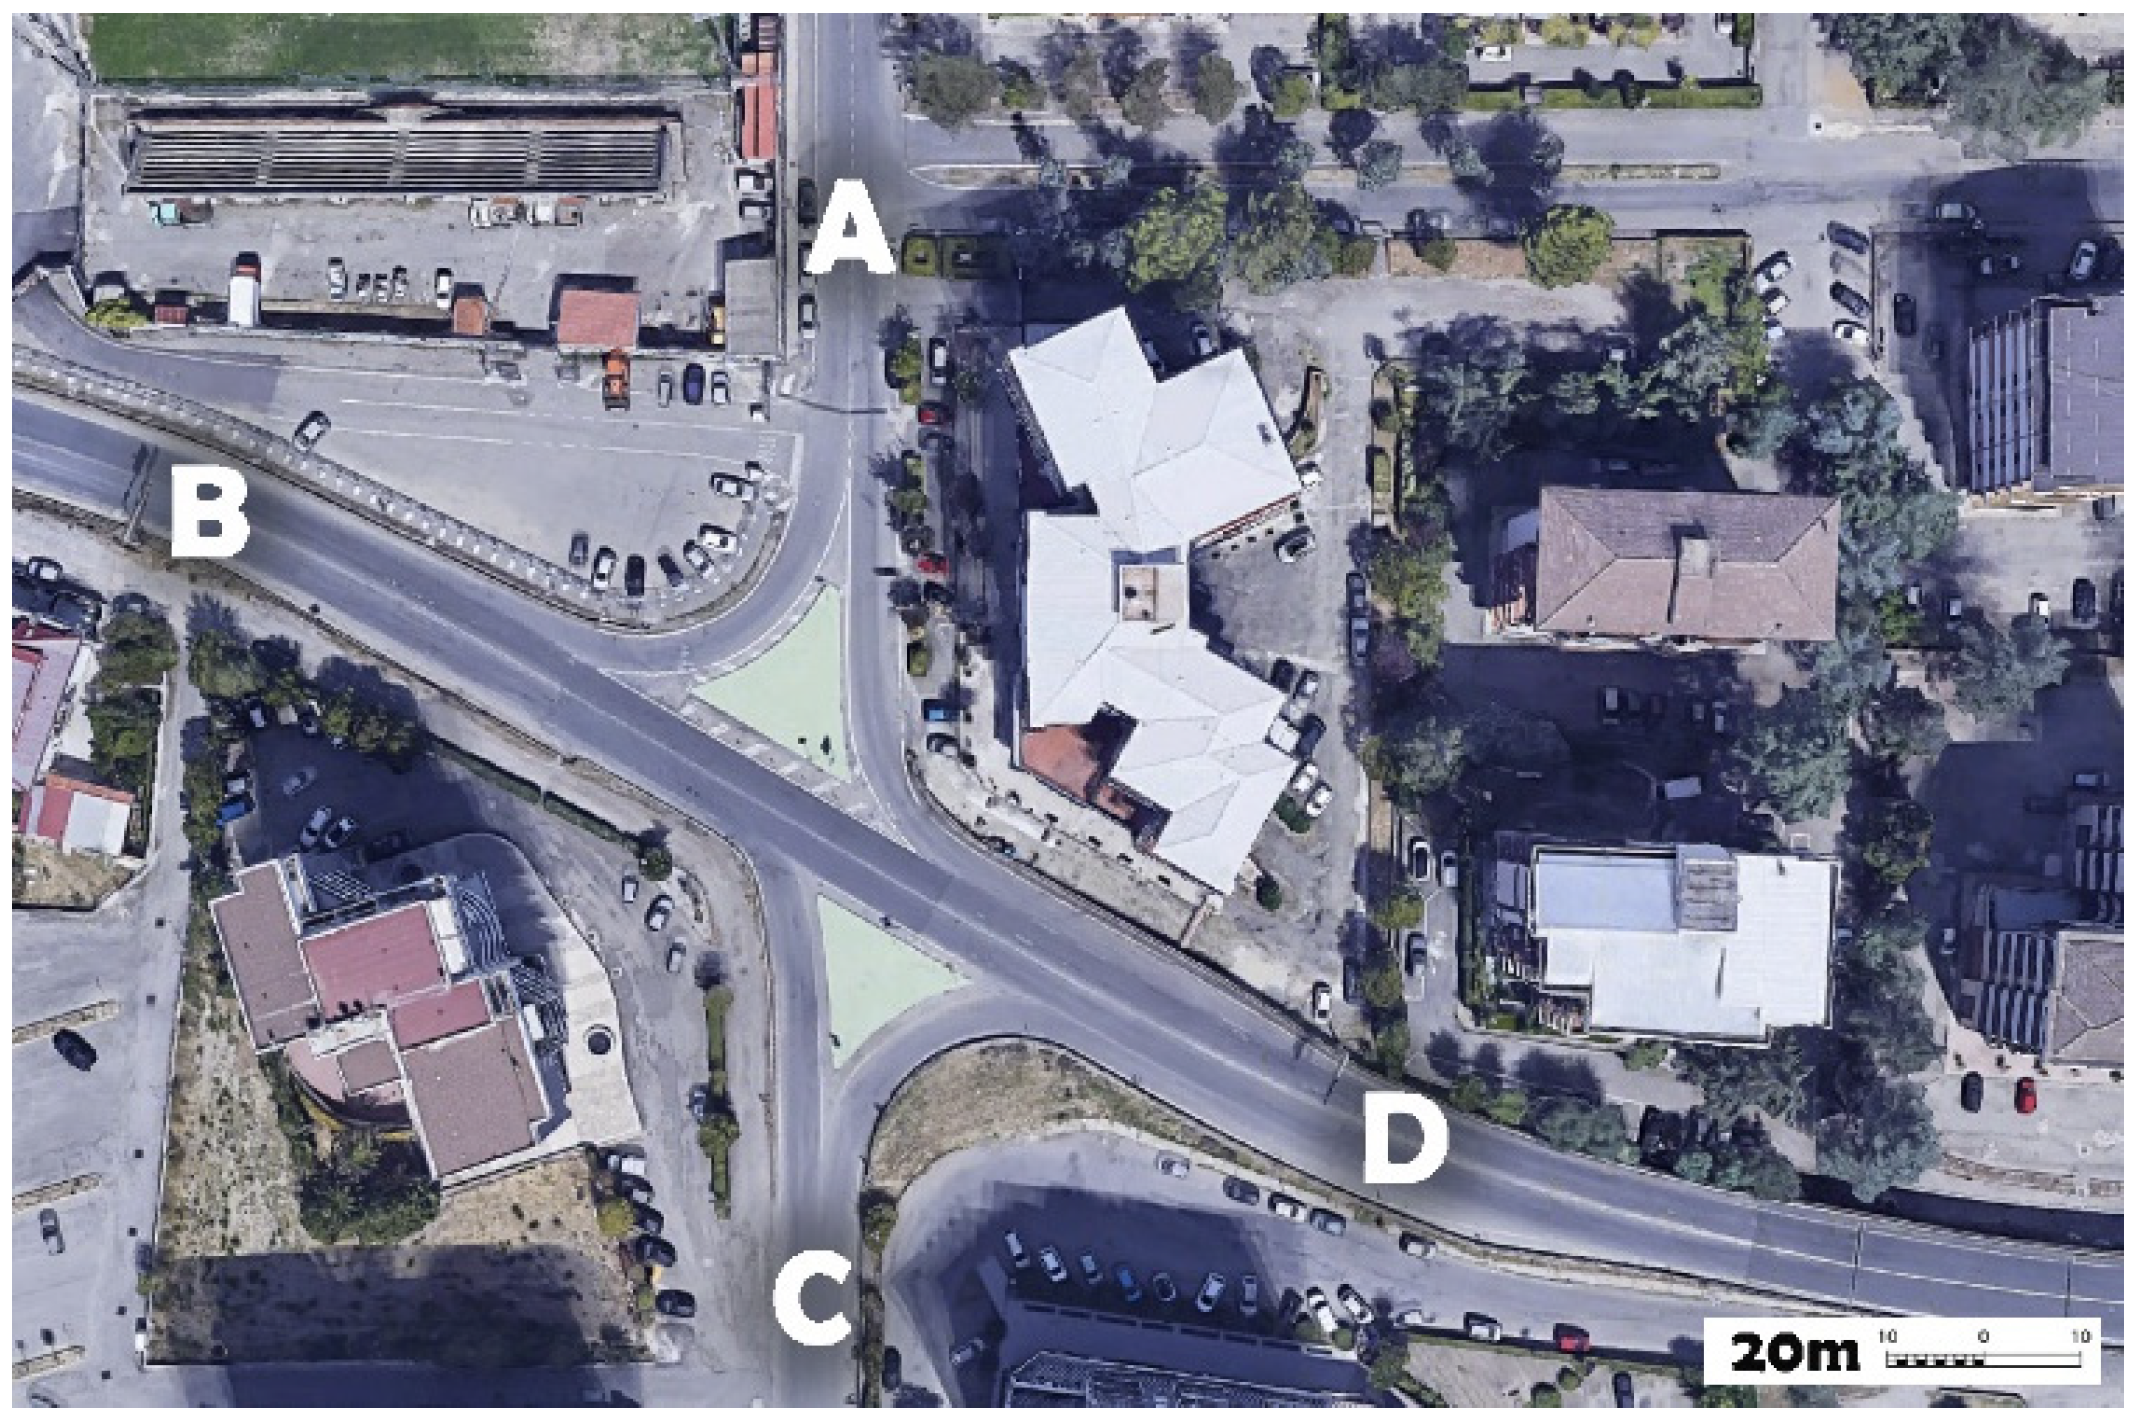
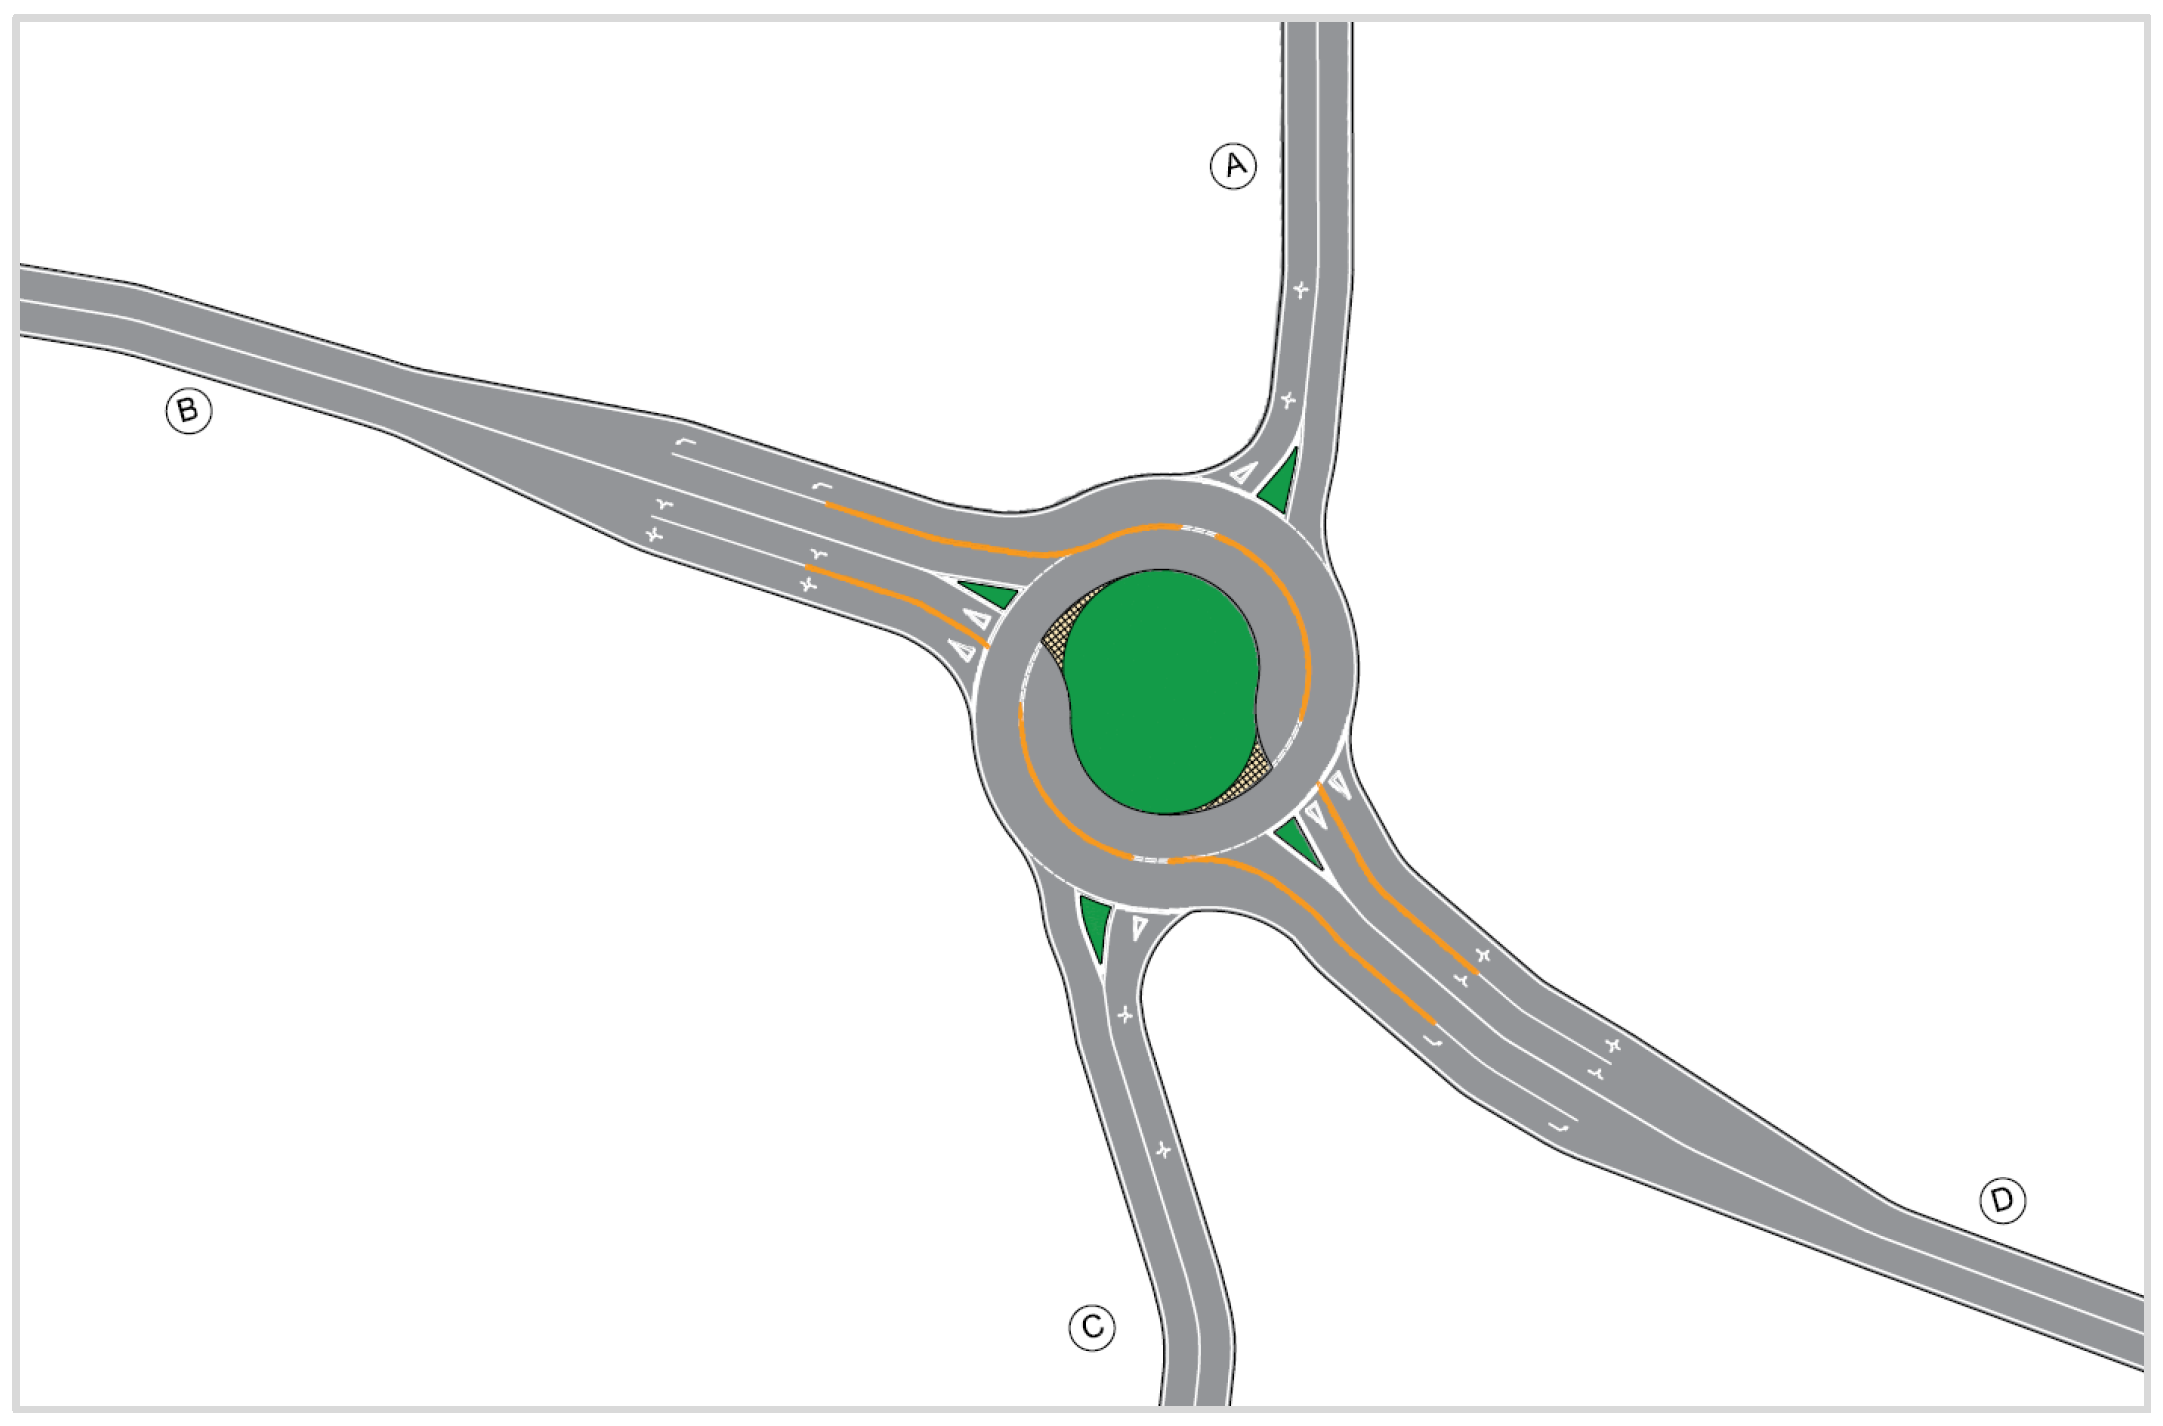
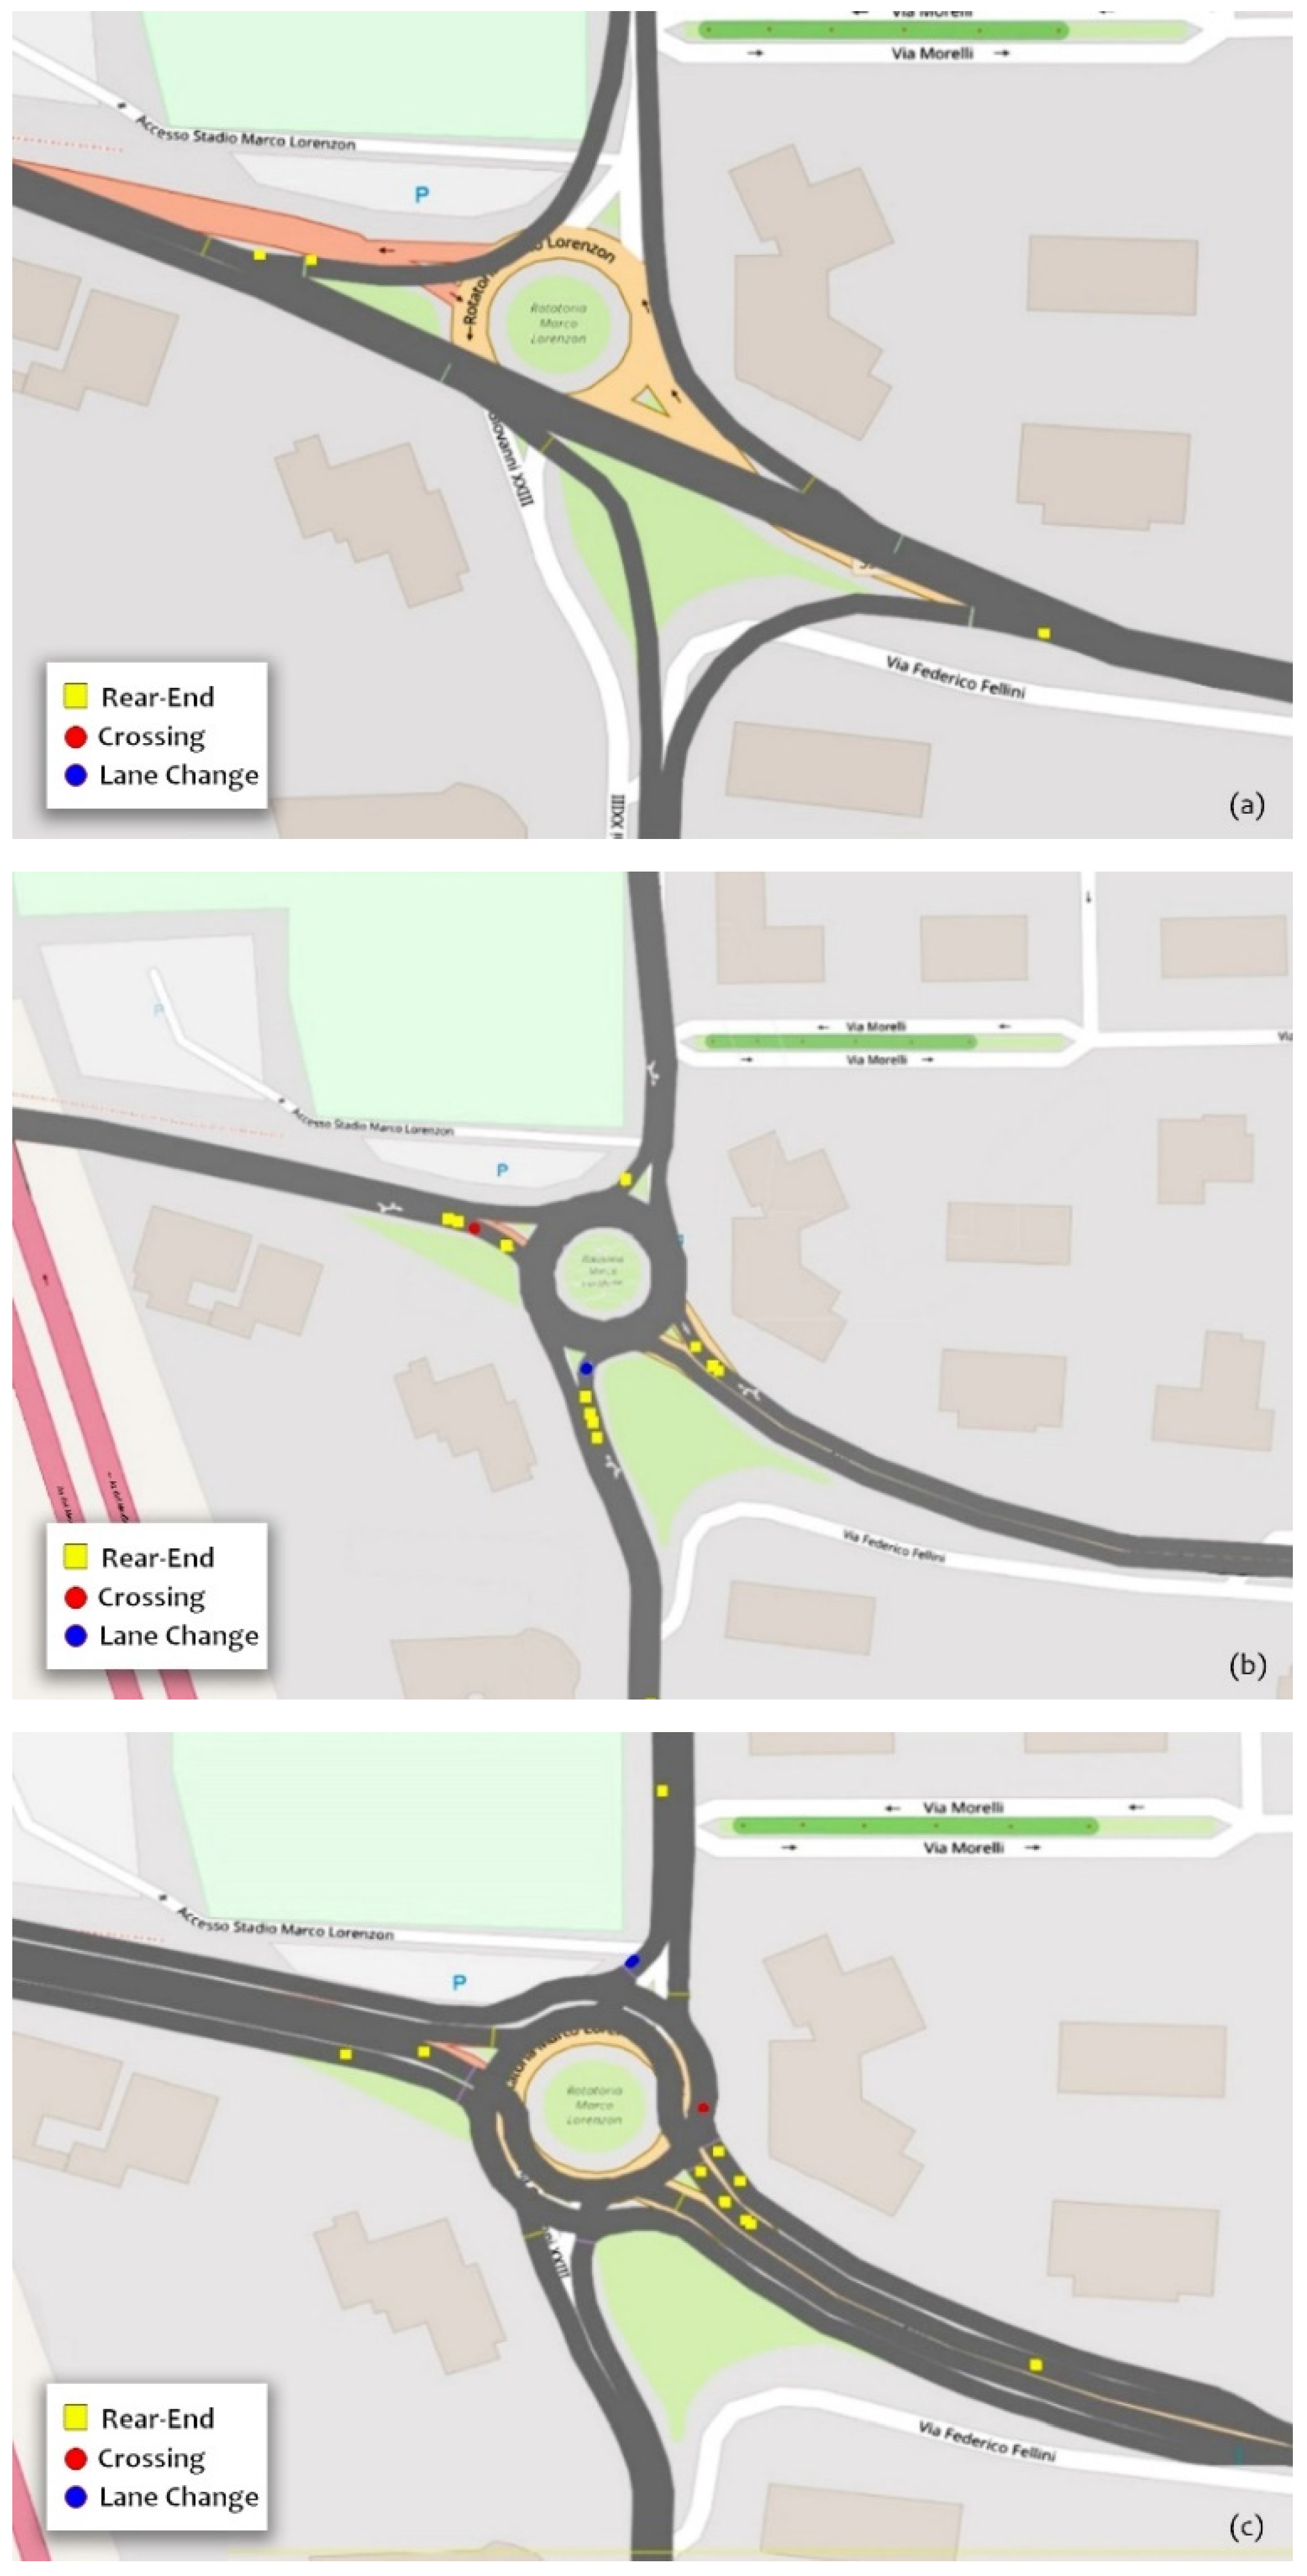
In this study, a modelled egg turbo roundabout is proposed as an alternative solution to the conventional existing case study roundabout. A comparative analysis is carried out for the following three different scenarios: the pre-roundabout scenario (a traditional priority junction), the current state of the roundabout, and the modelled turbo roundabout scenario. The comparison, in terms of operational and safety performances, is aimed at highlighting the issues related to the test site roundabout and the advantages and disadvantages of a potential implementation of the turbo roundabout layout as an effective alternative solution.

Literature Review

In a review of studies on the safety effects of converting intersections to roundabouts, Elvik [8] reports a reduction of 50 to 70% of accidents with deaths. In rebuilding existing intersections, roundabouts allow reducing the number of accidents with injuries by an average of 34% [9]. The same percentage of injury accident reduction can reach significant values (30–50%) [8]. Despite these safety benefits, well-performing single-lane roundabouts could have operational problems in the presence of high traffic demand [10].
The highest capacity levels in roundabouts can be achieved through the installation of traffic control devices. However, the above-mentioned measure does not permit to carry out the “self-regulation” principle which is the essential feature identifying this type of intersections [11].
To improve the capacity, the implementation of the single-lane roundabout with additional lanes is probably the most used solution. On the negative side, the multi-lane layout has several disadvantages concerning safety performances, mostly due to higher driving speeds and the increased number of potential conflict points [10]. In particular, the typologies of the additional conflict spots present in multi-lane roundabouts, compared to the basic single-lane configuration, are linked to drivers’ incorrect use of lanes and improper turning manoeuvres [12].
To answer the problems of low capacity and poor traffic safety conditions, in 1996, Fortuijn developed the turbo roundabout solution. The advantage of this new type of multilane roundabout is the more balanced distribution of the traffic flow over the lanes; moreover, the presence of lane separation is the main feature impacting the overall safety level, reducing pass-through driving speeds and eliminating conflict points due to weaving and cut-in manoeuvres [10].
Physical lane division at the entries and on the ring and the spiral circulatory roadway are the main differences between turbo roundabouts and the standard multi-lane roundabout layout. Raised lane dividers and spiral road markings prevent traffic flow weaving and lane changing, reducing the potential collisions on the circulatory carriageway [13]. As a result of the installation of curb dividers, the drivers obtain specific information on a partially constrained and defined path from the entry to the intended exit, circulating on the appropriate lane depending on the turning direction preselected before the entry in the intersection [14,15].
The reduction of entry and circulating speed, the number of conflict points, and the potential occurrence of side-by-side accidents are the main advantages of turbo roundabouts in terms of safety performance [14].
In comparison with traditional intersection types, the decrease in the potential conflict spots ranges between 38% and 66%, depending on the turbo roundabout arrangement. The turbo roundabout design, through conflict reduction, puts into effect the most effective criterion in terms of traffic safety at intersections [11]. Each additional conflict point is a contributing element to accident risk increase.
In Slovenia, a very low number of accidents has been recorded for existing turbo roundabouts [16]. The analysis of crash data showed that the occurred accidents involved only property damage, thus highlights the fact that this layout contributed to limiting both frequency and gravity of injuries.
Mauro et al. [17] carried out a methodology to assess the safety performances of a turbo roundabout exploring a series of crash typologies that can occur as a consequence of critical vehicle manoeuvres performed at the intersection area. They observed a decrease of about 40–50% in the number of total crashes and 20–30% in the number of injuries, compared to conventional roundabouts.
Fortuijn in his studies [10] estimated the reduction of the traffic crash rate by about 70% and concluded that the safety levels of the turbo roundabout can be comparable to the traditional single-lane layout.
In order to highlight the impact of turbo roundabouts on traffic safety, a before-and-after analysis based on the accident rate (comparison before and after the reconstruction with the new layout) has been conducted in the Czech Republic. The average percentage of the accident rate reduction estimated for the selected intersections is 41%; the percentage can reach significant higher values in several locations (about 70%). The authors pointed out that safety benefits could be increased by the installation of lane dividers [11].
The improved safety performances of turbo roundabouts compared to traditional multi-lane roundabouts are confirmed by many previous works. Different real case studies show that increased benefits in terms of road safety can be associated with the conversion of a double-lane geometric scheme into this modern layout.
After a three-year period in operation, the safety performances of the first turbo roundabout built in North America were compared to other multi-lane roundabouts existing in the same area. Results showed that the number of crashes per year at the turbo roundabout is 0.33 whereas the highest value of crash frequency observed at other types of roundabouts investigated is 44 collisions per year [18].
Wankogere et al. [19] carried out a driving simulator test to explore drivers’ behaviour at a turbo roundabout and a two-lane configuration. Focusing on the impact of signs and pavement markings on the driver’s performance, they stated that the turbo roundabout layout helps drivers in selecting and keeping the correct lanes. The benefits derive from the physical separation of lanes which imply that the traffic flow is channelled. Reduced travel speeds have an impact on lane-keeping too. The reduction of operative speeds both for traffic flows approaching and leaving the intersection area is an important feature of the roundabout scheme. In the classic layout, this decrease is measured at a distance of 300 m from the roundabout [9].
Tollazzi and Renčelj [20] underline that the lower travel speed on the turbo roundabout ring is a significant contributing element to better traffic safety conditions in comparison with the conventional multi-lane roundabouts. Significant speed reduction from 48 to 38 km/h is observed for drivers using the outer lane of a turbo-roundabout relatively to the classic two-lane layout [21].
The increased safety levels related to the reduced operative speeds suggest that the turbo roundabout solution is appropriate to be implemented in the context with pedestrian and two-wheel flows too, such as urban areas [22].
Bulla and Castro [23] carried out a road safety audit procedure to compare a roundabout and turbo roundabout in an urban area. Comparing the intersections investigated, they found a 22% decrease in the overall risk level, thus confirming the advantages in terms of higher safety level for the turbo roundabout scheme. Furthermore, a capacity increase of 7% was highlighted for the turbo roundabout in comparison with the standard configuration. The aim of the implementation of road safety audits in the design phase is to identify all road safety benefits and unsafe features of both schemes in a preventive way (before the operation stage) [24].
Several studies addressed the operational performances of turbo roundabouts and compared this layout with conventional schemes. A higher operational performance level of turbo-roundabouts in comparison to double-lane layouts depends on different variables such as the balance of traffic volumes approaching the intersection [25,26] and the increased proportion of right turns on the secondary lane [15].
Decreasing the conflict points between vehicles at the approaches and improving lane utilization by the distribution of the traffic flows tend to increase the capacity [10]. Increased fluidity for traffic entering and exiting the intersection maximize the benefits in terms of operational performances [20]. Engelsman and Uken [25] concluded that the capacity increase estimated for the turbo roundabout scheme is about 25% to 35% in relation to the capacity of an equivalent two-lane standard roundabout and assuming that the total traffic volumes on the approaches do not exceed 3000 to 3500 vehicles per hour. Baranowski [27] stated that the increased capacity performances of the turbo roundabout are mostly due to improved lane utilization.
Capacity models are generally classified as empirical (statistical) regression models based on field data, analytical models (semi-probabilistic) based on the gap acceptance theory, and micro-simulation models [26,28,29]. For an operational analysis of the turbo roundabout purpose, Pitlova and Kocianova [30] compared theoretical models and microsimulations. They evaluated the performance parameters of two turbo roundabout configurations (basic and egg) in order to find a suitable alternative to solve congestion and safety problems of a case study involving a single-lane roundabout. They obtained similar values from the two different methods. In particular, a 70–90% reduction of average waiting times was observed for both basic and egg turbo roundabouts in comparison with the existing single-lane roundabout results.
In a recent study, Vinayaka & Prathap [31] investigated the effects related to the conversion of three double-lane roundabouts in the turbo configuration. Empirical and micro-simulation methods were used. A decrease in delay between 5 and 9 s/vehicle was found and it was linked to the lowest likelihood of interaction between vehicles in the new roundabout geometry.
Despite the excellent performances expected in terms of safety, Bastos Silva et al. [32] stated that turbo roundabouts can provide higher capacity than two-lane standard roundabouts of similar size only in specific traffic conditions. Gredoska et al. [33] concluded that factors such as the entry and circulating traffic flows and the pedestrian flows affect the operational performances of turbo roundabouts.
Gallelli and Vaiana [34] observed increased capacity performance for an existing standard multi-lane roundabout with unbalanced flows converted into a modelled egg turbo roundabout. Using a micro-simulation tool to compare both layouts, they highlighted that capacity for each entry of the simulated turbo roundabout could be increased between 11 and 93%. Queue lengths can be minimized by more than 90% for some entries. They suggest that a turbo roundabout is a viable solution for the case study investigated. By means of microsimulations, Anagnostopoulos & Kehagia [35] observed a reduction of the average queue length (about −90%) when exploring the benefits related to the upgrading of an existing two-lane roundabout to a turbo roundabout. Additionally, they noticed a reduction in pollutant emissions.

2. Materials and Methods

2.1. Case Study Analysis

A case study roundabout is placed in the municipality of Rende along the State Road SS107 (secondary rural road), an important axis of the Southern Italy road network.
In 2019, the previous traditional priority junction was replaced by the existing roundabout in order to overcome several safety issues and improve the traffic flow. The most common safety problems at the conventional intersection were mainly related to improper driver’s manoeuvres: manoeuvres not allowed, such as the manoeuvres in the directions C-A and A-C, crossing the dominant through traffic flow (B-D) (Figure 1). Several traffic accidents were recorded in the functional area of the junction. The case study roundabout was built to overcome the issues related to a high demand of traffic turning in these directions not allowed in the previous intersection.
The construction of the existing roundabout has contributed to mitigate the previously highlighted safety issues, thanks to the reduced operative speed and the channelization of the turning vehicles. However, the current conventional roundabout suffers from traffic congestion and deficits in the levels-of-services, particularly during the rush hour.
The test site roundabout is geometrically characterised by four legs, a circulatory roadway width of 8 m and an external diameter of 38 m. Considering the value of the external diameter, included between 25 and 40 m, the selected roundabout, can be classified as a compact roundabout, in accordance with the Italian laws [36] (Figure 1).
The case study roundabout was investigated by the microsimulation approach in order to compare its operational performance with the previous priority junction and with an alternative solution, a modelled egg turbo roundabout.
In summary, the following three different scenarios were considered:
  • Scenario_PR (pre-roundabout): a traditional priority junction corresponding to the pre-construction stage of the roundabout. In this configuration, the traffic flow on the main road is continuous through the intersection. Lateral minor road approaches are connected to the major road forming two opposing T-junctions; two channelizing islands direct and control turning traffic manoeuvres (Figure 2).
  • Scenario_R (roundabout current state)—the existing roundabout;
  • Scenario_TR (turbo roundabout)—the modelled turbo roundabout (Section 2.2).
A traffic survey was carried out on the test site roundabout during a typical weekday between 12:45 p.m. and 1:45 p.m., because the case study roundabout suffers from traffic congestion during peak hours. Data on circulating and exiting traffic flows for each roundabout leg are summarised in the O/D matrix.
Table 1 shows the O/D matrix, homogenized in vehicles per hour to account for different vehicles characteristics. The coefficients used in this procedure are specified in the Highway Capacity Manual 2010 [37] which reports the following Passenger Car Equivalent coefficients: 1 for cars and 2 for heavy vehicles. For motorcycles, the adjusting factor is set to 0.5.
The analysis of the O/D matrix highlights that the through traffic flow is dominant: a significant percentage of the manoeuvres in the roundabout (about 49%) is part of the through movements along the main road trajectories (B-D/D-B). The total number of manoeuvres turning right is above 25%. A higher proportion of right-turn manoeuvres are observed in the direction B-C (about 10%).

2.2. Scenario Turbo Roundabout

As stated in the Introduction, previous studies showed that converting conventional junctions and roundabouts to turbo roundabouts can significantly improve both the traffic and safety level of the intersection area [38,39,40].
The third scenario concerns the definition of an alternative solution to the second scenario: the standard existing roundabout is converted into a turbo roundabout. Among all the different types of layouts, an egg turbo roundabout was selected. The main feature of the design of this turbo roundabout is the increased number of lanes in correspondence with the dominant through traffic flow.
From a methodological perspective, a detailed project of the new configuration of the intersection is defined in order to compare the modelled turbo roundabout with the performance characteristics of scenarios 1 and 2 (Figure 3).
Establishing the geometric attributes of the turbo roundabout, the external radius measure of the new layout is fixed at 21.15 m with the aim of fitting the new design to the limited available area. The positions of the turbo roundabout legs are kept unchanged compared with the existing roundabout.
The egg turbo roundabout implemented has two lanes at each entry and exit along the main road (roundabout legs B and D). The lane width for these arms is 3.50 m. For the roundabout secondary arms, A and C, the traffic flow is concentrated in a single lane (3.50 m) both at the entry and the exit.
The turbo-block is the reference element for the particular geometric design of the egg turbo roundabout. This basic combination of circles allows defining the vehicle spiral paths by positioning and shifting the centres of the three circular segments with different radii along a translation axis [10].
Curbs with a width of 30 cm are planned for defining the spiral paths in the circulatory roadway and the physical separation of the lanes at the entry and exit areas (for legs B and D).

3. Results and Discussion

3.1. Operational Performances: A Comparison between the Scenarios

For the microsimulation model, the VISSIM® software was used. A systematic procedure was carried out to calibrate the microsimulation model, following the indications of previous studies [38,41,42,43] and setting up the following factors in order to obtain realistic modelling:
  • traffic flow distribution;
  • priority rules;
  • speed areas (locating the sections defining vehicles speed changes at the approaches and exits as well as in circulating zones);
  • parameters that take into account driver behaviour.
The microsimulation model allows to obtain useful information on the following key operational performance measures:
  • queue length (m);
  • travel times (s);
  • delay times (s).
The time period for the operational performance evaluation was 3600 s.
Table 2 shows that the lowest queue length values can be observed for the Scenario pre-roundabout. Measurements are higher for the Scenario_R (the existing roundabout). Critical values can be observed for arms B and D thus leading to traffic congestion problems.
A decrease in the values is recorded for the planned egg turbo roundabout in comparison with the existing roundabout, especially for legs B and C. Compared to the roundabout design, the turbo roundabout solution allows to obtain a decrease of about 70–90% in the average values of queue length. Moreover, the highest reduction is observed for the two main approaching branches, B and D, with a percentage decrease of about 95%. For these approaches, the average queue lengths are reduced by more than 300–400 m. Obviously, the queue length results strongly impact the travel and delay times.
Comparing the three scenarios, the highest rates of average travel times are observed for the existing roundabout; the measures are particularly higher for legs A and D (178.03 s and 164.97 s, respectively).
It can be seen from Table 3 that the travel durations obtained for the egg turbo roundabout are approximately comparable to those recorded for the Scenario pre-roundabout, except for approach C. These findings seem to be significant: in the egg turbo roundabout, the layout travel times are similar to those of the priority junction, especially for the dominant through traffic flow.
Reduced travel time are denoted for the turbo roundabout compared with the conventional roundabout. The percentage decrease ranges between −53% and −86%; three of the four legs (A, B and D) show an improvement in travel times higher than 80%, for approach C this same percentage is about 53%.
Table 4 shows the average values of vehicle delays for each layout investigated and a comparison between the three scenarios based on the percentage change assessment. Delay times are strictly related to the parameters discussed above.
As can be seen in Table 4, the lowest measurements are observed for the traditional priority junction (first row in Table 4). The implementation of the roundabout solution caused an increase in delays, especially for approaches A, B and D. In contrast, the decrease in delays can reach significant values in the modelled egg turbo roundabout solution: delay times could be reduced by 89–95%.
Figure 4 shows the simulation output in terms of maximum travel times and maximum delays for the three layouts investigated, confirming the results discussed for the average evaluation indicators. The bars in the graph indicate the simulated measures of maximum travel time. According to the definition, travel time is cumulative of delay times and running times [44]. Figure 4 allows assessing how delays affect the total travel duration.
From these comparisons, it is evident that the existing roundabout (Scenario_R) is marked by several operational issues. Although this scenario could be safer than the previous intersection, the microsimulation traffic model showed that the replacement of the traditional priority junction with the compact roundabout did not lead to an upgrade of the level of service. Comparing the two layouts (Scenario_PR and Scenario_R), the results highlighted a drastically increase in all the operational performance parameters investigated, as observed in the field. The queue lengths are significant for each approach, reaching a maximum value of above 480 m. Although an assessment between queue length and crash rates is not quantitatively defined, higher values of queue length imply a higher potential danger [45].
The results obtained by the analysis suggest that the proposed egg turbo roundabout (Scenario_TR) allows recording a notable functional improvement in comparison with the existing roundabout. This new configuration of the intersection is associated with a decrease in travel and delay times and can significantly contribute to a queue length reduction by more than 70%. The reduction in queues and delays and thus in the sequence of cycles of acceleration-deceleration has an impact on fuel consumption, emissions of air pollutants, and noise [12].

3.2. Safety Analysis: A Comparison between the Scenarios

In this section, the surrogate safety assessment model (SSAM) is used to investigate the safety performances of the three different scenarios.
The vehicle trajectory data, extracted from the microsimulation software (VISSIM), are processed by the SSAM tool, generating information useful in predicting the number, location and severity of potential traffic conflicts. Twenty simulations were carried out for each scenario. Table 5 summarizes the number and the type of potential conflicts. The same data are displayed in Figure 5 to highlight the spatial distribution of the predicted hypothetical conflict points; the type of conflict as well as its location in the intersection, are easily discernible.
Conflicts are classified into four types:
  • crossing (|conflict angle| > 85°);
  • rear-end (|conflict angle| < 30°);
  • lane-change (30° ≤ |conflict angle| ≤ 85°);
  • unclassified (the conflict angle is unknown).
The conflict angle, defined by the interaction between two conflicting vehicles, is the main parameter affecting the above-mentioned classification [46].
It can be seen from Table 5 that the highest number of conflict points is recorded for the existing roundabout (Scenario_R); more than 73% of these conflicts are the result of entering the rear-ends: rear-end conflicts are present on all four approaches, especially near to the entries B, C and D (Figure 5b).
In the Scenario_PR, some rear-end conflicts occurred due to turning vehicles from the lateral minor approaches to the major road.
Overall, the comparison between the three configurations highlights an increased number of the total predicted conflict points for the roundabout scenario as compared to the traditional priority junction; whereas there is not a significant decrease in the number of the potential conflicts recorded for the turbo roundabout in comparison with the existing intersection (a decrease of approximately 15%). For the case study, the number of conflicts classified as path-crossing and lane-change recorded for the roundabout is comparable to those of the turbo roundabout; the potential number of rear-end conflicts, impacting negatively the safety level of the existing roundabout, could be reduced by 26% in the modelled turbo roundabout.
For the assessment of the surrogate safety of the different intersection scenarios the following measures have been collected:
  • TTC (time-to-collision);
  • PET (post-encroachment time);
  • DR (deceleration rate);
  • MaxS (maximum speed);
  • DeltaS (maximum speed differential).
TTC, PET and DR add information about the probability of the potential conflict event; more specifically, lower values of TTC and PET and higher values of DR indicate a higher risk of collision. MaxS and DeltaS can both be considered as a measure of the severity of the collision [45]. As reported by Gettman and Head [47], higher values of the related speed parameters, MaxS and DeltaS, impact with a higher severity level the effects of the resulting collision of the conflict event.
Table 6 and Table 7 show a summary of the surrogate conflict measures for each individual conflict type concerning the probability and the severity of the collision, respectively. The minimum, maximum and mean values are reported for the roundabout and turbo roundabout scenarios. Herein, the values recorded for the pre-roundabout scenario are not reported since only three potential rear-end conflicts have been observed for this intersection layout.
From these comparisons, we may draw the following conclusions. As was expected from the analysis of the number of conflicts, there is not a significant difference in terms of probability of collision between the roundabout and the turbo roundabout: similar results are obtained for the average values of each SSAM measure, for both the scenarios and for the three different type of conflicts (see Table 6).
Similar findings can be obtained considering the SSAM measures used to investigate the severity of the potential resulting collisions (Table 7). However, the slightly higher average values of the MaxS and DeltaS measures, recorded for the Scenario_TR for rear-end and lane-change types of conflicts, indicate that the level of severity of collisions might be higher when these types of conflict occur in the turbo roundabout intersection, as compared to the roundabout scenario (Scenario_R).
The analysis of the output of SSAM tool concerning the number of conflict situations showed that the number of rear-end conflicts could be approximately reduced by 26% in the modelled turbo roundabout; however, in this type of layout, rear-end conflicts might result in an increased magnitude of the collision consequences.

4. Conclusions

A common and widespread safety measure is the transformation of conventional intersections into a roundabout scheme. The roundabout solution is internationally recognized as a safe, suitable and efficient type of intersection control and traffic regulation. However, this intersection configuration does not lead to an upgrade of the level of service or the safety potential in every context. The deep literature review suggested that the turbo roundabout, a new type of multi-lane geometric configuration, could help to overcome the limitations of low capacity and unsafe traffic situations.
In this study, the authors want to highlight that the advantages and disadvantages of replacing a traditional junction with a roundabout or a modern turbo roundabout layout cannot be generalised, given the dependency on specific traffic conditions.
In light of the above, a comparative analysis is carried out for three different scenarios: a traditional priority junction (the pre-roundabout scenario), the roundabout current state and the modelled turbo roundabout scenario. A modelled egg turbo roundabout is proposed as an alternative solution to the conventional existing case study roundabout which suffers from traffic congestion and deficits in the levels-of-services, particularly during busy hours. The microsimulation model, implemented by the VISSIM software, was used to explore the most relevant operational performance measures: queue length, travel times and delays. Comparing the three layouts, the findings highlighted that the highest values of queue length, travel times and delays are recorded for the existing compact roundabout. In terms of operational performances, the proposed egg turbo roundabout allowed a notable functional improvement compared to the existing conventional roundabout: this new configuration of the intersection is associated with a decrease in travel and delay times and could significantly contribute to the reduction of the average queue length by more than 70%. Furthermore, the decrease in delays and queue length provides environmental benefits, as it contributes to downgrading emissions of air pollutants and fuel consumption.
Afterwards, the surrogate safety assessment model (SSAM) was used to investigate the safety performances of the three different scenarios. The comparison, in terms of the potential number of conflicts, showed an increased number of the total predicted conflict points for the roundabout scenario as compared to the traditional priority junction; whereas there was not a significant decrease in the number of the potential conflicts recorded for the turbo roundabout in comparison with the existing roundabout (a decrease of approximately 15%). The collection of different SSAM measures, such as TTC, PET, DR, MaxS, DeltaS allowed investigating the probability and severity of the potential collisions. The analysis of the average values of the above-mentioned SSAM measures showed that, in terms of probability of collision, the safety performance of the roundabout is comparable to the turbo roundabout. The slightly higher average values of the measures used to investigate the severity of the potential resulting collision indicated that the level of severity of collisions might be higher when some types of conflicts occur in the turbo roundabout intersection (such as rear-ends and lane-change conflicts). The considerations and findings are strictly related to this specific case study. An approach that takes into account both operational and safety measures, using micro-simulation models, supports authorities and practitioners in planning the most effective infrastructural solution, compared with an alternative.

Author Contributions

Conceptualization, V.G. and R.V.; methodology, V.G.; validation, V.G., G.P. and R.V.; formal analysis, V.G.; investigation, V.G.; data curation, V.G. and G.P.; writing—original draft preparation, G.P.; writing—review and editing, V.G., G.P. and R.V.; supervision, R.V. All authors have read and agreed to the published version of the manuscript.

Funding

This research received no external funding.

Institutional Review Board Statement

Not applicable.

Informed Consent Statement

Not applicable.

Data Availability Statement

Not applicable.

Acknowledgments

The authors want to acknowledge Eng. Pasquale Simone Gatto for his contribution in the survey of field data.

Conflicts of Interest

The authors declare no conflict of interest.

References

  1. European Commission. Europe on the Move. Sustainable Mobility for Europe: Safe, Connected, and Clean. 2018. Available online: https://eur-lex.europa.eu/resource.html?uri=cellar%3A0e8b694e-59b5-11e8-ab41-01aa75ed71a1.0003.02/DOC_1&format=PDF (accessed on 19 January 2021).
  2. European Commission. EU Road Safety Policy Framework 2021–2030—Next Steps towards “Vision Zero”. 2019. Available online: https://ec.europa.eu/transport/sites/transport/files/legislation/swd20190283-roadsafety-vision-zero.pdf (accessed on 13 January 2021).
  3. Szymanek, A. System Approach in Road Safety Studies. Commun. Sci. Lett. Univ. Zilina 2020, 22, 201–210. [Google Scholar] [CrossRef]
  4. European Commission. DG Energy and Transport, High Level Group Road Safety. Road Infrastructure Safety Management. Brussels, Belgium, 2003. Available online: http://www.expertas.de/01_en/02_docs/020_EC_SafetyManagement03_en/safety_manag.pdf (accessed on 20 January 2021).
  5. Elvik, R.; Vaa, T. The Handbook of Road Safety Measures; Elsevier Science: Amsterdam, The Netherlands, 2004. [Google Scholar]
  6. Ahn, K.; Rakha, H.; Trani, A.; Aerde, M. Estimating Vehicle Fuel Consumption and Emissions Based on Instantaneous Speed and Acceleration Levels. J. Transp. Eng. 2002, 128, 182–190. [Google Scholar] [CrossRef]
  7. Jaworski, A.; Mądziel, M.; Lejda, K. Creating an emission model based on portable emission measurement system for the purpose of a roundabout. Environ. Sci. Pollut. Res. 2019, 26, 21641–21654. [Google Scholar] [CrossRef] [Green Version]
  8. Elvik, R. Effects on road safety of converting intersections to roundabouts: Review of evidence from non-US studies. Transp. Res. Rec. 2003, 1847, 1–10. [Google Scholar] [CrossRef]
  9. De Winne, E. Roundabouts for safer roads. WIT Trans. Built Environ. 2009, 108, 541–551. [Google Scholar]
  10. Fortuijn, L.G.H. Turbo roundabouts: Design Principles and Safety Performance. Transp. Res. Rec. J. Transp. Res. Board 2009, 2096, 16–24. [Google Scholar] [CrossRef]
  11. Skvain, V.; Petru, J.; Krivda, V. Turbo-Roundabouts and their Basic Evaluation at Realized Constructions in Czech Republic. Procedia Eng. 2017, 190, 283–290. [Google Scholar] [CrossRef]
  12. FHWA. Roundabouts: An Informational Guide; Report No. FHWA-RD-00–067; Federal Highway Administration: Washington, DC, USA, 2000.
  13. Džambas, T.; Ahac, S.; Dragčević, V. Geometric design of turbo roundabouts. Teh. Vjesn. Tech. Gaz. 2017, 24, 309–318. [Google Scholar]
  14. Guerrieri, M.; Mauro, R.; Parla, G.; Tollazzi, T. Analysis of kinematic parameters and driver behavior at turbo roundabouts. J. Transp. Eng. Part A Syst. 2018, 144, 04018020. [Google Scholar] [CrossRef]
  15. Bastos Silva, A.; Santos, S.; Gaspar, M. Turbo-Roundabout use and design. In Proceedings of the CITTA 6th Annual Conference on Planning Research 2010, Coimbra, Portugal, 17 May 2013; pp. 1–14. [Google Scholar]
  16. Tollazzi, T.; Turnšek, S.; Renčelj, M. Slovenian experiences with turbo-Roundabouts. In Proceedings of the 3rd International Book on Roundabouts, TRB, Carmel, IN, USA, 3 June 2011. [Google Scholar]
  17. Mauro, R.; Cattani, M.; Guerrieri, M. Evaluation of the safety performance of turbo roundabouts by means of a potential accident rate model. Balt. J. Road Bridge Eng. 2015, 10, 28–38. [Google Scholar] [CrossRef] [Green Version]
  18. Murphy, T. The Turbo Roundabout: A First in North America. In Proceedings of the 2015 Conference of the Transportation Association of Canada 2015, Charlottetown, PE, Canada, 27–30 September 2015. [Google Scholar]
  19. Wankogere, E.J.; Kwigizile, V.; Oh, J.S.; Ikonomov, P. Comparison of driver navigation at turbo roundabouts and modern two-lane roundabouts simulation study. Transp. Res. Rec. 2017, 2637, 89–98. [Google Scholar] [CrossRef]
  20. Tollazzi, T.; Renčelj, M. Turbo-roundabouts in Slovenia—State of the art. In Proceedings of the XII International Symposium “Road Accidents Prevention 2014”, Borsko Jezero, Serbia, 9–10 October 2014. [Google Scholar]
  21. Fortuijn, L.G.H. Turbo-Kreisverkehre-Entwicklungen und Erfahrungen. In Proceedings of the Seminar Aktuelle Theme der Strassenplanung, Bergisch Gladbach, Germany, 25 January 2007. [Google Scholar]
  22. Corriere, F.; Guerrieri, M. Performance Analysis of Basic Turbo-Roundabouts in Urban Context. Procedia Soc. Behav. Sci. 2012, 53, 622–632. [Google Scholar] [CrossRef] [Green Version]
  23. Bulla-Cruz, L.A.; Castro, W. Analysis and comparison between two-Lane roundabouts and turbo roundabouts based on a road safety audit methodology and microsimulation: A case study in urban area. In Proceedings of the 3rd International Conference on Road Safety and Simulation, Indianapolis, IN, USA, 14–16 September 2011. [Google Scholar]
  24. Vaiana, R.; Perri, G.; Iuele, T.; Gallelli, V. A Comprehensive Approach Combining Regulatory Procedures and Accident Data Analysis for Road Safety Management Based on the European Directive 2019/1936/EC. Safety 2021, 7, 6. [Google Scholar] [CrossRef]
  25. Engelsman, J.C.; Uken, M. Turbo roundabouts as an alternative to two lane roundabouts. SACT 2007, 2007, 581–589. [Google Scholar]
  26. Giuffrè, O.; Granà, A.; Marino, S. Comparing performances of turbo-roundabouts and double-lane roundabouts. Mod. Appl. Sci. 2012, 6, 70–79. [Google Scholar] [CrossRef]
  27. Baranowski, B.; P.E. Roundabouts USA. Turbo Roundabout Design? Redesign of Park City’s 14 Year Old Deer Valley Roundabout. In Proceedings of the TRB 4th International Conference on Roundabouts, Seattle, WA, USA, 16–18 April 2014. [Google Scholar]
  28. Elhassy, Z.; Abou-Senna, H.; Shaaban, K.; Radwan, E. The implications of converting a high-Volume multilane roundabout into a turbo roundabout. J. Adv. Transp. 2020, 2020, 5472806. [Google Scholar] [CrossRef]
  29. Gallelli, V.; Guido, G.; Vitale, A.; Vaiana, R. Effects of calibration process on the simulation of rear-end conflicts at roundabouts. J. Traffic Transp. Eng. 2019, 6, 175–184. (In English) [Google Scholar] [CrossRef]
  30. Pitlova, E.; Kocianova, A. Case Study: Capacity characteristics comparison of single-Lane roundabout and turbo-roundabouts. Procedia Eng. 2017, 192, 701–706. [Google Scholar]
  31. Vinayaka, B.; Prathap, K.R. A study on upgrading of two lane Roundabouts to Turbo-Roundabouts in Banglore City. J. Xi An Univ. Archit. Technol. 2020, 7, 2820–2829. [Google Scholar]
  32. Bastos Silva, A.; Vasconcelos, A.; Santos, S. Moving from Conventional Roundabouts to Turbo-Roundabouts. Procedia Soc. Behav. Sci. 2014, 111, 137–146. [Google Scholar] [CrossRef] [Green Version]
  33. Gredoska, N.; Bombol, K.; Koltovska Nechoska, D. An Evaluation of Turbo Roundabout Performances: Case Study of the City of Ohrid. Int. J. Traffic Transp. Eng. 2016, 6, 196–211. [Google Scholar] [CrossRef] [Green Version]
  34. Gallelli, V.; Vaiana, R. Safety Improvements by Converting a Standard Roundabout with Unbalanced Flow Distribution into an Egg Turbo Roundabout: Simulation Approach to a Case Study. Sustainability 2019, 11, 466. [Google Scholar] [CrossRef] [Green Version]
  35. Anagnostopoulos, A.; Kehagia, F. Turbo-Roundabouts as an Alternative to Roundabouts in terms of Traffic Safety, Capacity and Pollutant Emissions. In Proceedings of the 7th Pan-Hellenic Road Safety Conference, Larissa, Greece, 11–12 October 2018. [Google Scholar]
  36. MIT. Norme Funzionali e Geometriche per la Costruzione delle Intersezioni Stradali; Ministero delle Infrastrutture e dei Trasporti: Rome, Italy, 2001.
  37. TRB. Highway Capacity Manual—HCM 2010, Transportation Research Board; National Research Council: Washington, DC, USA, 2010. [Google Scholar]
  38. Gallelli, V.; Iuele, T.; Vaiana, R. Conversion of a Semi-two Lanes Roundabout into a Turbo-Roundabout: A Performance Comparison. Procedia Comput. Sci. 2016, 83, 393–400. [Google Scholar] [CrossRef] [Green Version]
  39. Praticò, F.G.; Vaiana, R.; Gallelli, V. Micro-Simulation effectiveness in predicting operating speed profiles in a roundabout. Adv. Transp. Stud. 2015, 37, 5–14. [Google Scholar]
  40. Pompigna, A.; Guerrieri, M.; Mauro, R. New Extensions and Applications of the Modified Chumanov Model for Calculating Entry Capacity of Single-Lane Roundabouts. Sustainability 2020, 12, 6122. [Google Scholar] [CrossRef]
  41. Vaiana, R.; Gallelli, V.; Iuele, T. Sensitivity analysis in traffic microscopic simulation model for roundabouts. Balt. J. Road Bridg. Eng. 2013, 8, 174–183. [Google Scholar] [CrossRef]
  42. Gallelli, V.; Iuele, T.; Vaiana, R.; Vitale, A. Investigating the transferability of calibrated microsimulation parameters for operational performance analysis in roundabouts. J. Adv. Transp. 2017, 2017, 1–10. [Google Scholar]
  43. Gallelli, V.; Vaiana, R.; Iuele, T. Comparison between simulated and experimental crossing speed profiles on roundabout with different geometric features. Procedia Soc. Behav. Sci. 2014, 111, 117–126. [Google Scholar] [CrossRef] [Green Version]
  44. Turner, S.M.; Eisele, W.L.; Benz, R.J.; Holdener, D.J. Travel Time Data Collection Handbook (Report FHWA-PL-98-035); Federal Highway Administration: Washington, DC, USA, 1998.
  45. Gettman, D.; Head, L. Surrogate Safety Measures from Traffic Simulation Models. Transp. Res. Rec. 2003, 1840, 104–115. [Google Scholar] [CrossRef] [Green Version]
  46. Pu, L.; Joshi, R. Surrogate Safety Assessment Model (SSAM): Software User Manual; Turner-Fairbank Highway Research Center, FHWA, U.S. Department of Transportation: McLean, VA, USA, 2008.
  47. Gettman, D.; Head, L. Surrogate Measures of Safety from Traffic Simulation Models; Report No. FHWA-RD-03–050; Federal Highway Administration (FHWA): Washington, DC, USA, 2003.
Figure 1. Case study roundabout: A, B, C and D identify the approaches of the junction.
Sustainability 13 05103 g001
Figure 2. Scenario pre-roundabout: A, B, C and D identify the approaches of the junction.
Sustainability 13 05103 g002
Figure 3. Egg turbo roundabout design: A, B, C and D identify the approaches of the junction
Sustainability 13 05103 g003
Figure 4. Maximum travel times, maximum delay and running time for each scenario.
Sustainability 13 05103 g004
Figure 5. Locations of the predicted potential conflict points for the (a) Scenario_PR, (b) Scenario_R, (c) Scenario_TR.
Sustainability 13 05103 g005
Table 1. O/D matrix (vehicle/h).
O/DABCD
A313614090
B9051266535
C121146297
D186792574
Table 2. Average values of maximum queue length and comparison between the scenarios.
Average Values of Max Queue Length [m]
ABCD
Scenario_PR5.86-0.96-
Scenario_R207.69355.6362.65448.18
Scenario_TR36.4216.5417.3023.56
Percentage Change (%)
ABCD
Scenario_R vs Scenario_PR3444%-6415%-
Scenario_TR vs Scenario_R−82%−95%−72%−95%
Table 3. Average values of travel time and comparison between the scenarios.
Average Values of Travel Times [s]
ABCD
Scenario_PR22.5025.9917.5927.59
Scenario_R178.03121.2170.62164.97
Scenario_TR25.2422.5933.3428.42
Percentage Change (%)
ABCD
Scenario_R vs Scenario_PR691%366%302%498%
Scenario_TR vs Scenario_R−86%−81%−53%−83%
Table 4. Average values of delays and comparison between the scenarios.
Average Values of Delay Times [s]
ABCD
Scenario_PR1.410.310.580.40
Scenario_R164.6099.1941.48143.63
Scenario_TR11.304.524.536.47
Percentage Change (%)
ABCD
Scenario_R vs Scenario_PR11615%32244%7103%35808%
Scenario_TR vs Scenario_R−93%−95%−89%−95%
Table 5. Summary of the total number and different types of potential conflicts for each scenario.
Number and Types of Conflicts
TotalUnclassifiedCrossingRear-EndLane Change
Scenario_PR30030
Scenario_R2604193
Scenario_TR2205143
Table 6. SSAM Measures (probability of collision) for each type of conflict.
Scenario_RScenario_TR
Type of ConflictSSAM MeasureMinMeanMaxMinMeanMax
CrossingTTC [s]0.000.030.100.000.160.80
PET [s]0.000.050.200.000.040.20
DR [m/s2]−0.740.040.75−2.03−0.560.20
Rear-endTTC [s]1.401.481.501.201.441.50
PET [s]2.403.464.402.103.294.40
DR [m/s2]−3.09−1.88−0.18−3.03−2.70−1.69
Lane changeTTC [s]1.501.501.501.401.471.50
PET [s]3.003.834.302.103.103.80
DR [m/s2]−2.67−2.52−2.36−2.69−2.41−2.17
Table 7. SSAM Measures (severity of the collision) for each type of conflict.
Scenario_RScenario_TR
Type of ConflictSSAM MeasureMinMeanMaxMinMeanMax
CrossingMaxS [m/s]9.8717.9121.3614.2616.9120.64
DeltaS [m/s]8.9420.8028.3319.8327.7040.10
Rear-endMaxS [m/s]3.795.317.153.905.456.71
DeltaS [m/s]0.592.456.140.814.736.71
Lane changeMaxS [m/s]4.204.414.545.085.265.51
DeltaS [m/s]4.204.414.545.085.26−2.17
Publisher’s Note: MDPI stays neutral with regard to jurisdictional claims in published maps and institutional affiliations.

