Article

Multi-Hazard Risk Assessment of Kathmandu Valley, Nepal

by
Rajesh Khatakho
1,2,
Dipendra Gautam
1,3,4,5,*,
Komal Raj Aryal
6,*,
Vishnu Prasad Pandey
1,7,
Rajesh Rupakhety
8,
Suraj Lamichhane
1,7,
Yi-Chung Liu
9,
Khameis Abdouli
6,
Rocky Talchabhadel
1,10,
Bhesh Raj Thapa
1,5,11 and
Rabindra Adhikari
1,3,4,7
1
Interdisciplinary Research Institute for Sustainability, Kathmandu 44600, Nepal
2
Mannings Consult Pvt. Ltd., Lalitpur 44600, Nepal
3
Department of Civil Engineering, Cosmos College of Management and Technology, Lalitpur 44600, Nepal
4
Department of Civil Engineering, Institute of Engineering, Thapathali Campus, Tribhuvan University, Kathmandu 44600, Nepal
5
Nepal Academy of Science and Technology, Lalitpur 44600, Nepal
6
Faculty of Resilience, Rabdan Academy, Abu Dhabi 114646, United Arab Emirates
7
Department of Civil Engineering, Pulchowk Campus, Institute of Engineering, Tribhuvan University, Kathmandu 44600, Nepal
8
Earthquake Engineering Research Center, Faculty of Civil and Environmental Engineering, University of Iceland, Austuryegur 21, 800 Selfoss, Iceland
9
National Science and Technology Center for Disaster Reduction, New Taipei City 23143, Taiwan
10
Texas A&M AgriLife Research, Texas A&M University, El Paso, TX 79927, USA
11
Department of Civil Engineering, Universal Engineering and Science College, Lalitpur 44601, Nepal
*
Authors to whom correspondence should be addressed.
Sustainability 2021, 13(10), 5369; https://0-doi-org.brum.beds.ac.uk/10.3390/su13105369
Submission received: 19 March 2021 / Revised: 6 May 2021 / Accepted: 6 May 2021 / Published: 11 May 2021
(This article belongs to the Section Hazards and Sustainability)

Abstract

:
Natural hazards are complex phenomena that can occur independently, simultaneously, or in a series as cascading events. For any particular region, numerous single hazard maps may not necessarily provide all information regarding impending hazards to the stakeholders for preparedness and planning. A multi-hazard map furnishes composite illustration of the natural hazards of varying magnitude, frequency, and spatial distribution. Thus, multi-hazard risk assessment is performed to depict the holistic natural hazards scenario of any particular region. To the best of the authors’ knowledge, multi-hazard risk assessments are rarely conducted in Nepal although multiple natural hazards strike the country almost every year. In this study, floods, landslides, earthquakes, and urban fire hazards are used to assess multi-hazard risk in Kathmandu Valley, Nepal, using the Analytical Hierarchy Process (AHP), which is then integrated with the Geographical Information System (GIS). First, flood, landslide, earthquake, and urban fire hazard assessments are performed individually and then superimposed to obtain multi-hazard risk. Multi-hazard risk assessment of Kathmandu Valley is performed by pair-wise comparison of the four natural hazards. The sum of observations concludes that densely populated areas, old settlements, and the central valley have high to very high level of multi-hazard risk.

1. Introduction

Various geophysical locations on earth such as Himalayan region, alpine region, tropical region, volcanic vicinities, and coastal region, among others suffer from different hazards and their adverse impacts are exacerbated by population growth, urbanization, globalization, and climate change-induced alterations in the extreme weather. The economic losses associated with disaster events between 1990–1999 were more than 15 times higher than that between 1950–1959 [1]. Between 1995–2015, 1.35 million human casualties were attributed to natural disasters and half of them died due to earthquakes with the rest of the casualties being due to weather- and climate-induced hazards [2]. Although natural and anthropogenic hazards occur throughout the world, their economic and social consequences are much more severe in developing countries than in developed ones, resulting in negative economic growth thus obstructing development investment [1].
Nepal is exposed to a variety of natural hazards that cause disastrous damage to the built environment and result in loss of lives and properties. The most destructive natural hazards in Nepal are floods, landslides, earthquakes, and urban fire [3]. Young and fragile geology, very high relief, steep slopes, variable climatic conditions, and active tectonics trigger several natural hazards in Nepal every year. Furthermore, marginally planned and overpopulated settlements are the major factors that aggravate the impacts of disaster. For example, 13 different types of natural hazards resulted in 2940 disaster events between 2015–2016 [4]. These events caused 9708 fatalities; among them, 92.5% were due to the 2015 Gorkha earthquake. Furthermore, about a million houses were either partially or fully damaged and the total economic loss was estimated to be nearly 7 billion USD [5]. It is estimated that more than 80% of the total population can be exposed to natural hazards such as floods, landslides, windstorms, fires, and earthquakes [5]. Nepal lies in the 20th, 4th, 11th, and 30th rank worldwide in terms of multi-hazards, climate change- related hazards, earthquakes, and flood risks, respectively, as depicted by the 2004 study [6]. Disastrous events such as the 1993 flood, 2014 landslide, 2015 earthquake, and 2017 flood highlight the severity of multi-hazard risk in Nepal. There are several examples of one type of natural hazard resulting in another hazardous process in Nepal. For example, a massive landslide that occurred on 2 August 2014 at Jure village in central Nepal blocked the Sunkoshi River creating a landslide dam, which breached after 37 days with an outburst flood that damaged some houses more than 6 km downstream along the valley [7]. The 2015 Gorkha earthquake and aftershocks triggered many landslides and avalanches, the most notable among such was the debris avalanche that buried several villages in the Langtang Valley [8]. Furthermore, Nepal is prone to serial hazards that occur frequently and regularly, for example, floods and landslides occur every monsoon season (June–September). Sporadically occurring large earthquakes are known to increase spatio-temporal frequency of landslides as well. Complex interactions among different natural hazards result in cascading effects or synergies. Kathmandu Valley is prone to different types of natural hazards, and its built environment is very vulnerable [3]. Several studies have performed individual hazard assessments on seismic liquefaction [9,10,11], urban fire [12], ground shaking [13,14,15,16], flood [17,18], and landslide [19,20,21] in Kathmandu Valley. These studies are limited to a single natural hazard, variance in methodology, and study area coverage, which restrict decision-makers from determining areas susceptible to multiple hazards and from taking initiatives. Although multi-hazard occurrence is well supported by historical scenarios, multi-hazard risk studies are limited in Nepal.
Spatio-temporal distribution of primary impacts of a natural hazard is commonly presented in terms of hazard maps. Hazard mapping for different types of natural hazards such as floods [22,23,24,25,26], earthquakes [27,28,29], landslides [30,31,32,33], and urban fire [12,34] is widely reported in the literature. Hazard maps for different natural processes usually differ in definition/detail of hazard, spatio-temporal scales of the processes, and handling/integration of epistemic and aleatory uncertainties. Such maps are challenging to incorporate in policymaking, preparedness initiatives, and resource allocation efforts. In reality, natural hazards are complex processes and have cascading, triggering, knock-on, and domino effects. Risk mitigation and planning for such complex processes requires a holistic treatment of different hazards and their interactions, i.e., multi-hazard risk assessment. Therefore, a multi-hazard assessment is an effective tool in disaster and risk reduction, which depicts the coverage of potentially hazardous areas considering overall hazard scenarios. This term was first presented internationally in the context of sustainable development and Agenda 21 aiming to reduce environmental and disaster risk [35]. The United Nations (UN) supports the importance of multi-hazard risk assessment and elaborates it as “an essential element of a safer world in the twenty-first century”. Furthermore, it determines the vulnerable areas for multiple hazards with their threat levels that contribute to reduce the human casualties, economic losses, and identify priority areas for sustainable management [36]. Multi-hazard risk assessment faces several barriers such as lack of standard definitions of hazards caused by different processes, quantification of vulnerability and risk levels, methods for integrating different hazards, and the lack of empirical data, among others.
Methods such as heuristic and Multi-Criteria Decision Analysis (MCA) [37,38], statistical methods [39,40], deterministic methods [41], probabilistic methods [42,43], and artificial intelligence [44,45] have been employed in hazard assessments in published literature. The MCA can be implemented in frameworks such as the analytical hierarchy process (AHP) [46], fuzzy logic [47], and weight overlay method [48]. The AHP is one of the most popular MCA approaches. The AHP comprises problem definition, goals, alternatives determination, formulation of pair-wise comparison matrix, weight determination, and finding an overall priority [49]. It can be applied in absolute or relative measurements (experience and ability to judge observations) of connection between influencing factors and hazards that do not need a historical database and are simply based on the judgment of relative significance of each parameter class. However, the major demerits of this technique lie in its subjectivity in assigning weight and ratings for the parameter classes and lack of uncertainty estimation. Thus, the AHP method is effectively used only in relatively small study areas, which are often accessible for field investigation.
The study performs multi-hazard risk assessment and maps the same for Kathmandu Valley by optimizing the existing AHP method. This is achieved by integrating the AHP with a geographic information system (GIS). The blending of the AHP in GIS enhances the decision-making process with better illustration and mapping capabilities to facilitate the development of hazard maps. Such mapping helps to identify the highly susceptible areas for single hazard as well as multi-hazards that can play a significant role to address disaster risk reduction and also provide a guide for policymakers.

2. Materials and Methods

2.1. Study Area

Kathmandu Valley comprises three administrative districts: Kathmandu, Lalitpur, and Bhaktapur. It is located in central Nepal between 85°11′34″ E to 85°31′19″ E and 27°32′16.18″ N to 27°48′47.75″ N with a total area of 613 km2 (Figure 1). The valley is bowl-shaped loose soil deposit with relatively flat terrains centrally, hillocks in the outskirts, and mountains ranging from 1198 m to 2722 m above mean sea level (amsl) in the valley fringes. The weather is subtropical and is influenced by the South Asian monsoon with hot and wet summers (March–August) and cold and slightly dry winters (September–February). The average monthly rainfall varies widely with the lowest (4.2 mm) and the highest (402.1 mm) precipitation occurring in December and July, respectively. The valley is situated in the proximity of seismically active tectonic faults. The valley is filled with soft sediments and organic clay, which can potentially amplify ground shaking during moderate to large earthquakes.

2.2. Hazard Inventory Mapping

Individual hazard inventory mapping is a basic requirement of multi-hazard mapping. Mapping of hazardous events is important to understand the spatial relationship between the location of hazards and their predisposing factors. Inventory mapping in this study was performed by aerial photo interpretation, Google Earth engine, survey, historical data, and literature review. The inventory was cross-validated with the help of pilot field observations.

2.3. Factors Influencing Multi-Hazards

The type and source of data used in landslide, flood, fire, earthquake, and multi-hazard mapping are summarized in Table 1. Twenty-one influencing factors were selected based on the available information. Thereafter, a suitable class of the influencing factors and corresponding rating factors were assigned (Table 2). Each class was assigned with a rating factor between 0 to 4. The 0 value indicates the most stable condition having negligible hazard, whereas the value 4 represents the highest susceptibility of hazard occurrence. The overall methodological framework is presented in Figure 2. The Supplementary Tables S1–S4 summarize the influencing factors, classes, and corresponding rating factors for landslide, flood, fire, and earthquake hazard assessment, respectively. The thematic maps for the factors considered for flood, landslide, fire, and earthquake hazard assessment are depicted in Figure 3, Figure 4, Figure 5 and Figure 6, respectively. A summary of influencing factors for multi-hazard risk assessment is presented in Table 1.

2.3.1. Distance from Fault

Distance from faults is a significant factor for landslide events and seismic hazard because shorter distance from faults leads to greater probability of land subsidence, liquefaction, and building damage due to stronger shaking. The fault line data was digitized from Sakai [50] by geo-processing tools in Arc GIS 10.6, which depicts that the majority of fault lines are oriented along Northwest to Southeast (Figure 3a). The buffer zones at Euclidean distances of 200 m, 400 m, 600 m, 800 m, and greater than 800 m (Figure 3a) were used for both landslide susceptibility and earthquake hazard mapping.

2.3.2. Slope

Steeper slopes are more prone to landslides due to gravitational forces. The slope thematic map was prepared from the digital elevation model (DEM) [51]. The slope angle was classified in the interval of (i) 0–5°, (ii) 5–15°, (iii) 15–30°, (iv) 30–45°, and (v) >45° (Figure 3b) for landslide and seismic hazard mapping. Higher slope angle coincides with more likelihood of mass movements when compared to lower slopes. Gentle slopes and flat areas are more prone to flooding. For flood hazard assessment, slope angle was divided into intervals of (i) 0–3°, (ii) 3–7°, (iii) 7–13°, (iv) 13–20°, and (v) greater than 20° (Figure 4a).

2.3.3. Aspect

Aspect was derived from the DEM using ARC-GIS 10.6. Ten classes were considered as illustrated in Figure 3c. This factor is considered as an aggravation factor in landslides by several researchers [58,59]. It affects some hydrological processes such as evapotranspiration, weathering processes, vegetation, and plant root development, and meteorological events, such as the amount of rainfall and sunlight, drying winds, and the morphological structure of the area [60,61]. Normally, mountains observe more amount of rainfall leading to quick saturation of soil. However, it also depends upon factors such as slope topography, soil type, permeability, porosity, humidity, organic ingredients, land cover, and the climatic season [58]. This results in alteration of pore water pressure of slope material.

2.3.4. Profile Curvature

Profile curvature influences the driving and resisting stresses in the direction of mass movement. The profile curvature in this study was extracted from the DEM in Arc-GIS 10.6. Profile curvature was classified into (i) convex (<−0.5), (ii) flat (−0.5–0.5), and (iii) concave (>0.5) as shown in Figure 3d, which is used for landslide hazard assessment. Normally, convex slopes are well built as they dispense the runoff equally down the slope while concave slopes are regarded as potentially unstable as they concentrate water at the lowest point and contribute to the build-up of adverse hydrostatic pressure [62].

2.3.5. Distance from Stream

The stability of a slope depends on the degree of saturation of the material on the slope, and proximity to streams is considered to be an aggravation factor due to its contribution in saturation [63]. Proximity to the stream can be negatively correlated with the stability of slopes because it triggers the potential of slope erosion due to saturation of the lower part of the material. Precipitation results in the rise of river discharge that causes sediment deposition in the neighboring areas of the river and may lead to flooding. Five buffer zones were created to assign different levels of proximity as (i) <100 m, (ii) 100–200 m, (iii) 200–300 m, (iv) 300–400 m, and (v) >400 m for landslide and flood hazard assessment as shown in Figure 4c.

2.3.6. Land Use Land Cover (LULC)

The LULC change influences all four natural hazards considered in this study. It directly or indirectly affects some hydrological processes such as surface runoff, evapotranspiration, and infiltration and physical infrastructures such as open space, building stock, road and transport infrastructure, and critical facilities. For landslide hazard assessment, the agricultural land is more susceptible to landslide due to shallow rooted nature of most of the agricultural crops and the lack of proper drainage system. The presence of the built-up area creates the favorable environment for fire, flood, and earthquake hazard mostly due to exposure and the underlying vulnerabilities of constructed facilities. The LULC change factor was classified into (i) forest, (ii) water body, (iii) built area, (iv) agriculture land, and (v) restricted area as illustrated in Figure 4f.

2.3.7. Lithology

Lithology plays a vital role in landslide, earthquake, and flood hazard assessments. Three classes were considered for multi-hazard assessment as shown in Figure 4e. Local geological characteristics such as rock type, bed material deposition from the pre-historic era, surface runoff, infiltration, and permeability determine the effect of the geophysical, meteorological, and hydrological forces on terrain [44].

2.3.8. Distance from Road

Distance from road is negatively correlated with landslide as proximity to road may increase susceptibility of landslide hazard [64]. Good access and proximity of road network from the settlements reduce losses due to fire hazard as roads allow fire brigades to reach affected areas on time. Euclidean distance method was applied to generate five classes as (i) 0–100 m, (ii) 100–200 m, (iii) 200–400 m, (iv) 400–600 m, and (v) >600 m for landslide and fire hazard assessment as shown in Figure 3f.

2.3.9. Annual Precipitation

Heavy rainfalls trigger floods and landslides. Floods occur not only due to intensity and pattern of precipitation but also due to the moisture stored in the watershed basin, which is contributed by the previous hydrological process over a long time [65]. The inverse distance weighted (IDW) interpolation approach was applied to create the five buffer zones of rainfall as (i) <1400 mm, (ii) 1400–1500 mm, (iii) 1500–1600 mm, (iv) 1600–1800 mm, and (v) >1800 mm as depicted in Figure 4d.

2.3.10. Normalized Difference Vegetation Index (NDVI)
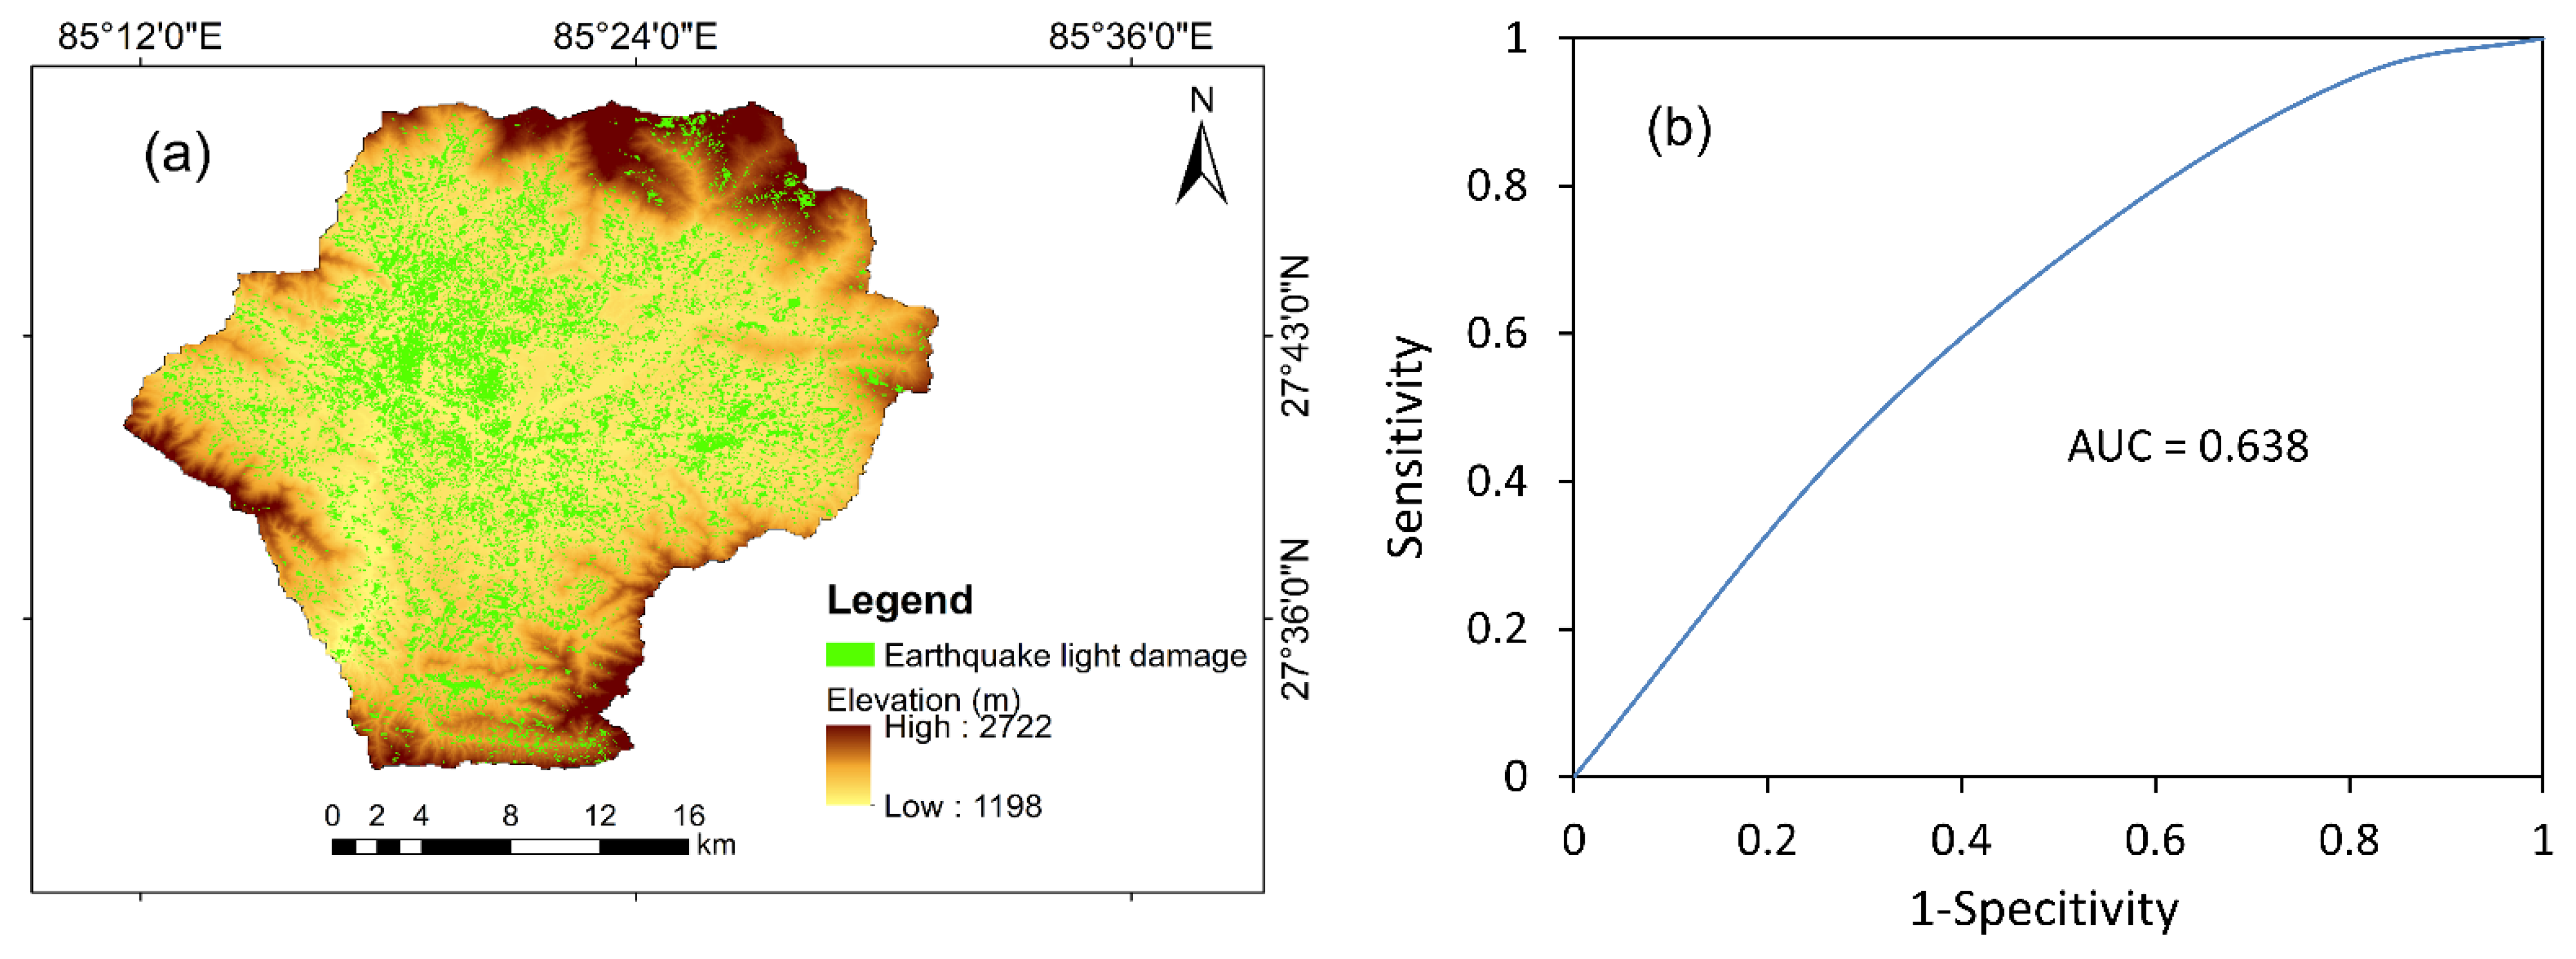
The NDVI was used to examine the presence of vegetation cover by measuring surface reflectivity. Vegetation provides both hydrological and mechanical effects that increase the stability of slopes by anchoring roots with soil and hence contribute in reducing speed of rainfall/run-off movement by creating a barrier. The NDVI was calculated from Landsat8 image in Arc-GIS 10.6 [51] and was classified into five categories as (i) 0–0.05, (ii) 0.05–0.15, (iii) 0.15–0.25, (iv) 0.25–0.35, and (v) 0.35–0.50, which were used in landslide hazard assessment. The NDVI value is inversely correlated to landslide susceptibility.

2.3.11. Elevation

Elevation was considered for landslide hazard because it is affected by geological processes. It commands the spatial disparity of hydro-meteorological condition and slope stabilities. It is also an influencing factor for flood as it affects runoff direction, moisture, temperature, wind direction, and the extent and the depth of the flood [66]. The DEM of 30 m resolution was used to derive the elevation classes of (i) <1300 m, (ii) 1300–1350 m, (iii) 1350–1450 m, (iv) 1450–1550 m, and (v) >1550 m as shown in Figure 4b.

2.3.12. Population Density

Dense settlements increase the exposure to natural as well as anthropogenic hazards. There lies a positive correlation between the population density and the potential number of casualties and property damaged by earthquakes and urban fire hazard. The high population density and clustered settlements result in challenges for response and evacuation during fire, landslide, and earthquake hazards. The population density was classified into six classes as illustrated in Figure 5a.

2.3.13. Distance from Fire Brigade

Fire brigades play a key role in protection and response activities as part of emergency management services in the case of fire incidences. Fire brigades when available in the vicinity will be effective in timely fire control. There are three fire brigades in the Kathmandu Valley. Euclidean distance method was applied to create the buffer zone of five classes as depicted in Figure 5b.

2.3.14. Distance from Gas Station

As per Nepal Oil Corporation (NOC) norms, a fuel station must consist of at least two fire extinguishers, four dry sand-filled buckets, water storage tanks, a spade, a fire axe, and safety gears such as fire-proof clothing and masks [12]. However, the safety measures are compromised in almost all gas stations. In addition, most of the gas stations are located nearby the densely populated areas that are under high risk of fire. The gas station locations were identified from Google Maps and five buffer zones were generated as illustrated in Figure 5c.

2.3.15. Distance from High-Voltage Transmission Lines

Transmission lines increase susceptibility of fires in their vicinity, and various damage including line tripping. Vegetation, trees, and settlements near the power lines likely play the most significant roles in fire events. Fire near the transmission lines is always challenging due to scenarios such as fuel type, moisture, occasional disagreement by landowners, high cost for right of way clearance, weather, and anthropogenic intervention. In this study, five classes of distance from transmission lines were considered as (i) 0–50 m, (ii) 50–100 m, (iii) 100–200 m, (iv) 200–500 m, and (e) >500m.

2.3.16. Distance from Electric Substation

Fire and explosion in electric substations occur due to various reasons such as (i) lightning strike, which can damage wires, equipment, and leads excessive electricity to flow into the transformer, (ii) heavy rain and strong winds result in trees to strike on the transformer, (iii) sudden damage to transformers which can also lead to overcharging, which produces excessive quantity of heat and sparks to ignite the mineral oil, and (iv) formation of flammable mixtures in different electrical equipment [67]. Hence, settlements close to electric substations are always at a risk of fire. In this study, distance from electric substations was categorized into five classes as presented in Figure 5e.

2.3.17. Distance from Main Settlement

Fire hazards are more likely to occur near dense settlements. High population density challenges firefighting, response, and evacuation operations in the case of a fire incidence. In addition, the major settlements of Kathmandu Valley are deprived from basic firefighting infrastructures, road networks, and supply of water during firefighting, etc. Distance from the center of the major settlements was classified into five categories as shown in Figure 5f.

2.3.18. Distance from Old Settlement

The old settlements in Kathmandu Valley are vulnerable to fire and earthquake hazards due to narrow roads, clustered buildings, flammable building materials, lack of safety measures, and dominance of vulnerable buildings stocks. The Euclidean distance was applied to compute the five distance classes as depicted in Figure 6d.

2.3.19. Probability of Soil Liquefaction

Liquefaction-induced failures in structures and infrastructures have been reported in Kathmandu Valley during past earthquakes. Apart from the earthquake magnitude, various elements such as age of the soil, sedimentation process, the depth of the water table, density, burial depth, ground slope, seismo-tectonics, sedimentary features, grain size distribution, etc., influence the liquefaction susceptibility of the soil. The liquefaction probability was divided into five classes for 475 years return period with a seismic intensity of moment magnitude (Mw) 8 at 1.5 m depth as illustrated in Figure 6c [9].

2.3.20. Seismic Intensity

Seismic intensity is a measure of ground shaking and its impact on the built environment. A seismic intensity map of Kathmandu Valley was retrieved from the study by JICA and MoHA [57], which is based on a Mid-Nepal earthquake scenario. This scenario was set based on the seismic gap in central Nepal. It assumed that Modified Mercalli Intensity (MMI) VIII would occur in Kathmandu Valley except for the mountainous areas in valley fringe. If an aftershock of magnitude 7 takes place at a position close to the main fracture zone, Kathmandu Valley would observe MMI VII. Seismicity of Kathmandu Valley was categorized into three classes: (i) VII, (i) VIII, and (ii) IX as depicted in Figure 6b.

2.3.21. Dominant Building Type

Different building types have a significant relation to structural topology and seismic vulnerability [68]. The dominant building type in this study was extracted by geo-referencing from the study conducted by JICA and MoHA [57]. The magnitude and extent of building damage is associated with the intensity of ground shaking and seismic performance of the structures as along with a vulnerability model, which elaborates the probability distribution of loss ratio for particular value of the intensity measure. Building types were classified into six group: (i) adobe, (ii) stone, (iii) RC (reinforced concrete), (iv) BM (brick in mud mortar), (v) BC (brick in cement mortar), and (vi) no building.

2.4. Determination of Layer Weights

The weights (wt.) of each layer were determined using the Analytical Hierarchy Process (AHP). The AHP is a semi-quantitative method in which decisions are taken using weights through pair-wise relative comparisons without inconsistencies in the decision process [69]. The AHP comprises five steps: (i) division of a decision problem into component factors, (ii) arrangement of these factors in ranked order, (iii) assignment of numerical values according to the relative importance of each factor (pair-wise comparison), (iv) setting up of a comparison matrix, and (v) computation of the normalized principal eigenvector, which gives the weight of each factor [70]. In conclusion, the fundamental principles of the AHP are (a) decomposition, (b) comparative judgment, and (c) assignment of normalized weight [71]. During AHP analysis, pair-wise comparison was carried out by comparing the relative significance, preference, or likelihood of influencing factors to establish the priority of each factor in the individual matrix. For instance, comparison of the factors was done using the scale from 1 to 9, in which 1, 3, 5, 7, and 9 respectively indicate equal, moderate, strong, very strong, and extreme significance, and 2, 4, 6, and 8 respectively indicate intermediate values. Conversely, less important variables were assigned 1 to 1/9 as shown in Table S5. An important characteristic of the AHP is that it can quantify rating inconsistencies with the help of consistency index (CI) as follows:
CI = ( max n ) ( n 1 )
where max is the largest eigenvalue of the matrix of order n.
Saaty [69] developed an average random consistency index (RI) for different matrix orders (see Table S6) and proposed a consistency ratio (CR) to evaluate the possible inconsistencies in the judgment matrix. The evaluation of CR was performed based on the following equation:
CR = CI RI
Saaty [72] elaborated that weighting coefficients are acceptable when CR is less than 0.1; if greater than 0.1, the matrix becomes inconsistent, and revision of judgment is required to confirm realistic results. In this study, we compiled five matrices; four for evaluating landslide, flood, fire, and earthquake, and one to depict multi-hazard risk.

2.5. Hazard Assessment

The first step of hazard assessment involves individual hazard mapping based on the selected influencing factors. Thereafter, four hazard maps were superimposed based on their weights to generate a multi-hazard risk map for Kathmandu Valley. The details of individual as well as multi-hazard mapping are illustrated as follows.

2.5.1. Landslide Hazard Assessment

Landslide hazard assessment is governed by the basic characteristics of slopes and their susceptibility to failure. Table S1 illustrates the selected factors involved in the landslide hazard assessment, their classes, and their ratings. An 11 × 11 matrix was prepared for pair-wise comparison of the factors affecting landslide occurrence using the AHP approach. After the formulation of the matrix, scores were assigned based on the relative importance among the factors. Higher importance was given to slope which has a weight value of 0.253 and less importance was given to elevation with 0.038 weight, as depicted in Table S7. We validated the AHP method by applying the consistency ratio (CR) as the value was obtained as 0.021, which is well within the acceptable range as illustrated by Saaty [72]. Landslide hazard assessment was done by employing the weighted linear combination equation as follows:
HI = i = 1 n R i W i
where HI denotes the individual hazard index, n is the total number of factors, R i is the rating of the factor i, and W i is the weight of the factor i.

2.5.2. Flood Hazard Assessment

A hydrological model can be used to evaluate flood peaks, depths, and volumes, and to generate flood hazard mapping. However, calibrating these models requires intensive data based on meteorological, hydrological, and geomorphological information. Many developing countries including Nepal lack such data at the watershed scale. Thus, a GIS-based flood hazard analysis was employed to assess the flood hazard in Kathmandu Valley. Table S8 shows selected factors, their classes, and their ratings for flood hazard assessment. For each factor class, a hazard rating of 0 to 4 was allocated. The 0 value denotes a more stable condition whereas 4 indicates high potential of flood hazard. A 6 × 6 matrix was prepared for the pair-wise comparison of different factors where the highest priority was given to slope, and the lowest priority was assigned to the LULC. The weights of 0.249 and 0.064 were calculated for slope and LULC respectively, and the CR value 0.044 (see Table S8) lies within the permissible limit of <0.10 as recommended by Saaty [72]. The flood hazard index was calculated using a weighted linear combination as depicted in Equation (3).

2.5.3. Fire Hazard Assessment

GIS-based fire hazard evaluation was used to analyze the spatial pattern of fire incidents in the study area. In this study, population density, distance from fire brigade, distance from gas station, distance from old settlement, distance from transmission line, distance from electric substation, distance from the main settlement, distance from road, and the LULC were considered. The hazard rating scheme for the influencing factors is presented in Table S3. For the AHP analysis, the pair-wise comparison of a 9 × 9 matrix was done. The highest weight (0.213) was evaluated for distance from gas station and the lowest weight (0.03) was calculated for distance from electric substation, and the CR was obtained to be 0.053 as depicted in Table S9. Similarly, the fire hazard index was evaluated using Equation (3).

2.5.4. Earthquake Hazard Assessment

To perform seismic hazard assessment, we used influencing factors such as seismic intensity, soil liquefaction, distance from old settlement, dominant building type, LULC, lithology, active faults, slope, and population density. The rating of factor classes considered for earthquake hazard assessment is shown in Table S4. A 9 × 9 matrix was built for the pair-wise comparison of influencing factors. The CR value was calculated as 0.021 that lies in permissible limit of <0.10. The seismic intensity (wt. = 0.178) and distance from old settlements (wt. = 0.178) were assigned as very important factors followed by soil liquefaction (wt. = 0.161), dominant building type (wt. = 0.161), active faults (wt. = 0.096), slope (wt. = 0.075), LULC (wt. = 0.064), population density (wt. = 0.044), and lithology (wt. = 0.043) as outlined in Table S10. The fire hazard assessment map was prepared by the sum of the weighted linear combination as depicted in Equation (3).

2.5.5. Multi-Hazard Risk Assessment

To perform multi-hazard risk assessment, each hazard was weighted using the AHP, because the degree of the impact (injury and death), losses, and risk of each hazard will be unique. The history of the earthquake in Nepal, for example, the 1934 Bihar-Nepal earthquake (Mw 8.3), the 1988 Udaypur earthquake (Mw 6.8), and the 2015 Gorkha earthquake (Mw 7.8) reveal that Kathmandu Valley will be severely affected by earthquake rather than landslide, flood, and fire hazards [73]. Thus, we assigned the larger relative significance to earthquake hazard as the study area is situated in a high seismicity region. As depicted by Gautam et al. [3], the highest damages and losses in Nepal were caused by the earthquake until 2018, followed by landslide, flood, and fire. Thus, relative significances were assigned accordingly. The AHP analysis was done by considering a 4 × 4 matrix for pair-wise comparison to calculate the weight. The analysis illustrated in Table S11 shows that the highest weight (0.498) was assigned for earthquake hazard and the lowest weight (0.122) was assigned to fire hazard. The CR value was 0.031, which is below the permissible limit. The multi-hazard risk scores were estimated by summation of the weight multiplied by corresponding hazards as follows:
MHI = i = 1 n H i W i
where MHI is a multi-hazard index, n is the total number of hazards, H i is the hazard i, and W i is the weight of the hazard i. Finally, a multi-hazard map was prepared by classifying and ranking between 1 and 5, using the Jenks Natural Break classification method provided in Arc-GIS 10.6 (1 = very low, 5 = very high).

3. Results and Discussion

3.1. Individual Hazard Assessment

3.1.1. Landslide Hazard Assessment

After applying the AHP, the landslide hazard map was prepared as shown in Figure 7. The landslide hazard zonation map was produced by classifying the scores between 1 and 5 using the Jenks Natural Break classification feature provided in Arc-GIS 10.6. The valley was categorized into five classes, corresponding to different hazard levels as shown in Figure 7, which highlights that 28.53% (highest) of the land area is moderately susceptible to landslide and 8.78% (lowest) of the land area demonstrates very high susceptibility to landslide (see Table 3). The spatial distribution of landslide hazard highlights that the north-eastern part of Kathmandu Valley has high to very high susceptibility while the central area of Kathmandu Valley is less prone (very low and low susceptibility) to landslide hazard. Lower vulnerability of landslide in a highly populated area of Kathmandu Valley is attributed to relatively flat terrain (slope = 0–5°), comparably lower elevation and annual precipitation, and flat profile curvature (−0.5–0.5). Normally, low frequency of landslide takes place at very high and very low elevation because slope generally consists of rocks with high shear strength at very high altitudes, and more gentle slope at very low altitudes, while intermediate altitude slope leads to instability that is more susceptible to a landslide [74]. The north-eastern part of Kathmandu Valley is highly and very highly prone to landslide due to the presence of the mild to steep slope and also due to proximity of active fault lines.

3.1.2. Flood Hazard Assessment

As shown in Figure 8, spatial distribution of high and very high flood hazard levels is concentrated in core city areas and riverbanks, respectively. Notably, some rivers, including Bagmati, Bishnumati, Hanumante, Manahara, and Balkhu, have observed severe flooding problems in the past. These rivers have active channel shifting due to loss of high sediment loads during the monsoon season. During the dry season, human encroachment and commercial exploitation deepen the channel depth and narrow the width of the stream as highlighted in Figure 9. The most urbanized locations of Kathmandu Valley have moderate to high flood vulnerability because of road networks, dense settlements that restrict the infiltration of water into the soil-water zone, and lack of a good drainage system to divert water safely into the natural channel. As shown in Table 3, 13.59% of the flood-prone area is located within the limits of the very high, 21.54% falls in the high, 20.97% falls in moderate, 20.25% falls in low, and 23.32% falls in very low flood susceptibility regions. Regarding the distribution of the flood-prone areas based on LULC, agricultural land reflects very high susceptibility to flooding (6.96%) while the restricted areas contain the lowest considering very high flood susceptibility (0.29%). The reason behind higher susceptibility is due to dominance of agricultural land located at the bank of streams and rivers.
Bagmati is the main river that drains through Kathmandu Valley for ~25 km. The drainage basin morphology, geology, rainfall intensity, and duration are the key factors in maximizing the rainfall-runoff [75]. For instance, heavy rainfall in the central valley influences the volume of runoff and enhances flash floods in the Bagmati River and its tributaries due to the majority of land being covered by built-up area and road networks. Monsoon precipitation is dominant in Nepal which is a major cause of flood in Kathmandu Valley. In addition, improper land use plans, unplanned settlement distribution, and deforestation in the watershed increase the extent and intensity of flood devastation. Thus, the economic loss due to flood disaster is considerably high in Nepal [76].

3.1.3. Fire Hazard Assessment

Fire hazard was categorized in five classes employing the Jenks Natural Break classification method in Arc GIS, which marked 33.31% of the area under very low, 35.17% of the area under low, 15.99% area under moderate, 11.88% area under high, and 3.66% area under very high fire susceptibility levels (Table 3). From Table S9, it can be observed that distance from gas station (wt. = 0.213), distance from old settlement (wt. = 0.192), and distance from fire brigade (wt. = 0.164) most significantly affect fire hazard. The distribution of fire hazard within the valley is shown in Figure 10. The old settlements such as Bhaktapur, Patan, Chapagaun, Kirtipur, and Nardevi are very highly susceptible to fire because of dense population, built-up areas, lack of preventive measures, lack of fire-resistance measures in constructions, lack of fire protection policies and safety codes for the use of electricity, gas station, narrow road lanes, clustered households, use of flammable building materials, and aging water supply and electrical systems. The western part of the valley has low to very low susceptibility to fire hazards due to the presence of accessible networks and proximity to fire brigades, despite densely distributed gas stations. The spatial distribution of fire susceptibility shows very low and low hazard levels outside the core city areas and surrounding mountainous regions while only moderate fire potential can be observed in fewer places outside the urban core. Such low to very low hazards are explained by the presence of agricultural land, forest, low population density, and limited gas stations in those areas.

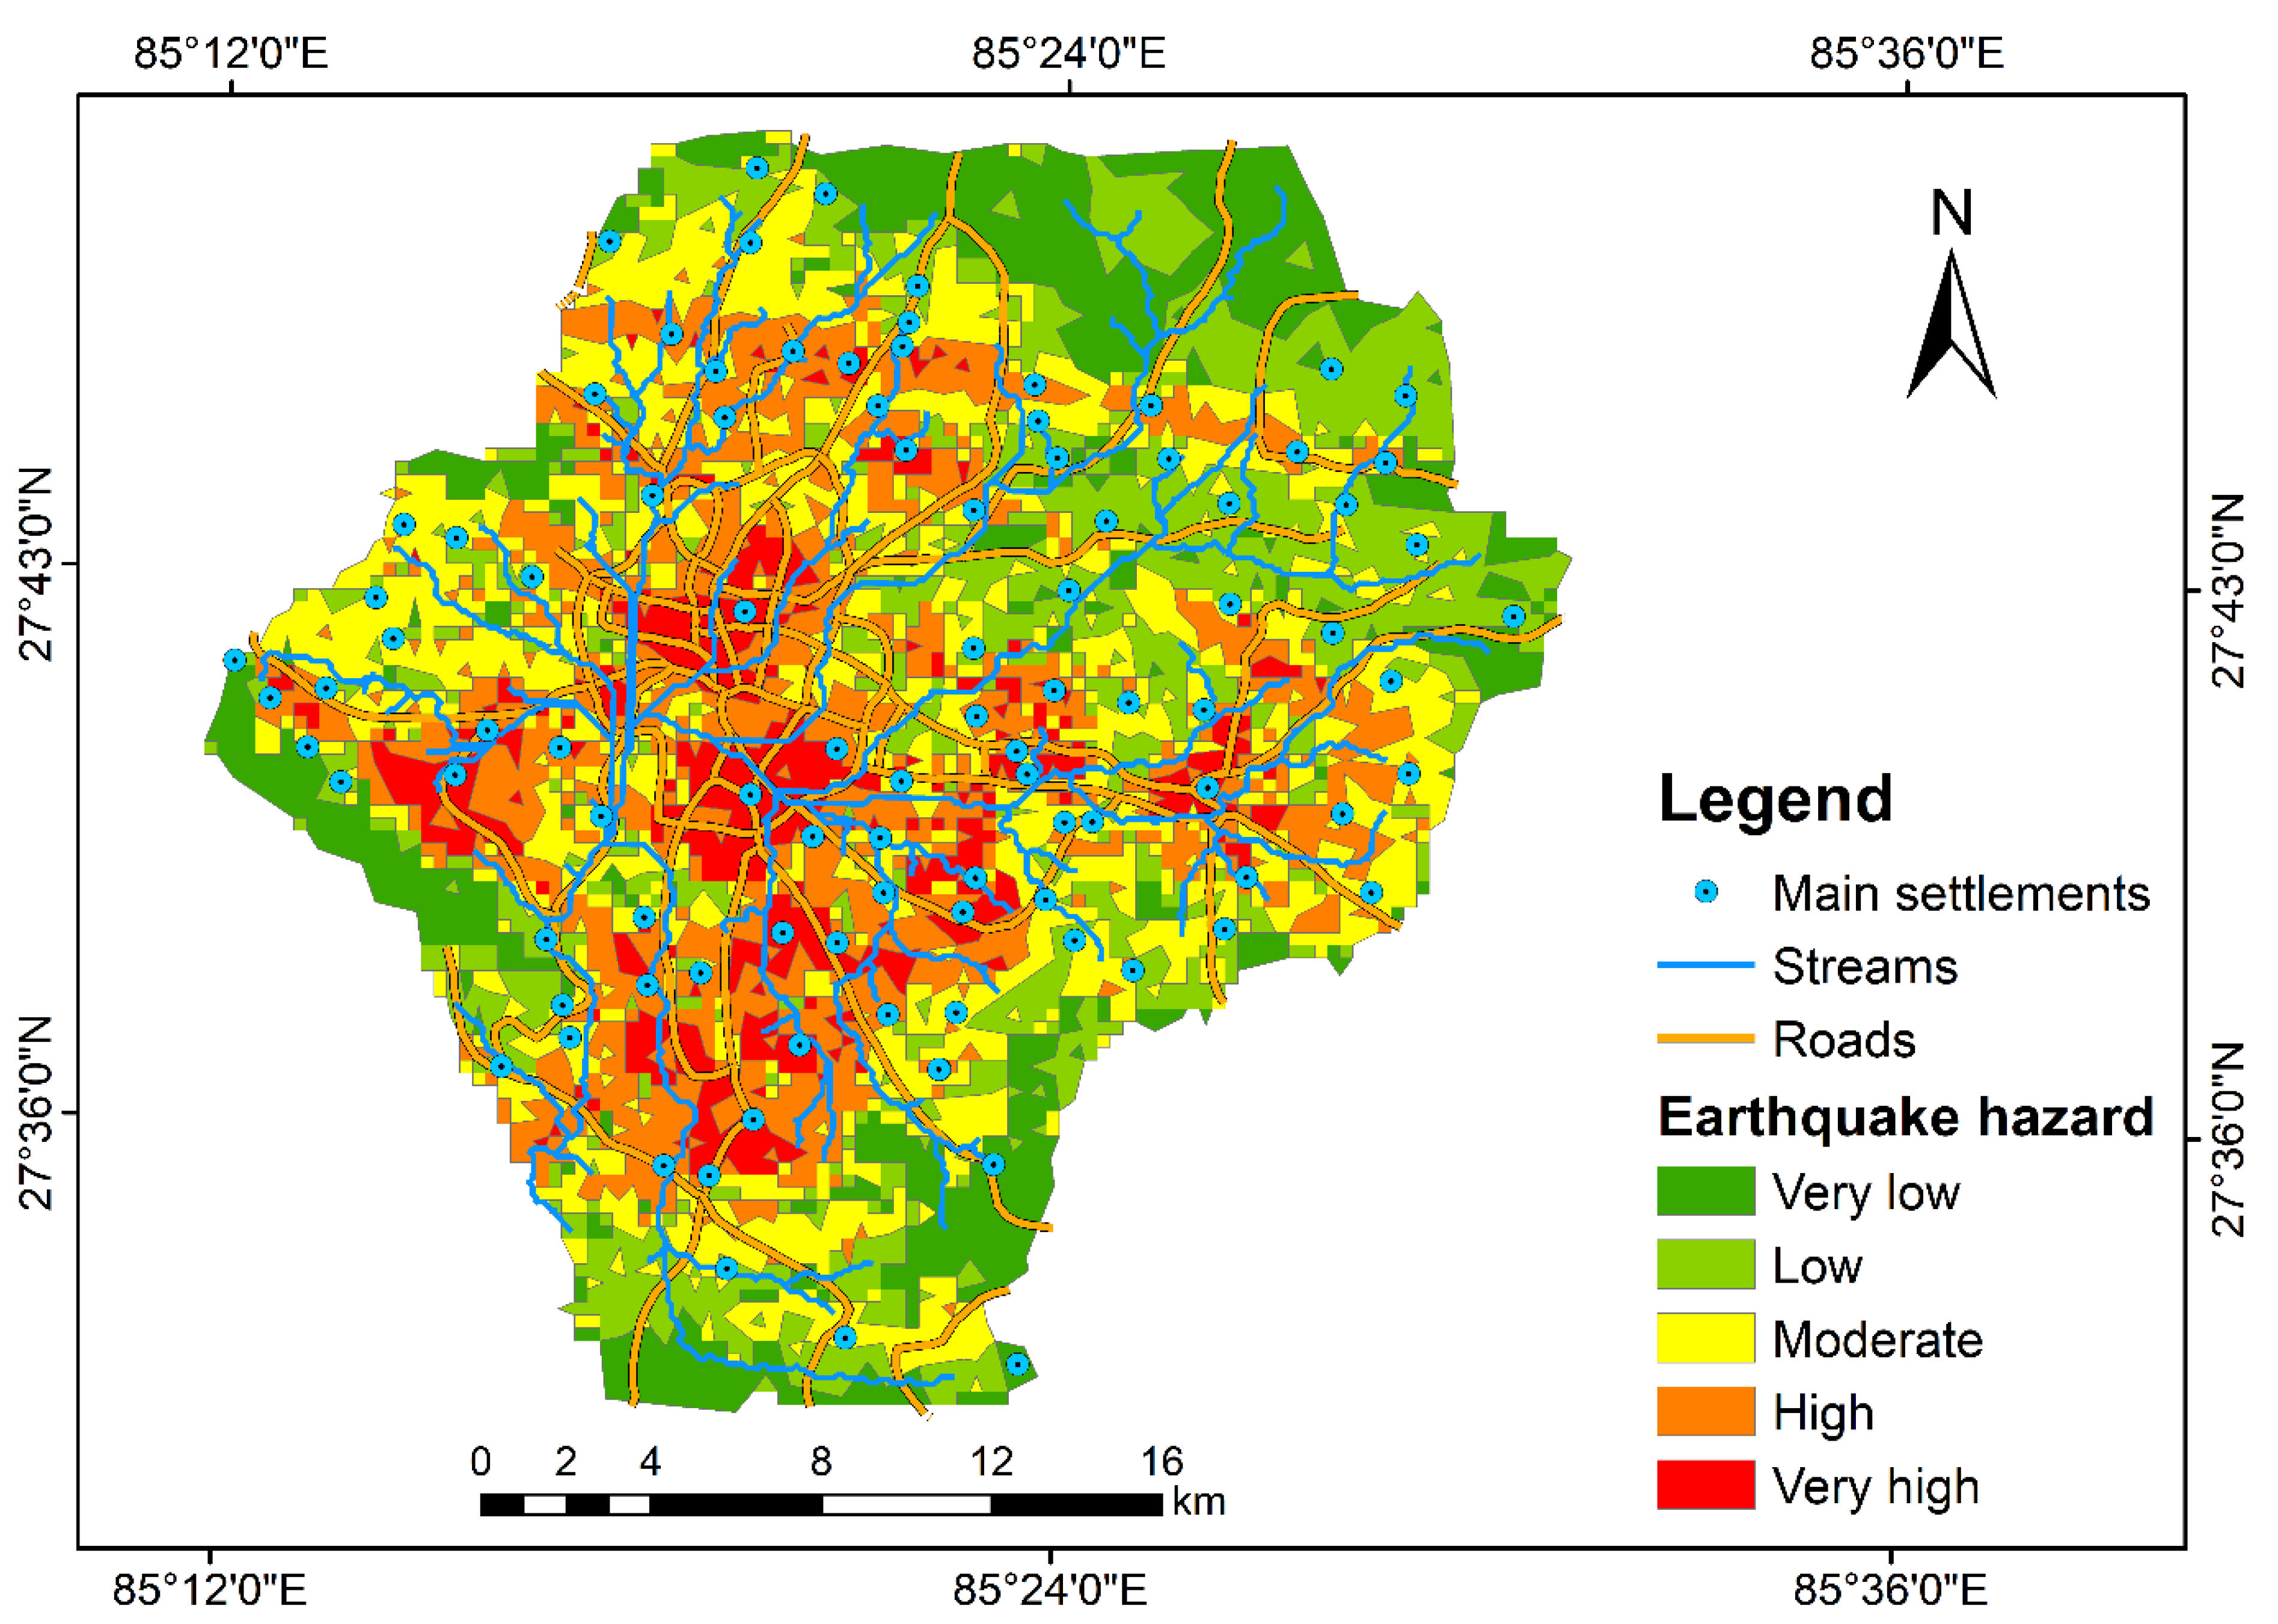
3.1.4. Earthquake Hazard Assessment

Very high and high potential seismic hazard are mostly distributed in the central valley, south-eastern, and south-western parts of Kathmandu Valley as illustrated in Figure 11. The main reason behind very high and high potential seismic hazard is attributed to dominance of non-engineered masonry construction, soil liquefaction potential, loose soil deposit, dense built-up area, and old settlements. Level of seismic hazard was categorized in five classes. At least 16.06% of the valley area falls under very low, 23.32% area falls under low, 29.13% of the area falls under moderate, 22.29% of the area falls under high, and 9.20% of the area falls under very high seismic hazard level. Even though most parts of Kathmandu Valley are susceptible to moderate seismic hazard, the presence of a large number of brick masonry buildings in soft soil resulted in severe damage during earthquakes. Furthermore, the basin structure induces a site effect that amplifies the intensity of the earthquake damage [77]. The peripheral areas have moderate level of seismic hazard, and the uninhabited mountains have very low and low level of seismic hazard. The central and south-western parts of Kathmandu Valley have Kalimati formation, which has very low bearing capacity compared to the north-east part of Kathmandu Valley (Gokarna formation), thus site effects and damages become highly scattered even within the valley.

3.2. Validation of the Different Hazard Maps

One of the most rational approaches for validation is physical verification, which is rather time-consuming and tedious. Thus, Receiver Operating Characteristics (ROC) curve, which depicts the effectiveness of diagnostic test [78], and hazard density were used to validate the earthquake hazard map because of the availability of the damage data due to the 2015 Gorkha earthquake. The y-axis of the ROC curve indicates the model sensitivity (true positive value), and the x-axis represents the false-positive predictions (1-specificity). The area under curve (AUC) value ranges from 0.5 to 1.0, and a greater AUC value regards higher prediction accuracy [79]. Figure 12 shows the ROC curve for earthquake hazard for the damage that occurred in Kathmandu Valley due to the 2015 Gorkha earthquake. The AUC was calculated to be 0.638, indicating moderate performance. Furthermore, hazard density of each class that defined as a ratio of observed hazard occurrences in respective hazard zonation class t provides the overall characteristic of the hazard zonation map. Table 4 depicts the observed earthquake damage density for different hazard classes where earthquake damage density for the very highly susceptible zone is 0.335 (remarkably larger than the other regions) followed by the earthquake damage density of 0.255, 0.211, 0.156, and 0.061 for high, moderate, low, and very low susceptible zones, respectively. These results illustrate a gradual decline in earthquake damage density from the very high to the very low hazard regions showing considerable variation in damage density values among different susceptibility zones. Although the ROC curve analysis shows moderate performance, the earthquake damage density evaluation reveals that classified hazard zones are in good correlation with incidents of past earthquake damage. However, only the light damage that occurred during the 2015 Gorkha earthquake was considered for validation purposes.
For other hazard maps, validation was carried out by superimposing historical hazard events. The historical events of flood, landslide, and fire hazard were obtained from the government repository [80]. Superposition of different historical hazard events in the study area is shown in Table 5. Thirty six landslide incidents were recorded in Kathmandu Valley, among them 44.44% of landslide events fall under very high susceptibility zones, followed by 36.11% under high susceptibility zone, 11.11% under moderate susceptibility zone, 5.56% under low susceptibility zone, and 2.78% under very low susceptibility zone. Similarly, validation of flood hazard map highlighted that out of 34 historical flood events, 58.82% of flood events were located under very high hazard zones, 29.41% under high hazard zones, 5.88% under moderate hazard zones, 5.88% under low hazard zones, and 0% under very low hazard zones. The majority of the recorded flood events occurred near the banks of the streams. In total, 274 past fire events were noted with full details and information, which occurred mostly in the highly urbanized and old settlement areas in Kathmandu Valley. It is found that 31.75% of fire events occurred within very high hazard zones and 29.20% occurred in high hazard zones.

3.3. Multi-Hazard Risk Assessment

Figure 13 shows the multi-hazard map of Kathmandu Valley. As shown in Figure 13, densely populated settlements, old settlements, and the central valley depict high to very high levels of multi-hazard risk. These areas are consistently characterized by high to very high levels of seismic, flood, and fire hazards. Interestingly, the eastern, southern, and north-eastern parts, and surrounding mountains of Kathmandu Valley comprise very low to low level of multi-hazard risk because these regions are dominated by low to moderate level of seismic and landslide hazards, while fire and flood hazards have very low and low susceptibility, respectively. Moderate level of multi-hazard risk is observed in the south-eastern, western, and north-western parts of Kathmandu Valley, where the level of seismic, landslide, and flood hazards has moderate susceptibility and fire hazard has low susceptibility. These are rapidly growing settlement areas such as Sudal, Tathali, Bhimdhunga, Thankot, Sangla, and Goldunga, where agricultural land is rapidly being converted to built-up area (Figure 13). As illustrated in Table 3, 20.12%, 26.05%, 22.02%, 19.24%, and 12.57% of the areas of Kathmandu Valley represent very low, low, moderate, high, and very high multi-hazard risk, respectively. The results reveal higher susceptible region where the spatial distribution of individual hazard and vulnerability (old settlement, built area, transmission line, gas stations, etc.) coincide. This study uses 21 influencing factors based on the available information, and there is still a space to improve a multi-hazard map in the future by considering more influencing factors and rigorous validation with an updated database. Although the method adopted in this study has also greater prediction accuracy, it is solely based on expert knowledge, experience, and judgment, which may lead to cognitive limitations aligned to uncertainty and subjectivity. There are some issues that cause major challenges in multi-hazard analysis such as differences in characteristics of hazard, inter-relationship of hazard that causes triggering and cascading effects, natural processes that employ heterogeneous impacts on elements at risk, and methods to describe vulnerability that vary between hazards. Considering multi-hazards jointly and employing the same methodology to analyze cascading impacts can provide a concise view of the impacts and risk levels. Sometimes, superposition of different hazard maps to produce a multi-hazard map may not be exhaustively representative. This prompts cascading hazard analysis.

4. Conclusions

Individual hazard maps can be insightful in the early stage of urban and land development planning, but such maps cannot depict the exacting scenario of multi-hazards. To this end, multi-hazard risk maps provide a more homogenized scenario of multiple natural hazards. We performed individual and multi-hazard risk assessment of Kathmandu Valley using AHP approach. To the best of the authors’ knowledge, this is the first systematic study for Kathmandu Valley that considers three prominent natural hazards and one artificial hazard, and performs zonation. The results highlight that the densely populated settlements, old settlements, and the central valley are the most hazard/risk-prone areas in Kathmandu Valley. This paradigm is pivotal as the greatest fraction of the valley population resides in these regions. The multi-hazard risk map developed in this study indicates that eastern, southern and north-eastern parts, and peripheral mountains of Kathmandu Valley are less prone to multi-hazards. Thus, these areas could be considered for urban expansion. The hazard assessment approach optimized and applied in this study showed promising results as the results were reliably validated with historical records of hazard. The individual and multi-hazard maps developed in this study can provide valuable insights for integrated disaster risk planning initiatives in the Kathmandu Valley considering multi-hazard risk. Further improvements in multi-hazard mapping can be achieved by considering more variables, and validation can be extended using more historical events.

Supplementary Materials

The following are available online at https://0-www-mdpi-com.brum.beds.ac.uk/article/10.3390/su13105369/s1, Table S1: The selected factors involved in the landslide hazard assessment, their classes and their ratings, Table S2: The selected factors involved in the flood hazard assessment, their classes, and their ratings, Table S3: The selected factors involved in the fire hazard assessment, their classes, and their ratings, Table S4: The selected factors involved in the earthquake hazard assessment, their classes and their ratings, Table S5: Scale of preference between two parameters in analytical hierarchy process (AHP) [82], Table S6: Random Consistency Index (RI) [69,83], Table S7: Pair-wise comparisons, weighting coefficients of each adopted factor in landslide hazard evaluation, and the estimated CR value, Table S8: Pair-wise comparisons, weighting coefficients of each adopted factor in flood hazard evaluation, and the estimated CR value, Table S9: Pair-wise comparisons, weighting coefficients of each adopted factor in fire hazard evaluation, and the estimated CR value, Table S10: Pair-wise comparisons, weighting coefficients of each adopted factor in earthquake hazard evaluation, and the estimated CR value, Table S11: Pair-wise comparisons, weighting coefficients of each adopted factor in multi-hazard evaluation, and the estimated CR value.

Author Contributions

Conceptualization, D.G., V.P.P., R.R., S.L., K.R.A., B.R.T., and R.T.; methodology, R.K., D.G., S.L., V.P.P., and R.R.; validation, V.P.P., R.R., and S.L.; formal analysis, R.K.; investigation, R.K. and S.L.; resources, D.G., K.R.A., S.L., B.R.T., and R.A.; data curation, R.K. and S.L.; writing—original draft preparation, R.K., D.G., V.P.P., R.R., and R.T.; writing—review and editing, K.R.A., S.L., Y.-C.L., K.A., B.R.T., and R.A.; visualization, K.R.A., S.L., Y.-C.L., K.A., B.R.T., and R.A.; supervision, D.G., V.P.P., R.R., and K.R.A. All authors have read and agreed to the published version of the manuscript.

Funding

This research received no external funding.

Data Availability Statement

All data used in the analysis are reported within the manuscript.

Acknowledgments

The authors gratefully acknowledge generous philanthropic support from the Office of the Vice President of the Rabdan Academy, The United Arab Emirates (UAE) and Interdisciplinary Research Institute for Sustainability (IRIS), Kathmandu, Nepal for this research. Rajesh Rupakhety acknowledges the support from the University of Iceland Research fund.

Conflicts of Interest

The authors declare no conflict of interest.

References

  1. World Bank. Hazards of Nature, Risks to Development: An IEG Evaluation of World Bank Assistance for Natural Disaster; World Bank: Washington, DC, USA, 2006. [Google Scholar]
  2. UNSIDR and CRED. Poverty & Death: Disaster Mortality, 1996–2015; UNSIDR and CRED: Brussels, Belgium, 2016. [Google Scholar]
  3. Gautam, D.; Thapa, S.; Pokhrel, S.; Lamichhane, S. Local level multi-hazard zonation of Nepal. Geomat. Nat. Hazards Risk 2021. [Google Scholar] [CrossRef]
  4. MoHA. Nepal Country Report; MoHA: Kathmandu, Nepal, 1999. [Google Scholar]
  5. MoHA. Nepal Disaster Report 2017: The Road to Sendai December; MoHA: Kathmandu, Nepal, 2017. [Google Scholar]
  6. UNDP/BCPR. A Global Report Reducing Disaster Risk-a Challenge for Development; UNDP/BCPR: Geneva, Switzerland, 2004. [Google Scholar]
  7. Shrestha, B.B.; Nakagawa, H. Hazard assessment of the formation and failure of the Sunkoshi landslide dam in Nepal. Nat. Hazards 2016, 82, 2029–2049. [Google Scholar] [CrossRef]
  8. Lacroix, P. Landslides triggered by the Gorkha earthquake in the Langtang valley, volumes and initiation processes. Earth Planets Space 2016, 68, 46. [Google Scholar] [CrossRef] [Green Version]
  9. Bhochhibhoya, S.; Adhikari, P.; Adhikari, P.; Gautam, D. Probabilistic seismic liquefaction hazard assessment of Kathmandu valley, Nepal. Geomat. Nat. Hazards Risk 2020, 11, 259–271. [Google Scholar] [CrossRef] [Green Version]
  10. Gautam, D.; de Magistris, F.S.; Fabbrocino, G. Soil liquefaction in Kathmandu valley due to 25 April 2015 Gorkha, Nepal earthquake. Soil Dyn. Earthq. Eng. 2017, 97, 37–47. [Google Scholar] [CrossRef]
  11. Rajendran, C.P. Constraints on previous earthquakes from the liquefaction sites in the Kathmandu Valley associated with the 2015 Gorkha earthquake and their regional implications. Quat. Int. 2020. [Google Scholar] [CrossRef]
  12. Chhetri, S.K.; Kayastha, P. Manifestation of an analytic hierarchy process (AHP) model on fire potential zonation mapping in Kathmandu metropolitan City, Nepal. ISPRS Int. J. Geo Inf. 2015, 4, 400–417. [Google Scholar] [CrossRef] [Green Version]
  13. Chaulagain, H.; Rodrigues, H.; Silva, V.; Spacone, E.; Varum, H. Seismic risk assessment and hazard mapping in Nepal. Nat. Hazards 2015, 78, 583–602. [Google Scholar] [CrossRef]
  14. Chaulagain, H.; Rodrigues, H.; Silva, V.; Spacone, E.; Varum, H. Earthquake loss estimation for the Kathmandu Valley. Bull. Earthquake Eng. 2016, 14, 59–88. [Google Scholar]
  15. Sakai, T.; Gajurel, A.P.; Tabata, H. Seismites in the Pleistocene succession and recurrence period of large earthquakes in the Kathmandu Valley, Nepal. Geoenviron. Disasters 2015, 2, 1–17. [Google Scholar] [CrossRef]
  16. Mugnier, J.L.; Huyghe, P.; Gajurel, A.P.; Upreti, B.N.; Jouanne, F. Seismites in the Kathmandu basin and seismic hazard in central Himalaya. Tectonophysics 2011, 509, 33–49. [Google Scholar] [CrossRef]
  17. Bajracharya, S.R.; Shrestha, M.S.; Shrestha, A.B. Assessment of high-resolution satellite rainfall estimation products in a streamflow model for flood prediction in the Bagmati basin, Nepal. J. Flood Risk Manag. 2017, 10, 5–16. [Google Scholar] [CrossRef]
  18. Gautam, D.K.; Kharbuja, R.G. Flood hazard mapping of Bagmati River in Kathmandu valley using geo-informatics tools. J. Hydrol. Meteorol. 2006, 3, 1–9. [Google Scholar]
  19. Dahal, R.K.; Hasegawa, S.; Nonomura, A.; Yamanaka, M.; Dhakal, S.; Paudyal, P. Predictive modelling of rainfall-induced landslide hazard in the Lesser Himalaya of Nepal based on weights-of-evidence. Geomorphology 2008, 102, 496–510. [Google Scholar] [CrossRef]
  20. Hasegawa, S.; Dahal, R.K.; Yamanaka, M.; Bhandary, N.P.; Yatabe, R.; Inagaki, H. Causes of large-scale landslides in the Lesser Himalaya of central Nepal. Environ. Geol. 2009, 57, 1423–1434. [Google Scholar] [CrossRef]
  21. Timilsina, M.; Bhandary, N.P.; Dahal, R.K.; Yatabe, R. Distribution probability of large-scale landslides in central Nepal. Geomorphology 2014, 226, 236–248. [Google Scholar] [CrossRef]
  22. Bathrellos, G.D.; Karymbalis, E.; Skilodimou, H.D.; Gaki-Papanastassiou, K.; Baltas, E.A. Urban flood hazard assessment in the basin of Athens Metropolitan city, Greece. Environ. Earth Sci. 2016, 75, 319. [Google Scholar] [CrossRef]
  23. Artan, G.; Gadain, H.; Smith, J.L.; Asante, K.; Bandaragoda, C.J.; Verdin, J.P. Adequacy of satellite derived rainfall data for stream flow modeling. Nat. Hazards 2007, 43, 167–185. [Google Scholar] [CrossRef]
  24. Todini, E. Hydrological catchment modelling: Past, present and future. Hydrol. Earth Syst. Sci. 2007, 11, 468–482. [Google Scholar] [CrossRef] [Green Version]
  25. Mishra, K.; Sinha, R. Flood risk assessment in the Kosi megafan using multi-criteria decision analysis: A hydro-geomorphic approach. Geomorphology 2020, 350, 106861. [Google Scholar] [CrossRef]
  26. Aryal, D.; Wang, L.; Adhikari, T.R.; Zhou, J.; Li, X.; Shrestha, M.; Wang, Y.; Chen, D. A Model-Based Flood Hazard Mapping on the Southern Slope of Himalaya. Water 2020, 12, 540. [Google Scholar] [CrossRef] [Green Version]
  27. Ornthammarath, T.; Warnitchai, P.; Chan, C.-H.; Wang, Y.; Shi, X.; Nguyen, P.H.; Nguyen, L.M.; Kosuwan, S.; Thant, M. Probabilistic seismic hazard assessments for Northern Southeast Asia (Indochina): Smooth seismicity approach. Earthq. Spectra 2020, 36, 69–90. [Google Scholar] [CrossRef]
  28. Jena, R.; Pradhan, B.; Beydoun, G.; Alamri, A.M.; Ardiansyah, N.; Sofyan, H. Earthquake hazard and risk assessment using machine learning approaches at Palu, Indonesia. Sci. Total Environ. 2020, 749, 141582. [Google Scholar] [CrossRef] [PubMed]
  29. Yariyan, P.; Zabihi, H.; Wolf, I.D.; Karami, M.; Amiriyan, S. Earthquake risk assessment using an integrated Fuzzy Analytic Hierarchy Process with Artificial Neural Networks based on GIS: A case study of Sanandaj in Iran. Int. J. Disaster Risk Reduct. 2020, 50, 101705. [Google Scholar] [CrossRef]
  30. He, H.; Hu, D.; Sun, Q.; Zhu, L.; Liu, Y. A landslide susceptibility assessment method based on GIS technology and an AHP-weighted information content method: A case study of southern Anhui, China. ISPRS Int. J. Geo Inf. 2019, 8, 266. [Google Scholar] [CrossRef] [Green Version]
  31. Ambrosi, C.; Strozzi, T.; Scapozza, C.; Wegmüller, U. Landslide hazard assessment in the Himalayas (Nepal and Bhutan) based on Earth-Observation data. Eng. Geol. 2018, 237, 217–228. [Google Scholar] [CrossRef]
  32. Pourghasemi, H.R.; Moradi, H.R.; Fatemi Aghda, S.M. Landslide susceptibility mapping by binary logistic regression, analytical hierarchy process, and statistical index models and assessment of their performances. Nat. Hazards 2013, 69, 749–779. [Google Scholar] [CrossRef]
  33. Chen, W.; Hong, H.; Panahi, M.; Shahabi, H.; Wang, Y.; Shirzadi, A.; Pirasteh, S.; Alesheikh, A.A.; Khosravi, K.; Panahi, S.; et al. Spatial Prediction of Landslide Susceptibility Using GIS-Based Data Mining Techniques of ANFIS with Whale Optimization Algorithm (WOA) and Grey Wolf Optimizer (GWO). Appl. Sci. 2019, 9, 3755. [Google Scholar] [CrossRef] [Green Version]
  34. Shi, L.; Zhang, R.; Xie, Q.; Fu, L. Improving analytic hierarchy process applied to fire risk analysis of public building. Chin. Sci. Bull. 2009, 54, 1442–1450. [Google Scholar] [CrossRef] [Green Version]
  35. UNEP. United Nations Conference on Environment & Development Rio de Janerio, Brazil, 3 to 14 June 1992 AGENDA 21; UNEP: Rio de Janerio, Brazil, 1992. [Google Scholar]
  36. UN. Johannsburg Plan of Implementation of the World Summit on Sustainable Development; Technical Report; United Nations Publications: New York, NY, USA, 2002. [Google Scholar]
  37. Barua, U.; Akhter, M.S.; Ansary, M.A. District-wise multi-hazard zoning of Bangladesh. Nat. Hazards 2016, 82, 1895–1918. [Google Scholar] [CrossRef]
  38. Bathrellos, G.D.; Skilodimou, H.D.; Chousianitis, K.; Youssef, A.M.; Pradhan, B. Suitability estimation for urban development using multi-hazard assessment map. Sci. Total Environ. 2017, 575, 119–134. [Google Scholar] [CrossRef]
  39. Chimidi, G.; Raghuvanshi, T.K.; Suryabhagavan, K.V. Landslide hazard evaluation and zonation in and around Gimbi town, western Ethiopia—a GIS-based statistical approach. Appl. Geomat. 2017, 9, 219–236. [Google Scholar] [CrossRef]
  40. Mengistu, F.; Suryabhagavan, K.V.; Raghuvanshi, T.K.; Lewi, E. Landslide Hazard Zonation and Slope Instability Assessment using Optical and InSAR Data: A Case Study from Gidole Town and its Surrounding Areas, Southern Ethiopia. Remote Sens. Land 2019, 3, 1–14. [Google Scholar] [CrossRef]
  41. Liu, Y.-C.; Chen, C.-S. A new approach for application of rock mass classification on rock slope stability assessment. Eng. Geol. 2007, 89, 129–143. [Google Scholar] [CrossRef]
  42. Lari, S.; Frattini, P.; Crosta, G.B. A probabilistic approach for landslide hazard analysis. Eng. Geol. 2014, 182, 3–14. [Google Scholar] [CrossRef] [Green Version]
  43. Straub, D.; Schubert, M. Modeling and managing uncertainties in rock-fall hazards. Georisk Assess. Manag. Risk Eng. Syst. Geohazards 2008, 2, 1–15. [Google Scholar] [CrossRef]
  44. Pourghasemi, H.R.; Gayen, A.; Edalat, M.; Zarafshar, M.; Tiefenbacher, J.P. Is multi-hazard mapping effective in assessing natural hazards and integrated watershed management? Geosci. Front. 2020, 11, 1203–1217. [Google Scholar] [CrossRef]
  45. Pradhan, B. A comparative study on the predictive ability of the decision tree, support vector machine and neuro-fuzzy models in landslide susceptibility mapping using GIS. Comput. Geosci. 2013, 51, 350–365. [Google Scholar] [CrossRef]
  46. Saaty, T.L. Decision making with the Analytic Hierarchy Process. Sci. Iran. 2002, 9, 215–229. [Google Scholar] [CrossRef] [Green Version]
  47. Meten, M.; PrakashBhandary, N.; Yatabe, R. Effect of Landslide Factor Combinations on the Prediction Accuracy of Landslide Susceptibility Maps in the Blue Nile Gorge of Central Ethiopia. Geoenviron. Disasters 2015, 2. [Google Scholar] [CrossRef] [Green Version]
  48. Shit, P.K.; Bhunia, G.S.; Maiti, R. Potential landslide susceptibility mapping using weighted overlay model (WOM). Model. Earth Syst. Environ. 2016, 2, 21. [Google Scholar] [CrossRef] [Green Version]
  49. Pardeshi, S.D.; Autade, S.E.; Pardeshi, S.S. Landslide hazard assessment: Recent trends and techniques. Springerplus 2013, 2, 1–11. [Google Scholar] [CrossRef] [PubMed] [Green Version]
  50. Sakai, H. Stratigraphic division and sedimentary facies of the Kathmandu Basin Group, central Nepal. J. Nepal Geol. Soc. 2001, 25, 19–32. [Google Scholar]
  51. USGS. Earth explorer data available on the World Wide Web, United State Geological Survey (USGS). Available online: https://earthexplorer.usgs.gov/ (accessed on 10 May 2020).
  52. Lamichhane, S.; Shakya, N.M. Integrated assessment of climate change and land use change impacts on hydrology in the Kathmandu Valley watershed, Central Nepal. Water 2019, 11, 2059. [Google Scholar] [CrossRef] [Green Version]
  53. DMG. Engineering and Environmental Geological Map of the Kathmandu Valley,’ Scale 1:50,000, Department of Mines and Geology, Kathmandu, First Edition Kathmandu; DMG: Kathmandu, Nepal, 1998. [Google Scholar]
  54. Google Map Kathmandu Valley. Available online: https://www.google.com/maps/@27.6659389,85.4091329,11.56z?hl=en (accessed on 12 November 2020).
  55. DHM. Hydrological and Meterological Records of Nepal, Department of Hydrology and Meteorology: Government of Nepal, Ministry of Water Resources, Kathmandu; DHM: Kathmandu, Nepal, 2015. [Google Scholar]
  56. CBS. Nepal Population Report 2011, Government of Nepal Ministry of Health and Population, Kathmandu, Nepal; CBS: Ramshahpath, Kathmandu, Nepal, 2012. [Google Scholar]
  57. JICA; MoHA. The Study on Earthquake Disaster Mitigation in the Kathmandu Valley, Kingdom of Nepal Final Report, Volume I; MoHA: Kathmandu, Nepal, 2002. [Google Scholar]
  58. Pourghasemi, H.R.; Pradhan, B.; Gokceoglu, C. Application of fuzzy logic and analytical hierarchy process (AHP) to landslide susceptibility mapping at Haraz watershed, Iran. Nat. Hazards 2012, 63, 965–996. [Google Scholar] [CrossRef]
  59. Pourghasemi, H.R.; Gayen, A.; Panahi, M.; Rezaie, F.; Blaschke, T. Multi-hazard probability assessment and mapping in Iran. Sci. Total Environ. 2019, 692, 556–571. [Google Scholar] [CrossRef]
  60. Yalcin, A. GIS-based landslide susceptibility mapping using analytical hierarchy process and bivariate statistics in Ardesen (Turkey): Comparisons of results and confirmations. CATENA 2008, 72, 1–12. [Google Scholar] [CrossRef]
  61. Galli, M.; Ardizzone, F.; Cardinali, M.; Guzzetti, F.; Reichenbach, P. Comparing landslide inventory maps. Geomorphology 2008, 94, 268–289. [Google Scholar] [CrossRef]
  62. Stocking, M.A. Relief analysis and Soil Erosion in Rhodesia Using Multi-Variate Techniques. Z. Geomorphol. 1972, 16, 432–443. [Google Scholar]
  63. van Westen, C.J.; Castellanos, E.; Kuriakose, S.L. Spatial data for landslide susceptibility, hazard, and vulnerability assessment: An overview. Eng. Geol. 2008, 102, 112–131. [Google Scholar] [CrossRef]
  64. Chen, W.; Li, Y. GIS-based evaluation of landslide susceptibility using hybrid computational intelligence models. Catena 2020, 195, 104777. [Google Scholar] [CrossRef]
  65. Bennett, B.; Leonard, M.; Deng, Y.; Westra, S. An empirical investigation into the effect of antecedent precipitation on flood volume. J. Hydrol. 2018, 567, 435–445. [Google Scholar] [CrossRef]
  66. Gigović, L.; Pamučar, D.; Bajić, Z.; Drobnjak, S. Application of GIS-Interval Rough AHP Methodology for Flood Hazard Mapping in Urban Areas. Water 2017, 9, 360. [Google Scholar] [CrossRef] [Green Version]
  67. El-Harbawi, M.; Al-Mubaddel, F. Risk of Fire and Explosion in Electrical Substations Due to the Formation of Flammable Mixtures. Sci. Rep. 2020, 10, 6295. [Google Scholar] [CrossRef] [PubMed]
  68. Gautam, D.; Fabbrocino, G.; Santucci de Magistris, F. Derive empirical fragility functions for Nepali residential buildings. Eng. Struct. 2018, 171, 617–628. [Google Scholar] [CrossRef]
  69. Saaty, T.L. The Analytic Hierarchy Process: Planning, Priority Setting, Resource Allocation; McGraw-Hill Book Co: New York, NY, USA, 1980. [Google Scholar]
  70. Saaty, T.L.; Vargas, L.G. Models, Methods, Concepts and Applications of the Analytic Hierarchy Process; Springer: Berlin/Heidelberg, Germany, 2001. [Google Scholar]
  71. Malczewski, J. GIS and Multicriteria Decision Analysis; John Wiley & Sons: New York, NY, USA, 1999; ISBN 978-0-471-32944-2. [Google Scholar]
  72. Saaty, T.L. How to make a decision: The analytic hierarchy process. Eur. J. Oper. Res. 1990, 48, 9–26. [Google Scholar] [CrossRef]
  73. Chaulagain, H.; Gautam, D.; Rodrigues, H. Revisiting Major Historical Earthquakes in Nepal: Overview of 1833, 1934, 1980, 1988, 2011, and 2015 Seismic Events. In Impacts and Insights of Gorkha Earthquake; Gautam, D., Rodrigues, H., Eds.; Elsevier: Boston, MA, USA, 2018; Volume I, pp. 1–17. ISBN 9780128128084. [Google Scholar]
  74. Dai, F.; Lee, C. Landslide characteristics and slope instability modeling using GIS, Lantau Island, Hong Kong. Geomorphology 2002, 42, 213–228. [Google Scholar] [CrossRef]
  75. Costa, J.E. Hydraulics and basin morphometry of the largest flash floods in the conterminous United States. J. Hydrol. 1987, 93, 313–338. [Google Scholar] [CrossRef]
  76. DWIDM. Disaster review 1973 to 2016; DWIDM: Kathmandu, Nepal, 2017. [Google Scholar]
  77. Gautam, D.; Forte, G.; Rodrigues, H. Site effects and associated structural damage analysis in Kathmandu Valley, Nepal. Earthq. Struct. 2016, 10, 1013–1032. [Google Scholar] [CrossRef]
  78. Swets, J. Measuring the accuracy of diagnostic systems. Science 1988, 240, 1285–1293. [Google Scholar] [CrossRef] [Green Version]
  79. Yesilnacar, E.; Topal, T. Landslide susceptibility mapping: A comparison of logistic regression and neural networks methods in a medium scale study, Hendek region (Turkey). Eng. Geol. 2005, 79, 251–266. [Google Scholar] [CrossRef]
  80. GoN. Nepal Disaster Risk Reduction Portal Kathmandu, Nepal. Available online: http://drrportal.gov.np/ (accessed on 7 November 2020).
  81. NASA. NASA-Generated Damage Map to Assist with 2015 Gorkha, Nepal Earthquake Disaster Response. Available online: https://www.nasa.gov/jpl/nasa-generated-damage-map-to-assist-with-2015-gorkha-nepal-earthquake-disaster (accessed on 1 November 2020).
  82. Saaty, T.L. A scaling method for priorities in hierarchical structures. J. Math. Psychol. 1977, 15, 234–281. [Google Scholar] [CrossRef]
  83. Saaty, T.L. The Fundamentals of Decision Making and Priority Theory with the Analytic Hierarchy Process, 2nd ed.; RWS Publications: Pitsburg, PA, USA, 2000; Volume VI. [Google Scholar]
Figure 1. Location of study area showing major settlements, roads, streams, and elevation.
Sustainability 13 05369 g001
Figure 2. Methodological framework of study.
Sustainability 13 05369 g002
Figure 3. Thematic maps of the factors used in the landslide hazard assessment: (a) Distance from fault; (b) Slope; (c) Aspect; (d) Profile curvature; (e) NDVI and (f) Distance from road.
Sustainability 13 05369 g003
Figure 4. Thematic maps of the factors used in the flood hazard assessment: (a) Slope; (b) Elevation; (c) distance from streams; (d) Precipitation; (e) Lithology and (f) LULC.
Sustainability 13 05369 g004
Figure 5. Thematic maps of the factors used in the fire hazard assessment: (a) Population density; (b) Distance from fire brigades; (c) Distance from gas stations; (d) Distance from transmission grids; (e) Distance from electric substations; (f) Distance from main settlement. In the figure, ‘T’ indicates a thousand.
Sustainability 13 05369 g005
Figure 6. Thematic maps of the factors used in the earthquake hazard assessment: (a) Dominant building type; (b) Seismic intensity; (c) Probability of liquefaction and (d) Distance from old settlement. MMI in figure stands for Modified Mercalli Intensity.
Sustainability 13 05369 g006
Figure 7. Landslide hazard map for Kathmandu Valley.
Sustainability 13 05369 g007
Figure 8. Flood hazard map for Kathmandu Valley.
Sustainability 13 05369 g008
Figure 9. Example of encroachment of Bishnumati River in Kathmandu Valley: (a) 21 October 2003 (modified from Google Earth Pro, 2021); (b) 11 November 2020 (modified from Google Earth Pro, 2021).
Sustainability 13 05369 g009
Figure 10. Fire hazard map for Kathmandu Valley.
Sustainability 13 05369 g010
Figure 11. Earthquake hazard map for Kathmandu Valley.
Sustainability 13 05369 g011
Figure 12. (a) Distribution of light damage intensity in Kathmandu Valley due to the 2015 Gorkha earthquake [81] and (b) Receiver Operating Characteristics (ROC) curves and Area under Curve (AUC) of earthquake hazard assessment.
Sustainability 13 05369 g012
Figure 13. Multi-hazard risk map for Kathmandu Valley.
Sustainability 13 05369 g013
Table 1. Summary of type and source of data.
DatasetData FormatData Description/ProcessingResolutionReference
Distance from faultLineDerived from geo-referencing[50]
SlopeSpatial gridsExtracted from digital elevation model (DEM)30 m × 30 m[51]
AspectSpatial gridsExtracted from DEM30 m × 30 m[51]
Profile curvatureSpatial gridsExtracted from DEM30 m × 30 m[51]
Distance from streamLineExtracted from DEM by arc hydro tool and buffer range of river[51]
LULC (land use land cover)PolygonLand use land cover30 m × 30 m[52]
LithologyPolygonDerived from geo-referencing[53]
Distance from roadLineBuffer of main road in Kathmandu[54]
Annual precipitation Excel data Interpolation based on 21 rainfall stations in Kathmandu valley from 2000–2014[55]
NDVI (Normalized Difference Vegetation Index)Spatial gridsNormalized difference vegetation index derived from Landsat8 image April 201930 m × 30 m[51]
Elevation Spatial gridsDerived from DEM30 m × 30 m[51]
Population densitySpatial gridsPopulation distribution[56]
Distance from fire brigadesPointBuffer range of fire station[54]
Distance from gas stationPointBuffer range of gas station[54]
Distance from transmission lineLineBuffer range of transmission lineNepal Electricity Authority, Nepal (https://www.nea.org.np/)
Distance from electric substationPointBuffer range of electric substationNepal Electricity Authority, Nepal (https://www.nea.org.np/)
Distance from main settlementPointBuffer range of main settlement[56]
Distance from old settlementPointBuffer range of old settlement[56]
Seismic intensitySpatial gridsDerived from geo-referencing[57]
Soil liquefactionPointInterpolation based on 88 bore holes at 1.5 m[9]
Dominant building typeSpatial gridsDerived from geo-referencing[57]
Table 2. Data layer source for different hazard assessment.
DatasetLandslide Effective FactorFlood Effective FactorFire Effective FactorEarthquake Effective Factor
Distance from fault
Slope
Aspect
Profile curvature
Distance from stream
LULC
Lithology
Distance from road
Annual precipitation
NDVI
Elevation
Population density
Distance from fire brigades
Distance from gas station
Distance from transmission line
Distance from electric substation
Distance from main settlement
Distance from old settlement
Soil liquefaction
Seismic intensity
Dominant building type
Table 3. Hazard zonation percentage area of landslide, flood, earthquake, fire, and multi-hazard in Kathmandu Valley.
Hazard ZonationLandslide (%)Flood (%)Fire (%)Earthquake (%)Multi-Hazard (%)
Very low14.7723.6533.3116.0620.12
Low25.2420.2535.1723.3226.05
Moderate28.5320.9715.9929.1322.02
High22.6821.5411.8822.2919.24
Very high8.7813.593.669.2012.57
Table 4. Observed damaged density in the different hazard zones.
Earthquake Hazard ZoneAreaEarthquake Damage AreaEarthquake Damage Density
km2%km2%
Very low98.4416.066.035.030.061
Low142.9523.3222.3618.650.156
Moderate178.5429.1337.6831.430.211
High136.6522.2934.9029.110.255
Very high56.429.2018.9215.780.335
Table 5. Validation of different historical hazard events with the hazard maps.
Hazard ZonationLandslideFloodFire
Events%Events%Events%
Very low12.7800248.76
Low25.5625.882810.22
Moderate411.1125.885520.07
High1336.111029.418029.20
Very high1644.442058.828731.75
Publisher’s Note: MDPI stays neutral with regard to jurisdictional claims in published maps and institutional affiliations.

