Article

Predictive Maintenance as a Driver for Corporate Sustainability: Evidence from a Public-Private Co-Financed R&D Project

Department of Management & Innovation Systems, University of Salerno, 84084 Fisciano, Italy
*
Author to whom correspondence should be addressed.
Sustainability 2021, 13(11), 5884; https://0-doi-org.brum.beds.ac.uk/10.3390/su13115884
Submission received: 17 February 2021 / Revised: 7 May 2021 / Accepted: 14 May 2021 / Published: 24 May 2021

Abstract

:
Can public–private research favor sustainable economic growth? Can innovation in terms of predictive maintenance (a recently consolidated evolution compared to the more traditional final and preventive maintenance) favor sustainable business balance? Drawing on the Quadruple Helix model and adopting the users’ (fourth helix) perspective, this paper seeks to provide initial answers to these two questions. Following an exploratory approach, it applies case study methodology to present the research outcomes of the D.I.A.S.E.I. Project, a co-financed research and development (R&D) project. Using a mixed-methods approach, narrative and quantitative, the study highlights that investing in predictive maintenance allows companies to reach better profitability ratios and sustainable value indexes. This is possible because of the improved quality of the provided services, higher revenues and the reduction of extraordinary maintenance costs. Furthermore, if companies support investment in predictive maintenance through correct financial decisions, they may create value over time and favor sustainable business balance. The work is the first empirical investigation, which should encourage further explorations. There are numerous implications, including reference to the co-creation of value, the effects on decision support systems and sustainable competitive advantage.

1. Introduction

Public–private research, involving government, academia and industry, has mainly been studied through the lens of the Triple Helix Model. However, more recent studies have begun to include the role of other helices [1]. In particular, some studies have found there is an important role played by the ‘fourth helix,’ which represents public users in civic society who are the recipients of innovations developed through public–private research [2]. These users may lead the process of innovation development and benefit from the implementation of the new product/process.
By adopting the users’ perspectives, this research aims to study if public–private research may favor sustainable economic growth. In detail, it aims to verify whether and how the introduction of a new technology, developed through public–private research, affects companies’ performance and their ability to create sustainable value over time.
The new technology that is the object of study is predictive maintenance (PdM), a recently consolidated approach to maintenance compared to the more traditional forms of final and preventive maintenance.
Today, decision-making processes are increasingly data-driven, decisions more ‘informed’ [3], the exchange of information is rapid (often in real-time), it can be precise, punctual, efficient and valid. Many opportunities arise from the use of high technologies in organizational and management domains, achieving greater efficiency and effectiveness in process and timeliness, reliability, predictability and consistency between quality and safety performance.
Nevertheless, the risk of ’data deluge’ and the difficulty of ensuring there are useful elements of data is very high, while the ability to make quick, accurate and comprehensive decisions becomes increasingly fundamental. The evolution of decision support systems (DSS) is of increasing importance in many aspects of service provision, for diagnostics (descriptive analytics), assistance phases (follow-up analytics) and forecasting possible future choices (predictive analytics) and related reasons (prescriptive analytics) [4,5]. In business operations, information reliability is fundamental to many sectors worldwide and deserves to be supported by proper analysis of available data [6]. As the degree of reliability increases, the costs related to breakdowns, spare parts, costs deriving from lack of productivity or maintenance costs all reduce [7].
In the industrial field, in particular, a thorough maintenance policy is needed in order to avoid or prevent premature failures (attributed to design deficiency or installation defects), accidental or random failures (non-nominal operating conditions producing inevitable alterations with consequent loss of operational capabilities) and structural failures (which often led to the preventive replacement of obsolete components) [8].
All this leads to a focus on the evolution in human–machine interactions derived from the arising platformization in today’s decision-making processes. Sometimes, the use of information technology (IT) tools (such as artificial intelligence (AI), DSS or chatbots) to make appropriate decisions appears unsuccessful and unsupportive for humans (e.g., non-performance/wrong performance/poor performance of the task), non-humans (e.g., non-learning or erroneous learning from the human interaction) and the ecosystem in which they interact (e.g., processes do not increase the ecosystem viability/continuity as a whole) [9].
A new technology based on the principles of PdM has been developed within a co-financed research and development (R&D) project. This project, entitled ‘D.I.A.S.E.I.-Diagnosis of Failures and PdM in Innovative Energy Systems,’ was completed in 2020 and involved the present researchers [10]. It has been presented and conducted by the Department of Science and Business-Management and Innovation Systems (DISA-MIS) of Salerno University (UniSA), in collaboration with two private partners (Cosmo Service Ltd. and C.O.M.E.A. Consortium) operating in the Campania Region of Italy, in the energy sector, funded by the Campania Region (POR FESR 2014/20).
For the purpose of the present paper, this project is selected as a case study to verify whether and to what extent PdM affects the performance and the ability of companies that equip themselves with appropriate tools and/or invest in targeted industrial research and experimental development to create sustainable value over time. The uniqueness of the project allows preliminary conceptualizations on an unexplored theme, that of PdM, according to an exploratory approach [11].
The case study methodology [12] is appropriate to address the two related research questions:
(i)
Can public–private research favor sustainable economic growth?
(ii)
Can, specifically, innovation in terms of PdM favor sustainable business balance?
By framing the study via the Quadruple Helix, the D.I.A.S.E.I. Project allows focus on the fourth helix—the users, here intended as providers—who may decide to invest in the innovative technology developed within the project. This technology is intended to support analysis, diagnosis, the proposal of maintenance interventions in a predictive manner and improve the quality of the service provided (such as the supply of electricity) with respect to the management and anticipation of future possible physiological/structural or contingent/occasional challenges. Specifically, in this work, reference is made to energy devices and, therefore, both the indicators and the references to PdM refer to the energy sector.
The findings make a small contribution to the issue of sustainability. First, the narration of the D.I.A.S.E.I project allows for the implementation of the Quadruple Helix model on a real case and confirms the importance of the fourth helix (the users). First, the role of PdM users (energy dealers) is explicitly highlighted, even if final users of energy provision (people) are also relevant to the overall evaluation of performance level. Second, the quantitative analysis supports what can be speculated about the logical connection between PdM and sustainable corporate balance, especially in an era of continuous uncertainty in which reliable and instant decision support can make a difference in terms of competitiveness. The implications are numerous, including for the co-creation of value, the effects on DSS and sustainable competitive advantage. This first confirmatory analysis may provide useful information for the continuation of exploratory investigations, both desk-based and via fieldwork.
The paper is structured as follows: Section 2 present the scientific framework and starts from the recent advances in studies on sustainability in terms of quadruple/quintuple helices and the potential link with the emergent PdM in business organizations; Section 3 introduces the methodological approach, presenting a summary of the case study (the D.I.A.S.E.I. Project) to propose some hypotheses and describing the data collection process, the quantitative analysis and the main results; Section 4 present the discussion and final remarks, with a focus on value co-creation processes; Section 5 outlines conclusions.

2. Scientific Framework

2.1. Latest Advances in Sustainability Studies

In evolving studies on sustainability, the Triple Helix model [13,14] re-thought the structural links between the well-known fields of environment, society and economy by focusing on their integration, from which institutional agents such as universities, industry and government emerge.
From this starting point, a new role for each agent has been highlighted, as central government shares policies with the recipients (increasing the cooperation with local municipalities), the industry prefers to work on technology-transfer processes that are now more calibrated with local actors and universities open training courses to suit the context of their local communities [15]. What derives from all this is a virtuous self-feeding cycle for mutual benefit, involving all dimensions of social and economic development [16,17], making the holistic lens more evident and insightful [18,19,20].
This understanding helps to highlight that the main dynamics are more recursive and rationally reinforcing: industry works better and delivers greater results if well-trained by universities more efficiently supported by far-sighted planning that is financed and locally managed by the government. In the same way, innovative processes may arise to take advantage of the interactions occurring between each party, joining the key components of knowledge (R&D outcomes and teaching and training), production (productivity and human capital) and stability (political options and public financial investments).
More recently, sustainability has been approached by using a system-thinking framework [21,22]. This helps to appreciate biunivocal or radial synergies originating from a set of sustainable actions intended as a whole [23,24], resource integration from a common and equifinal approach, institutional arrangements deriving from behavioral convergence and cognitive alignment, which all sustain effective decision-making [25,26,27].
These positive effects can be further improved through the understanding of new relevant elements [28]. The inclusion of the emerging fourth and fifth helices in the sustainability graph, civil society (iv) and the environment as a whole (v) foster new reflections in terms of sustainable actions [29] (Figure 1).
Accordingly, the fourth helix allows greater attention on technology transfer in innovative processes, as favored by a cyclic approach and an increased involvement of surrounding actors in acquiring new knowledge [30]. The image shows how the helices overview can graphically change, definitively overcoming the previous icon representation.
The fourth helix of the ‘media-based and culture-based public’ and the ‘civil society’ [2] (p. 13) contributes by making evident the role of users in confirming the sustainability of any adopted solution. This inclusion explains how new instructions can be used, which competencies are needed, how engaged customers can support quality thanks to their active participation and how much this practice increases expertise and knowledge [31]. The consequent iterative and layered process generates new knowledge (‘the stratification of knowledge’) by transforming innovation in technologies and elaborating evolutions in markets [32,33,34].
The alignment among the actors is determined in terms of the ‘degree to which an organization’s design, strategy, and culture are cooperating to achieve the same desired goals. It is a measurement of the agreement or relative distance between several ideal and real elements of organizational life’ [35] (p. 23). The conceptualization of the fourth helix is a key indicator for identifying possible pathways of alignment among the three other helices [36].
The main issue is the capacity of organizations (and then managers) to generate new knowledge helpful to pursue their own final goals while trying to avoid mistakes, disturbances or misalignments. In this sense, information asymmetry takes a role [37] because the analysis of the relationship focuses on instances where the ‘inability to assess quality represents exposure to two different forms of supplier opportunism, namely, misrepresentation of an outlet’s true characteristics and actual quality cheating’ [38].
This also affects human–machine interactions, mainly in terms of knowledge management. To reduce information asymmetry, a cognitive alignment between the actors is requested [39] to handle the problem of cognitive distance, defined broadly as ‘the degree of diversity in research methodologies and in the use and interpretation of knowledge, can influence the process of technology transfer’ [40] (p. 489). Both imposed top-down and spontaneous bottom-up cognitive alignment allow for the avoidance of any type of opportunistic behavior and, at the same time, direct all energy, resources and technology along the same pathway, with positive effects on the value of the achieved result.
In these situations, investments are required to reach cognitive alignment for policy makers, managers and organizations [41], such as: (i) to conceive an educational system that does not only teach the principles of competitiveness; (ii) to develop a social system capable of promoting common values and styles of life; (iii) to promote interaction and relationships not only within the boundaries of specific projects and/or directed at specific aims; (iv) to improve the expertise of policy makers, managers and organizations in terms of finding and promoting pathways for cognitive alignment within organizations and with external actors.

2.2. Exploring the Main Current Features of PdM

In general, information sharing (with shared databases, data storage, data extraction, and data processing) favors a more functional, versatile, scalable, context-friendly service design [42,43], where decision making can make a difference and, therefore, deserves to be further explored.
The main characteristics of the data that can be reached (data acquisition/disclosure), aggregated/combined (data manipulation) and used (data consumption) in the service organizations’ processes are considered the most critical [44]. For this purpose, the 10 Vs of big data will be taken into consideration (Volume, Velocity, Variety, Veracity, Value, Validity, Variability, Venue, Vocabulary and Vagueness) to understand how new knowledge (and, therefore, awareness) is generated in service and how much the decision-making processes are consequently influenced, with particular reference to the possible advantages of meta-data, data modeling/architecture and data integration [45].
In industrial fields, data feed several types of maintenance to sustain the continuity of business over time. The maintenance policies are different and distinguished (and ruled/regulated) as follows:
  • corrective (par. 7.5 of UNI EN 13306: 2018);
  • preventive/cyclical (par. 7.2 of UNI EN 13306: 2018);
  • condition-based (CBM) (par. 7.3 of UNI EN 13306: 2018);
  • predictive (PdM) (par. 7.4 of UNI EN 13306: 2018);
  • improvement (par. 7.4 of UNI 10147: 2013).
PdM allows a forecast of the moment in which the parameter under control will exceed the preset limit threshold and includes the development of forecast models based on operating data and the monitoring parameters of the entity to be maintained [46]. Specifically, PdM acts for:
(i)
real-time diagnostics of each component, which can also be consulted remotely;
(ii)
greater knowledge of the interaction between the pieces forming the production platform, which in turn depends on the aforementioned availability of real-time data on the individual components;
(iii)
refined understanding of the causes and effects of each production stage;
(iv)
greater accuracy in predicting the malfunction of machinery and individual components;
(v)
minimization of sudden stops, since the weak signals of a forthcoming fault are detected, and action is taken by scheduling maintenance activities;
(vi)
greater respect for delivery times, because by avoiding unexpected stops, it is possible to respect production plans;
(vii)
minimization of production waste because the maintenance intervention prevents failures and malfunctions, reducing production defects and resulting waste.
The most used methods of decision-making in service can be improved/refined/streamlined from the point of view of data management (such as cloud computing for information sharing or artificial intelligence) for interpretation by available data and the generation of new data, as well as machine learning, data mining and sentiment analysis [47,48].
The failure rate is the ratio between the probability that the failure occurs in an elementary time interval and the duration of that interval. This is assuming that at the time t the component is still functional. It has dimension (t−1) and can be interpreted as ‘number of failures per unit of time’ (Figure 2).
Different value ranges of the aforementioned parameter are distinguished, which express different states of the system, from a very stable system (very low parameter) to a stable system, to a system in pre-alarm, passing through a system requiring preventive maintenance and, finally, a system requiring maintenance for failure occurred. The time that is believed to elapse between one control and another of the parameter is shown on the abscissa axis. In very stable system conditions at instant t_k, a new check at instant t_k + ∆t_3 is suggested, which is longer than the time interval to the next check, necessary in the case of a stable system, and much longer than when the system immediately t_k is in pre-alarm.
The implementation of predictive analytics solutions within a production architecture that was not designed with a view to sustainable Industry 4.0 may seem extremely difficult and lead to the observed system being not sustainable at all. Below is a shortlist of the main tools required to draw on data useful for predictive purposes [49,50] to properly support human–machine interaction within decision-making processes:
  • sensors, necessary for the real-time collection of data from the machines (Internet of Things-IoT-paradigm). It should be noted that in addition to maintenance purposes, the installation of sensors on production machinery can be useful for multiple purposes in a smart factory;
  • communication software to facilitate the exchange of information between production machinery within the factory. Gateway devices are a point of contact between controllers, for example, a programmable logic controller (PLC) and the computational platform that unifies and analyzes the collected data. These devices also have the function of protecting the IoT network, monitoring the transport of data and ensuring interoperability between devices within the production space;
  • analytical infrastructure, which includes the tools capable of efficiently completing the data ingestion and storage processes of the amount of data produced by the various sources. With the presence of immense and diverse amounts of data, the traditional data warehouse is being replaced by a more powerful and efficient infrastructure called a data lake. The analytical infrastructure, therefore, also includes the tools that can process the data present in the data lake and present them efficiently;
  • predictive platform, the computational heart that aims to analyze the various information provided by the production apparatus and provide business rules that can be quickly implemented. The creation of predictive models is usually outsourced, but the forecasts provided by a PdM solution can be incorporated into the production process so that more or less immediate decisions can be made based on the forecasts themselves.
Figure 3 shows how the flow can be in a cyclical manner, highlighting the self-feeding iterative process [47,51]. Starting from data extraction (1) through several sources, such as machine and plant sensors, as well as several relevant inputs from daily operations, a number of different analyses (2) should be done in order to output some check and alert reports. After acquiring data as they have been clustered, an effective information sharing activity (3) occurs and should be managed with appropriate instruments (databases and multiple device interfaces) followed by a machine learning process (4) to properly filter data for mining and classification. Finally, a PdM (5) can derive as a result of the entire flow as a whole for the definition of new statistical models and insightful decision-making. This, in the end, will be the initial step for the next cycle.
The typical flowchart is no longer applicable here. The cyclic approach is more appropriate and occurs (for instance) in the logic of maintenance for several instruments and plants in firms.
In the presence of these components, it is possible to collect real-time data on temperature, vibrations, wear, energy consumption, mechanical, electrical and electronic data. These data will be automatically historicized, generally through a business intelligence architecture and analyzed with predictive analysis algorithms. There are several HW/SW architectures on the market to implement PdM solutions in smart factories. Furthermore, from the point of view of the professionals involved, System Applications and Products (SAP) emphasize that not only data scientists should be considered, but also analysts and domain experts.

2.3. Linking Sustainability and PdM

The possibility of a defined link between the capacity to effectively predict future trends (rather than only estimating them) and sustainable actions in business has been confirmed through a recent Scopus literature review of ‘maintenance and sustainability’ [52]. For PdM particularly, in a number of specified business strategies, management tools and technical operations, the link is based on: (i) the endpoint detection systems of semiconductor manufacturing [53]; (ii) the definition of sustainable condition-based maintenance [54]; (iii) sustainable smart manufacturing in Industry 4.0 [55].
Continuing the bridge with sustainability studies, with the introduction of helix inter-spheres discussed above, and the fourth helix, in particular, PdM helps to provide a better service. This has positive effects both for users of the implemented technology (such as firms or dealers) and for the targeted demand who will benefit from a more efficient and qualitative solution, as it will be usefully and properly maintained via the following updates:
  • track and trace, or the ability to follow specific materials or real semi-finished objects for the entire production process, where it is difficult to do so visually;
  • quality control, which can be extended and automated in various production phases;
  • inventory, to monitor and control the quantity of resources used or potentially reusable materials to minimize storage costs and avoid situations of surplus or deficit.
Human–machine interactions are fostered by AI solutions, which are progressing at high speed, showing abilities to perceive words, develop cognition, build relationships and fill roles. However, the foundation of an international Trustable AI committee comprising companies developing AI solutions and the multiple calls for studies still poses many questions on how AI should be developed and used by humans [56], for example, in values-oriented design and ethics [57] for users.
Following the above reflections on the fourth helix concerning the relevance of users, the emerging scenarios place humans and machines in an alternative position, no longer ‘complementary’ as in previous maintenance proposals, to solve today’s complex problems. This can develop in two different directions. First, technology has been considered as a tool humans adopt to achieve objectives, where the human decision-maker fully assumes risks derived from any fallacy in the solution provided by the trusted AI for sustainable action in business. Second, the ability of AI to produce patterns of solutions places the decision-maker in a subordinate position, and the risk of the latter contravening the machine’s solution goes hand-in-hand with the risk of machine error [58], with huge effects on sustainability.
There is a need to better understand how the information flow works, what criticalities it presents, how it feeds the activation and management of known operations, how it integrates the various data sources and how it supports the management of queries, schedules, layers, overlaps, alerts, availabilities, delays, recoveries, retrieval/revival and privacy/security. Following on, a new way to integrate and underpin the PdM cycle process is proposed. As seen in the above conceptualization of helices, in the following picture, the users (directly from the fourth helix) can be usefully included and activated in all identified steps by contributing in several ways:
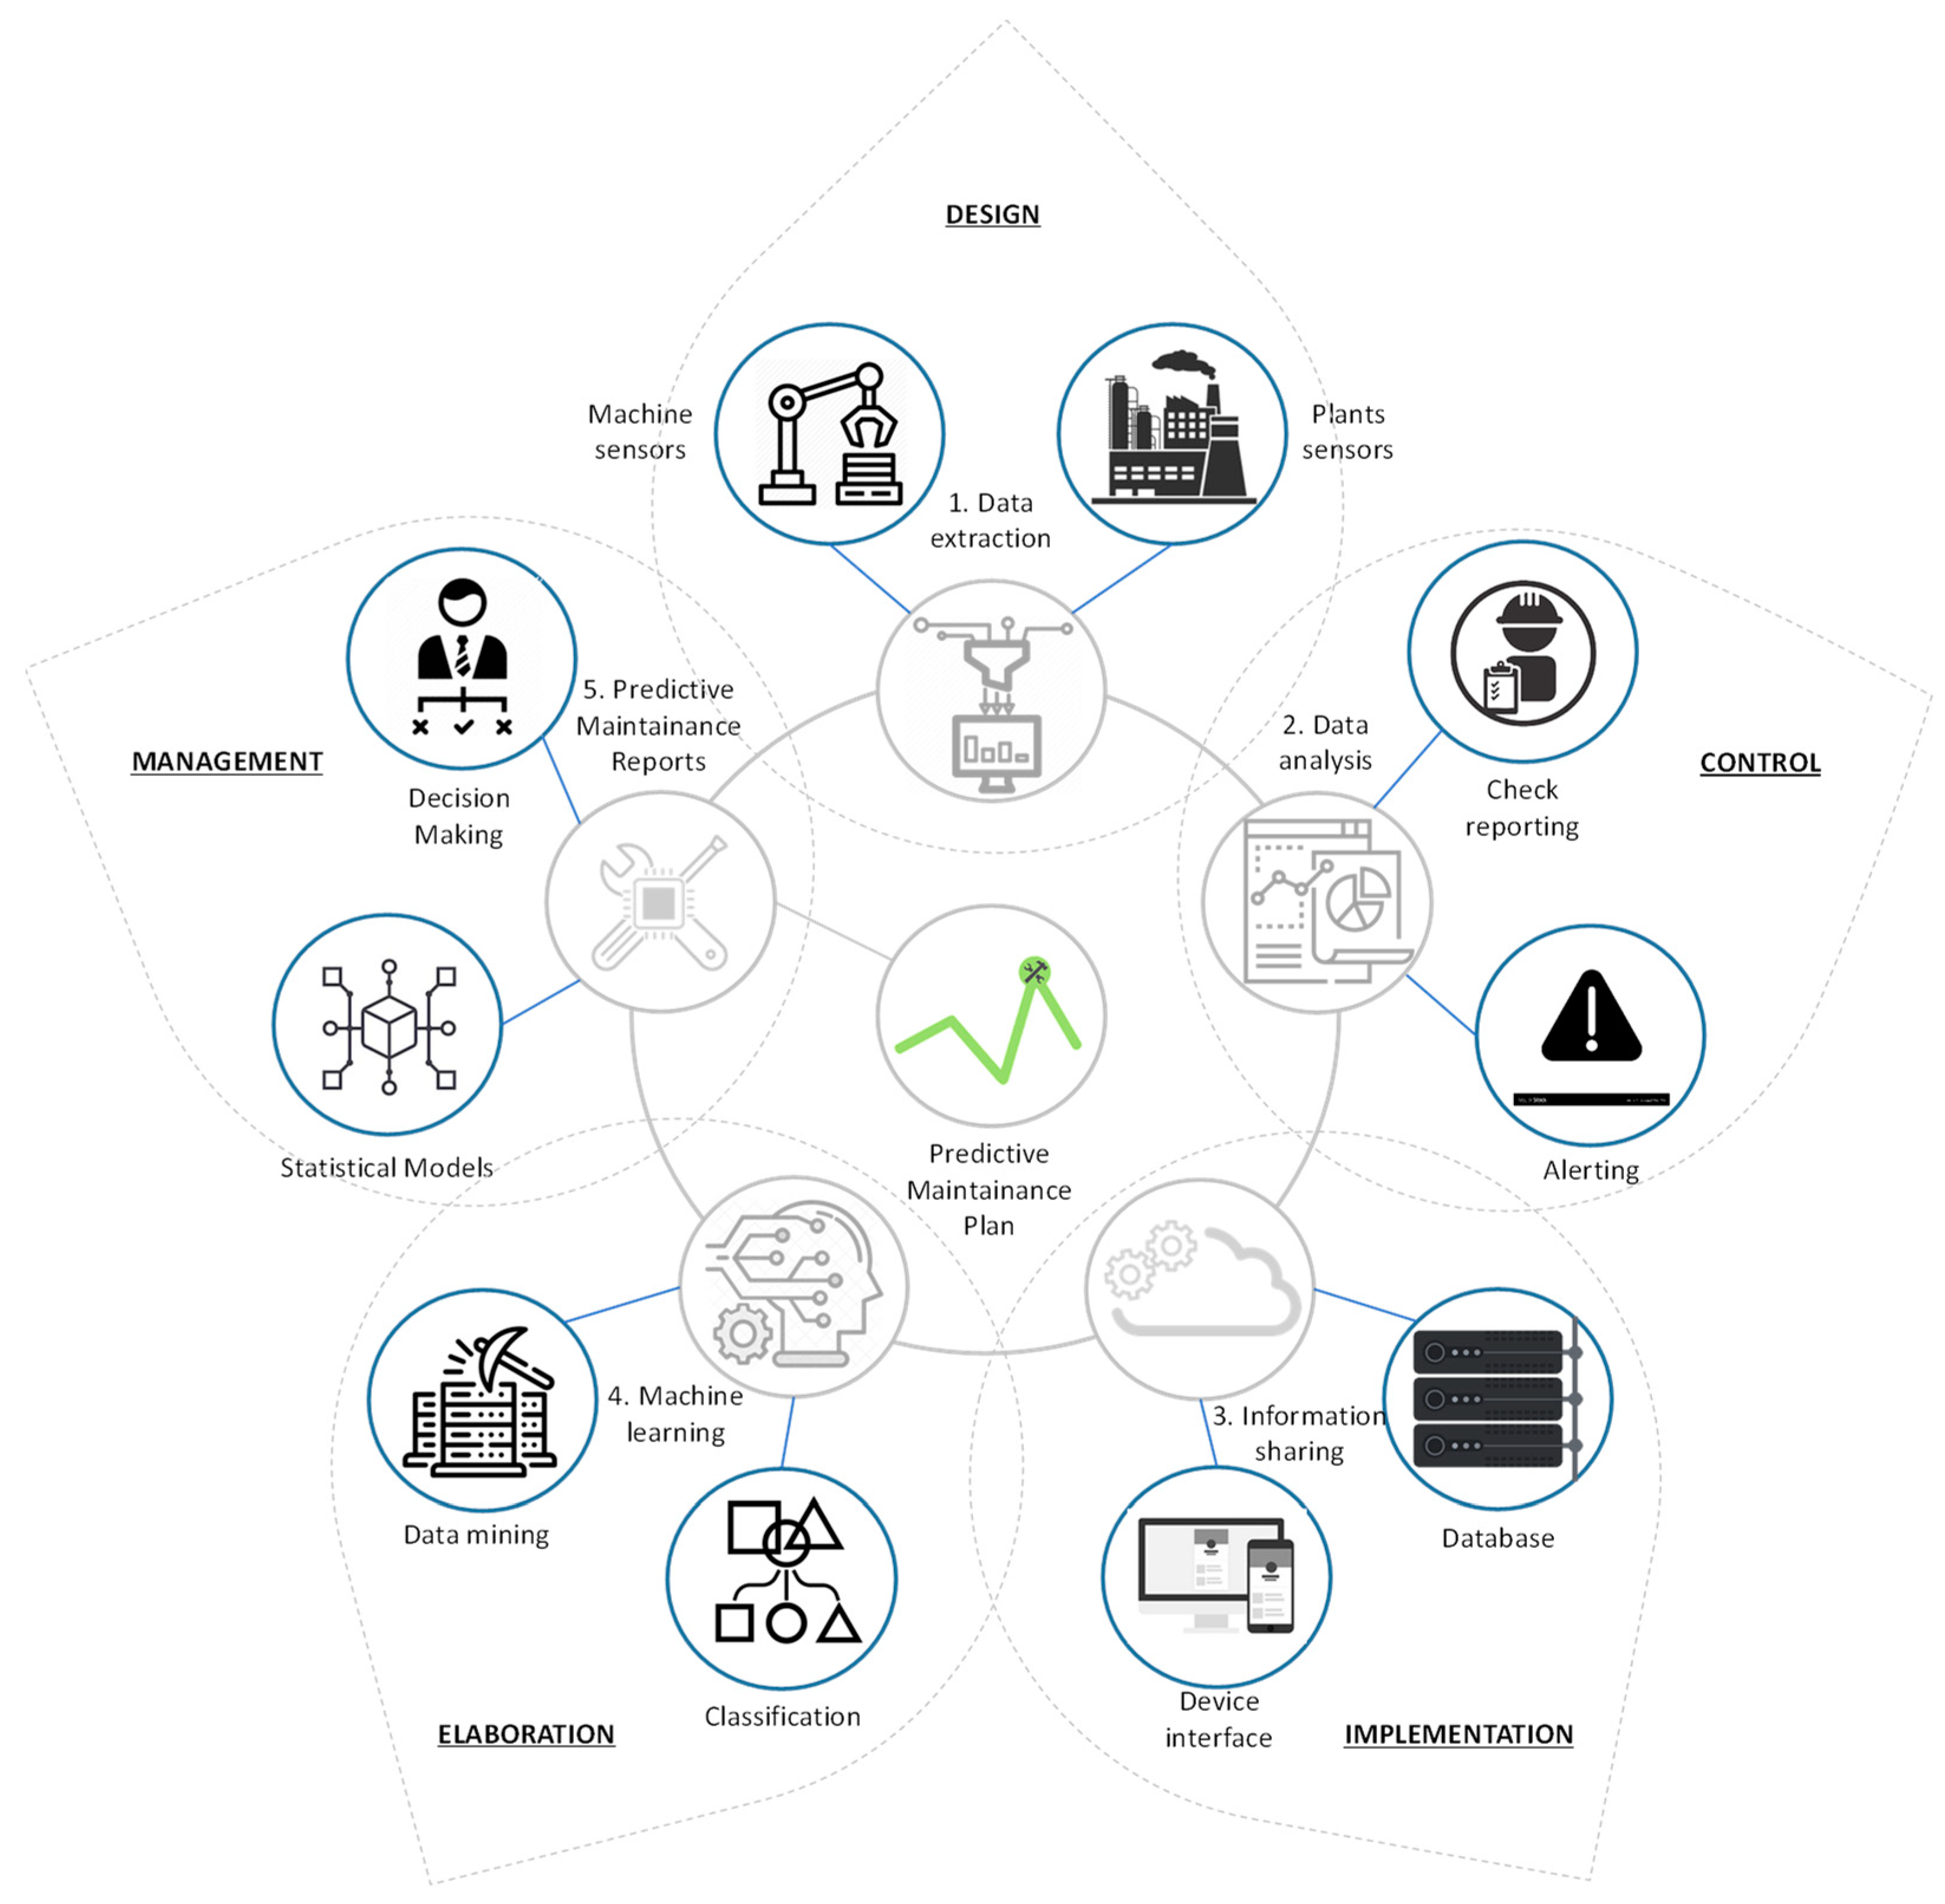
  • the design of sensors’ positioning in types of machinery and plants is crucial for data extraction so that it strategically follows the main aim of business owners’ plans;
  • the internal/external communication of insight reports both for simple checks and significant alerts is relevant to reach the right person at the right moment;
  • the instrument equipment implementation for storing and using the acquired data to share and make them available when needed should be thought through in a specific way so that it fits with the wants/needs of all users (decision-makers, operators, auditors, shareholders, etc.);
  • the hi-tech tools dealing with data elaboration support the re-reading of several phases in the correct demining of critical information for managers;
  • the action management of daily operations is strongly affected by decision-making and behavioral models, consequently originating from previous steps and can contribute to the next generation of PdM for future rounds.
In Figure 4, five main elements have been grouped. The cyclic approach is also confirmed because of the logical connection between the design made up to start any process, and the following steps of check control (through reporting), implementation of the equipment (for the respondent diffusion of strategic information), data elaboration (for the right filter and cluster) and operational management to return to the start.
Finally, new insights from studies on sustainability in terms of technology transfer, as introduced before, lead organizations to re-think a number of processes to improve operations and plans. Ultimately, in production platforms that adopt PdM strategies, action is taken only where and when strictly necessary, since it is possible not only to have a real-time diagnosis of the maintenance status of the machinery but also to generate alerts when the operating parameters’ optimal changes register significant variations or exceed the set threshold values.
This allows estimation of when components will reach the end of life, minimizing the risk of failure and sudden machinery crashing. More specifically, the availability of diagnostic and forecast data in real-time allows for:
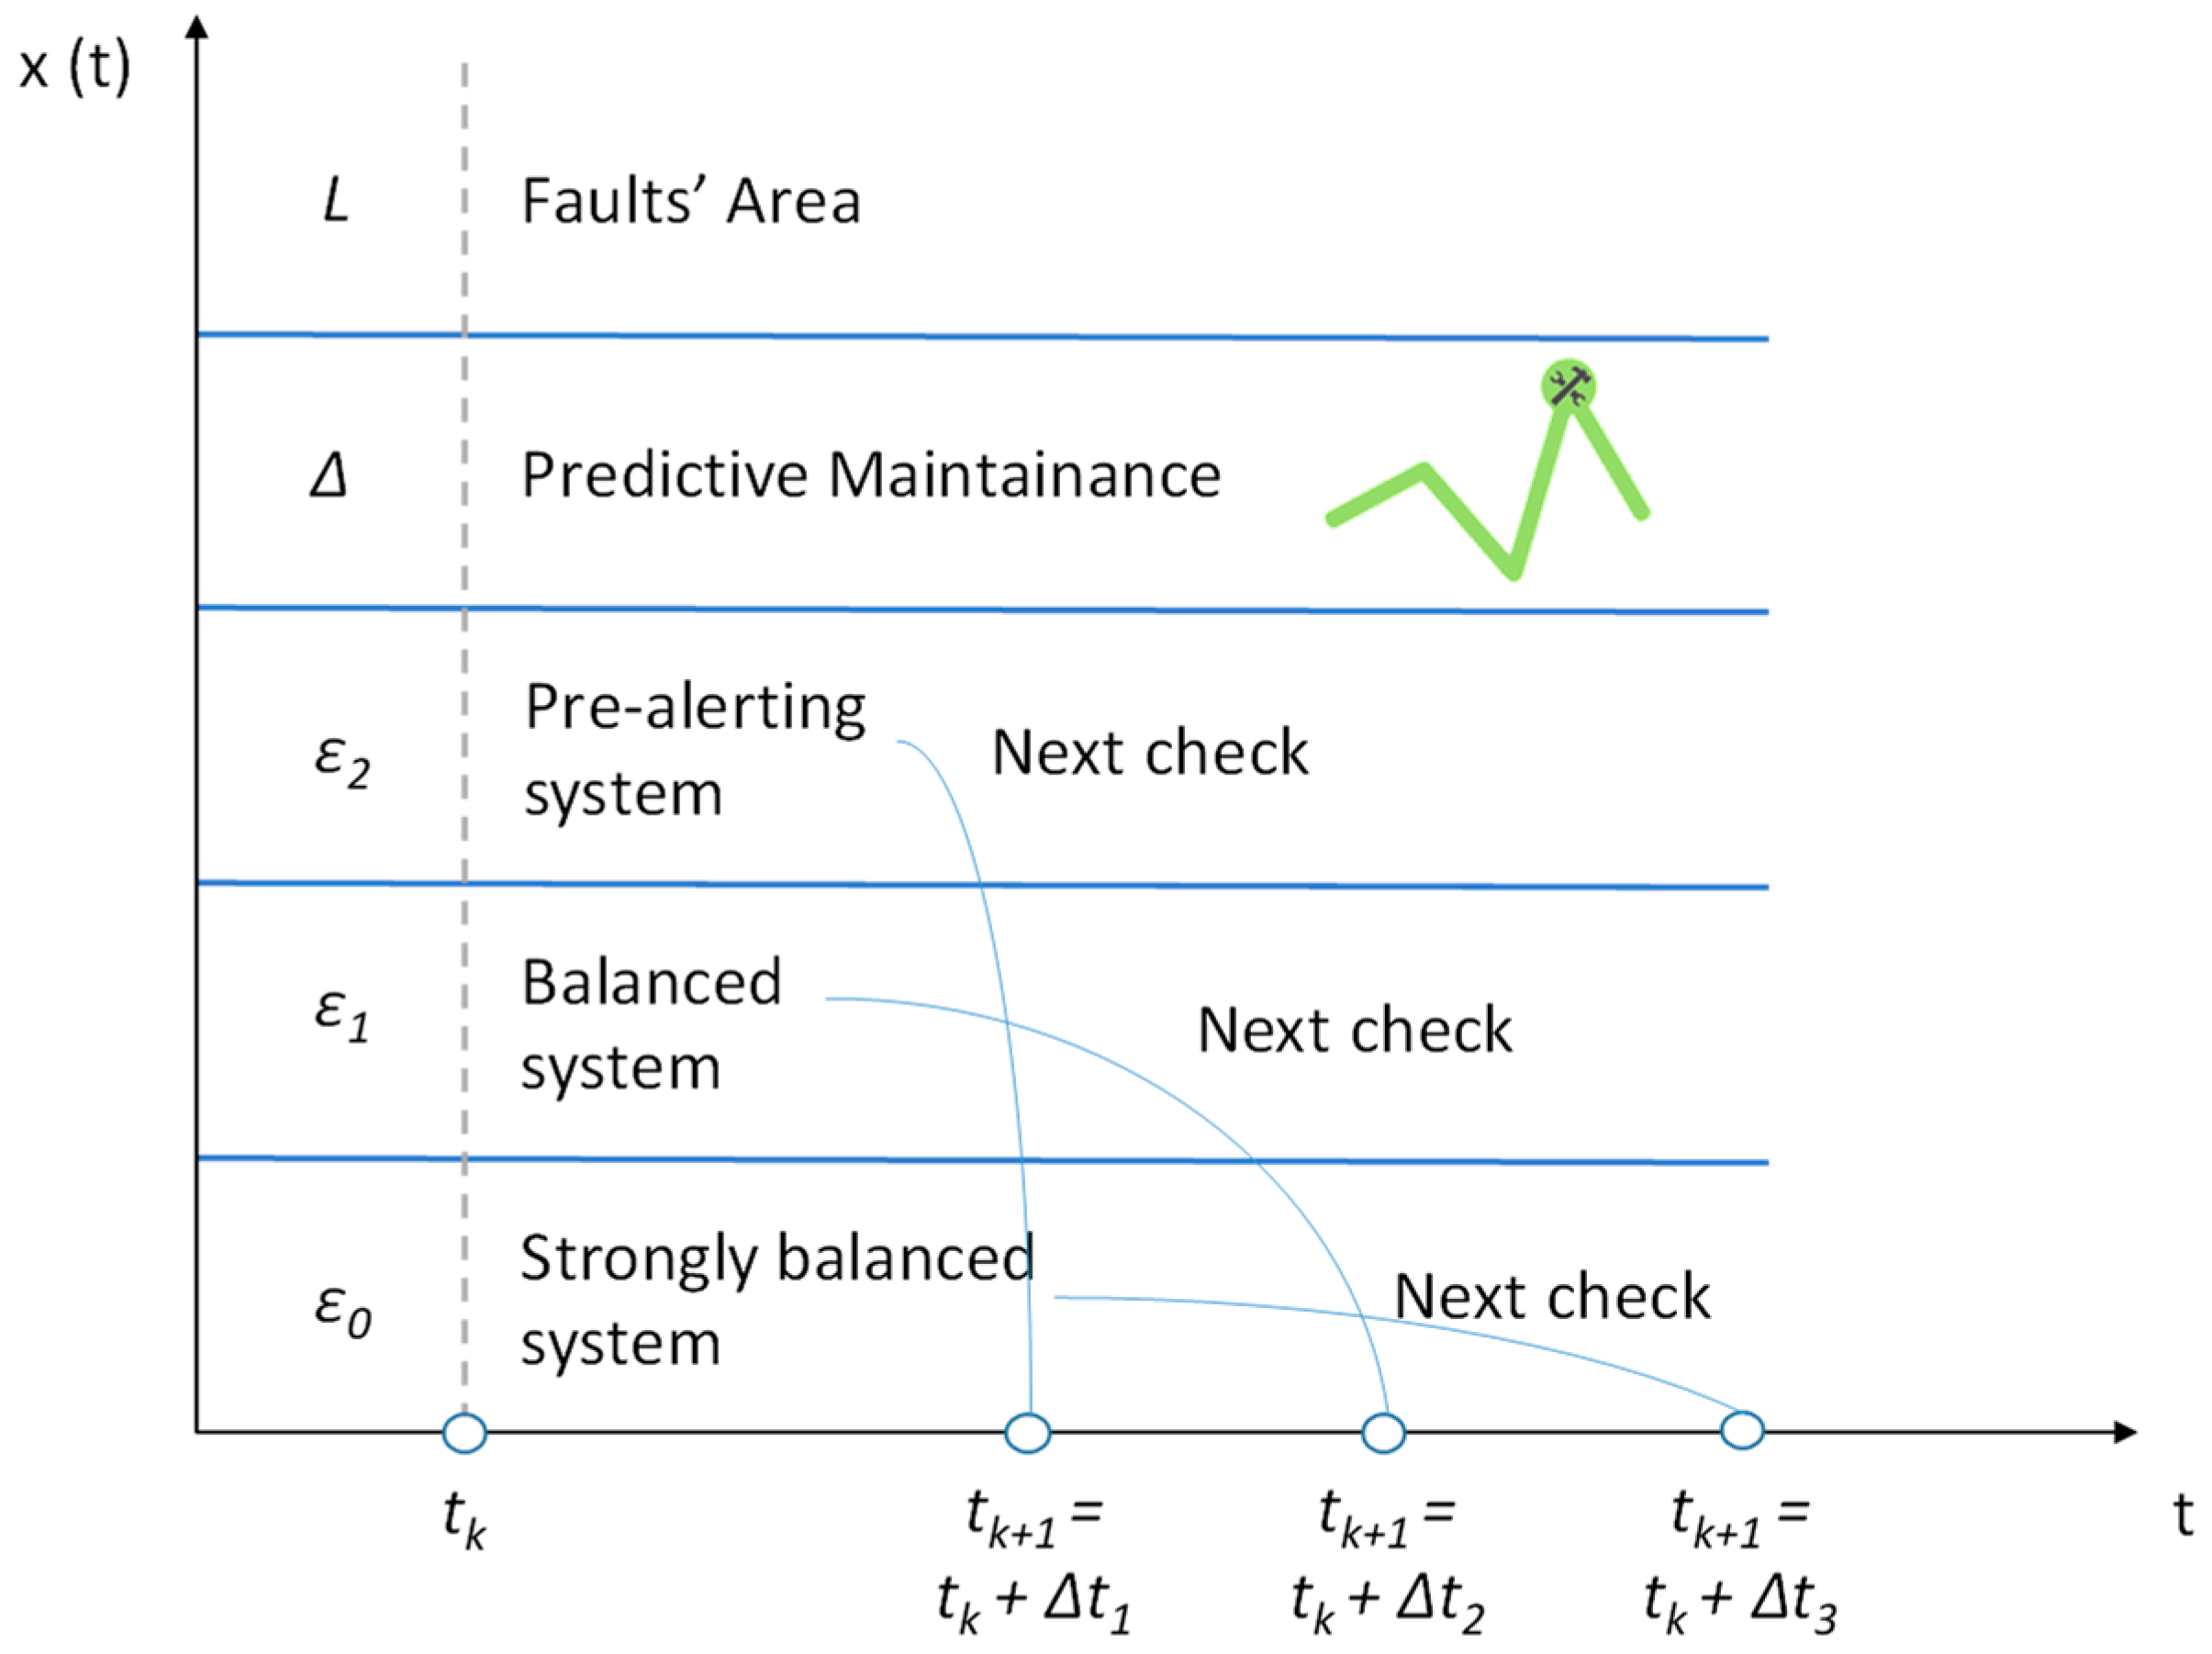
  • prediction of the conditions of the fault, calculating the time between one fault and the next and defining the actions to be taken at the level of ordinary preventive maintenance;
  • evaluation of the performance of the machinery over time, aggregating large amounts of data from different sources, with the aim of stimulating the machine learning process and allowing the system to refine the algorithms in order to reduce deviations from the forecast;
  • estimation of the residual life of the machinery, to assess the need for replacement or maintenance, the costs of interventions and the phases of the processes, but above all, to avoid extraordinary events that could affect company efficiency (production stops).
Having introduced maintenance policies for sustainability and the costs of reliability, each implies different implementation costs but also different outcomes, linked to sustainable actions and balanced dynamics in business. It is possible to distinguish between direct costs (labor, materials, external companies) and indirect costs (no production, accidentality of non-production, influences on product quality, safety conditions for personnel and facilities, influences on the state of conservation of the plants, financial and spare parts warehouse management costs).

3. Methodology

3.1. Case Study Research

As the PdM is an unexplored theme, this study adopts an exploratory approach [10] and employs a case study methodology [59] to present the D.I.A.S.E.I. Project, selected for its uniqueness [9] and to investigate the effects of the introduction of the PdM in terms of sustainability.
Even though the analysis of a single case makes it difficult to generalize results, it allows an in-depth exploration by permitting the understanding of a contemporary phenomenon within its complex context by using a variety of lenses [10,60,61,62]. As Gummesson [63] (p. 8) sustains, through case analysis, it is possible to study ‘the numerous factors and their links and interactions in dynamic context’.
Case study methodology has been acknowledged as an approach to generating and testing theory that has provided the mainstream management field with ground-breaking insights [64]. Properly, case theory suggests the conceptualization of cases as the ground in the real world for theory generation, reporting, conclusions and practical applications [8]. By analyzing a case in-depth, it is then possible to move from the particular to general and to condense complexity in simpler thoughts and actions.
Although some authors, in a ‘post-positivist’ perspective, believe that researchers should not influence the phenomenon through their cognitive biases and suggest reducing to a minimum the interaction with research subjects [65] to keep a realist perspective while preserving objectivity [66], case theory puts emphasis on interactive research [9]. This approach, adopted in the present study, asks for close interaction between the researcher and the object of the study, data, respondents, etc. [67]. The direct involvement can allow the researcher to better understand the phenomenon and its complexity.
According to case theory, this study also applies a mixed-methods approach, using different data sources to investigate the unit of analysis [68] and encompassing descriptive narratives and quantitative techniques. Narratives are fundamental in the conceptualization of the case and in hypotheses development but are limited. Therefore, we implement them through the application of a bivariate analysis to verify the existence, the significance and the sign of a relationship between the introduction of the PdM and sustainable economic growth.

3.2. The Case Study of the D.I.A.S.E.I. R&D Project

The case selected to deepen the role of PdM in enhancing sustainability is the D.I.A.S.E.I project. It was selected because of its uniqueness [9], being the first project carried out by academia and industry, and supported by public funds, to develop an innovative technology based on the PdM. It proposes a new modular-hierarchical architecture of energy systems for industrial applications. In particular, it associates ‘automation panels’ to a ‘main energization panel’ in order to carry out efficient diagnostics on the various components making up the system and to implement the PdM. Potential users of the proposal are complex energy-intensive users, such as suppliers of electricity or railway transport services. By adopting their perspectives, the quantitative analysis verifies the capacity of PdM to improve financial performance (FP) and create sustainable economic growth.
The project intends to use an innovative technological solution for the management of failures in integrated energy systems for medium/large users and/or scattered over a wide geographical area, capable of automatic and optimized management of any failure situations in all the components of the system, as well as providing indications for corrective and preventive maintenance of a predictive type.
In particular, the project is based on the use of solutions that are equally efficient with respect to pure ‘physical redundancy,’ but which have characteristics of greater cost-effectiveness and architectural simplicity, together with the better overall performance from the point of view of reliability and quality of the service. These solutions, based on the principles of ‘analytical redundancy’ or ‘functional redundancy,’ make it possible to treat the events of failure or simple malfunction in drift, both of the user system and of the monitoring and management system of the same, as ‘atypical’ conditions of operation. This is with respect to which the systems adapt and seek a new condition of operational balance aimed at maximizing residual functionality while identifying the corrective/preventive maintenance actions to be implemented.
The context in which the research project operates is that of the creation of new power supply panels equipped with self-diagnosis capabilities and advanced treatment of incipient failures for the optimization of maintenance, lifetime and the minimization of downtime of the powered systems. These capabilities are guaranteed by the use of fault diagnosis and overcoming techniques aimed, on the one hand, at guaranteeing the prompt response of a problem (detection and isolation) and, on the other hand, at allowing, even if with limitations, the correct operation of the systems even in the presence of a fault (‘recovery’ procedures).
At present, typically, power panels do not provide for advanced fault diagnosis techniques or supervision systems capable of managing PdM on energy systems. The project proposes to equip the energization system (as a whole) with a set of devices capable of performing an efficient diagnosis on the various components making up the system to allow the implementation of PdM techniques.
For users, the introduction of PdM represents a sort of investment in fixed assets and, as such, it implies the employment of financial resources [69,70]. In this logic, it will be considered convenient if future cash flows will be higher than the initial cost [71]. More specifically, the introduction of PdM will imply a reduction, almost an elimination, of the extraordinary maintenance costs, fiscal advantages and greater effectiveness and efficiency of maintenance activities. These aspects have repercussions on profitability ratios and value indexes. Therefore, to capture the effects of PdM on FP and sustainable economic growth, we consider some profitability ratios and value indexes [72,73]. As profitability ratios, we use the return on sales (ROS), the return on investment (ROI) and the return on equity (ROE).
ROS expresses the ability of a company to be efficient. Efficiency is related to a company’s ability to reduce costs and transform a greater part of revenues into operating income. As the introduction of predictive maintenance translates in minus costs, we may hypothesize that:
Hypothesis 1.
The introduction of predictive maintenance improves companies’ efficiency.
ROI highlights a company’s ability to use resources in the best way possible and remunerate the invested capital. The introduction of predictive maintenance implies both a higher denominator and numerator of this ratio, but because the denominator reduces over time because of the amortization process, predictive maintenance, thanks to a cost reduction, improves the operating income and, in turn, the ROI. Therefore, we hypothesize that:
Hypothesis 2.
The introduction of predictive maintenance improves returns on invested capitals.
ROE may be interpreted as a synthetic parameter expressing the global profitability of a company. As it is measured as the ratio between net income and net capital, PdM will generate an improvement of this ratio because it increases the net income thanks to the cost reduction and the fiscal advantages. By considering the same level of net capital, we may hypothesize that:
Hypothesis 3.
The introduction of predictive maintenance improves global profitability.
Furthermore, we are interested in understanding the effects that the PdM may have on sustainable economic growth over time. The profitability ratios are the basis of estimating value indexes, such as economic value added (EVA) and market value added (MVA). However, these require a further step that is a matching between a company’s operating structure and its financial structure. By also considering companies’ decisions about capital structure and their cost of capital, we may estimate the greater value that a company may create by introducing the PdM. A greater value will depend on a cost reduction, on the one hand, and on the right choice in selecting capitals to support the investment, on the other hand. By supposing that a company with a vision towards the future wants to maintain the same weighted average cost of capitals or reduce it, we may hypothesize that an improved operating structure could contribute to creating greater value over time and thus formulate:
Hypothesis 4.
The introduction of predictive maintenance allows companies to create sustainable value.

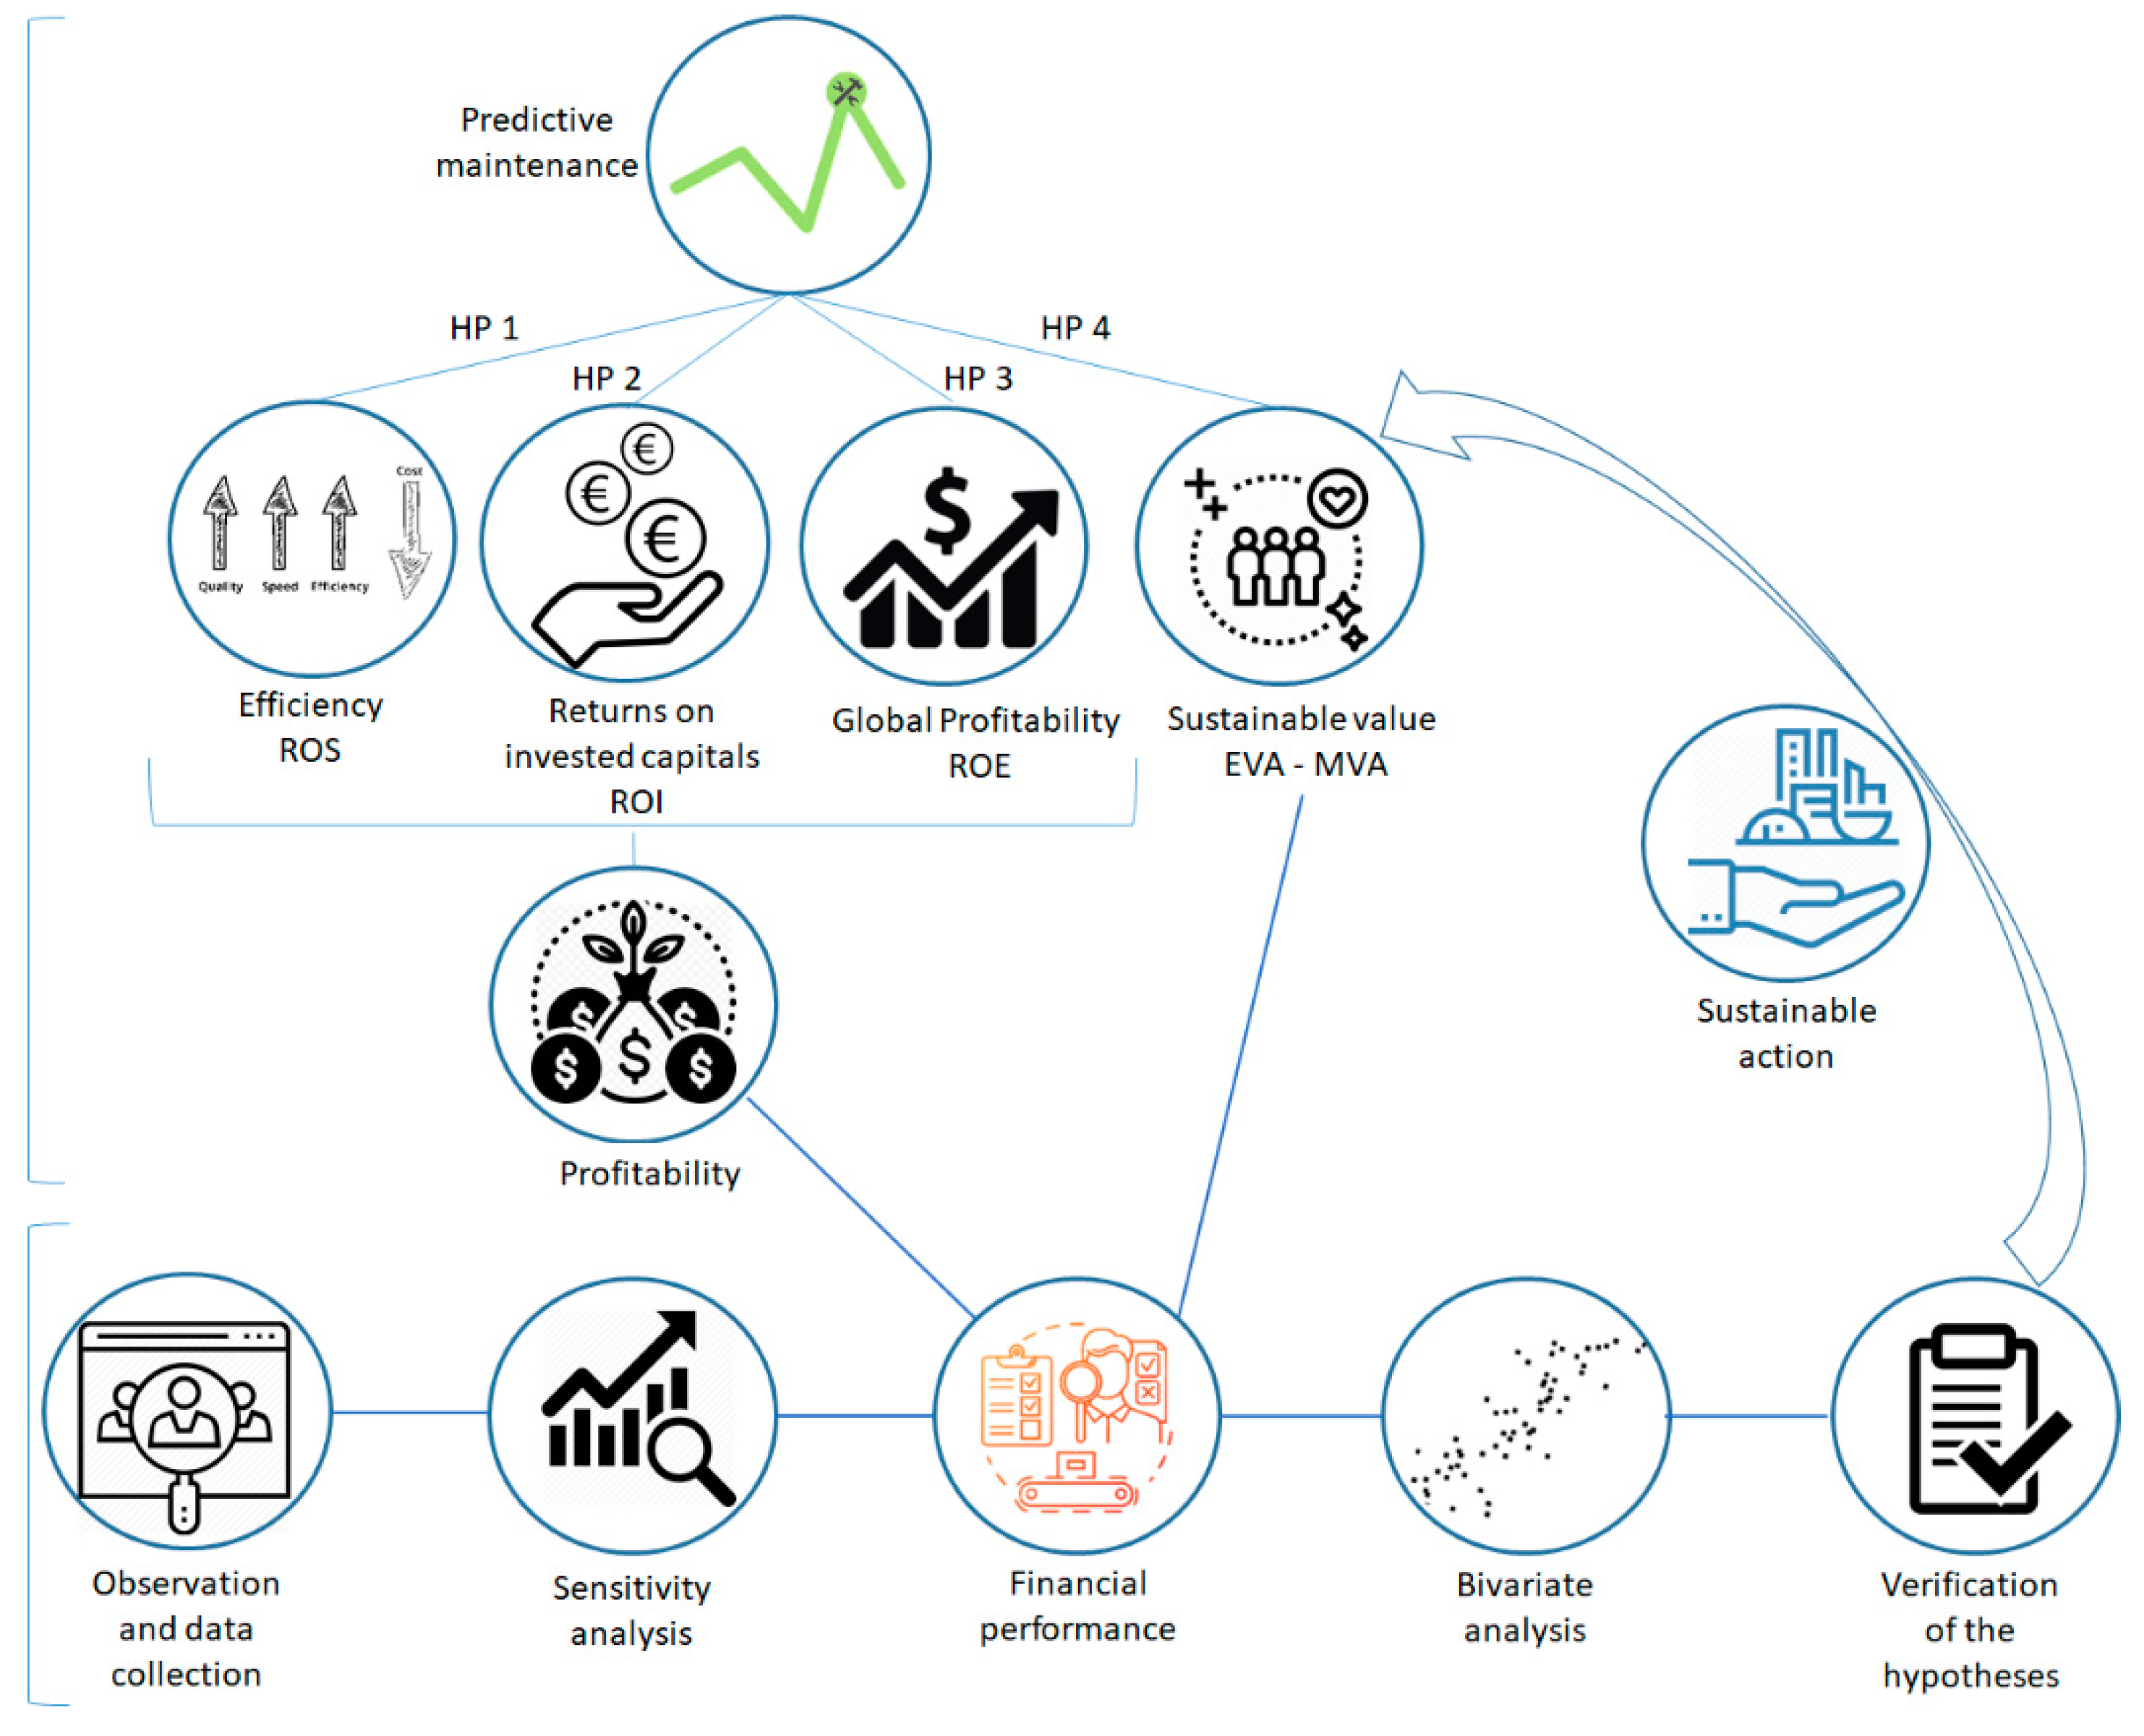
3.3. Research Model Design

In line with the chosen research methodology, beyond a descriptive narrative to introduce the D.I.A.S.E.I. Project and formulate the research hypotheses, this study presents a quantitative analysis to verify the existence, the significance and the sign of the relationship between the introduction of the PdM and sustainable economic growth. On the AIDA Bureau Van Dijk database, we collected data on income statements and balance sheets of companies potentially interested in acquiring the technology developed within the D.I.A.S.E.I. Project.
Through the application of a sensitivity analysis, we estimated the income statements and balance sheets for the next five years by basing our forecast on historical data. The estimations were carried out by considering the hypothesis of no acquisition of the new technology and the hypothesis of acquisition in an optimal, normal and worse situation. On the basis of the estimated balance sheets and income statements, we computed the main ratios to assess companies’ FP. On those data, we applied a bivariate analysis to test the existence, the significance and the sign of a relationship between the introduction of the PdM and financial performance and between the introduction of the PdM and firms’ ability to act in a sustainable way and create sustainable economic growth over time.
Figure 5 summarizes the research model design, whose phases are described in detail in the subsequent paragraphs.

3.4. Sample Selection and Data Collection

To test our hypotheses, we collected data from the AIDA Bureau van Dijk database about companies that may be potentially interested in acquiring the technology developed within the D.I.A.S.E.I. Project and, thus, in introducing PdM in their organization. The AIDA Bureau van Dijk database reports financial data and company details for about 900,000 Italian firms. Specifically, for our analysis, we considered as a selection criterion the classification of economic activities (ATECO) code of the companies and selected those belonging to the energy and railway industries. Furthermore, we excluded small and medium-sized organizations. Lastly, we verified that companies had the physical structures for introducing new technology and that they were not just service providers. In doing so, we sampled 17 potential users of the D.I.A.S.E.I. technological proposal.
For each company in our sample, we collected the income statements and balance sheets for the years 2016–2020.

3.5. Sensitivity Analysis and Description of Variables

In order to have data useful to investigate the effects of the introduction of the technology developed within the D.I.A.S.E.I. Project on companies’ sustainable economic growth, we estimated the income statements and balance sheets for the next five years (2021–2025) through the application of a sensitivity analysis by basing our forecast on historical data (income statements and balance sheets for the years 2016–2020). We recognize this practice can be risky when considering the introduction of new technology. To mitigate such risk, we have operated along two different lines. First, we interviewed some employees (also in senior positions) operating in the industries considered in our sample. In this way, we obtained practical and experienced support to understand the areas of the companies interested by the introduction of the new technology; second, we carried out a sensitivity analysis, which is a technique used when there is uncertainty in the output of a model because it can be apportioned to different sources of uncertainty in the model input [74]. Specifically, we estimated companies’ future income statements and balance sheets by considering the hypothesis of no acquisition of the new technology and the hypothesis of acquisition in three different scenarios (optimal, normal, worse) [75]. This practice allows us to control for under- and over-estimations.
On the basis of the estimated balance sheets and income statements, in the hypotheses of introduction and no introduction of PdM, we computed the main ratios to assess companies’ financial performance for each hypothesized scenario. Specifically, we calculated ROS, ROI and ROE as profitability ratios. ROS is calculated as Earnings Before Interest, Taxes, Depreciation and Amortization (EBITDA)/Sales ratio. We use EBITDA because it is less subject to manipulation than the Earnings Before Interest and Taxes (EBIT) figure [76]. It expresses the operating efficiency of companies, that is, their ability to transform revenues into operating income. ROI is calculated as the income before extraordinary items and discontinued operations divided by the invested capitals (net assets minus investments in extra operating activities) [77]. In the formula, this is expressed as EBIT/invested capital. It measures companies’ capacity to turn investments into income. Lastly, we calculated ROE as the ratio between net income and the capital invested by shareholders. In the formula, this is expressed as net income/net capital. It is an index expressing a company’s global profitability and its ability to remunerate those who bring risk capital to the company [78]. Beyond profitability ratios, to better catch the potential of the technology developed within the D.I.A.S.E.I. Project on companies’ sustainable economic growth, we also computed two sustainable value indexes: EVA and MVA. EVA measures a company’s financial performance based on the residual wealth or the real profits generated by a company. It is calculated by subtracting the product of the company’s initial capital and the percentage cost of capital from its after-tax net profit [79] and expresses how profitable an organization can become within a given period of time. In the formula, this is expressed as NOPAT–WACC * invested capitals, where NOPAT is the Net Operating Profit After Taxes, and WACC is the Weighted Average Cost of Capital. In order to capture the wealth that will be created over time, we also computed the MVA by summing the discounted EVA calculated for the future five years [80]. In formula, MVA = t = 1 5 E V A t 1 + W A C C t .
By calculating all these ratios and indexes for the 17 companies in our sample, we obtained a total of 1496 observations.

3.6. Bivariate Analysis and Hypotheses Verification

To the above data, we applied a bivariate analysis [81] to test the existence, the significance and the sign of a relationship between the introduction of the PdM and FP and between the introduction of the PdM and firms’ ability to act in a sustainable way and create sustainable economic growth over time.
We carried out five t-tests (mean difference tests) because we had a qualitative variable (PdM), measured as a dummy with two modalities, 1 when the company introduces the PdM and 0 when the company does not, and quantitative continuous variables (ratios and indexes). The application of this technique allows us to verify if the means of the quantitative variables computed in the two groups determined by the qualitative variable are significantly different from each other, proving the existence of the relationship, or are similar, proving the absence of the relationship between PdM, performance and wealth.
Through the application of a bivariate analysis, we tested our five hypotheses of association and verified that all are supported by results.
The results shown in Table 1 highlight that the three profitability ratios and the two sustainable value indices are higher in the hypothesis of adoption of PdM. First, we verified the assumption of homoscedasticity through the application of Levene’s test (H0: the variance between the two groups is homogeneous) [82]. Its p-value was lower than 0, with a p-value of 0.05 for the relationships PdM–ROS, PdM–ROI and PdM–EVA. It resulted in p-values higher than 0.05 for the relationships PdM–ROE and PdM–MVA. Accordingly, in the first three cases, we could interpret that the assumption of homogeneity cannot be considered as verified, and, thus, we looked at the robust t-tests. Their p-values were lower than 0.05; hence, we could reject the null hypothesis and suggest that the means of ROS (+2.43%), ROI (0.11%) and EVA (0.15) are higher in the hypothesis of adoption of PdM. In the other two cases, we may accept the homogeneity hypothesis and look at the classic t-test. The p-values were lower than 0.05; hence, we can suggest that the means of ROE and MVA are also higher in the hypothesis of adoption of PdM (Table A1, Table A2, Table A3, Table A4 and Table A5, in Appendix A, present more detail).
Figure 6 sums up the results suggesting that, through the introduction of PdM, companies are able to act in a sustainable manner and may tend towards sustainable economic growth by reaching better profitability ratios and sustainable value indexes. The Figure can be interpreted as an ideal path.

4. Discussion

The concept of sustainability is multidimensional and has multiple meanings [83]. The classic distinction operates on the triad of social, environmental and economic sustainability [84]. While several studies have deepened the social [85,86,87] and environmental [88,89] dimensions, it is almost a paradox that only a few studies (among others, [90,91]) have focused on the economic dimension of sustainability that is the basis for other two.
The present study addresses this aspect, with the aim to provide an adjunctive, although minimal, advancement to the research on the sustainability issue. The paper, by drawing on the Quadruple Helix model [30], adopts the users’ (fourth helix) perspective to confirm, empirically and quantitatively, what can be estimated about the logical relationship between PdM and sustainable economic growth, through actual results derived from a direct experimental experience.
The D.I.A.S.E.I. Project, thanks to its innovativeness, multidisciplinary approach and direct involvement of researchers, has offered the opportunity to interpret the Quadruple Helix model in a real case and to field-test the role that PdM may exert on companies’ financial performance and value creation.
The D.I.A.S.E.I. Project may be considered as a virtuous example of interrelation between a university (UniSA), government (Campania Region) and industry (Cosmo Service Ltd. and C.O.M.E.A. Consortium). The three actors have been able to develop very insightful technological innovation while thinking about the benefits for users (fourth helix), who here are service providers. It has provided new suggestions regarding socio-economic and managerial expectations (maintenance of sustainable standards, organizational rationalization and containment of public spending), primarily in cases of errors or malfunctioning (liability), sensitive personal data protection (privacy) and safe storage of users’ data (cyber security).
Findings support the initial intuition and the research hypotheses. The quantitative analysis highlighted that an investment in PdM increases the fixed assets of a company if it reduces extraordinary maintenance costs that make the operating income higher and allows the company to benefit from fiscal advantages improving, in turn, the net income. Such variations in balance sheets and income statements imply an increment in the profitability ratios in terms of higher returns on invested capitals and in terms of shareholders’ remuneration.
This is especially possible thanks to more efficient management of operating costs that allows translation of a greater part of revenues in income. Empirical results support the significant difference between the mean values of profitability ratios for companies that decide to invest in PdM and companies that avoid the investment.
Figure 7 shows how PdM impacts the economic sustainability of those companies that equip themselves with appropriate tools and/or invest in targeted industrial R&D activities. The introduction of innovative devices capable of favoring the analysis, diagnosis and the proposal of maintenance interventions in a predictive manner improves the quality of the provided service (such as the supply of electricity), with respect to the management and anticipation of future possible failures (physiological/structural or contingent/occasional), in an iterative way.
From an economic perspective, this may translate to higher revenues that, together with cost reduction, contribute to determine higher income. To put it another way, investing in PdM may help companies in generating large amounts of free cash flows that can be used, in a virtuous circle, to invest and innovate again. If the company is also able to support the investment through correct financial decisions by keeping the cost of capital low, improved profitability ratios transform into the creation of greater value over time [92]. This aspect, corroborated by the empirical results, underlines the capacity of PdM to favor a sustainable business balance, providing, in turn, a positive answer to the second research question of this work.
Furthermore, the major economic and financial resources generated could be employed to support the other two dimensions in addition to sustainability, the social and the environmental. Companies with a greater amount of cash flow available could decide to use this just to remunerate shareholders or, from a stakeholder perspective [93], could invest in activities to improve the environmental and social conditions of a large community. From a wider perspective, PdM could therefore generate value not just for the users but for civic society, if companies decide to behave as actors of social change and social finance [94] by pursuing not just economic sustainability but corporate sustainability, defined as ‘the inclusion of social and environmental concerns in business operations and in interactions with stakeholders’ [95]. The discussion of the findings obtained through the analyses carried out on the D.I.A.S.E.I. Project provides a positive answer to the main research question of this work by highlighting that public–private research may favor the co-creation of sustainable value.

5. Conclusions

This work aimed to verify whether and how PdM could impact the economic sustainability of those companies that equip themselves with appropriate predictive maintenance tools and instruments. The research outcomes of D.I.A.S.E.I. Project revealed evidence supporting this by properly linking financial ratios from business analytics to sustainable performance.
The findings make an intriguing contribution to understanding how decision-making can be useful in pursuing successful new end goals in a sustainable manner by taking into account the four helices; in particular, the fourth helix of users that, with supportive technology (implemented in a predictive sense), can bring more concrete advantages from innovative processes over time.
PdM contributes to facing uncertainty and sustains business development against frictions, disturbances, misunderstandings and misalignments that can occur in a business life cycle. The virtuous self-feeding cycle, inspired by the fourth helix in recent sustainability studies, can foster all the processes as a whole.
Although the quantitative analysis supports the hypotheses and confirms what can be logically estimated about the relationship between PdM and sustainable economic growth, it is important to highlight that the analyses are carried out on estimations that are obtained through the application of a sensitivity analysis. This limitation makes the findings not widely generalizable and invites future scholars to test the same effects on final data from balance sheets and income statements, available after PdM has been introduced in some companies.
Future research in terms of business and finance management is recommended to explore the drivers of sustainable innovation and benchmark best practices for sustainable behavior in business.

Author Contributions

Conceptualization, all authors; introduction, F.P. and C.G.; theoretical framework, L.C.; methodology, R.S.; discussion, L.C. and R.S.; conclusion, F.P. and C.G.; writing—original draft preparation, L.C. and R.S.; writing—review and editing, F.P. and C.G.; visualization, L.C. and R.S.; supervision, F.P. and C.G. All authors have read and agreed to the published version of the manuscript.

Funding

This research received no external funding.

Conflicts of Interest

The authors declare no conflict of interest.

Appendix A

The appendix shows in detail the results of bivariate analysis.
Table A1. T-test predictive maintenance for ROS.
Levene’s Test for Equality of VariancesT-test for Equality of Means
Fsig.tdfSig. (2-tailed)Mead DifferenceStd Error Difference
ROSEqual variances assumed2.2780.0312.371180.1212.430.78
Equal variances not assumed 2.561120.0112.430.53
Table A2. T-test predictive maintenance for ROI.
Levene’s Test for Equality of VariancesT-test for Equality of Means
Fsig.tdfSig. (2-tailed)Mead DifferenceStd Error Difference
ROIEqual variances assumed2.2220.0091.071050.0560.110.003
Equal variances not assumed 1.091370.0080.110.008
Table A3. T-test predictive maintenance for EVA.
Levene’s Test for Equality of VariancesT-test for Equality of Means
Fsig.tdfSig. (2-tailed)Mead DifferenceStd Error Difference
EVAEqual variances assumed2.713.0272.4317620.0480.150.004
Equal variances not assumed 2.5412410.0120.150.006
Table A4. T-test predictive maintenance for ROE.
Levene’s Test for Equality of VariancesT-test for Equality of Means
Fsig.tdfSig. (2-tailed)Mead DifferenceStd Error Difference
ROEEqual variances assumed2.2220.1392.591180.0110.080.003
Equal variances not assumed 2.88935510.0070.080.002
Table A5. T-test predictive maintenance for MVA.
Levene’s Test for Equality of VariancesT-test for Equality of Means
Fsig.tdfSig. (2-tailed)Mead DifferenceStd Error Difference
ROSEqual variances assumed2.1650.1422.461150.0140.120.009
Equal variances not assumed 2.77614730.0120.120.010

References

  1. Leydesdorff, L. The triple helix, quadruple helix,…, and an N-tuple of helices: Explanatory models for analyzing the knowledge-based economy? J. Knowl. Econ. 2012, 3, 25–35. [Google Scholar] [CrossRef] [Green Version]
  2. Carayannis, E.G.; Campbell, D.F.J. Mode 3 Knowledge Production in Quadruple Helix Innovation Systems; Springer: New York, NY, USA, 2012. [Google Scholar]
  3. Polese, F.; Carrubbo, L.; Caputo, F.L.; Sarno, D. Managing Healthcare Service Ecosystems: Abstracting a Sustainability-Based View from Hospitalization at Home (HaH) Practices. Sustainability 2018, 10, 3951. [Google Scholar] [CrossRef] [Green Version]
  4. Spohrer, J.; Bassano, C.; Piciocchi, P.; Siddike, M.A.K. What Makes a System Smart? Wise? In Advances in the Human Side of Service Engineering; Ahram, T., Karwowski, W., Eds.; Springer International Publishing: Cham, Switzerland, 2017; pp. 23–34. [Google Scholar]
  5. Barile, S.; Quattrociocchi, B.; Calabrese, M.; Iandolo, F. Sustainability and the Viable Systems Approach: Opportunities and Issues for the Governance of the Territory. Sustainability 2018, 10, 790. [Google Scholar] [CrossRef] [Green Version]
  6. Troisi, O.; Ciasullo, M.V.; Carrubbo, L.; Sarno, D.; Grimaldi, M. Meta-management for sustainability in territorial ecosystems: The case of Libera’s social reuse of territory. Land Use Policy 2019, 84, 138–153. [Google Scholar] [CrossRef]
  7. Karnouskos, S.; Colombo, A.W.; Lastra, J.L.M.; Popescu, C. Towards the energy efficient future factory. In Proceedings of the IEEE International Conference on Industrial Informatics, Cariff, UK, 13–26 June 2009. [Google Scholar]
  8. Brizzi, P.; Conzon, D.; Khaleel, H.; Tomasi, R.; Pastrone, C.; Spirito, A.M.; Knechtel, M.; Pramudianto, F.; Cultrona, P. Bringing the Internet of Things along the manufacturing line: A case study in controlling industrial robot and monitoring energy consumption remotely. In Proceedings of the IEEE International Conference on Emerging Technologies and Factory Automation, Cagliari, Italy, 10–13 September 2013. [Google Scholar]
  9. Jasiulewicz-Kaczmarek, M.; Legutko, S.; Kluk, P. Maintenance 4.0 technologies—New opportunities for sustainability driven maintenance. Manag. Prod. Eng. Rev. 2020, 11, 74–87. [Google Scholar]
  10. Gummesson, E.; Sarno, D.; Carrubbo, L.; Sirianni, C. Contributing to Sustainable Healthcare Systems with Case Theory. Int. J. Bus. Manag. 2019, 14, 34–47. [Google Scholar] [CrossRef] [Green Version]
  11. Tellis, W. Application of a case study methodology. Qual. Rep. 1997, 3, 1–19. [Google Scholar] [CrossRef]
  12. Yin, R.K. Designing case studies. In Case Study Research; SAGE: Thousand Oaks, CA, USA, 2008; pp. 359–386. [Google Scholar]
  13. Etzkowitz, H.; Zhou, C. Triple Helix twins: Innovation and sustainability. Sci. Public Policy 2006, 33, 77–83. [Google Scholar] [CrossRef]
  14. Etzkowitz, H.; Leydesdorff, L. The dynamics of innovation: From National Systems and “Mode 2” to a Triple Helix of university-industry-government relations. Res. Policy 2000, 29, 109–123. [Google Scholar] [CrossRef]
  15. Alvesson, M. Social identity and the problem of loyalty in knowledge-intensive companies. J. Manag. Stud. 2000, 37, 1101–1122. [Google Scholar] [CrossRef]
  16. Lozano, R. A holistic perspective on corporate sustainability drivers. Corp. Soc. Responsib. Environ. Manag. 2015, 22, 32–44. [Google Scholar] [CrossRef]
  17. Sciarelli, M.; Cosimato, S.; Landi, G.; Iandolo, F. Socially responsible investment strategies for the transition towards sustainable development: The importance of integrating and communicating ESG. TQM J. 2021. [Google Scholar] [CrossRef]
  18. Caputo, F.; Del Giudice, M.; Evangelista, F.; Russo, G. Corporate disclosure and intellectual capital: The light side of information asymmetry. Int. J. Manag. Financ. Acc. 2016, 8, 75–96. [Google Scholar] [CrossRef]
  19. Calabrese, M.; Iandolo, F.; Caputo, F.; Sarno, D. From Mechanical to Cognitive View: The Changes of Decision Making in Business Environment. In Social Dynamics in a System Perspective; Barile, S., Pellicano, M., Polese, F., Eds.; Springer: New York, NJ, USA, 2007; pp. 223–240. [Google Scholar]
  20. Farioli, F.; Barile, S.; Saviano, M.; Iandolo, F. Re-reading sustainability through the Triple Helix model in the frame of a systems perspective. In The SAGE Handbook of Nature; SAGE: London, UK, 2018; pp. 10–37. [Google Scholar]
  21. Wiek, A.; Withycombe, L.; Redman, C. Key competencies in sustainability: A reference framework for academic program development. Sustain. Sci. 2011, 6, 203–218. [Google Scholar] [CrossRef] [Green Version]
  22. Barile, S.; Saviano, M.; Iandolo, F.; Calabrese, M. The viable systems approach and its contribution to the analysis of sustainable business behaviors. Syst. Res. Behav. Sci. 2014, 31, 683–695. [Google Scholar] [CrossRef]
  23. Iandolo, F.; Barile, S.; Armenia, S.; Carrubbo, L. System dynamics perspective on a viable systems approach definition for sustainable value. Sustain. Sci. 2018, 13, 1245–1263. [Google Scholar] [CrossRef]
  24. Iandolo, F.; Caputo, F. La Creazione di Valore tra Economia, Impresa e Sostenibilità; Editrice Nuova Cultura, Collana ManOTec: Roma, Italy, 2018. [Google Scholar]
  25. Barile, S.; Pels, J.; Polese, F.; Saviano, M. An introduction to the viable systems approach and its contribution to marketing. J. Bus. Mark. Manag. 2012, 5, 54–78. [Google Scholar]
  26. Barile, S.; Polese, F.; Carrubbo, L. Il Cambiamento quale Fattore Strategico per la Sopravvivenza delle Organizzazioni Imprenditoriali. In Immaginare l’innovazione; Barile, S., Polese, F., Saviano, M., Eds.; Giappichelli Editore: Torino, Italy, 2012; pp. 2–32. [Google Scholar]
  27. Badinelli, R.; Barile, S.; Ng, I.; Polese, F.; Saviano, M.; Di Nauta, P. Viable Service Systems and Decision Making in Service Management. J. Serv. Manag. 2012, 23, 498–526. [Google Scholar] [CrossRef]
  28. Polese, F.; Carrubbo, L.; Bruni, R.; Caputo, F. Enabling actors’ viable behaviour: Reflections upon the link between viability and complexity within smart service system. Int. J. Markets Bus. Syst. 2018, 3, 111–119. [Google Scholar] [CrossRef]
  29. Carayannis, E.G.; Campbell, D.F. ’Mode 3’ and ‘Quadruple Helix’: Toward a 21st century fractal innovation ecosystem. Int. J. Technol. Manag. 2009, 46, 201–234. [Google Scholar] [CrossRef] [Green Version]
  30. Galvão, A.; Mascarenhas, C.; Rodrigues, R.G.; Marques, C.S.; Leal, C.T. A quadruple helix model of entrepreneurship, innovation and stages of economic development. Rev. Int. Bus. Strategy 2017. [Google Scholar] [CrossRef]
  31. Tronvoll, B.; Barile, S.; Caputo, F. A Systems Approach to Understanding the Philosophical Foundation of Marketing Studies. In Social Dynamics in a System Perspective; Barile, S., Pellicano, M., Polese, F., Eds.; Springer: New York, NJ, USA, 2007. [Google Scholar]
  32. Carayannis, E.G.; Rakhmatullin, R. The Quadruple/Quintuple Innovation Helixes and Smart Specialisation Strategies for Sustainable and Inclusive Growth in Europe and Beyond. J. Knowl. Econ. 2014, 5, 212–239. [Google Scholar] [CrossRef]
  33. Carayannis, E.G.; Grigoroudis, E. Quadruple innovation helix and smart specialization: Knowledge production and national competitiveness. Foresight STI Gov. 2016, 10, 31–42. [Google Scholar] [CrossRef]
  34. Carayannis, E.G.; Grigoroudis, E.; Pirounakis, D. Quadruple innovation helix and smart specialization: Knowledge production and national competitiveness. In Asia-Pacific Tech Monitor; Asian and Pacific Centre for Transfer of Technology (APCTT): New Delhi, India, 2015; pp. 19–27. [Google Scholar]
  35. Sender, S.W. Systematic agreement: A theory of organizational alignment. Hum. Resour. Dev. Q. 1997, 8, 23–40. [Google Scholar] [CrossRef]
  36. Carayannis, E.G.; Goletsis, Y.; Grigoroudis, E. Composite innovation metrics: MCDA and the quadruple innovation helix framework. Technol. Forecast Soc. 2017, 131, 4–17. [Google Scholar] [CrossRef]
  37. Healy, P.M.; Palepu, K.G. Information asymmetry, corporate disclosure, and the capital markets: A review of the empirical disclosure literature. J. Acc. Econ. 2001, 31, 405–440. [Google Scholar] [CrossRef]
  38. Mishra, D.P.; Heide, J.B.; Cort, S.G. Information asymmetry and levels of agency relationships. J. Mark. Res. 1998, 54, 277–295. [Google Scholar] [CrossRef] [Green Version]
  39. Del Giudice, M.; Della Peruta, M.R.; Maggioni, V. Collective Knowledge and Organizational Routines within Academic Communities of Practice: An Empirical Research on Science-Entrepreneurs. J. Knowl. Econ. 2013, 4, 260–278. [Google Scholar] [CrossRef]
  40. Muscio, A.; Pozzali, A. The effects of cognitive distance in university-industry collaborations: Some evidence from Italian universities. J. Technol. Transf. 2013, 38, 486–508. [Google Scholar] [CrossRef]
  41. Caputo, F.; Carrubbo, L.; Sarno, D. The Influence of Cognitive Dimensions on the Consumer-SME Relationship: A Sustainability-Oriented View. Sustainability 2018, 10, 3238. [Google Scholar] [CrossRef] [Green Version]
  42. Frow, P.; McColl-Kennedy, J.R.; Payne, A.; Govind, R. Service ecosystem well-being: Conceptualization and implications for theory and practice. Eur. J. Mark. 2019, 53, 2657–2691. [Google Scholar] [CrossRef]
  43. Barile, S.; Polese, F.; Saviano, M.; Carrubbo, L. Service Innovation in Translational Medicine. In Innovation in Practices, Perspectives and Experiences; Russo Spena, T., Mele, C., Nuutinen, M., Eds.; Springer International Publishing: Cham, Switzerland, 2016; pp. 417–438. [Google Scholar]
  44. Demichela, M.; Baldissone, G.; Darabnia, B. Using field data for energy efficiency based on maintenance and operational optimisation. A step towards PHM in process plants. Processes 2018, 6, 25. [Google Scholar] [CrossRef] [Green Version]
  45. Napoletano, P.; Carrubbo, L. Becoming smarter: Towards a new generation of services systems. Impresa Ambiente Manag. 2011, 4, 1–14. [Google Scholar]
  46. Vijayaraghavan, A.; Dornfeld, D. Automated energy monitoring of machine tools. CIRP Ann. Manuf. Technol. 2010, 51, 21–24. [Google Scholar] [CrossRef] [Green Version]
  47. Shrouf, F.; Ordieres, J.; Miragliotta, G. Smart factories in Industry 4.0: A review of the concept and of energy management approached in production based on the Internet of Things paradigm. In Proceedings of the IEEE International Conference on Industrial Engineering and Engineering Management, Selangor, Malaysia, 9–12 December 2014. [Google Scholar]
  48. Yalcinkaya, M.; Singh, V. Building Information Modeling (BIM) for Facilities Management—Literature Review and Future Needs. In Product Lifecycle Management for a Global Market—IFIP Advances in Information and Communication Technology; Fukuda, S., Bernard, A., Gurumoorthy, B., Bouras, A., Eds.; Springer: Berlin/Heidelberg, Germany, 2014; p. 442. [Google Scholar]
  49. Xiaoli, X.; Yunbo, Z.; Guoxin, W. Design of intelligent internet of things for equipment maintenance Proceedings. In Proceedings of the 4th International Conference on Intelligent Computation Technology and Automation, Zhangjiajie, China, 10–11 October 2011. [Google Scholar]
  50. Ciaramella, A.; Tronconi, O. Facility Management. Progettare, Misurare, Gestire e Remunerare i Servizi; Franco Angeli: Milano, Italy, 2014. [Google Scholar]
  51. Firdaus, N.; Samat, H.A.; Mohamad, N. Maintenance for Energy efficiency: A Review. In IOP Conference Series: Materials Science and Engineering, Penang, Malaysia, 12–13 December 2018; IOP Publishing Ltd: Bristol, UK, 2019; p. 530. [Google Scholar]
  52. Franciosi, C.; Iung, B.; Miranda, S.; Riemma, S. Maintenance for sustainability in the Industry 4.0 context: A scoping literature review. IFAC PapersOnLine 2018, 51, 903–908. [Google Scholar] [CrossRef]
  53. Hung, S.W.; He, D.S.; Lu, W.M. Evaluating the dynamic performances of business groups from the carry-over perspective: A case study of Taiwan’s semiconductor industry. Omega 2014, 46, 1–10. [Google Scholar] [CrossRef]
  54. Sénéchal, O. Performance indicators nomenclatures for decision making in sustainable conditions based maintenance. IFAC-PapersOnline 2018, 51, 1137–1142. [Google Scholar] [CrossRef]
  55. Çınar, Z.M.; Abdussalam Nuhu, A.; Zeeshan, Q.; Korhan, O.; Asmael, M.; Safaei, B. Machine learning in predictive maintenance towards sustainable smart manufacturing in Industry 4.0. Sustainability 2020, 12, 8211. [Google Scholar] [CrossRef]
  56. Kaartemo, V.; Helkkula, A. A systematic review of artificial intelligence and robots in value co-creation: Current status and future research avenues. J. Creat. Value 2018, 4, 211–228. [Google Scholar] [CrossRef] [Green Version]
  57. Shilton, K. Values and ethics in human-computer interaction. Found. Trends® in Hum. Comput. Interact. 2018, 12, 107–171. [Google Scholar] [CrossRef] [Green Version]
  58. Pakkala, D.; Spohrer, D. Digital service: Technological agency in service SYSTEMS. In Proceedings of the 52nd Hawaii International Conference on System Sciences, Honolulu, HI, USA, 8–11 January 2019. [Google Scholar]
  59. Yin, R.K. Case Study Research and Applications: Design and Methods; Sage Publications: Thousand Oaks, CA, USA, 2017. [Google Scholar]
  60. Pettigrew, A.M. The Politics of Organizational Decision Making; Tavistock: London, UK, 1973. [Google Scholar]
  61. Eisenhardt, K.M. Building theories from case study research. Acad. Manag. Rev. 1989, 14, 532–550. [Google Scholar] [CrossRef]
  62. Stake, R.E. The Art of Case Study Research; Sage Publications: Thousand Oaks, CA, USA, 1995. [Google Scholar]
  63. Gummesson, E. Case Theory in Business and Management: Reinventing Case Study Research; Sage Publications: Thousand Oaks, CA, USA, 2017. [Google Scholar]
  64. De Massis, A.; Kotlar, J. The case study method in family business research: Guidelines for qualitative scholarship. J. Fam. Bus. Strateg. 2014, 5, 15–29. [Google Scholar] [CrossRef]
  65. Yin, R.K. Case Study Research: Design and Methods (Applied Social Research Methods); Sage Publications: Thousand Oaks, CA, USA, 2014. [Google Scholar]
  66. Harrison, H.; Birks, M.; Franklin, R.; Mills, J. Case study research: Foundations and methodological orientations. Forum Qual. Soc. Res. 2017, 8, 1–17. [Google Scholar]
  67. Gummesson, E. Qualitative Methods in Management Research; Sage Publications: Thousand Oaks, CA, USA, 2000. [Google Scholar]
  68. Baxter, P.; Jack, S. Qualitative case study methodology: Study design and implementation for novice researchers. Qual. Rep. 2008, 13, 544–559. [Google Scholar]
  69. Damodaran, A.; Roggi, O. Finanza Aziendale. Applicazioni per il Management; Maggioli Editore: Rimini, Italy, 2015. [Google Scholar]
  70. Bertelli, R.; Linguanti, E. Analisi Finanziaria e Gestione di Portafoglio; Franco Angeli: Milano, Italy, 2015. [Google Scholar]
  71. Maurizi, I. Piani di Investimento; Bruno Editori: Roma, Italy, 2014. [Google Scholar]
  72. Spangenberg, J.H. Economic sustainability of the economy: Concepts and indicators. Int. J. Sust. Dev. 2005, 8, 47–64. [Google Scholar] [CrossRef]
  73. Searcy, C. Corporate sustainability performance measurement systems: A review and research agenda. J. Bus. Ethics 2012, 107, 239–253. [Google Scholar] [CrossRef]
  74. Saltelli, A. Sensitivity analysis for importance assessment. Risk Anal. 2002, 22, 579–590. [Google Scholar] [CrossRef]
  75. Borgonovo, E.; Peccati, L. Uncertainty and global sensitivity analysis in the evaluation of investment projects. Int. J. Prod. Econ. 2006, 104, 62–73. [Google Scholar] [CrossRef]
  76. Barber, B.M.; Lyon, J.D. Detecting Abnormal Operating Performance: The Empirical Power and Specification of Test Statistics. J. Financ. Econ. 1996, 41, 359–399. [Google Scholar] [CrossRef]
  77. Dallocchio, M.; Salvi, A. Finanza Aziendale; Egea: Milano, Italy, 2011; Volume 2. [Google Scholar]
  78. Brealey, R.A. Principi di Finanza Aziendale; McGraw-Hill Education: Milano, Italy, 2015. [Google Scholar]
  79. Weaver, S.C. Measuring economic value added: A survey of the practices of EVA® proponents. J. Appl. Financ. 2001, 11, 50–60. [Google Scholar]
  80. Hartman, J.C. On the equivalence of net present value and market value added as measures of a project’s economic worth. Eng. Econ. 2000, 45, 158–165. [Google Scholar] [CrossRef]
  81. Marradi, A. Linee Guida per L’analisi Bivariata dei Dati nelle Scienze Sociali; Franco Angeli: Milano, Italy, 2002. [Google Scholar]
  82. Glass, G.V. Testing homogeneity of variances. Am. Educ. Res. J. 1966, 3, 187–190. [Google Scholar] [CrossRef]
  83. Giovannoni, E.; Fabietti, G. What is Sustainability? A Review of the Concept and its Applications. In Integrated Reporting: Concepts and Cases that Redefine Corporate Accountability; Busco, C., Frigo, M., Riccaboni, A., Quattrone, P., Eds.; Springer: Cham, Switzerland, 2013; pp. 21–40. [Google Scholar]
  84. Schaltegger, S.; Wagner, M. Managing the Business Case for Sustainability: The Integration of Social, Environmental and Economic Performance; Routledge: London, UK, 2017. [Google Scholar]
  85. Eizenberg, E.; Jabareen, Y. Social sustainability: A new conceptual framework. Sustainability 2017, 9, 68. [Google Scholar] [CrossRef] [Green Version]
  86. Littig, B.; Griessler, E. Social sustainability: A catchword between political pragmatism and social theory. Int. J. Sust. Dev. 2005, 8, 65–79. [Google Scholar] [CrossRef] [Green Version]
  87. Dillard, J.; Dujon, V.; King, M.C. Understanding the Social Dimension of Sustainability; Routledge: London, UK, 2008. [Google Scholar]
  88. Morelli, J. Environmental sustainability: A definition for environmental professionals. J. Environ. Sust. 2011, 1, 1–9. [Google Scholar]
  89. Orlitzky, M.; Siegel, D.S.; Waldman, D.A. Strategic corporate social responsibility and environmental sustainability. Bus. Soc. 2011, 50, 6–27. [Google Scholar] [CrossRef]
  90. Choi, S.; Ng, A. Environmental and economic dimensions of sustainability and price effects on consumer responses. J. Bus. Ethics 2011, 104, 269–282. [Google Scholar] [CrossRef]
  91. Doane, D.; MacGillivray, A. Economic sustainability: The business of staying in business. N. Econ. Found. 2001, 1, 1–53. [Google Scholar]
  92. Gallucci, C.; Santulli, R. Il Controllo della Redditività e della Sostenibilità Finanziaria: Indicatori per la Misurazione. In Il Controllo Manageriale e gli Indicatori di Performance Dentro e Fuori le Organizzazioni; Simone, C., Ed.; Edizioni Nuova Cultura: Roma, Italy, 2018; pp. 95–123. [Google Scholar]
  93. Freeman, R.E. Strategic Management: A Stakeholder Approach; Pitman: Boston, MA, USA, 1984. [Google Scholar]
  94. Nicholls, A.; Paton, R.; Emerson, J. Social Finance; Oxford University Press: Oxford, UK, 2015. [Google Scholar]
  95. Van Marrewijk, M. Concepts and definitions of CSR and corporate sustainability: Between agency and communion. J. Bus. Ethics 2003, 44, 95–105. [Google Scholar] [CrossRef]
Figure 1. The emerging new helices in sustainability studies.
Sustainability 13 05884 g001
Figure 2. The qualitative monitored time parameter diagram.
Sustainability 13 05884 g002
Figure 3. The iterative self-feeding cycle process of PdM.
Sustainability 13 05884 g003
Figure 4. The integrated PdM cycle process through the fourth helix.
Sustainability 13 05884 g004
Figure 5. The research model design.
Sustainability 13 05884 g005
Figure 6. A synthesis of the results.
Sustainability 13 05884 g006
Figure 7. Conclusive interlinked connection between PdM and sustainability.
Sustainability 13 05884 g007
Table 1. Hypotheses testing results.
Hypothesist-TestMean Differencep-Value
H1 (+)The introduction of predictive maintenance improves companies’ efficiency2.562.430.011
H2 (+)The introduction of predictive maintenance improves the returns on invested capitals1.090.110.008
H3 (+)The introduction of predictive maintenance improves the global profitability2.540.150.012
H4 (+)The introduction of predictive maintenance allows companies to create sustainable value2.59 2.560.08
0.012
0.011
0.014
Publisher’s Note: MDPI stays neutral with regard to jurisdictional claims in published maps and institutional affiliations.

