Article

Data-Driven Methodology to Support Long-Lasting Logistics and Decision Making for Urban Last-Mile Operations

by
Edgar Gutierrez-Franco
1,2,*,
Christopher Mejia-Argueta
3 and
Luis Rabelo
2
1
Center for Latin-American Logistics Innovation, Massachusetts Institute of Technology, Global SCALE Network, Cambridge, MA 02139, USA
2
Department of Industrial Engineering and Management Systems, University of Central Florida, Orlando, FL 162993, USA
3
Food and Retail Operations Lab, Center for Transportation and Logistics, Massachusetts Institute of Technology, Cambridge, MA 02139, USA
*
Author to whom correspondence should be addressed.
Sustainability 2021, 13(11), 6230; https://0-doi-org.brum.beds.ac.uk/10.3390/su13116230
Submission received: 14 April 2021 / Revised: 26 May 2021 / Accepted: 28 May 2021 / Published: 1 June 2021
(This article belongs to the Special Issue Sustainable Logistics and Services)

Abstract

:
Last-mile operations in forward and reverse logistics are responsible for a large part of the costs, emissions, and times in supply chains. These operations have increased due to the growth of electronic commerce and direct-to-consumer strategies. We propose a novel data- and model-driven framework to support decision making for urban distribution. The methodology is composed of diverse, hybrid, and complementary techniques integrated by a decision support system. This approach focuses on key elements of megacities such as socio-demographic diversity, portfolio mix, logistics fragmentation, high congestion factors, and dense commercial areas. The methodological framework will allow decision makers to create early warning systems and, with the implementation of optimization, machine learning, and simulation models together, make the best utilization of resources. The advantages of the system include flexibility in decision making, social welfare, increased productivity, and reductions in cost and environmental impacts. A real-world illustrative example is presented under conditions in one of the most congested cities: the megacity of Bogota, Colombia. Data come from a retail organization operating in the city. A network of stakeholders is analyzed to understand the complex urban distribution. The execution of the methodology was capable of solving a complex problem reducing the number of vehicles utilized, increasing the resource capacity utilization, and reducing the cost of operations of the fleet, meeting all constraints. These constraints included the window of operations and accomplishing the total number of deliveries. Furthermore, the methodology could accomplish the learning function using deep reinforcement learning in reasonable computational times. This preliminary analysis shows the potential benefits, especially in understudied metropolitan areas from emerging markets, supporting a more effective delivery process, and encouraging proactive, dynamic decision making during the execution stage.

1. Introduction

With the COVID-19 pandemic, the demand for delivery services has substantially increased, particularly in urban areas. The number of delivery vehicles in the world’s 100 largest cities is estimated to grow by 36% over the next decade [1]. More than ever, end consumers are adopting electronic commerce (e-commerce) and want to receive their goods without going out from where they are located (e.g., home, office). This trend creates greater pressure on cities in terms of traffic and to ensure high-performance business models through the efficient management of planning deliveries and the smooth implementation of vehicle routing. Unfortunately, this growing need for last-mile deliveries in the business to consumer (B2C) transactions is also affecting the environment. The transport sector is reported to account for approximately 25% of CO2 emissions, globally. Land transport accounts for three-quarters of total emissions. An estimate of 30% comes from vehicles transporting goods [2].
Consequently, any form of commerce and trade (e.g., retail, restaurants) faces more challenges to meet customers’ expectations [3]. Given rising digital marketing and the accessibility to (and affordability of) internet connectivity, all types of commerce are expanding, bringing a significant increase in the flow of products to metropolitan areas. These products, after being used, are generally transported again to be repaired, reconditioned, remanufactured, recycled, transformed, or disposed of in supply chains. Last-mile operations (i.e., distribution, handling) for forwarding or reverse logistics are responsible for a large part of greenhouse gas (GHG) emissions in cities, and of course, are a significant contributor to climate change worldwide [4,5,6]. Therefore, there is an urgent need to build long-term sustainable operations, emphasize social goals to deliver orders accurately and on time, and reduce the environmental impact [7].
Understanding evolving patterns and needs of supply chain stakeholders and their interactions is essential to build competitive advantages and to find logistics efficiencies while bringing environmental and socioeconomic benefits. Urban distribution is a complex challenge that depends on multiple factors that affect delivery services across stakeholders (e.g., manufacturers and distributors), increases demand (on end consumers) and, varies depending on environmental, socioeconomic shifts and traffic regulations (public sector) [8,9,10]. There is a huge opportunity to boost the role that data-driven and model-driven decision-making processes can play for urban logistics. Consequently, these processes support the formulation of policies (e.g., parking spaces and roads), the need for special infrastructure (e.g., bike lanes), and the use of emerging technologies to collect, process, and analyze the data (e.g., sensors).
The growing size of e-commerce [11,12], representing an industry of around USD 97 billion [13], is re-scaling and changing supply chain operations. Actually, last-mile operations account for 53% of shipment costs due to a higher frequency of small, personalized orders [14,15]. These orders require courier- and parcel delivery services that have grown by more than 25% per year over the last decade [16,17]. Furthermore, urban distribution is responsible for 13% of undesired congestion [18]. Consequently, highly effective decision support systems are becoming more critical for all stakeholders to reckon with future challenges [19]. These systems must be able to address strategic and operational decisions for multiple stakeholders [20,21,22] through a set of integral techniques such as simulation, optimization, agent-based modeling, predictive tools, etc. These systems must also monitor and control operations by measuring their performance through multiple key performance indicators (e.g., costs, time, efficiency).
Regulations, novel business models, technologies, as well as the evolution of urban logistics ecosystems, promote long-lasting strategies to respond effectively to urban distribution issues, resulting in more efficient operations that translate into time and money savings due to the optimal use of logistics assets (e.g., fleets, logistics facilities). However, building a generic system or perspective that integrates metrics, various levels of decision making, multiple stakeholders, and supplementary techniques is a challenge [8,21]. Furthermore, current proposals have not addressed the challenges of developing contexts and emerging market economies [23]. In developed and developing countries, the evolution is more dependent on a set of features related to urbanization, socioeconomic changes, accessibility and shifts of the retailing footprint, and not just technology-driven trends [24].
There are just a handful of studies in developing countries that characterize urban logistics operations, but they do not address dynamic decision making. Also, there are no discussions regarding a methodology composed of supplementary techniques to tailor effective urban distribution for emerging economies while looking at the customer evolution [25,26]. Most urban logistics studies discuss mathematical models related to vehicle routing (VRP), location problems, and inventory models. These studies present an in-depth review of dynamic and stochastic VRPs without analyzing the differences of logistics systems in emerging economies.
Predictive, prescriptive, and hybrid techniques must address dynamic behavior in stakeholders, incomplete and fragmented data, and non-steady conditions from logistics operations in developing countries. The techniques would support delivery processes and adjust plans according to changes in key factors related to multiple potential scenarios. Data analytics might be the first step in understanding critical issues, followed by building proper measurement systems, predicting evolving patterns, and leading stakeholders to reinvent their strategies and policies, allowing for the embrace of technology and data-driven culture [27,28]. With a comprehensive methodology, these techniques can improve logistics operations through optimization, agent-based modeling, among other techniques, for urban freight transport in megacities of emerging markets [29,30].
Recently, authors in [31,32] highlighted the need to integrate techniques like simulation, optimization, and machine learning to achieve long-term sustainable transportation systems. They identified how these techniques have been applied for sustainability dimensions (i.e., economy, society, or environment) but as independent silos, without relating dimensions with each other. They conclude that given the distinct goals of sustainability dimensions, it is unlikely that it can be improved with a single method. Therefore, it is necessary to use hybrid and complementary models [33]. In addition, methodologies linked to stakeholder’s behaviors would allow policy makers and transportation planners to define potential measures to alleviate traffic congestion and develop effective transportation systems [34]. We also invite readers to consult the works from Dekker et al. in [35] and Lin et al. in [36], where the contribution that analytical methods can make to green logistics is highlighted.
There is a growing need in both industry and governments for analytical instruments to improve the efficiency of last-mile deliveries in cities [37]. This research aims to propose an actionable framework to close the existing gap in the design and implementation of decision systems to support long-lasting and efficient logistics operations. This is supported in solid theory to plan and execute high-performance urban logistics with positive social, environmental, and economic impacts. With this methodological architecture, public transportation policy makers and transportation managers can benefit from previously acquired knowledge to make decisions. Both industry and academic works have taken advantage of previous knowledge to guide the execution of operations with the support of analytical simulation models, also called digital twins [38,39,40]. Urban environments are dynamic and complex due to a broad set of interactions stakeholders. The framework is one of the few works that considers critical factors from emerging markets such as fragmentation, high congestion factors, developing infrastructure, dynamic socioeconomic patterns, and dense commercial areas. Simulation has proven to be a valuable tool to evaluate the impacts of logistics solutions and interactions, before their actual implementation in the field; however, when combined with optimization, statistical, and machine learning models, the results are reinforced and improved substantially [41,42].
With those considerations, we design a methodology that allows for iteratively testing and adjusting gaps between the expected and actual performance of distribution operations. The methodology comprises predictive models, machine learning, optimization, simulation, and stochastic techniques in a support system. This system takes advantage of learning procedures that self-adjust themselves to meet the stakeholders’ goals in mutually beneficial situations. We apply our methodology to a case study from the retail industry in Bogota, Colombia, the most densely populated area in Latin America and the Caribbean. This city resembles conditions, features, and parameters of last-mile operations in a city from an emerging economy. We were able to reduce the number of vehicles utilized by 35%, increment the capacity utilization of vehicles, reduce costs, and obtain better accuracy in the estimated time of arrival to each customer.
In terms of transportation, there are three main areas of action that the government and private sector can interact with and improve: smart infrastructure, innovative mobility solutions, and city logistics. This work focuses on city logistics in terms of the sustainability and efficiency of last-mile operations and digitalization of the decision-making process throughout a holistic platform. Our proposal also contributes to the research community by modeling and building knowledge about the role of evolution on defining urban logistics strategies and optimizing observed and future trends and behaviors. Further, our research focuses on tackling the changing features of metropolitan areas in emerging market economies to design, plan and deploy long-term sustainable logistics operations. Different analytical tools help reduce logistical costs, environmental impacts, and negative social externalities.
The rest of the paper is structured as follows. Section 2 introduces the performance measurement system for last-mile operations. Section 3 presents the conceptual methodology of a decision support system and describes the interactions between learning and decision-making models. In Section 4, we test the proposed methodology using the conditions and data from Bogota, Colombia. Section 5 discusses the results, future research opportunities, and interpretations of the case study from the perspective of the methodology in the broadest context of last-mile logistics and finally, Section 6 states conclusions.

2. Stakeholders and Metrics for Last-Mile Delivery Operations

Transportation managers seek to find more efficient and sustainable ways for planning and executing delivery operations in a city [43]. Urbanization and congestion in large cities, and more specifically in emerging economies, have created significant challenges regarding the use and planning of infrastructure, strategies to keep the same level of service and on-time deliveries, and optimization of available resources (e.g., parking spaces). The increase in home deliveries generated concern about the use of resources and the impact on economic, environmental, and social dimensions [44]. The design of advanced technologies of ICT (Information and Communication Technology) and ITS (Intelligent Transport Systems) are closing the mismatch between the sustainable goals through a better understanding of city logistics policies and the daily interaction of stakeholders [20]. For instance, sensors and radio frequency identification (RFID) facilitate data collection; machine learning and advanced statistical analysis allow for processing and analyzing data patterns and trends; the use of urban freight observatories and control towers enables the monitoring of multiple variables and looking at the evolution of variables to visualize information and facilitate decision-making processes; finally, emerging technologies such as droid and drone deliveries, tri-dimensional printing, novel vehicle design, and multi-tier urban distribution look at optimizing logistics costs, reaching economies of scale, automating some processes and providing a different experience (e.g., level of service) to customers.
Data accessibility eases monitoring processes, interactions, and attempting to devise an effective decision-making system. Nevertheless, choosing the most suitable performance indicators is significant because they differ among stakeholders, processes, circumstances, and even decision stages. Therefore, their configuration becomes essential to evaluate progress comparing a baseline case (i.e., reference level) with pre-defined targets for diverse criteria and alternative scenarios. This also helps tracking improvements on logistics operations and taking quick actions under uncertain conditions to guarantee better performance [45]. In the following subsection, we describe key performance indicators (KPIs) for each stakeholder and process.
One of the primary growth drivers for last-mile operations is customer behavior. Customer profiles have become more diverse and dependent on a large quantity of physical and electronic retail channels. Furthermore, end consumers prefer to have a larger variety of delivery, payment, and merchandising options to acquire their services and products. This increases the need for fragmented deliveries to meet just-in-time shipments and avoid having stockout events. On the other hand, cash and information flows must be synchronized to avoid wrong shipping orders from shippers (e.g., supplier, retailer) and small retailers (e.g., minimarkets, nanostores) and end consumers returning them. These customers are located in fast-growing metropolitan areas where companies seek to deploy effective logistics strategies to perform millions of deliveries [46,47,48]. Nanostores i.e., small, family-owned retailers that have less than five employees, no backroom space, limited budget, and scarce technological support) account for over 50% of the market share globally and of the fragmented retail landscape, and they are expected to prevail in the following decades [26]. For example, there are around one million in Brazil, more than 800,000 in Mexico, and 400,000 in Colombia [49].
Vehicle operator decisions and expertise impact efficiency in last-mile operations and we consider them a second important driver. Vehicle operator behaviors influence logistics performance and explain the gap between planned and actual distribution operations (e.g., routes, schedules). Thus, including the operators’ knowledge into decision-making models and data-driven analytics will allow for synchronizing information technologies with human experience to achieve better delivery times, increase service level to customers, improve profit, etc. [50,51].
The widely studied geographic location and its impacts on distribution performance is the third driver. Methods that find the best routes to visit multiple customers subject to distinct constraints such as capacity, fixed schedules, density, and city topology have been widely documented in the vehicle routing problem (VRP) [52,53] and city logistics models [9,20]. Dynamic fleet and vehicle routing management is a promising venue that has studied changing traffic and demand variants [52]. However, these models need supplementary interfaces to guarantee their proper implementation and interpretation by practitioners. Other variants consider location and routing problems (LRP) that have been documented extensively [54,55]. Two-step LRP models have been proposed to deal with densely populated and commercial areas [56,57]. Recently, agent-based modeling has integrated methodologies for various stakeholders (i.e., suppliers, logistics operators, retailers, and city planners) in urban logistics [58], land use, and transportation [58].
Finally, congestion factors and traffic comprise the fourth driver. These components depend on the weather, time windows, city regulations, among other issues closely related to the first and third drivers. Furthermore, they shape reactions and increase learning for vehicle operators, and more recently, for data-driven algorithms as well [59,60]. Thus, traffic is a consequence of other vehicle operators and highly depends on the available infrastructure, such as parking locations [16,61,62].
Based on these relevant drivers, real-time data-driven approaches and interactive decision support systems (DSS) have emerged to reduce logistics costs and improve current performance [63]. Literature reports how advanced optimization and stochastic models have been applied to provide solutions from various stakeholders’ perspectives. From the private sector perspective, the articles by Yang et al. (2004) [60] optimized travel distances of empty trucks, deliveries with delayed completion times, and returns under multiple scenarios. From a private–public dyad perspective, Tounsi [64] analyzed consumer behavior under the influence of tariff regulations depending on congestion. Users react depending on the price and time of the delivery service. Lastly, a perspective from a distributor–consumer viewpoint is presented by Reyes et al. (2016) [65], who suggested innovative last-mile operations such as trunk deliveries.

2.1. Stakeholders in Last-Mile Delivery Operations

Traditionally, the literature mentions four stakeholders for city logistics: shippers, freight forwarders or carriers, administrators or city governments, and inhabitants or end customers [66,67]. These stakeholders follow distinct behaviors to pursue different objectives. For instance, cost reduction is a common interest of profit maximizers like shippers, carriers, and money savers like customers. In contrast, administrators are interested in dealing with traffic congestion, accidents, and environmental problems. However, uncertainty in decisions and interactions among diverse factors represent a challenge for planning logistics operations. Table 1 presents a short description of each stakeholder in urban logistics and an important reference for each KPI.
For the sake of scope, we focus our analysis on quantitative metrics that can be financial and non-financial, such as time, quantity, throughput, and rates. Once the performance system is created and the cause–effect interactions are understood, the metrics are used to make decisions for multiple stakeholders under diverse circumstances and decision levels. The methodology is continuously improved and aligned with updated stakeholder needs and goals. Consequently, the system can assess performance and compare solutions in near real-time to adjust strategies to meet the goals and requirements. The latter depends on the most likely scenarios to reduce delays, lost sales, costs, risks, and poorly planned resource allocation. Thus, real-time decision making using predictive tools under uncertain situations becomes a state-of-the-art tool to link forecasted performance with real operations. The following sub-section describes the metrics for distribution operations.

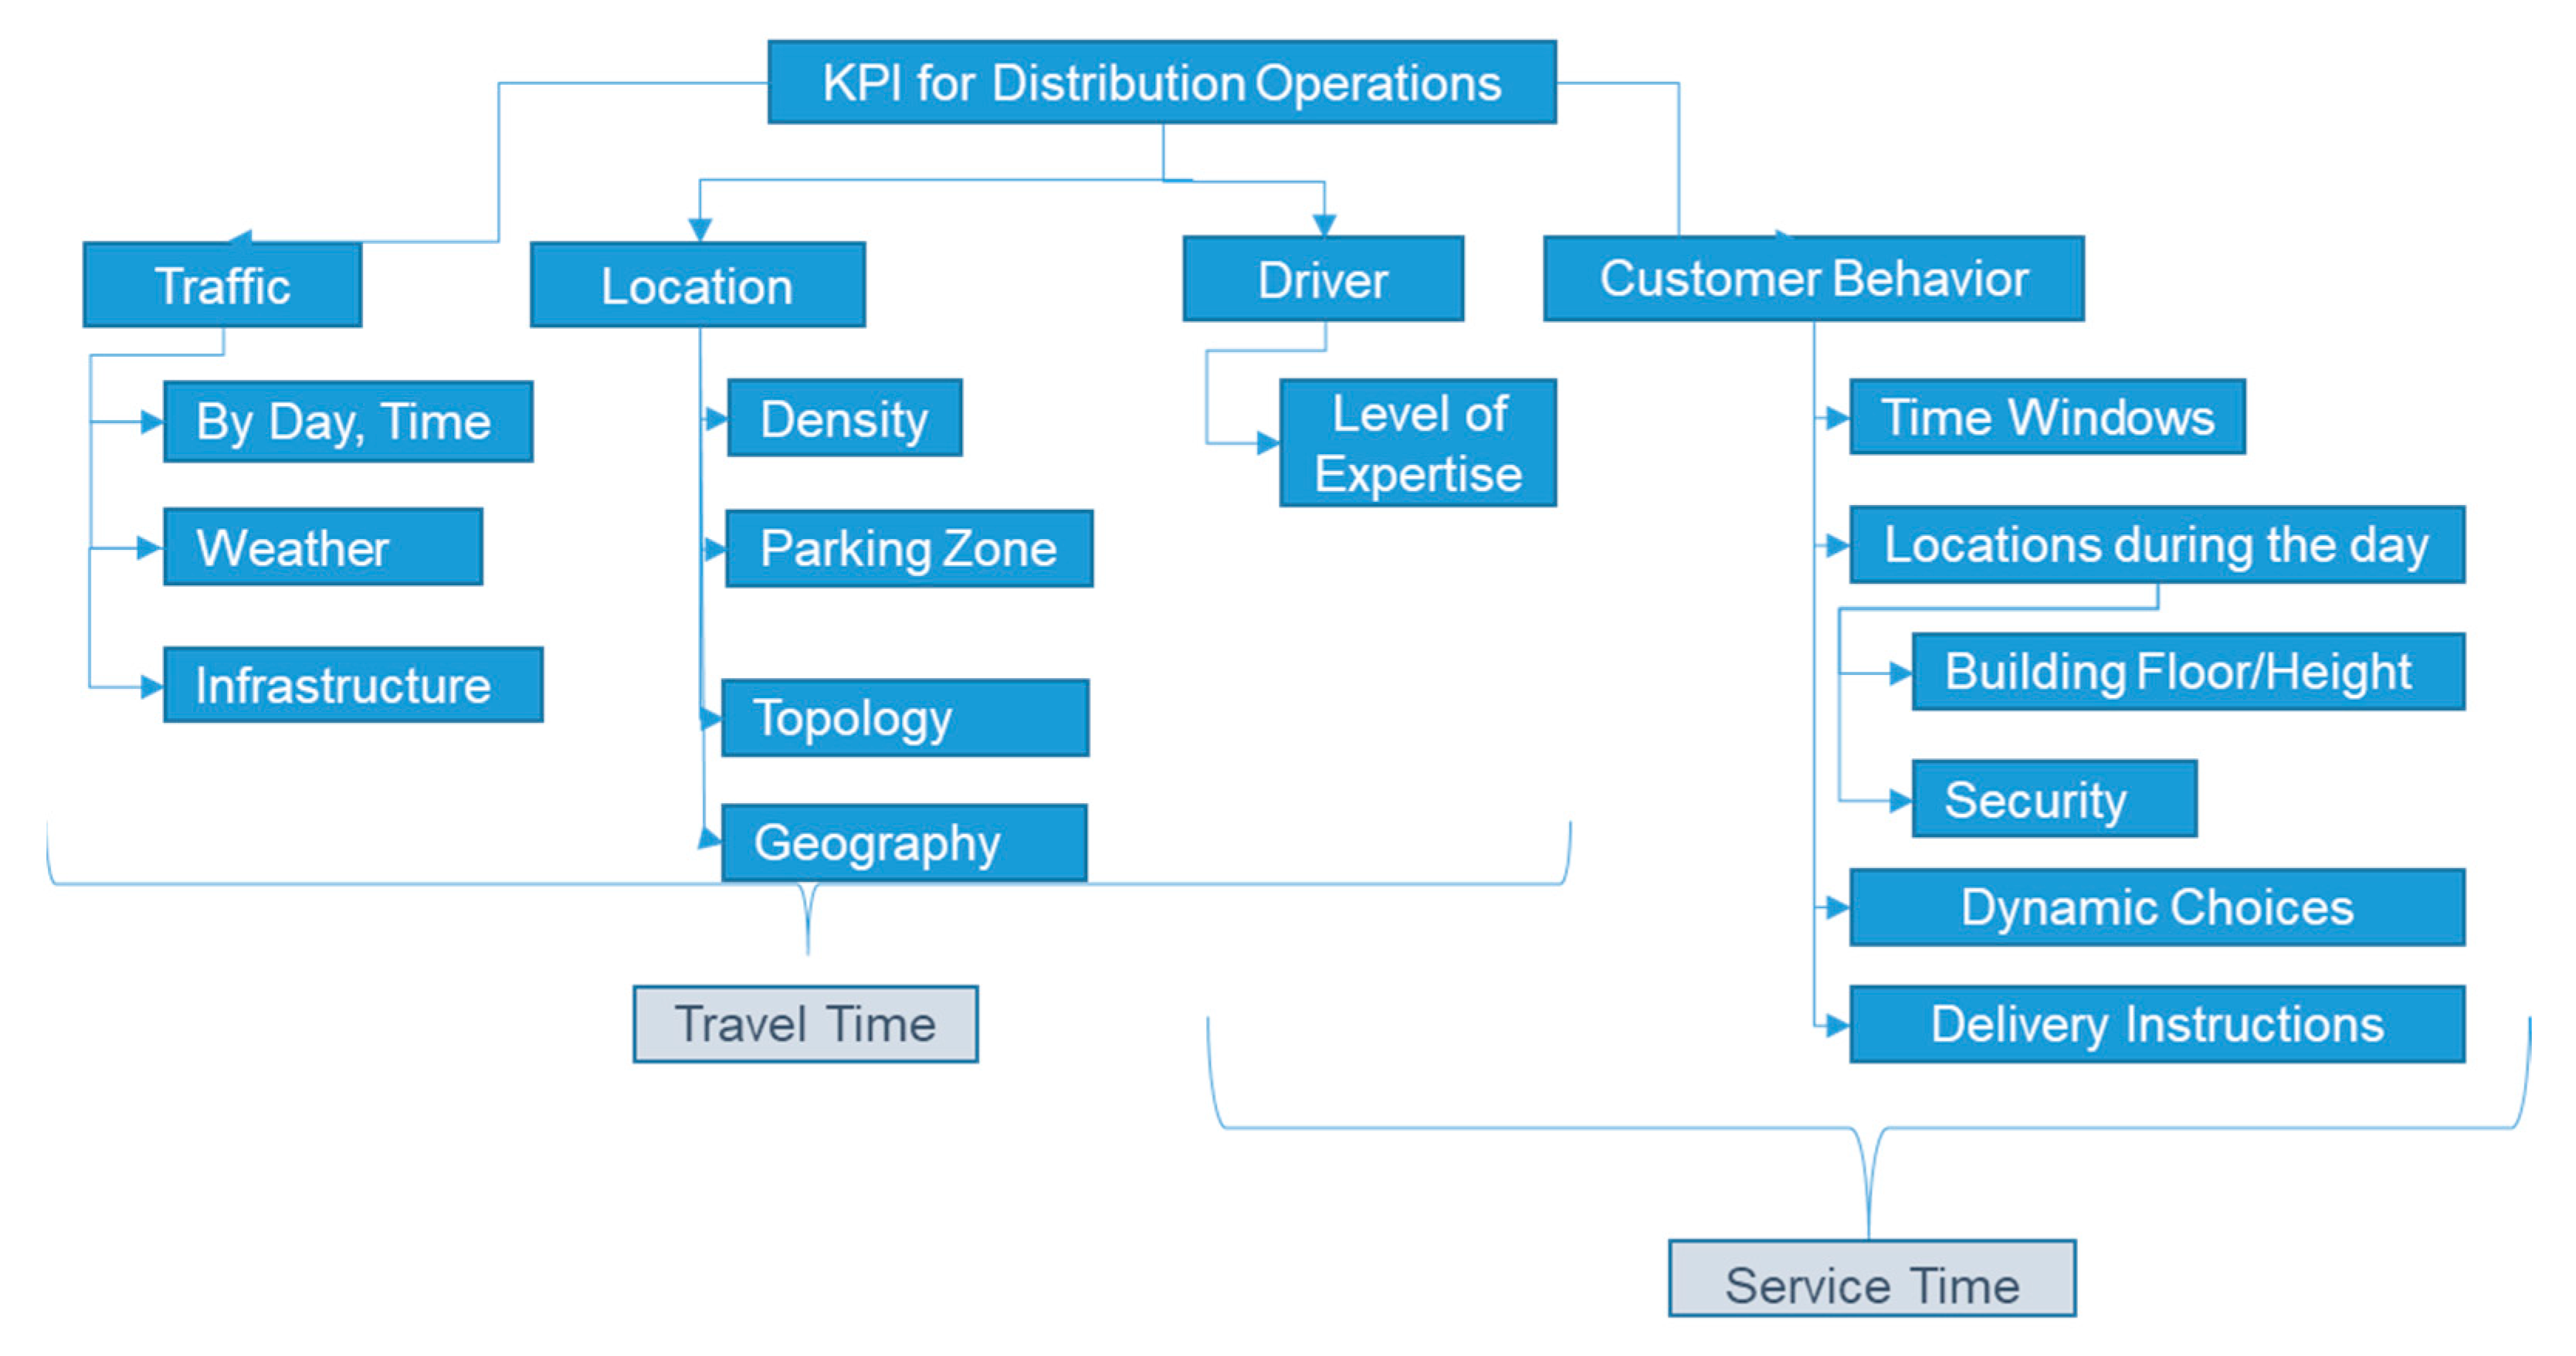
2.2. Data-Driven Metrics for Distribution Operations

Each stakeholder may have different goals and, therefore, need diverse performance indicators depending on cooperation or competition among them. Given that last-mile operations comprise a wide variety of logistics processes, they rely on multiple key performance indicators (KPIs). Still, they are mainly linked to four big drivers: congestion conditions or traffic, geographical issues or location of customers, vehicle operators, and customer behavior. Metrics such as estimated time of arrival (ETA), cost to serve, service level, among others are closely related to distribution procedures.
Figure 1 highlights the main factors that affect these KPIs. There are two main groups: (I) travel–time complications that are affected by traffic conditions, location characteristics, vehicle operator performance (i.e., geographic and non-controllable, external elements), and (II) service level issues that are mainly influenced by customer and vehicle operator behaviors (i.e., human elements). For instance, in the second group customers directly affect the delivery task due to demand patterns (e.g., seasonality, preferences, frequency, volume of purchases), time windows, and delivery instructions; while inexperienced vehicle operators affect the delivery time due to poor routing and wrong preparation for delivery [69].
Our conceptual methodology aims to support decision making in uncertain, dynamic environments for fragmented shipments. The methodology adapts the most appropriate set of KPIs to measure the system. This implies that data mining and statistical techniques might be used to build complementary, hybrid performance systems that guarantee robustness in measuring last-mile operations. Therefore, getting insights from patterns, trends, and outliers might help understand data and build knowledge about the system’s behavior [70,71]. Table 2 defines indicators for various features considering critical attributes for each KPI dimension.
Certainty refers to the confidence in the knowledge of parameters used for the decision models. On the other hand, variability stands for changes over time (static or dynamic). Modeling techniques are associated with these characteristics. The quality of the data directly affects the effectiveness of the models to make decisions. Simultaneously, the correct identification of variability in the data through probability distributions and aligned with time changes (e.g., peak or valley traffic times) determine a simple approximation of the model to the reality. The table below highlights some of the findings in the literature regarding these features.

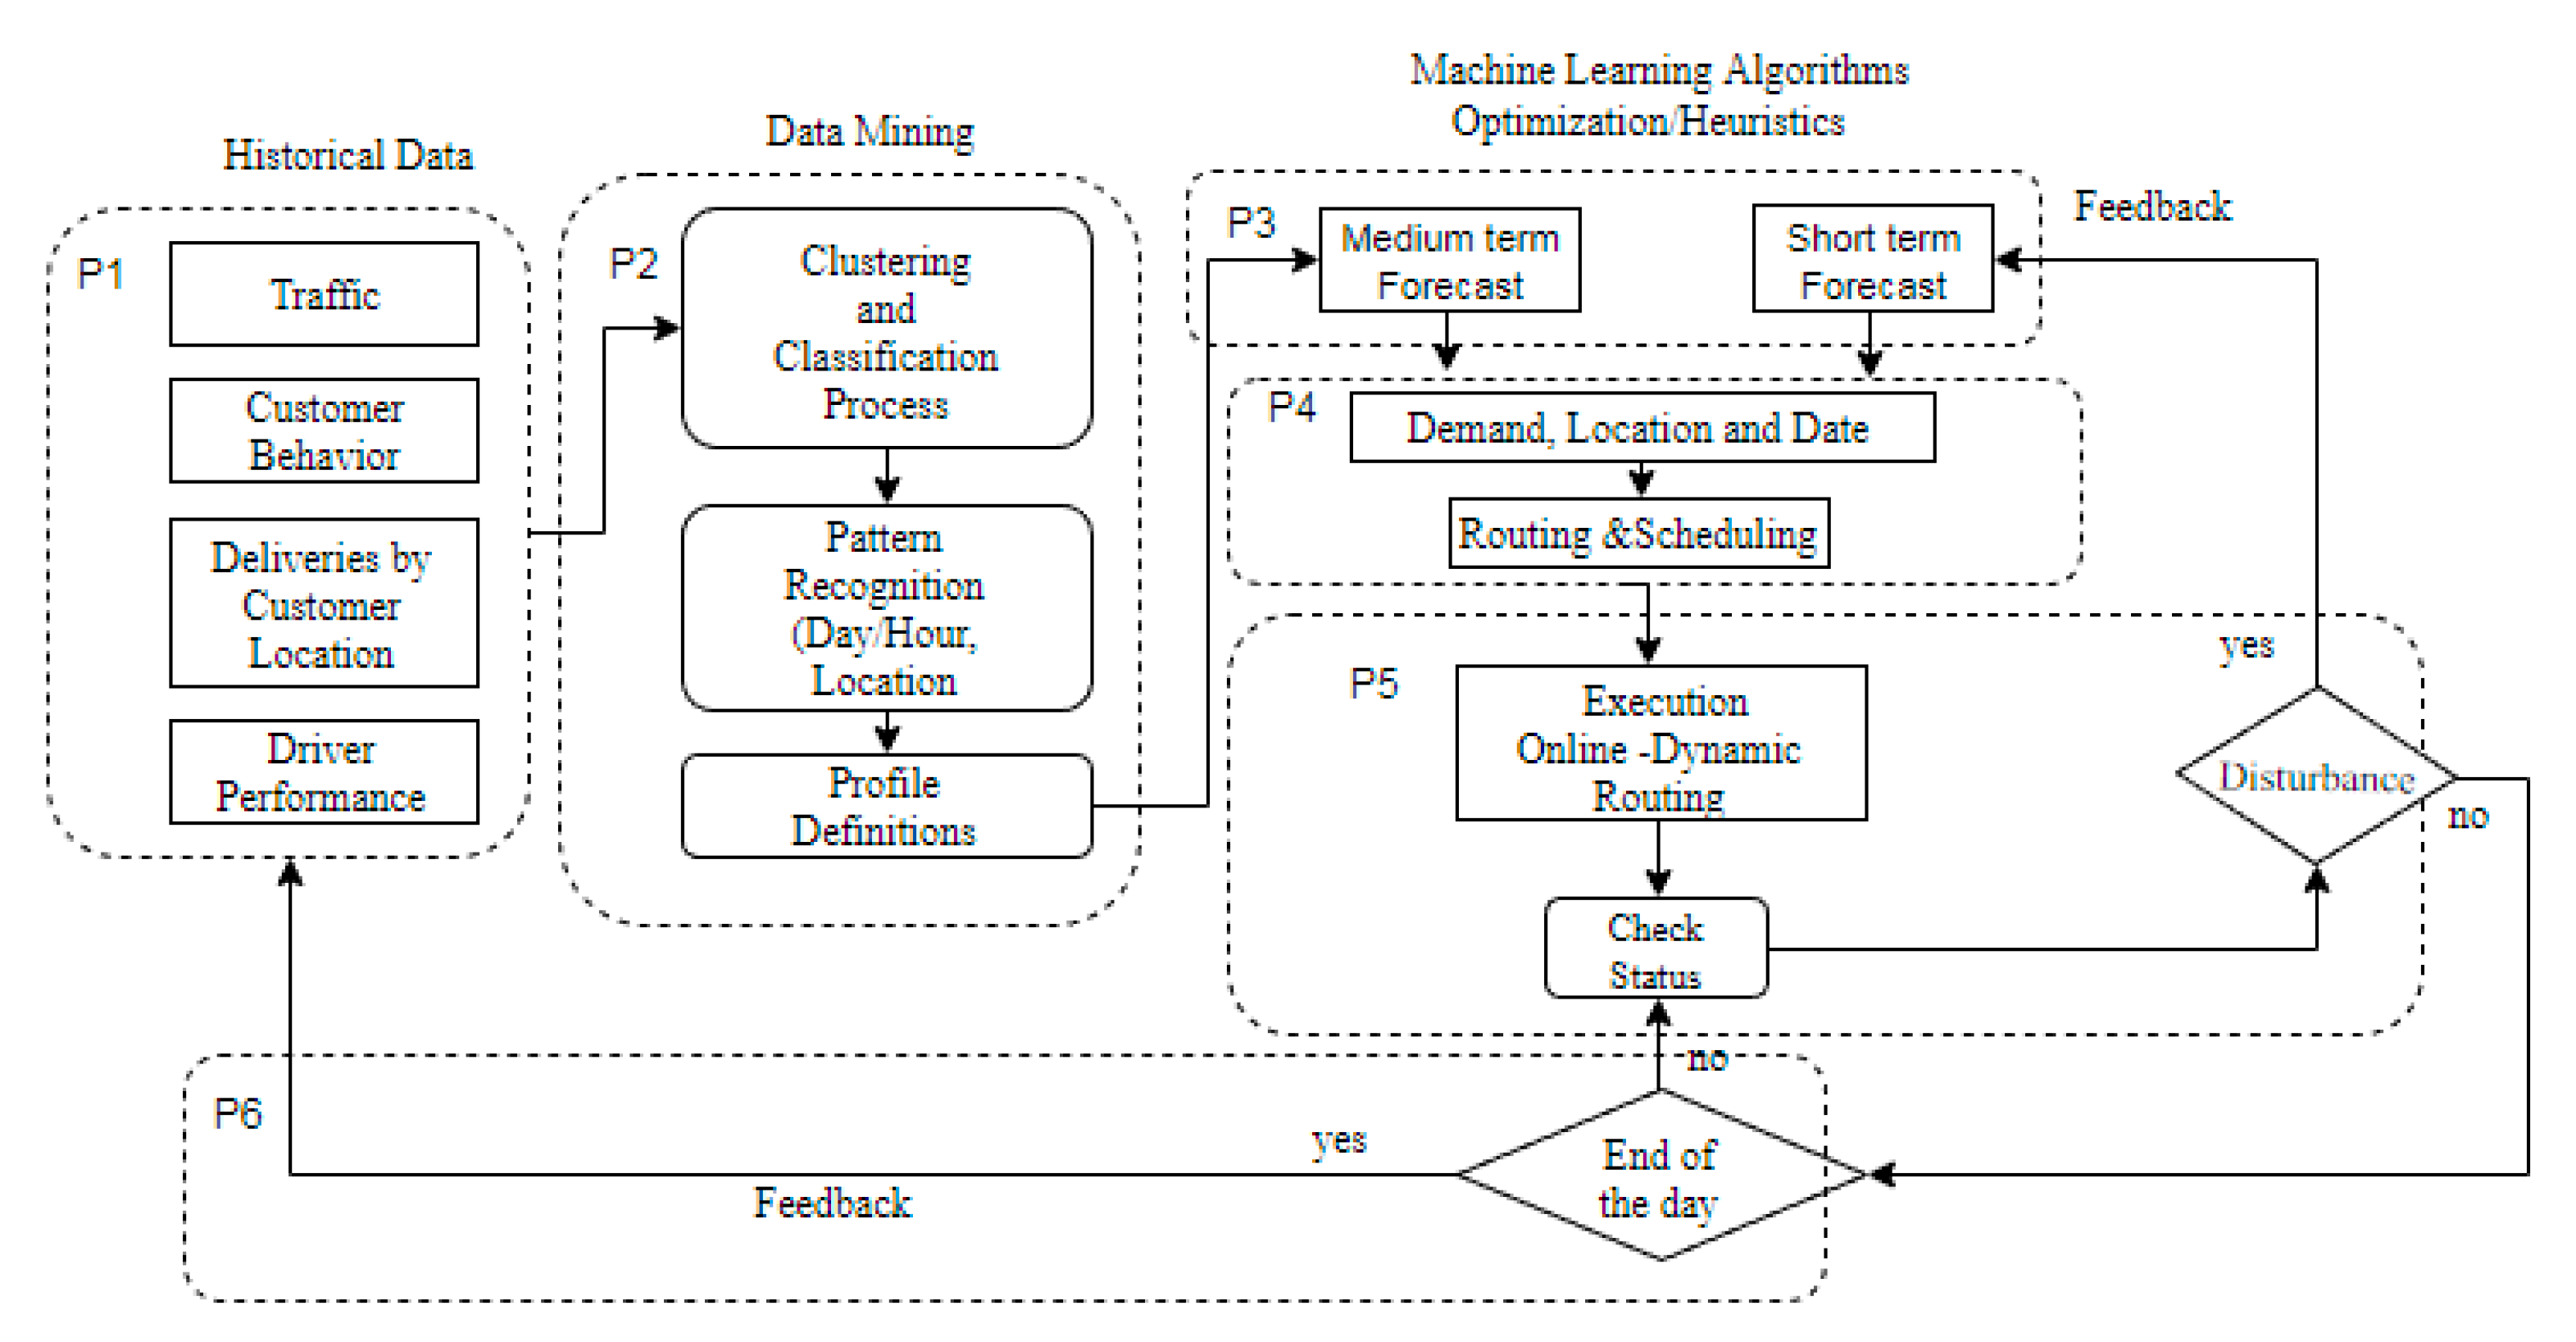
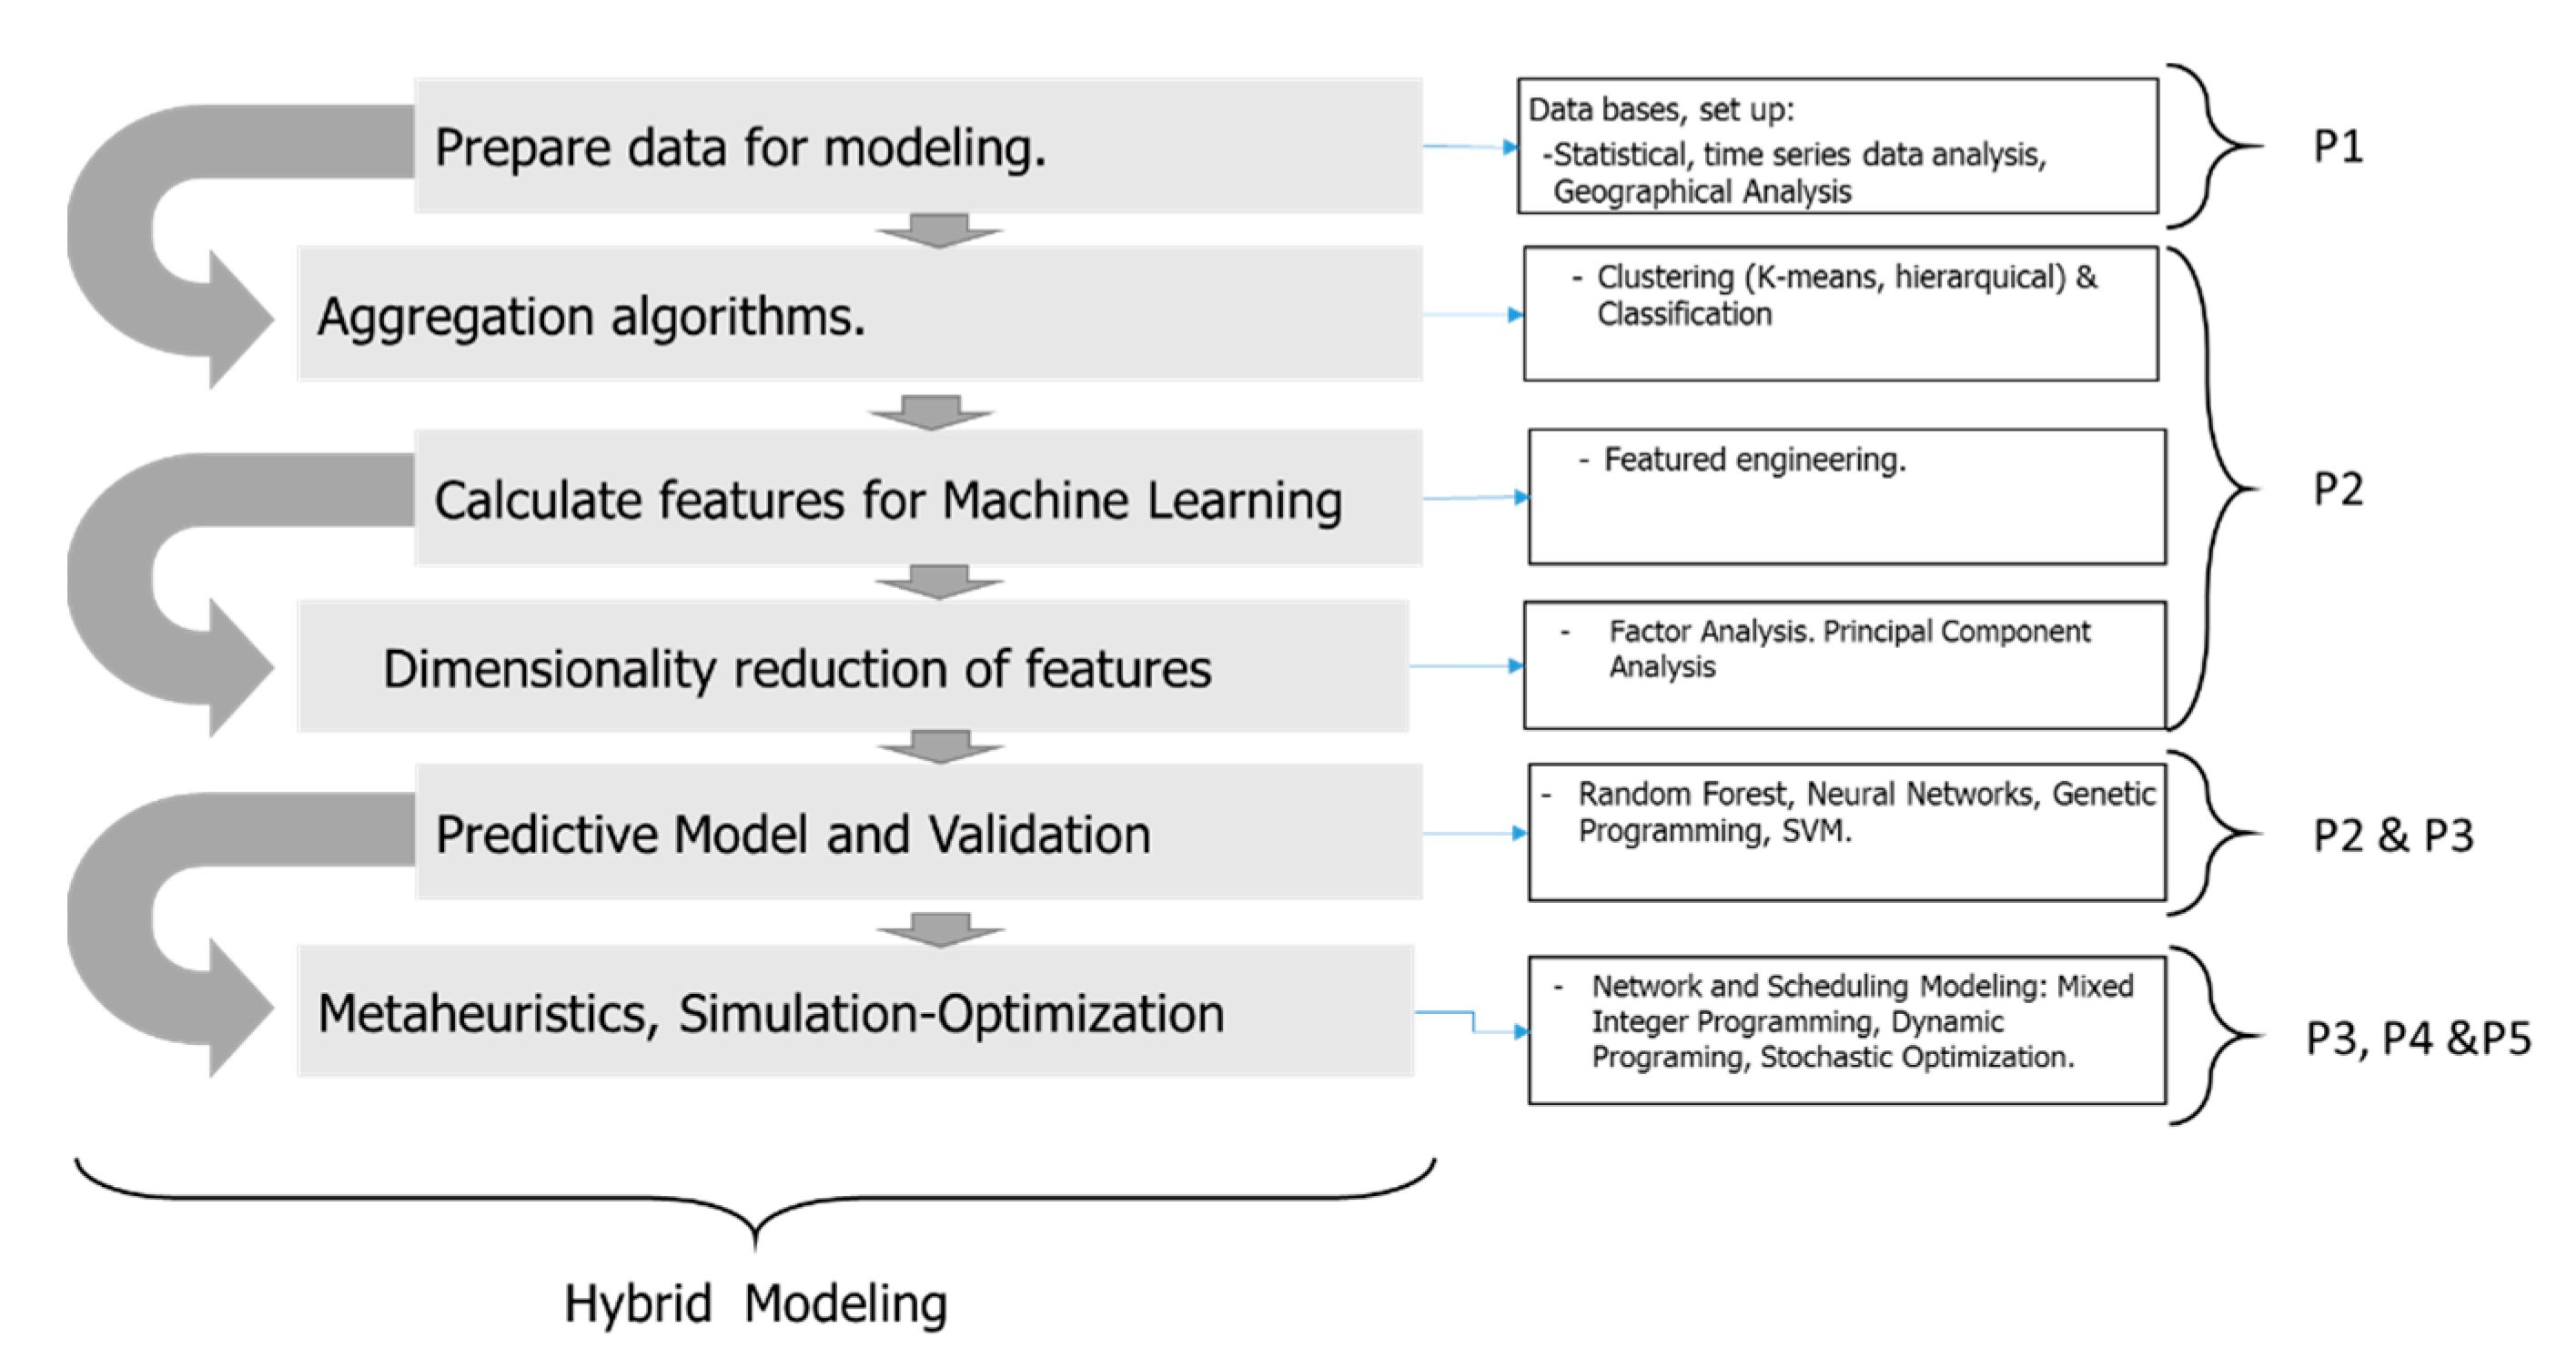
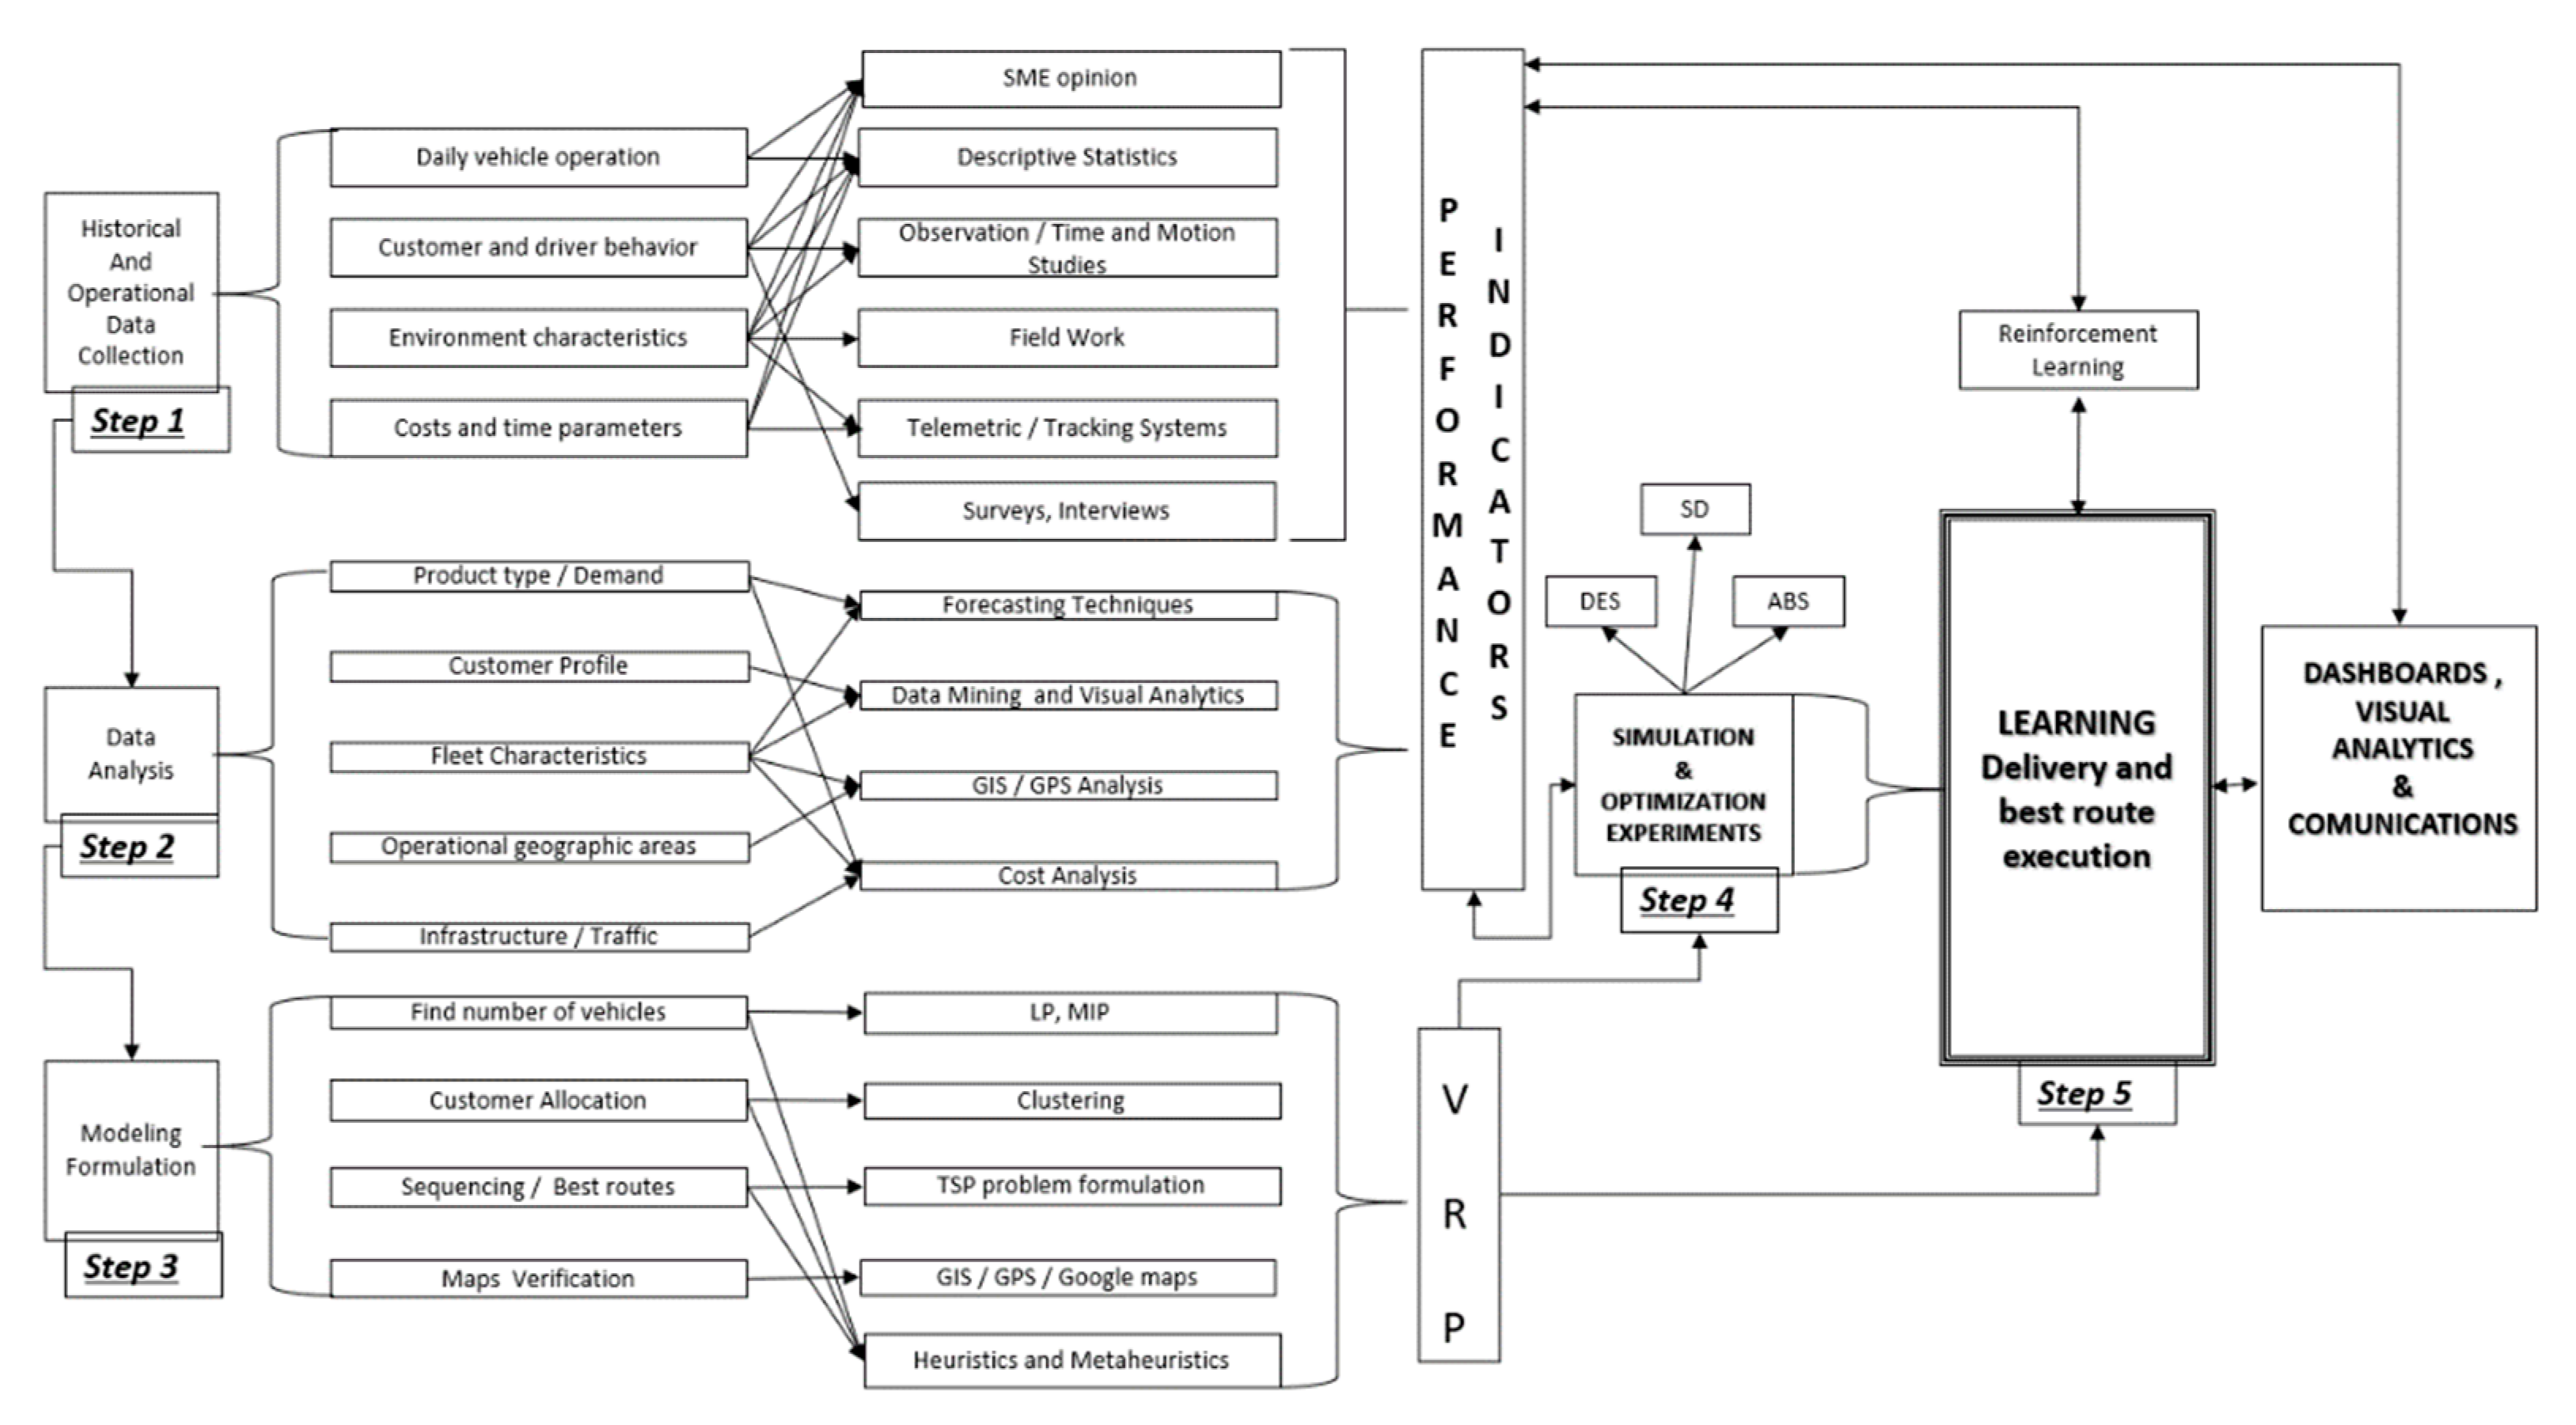
3. Smart Data-Driven Decision-Making Methodology

The proposed methodology aims to predict uncertain events, changes, and dynamic behaviors for the system to keep high-performance operations and support routing and scheduling. To address potential uncertain and dynamic elements, integrating urban traffic signals, human behaviors and performance, predictive modeling, and decision support systems acquires higher relevance. The methodology relies on various techniques (e.g., predictive and decision-making methodologies), software (e.g., ERP, TMS, WMS, GIS), and hardware (e.g., sensors, GPS).
This methodology is composed of six main steps or activities. Figure 2 shows every step and how they are linked to each other. In general, the first step (P1: Data Collection) is performed to gather data from the main drivers of distribution: traffic data, customer behavior, deliveries by customer location, and vehicle operator performance. In the second step, all data are analyzed using data mining techniques to identify patterns, significant variables and define clustered profiles per product, customer, zone, and driver. In this step (P2), feature engineering is necessary to detect which features are the most relevant to predict the behavior. The third step (P3) is used to forecast future operations and set up potential actionable scenarios to respond immediately to changes (short term) and create a set of strategies to react under diverse circumstances (medium term). All predictive models are based on elements from vehicle operators such as delivery locations, traffic conditions, possible routes, and behaviors/preferences.
The fourth step (P4) helps optimize key elements for distribution like location and scheduling based on calibrated, collected parameters. This optimization is based on distribution drivers to tailor strategies based on specific combinations of features and observed values on the KPIs. The fifth step is the execution phase (P5), which supports the dynamic, stochastic decision making by considering how distribution strategies are performing versus pre-defined targets. Feedback loops help adjust strategies to respond to deviations and gaps based on available resources and feeding data from self-learning algorithms. Finally, step 6 (P6) summarizes a day report that helps adjust step 5 and generates historical data supporting future decision-making processes. In the following sub-sections, we will delve into how the data are analyzed and used in each step. The description will give a complete vision of how our methodology works.
Now we will give a detailed description of the techniques used in each step. Steps 1 to 4 are the combination of descriptive statistics, machine learning techniques (i.e., descriptive, and predictive approaches), and optimization methods (i.e., prescriptive approach) to reduce gaps in the execution phase. Modeling simulation software is used together with optimization and machine learning models to model customers’ and drivers’ behavior and total delivery time. This is then split into two main components: uncertain service time at customer locations and uncertainty of travel time on roads. Simulations have the potential to be used with the associated variables.
The city also has different characteristics, depending on the zone. Travel times to go from one customer to another depends on routes, speed (i.e., velocity), and delivery orders per vehicle [9,73]. The fifth step represents the near real-time data collection task, which constantly checks the operation status, performs assessments with specific KPIs, and analyzes potential changes in the external variables that affect overall distribution via simulation and optimization. Figure 3 shows the flow of data and technique through each step.

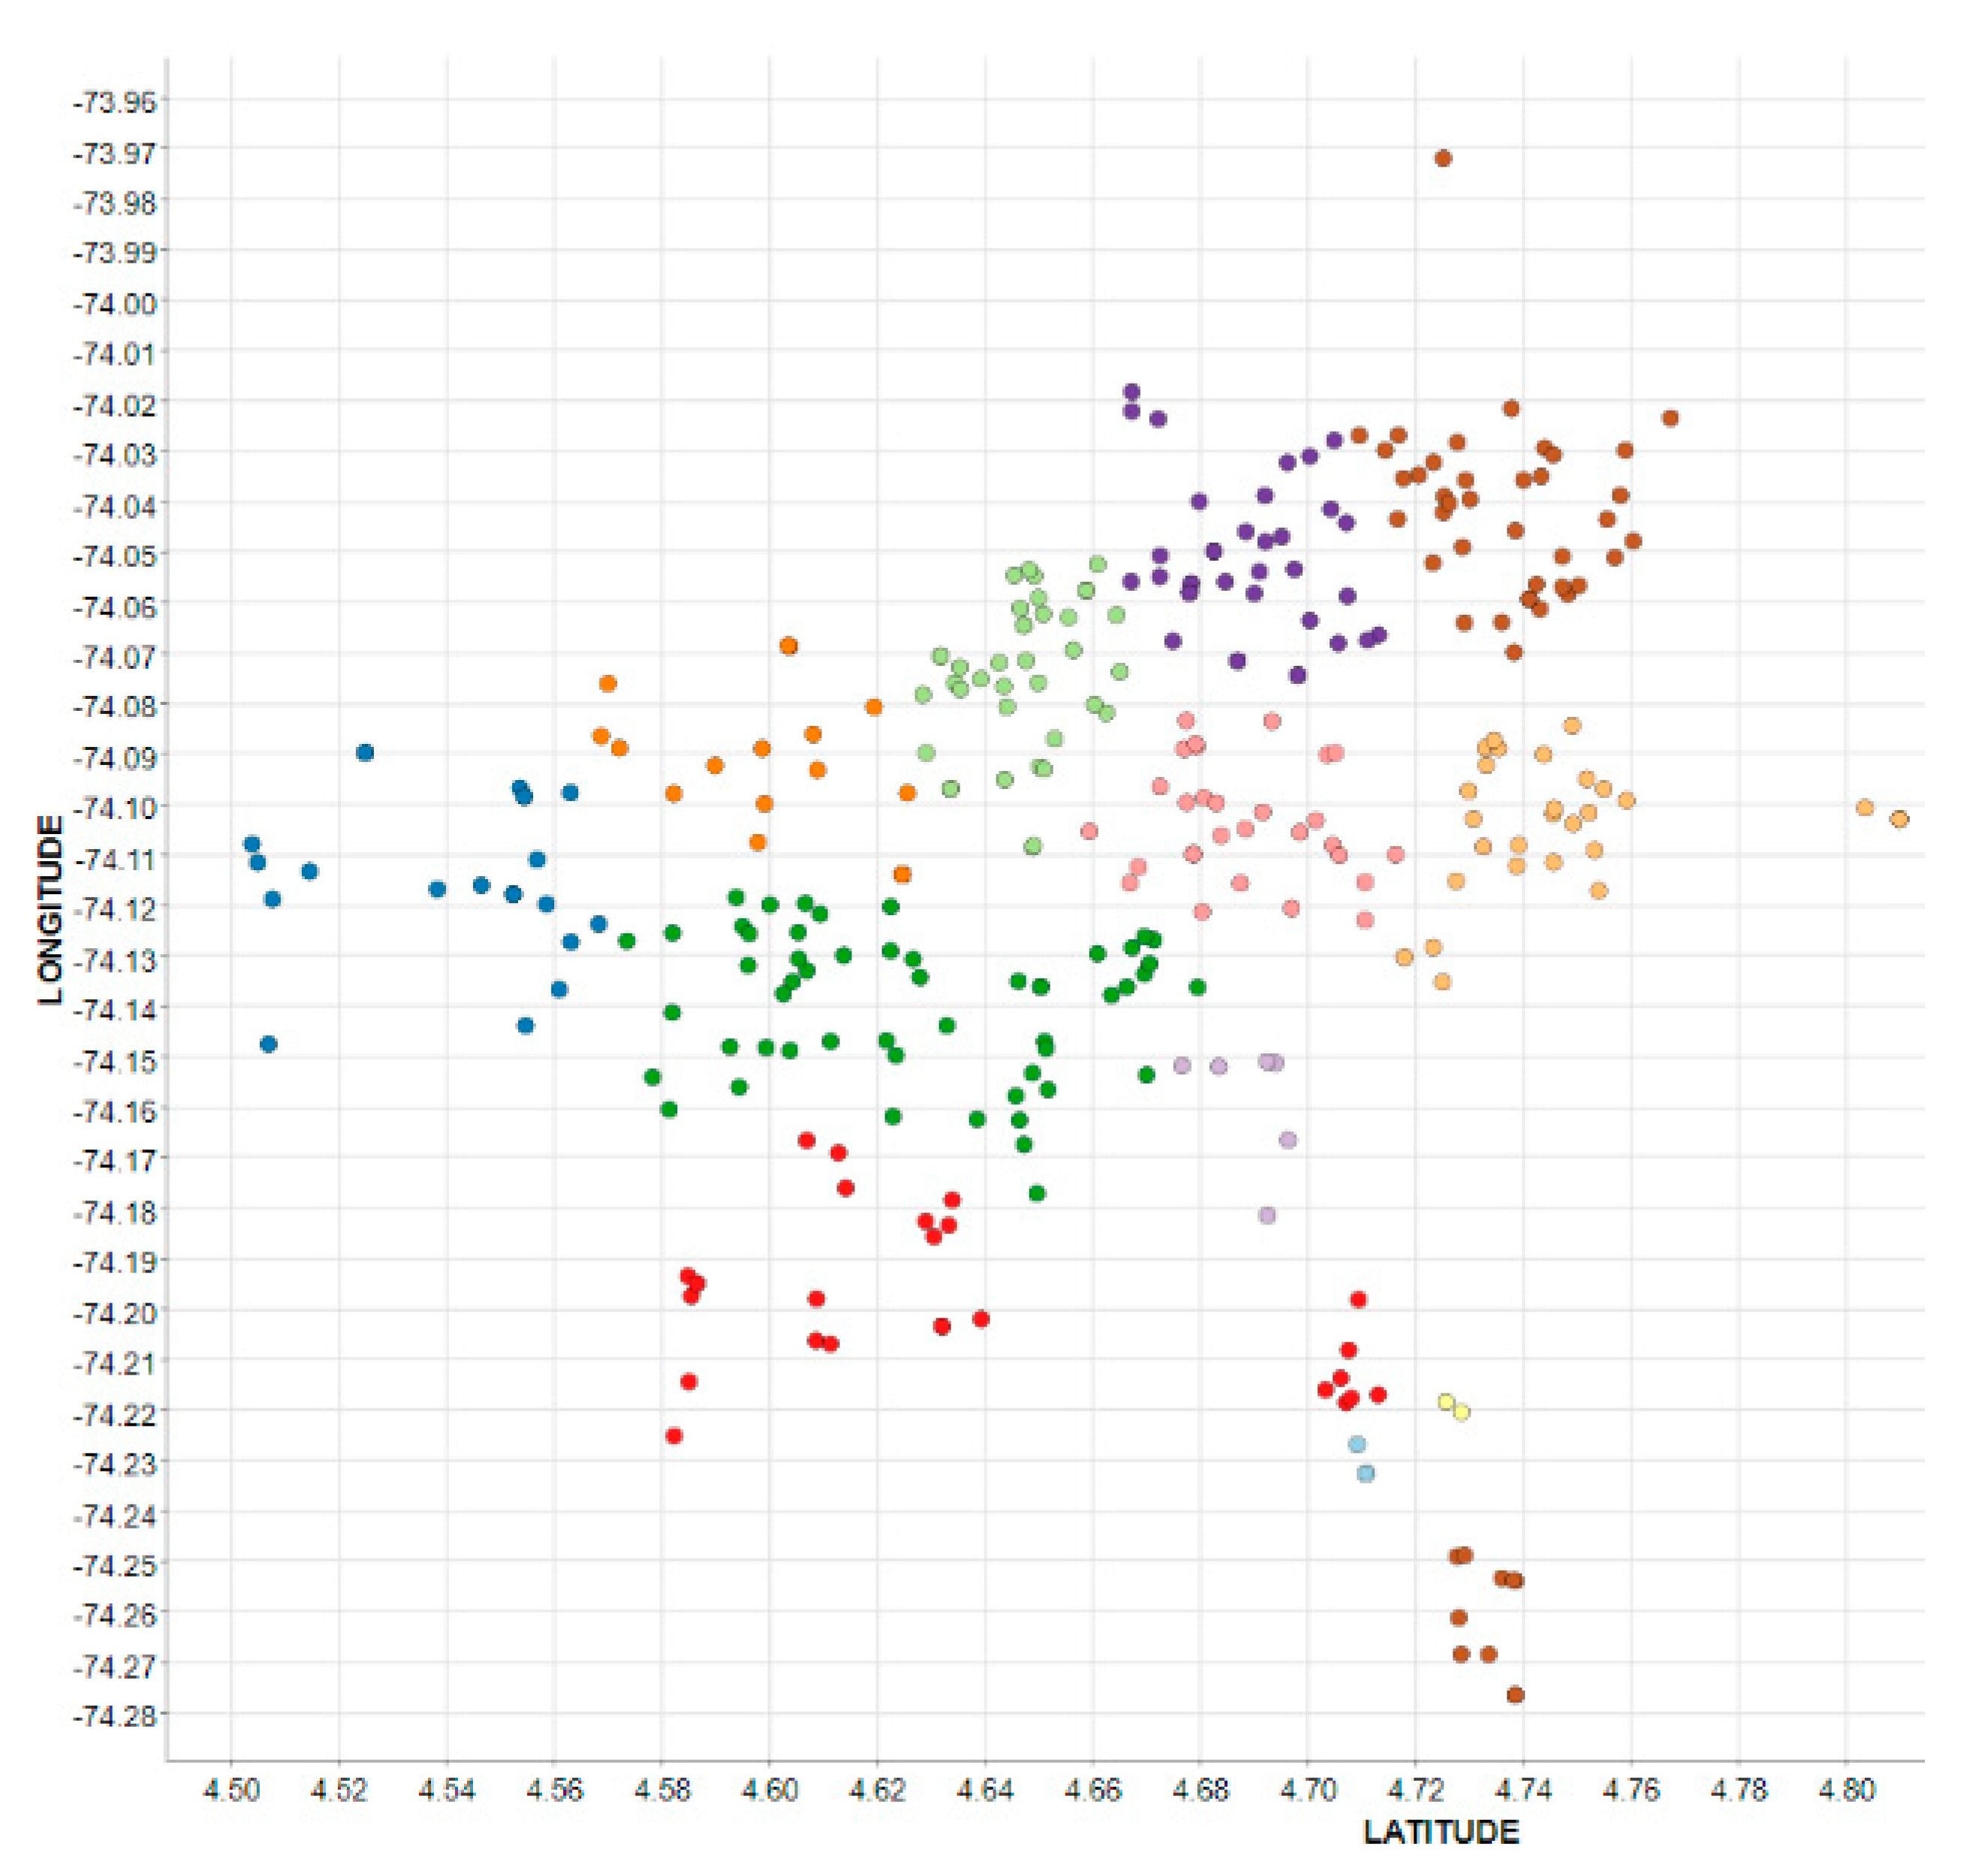
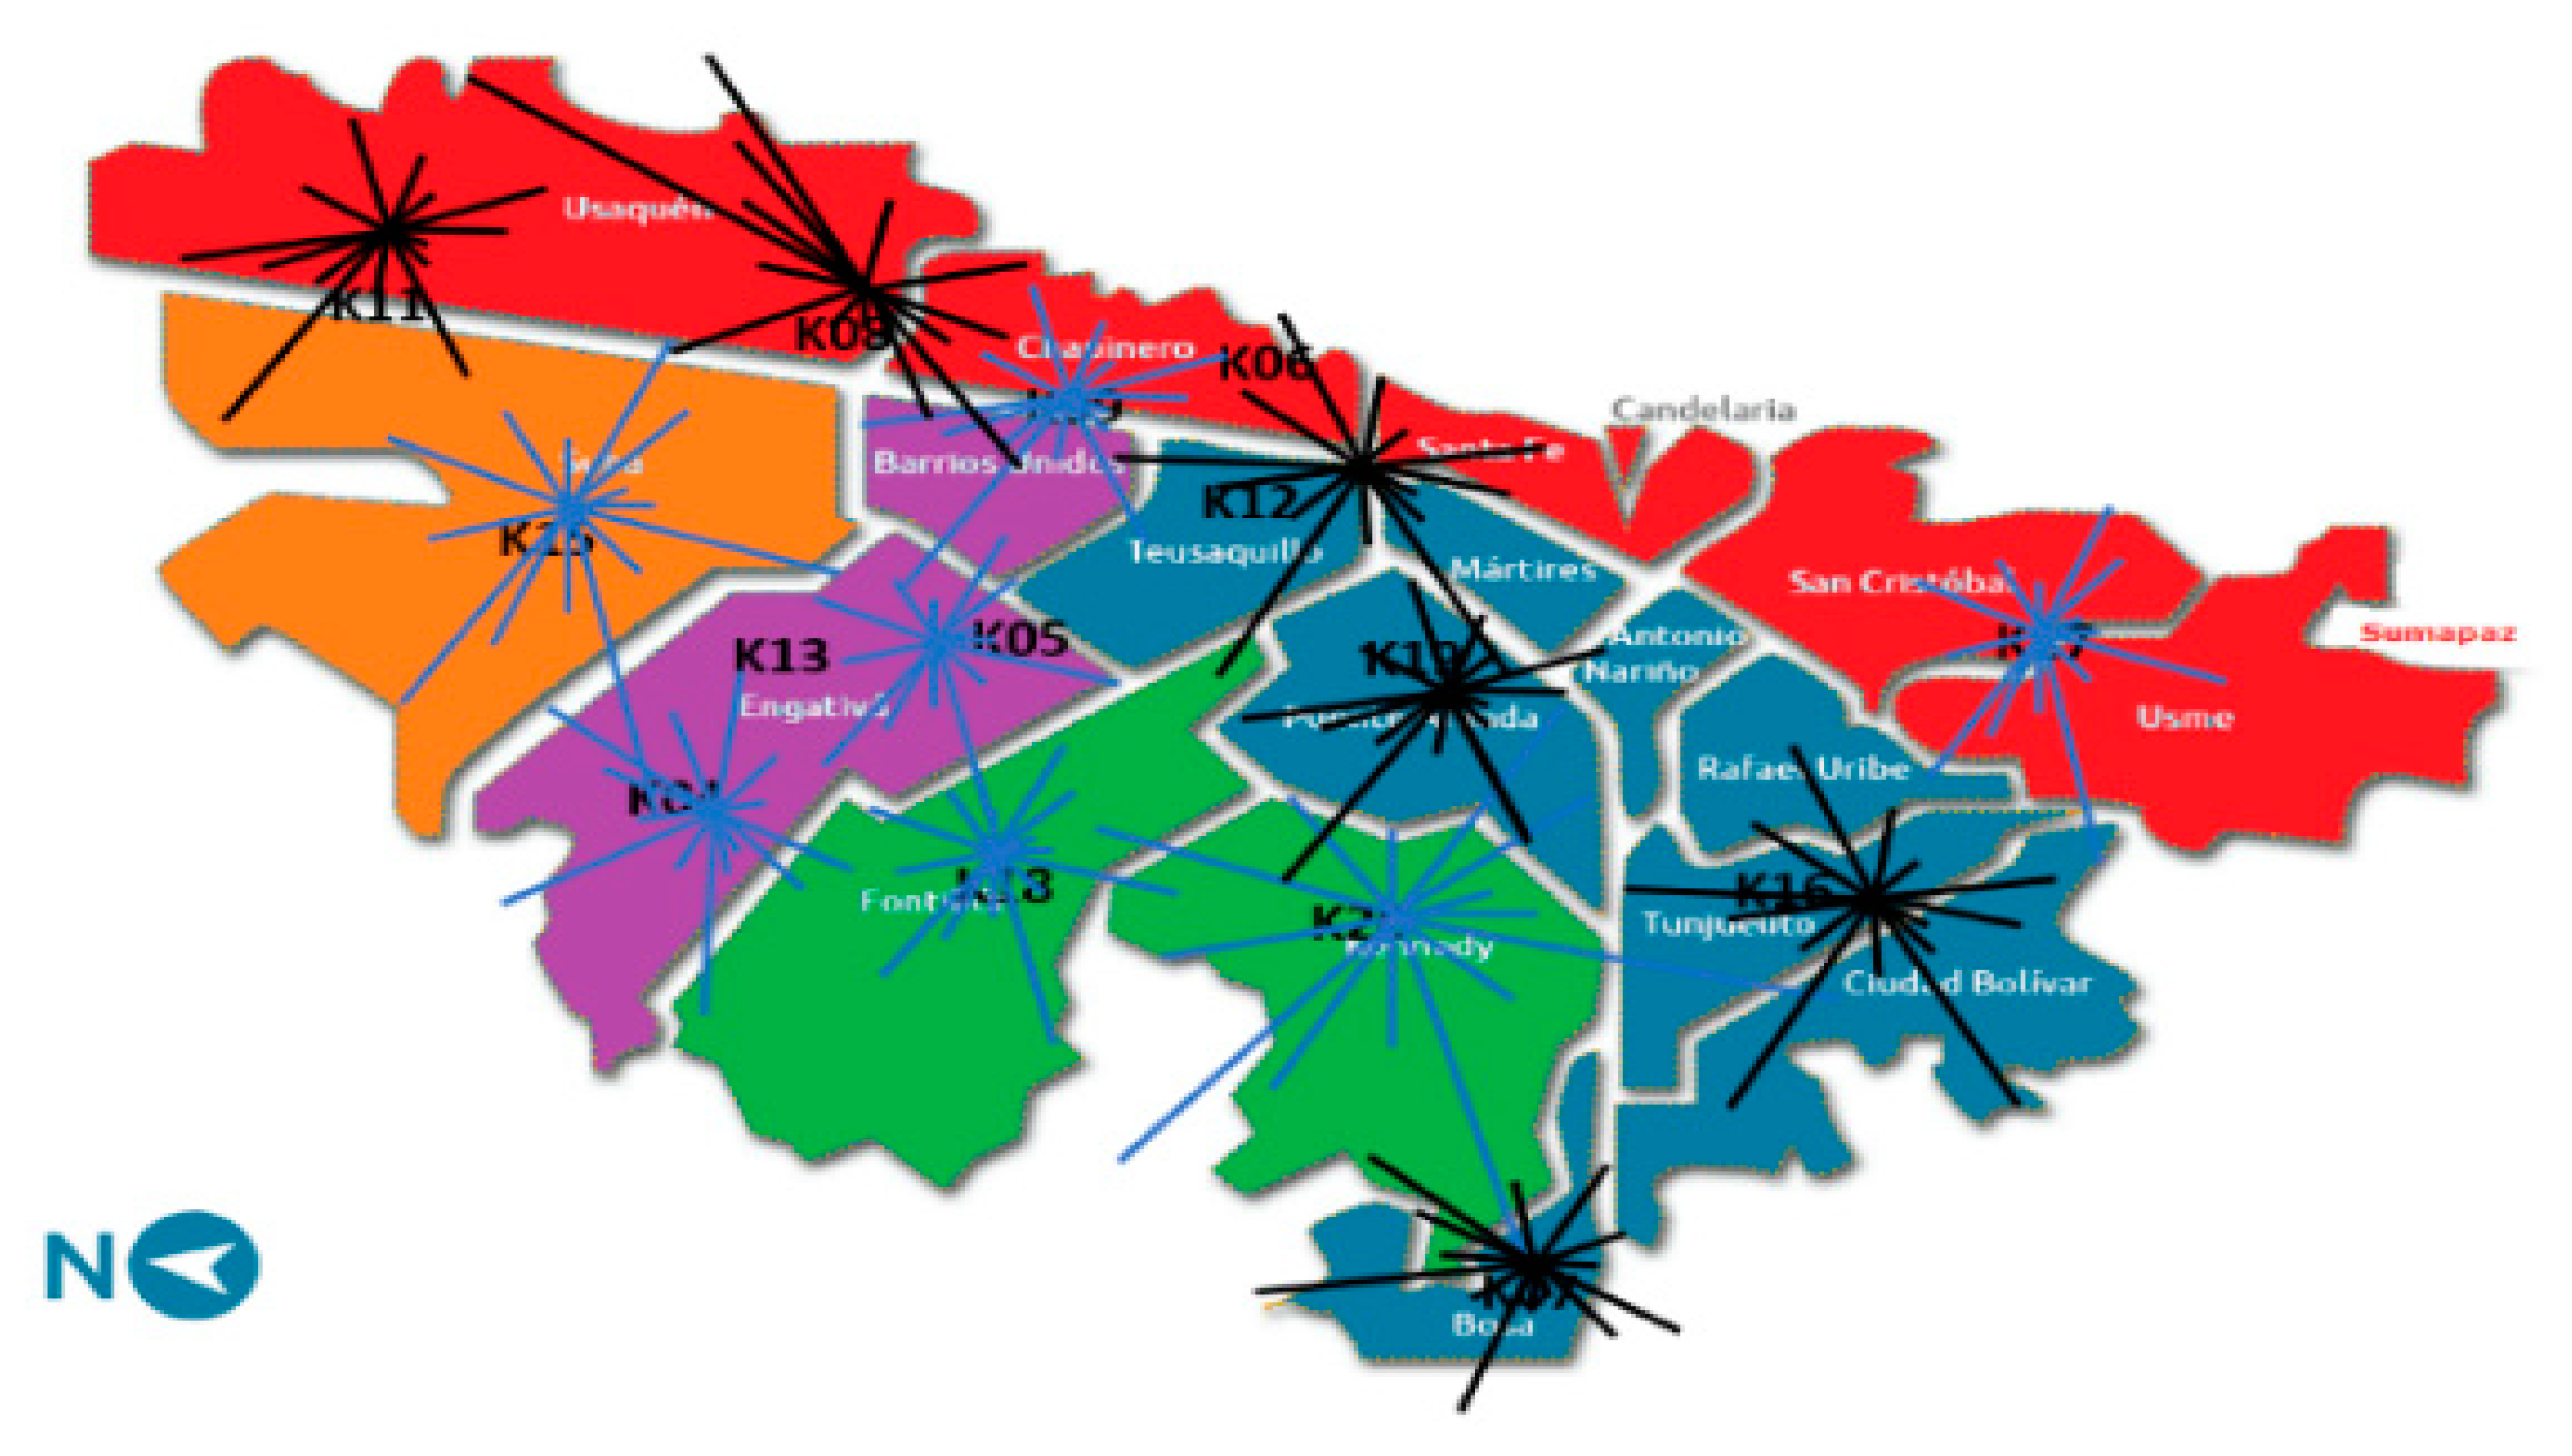
3.1. Steps 1–2: Historical Data Collection, Data Mining, and Clustering (P1–P2)

Last-mile operations are experiencing a transformation from a system that follows traditional rules to a complex and dynamic network. This network is starting to connect real-time data from traffic, weather, parking availability, environmental and socioeconomic issues, and customer/supplier essentials [20,68]. The first steps of the proposed framework include data collection, data mining, and data analysis. The methodology determines how to gather, process, clean, and analyze the data. In general, databases to plan last-mile delivery operations are designed with the following fields: (i) customer information such as order dates, shipment mode, type of product, weight, volume, sales, etc.; (ii) customer socio-demographic characteristics, including age, household size, and income level; (iii) location characteristics, namely the level of urbanization and commercial density by zone, as well as distance or time to logistics facilities or parking lots; (iv) vehicle operator performance based on indicators; (v) traffic data per zone, day, and hour slots.
Once the data are collected, they have to be processed, merged, integrated (e.g., clustering and classification) to be examined through data mining techniques. The identification of significant factors is made via statistical analyses and machine learning techniques. For the feature selection, the data set is broken down into two subsets to perform modeling: train-validation test and experimental setting. Aside from formulating a single model for the data set and observing its performance, the methodology tests a group of different models and parameter options. The first task is to train the model with a specific amount of data. Then, its performance is tested based on an error metric from a validation set, in which the KPIs are the benchmarking targets. The following step is to find the model(s) that has the minimum error rate on the validation set, and then, it will retrain the chosen model, including both the training and the validation set. Finally, the system will see how that model performs in the experimental setting and will provide the evaluation metric.
Consequently, the validation set calibrates the best parameters and evaluates the model’s performance. The system follows a walk-forward metric. In this case, it assumes that over time, logistics operations may evolve using different kinds of error measurements (e.g., MAPE) to improve performance. This approach also allows a simulation to map how this model would work in a real setting. Finally, it is expected that the data support the decision making and allow for scalability at different levels of analysis. In general, these steps deal with a high volume and variety of data to handle inaccuracies and provide robust solutions for prediction-based events.

3.2. Steps 3–4: Predictive and Prescriptive Models (P3–P4)

Companies that need to make deliveries of their products generally work with a fleet of heterogeneous vehicles (i.e., capacity, size, type—dry, chilled cargo), which are utilized to satisfy customer demands in locations where geographical and topological conditions prohibit vehicles to operate in various sizes and forms. For example, in emerging economies, deliveries must be done with motorcycles and/or bicycles, due to poor street conditions (i.e., infrastructure). Deliveries may be performed to nanostores, medium-large retail stores or end consumers. Once the clusters are identified, the next step of the methodology follows the delivery operation. In this phase (P4), the use of a prescriptive model is proposed.
The optimal number of heterogeneous vehicles and their routing are a key decision point for logistics operations. There exist efficient mathematical models and algorithms like mixed-integer linear programming formulations and metaheuristics available for practitioners and researchers that represent and solve this problem, taking into account general constraints regarding volume, weight capacity and demand [74,75,76]. These models seek to choose the proper type of vehicle and the numbers that will satisfy demand efficiently. Also, they will specify the routes that the vehicles will take, particularly the order in which customers are served on time and favoring locally available resources. Most industries use heuristics, metaheuristics, and simulation-optimization approaches to find fast and efficient solutions.
Each customer may have a specific set of restrictions that are relevant to this model. For example, a specific nanostore can be in a place where it may only allow two of the five possible vehicles enter its location. This could be due to vehicle size restrictions or incompatibility with the unloading conditions per neighborhood or per store. In addition to this, not every vehicle can enter some city zones when it is above a certain threshold depending on weight and size. Also, sometimes customers must be visited more than once to fulfill demand, and vehicles can visit multiple stores per trip (sometimes, per stop). The main assumptions for this model include:
  • All products are aggregated into a single category based on the weight.
  • The distribution is outsourced. Therefore, all vehicles are leased from a third-party logistics provider. Therefore, an indirect model is used. This is true for around 60% of the cases in emerging markets to serve the highly fragmented retail landscape [48].
This model allows a decision maker to define vehicle routing to serve a set of nodes N that represent customers, in this case, nanostores from a depot (0). Each link between a pair of nodes (i, j) represents an arc A. Based on these features, the vehicle routing problem (VRP) might be summarized in a graph G=(N, A) with the traditional formulation of a VRP proposed by numerous authors (see [38,53,77,78] for further information).

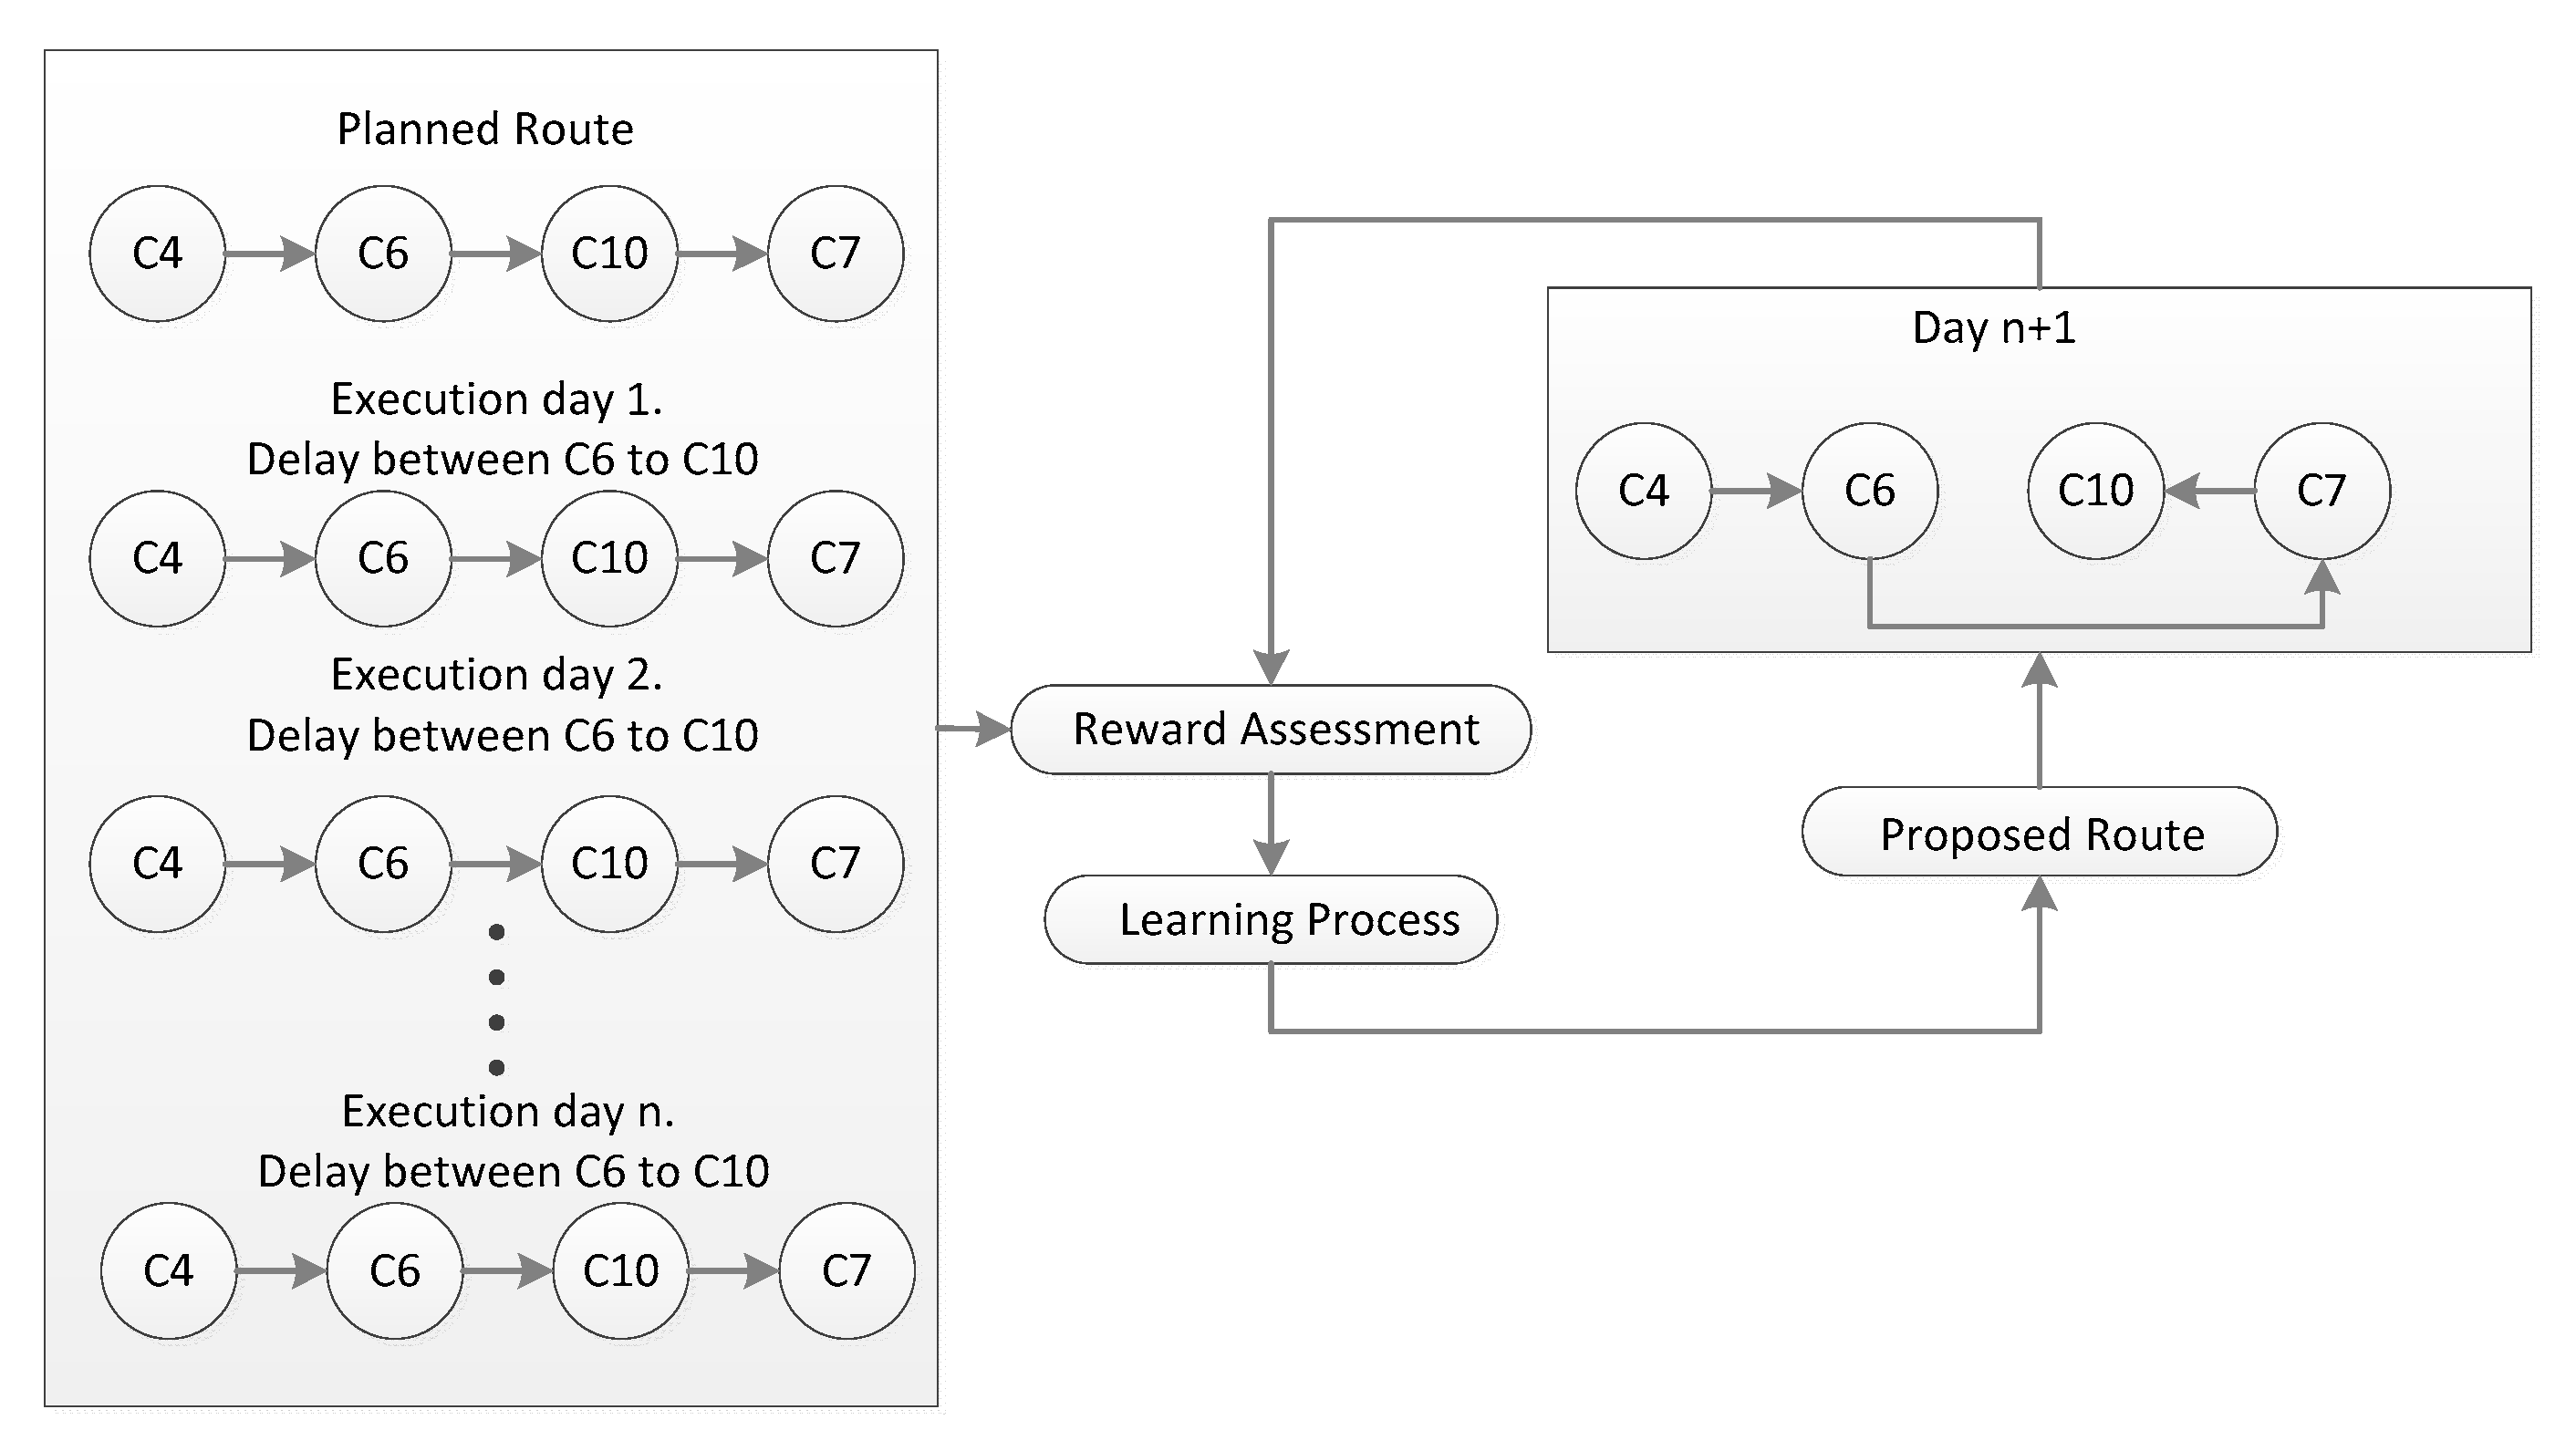
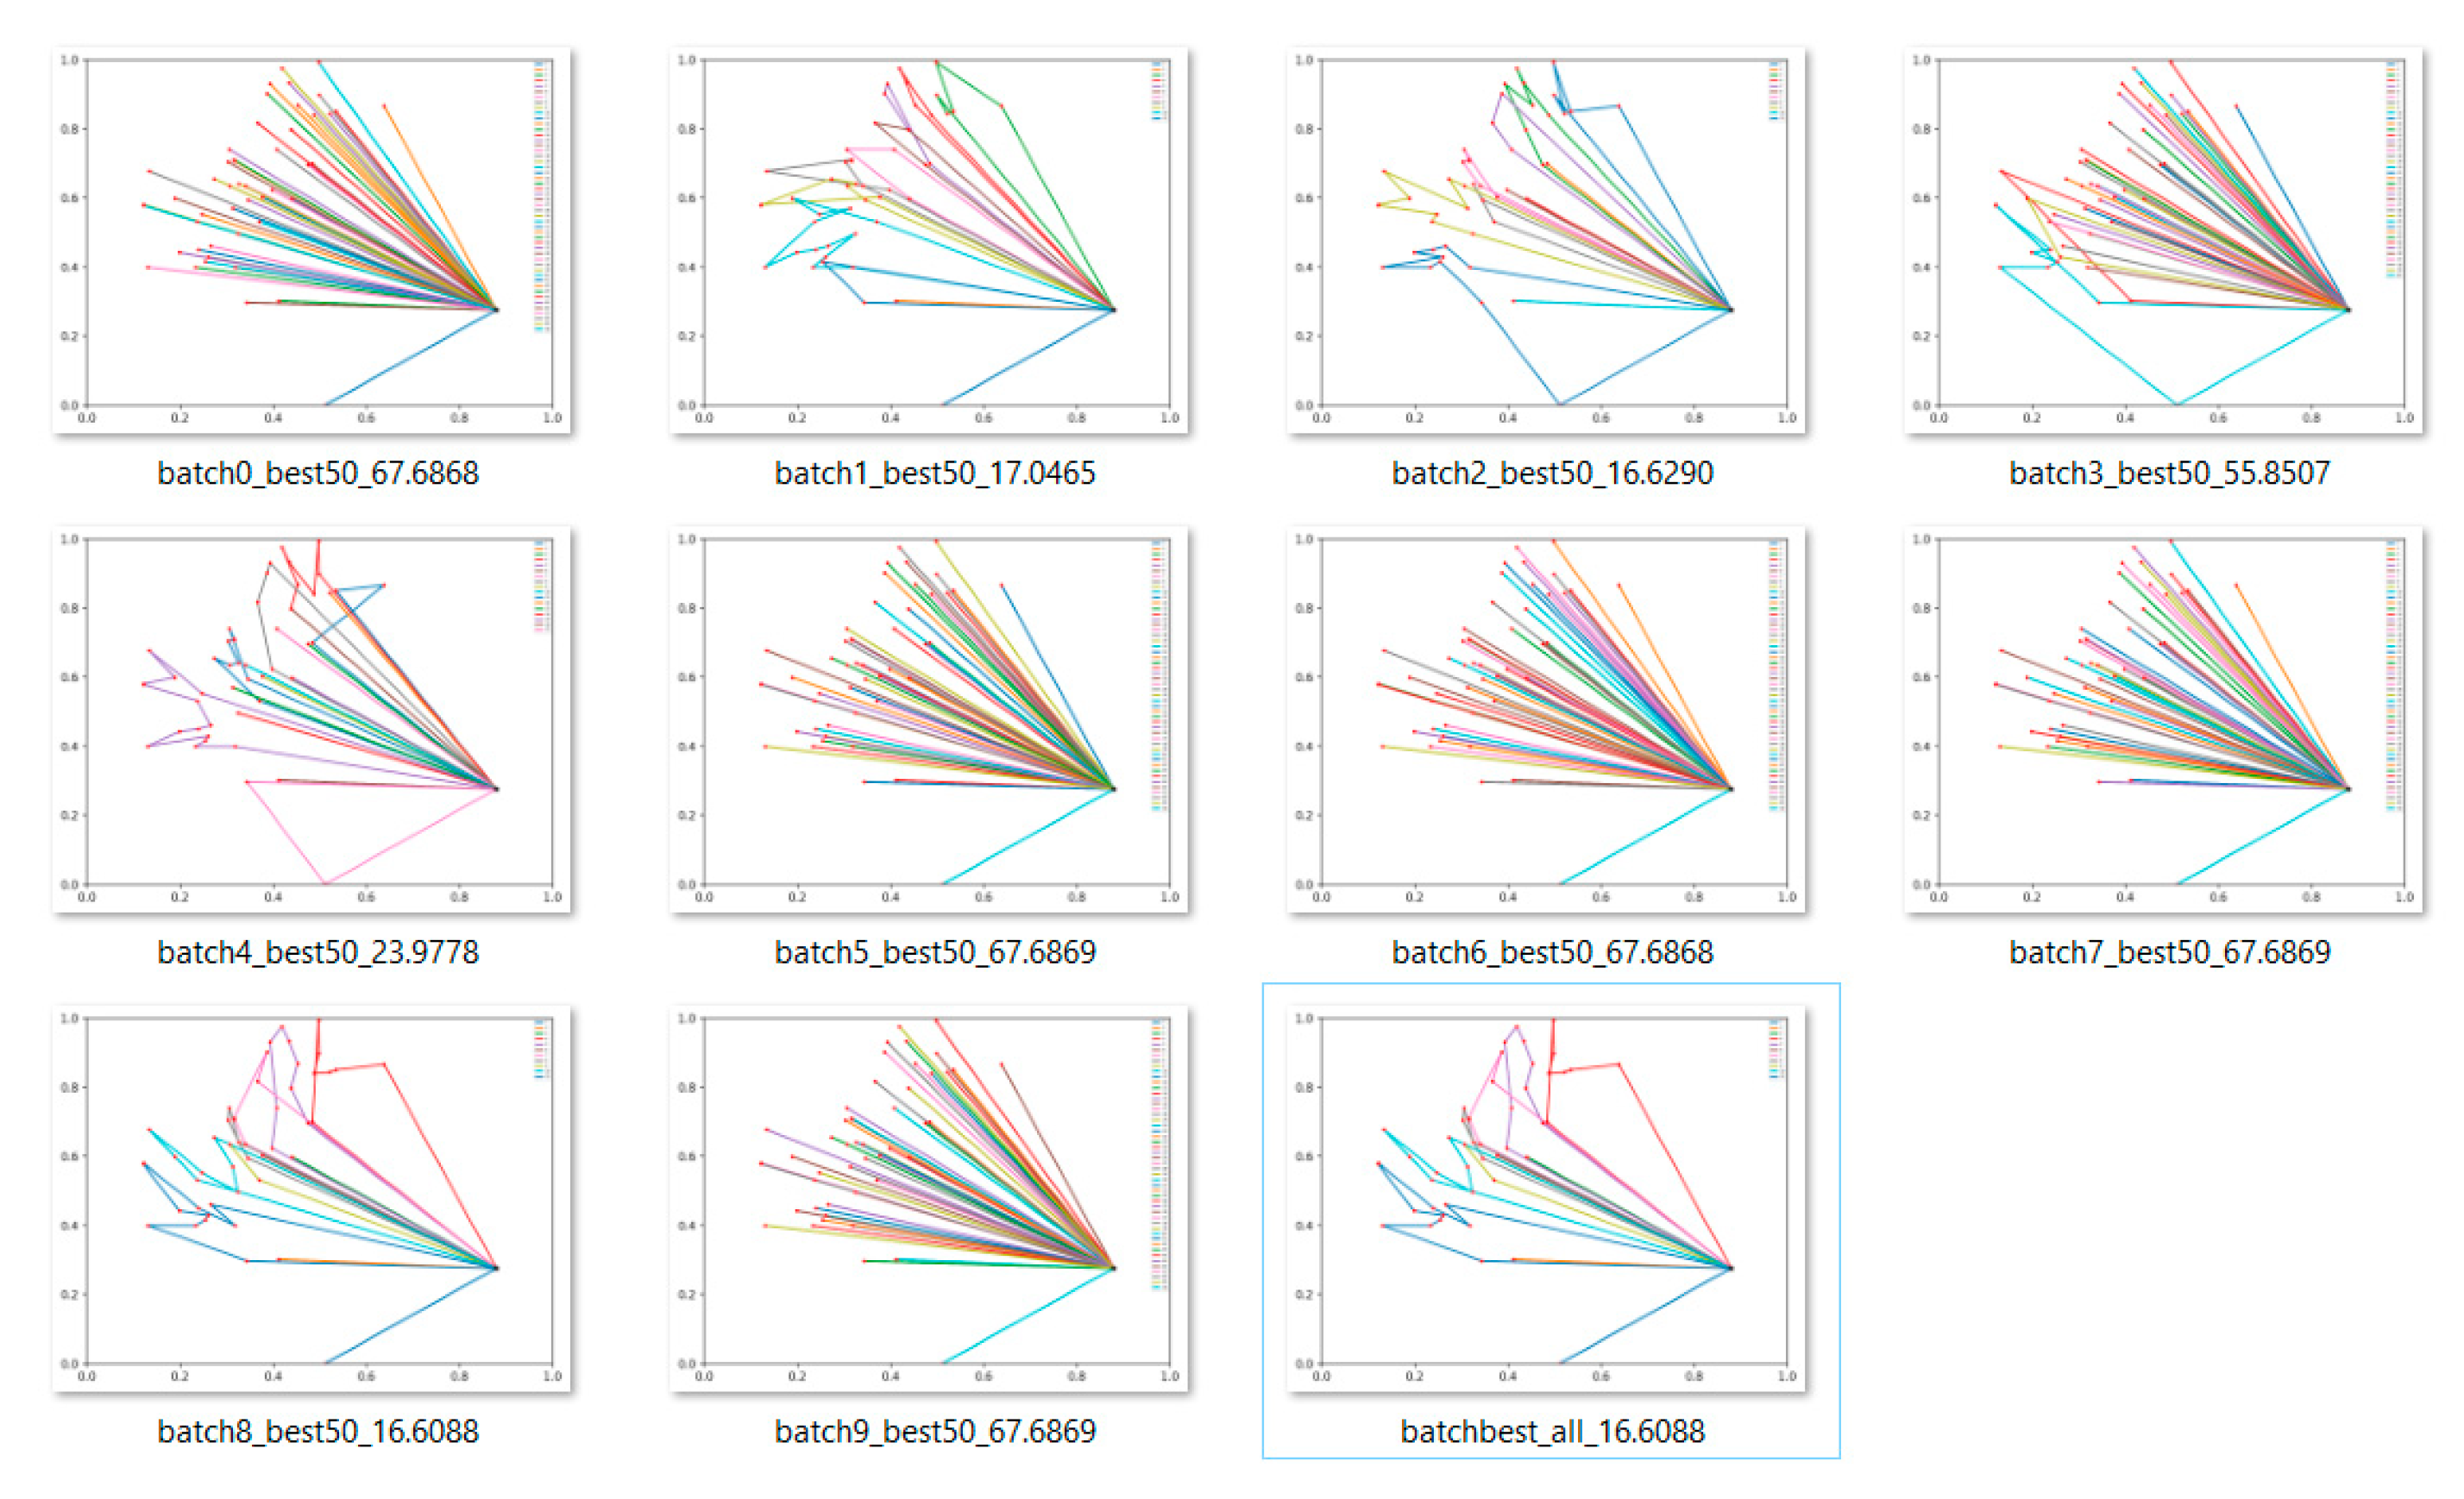
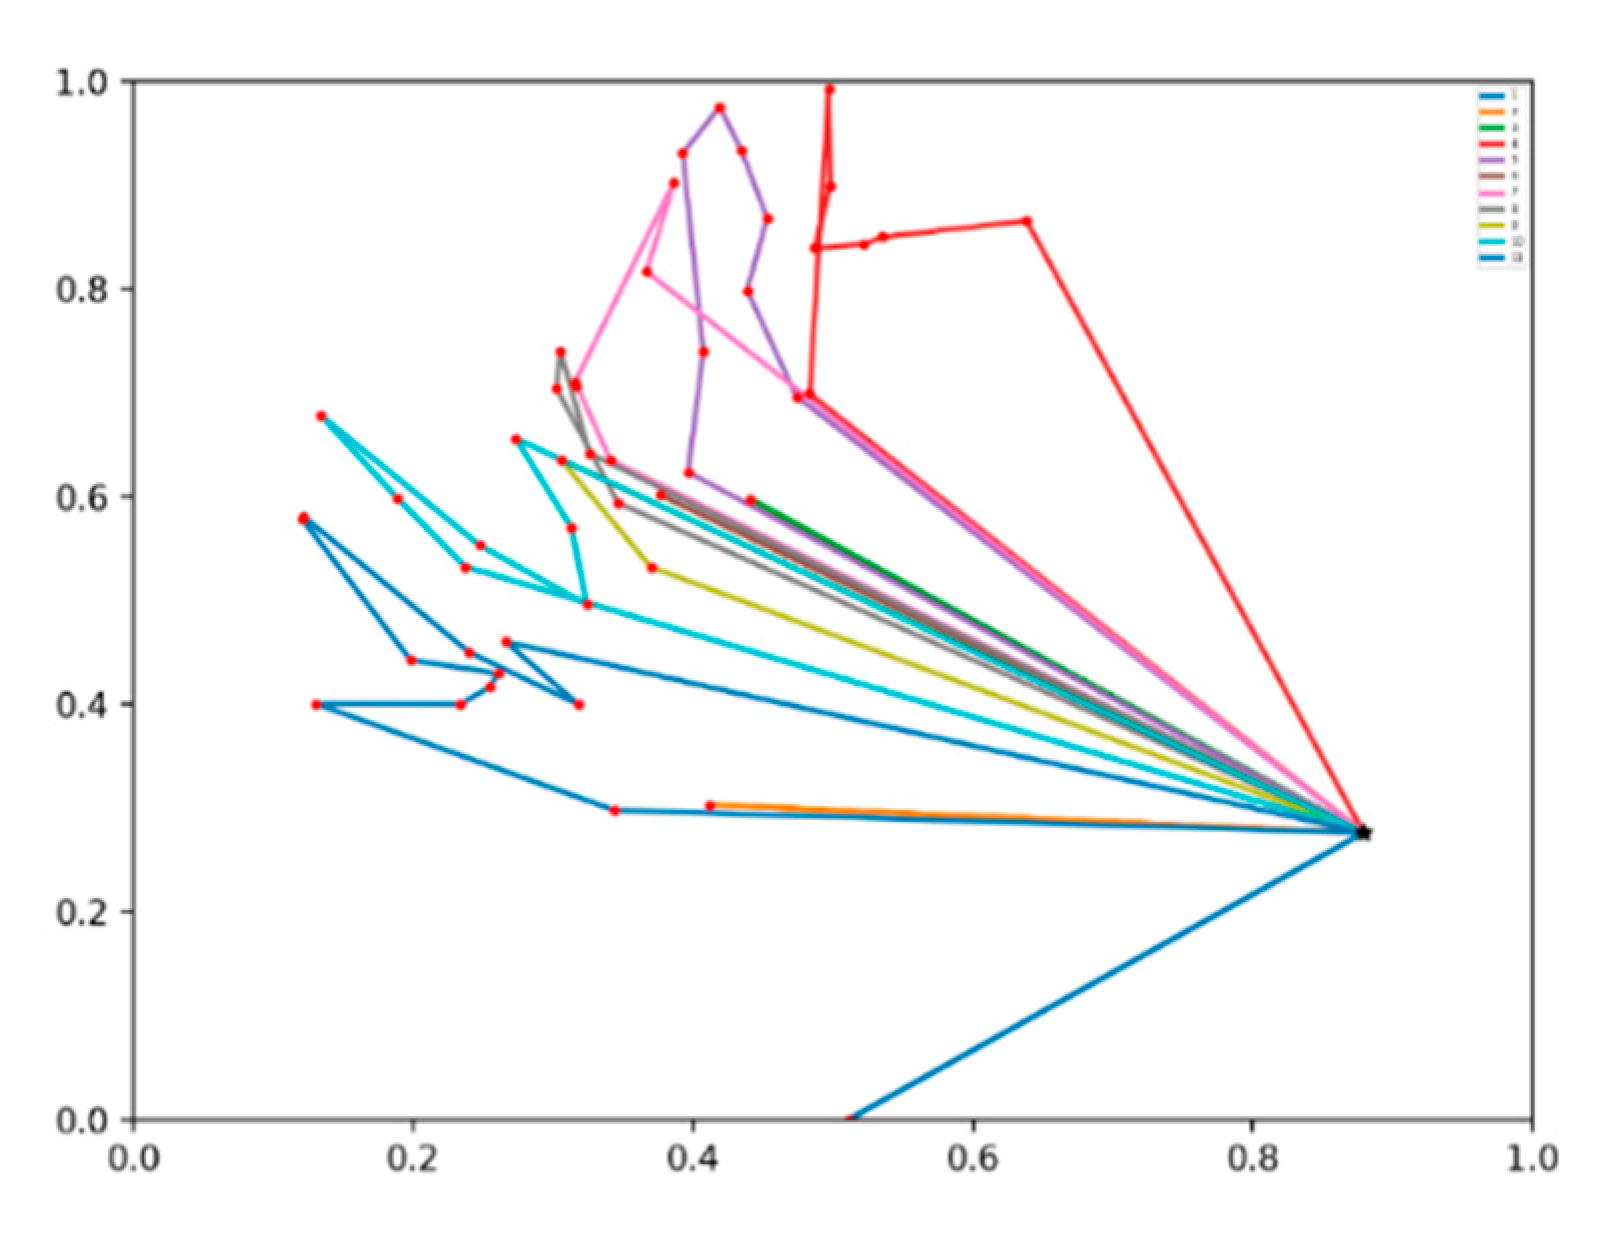
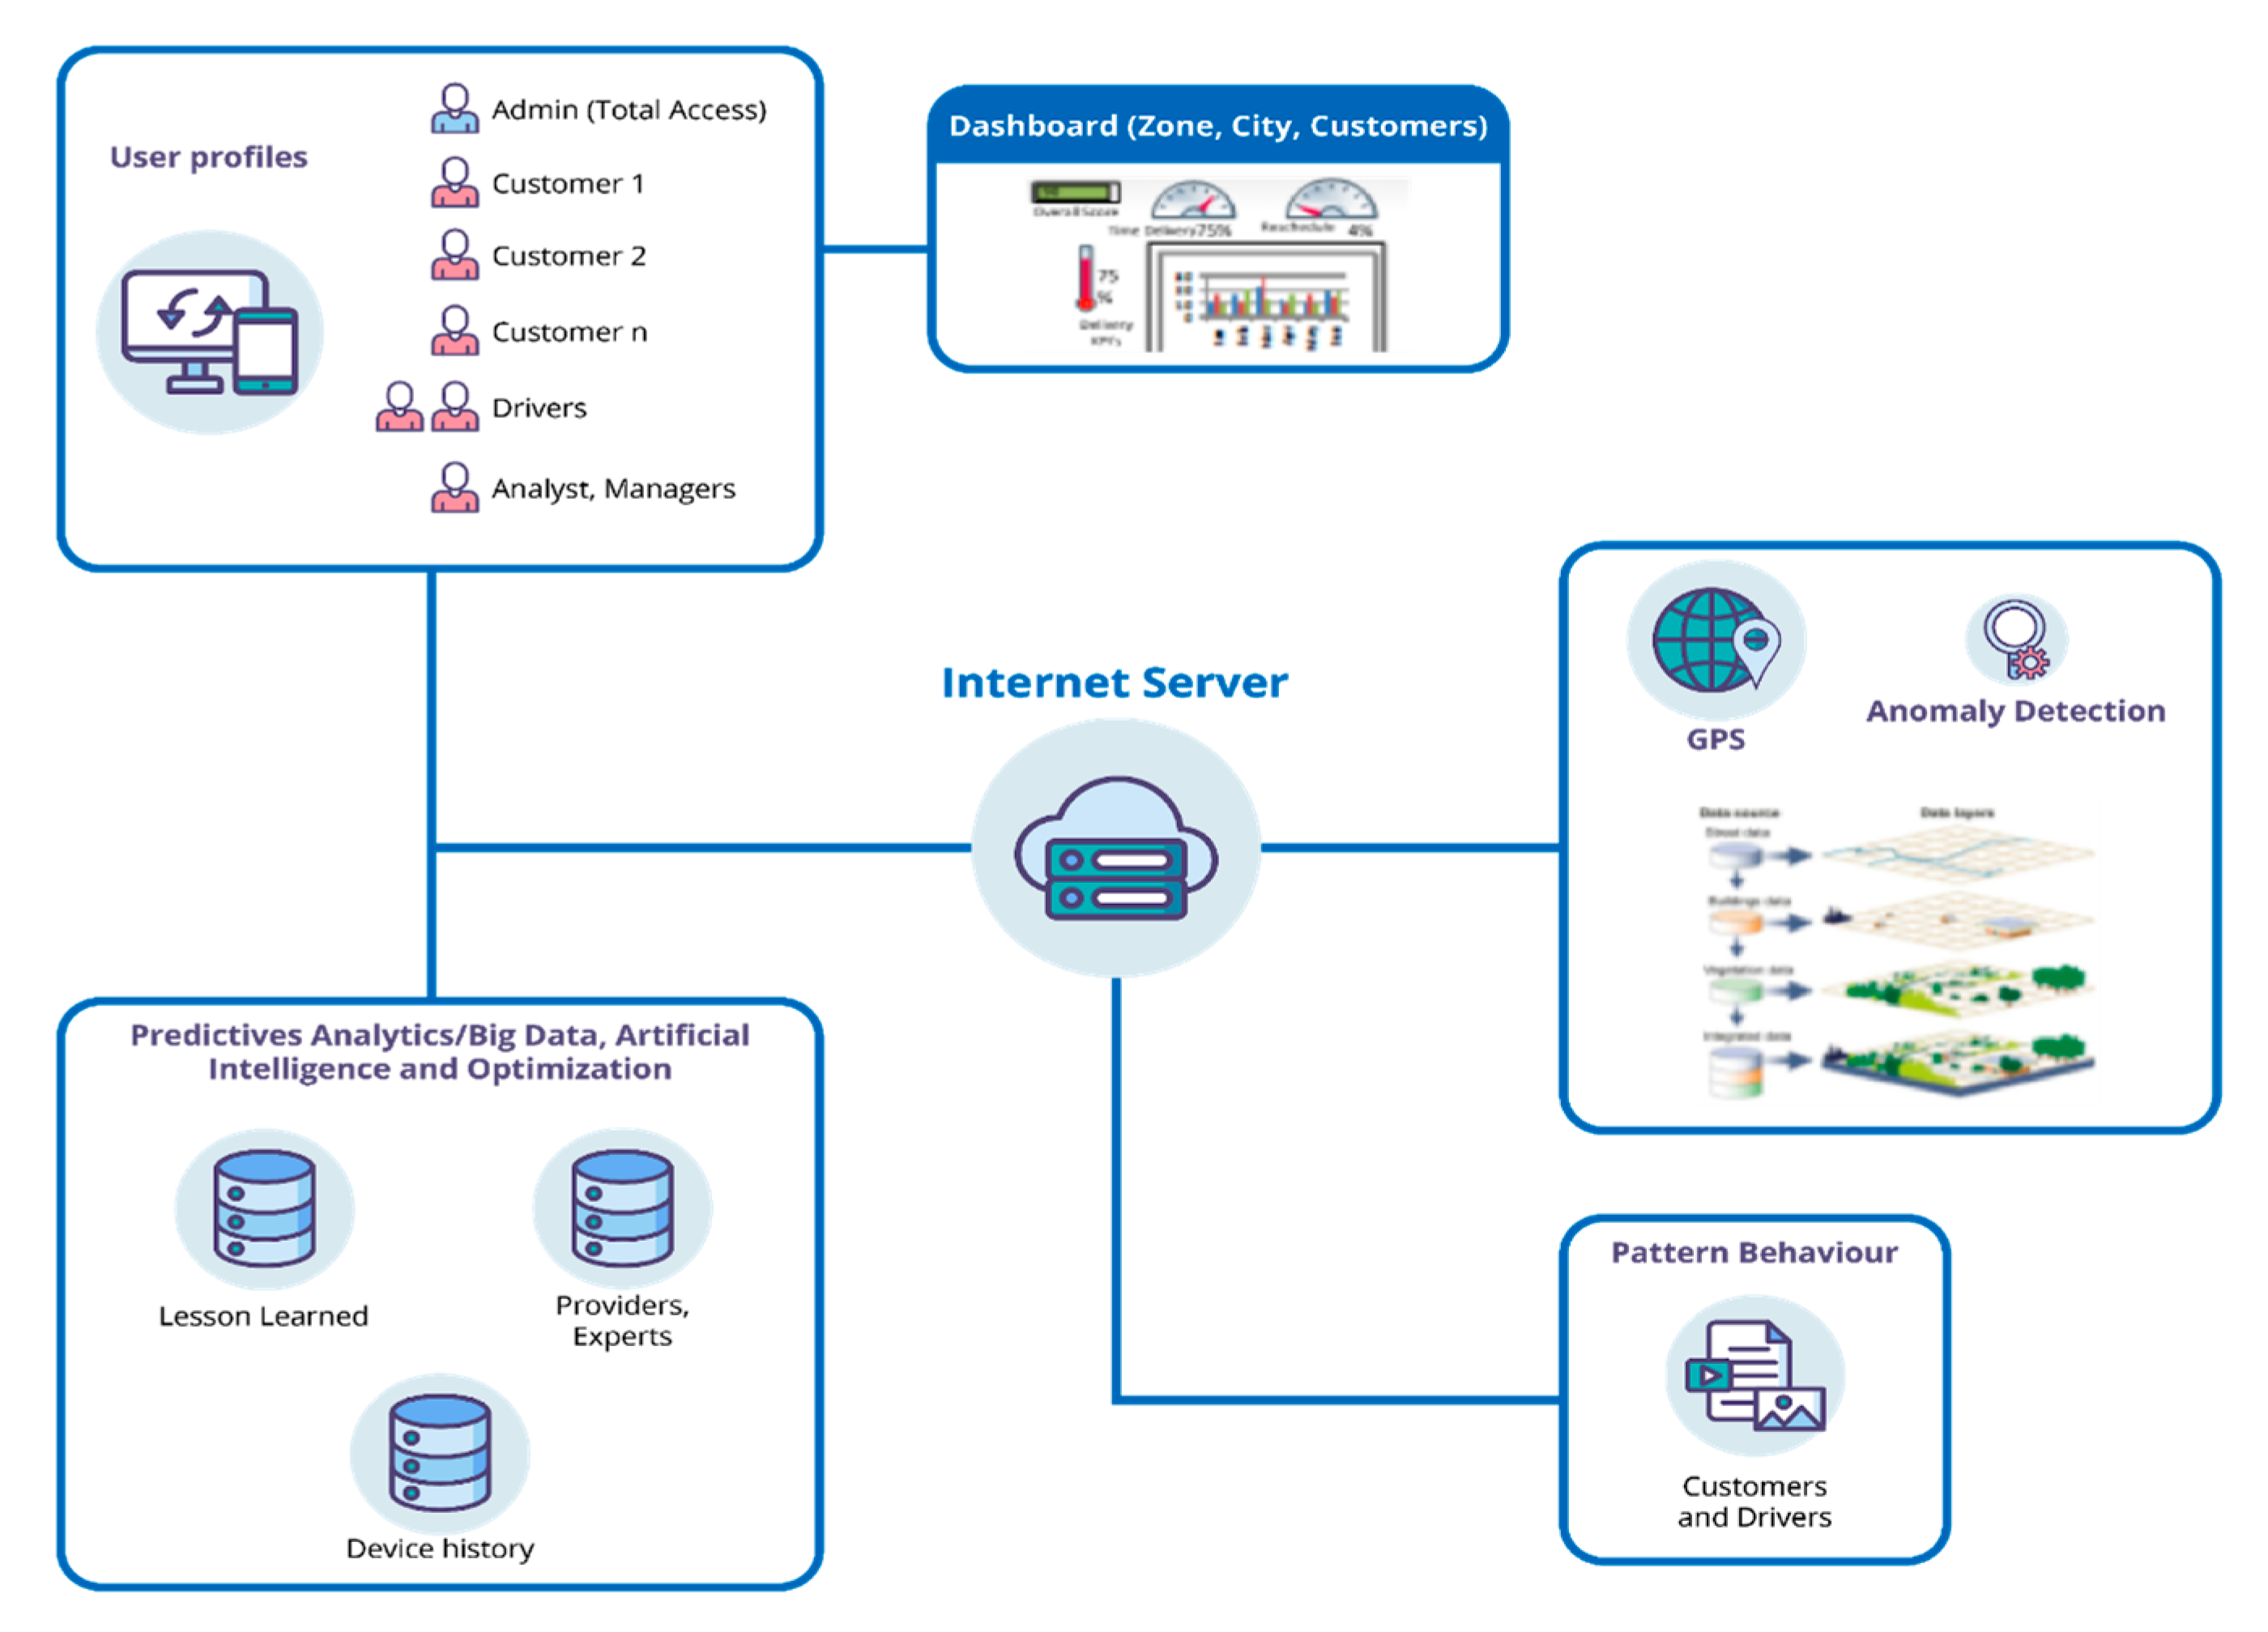
3.3. Steps 5–6: Execution and Learning (P5–P6)
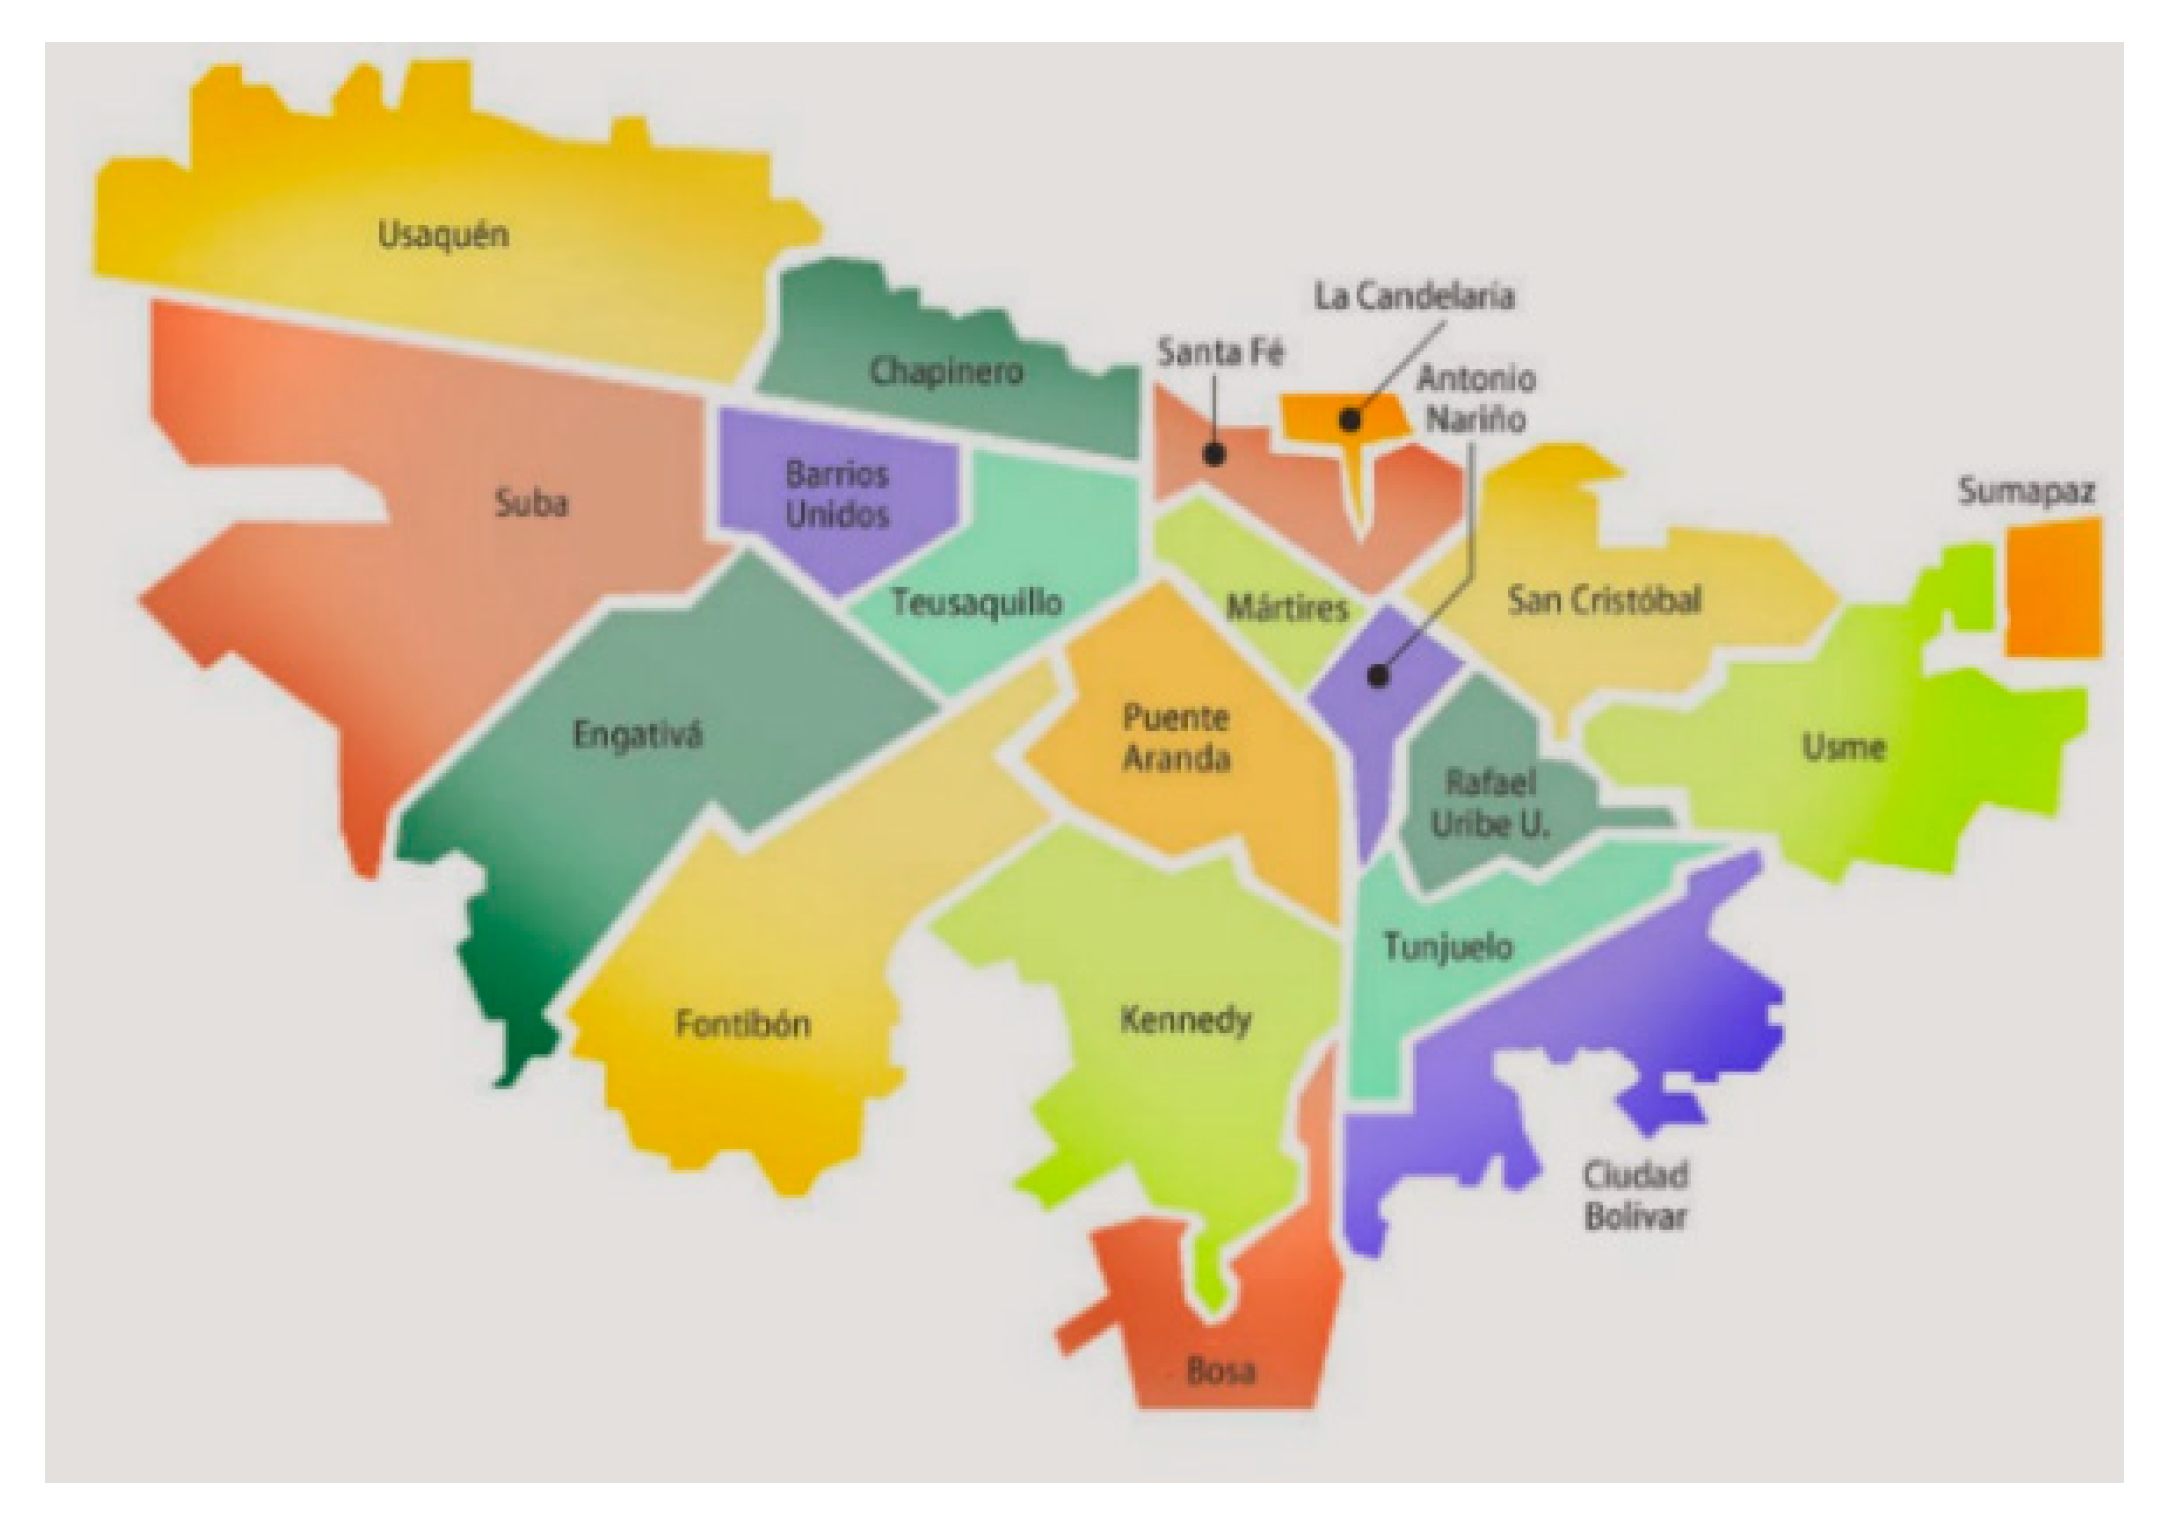
In this phase, the system already has predicted traffic and customer patterns using the location data collected from the sensors and the GPS tracking. However, given that the schedule of a customer and/or the traffic pattern can change for unpredicted reasons, there is a possibility to observe differences between the planned delivery routes and executed routes. Thus, in step 5, the methodology generates a set of recommendations to end consumers and nanostore owners about the day, location, and time to receive their deliveries. A set of distinct patterns for estimating and determining scenarios should be used as an initial solution. This process supports predicting the last-mile routing and their corresponding KPIs, given near real-time information from sensors and customer service. The information is given to select supplementary scenarios that support decision making under diverse circumstances to improve diverse KPIs.
Steps 5 and 6 consider the feedback loops in the system. Step 5 uses sensor technology and GPS tools to position the vehicle, analyze delivery status, and feed updated data into the systems. It shows results through dashboards that compare the system’s state at periods for specific locations, products, operators, clients, etc. It can compare the current performance with the minimum requirement and predict failures to meet the execution goals. Furthermore, the methodology raises alerts in case some potential disruptions or perturbations are computed with a high likelihood or require intervention from the planners. Once the system builds initial solutions (P1–P4), the execution starts. When the execution is complete, feedback is performed and feeds the historical data (step 6).
Learning happens due to the accumulation of knowledge over the time, and it is based on proactive and reactive strategies, observed issues, etc. Therefore, learning is not a set of rules. We propose a learning process based on the KPIs. The system can “learn” from the best practices and follow continuous learning. Based on past deliveries and logistics operations, the system captures rewards and acquires those that improve the system (i.e., supervised learning). The system should also identify new versions of indicators and insights (i.e., unsupervised learning), which can be a combination of KPIs or behaviors that were not specified in the previous steps.
The following section discusses a case study that represents the main challenges faced by last-mile operations in emerging market economies. The proposed methodology is applied to create a digital twin for last-mile operations in a megacity to support the delivery of goods and to solve potential misfires and adjust last-mile operations depending on the circumstances.

4. Case Study

The proposed methodology is applied to support the decision making for the delivery of goods within a megacity and support the near real-time decisions for dispatchers and transportation managers. These decisions are taken under conditions and behavior patterns from operators and customers, as well as data from locations and traffic. The digital twin aims to predict future scenarios and plan strategies for the most likely situations for the dispatchers of vehicles in businesses (e.g., retail, logistics companies, restaurants). This will help to determine and support the accurate calculation of performance indicators in a logistics company. Scenarios with heterogeneous fleets are discussed.
The methodology is applied for the last-mile operations in one of the most congested cities globally: Bogota, Colombia. With a total area of 613 square miles, Bogota is one of the largest cities in South America; with around 12 million inhabitants, it is the most densely populated city in Latin America. It is characterized by diversity in population segments, regular road infrastructure, and diversity in population economic conditions. Data are based on the operation of a retail organization that operates in the city.
For this research, the following three main “simulation agents” are defined:
Vehicle Operators: This agent represents the vehicle’s behavior in the city regarding velocity and parking features (i.e., the time of day and the city zones). The velocity affects the travel time directly. Uncertain travel times are modeled as random variables [79]. Usually, the information is modelled as stochastic travel times per path between the nodes and represented by a probability distribution. For example, Burr, Weibull, gamma and lognormal, are classic distributions used in this case [80]. These distributions show a positive skewness, i.e., values indicate the significant amount of the density being below the mean value and the tail with low probability. The vehicle operator assumes other responsibilities as well. For example, they must also walk to deliver the products from door to door. This set of activities can be called “service activities” and has a related service time. In the literature, it is common to find service times modeled with triangular or normal probability distributions [81]. It is also essential to point out the customer’s influence regarding this service time [82].
Customers/end consumer: The customer’s shopping behavior can change depending on the season. Usually, companies detect two main seasons: valley and peak season demands. The modeling of this is generally made through the analysis of historical data [83]. During the season, the normal or uniform probability distribution is typically used to set up the number of orders per day [84]. The geographical location where the demand occurs is modeled often using uniform distributions per zones and time of the year. Examples of the types of customers in a city are small businesses, nanostores, supermarkets, residents (townhouses, housing complexes or buildings), etc.
City: Uncertainty in a city environment due to changes in travel times for road infrastructure or weather conditions, along with parking availability, are some of the factors that incorporate challenging decisions or policies to meet customer demands and time windows [85]. This directly affects the service levels and operational costs when adopting traffic, transport, or environmental regulations.
This case discusses the key focus points and provides guidelines and implications for the last-mile delivery problem. Optimization models are coded in algebraic modeling software (e.g., Pyomo, Gurobi, GAMS) to identify the fleet and type of vehicles. Also, it assesses the dynamic and learning process of the solution using agent-based simulation. Table 3 depicts the justification for each of the steps.

4.1. Steps 1–2: Historical Data, Data Collection Description and Data Analysis

To have a sense of a retail operation for home delivery in Bogota, Table 4 shows daily customers’ demand in average numbers. Transactional data from a period of three weeks were analyzed for each demand type (peak and valley seasons). Table 5 shows the typical configuration of vehicles for the distribution to end consumers. Potential clients can place an order one or more days before the delivery date. Moreover, the order can be associated with or without a time window.
Megacities such as Bogota are characterized by heavy traffic congestion, extended trip times and high pollution. The lack of a proper urban growth plan, along with the growth in urban housing areas, retail stores, and regular roads, poses big challenges for urban logistics. The differences in density population between different city districts is a typical characteristic. Bogota is divided into 20 districts (see Figure 4). Each of these districts has its own rules and government budget for infrastructure, laws that influence road construction, and parking conditions, to name a few. A shared trait among the districts is that they can have different road infrastructure characteristics. The latter affects vehicles’ speed [86].
Table 6 shows the classification of districts and important features like the surface size, population size, population density, and average speed. Travel times were retrieved using Google Maps, considering actual traffic conditions. Each district has a varying density of inhabitants per square kilometer, which we used to order Table 6.

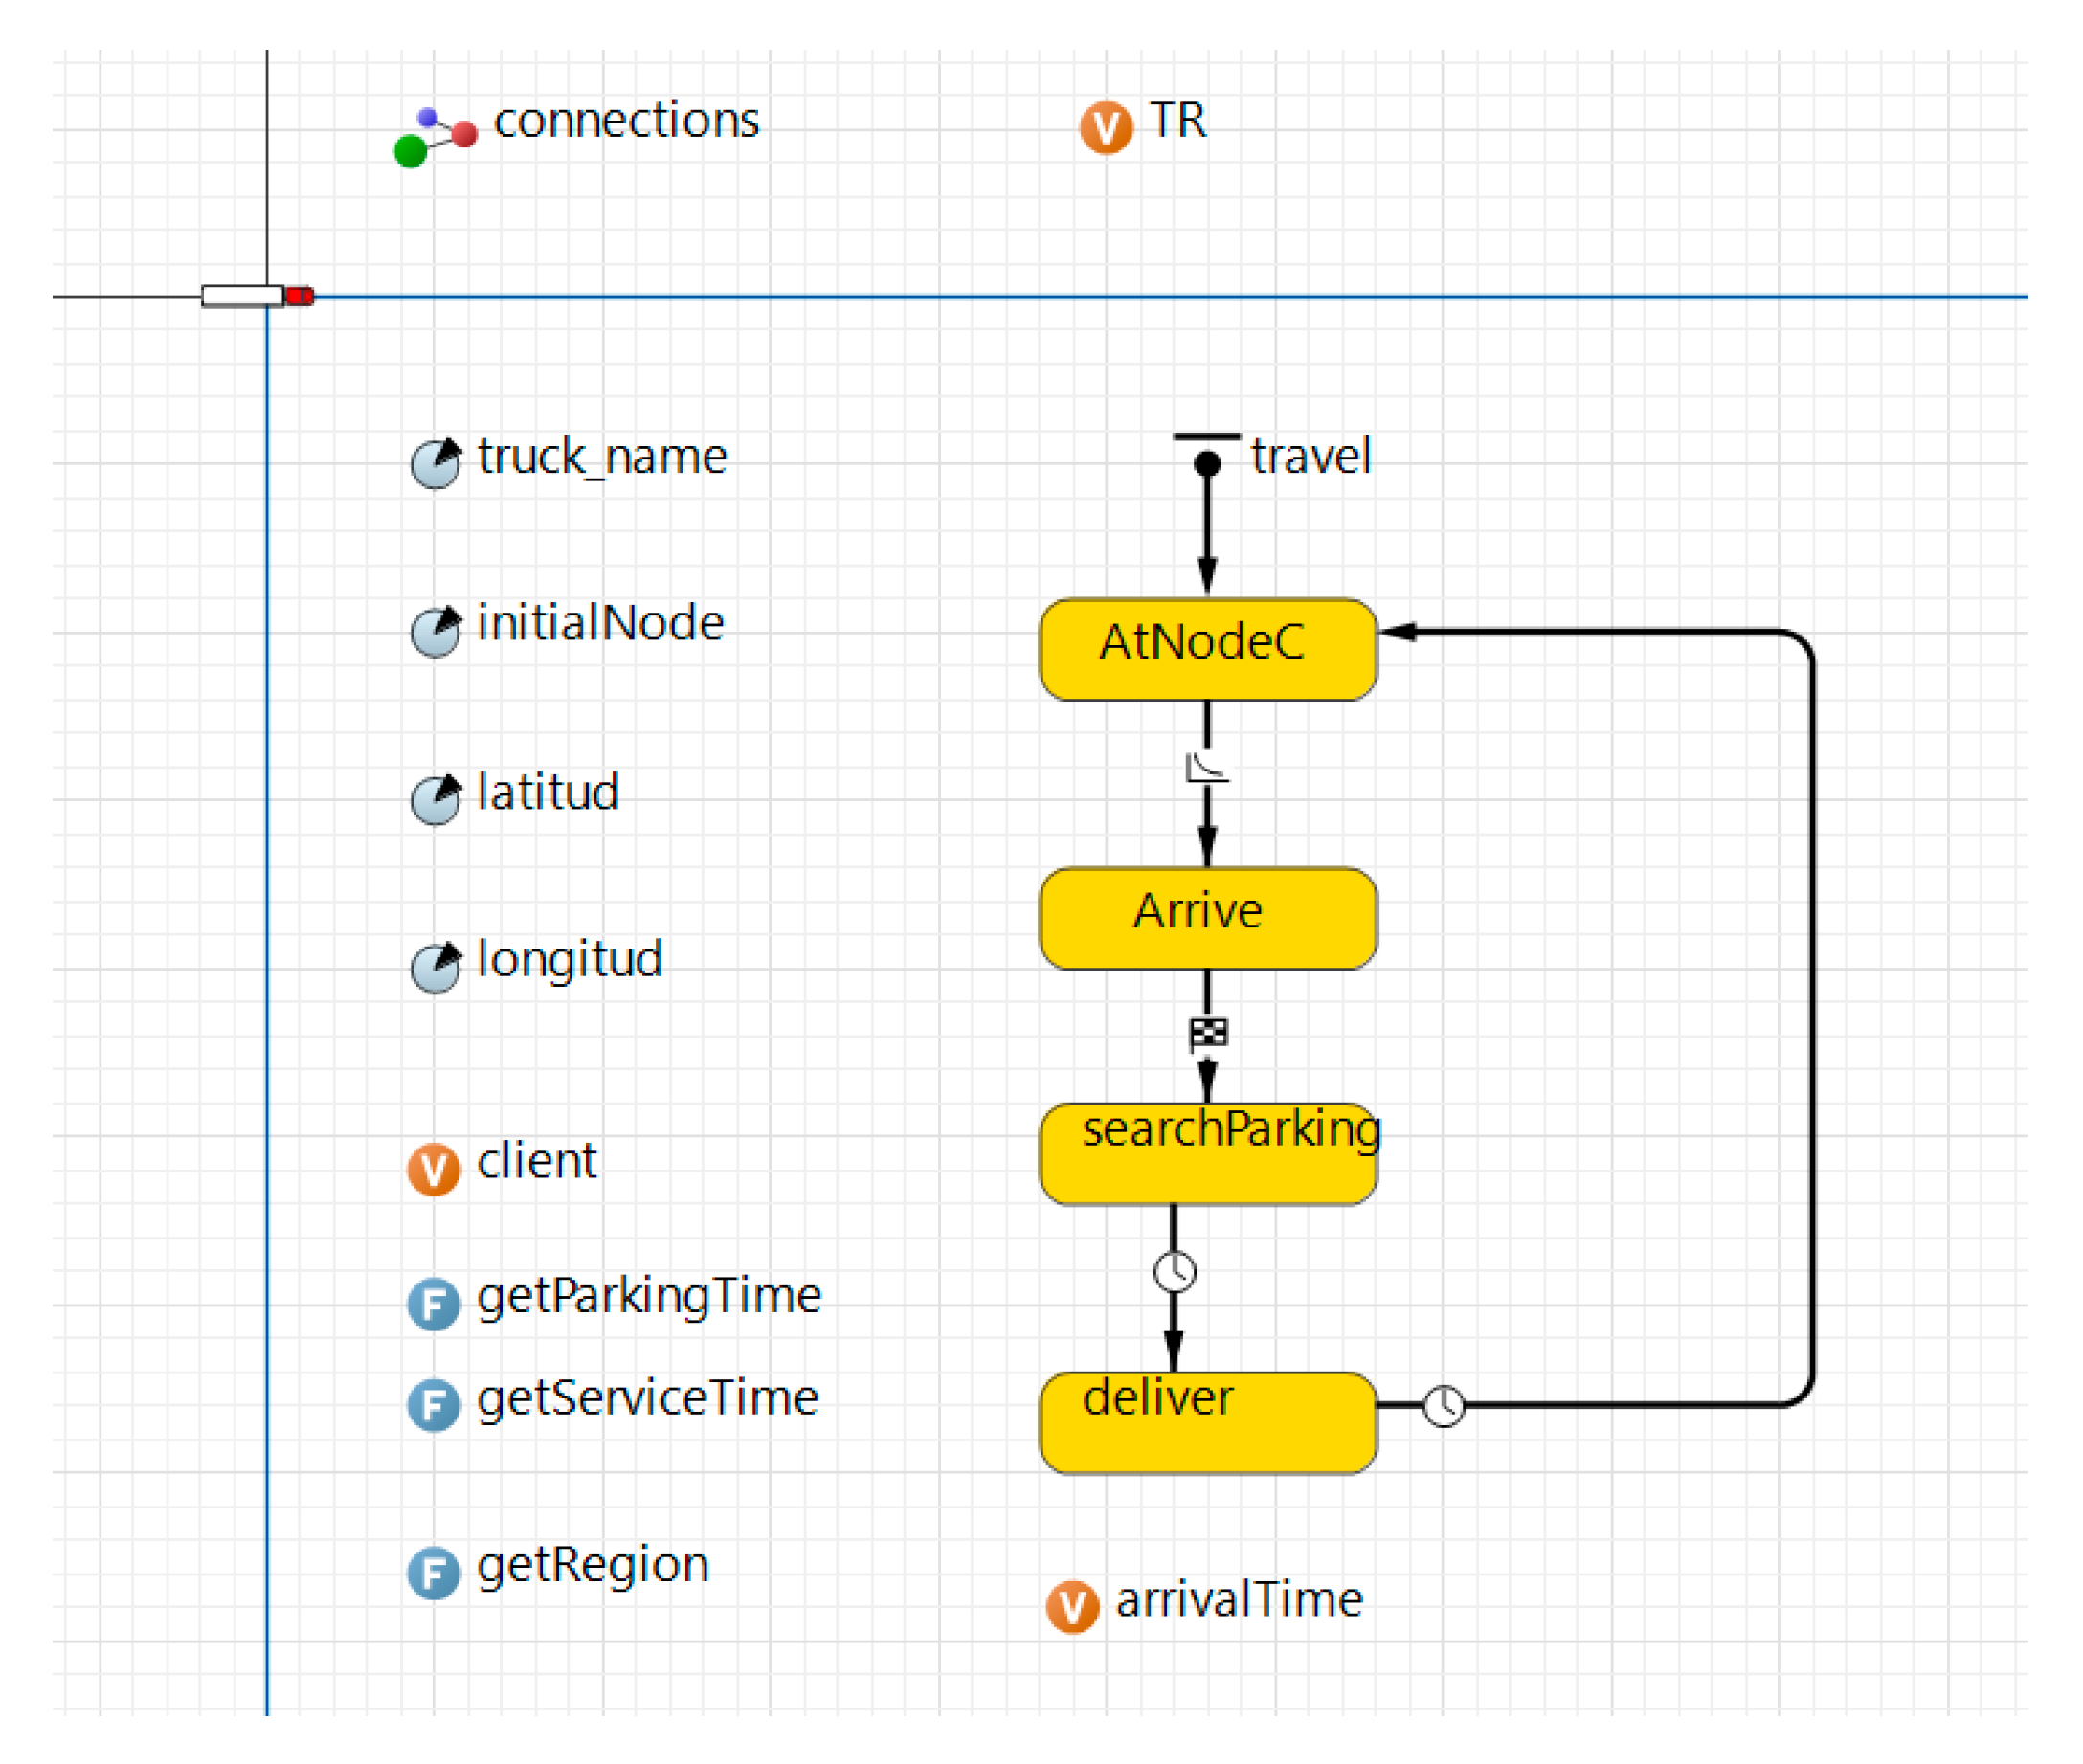
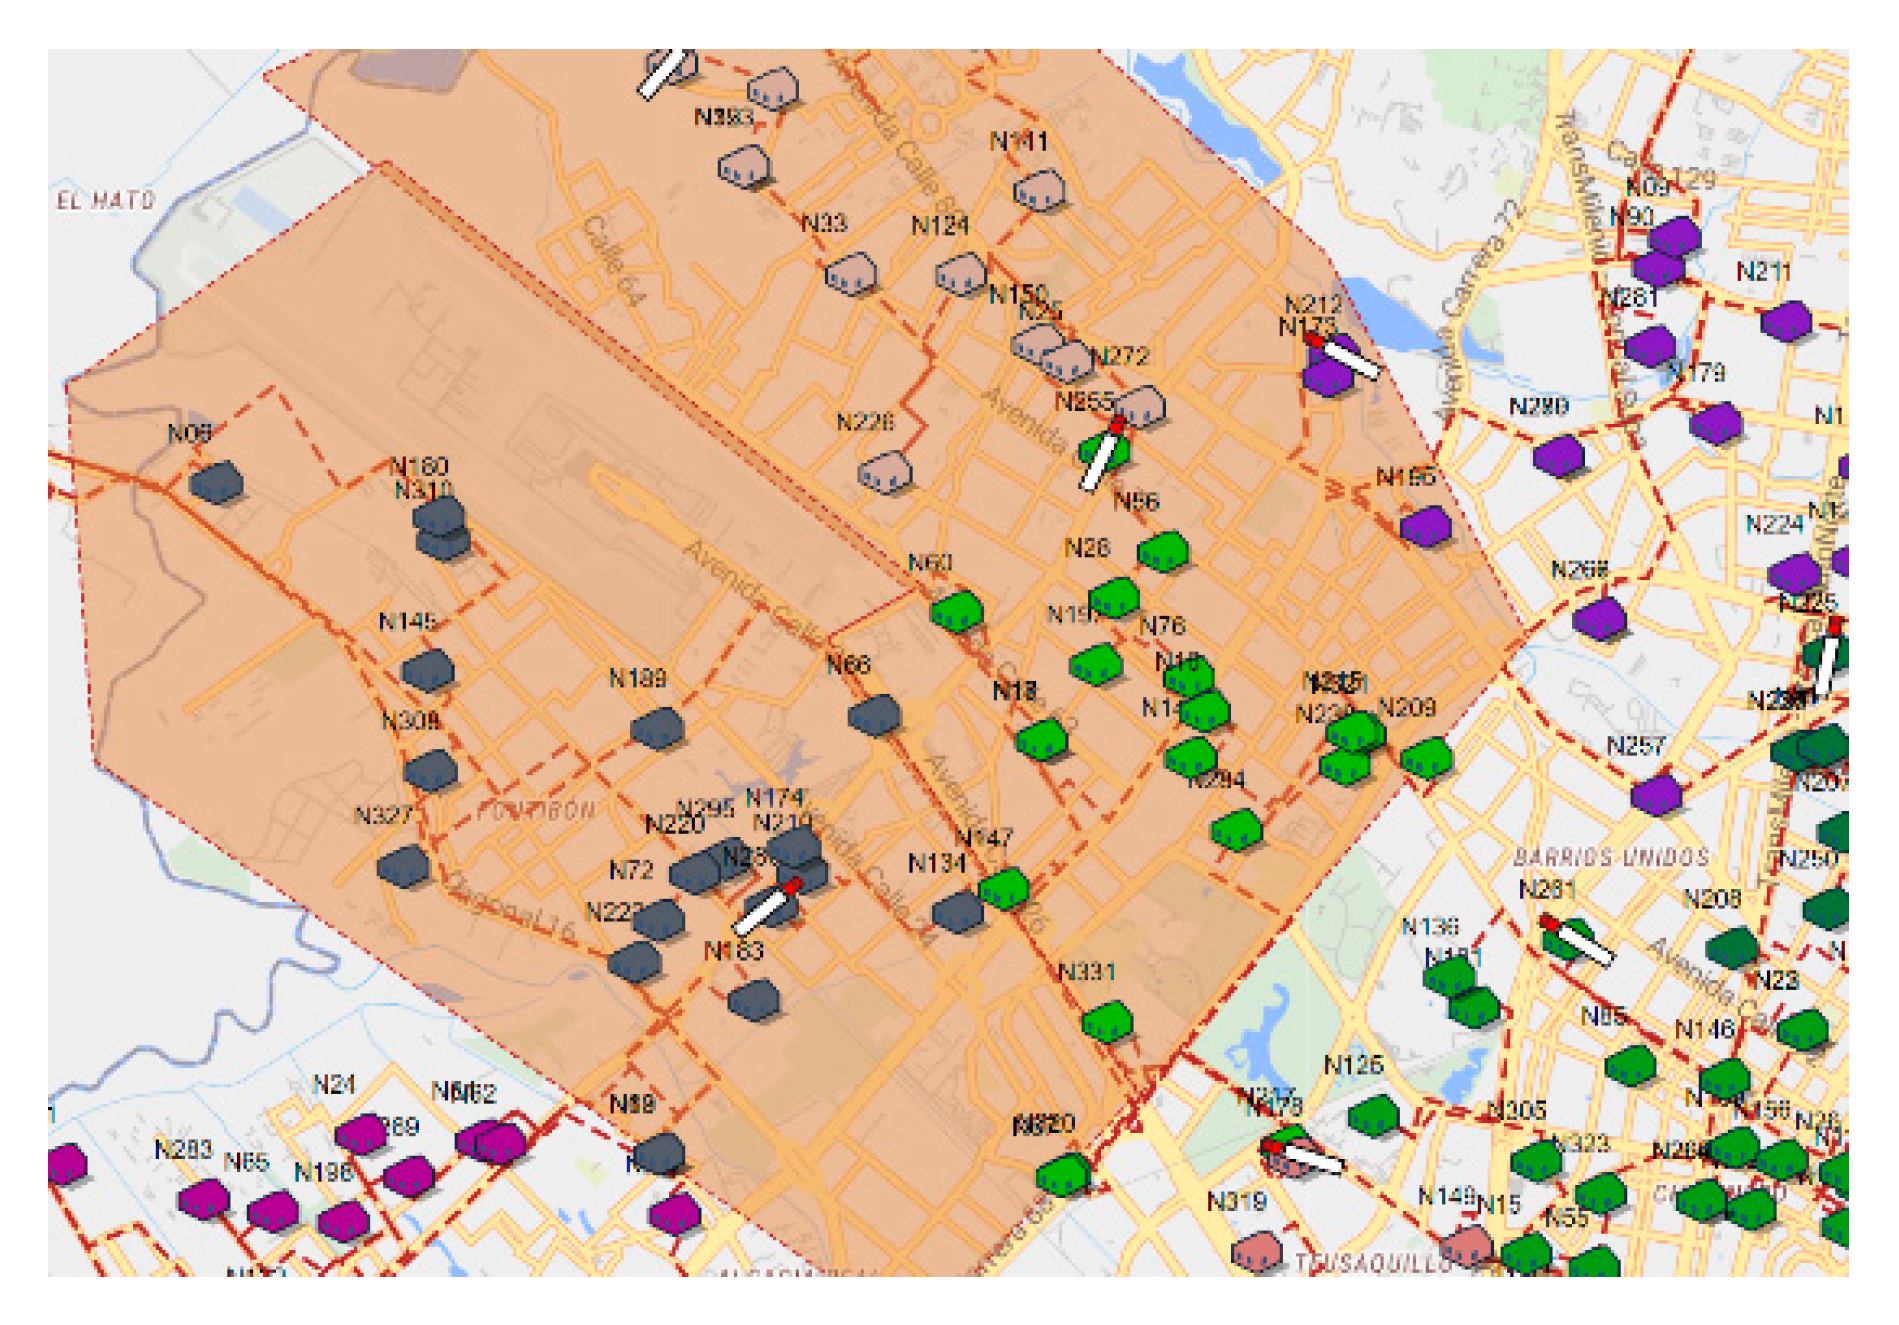
4.2. Steps 3–4: Modeling Simulation and Experiments

Clustering techniques [87,88] are used to assign vehicles to customers. In Bogota, there are some suburbs around the city where customers also make orders for goods. Thus, it is necessary to plan the number of resources to serve the demand of the whole city. An optimization model was applied to define the number of heterogeneous vehicles and the routes to fulfill the customers’ needs. This process is divided into three phases. Phase 1: We used a mixed-integer programming model to identify the number of vehicles. Phase 2: We allocated customers to vehicles. Once we knew the type and quantity of vehicles, an assignation model served to allocate customers to each vehicle. This step followed the K-means clustering, which allowed for determining the cluster centers for the number of vehicles. The clustering uses the Euclidean distance. Figure 5 shows the location of the customer in a cartesian plane. The color represents the assignation of the cluster.
Figure 6 shows the “centroids” of each district in order to perform the assignment to each corresponding customer. This allows for the configuring of a two-tier distribution strategy.
Most of the companies prefer to own/lease smaller vehicles due to traffic conditions and transport regulations. When analyzing the vehicle utilization for the available vehicles of the company under study, we can observe that there is a high rate of unutilized capacity for volume and weight (see Table 7). Time windows to complete the operation are entirely used in almost all cases.
To find the routing schedule, we used the formulation for the travel salesman problem for each of the vehicles. An additional process was undertaken to verify the model assumptions and that the route met the constraints in service and travel time. Table 8 shows the routes in google maps used to verify speeds, time, and routing directions for clusters of customers.
Once the vehicles were assigned to customers, Google Maps was used to locate the customers based on their geographical position (i.e., longitude and latitude). Capacity utilization in the categories of volume, weight, and time were met. Time windows and capacity were respected and optimized. One of the significant advantages of the simulation process is being able to verify the assumptions of the optimization model. We observed that some transportation managers leave time gaps to prevent delays due to unexpected events (e.g., accidents) in the execution. This is expected to be improved due to the experience of the operator in the field.
  • The parameters can be calibrated to the extent that the actual operation is compared with the results of the optimization and simulation models. Simulation assumptions and parameters to recreate the routes execution and the scheduling for each of the vehicles are:
  • Total service time depends on parking and delivery time. It varies depending on the type of customer (i.e., nanostore, townhouse, or building).
  • Time window per day (i.e., working journey) for deliveries: 600min
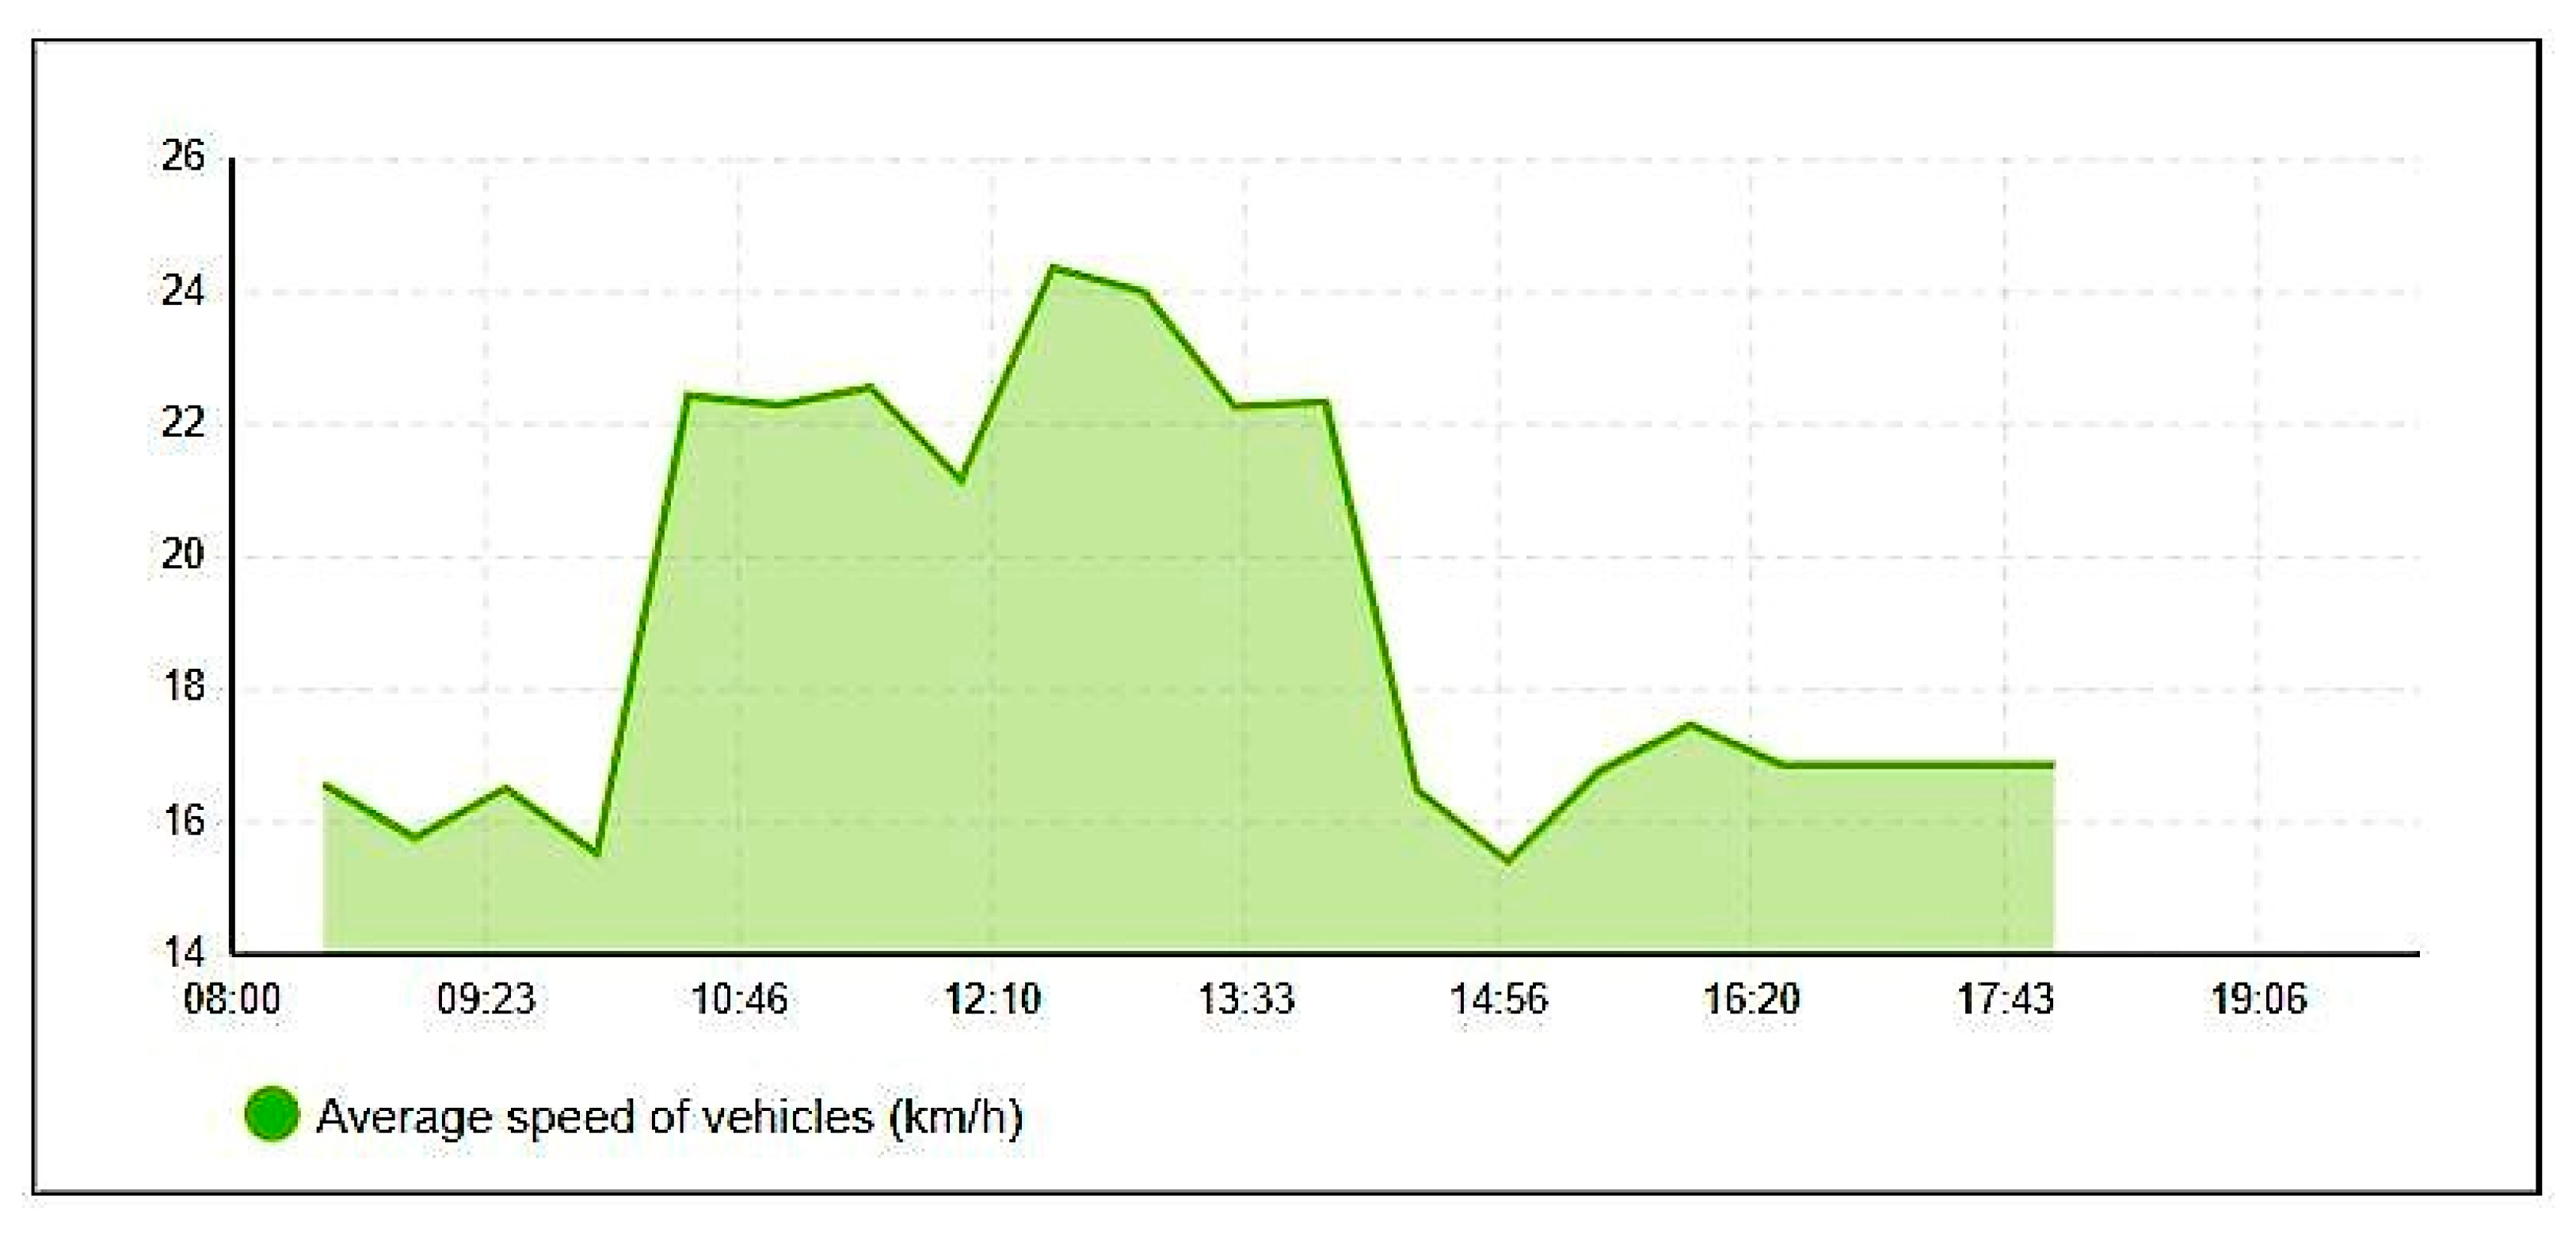
  • Vehicle velocity varies mainly depending on the city district (e.g., 30km/h for the valley hour in Engativa)
The vehicles already have an “optimal” route, which is set up with better knowledge of customers, vehicle operators, and is based on the city grid. However, due to the variability in speed and service times, it is necessary to simulate a set of potential outputs. Districts were defined with “urban metrics” [57], such as density, land use, complexity, road network, and cluster procedure.
An agent-based simulation model for last-mile delivery was built, where each stakeholder is an agent, to understand how the distribution is executed under particular city conditions. Since uncertainties in operator behavior, traffic, and parking time follow a stochastic behavior, the agent-based model is a valuable tool to simulate.
First, we created a population of customers with their parameters (see Table 9). For this simulation, we considered three types of customers: town houses, buildings, and nanostores (i.e., small, family-owned retailers). Data are given per customer: latitude and longitude, vehicle assigned, demand in weight, volume, and type of customer.
Table 10 depicts an example of the service and parking time (i.e., average and variability), depending on the kind of customer. These estimates are based on data collected by the company.
The agent “vehicle operator” is represented through a vehicle entity and is modeled as shown by Figure 7.
Simulation model schedules were generated to represent the change in velocity in the city due to the peak and valley hours. For example, for peak hours (from 6:00 h to 10:00 h and 15:00 h to 18:00 h), the average velocity oscillates between 14 km/h and 18 km/h, and from 10:00 h to 15:00 h the average speed is 22 km/h. Table 11 shows the velocity for each district. Customers and routes from optimization models and districts were placed on a map. Figure 8 shows two shaded areas (Engativa and Fontibon), each with their respective characteristics (i.e., traffic velocity, parking time).
Once all the steps are processed, it is possible to simulate an operation to solve the problem of efficient delivery of products in the city. Figure 8 depicts the animation of the daily delivery process. Each color represents a different vehicle. Red dash lines are the paths that are followed by each of the cars. With these paths, it is possible to know each vehicle’s directions to do the deliveries. Figure 9 depicts the average velocity of vehicles in the city.
The simulation allows for clarity to be gained of each vehicle’s schedule under the parameters and conditions fed into the model (e.g., traffic, service times). Table 12 depicts the time for vehicles in the district of Usaquén, showing the arrival and departure time and the service time (parking and delivery). The daily time window goes from 8:00 h to 18:00 h.
One of the advantages of the proposed methodology is the possibility to learn from daily operations. In Step 5, machine learning algorithms are presented and facilitate the system to accumulate experience from real distribution observed in the field. These results feed into the database from which predictions of future operations are made to support the decisions when data cannot be collected, or not available. Capitalizing on the simulation models created from Steps 3 and 4, behaviors of different stakeholders may be predicted [46]. Probability distributions included in the simulation models replicate the behaviors of stakeholders allowing predictions about how they will act in the deployment phase. Furthermore, data analytics and its applications will allow for an understanding of patterns, trends, and the prediction of demand [89].

4.3. Steps 5–6: Execution and Learning

The technique described by Nazari et al. [90] proposes a playground where the agents learn in a simulation setting. As it was shown in Figure 10, external conditions may affect the time of the delivery. Different circumstances were simulated to undertake trial and error tests and to learn from the assumptions and results. Once the decision maker has acknowledged different “emerging behaviors,” the same simulation setting may be used to test the outputs of the learning algorithms and explore their capability to be used by transportation managers. This part of the methodology may be extended to use deep reinforcement learning and numerical instances to test it [90,91]. The theoretical background can be found in [92,93].
A grid structure was proposed to allow the agent to adjust the path to the road conditions (e.g., traffic density, velocity, and flow) and learn by positive and negative rewards what the best path is. Next, an artificial neural network was trained to control the decisions to find routes in the city. As explained, once the assignation of resources is made, the problem becomes finding more efficient customer visiting sequences. It does this by learning a policy (i.e., actions) that decides the best route between one point to another or the sequence of visiting “nodes” in a geographical space based on the environment’s status. Deep reinforcement learning algorithms and their respective architecture can learn from simulations to support exploration and optimization.
Deliveries to nanostores are a common task in many cities. The transportation of goods is made from consumer-packaged goods (CPG), soft drinks, or brewery manufacturers and is an everyday logistics task. Customer demands are related to events or market seasons in the year and those are frequently delivered to the same locations.
The purpose of this example is to demonstrate how these companies, retailers, restaurants, and/or supermarkets can make use of learning procedures to improve their planning for the use of their delivery fleet and satisfy customer demands. In a city like Bogota, light trucks can deliver to approximately 50 to 100 nanostores per day [48]. Due to the proximity of them, it is estimated that 1500–2000 deliveries can be made to nanostores from CPG manufacturers or distributors.
We use deep reinforcement learning to handle problems where it is necessary to have quick and near-optimal solutions for the vehicle routing problem based on the external conditions. These algorithms are very convenient, especially when handling a large volume of customers. As it was discussed, the algorithm learns from the environment. For our purpose, geographical information was used to feed the network and demand distribution as dynamic information.
Once the algorithm is trained for the problem, the information is normalized to follow the network structure. Values between [0,1] allow for representing locations (i.e., cardinal coordinates). The normalization algorithm starts by creating a square grid by calculating the maximum and minimum values for latitude and longitude. The difference between these two values gives the domain and range. The algorithm used for training the vehicles to find the shortest delivery path follows a deep reinforcement learning trained policy. This approach does not need to calculate the distance matrix each time the routes need to be set. It is calculated based on the positive and negative rewards signals and the feasibility constraints in vehicles’ capacity. Also, it is not required to retrain for every new situation. The points can be migrated from a map into a chart (see Figure 11).
In this example, the VRP has two dynamic elements: vehicle capacity and customer demand. It is assumed that the vehicle operator can visit any customer to fully satisfy the requirement; however, this can be modified for split deliveries. The experiments were conducted on a PC Intel® Core™ i7-7700K CPU @ 4.20GHz CPU 4 cores eight threads with a GeForce GTX 1060 6GB/PCIe/SSE2 graphics card and 16 GB RAM. Operating System Ubuntu 18.04.2 LTS.
The test output provides a tour of the nodes to visit and features of the trip. Different snapshots were taken at various parts of the training to provide better visualization of the learning process. The training method for this experiment makes use of two neural networks. The first is the actor-network, used to predict the probability distribution over the following action at any given step, which reduces the problem of choosing a customer from a particular area. The second is the critic-network, which provides an estimated reward for any problem instance, which helps to make the best decision from the actor network’s distribution pool. Figure 12 depicts the average rewards for every 100 runs over ten epochs. The X axis represents the number of periods and Y axis the potential reward. One may observe that, after period 70, there are no big rewards that motivate swaps or exchanges in the model.
Figure 13 illustrates ten generations of training for a sample of 50 nodes. Several realizations were performed to serve all customers while minimizing costs and meeting all constraints. An acquisitive policy was used to produce the routes, producing non-optimal solutions. Of course, each of the solutions satisfies demands and proposes the use of fewer vehicles.
Figure 14 displays the best solution for each instance that was able to save up to 35% in assigning vehicles to serve all customers. Therefore, the combination of techniques from this framework provides promising results that should be fully investigated in other industries, geographies and circumstances.

5. Discussion and Future Research

The design and application of algorithms has become relevant in order to find alternatives to guide and support decision- and policymaking processes to solve the heavy traffic problem in large and mid-sized cities and to increase the life quality of citizens [94]. This work designs a methodology that identifies the interactions, behaviors, and importance of stakeholders. Likewise, it reinforces the legitimacy and transparency of the decision-making processes and shows how each analytical technique supports another to formulate long-term sustainable models to address the growing urban distribution. Some organizations are already considering carrying out this logistics planning for the delivery and collection of goods or materials, simultaneously. This system can support operations to bring products to customers and retrieve materials from them for reuse or disposal [95,96].
The United Nations agenda for sustainable development calls for the shared efforts of governments, private sector, academia and society to promote the principles of sustainability [97]. This work presents a precise methodology to use analytical techniques jointly and, from a business and city perspective, long-lasting competitive advantages and benefits are found for supply chain stakeholders and society. Our proposal presents a holistic integration of analytical techniques with the principles of sustainability in the strategic decision making of organizations that need undertake last-mile operations.
Our work presents an innovative architecture (see Figure 15 and Figure 16) for analytical decision making that can help transportation and logistics managers better plan and execute deliveries. The methodology considers characteristics of digitization, decentralization, and automation. The framework is application-driven and is built considering the challenges of retail fragmentation, poor infrastructure, and dynamic consumption patterns of megacities in emerging market economies. The framework is based on a combination of quantitative methods that allow for the gaining of knowledge on descriptive, predictive, and prescriptive approaches. The combination of techniques allows for the gaining of insights into current and future operations between the stakeholders and physical flow in the distribution process. With the learning procedures, we expect to adjust routes by responding to possible anomalies, changes in customer schedules, or traffic flow. Optimization modeling, combined with simulation and visualization technology, bring effective goods delivery and better decision making.
Our approach contributes to the scientific and practitioners’ community by considering learning processes to create effective, proactive distribution systems to achieve short- and long-term goals [93]. Making decisions regarding route selection with minimal destination times under a dynamic traffic environment is a daily challenge for delivery. The goal is to complete customer orders under traffic conditions and environment status. The data-driven methodology is designed to set up efficient routes and information about road traffic, city zones, and customer wait times, among other indicators [9].
The case study for urban logistics was able to bring an efficient solution to set up routes to deliver orders in the city. The methodology proves to be effective despite being data demanding, because it aims to help transportation managers support peak and valley delivery orders by initiating a way to define the correct combination of vehicle types together with the number of orders that each vehicle can carry. Most importantly, it brings a simulation learning methodology to improve the processes.
The proposed framework is actionable and provides a set of steps that are modular (see Figure 16). Most importantly, it combines the best of different approaches to gain a holistic perspective on tackling growing last-mile delivery operations, when customers and drivers continuously change their behavior and in environments where external data like traffic and weather are changing all the time. Last but not least, in the emerging world, the location of customers is a changing variable due to the continuous entry and exit of nano, micro and small businesses and due to the growing base of end consumers using electronic commerce (e-commerce). Therefore, e-commerce business to customer (B2C) and business to business (B2B) will become the next trend in most developing countries, as has already happened in China and India.
Citizens and city administrations struggle against traffic congestion, air pollution, and noise, due to the increasing number of delivery vehicles, as well as the emissions they generate and the space they occupy in parking when there is no adequate infrastructure. All these factors generate even more urban challenges. Several studies have revealed that, if public interventions are not carried out, traffic in city centers, for example, will be seriously disturbed in the coming years. New technologies are emerging, such as droids and drones and the trend in research is focusing on how to make their use efficient [98,99,100]. Simulation tools along with congestion prediction, using IoT and machine learning [101,102], that take these technologies into account, create the basis for generating player strategy discussions through a solid fact base, in order to foster public–private partnerships and accelerate the development and implementation of effective interventions in a city’s logistics [103]. So, it is important to create roadmaps for last-mile ecosystems [100,104].
One of the main barriers to implementing closed-loop supply chains and circular economy practices is the big opportunities that still prevail in reverse logistics. Finding best practices for collecting recyclable materials is imperative for industries that want to benefit from reusing materials in their own processes or to generate profits [95,105]. Thus, research is being carried out on how to optimize the collection of materials, for example, with e-commerce takeback models. Research have been conducted where logistics for first-mile operations, such as collecting material, is joined with the logistics of the last-mile operation where products should be delivered. Also known as pick-up and delivery problems [106] but, in this case, with emphasis on the pickup of materials to be reused and delivery of any products (see Figure 17).
It is expected that future research will continue to delve into the demonstration of how these practices can reduce urban traffic and have an impact on reducing emissions by completing the two operations simultaneously [107]. Likewise, as demonstrated in this research, the use of assets is increased and the operating costs of the fleet of vehicles available in organizations can be reduced. Therefore, a potential extension of this research might include a careful incorporation of a circular economy as a module in our proposed framework.
Lastly, the methodology makes use of stakeholder behavior patterns. Allowing a better decision-making process and modifying routes ahead of time increases the possibility of meeting the demand within the customer time window. Additionally, these patterns are combined with the knowledge of traffic conditions that may be extended and further investigated in different cities across the world. Furthermore, it was possible to propose suboptimal policies for the Dynamic Vehicle Routing Problem (DVRP), which many industries face worldwide.

6. Conclusions

This research proposes a generic system that integrates metrics, various decision levels, multiple stakeholders, and supplementary techniques for last-mile operations. Complex interactions and dynamic behaviors among various stakeholders are presented. The evolution of purchasing patterns is more dependent on a set of features related to urbanization, socioeconomic changes, accessibility, and retailing footprint and not just technology. These characteristics may affect the performance of planning and execution of urban distribution strategies.
Improving operational efficiency is an opportunity for companies facing commercial business to business (B2B) and business to customer (B2C) delivery to compete against large logistics multinationals and improve customer service levels, especially in emerging market economies. The area of last-mile delivery planning has gained traction because of customer expectations to receive fast and reliable service. Typical problems in vehicle routing are random customer requests and demands and the presence of a high uncertainty due to diverse factors such as traffic jams or as simple as the availability of the budget of the nanostore owner when delivering an order. High-quality solutions can be found by accounting for these random occurrences when operational planning is being carried out or by incorporating changes to the plans while vehicles are on their route to minimize unsuccessful visits, returns and many other undesired consequences. Changing plans while operating can yield a significant amount of information, but it may not reach optimum efficiency. The use of simulations can help successfully anticipate unexpected problems in vehicle routing to tackle them early on. Offline simulations can assist in optimizing vehicle routing operations.
The last-mile delivery research community has been working on better algorithms to solve operational issues using different kinds of techniques, from mathematical programming to simple heuristics. However, there is a lack of a unified methodology to build a software architecture, where different approaches can be used in a synchronized form and help to build a holistic understanding and adaptative strategies according to observed circumstances.
Our main goal is to present the architecture of a system that allows us to achieve its execution in a sustainable, environmental, and operational manner, addressing the three dimensions of sustainability. This allows us to gain knowledge from environmental and non-environmental externalities, generating better logistics practices and designing public policies. Our methodology allows to generate an analysis of the performance and delivery practices in last-mile logistics, quantifying the impacts that the different stakeholders have.
Our solution is a fundamental tool focused on the market of those organizations that are committed to creating integral logistics systems, i.e., including reverse logistics as a circular economy strategy [108,109]. Those companies focus on the process of returning consumer goods for replacement, renewal, recycling, redistribution, or clean disposal. Organizations will benefit from a platform that allows logistics operations to be carried out more efficiently and less costly. The implementation of an affordable solution for those companies that want to improve their sustainability practices can be found in our methodology: a decision support system for all their logistics operations along with sustainability practices to create efficient, closed-loop supply chains.
The data-driven methodology is made up of analytical tools that perform tasks in different steps for logistics operations [110]. Those tasks are broken down in descriptive, predictive, and prescriptive methods. Sustainable practices can be achieved when the continuous improvement is put in place in a rigoristic manner. The digital twin of the entire operation allows for the simulation of how the logistics operations (forward or reverse) will be executed to plan and follow up on possible disturbances [111]. Likewise, our system allows us to learn about the experience with machine learning algorithms. All this is supported with visualization tools or dashboards for each of the actors that use the tool. Thus, we use advanced analytical technology together with the best logistics practices to provide a solid and sustainable solution.
This methodology aims to support decisions, detect problems via an early warning system, and adjust last-mile operations depending on the circumstances. These decisions are fed with conditions and behavior patterns from vehicle operators, customers, location, traffic, and weather. However, the proposal to feed real-time data or high-quality data does not only come from emerging technology but also from model-driven decision making. Also, the possibility to predict future scenarios and plan strategies for the most likely situations is introduced. This will help determine and support the accurate calculation of the performance indicators.
Additionally, the methodology is designed to consider current and future system performance to improve the use of algorithms and be able, through a feedback learning process, to learn from past behaviors to deliver last-mile insights and an intelligent warning and execution tool for managers, analysts, and customers. This feedback step works as a “learning from experience” method. During and after the operation, current KPIs are compared with the desired KPIs, and the system should be able to adopt the best practices for future executions. The proposed architecture aims to support real-time decisions to respond to unforeseen events in the delivery steps. The system’s main outputs should be an intelligent early warning mechanism for managers and customers, when given a set of the leading causes for the delay on the delivery.
The outcomes support vehicles’ management, and it is possible to make adjustments such as re-routing and delivery re-scheduling. Furthermore, due to the schedule of a customer and/or the fact that the traffic can change for unpredicted reasons, there is the possibility of a difference between the planned delivery routes and the execution, which is why the use of technology is being proposed to dynamically adjust the routes to respond efficiently to these possible events. This methodology can help to alleviate traffic problems in cities due to better efficiency in the operations. It is also possible to predict financial, social, environmental, and economic impacts in a city’s logistics providing information related to the trade-offs between stakeholders’ behaviors.
Despite this conceptual framework still needing to be applied in several circumstances, adapted, and extended, its modular design allows researchers, policymakers, and practitioners to find a common ground to feed data and get value. Given the new tendency to synchronize digital technologies’ penetration without compromising the network reliability and effectiveness, the necessity of a data interrelation between private and public stakeholders enables it to integrate operations and planning systems in a modular, flexible, and scalable fashion. This conceptual design aims to integrate analytics and semantic models, to overcome information siloes, and enable interaction and understanding between them.

Author Contributions

Conceptualization, Investigation, Methodology, Writing of the Original Draft, Software, E.G.-F.; Review, Editing, Supervision, Funding Acquisition, Project Administration, L.R.; Writing, Reviewing, Editing, Investigation, C.M.-A.; L.R. All authors have read and agreed to the published version of the manuscript.

Funding

This research was funded by National Science Foundation under award no. 2012228.

Institutional Review Board Statement

Not applicable.

Informed Consent Statement

Not applicable.

Acknowledgments

This material is partially based upon work supported by the National Science Foundation under award no. 2012228 and Scholarship (E.G) Fulbright Colombia.

Conflicts of Interest

The authors declare no conflict of interest. The funders had no role in the design of the study, in the collection, analyses, or interpretation of data, in the writing of the manuscript, or in the decision to publish the results.

References

  1. Joselow, M. Delivery Vehicles Increasingly Choke Cities with Pollution. Available online: https://www.scientificamerican.com/article/delivery-vehicles-increasingly-choke-cities-with-pollution/ (accessed on 13 March 2021).
  2. Ritchie, H. Cars, Planes, Trains: Where Do CO2 Emissions from Transport Come from? Available online: https://ourworldindata.org/co2-emissions-from-transport (accessed on 13 March 2021).
  3. Lim, S.F.W.; Jin, X.; Srai, J.S. Consumer-driven e-commerce. Int. J. Phys. Distrib. Logist. Manag. 2018, 48, 308–332. [Google Scholar] [CrossRef] [Green Version]
  4. Wygonik, E.; Goodchild, A.V. Urban form and last-mile goods movement: Factors affecting vehicle miles travelled and emissions. Transp. Res. Part D Transp. Environ. 2018, 61, 217–229. [Google Scholar] [CrossRef]
  5. Nenni, M.E.; Sforza, A.; Sterle, C. Sustainability-based review of urban freight models. Soft Comput. 2019, 23, 2899–2909. [Google Scholar] [CrossRef]
  6. Visser, J.; Nemoto, T.; Browne, M. Home Delivery and the Impacts on Urban Freight Transport: A Review. Procedia Soc. Behav. Sci. 2014, 125, 15–27. [Google Scholar] [CrossRef] [Green Version]
  7. Transport and Environment. Transport Climate Targets and the Paris Agreement Transport & Environment. Available online: https://www.transportenvironment.org/what-we-do/transport-climate-targets-and-paris-agreement (accessed on 31 January 2021).
  8. Anand, N.; Quak, H.; van Duin, R.; Tavasszy, L. City Logistics Modeling Efforts: Trends and Gaps—A Review. Procedia Soc. Behav. Sci. 2012, 39, 101–115. [Google Scholar] [CrossRef] [Green Version]
  9. Kim, G.; Ong, Y.-S.; Heng, C.K.; Tan, P.S.; Zhang, N.A. City Vehicle Routing Problem (City VRP): A Review. IEEE Trans. Intell. Transp. Syst. 2015, 16, 1654–1666. [Google Scholar] [CrossRef]
  10. Zenezini, G.; van Duin, R.; Tavasszy, L.; Marco, A.D. Stakeholders’ Roles for Business Modelling in a City Logistics Ecosystem: Towards a Conceptual Model. In Proceedings of the 10th International Conference on City Logistics, Phuket Island, Thailand, 14–16 June 2017; pp. 344–358. [Google Scholar]
  11. Allen, J.; Piecyk, M.; Piotrowska, M.; McLeod, F.; Cherrett, T.; Ghali, K.; Nguyen, T.; Bektas, T.; Bates, O.; Friday, A.; et al. Understanding the impact of e-commerce on last-mile light goods vehicle activity in urban areas: The case of London. Transp. Res. Part D Transp. Environ. 2018, 61, 325–338. [Google Scholar] [CrossRef] [Green Version]
  12. Bjerkan, K.Y.; Bjørgen, A.; Hjelkrem, O.A. E-commerce and prevalence of last mile practices. Transp. Res. Procedia 2020, 46, 293–300. [Google Scholar] [CrossRef]
  13. National Retail Federation. Monthly Economic Review: October 2016. Available online: https://nrf.com/research/monthly-economic-review-october. (accessed on 14 March 2021).
  14. Millar, M. Challenges of the Last Mile Delivery in Serving E-Commerce Business. Available online: https://www.koganpage.com/article/challenges-of-the-last-mile-delivery-in-serving-e-commerce-business (accessed on 13 March 2021).
  15. Mangiaracina, R.; Perego, A.; Seghezzi, A.; Tumino, A. Innovative solutions to increase last-mile delivery efficiency in B2C e-commerce: A literature review. Int. J. Phys. Distrib. Logist. Manag. 2019, 49, 901–920. [Google Scholar] [CrossRef]
  16. Boyer, K.K.; Prud’Homme, A.M.; Chung, W. The last mile challenge: Evaluating the effects of customer density and delivery window patterns. J. Bus. Logist. 2009, 30, 185–201. [Google Scholar] [CrossRef]
  17. Farber, M. Consumers Are Now Doing Most of Their Shopping Online. Available online: https://fortune.com/2016/06/08/online-shopping-increases/ (accessed on 13 March 2021).
  18. Roca-Riu, M.; Estrada, M.; Fernández, E. An Evaluation of Urban Consolidation Centers Through Continuous Analysis with Non-equal Market Share Companies. Transp. Res. Procedia 2016, 12, 370–382. [Google Scholar] [CrossRef] [Green Version]
  19. Janjevic, M.; Knoppen, D.; Winkenbach, M. Integrated decision-making framework for urban freight logistics policy-making. Transp. Res. Part D Transp. Environ. 2019, 72, 333–357. [Google Scholar] [CrossRef]
  20. Taniguchi, E.; Thompson, R.G.; Yamada, T. Emerging Techniques for Enhancing the Practical Application of City Logistics Models. Procedia Soc. Behav. Sci. 2012, 39, 3–18. [Google Scholar] [CrossRef] [Green Version]
  21. Macharis, C.; Milan, L.; Verlinde, S. A stakeholder-based multicriteria evaluation framework for city distribution. Res. Transp. Bus. Manag. 2014, 11, 75–84. [Google Scholar] [CrossRef]
  22. Van Heeswijk, W.J.A.; Mes, M.R.K.; Schutten, J.M.J.; Zijm, W.H.M. Evaluating Urban Logistics Schemes Using Agent-based Simulation. Transp. Sci. 2020, 54, 651–675. [Google Scholar] [CrossRef]
  23. Janjevic, M.; Winkenbach, M. Characterizing urban last-mile distribution strategies in mature and emerging e-commerce markets. Transp. Res. Part A Policy Pract. 2020, 133, 164–196. [Google Scholar] [CrossRef]
  24. Prahalad, C.K.; Hart, S.L. The fortune at the bottom of the pyramid. Revista Eletrônica de Estratégia Negócios 2010, 1, 1–23. [Google Scholar] [CrossRef] [Green Version]
  25. Schmidt, A. A Look at the Courier Service Industry in the United States. Available online: https://marketrealist.com/2015/07/look-courier-service-industry-united-states/ (accessed on 13 March 2021).
  26. Joerss, M.; Schröder, J.; Neuhaus, F. Parcel Delivery: The Future of Last Mile–Urbanism Next. Available online: https://www.urbanismnext.org/resources/parcel-delivery-the-future-of-last-mile (accessed on 14 March 2021).
  27. Tolle, K.; Tansley, S.; Hey, A.J.G. The Fourth Paradigm: Data-Intensive Scientific Discovery. Proc. IEEE 2011, 99, 1334–1337. [Google Scholar] [CrossRef] [Green Version]
  28. Brynjolfsson, E.; Hitt, L.M.; Kim, H.H. Strength in Numbers: How Does Data-Driven Decisionmaking Affect Firm Performance? SSRN Scholarly Paper ID 1819486; Social Science Research Network: Rochester, NY, USA, 2011. [Google Scholar] [CrossRef]
  29. Kin, B.; Verlinde, S.; Macharis, C. Sustainable urban freight transport in megacities in emerging markets. Sustain. Cities Soc. 2017, 32, 31–41. [Google Scholar] [CrossRef]
  30. Velásquez, J.; Saldaña, C.; Gutierrez-Franco, E.; Gakis, K.; Pardalos, P. A Mathematical Programing Model for Regional Planning Incorporating Economics, Logistics, Infrastructure and Land Use. In Network Design and Optimization for Smart Cities; World Scientific: Singapore, 2017; pp. 1–31. [Google Scholar] [CrossRef] [Green Version]
  31. de la Torre, R.; Corlu, C.; Faulin, J.; Onggo, B.; Juan, A. Simulation, Optimization, and Machine Learning in Sustainable Transportation Systems: Models and Applications. Sustainability 2021, 13, 1551. [Google Scholar] [CrossRef]
  32. Onggo, B.S.; Corlu, C.G.; Juan, A.A.; Monks, T.; de la Torre, R. Combining symbiotic simulation systems with enterprise data storage systems for real-time decision-making. Enterp. Inf. Syst. 2021, 15, 230–247. [Google Scholar] [CrossRef]
  33. Mustafee, N.; Harper, A.; Onggo, B.S. Hybrid Modelling and Simulation (M&S): Driving Innovation in the Theory and Practice of M&S. In Proceedings of the 2020 Winter Simulation Conference (WSC), Orlando, FL, USA, 14–18 December 2020; pp. 3140–3151. [Google Scholar]
  34. Liu, X.; Gao, L.; Ni, A.; Ye, N. Understanding Better the Influential Factors of Commuters’ Multi-Day Travel Behavior: Evidence from Shanghai, China. Sustainability 2020, 12, 376. [Google Scholar] [CrossRef] [Green Version]
  35. Dekker, R.; Bloemhof, J.; Mallidis, I. Operations Research for green logistics–An overview of aspects, issues, contributions and challenges. Eur. J. Oper. Res. 2012, 219, 671–679. [Google Scholar] [CrossRef] [Green Version]
  36. Lin, C.; Choy, K.; Ho, G.; Chung, S.; Lam, H. Survey of Green Vehicle Routing Problem: Past and future trends. Expert Syst. Appl. 2014, 41, 1118–1138. [Google Scholar] [CrossRef]
  37. Snoeck, A.; Winkenbach, M. A Discrete Simulation-Based Optimization Algorithm for the Design of Highly Responsive Last-Mile Distribution Networks; Working Paper; Massachusetts Institute of Technology: Cambridge, MA, USA, 2020. [Google Scholar]
  38. Crainic, T.G.; Ricciardi, N.; Storchi, G. Models for Evaluating and Planning City Logistics Systems. Transp. Sci. 2009, 43, 432–454. [Google Scholar] [CrossRef] [Green Version]
  39. Rabe, M.; Goldsman, D. Decision Making Using Simulation Methods in Sustainable Transportation. In Sustainable Transportation and Smart Logistics; Elsevier BV: Amsterdam, The Netherlands, 2019; pp. 305–333. [Google Scholar]
  40. Cortes, E.; Rabelo, L.; Sarmiento, A.T.; Gutierrez, E. Design of Distributed Discrete-Event Simulation Systems Using Deep Belief Networks. Information 2020, 11, 467. [Google Scholar] [CrossRef]
  41. Hoberg, K.; Fransoo, J.; Leopold, H.; Henrietta von, E.-W. Next Generation Supply Chain Planning Is as Much about People and Processes as It Is about Technology. Available online: https://www.linkedin.com/pulse/next-generation-supply-chain-planning-much-people-jan-fransoo/ (accessed on 12 March 2021).
  42. Karakikes, I.; Nathanail, E. Simulation Techniques for Evaluating Smart Logistics Solutions for Sustainable Urban Distribution. Procedia Eng. 2017, 178, 569–578. [Google Scholar] [CrossRef]
  43. Nathanail, E.; Adamos, G.; Gogas, M. A novel approach for assessing sustainable city logistics. Transp. Res. Procedia 2017, 25, 1036–1045. [Google Scholar] [CrossRef]
  44. Gonzalez-Feliu, J.; Morana, J. Are City Logistics Solutions Sustainable? The Case of Cityporto. TeMA J. Land Use Mobil. Environ. 2010, 3, 29–37. [Google Scholar] [CrossRef]
  45. Giaglis, G.; Minis, I.; Tatarakis, A.; Zeimpekis, V. Minimizing logistics risk through real-time vehicle routing and mobile technologies. Int. J. Phys. Distrib. Logist. Manag. 2004, 34, 749–764. [Google Scholar] [CrossRef] [Green Version]
  46. Gutierrez, E. A Methodology for Data-Driven Decision-Making in Last Mile Delivery Operations. Ph.D. Thesis, University of Central Florida, Orlando, FL, USA, 2019. [Google Scholar]
  47. Garza Ramírez, J. Distribution Strategies in Emerging Markets: Case Studies in Latin America. Ph.D. Thesis, Massachusetts Institute of Technology, Cambridge, MA, USA, 2011. [Google Scholar]
  48. Fransoo, J.C.; Blanco, E.E.; Mejia-Argueta, C. Reaching 50 Million Nanostores: Retail Distribution in Emerging Megacities; CreateSpace Independent Publishing Platform: Scotts Valley, CA, USA, 2017. [Google Scholar]
  49. Diaz, A.; Lacayo, J.A.; Salcedo, L. Cómo Vender a Las Tiendas de Barrio En América Latina; The McKinsey Quarterly: Seattle, WA, USA, 2007; pp. 81–93. [Google Scholar]
  50. Raman, A.; DeHoratius, N.; Ton, Z. Execution: The Missing Link in Retail Operations. Calif. Manag. Rev. 2001, 43, 136–152. [Google Scholar] [CrossRef]
  51. Mahmassani, H.S. (Ed.) Transportation and Traffic Theory: Flow, Dynamics and Human Interaction, Illustrated Edition; Emerald Publishing: Amsterdam, The Netherlands, 2005. [Google Scholar]
  52. Pillac, V.; Gendreau, M.; Guéret, C.; Medaglia, A. A review of dynamic vehicle routing problems. Eur. J. Oper. Res. 2013, 225, 1–11. [Google Scholar] [CrossRef] [Green Version]
  53. Toth, P.; Vigo, D. (Eds.) Vehicle Routing: Problems, Methods, and Applications, 2nd ed.; MOS-SIAM Series on Optimization; Society for Industrial and Applied Mathematics; Mathematical Optimization Society: Philadelphia, PA, USA, 2014. [Google Scholar]
  54. Nagy, G.; Salhi, S. Location-routing: Issues, models and methods. Eur. J. Oper. Res. 2007, 177, 649–672. [Google Scholar] [CrossRef] [Green Version]
  55. Prodhon, C.; Prins, C. A survey of recent research on location-routing problems. Eur. J. Oper. Res. 2014, 238, 1–17. [Google Scholar] [CrossRef]
  56. Winkenbach, M. Remapping the Last Mile of the Urban Supply Chain. Available online: https://0-sloanreview-mit-edu.brum.beds.ac.uk/article/remapping-the-last-mile-of-the-urban-supply-chain/ (accessed on 13 March 2021).
  57. Merchan, D.; Blanco, E.; Winkenbach, M. Transshipment Networks for Last-Mile Delivery in Congested Urban Areas; Logistics and Supply Chain: Bordeaux, France, 2016. [Google Scholar]
  58. Anand, N.; Van Duin, J.R.; Tavasszy, L. Framework for Modelling Multi-stakeholder City Logistics Domain Using the Agent based Modelling Approach. Transp. Res. Procedia 2016, 16, 4–15. [Google Scholar] [CrossRef] [Green Version]
  59. Jayakrishnan, R.; Mahmassani, H.S.; Hu, T.-Y. An evaluation tool for advanced traffic information and management systems in urban networks. Transp. Res. Part C Emerg. Technol. 1994, 2, 129–147. [Google Scholar] [CrossRef]
  60. Yang, J.; Jaillet, P.; Mahmassani, H. Real-Time Multivehicle Truckload Pickup and Delivery Problems. Transp. Sci. 2004, 38, 135–148. [Google Scholar] [CrossRef] [Green Version]
  61. Alho, A.R.; Silva, J.D.A.E.; de Sousa, J.P.; Blanco, E. Improving mobility by optimizing the number, location and usage of loading/unloading bays for urban freight vehicles. Transp. Res. Part D Transp. Environ. 2018, 61, 3–18. [Google Scholar] [CrossRef]
  62. Chiara, G.D.; Cheah, L.; Azevedo, C.L.; Ben-Akiva, M.E. A Policy-Sensitive Model of Parking Choice for Commercial Vehicles in Urban Areas. Transp. Sci. 2020, 54, 606–630. [Google Scholar] [CrossRef]
  63. Nwoye, C.; Agu, M.; Ogbuokiri, B. Enhancing Courier Service with the Development of an Interactive Mobile App in Android Platform. IOSR J. Mob. Comput. Appl. 2015, 2, 56–61. [Google Scholar] [CrossRef]
  64. Tounsi, B.; Hayel, Y.; Quadri, D.; Brotcorne, L. Mathematical Programming with Stochastic Equilibrium Constraints applied to Optimal Last-mile Delivery Services. Electron. Notes Discret. Math. 2016, 52, 5–12. [Google Scholar] [CrossRef] [Green Version]
  65. Reyes, D.; Savelsbergh, M.; Toriello, A. Vehicle routing with roaming delivery locations. Transp. Res. Part C Emerg. Technol. 2017, 80, 71–91. [Google Scholar] [CrossRef]
  66. Taniguchi, E.; Thompson, R.G. Modeling City Logistics. Transp. Res. Rec. J. Transp. Res. Board 2002, 1790, 45–51. [Google Scholar] [CrossRef]
  67. Hesse, M. City Logistics: Network Modelling and Intelligent Transport Systems. J. Transp. Geogr. 2002, 10, 158–159. [Google Scholar] [CrossRef]
  68. Rathore, M.M.; Ahmad, A.; Paul, A.; Rho, S. Urban planning and building smart cities based on the Internet of Things using Big Data analytics. Comput. Netw. 2016, 101, 63–80. [Google Scholar] [CrossRef]
  69. Ye, B.; Zuo, J.; Zhao, X.; Luo, L. Research on the Express Delivery Delay Prediction Based on Neural Network in the Background of Big Data; Atlantis Press: Basingstoke, UK, 2016; pp. 1449–1454. [Google Scholar]
  70. Chen, C.P.; Zhang, C.-Y. Data-intensive applications, challenges, techniques and technologies: A survey on Big Data. Inf. Sci. 2014, 275, 314–347. [Google Scholar] [CrossRef]
  71. Rabelo, L.; Bhide, S.; Gutierrez, E. Artificial Intelligence: Advances in Research and Applications; Nova Science Publishers: New York, NY, USA; Available online: https://novapublishers.com/shop/artificial-intelligence-advances-in-research-and-applications/ (accessed on 14 March 2021).
  72. Toledo, T.; Koutsopoulos, H.N.; Ben-Akiva, M. Integrated driving behavior modeling. Transp. Res. Part C Emerg. Technol. 2007, 15, 96–112. [Google Scholar] [CrossRef]
  73. Gmira, M.; Gendreau, M.; Lodi, A.; Potvin, J.-Y. Travel speed prediction based on learning methods for home delivery. EURO J. Transp. Logist. 2020, 9, 100006. [Google Scholar] [CrossRef]
  74. Gheysens, F.; Golden, B.; Assad, A. A comparison of techniques for solving the fleet size and mix vehicle routing problem. OR Spectr. 1984, 6, 207–216. [Google Scholar] [CrossRef]
  75. Karaoglan, I.; Altiparmak, F.; Kara, I.; Dengiz, B. Vehicle Routing Problem with Simultaneous Pickup and Delivery: Mixed Integer Programming Formulations and Comparative Analyses. Technical Report. Available online: https://www.researchgate.net/profile/Imdat-Kara/publication/268015675_Technical_Report_Vehicle_Routing_Problem_with_Simultaneous_Pickup_and_Delivery_Mixed_Integer_Programming_Formulations_and_Comparative_Analyses/links/546f4ea60cf2d67fc0310b42/Technical-Report-Vehicle-Routing-Problem-with-Simultaneous-Pickup-and-Delivery-Mixed-Integer-Programming-Formulations-and-Comparative-Analyses.pdf (accessed on 12 March 2021).
  76. Di, Z.; Yang, L.; Wang, L.; Qi, J. A Robust Network Design Problem Based on the Spatiotemporal Attributes of Activities. IEEE Trans. Intell. Transp. Syst. 2020, 21, 4294–4307. [Google Scholar] [CrossRef]
  77. Dondo, R.; Cerdá, J. A cluster-based optimization approach for the multi-depot heterogeneous fleet vehicle routing problem with time windows. Eur. J. Oper. Res. 2007, 176, 1478–1507. [Google Scholar] [CrossRef]
  78. Tilk, C.; Olkis, K.; Irnich, S. The Last-Mile Vehicle Routing Problem with Delivery Options; Working Paper; Gutenberg School of Management and Economics, Johannes Gutenberg-Universität Mainz: Mainz, Germany, 2020. [Google Scholar]
  79. Van Woensel, T.; Kerbache, L.; Peremans, H.; Vandaele, N. Vehicle routing with dynamic travel times: A queueing approach. Eur. J. Oper. Res. 2008, 186, 990–1007. [Google Scholar] [CrossRef]
  80. Susilawati, S.; Taylor, M.A.P.; Somenahalli, S.V.C. Distributions of travel time variability on urban roads. J. Adv. Transp. 2013, 47, 720–736. [Google Scholar] [CrossRef]
  81. Errico, F.; Desaulniers, G.; Gendreau, M.; Rei, W.; Rousseau, L.-M. A priori optimization with recourse for the vehicle routing problem with hard time windows and stochastic service times. Eur. J. Oper. Res. 2016, 249, 55–66. [Google Scholar] [CrossRef]
  82. Souyris, S.; Cortés, C.E.; Ordóñez, F.; Weintraub, A. A Robust Optimization Approach to Dispatching Technicians under Stochastic Service Times; SpringerLink: Berlin, Germany; Available online: https://0-link-springer-com.brum.beds.ac.uk/article/10.1007%2Fs11590-012-0557-6 (accessed on 13 March 2021).
  83. Erera, A.L.; Savelsbergh, M.W.P. ROUTE 2007: Recent advances in vehicle routing optimization. Networks 2009, 54, 165–166. [Google Scholar] [CrossRef]
  84. Secomandi, N. Comparing neuro-dynamic programming algorithms for the vehicle routing problem with stochastic demands. Comput. Oper. Res. 2000, 27, 1201–1225. [Google Scholar] [CrossRef]
  85. Vinsensius, A.; Wang, Y.; Chew, E.P.; Lee, L.H. Dynamic Incentive Mechanism for Delivery Slot Management in E-Commerce Attended Home Delivery. Transp. Sci. 2020, 54, 567–587. [Google Scholar] [CrossRef]
  86. Akbar, P.; Duranton, G. Measuring the Cost of Congestion in Highly Congested City: Bogotá; Working Paper; CAF: Buenos Aires, Argentina, 2017. [Google Scholar]
  87. Ducret, R.; Lemarié, B.; Roset, A. Cluster Analysis and Spatial Modeling for Urban Freight. Identifying Homogeneous Urban Zones Based on Urban Form and Logistics Characteristics. Transp. Res. Procedia 2016, 12, 301–313. [Google Scholar] [CrossRef] [Green Version]
  88. Bertsimas, D.; Dunn, J.W. Optimal classification trees. Mach. Learn. 2017, 106, 1039–1082. [Google Scholar] [CrossRef]
  89. Seyedan, M.; Mafakheri, F. Predictive big data analytics for supply chain demand forecasting: Methods, applications, and research opportunities. J. Big Data 2020, 7, 1–22. [Google Scholar] [CrossRef]
  90. Nazari, M.; Oroojlooy, A.; Snyder, L.V.; Takáč, M. Reinforcement Learning for Solving the Vehicle Routing Problem. arXiv 2018, arXiv:1802.04240. [Google Scholar]
  91. Nazari, R. OptMLGroup/VRP-RL; Optimization and Machine Learning Group @ Lehigh. GitHub Library. 2021. Available online: https://github.com/OptMLGroup/VRP-RL (accessed on 5 January 2021).
  92. Veres, M.; Moussa, M. Deep Learning for Intelligent Transportation Systems: A Survey of Emerging Trends. IEEE Trans. Intell. Transp. Syst. 2020, 21, 3152–3168. [Google Scholar] [CrossRef]
  93. Sutton, R.S.; Barto, A.G. Reinforcement Learning, 2nd ed.; An Introduction; MIT Press: Cambridge, MA, USA, 2018. [Google Scholar]
  94. De Paula, L.B.; Marins, F.A.S. Algorithms applied in decision-making for sustainable transport. J. Clean. Prod. 2018, 176, 1133–1143. [Google Scholar] [CrossRef] [Green Version]
  95. Han, H.; Cueto, E.P. Waste Collection Vehicle Routing Problem: Literature Review. Promet Traffic Transp. 2015, 27, 345–358. [Google Scholar] [CrossRef] [Green Version]
  96. Cardoso, S.R.; Barbosa-Póvoa, A.P.F.; Relvas, S. Design and planning of supply chains with integration of reverse logistics activities under demand uncertainty. Eur. J. Oper. Res. 2013, 226, 436–451. [Google Scholar] [CrossRef]
  97. United Nations. Transforming Our World: The 2030 Agenda for Sustainable Development Textbar; Department of Economic and Social Affairs: New York, NY, USA, 2015. [Google Scholar]
  98. Moshref-Javadi, M.; Winkenbach, M. Applications and Research avenues for drone-based models in logistics: A classification and review. Expert Syst. Appl. 2021, 177, 114854. [Google Scholar] [CrossRef]
  99. Moshref-Javadi, M.; Hemmati, A.; Winkenbach, M. A truck and drones model for last-mile delivery: A mathematical model and heuristic approach. Appl. Math. Model. 2020, 80, 290–318. [Google Scholar] [CrossRef]
  100. World Economic Forum. The Future of the Last-Mile Ecosystem; Transition Roadmaps for Public and Private-Sector Players; Available online: https://www.weforum.org/reports/the-future-of-the-last-mile-ecosystem (accessed on 12 March 2021).
  101. Dlugosch, O.; Brandt, T.; Neumann, D. Combining analytics and simulation methods to assess the impact of shared, autonomous electric vehicles on sustainable urban mobility. Inf. Manag. 2020, 103285. [Google Scholar] [CrossRef]
  102. Nandal, M.; Mor, N.; Sood, H. An Overview of Use of Artificial Neural Network in Sustainable Transport System. In Advances in Intelligent Systems and Computing; Springer Science and Business Media LLC: Berlin, Germany, 2020; pp. 83–91. [Google Scholar]
  103. Majumdar, S.; Subhani, M.M.; Roullier, B.; Anjum, A.; Zhu, R. Congestion prediction for smart sustainable cities using IoT and machine learning approaches. Sustain. Cities Soc. 2021, 64, 102500. [Google Scholar] [CrossRef]
  104. Barceló, J. Future Trends in Sustainable Transportation. In Sustainable Transportation and Smart Logistics; Elsevier BV: Amsterdam, The Netherlands, 2019; pp. 401–435. [Google Scholar]
  105. Wilson, M.; Paschen, J.; Pitt, L. The circular economy meets artificial intelligence (AI): Understanding the opportunities of AI for reverse logistics. Manag. Environ. Qual. Int. J. 2021, in press. [Google Scholar] [CrossRef]
  106. Gutierrez-Franco, E.; Montoya-Torres, J.; Bautista, J.; Lizarazo, E. Solving the Vehicle Routing with Simultaneous Pickups and Deliveries for a Beverage Distribution Company; Revista de la Escuela Colombiana de Ingeniería: Colombia, 2009; p. 75. Available online: https://www.researchgate.net/publication/301351922_Solving_the_Vehicle_Routing_with_Simultaneous_Pickups_and_Deliveries_for_a_Beverage_Distribution_Company (accessed on 31 May 2021).
  107. Bergmann, F.M.; Wagner, S.M.; Winkenbach, M. Integrating first-mile pickup and last-mile delivery on shared vehicle routes for efficient urban e-commerce distribution. Transp. Res. Part B Methodol. 2020, 131, 26–62. [Google Scholar] [CrossRef]
  108. Bernon, M.; Tjahjono, B.; Ripanti, E. Aligning retail reverse logistics practice with circular economy values: An exploratory framework. Prod. Plan. Control 2018, 29, 483–497. [Google Scholar] [CrossRef]
  109. Esposito, M.; Tse, T.; Soufani, K. Reverse logistics for postal services within a circular economy. Thunderbird Int. Bus. Rev. 2018, 60, 741–745. [Google Scholar] [CrossRef]
  110. Julianelli, V.; Caiado, R.G.G.; Scavarda, L.F.; Cruz, S.P.D.M.F. Interplay between reverse logistics and circular economy: Critical success factors-based taxonomy and framework. Resour. Conserv. Recycl. 2020, 158, 104784. [Google Scholar] [CrossRef]
  111. Macioszek, E. First and Last Mile Delivery–Problems and Issues. In Advances in Intelligent Systems and Computing; Springer Science and Business Media LLC: Berlin, Germany, 2017; pp. 147–154. [Google Scholar]
Figure 1. KPIs for distribution drivers.
Sustainability 13 06230 g001
Figure 2. Conceptual framework for distribution decision making.
Sustainability 13 06230 g002
Figure 3. Techniques used in each step of the conceptual framework.
Sustainability 13 06230 g003
Figure 4. Districts in Bogota.
Sustainability 13 06230 g004
Figure 5. Longitude and latitude customers in Bogota.
Sustainability 13 06230 g005
Figure 6. Customer allocation in vehicles.
Sustainability 13 06230 g006
Figure 7. Vehicle state chart.
Sustainability 13 06230 g007
Figure 8. Home delivery simulation.
Sustainability 13 06230 g008
Figure 9. Average speed of all vehicles in the city over the day.
Sustainability 13 06230 g009
Figure 10. The learning process for delays in routes.
Sustainability 13 06230 g010
Figure 11. Abstracting map reality into cardinal coordinate charts.
Sustainability 13 06230 g011
Figure 12. Rewards in the training phase for 20 nodes.
Sustainability 13 06230 g012
Figure 13. Batch Generations 50 nodes.
Sustainability 13 06230 g013
Figure 14. The best solution.
Sustainability 13 06230 g014
Figure 15. Last-Mile Methodology: methods and interrelations map.
Sustainability 13 06230 g015
Figure 16. Software Architecture.
Sustainability 13 06230 g016
Figure 17. Forward and Reverse/Takeback Last-Mile Operations.
Sustainability 13 06230 g017
Table 1. Stakeholders of last-mile delivery operations.
StakeholderDescriptionObjectiveData AnalysisCertaintyVariability
MetricDet.Prb.Sta.Dyn.Reference
City GovernmentsLocal, state and city governments.
Decision Makers
Better traffic
Control environment Infrastructure investment
Land use Road safety
Traffic regulations.x x [51,61,68]
CO2 emissions.x x
Low/High emission areas.
Traffic congestion–flow. x x
Type of use (residential, business).x x
Truck weight limits per zone.x x
InhabitantsWorkers, kids (School), elderly population, regular pedestriansMinimize traffic congestion and accidents
Some externalities like pollution or noise
Additional travel time. x[58]
* of accidents. x
Pollution.
CarriersTransporters, warehouse companies, 3PLsCustomer service
Meet time windows
Reduce costs
Transportation cost.x x [29]
Fuel consumption.x x
Driver infractions. x x
% Rejections. x x
Capacity utilization. x x
Travel times. x x
Number and % fleet use. x x
ShippersManufacturers, wholesalers, retailersCustomer service
Reliability of transport No damage in products
No delays Increase safety
Capacity utilization.x x[20]
Driver infractions. x x
% Fleet use. x x
Service cost.
% OTIF (On time-In full). x x
% Rejections. x x
End ClientsCustomer buys products from businesses. Consumer uses the products (she may be a customer)Obtain what they look for
Time, quality, and price time windows
Frequency. x x[21]
Locations.x x
Time windows.x x
Number of returns. x x
Meet the demand. x x
* Det: Deterministic. Prb.: Probabilistic. Sta.: Static. Dyn.: Dynamic.
Table 2. KPIs Characteristics in last-mile delivery decisions.
FeatureCertaintyVariability Literature Source
DeterministicProbabilistic StaticDynamic
TrafficDay/Hour x x[51]
Weather x x
Infrastructurex x
LocationDensityx x [30,61]
Parking Zonex x
Topologyx x
Geographyx x
DriverExpertisex x[72]
Performancex x
Customer Time Windowsx x[21]
Locationsx x
Building Specs.x x
Securityx x
Delivery inst.x x
Table 3. How and Why Case Study Description.
Description Methodology Steps for Urban Logistics
Step 1: Historical and Data Collection
Why: Data about customers’ demands, location, and type (i.e., nanostore, townhouse, or building). General features of customers. Industry patterns and trends.
How: This directly affects the service levels and operational costs when adopting traffic, transport or environmental regulations.
Data for the following step: Vehicle’s speeds for different city districts. Data about vehicle’s capacities in volume and weight, including fixed and variable costs. Service and unloading times. Characterization of customer demands. Research directions.
Step 2: Data Analysis
Why: Identify promising insights/parameters for the decision-making tools: optimization, simulation, and machine learning methods.
How: Forecasting techniques, clustering, data mining, probability distributions.
Data for the following step: Clusters, tendencies, forecasting, customer profiles, vehicle operator behavior, parking, service time in city (districts), and probability distributions for speed, parking, and service time.
Step 3: Quantitative Modeling
Why: Identify the best allocation of resources to meet the pre-defined targets of cost and high service levels.
How: Linear programming. Mixed-integer linear programming. Heuristics.
Data for the following step: Quantity of cars, routing, optimal amount of resources.
Step 4: Simulation and Experiments
Why: Run experiments (parameter variation in vehicle’s velocities, service times, and different zones in the city) and analyze the outputs to make better decisions about the real-world operation.
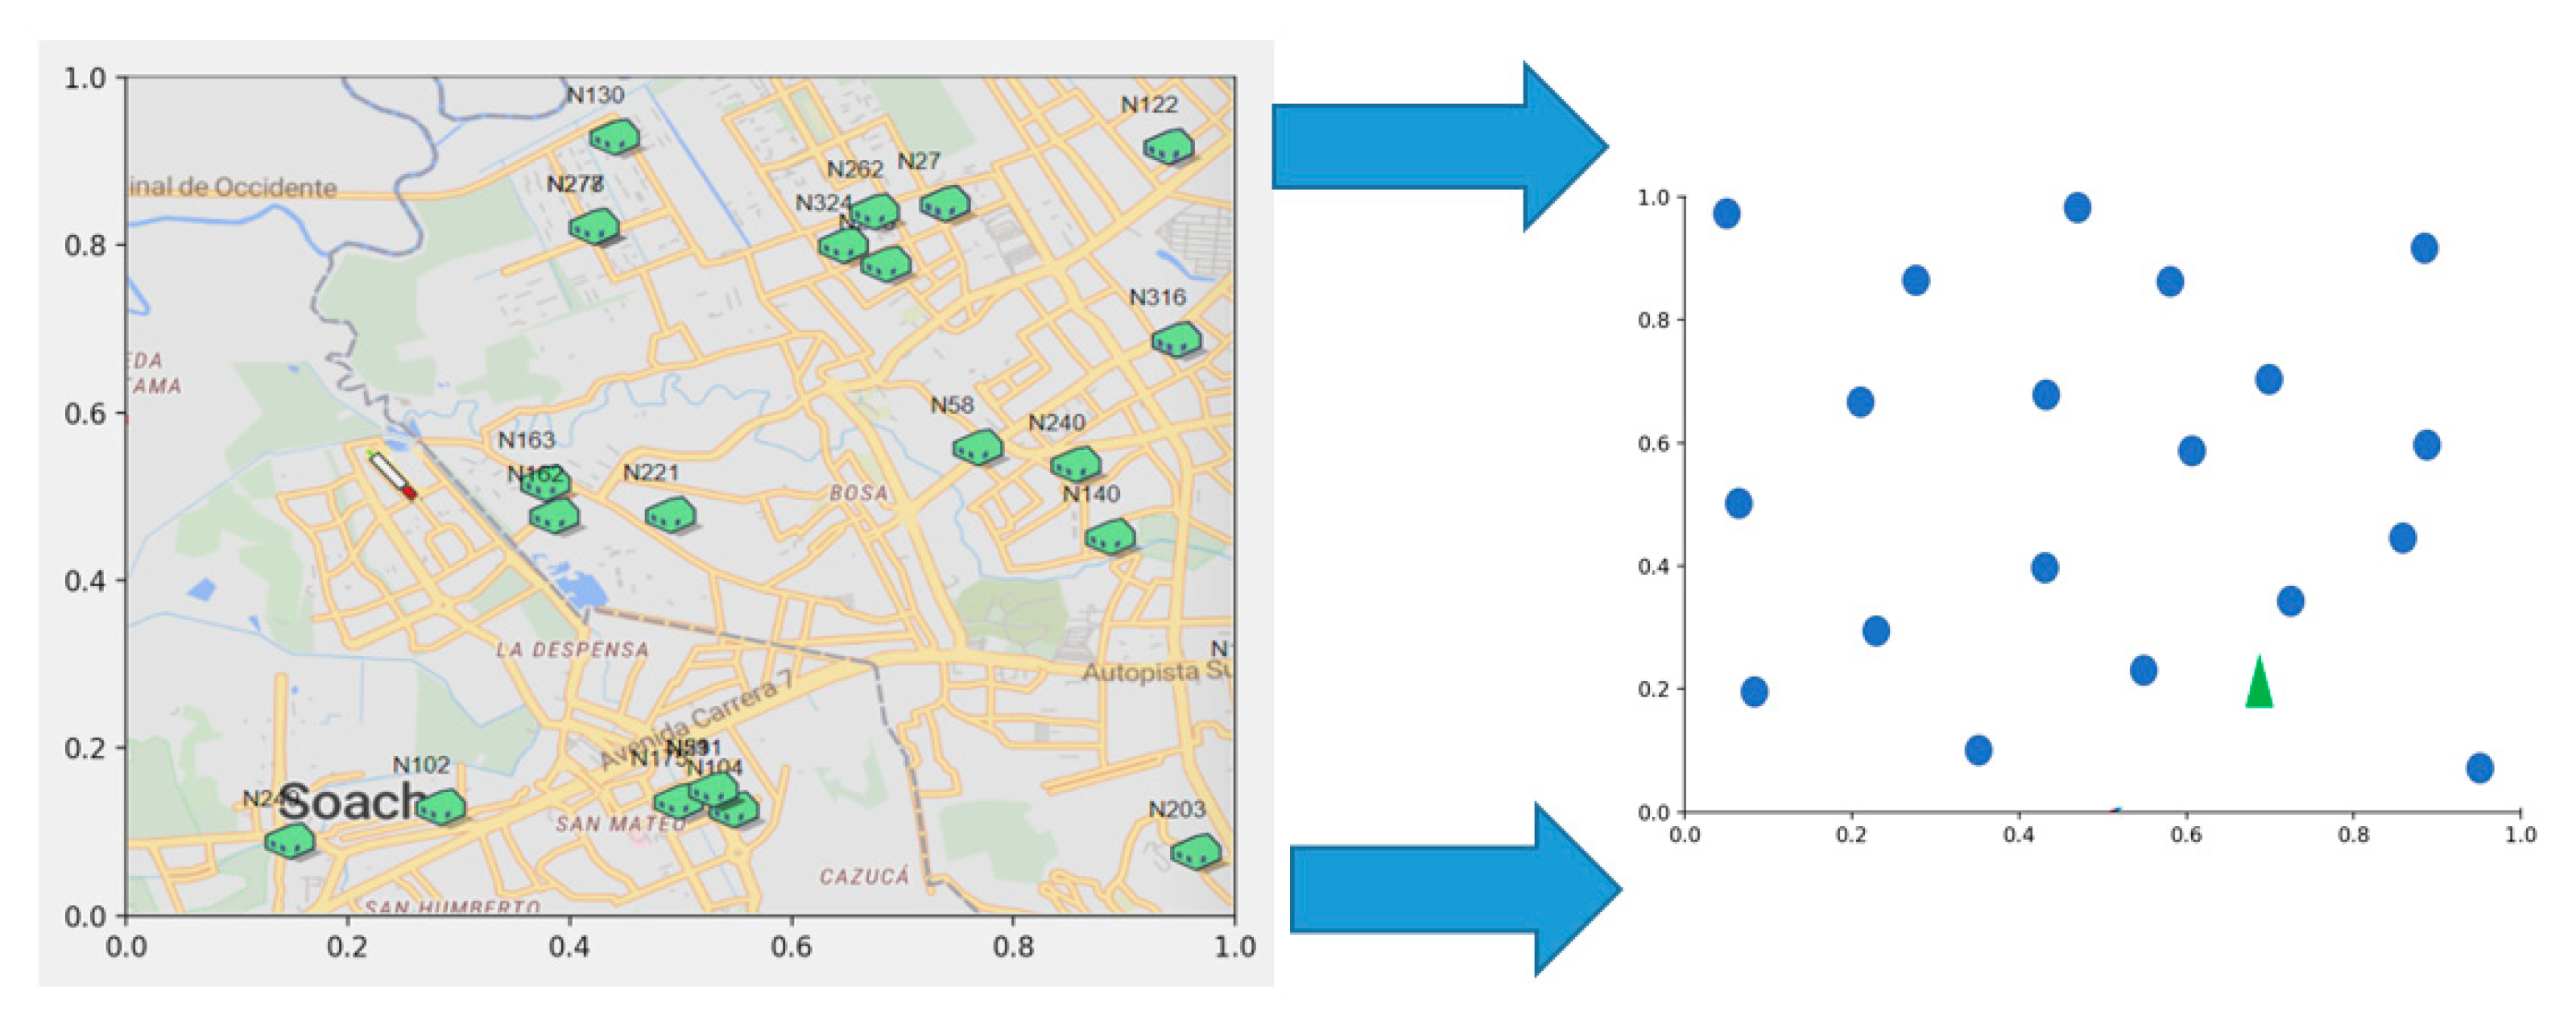
How: Agent-based simulation. The capabilities of linking maps and simulation were very useful for this case. The model builds a transportation model with GIS maps. With this technique, the model focuses on the system’s active components and their interrelations (i.e., vehicles, customers and city).
Data for the following step: Calibrated speeds in different city districts, number of customers served per vehicle, distances and time between zones and customers, calibrated speeds, parking, and service time per type of customer. Time of arrival and departure per customer. Schedule per vehicle.
Step 5–6: Learning
Why: Learn the best routes in the city to provide an excellent service level.
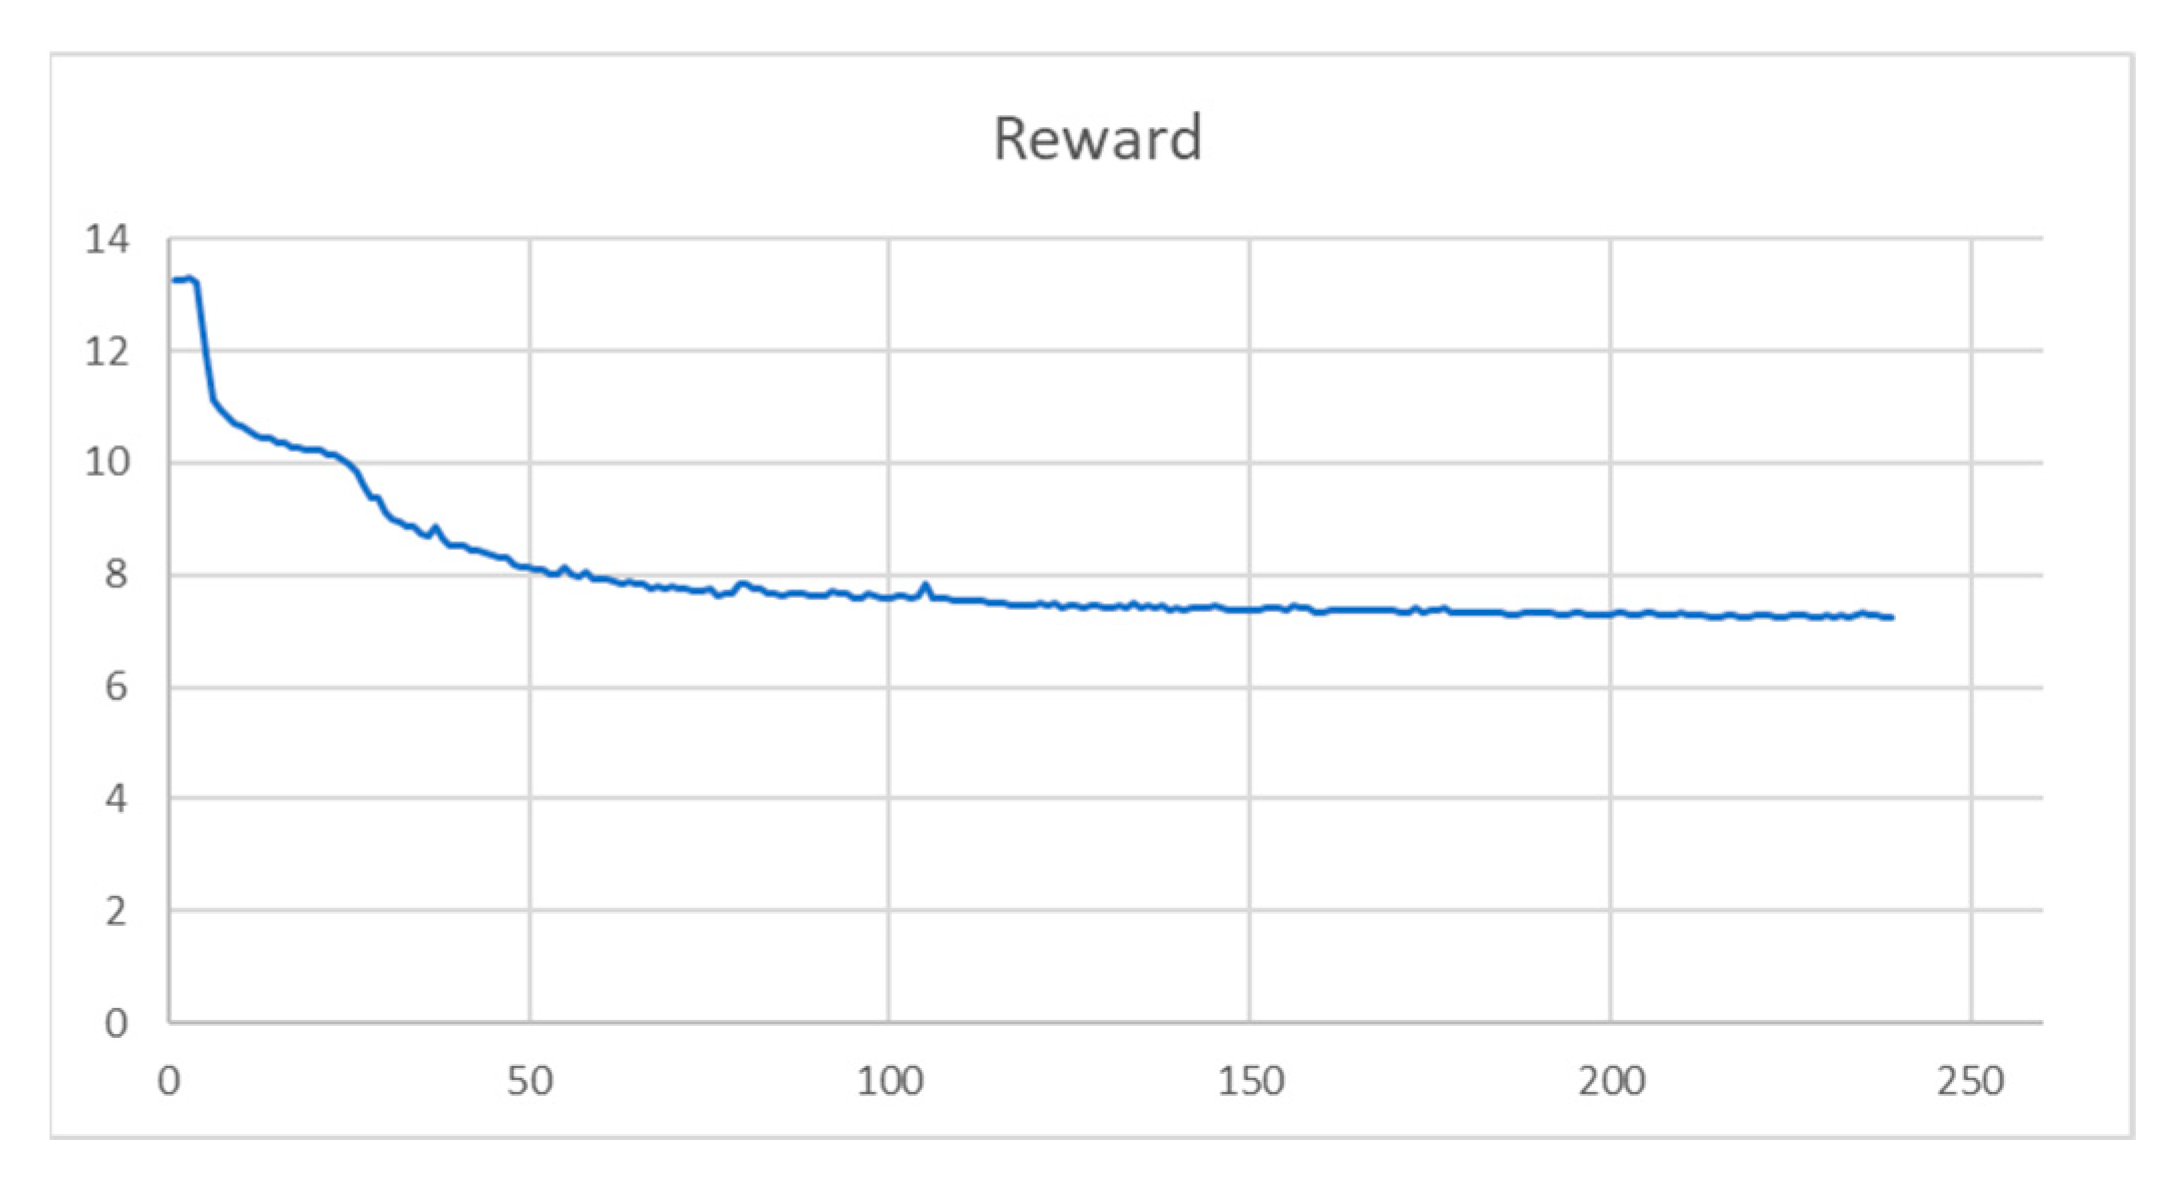
How: Deep reinforcement learning.
Output: Best routing sequence to complete the delivery task to customers.
Table 4. Average customer demand (i.e., order) per day for this illustrative example.
Average per Day:
DemandCustomers
Peak327
Valley200
Table 5. Vehicle types for home delivery in one retail store.
CriteriaQuantity (#)Capacity (m3)Type of VehicleLoad Capacity (Kg)
Type of Vehicles34Carry700
320Turbo3500
1414Turbo2000
Table 6. Features per district in Bogota.
Locality NameSurface km2PopulationDensity hab/km2Average Velocity (km/h)
Kennedy391,088,44328,20520
Bosa24673,07728,12623
Rafael Uribe14374,24627,06024
Engativa36887,08024,72318
Antonio Nariño5109,17622,37225
Barrios Unidos12243,46520,45922
Tunjuelito10199,43020,12420
Los Martires799,11915,22524
Puente Aranda17258,28714,92125
Suba1011,218,51312,11727
Fontibon33394,64811,85818
La Candelaria224,08811,69321
Teusaquillo14153,02510,78421
San Cristóbal49404,697824329
Usaquén65501,999768621
Ciudad Bolívar130707,569544226
Chapinero38139,701366122
Santa Fe45110,048243629
Usme215457,302212626
Sumapaz7816531929
Table 7. Vehicle utilization and time window features per vehicle type.
Vehicle Type% Volume% Weight% Time Window (600 min)
Turbo 2 (Ton) 137%40%100%
Turbo 2 (Ton) 1042%65%100%
Turbo 2 (Ton) 1128%36%100%
Turbo 2 (Ton) 1243%79%100%
Turbo 2 (Ton) 1334%41%100%
Turbo 2 (Ton) 1437%35%100%
Turbo 2 (Ton) 258%53%100%
Turbo 2 (Ton) 349%45%100%
Turbo 2 (Ton) 459%56%100%
Turbo 2 (Ton) 553%46%100%
Turbo 2 (Ton) 649%55%100%
Turbo 2 (Ton) 740%40%100%
Turbo 2 (Ton) 837%66%95%
Turbo 2 (Ton) 942%35%100%
Turbo 3,5 (Ton) 130%35%95%
Turbo 3,5 (Ton) 235%46%90%
Turbo 3,5 (Ton) 353%76%100%
Table 8. Average velocity per district.
VehicleThe Route in Google Maps. LinkAverage Velocity (km/h)Main Locality
K04https://bit.ly/2VnGe2e19.29Engativa
K05https://bit.ly/2VELunf19.84Engativa/Teusaquillo
K06https://bit.ly/2W4KGHk23.83Usaquén
K07https://bit.ly/2LGE5iB17.17Bosa
K08https://bit.ly/2VXGc5v17.88Chapinero/Usaquén
K09https://bit.ly/2W3eC6N15.21Chapinero/Barrios Unidos
K10https://bit.ly/2Ynewob21.1Facatativa
K11https://bit.ly/2Q4rpQX18.2Suba/Usaquén
K12https://bit.ly/30kC6Uv19.89Teusaquillo
K13https://bit.ly/2VxGKQ116.31Suba/Engativa
K14https://bit.ly/2Q0Hl6U26.79Chia/Canelon/La Naveta
K15https://bit.ly/2JgUSH117.45Suba
K16https://bit.ly/2YqItDS17.17Tunjuelito/Ciudad Bolivar
K17https://bit.ly/2YtnNep20.18Usme/San Cristobal
K18https://bit.ly/2Hh8wHC18.29Fontibon
K19https://bit.ly/2PYlNrB19.81P. Aranda/Antonio Nariño
K20https://bit.ly/2vYcfDz19.29Kennedy/Fontibon
Table 9. Customers’ parameters.
NameLatitudeLongitudeVehicleSum of WeightSum of VolumeType
N014.709352−74.19812K1892.400.314townhouse
N024.703184−74.215988K206.500.162nanostore
N034.710766−74.232552K1076.200.285townhouse
N044.710766−74.232552K1042.501.191townhouse
N054.728393−74.220398K1054.030.221townhouse
N064.696234−74.166496K18732.000.480building
N074.725585−74.218353K1070.600.361townhouse
N084.738458−74.253876K10106.200.343building
N094.713043−74.066406K0432.200.088townhouse
N104.82469−74.35247K1046.500.195building
N114.704219−74.041473K061312.670.708townhouse
Table 10. Time for a select of customers.
Cust. TypeService Time Mean Service Time Std DevParking Time Mean Parking Time Std Dev
Building10353
Townhouse8331
Nanostore11341
Default10342
Table 11. Regular and peak-hour speed (in km/h) in each borough of Bogota, Colombia.
IDNameNormal SpeedPeak-Hour Speed
1Usaquén20.0014.00
2Chapinero17.0011.90
3Santa Fe19.8913.92
4San Cristóbal25.0017.50
5Usme25.0017.50
6Tunjuelito25.0017.50
7Bosa23.0016.10
8Kennedy25.0017.50
9Fontibón20.0014.00
10Engativá25.0017.50
11Suba25.0017.50
12Barrios Unidos20.0014.00
13Teusaquillo25.0017.50
14Los Mártires 19.8113.87
15Antonio Nariño20.0014.00
16Puente Aranda25.0017.50
17La Candelaria19.8913.92
18Rafael Uribe 17.1712.02
19Ciudad Bolívar17.1712.02
20Sumapaz19.8113.87
Table 12. KPIs per vehicle delivery or route.
VehicleNumber of CustomersAverage of Service Time (min)Start Time (h)End Time (h)Total Operation HoursTotal Operation Min% Utilization Time Window
K041913.58:2015:317:11431.172%
K052015.58:1415:006:45405.868%
K062012.38:1317:489:34574.296%
K072012.98:1715:507:3345376%
K0820158:0715:357:28448.475%
K092013.28:1615:327:1543673%
K102013.18:2816:358:06486.281%
K112014.88:0414:496:45405.368%
K1220158:1015:497:3845976%
K132014.78:1715:427:24444.274%
K141913.98:1816:198:01481.280%
K151812.98:4415:426:5841870%
K162014.78:0815:417:33453.176%
K172013.38:0316:088:05485.181%
K182013.88:4215:557:13433.172%
K1920138:0715:437:35455.976%
K202014.48:0716:438:3651686%
Publisher’s Note: MDPI stays neutral with regard to jurisdictional claims in published maps and institutional affiliations.

