
Urban Sub-Center Design Framework Based on the Walkability Evaluation Method: Taking Coomera Town Sub-Center as an Example

 ,
,
Abstract
:1. Introduction
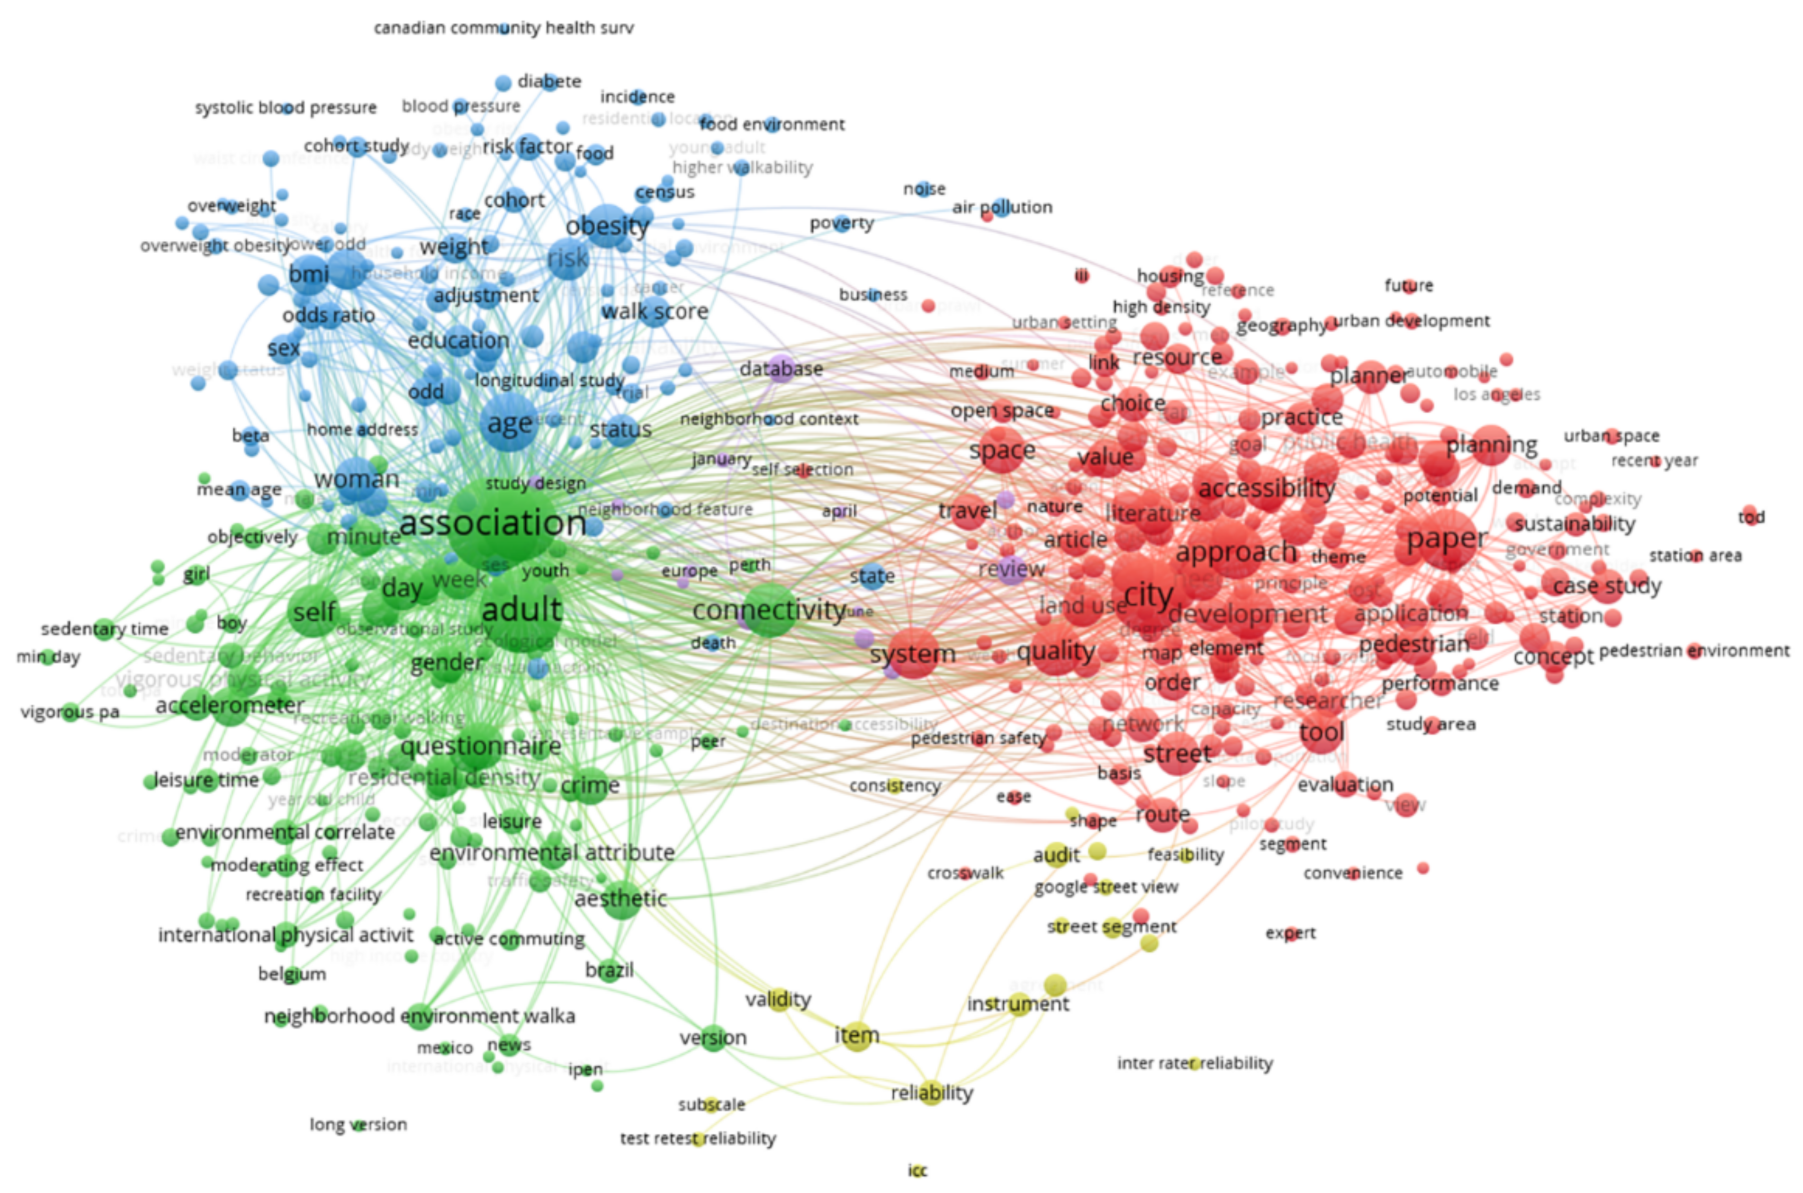
2. Literature Review
3. Methods
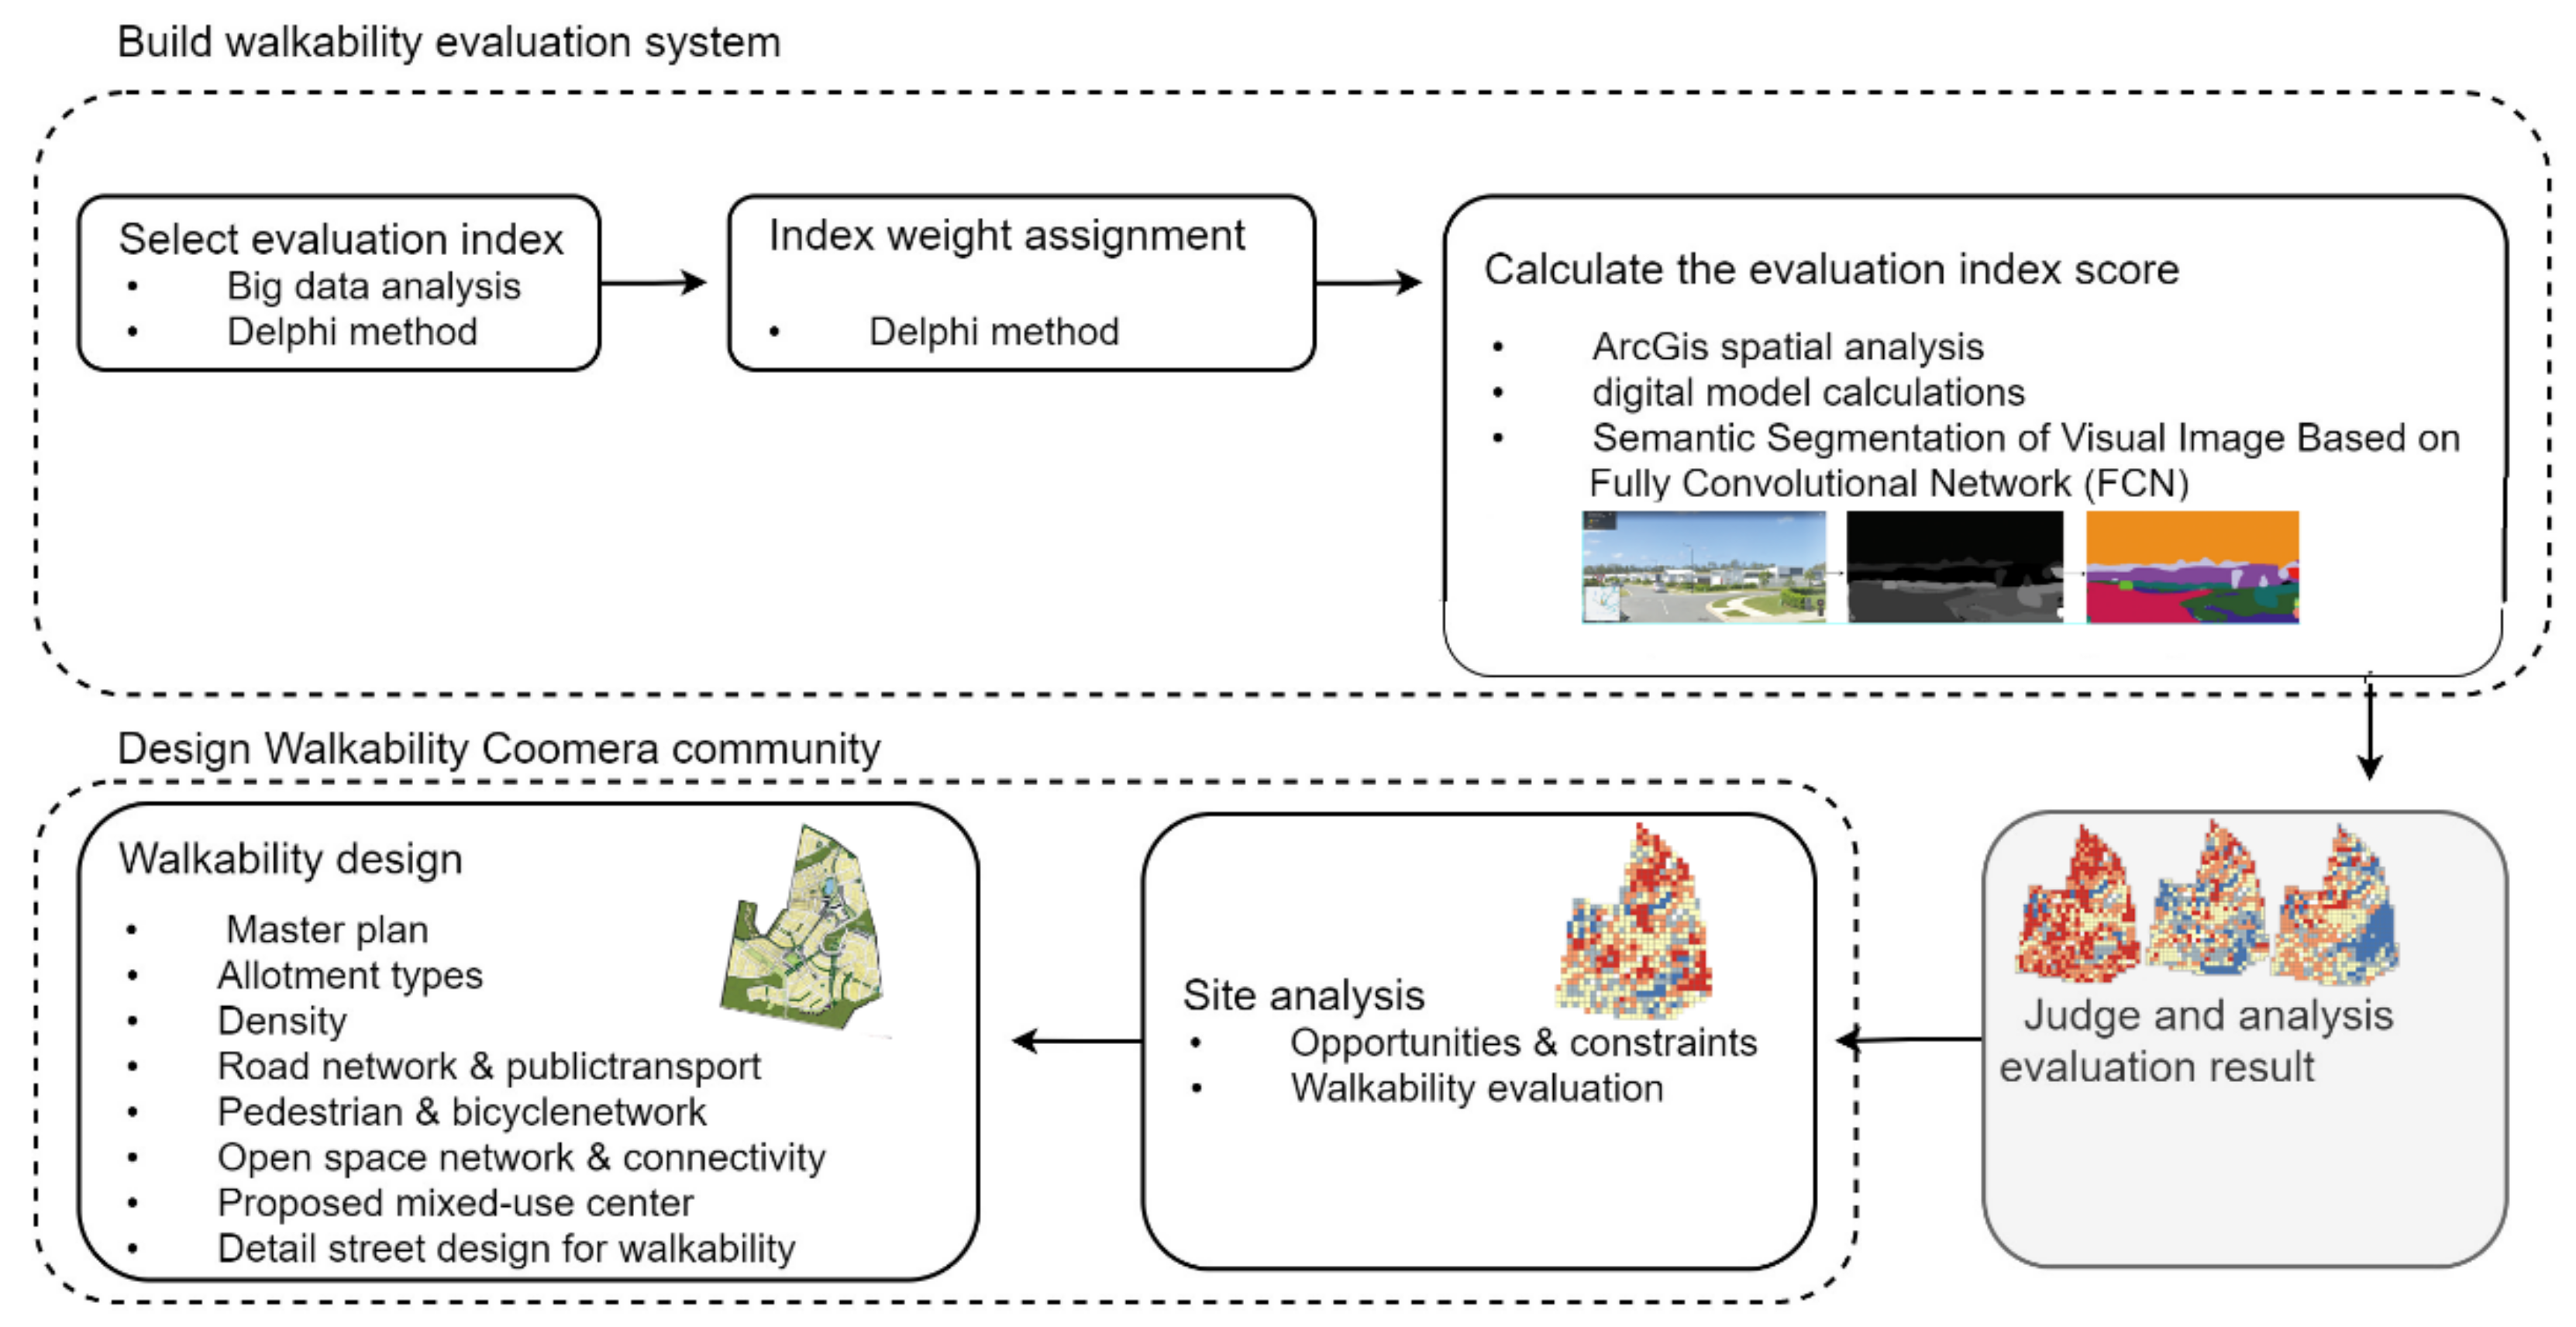
4. Building a Walkability Evaluation System
4.1. Selecting Evaluation Indexes
4.1.1. Density
4.1.2. Open Space
4.1.3. Road Network and Public Transport
4.1.4. Pedestrian and Bicycle Network
4.1.5. Walking within the Landscape
4.1.6. Path Security
4.1.7. Summary
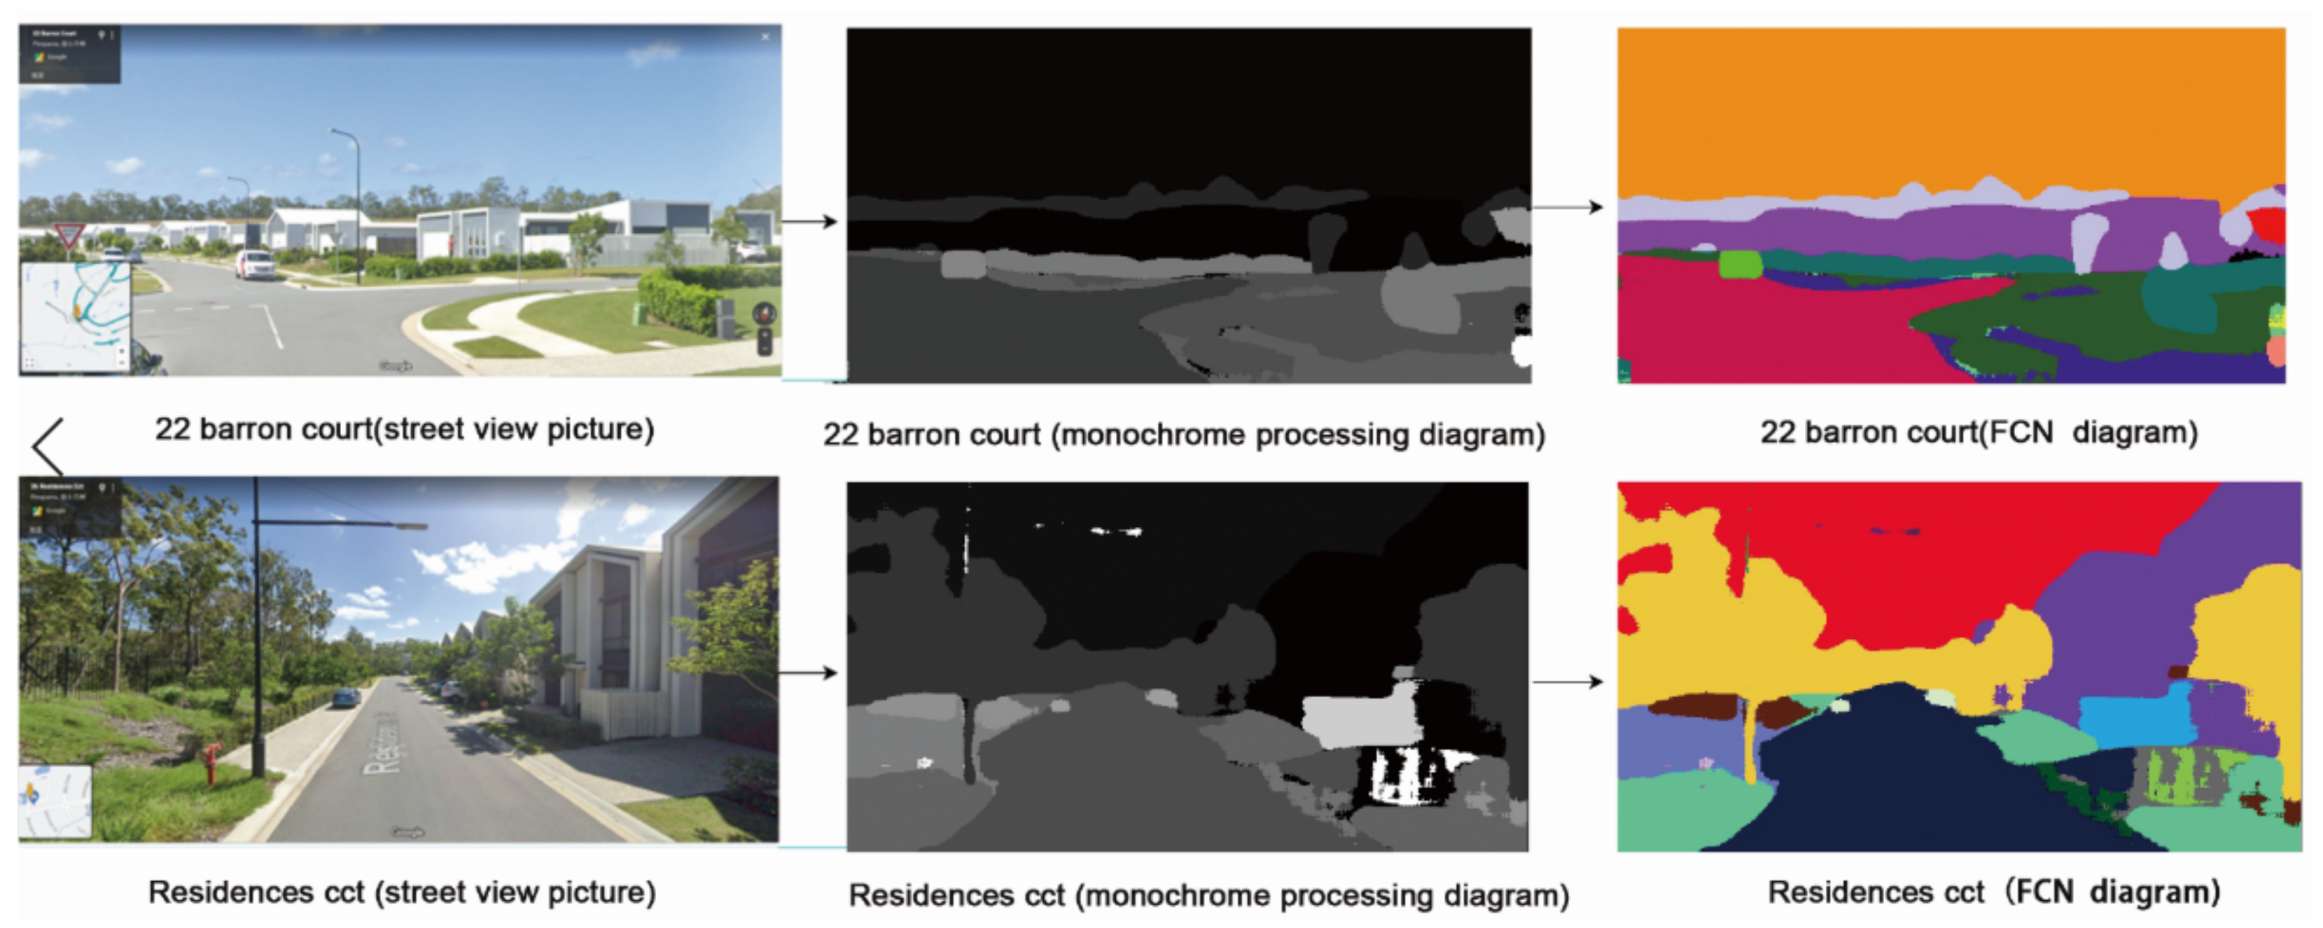
4.2. Obtain Data on Evaluation Indicators
4.3. Determin the Evaluation Indicators and Standards
5. Design Walkability of the Coomera Community
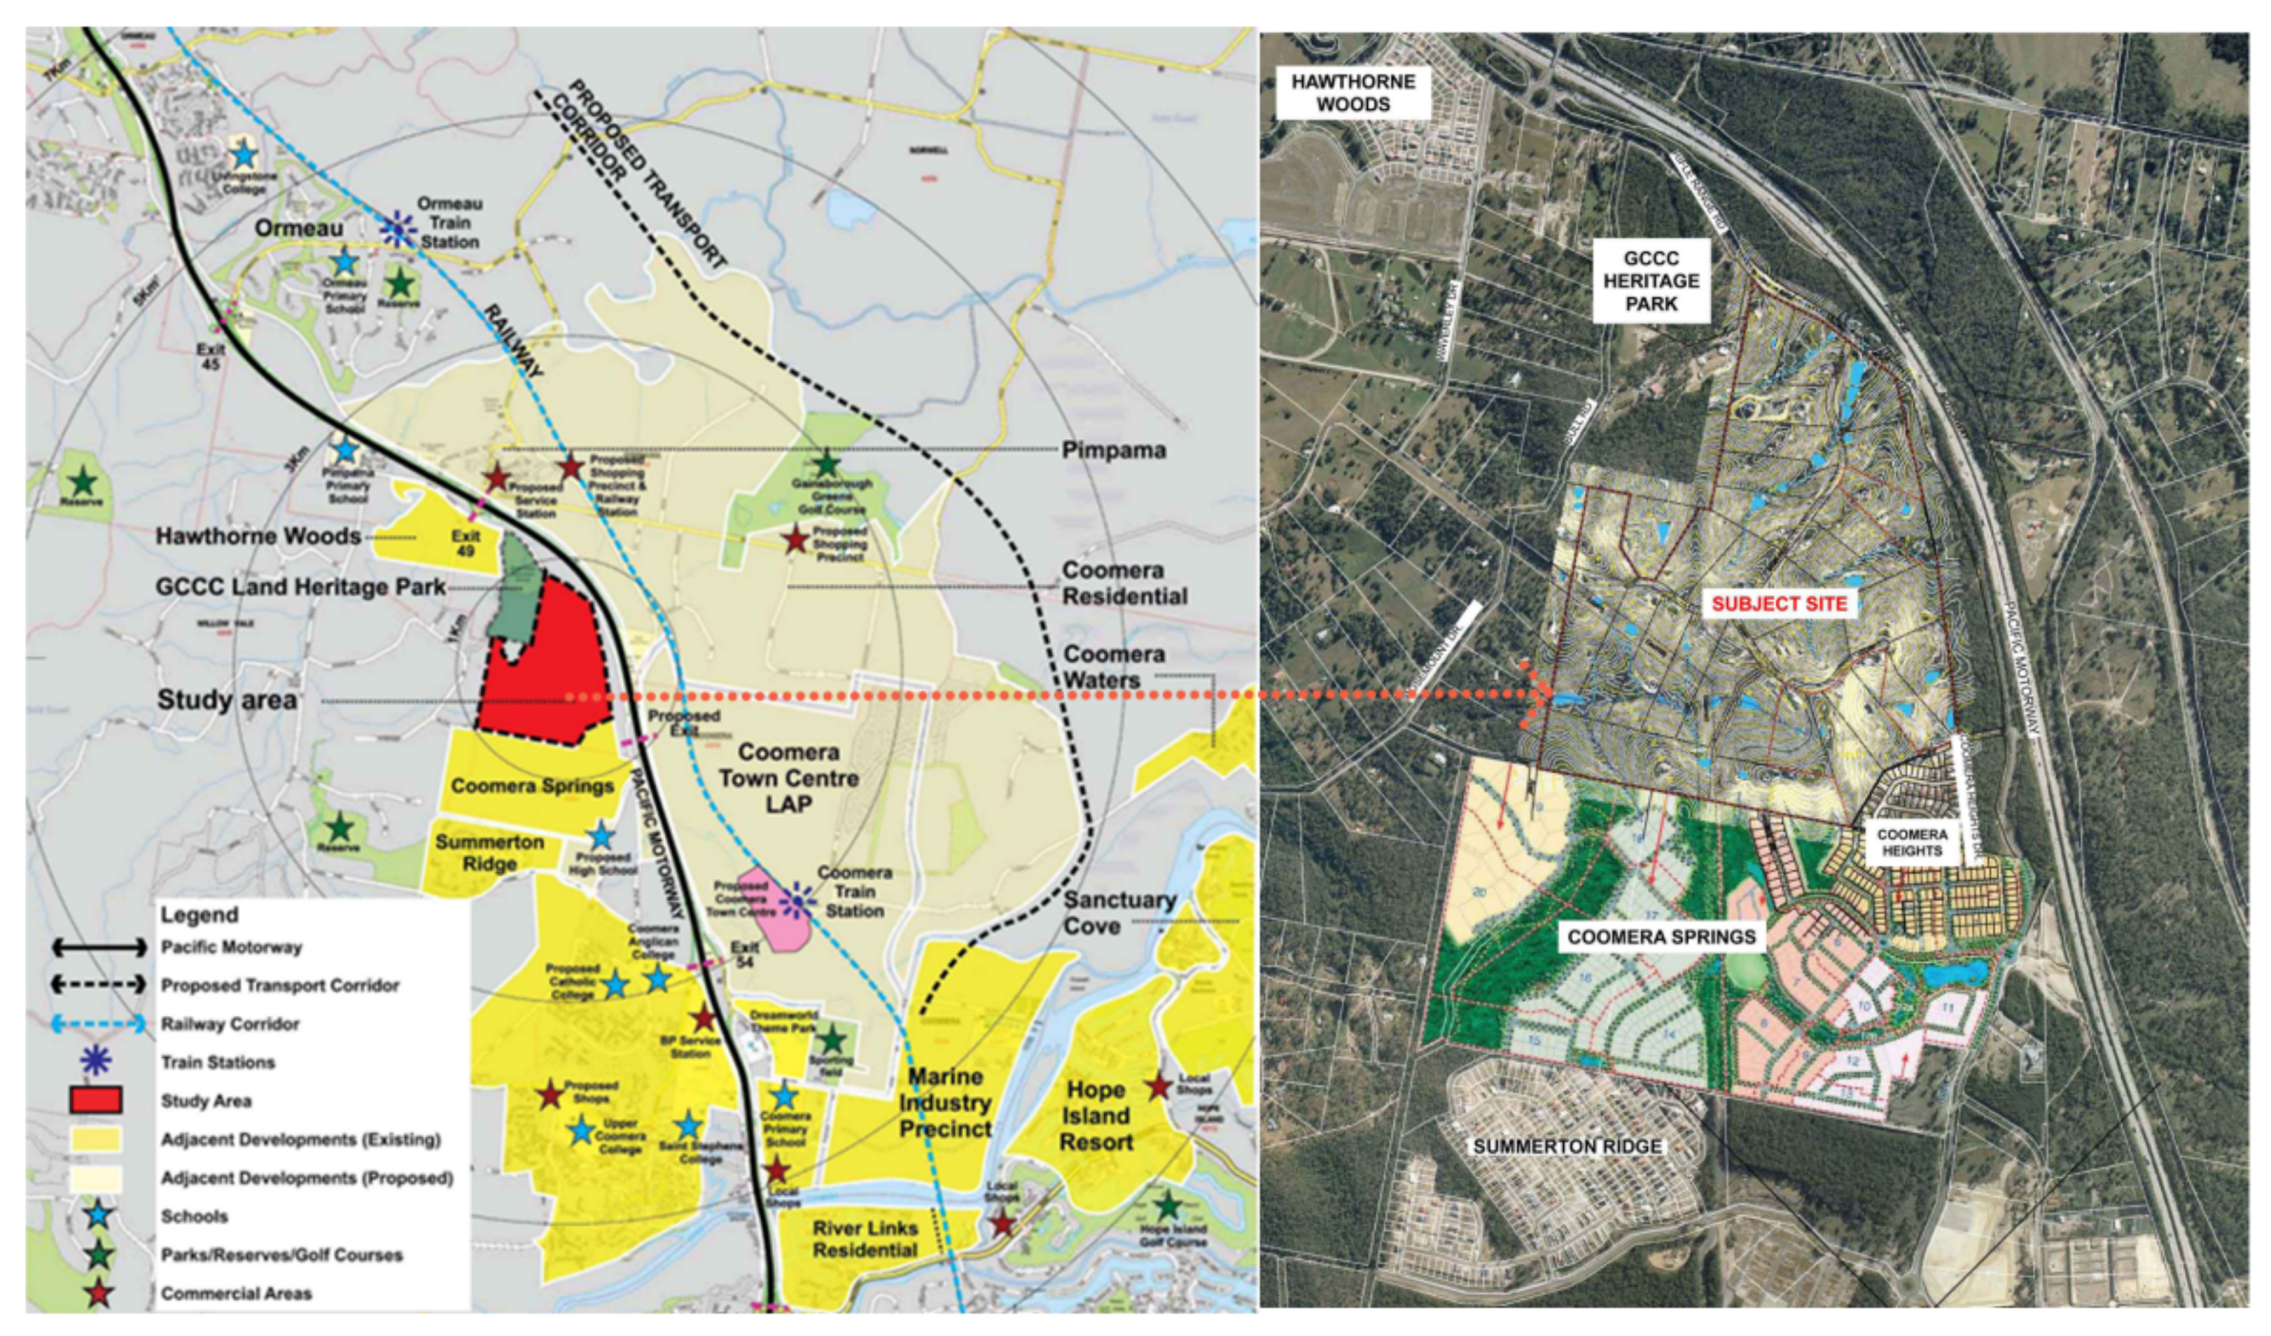
5.1. Site Location
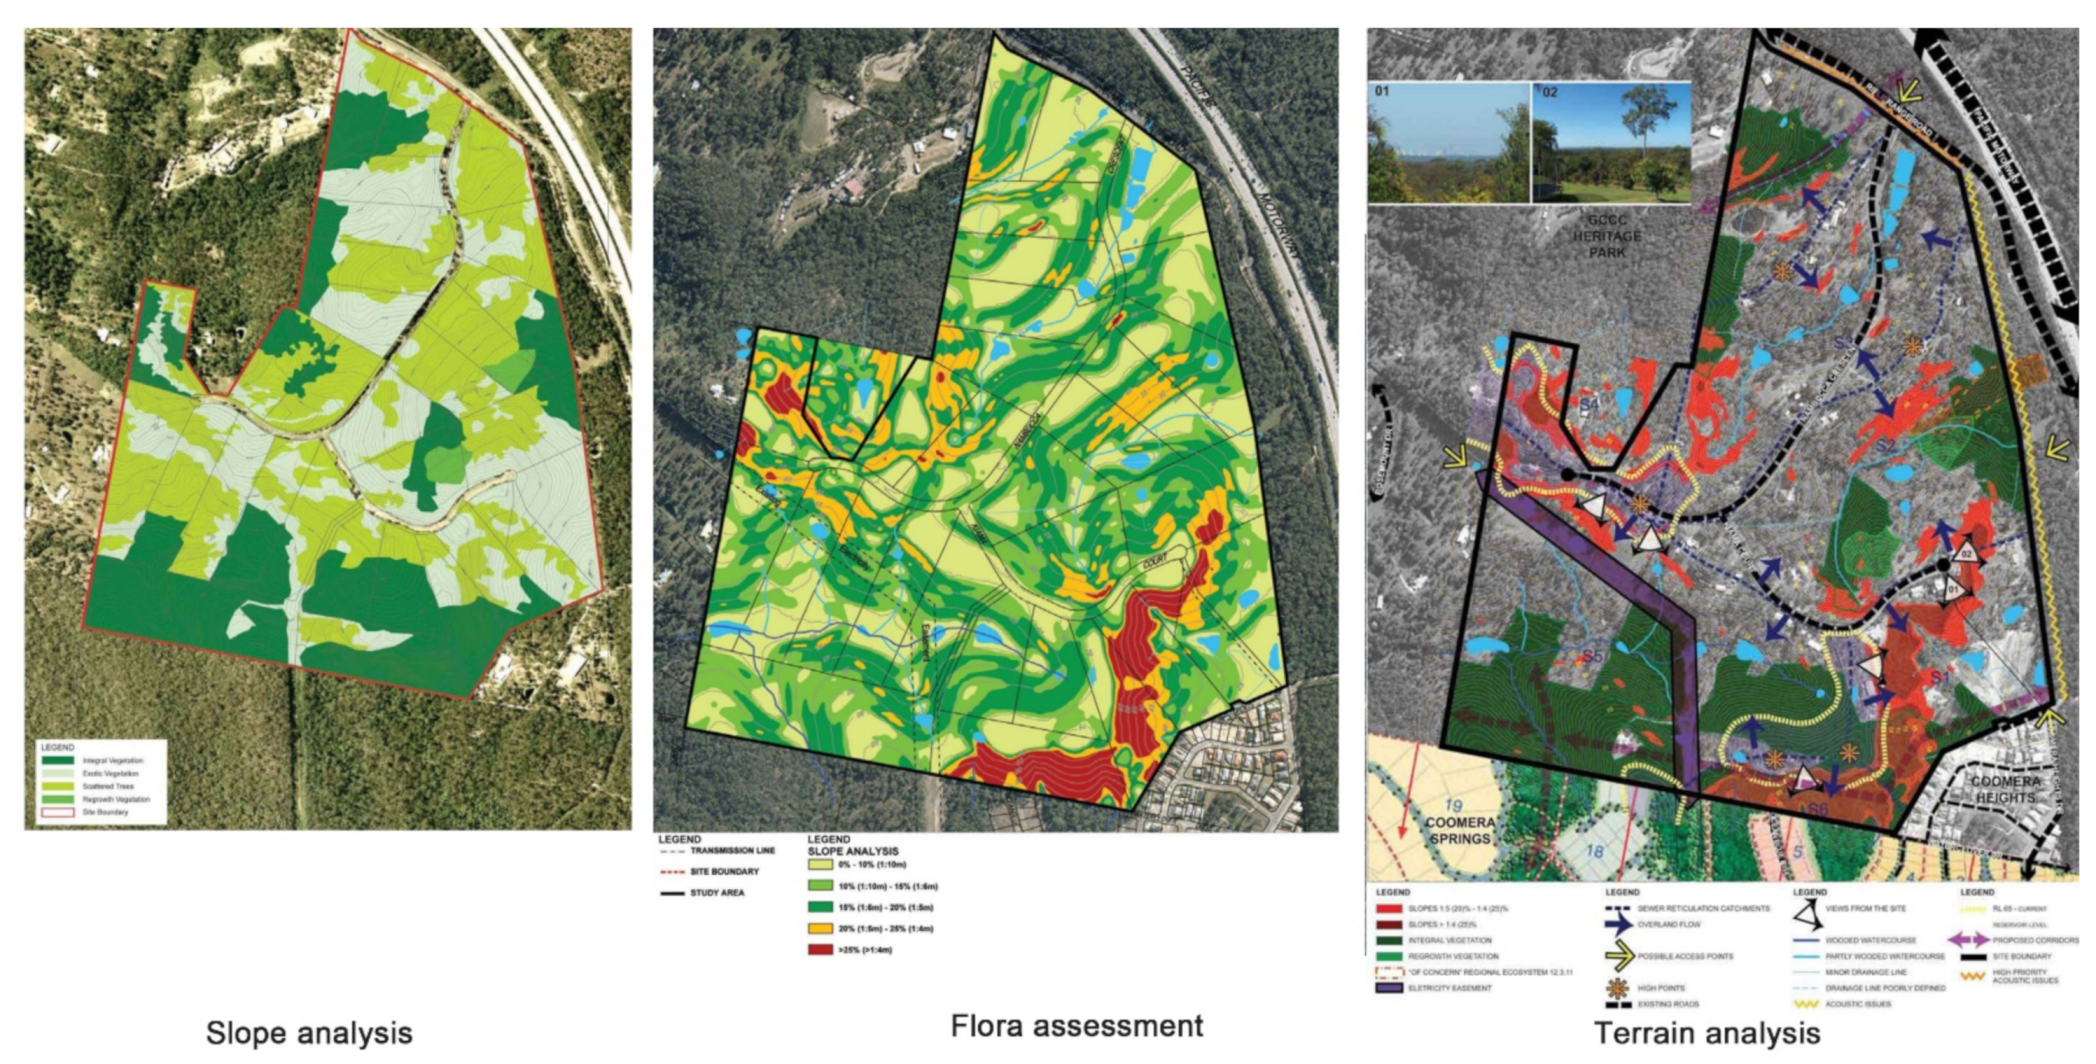
5.2. Opportunities and Constraints
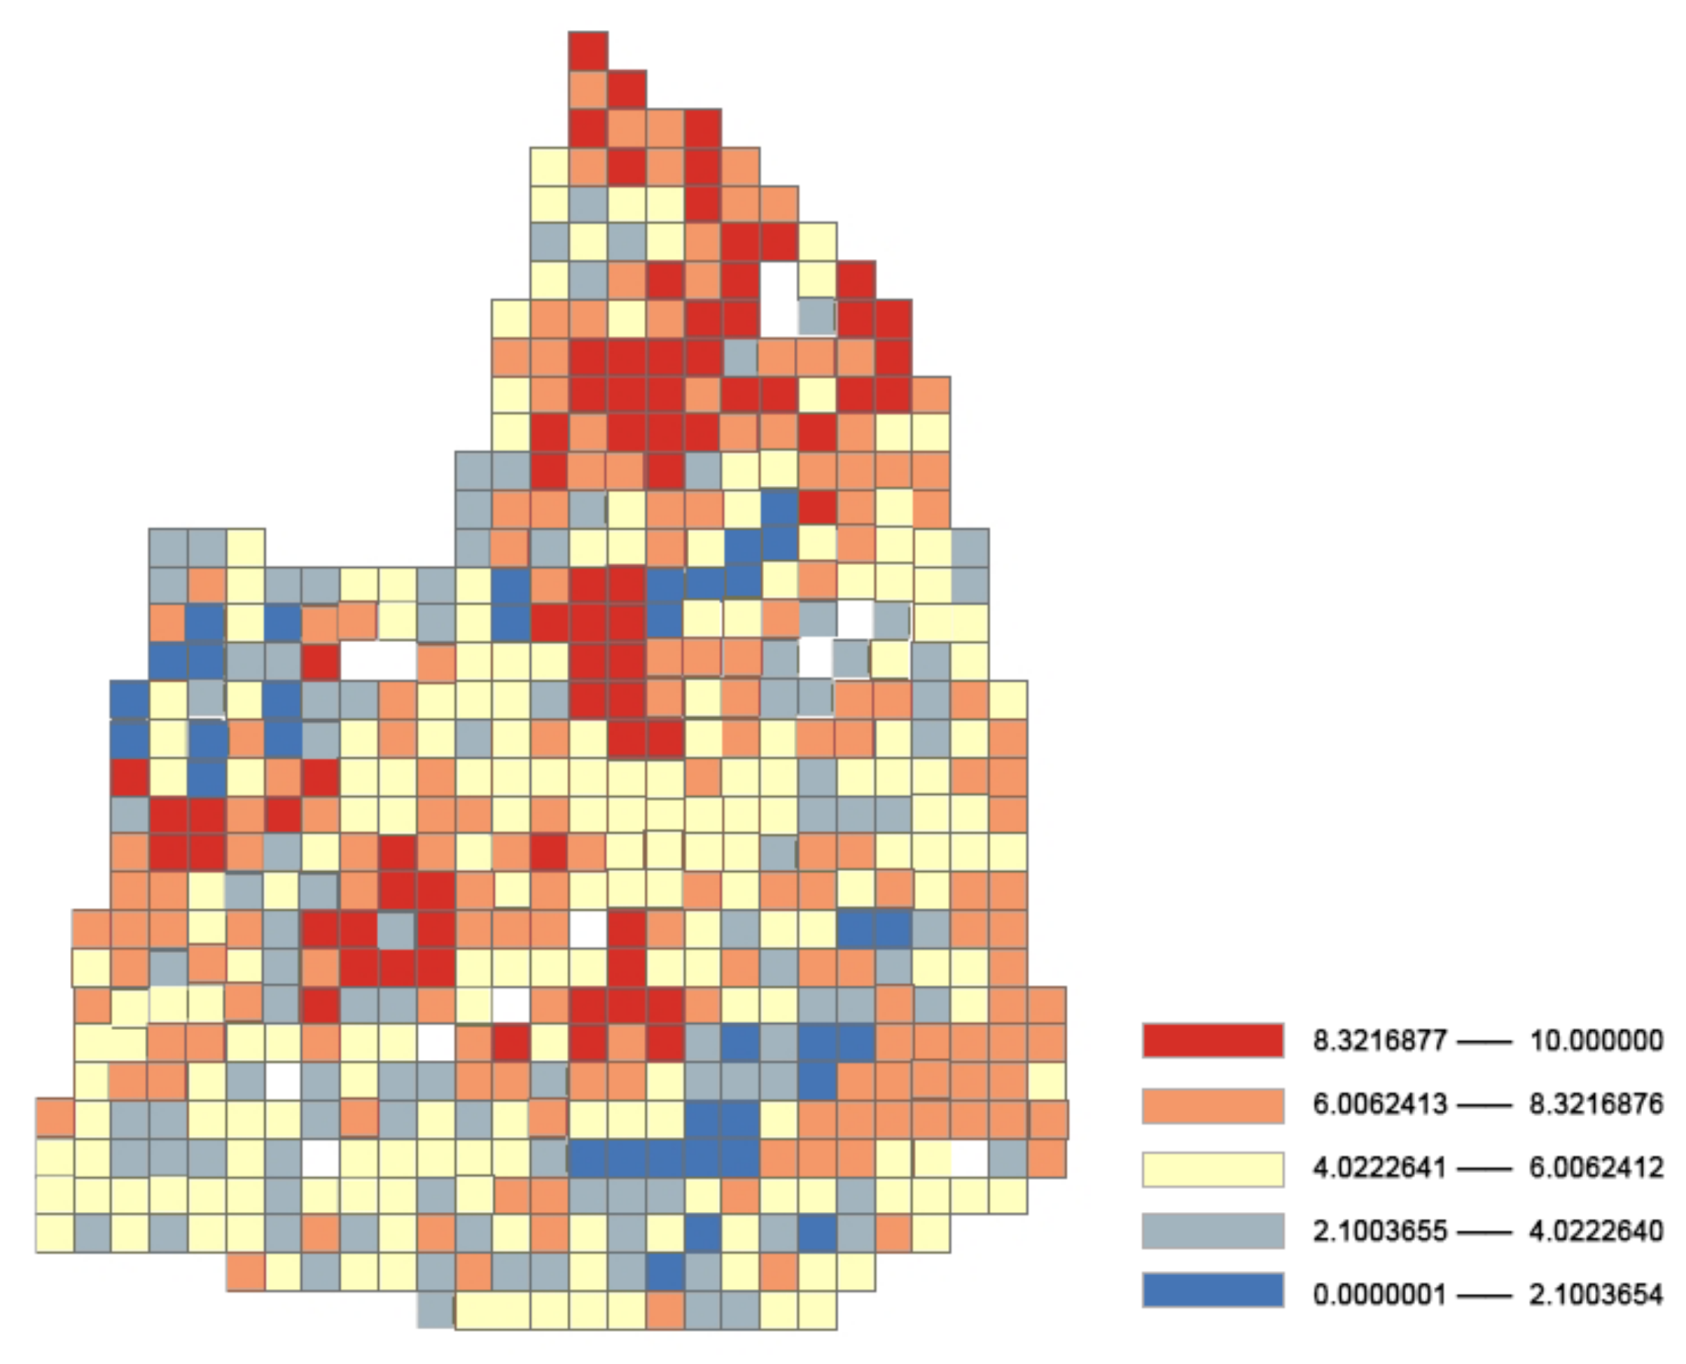
5.3. Walkability Evaluation
5.4. Walkability Design
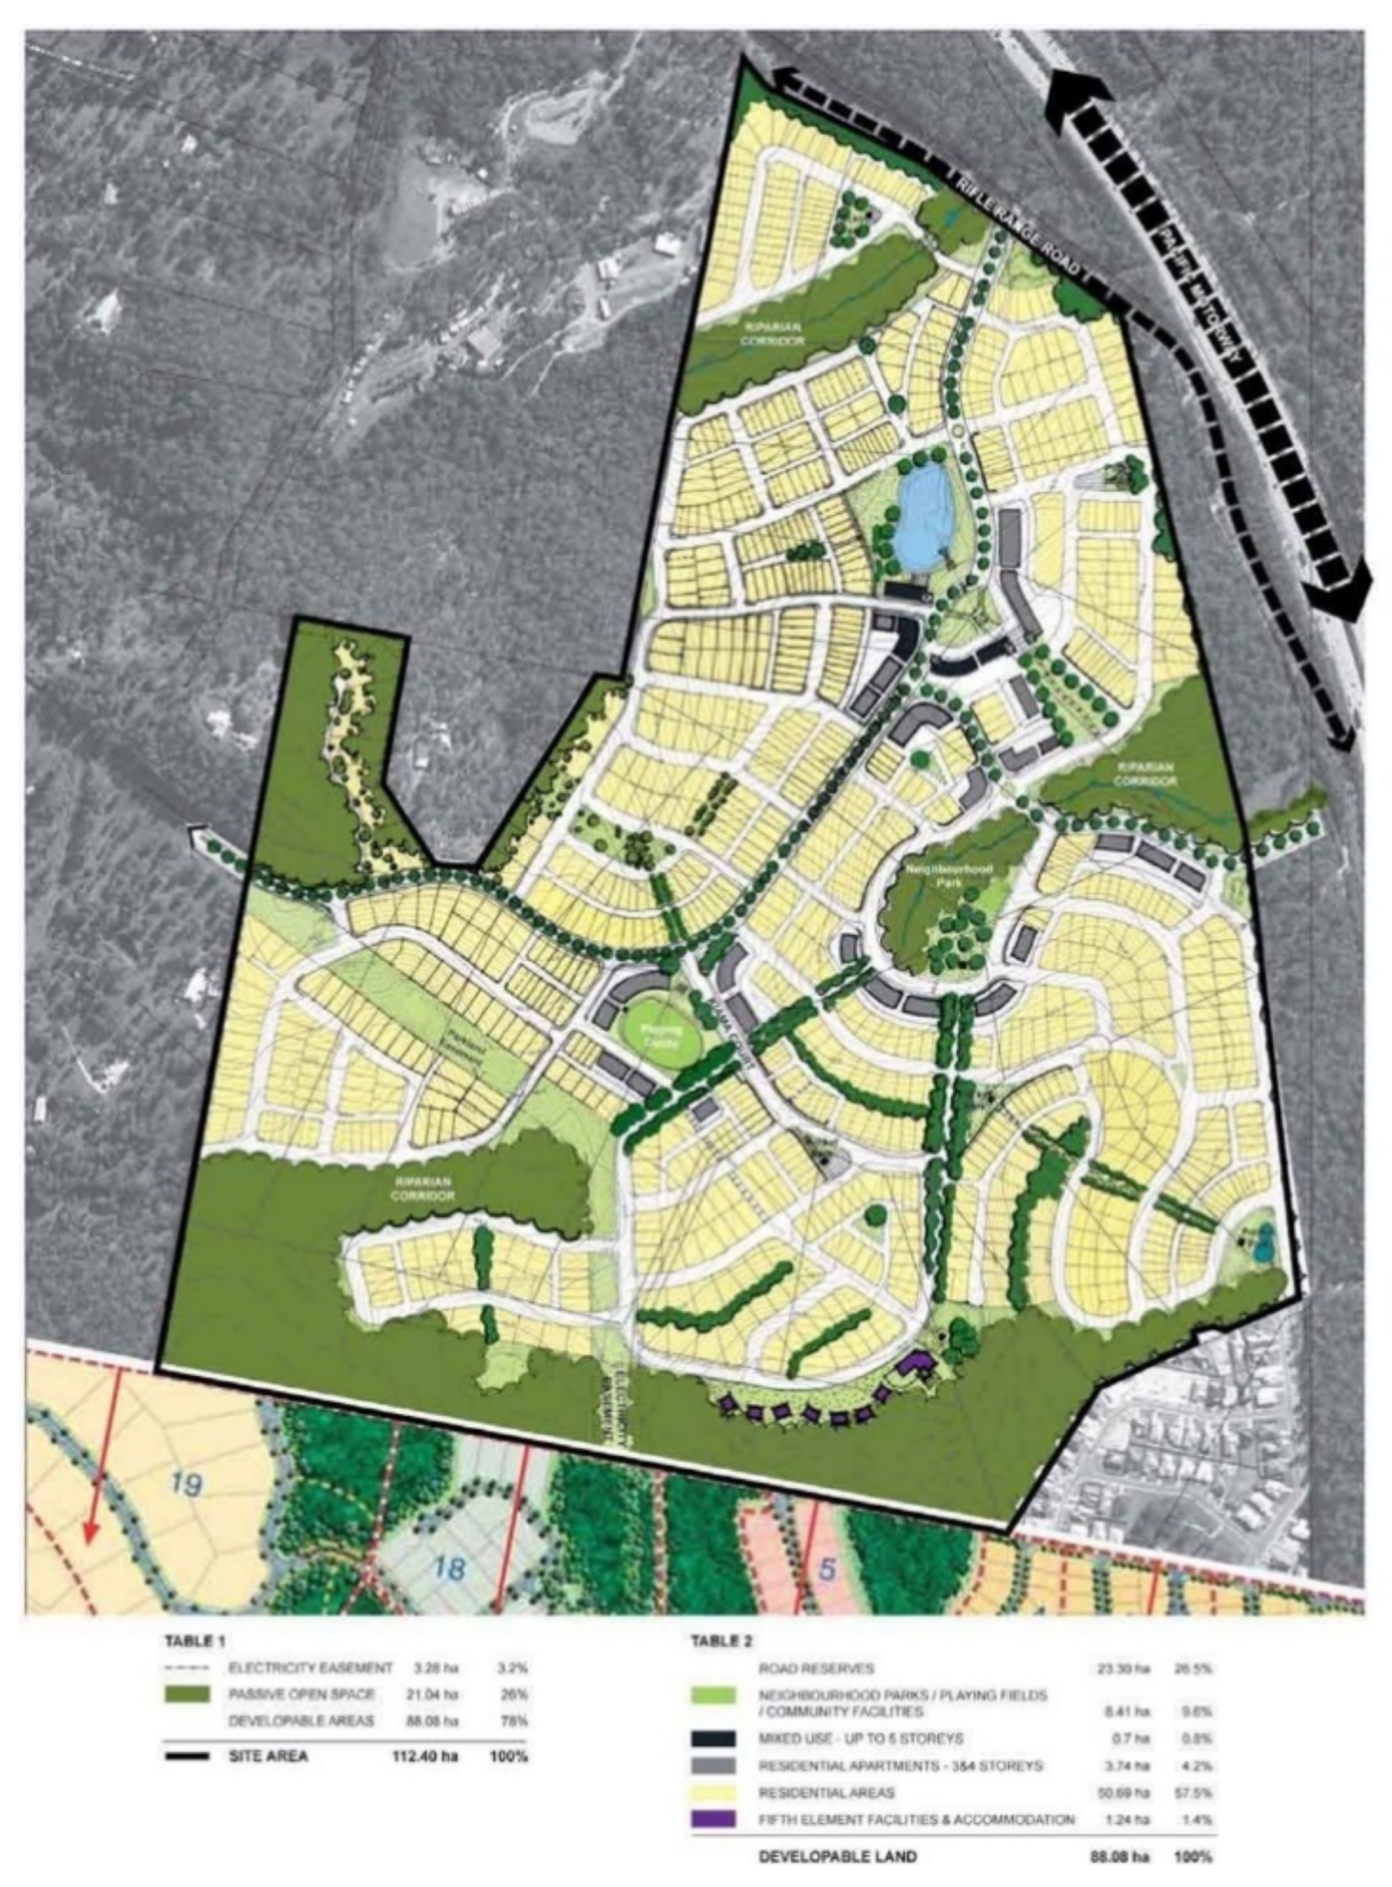
5.4.1. Master Plan
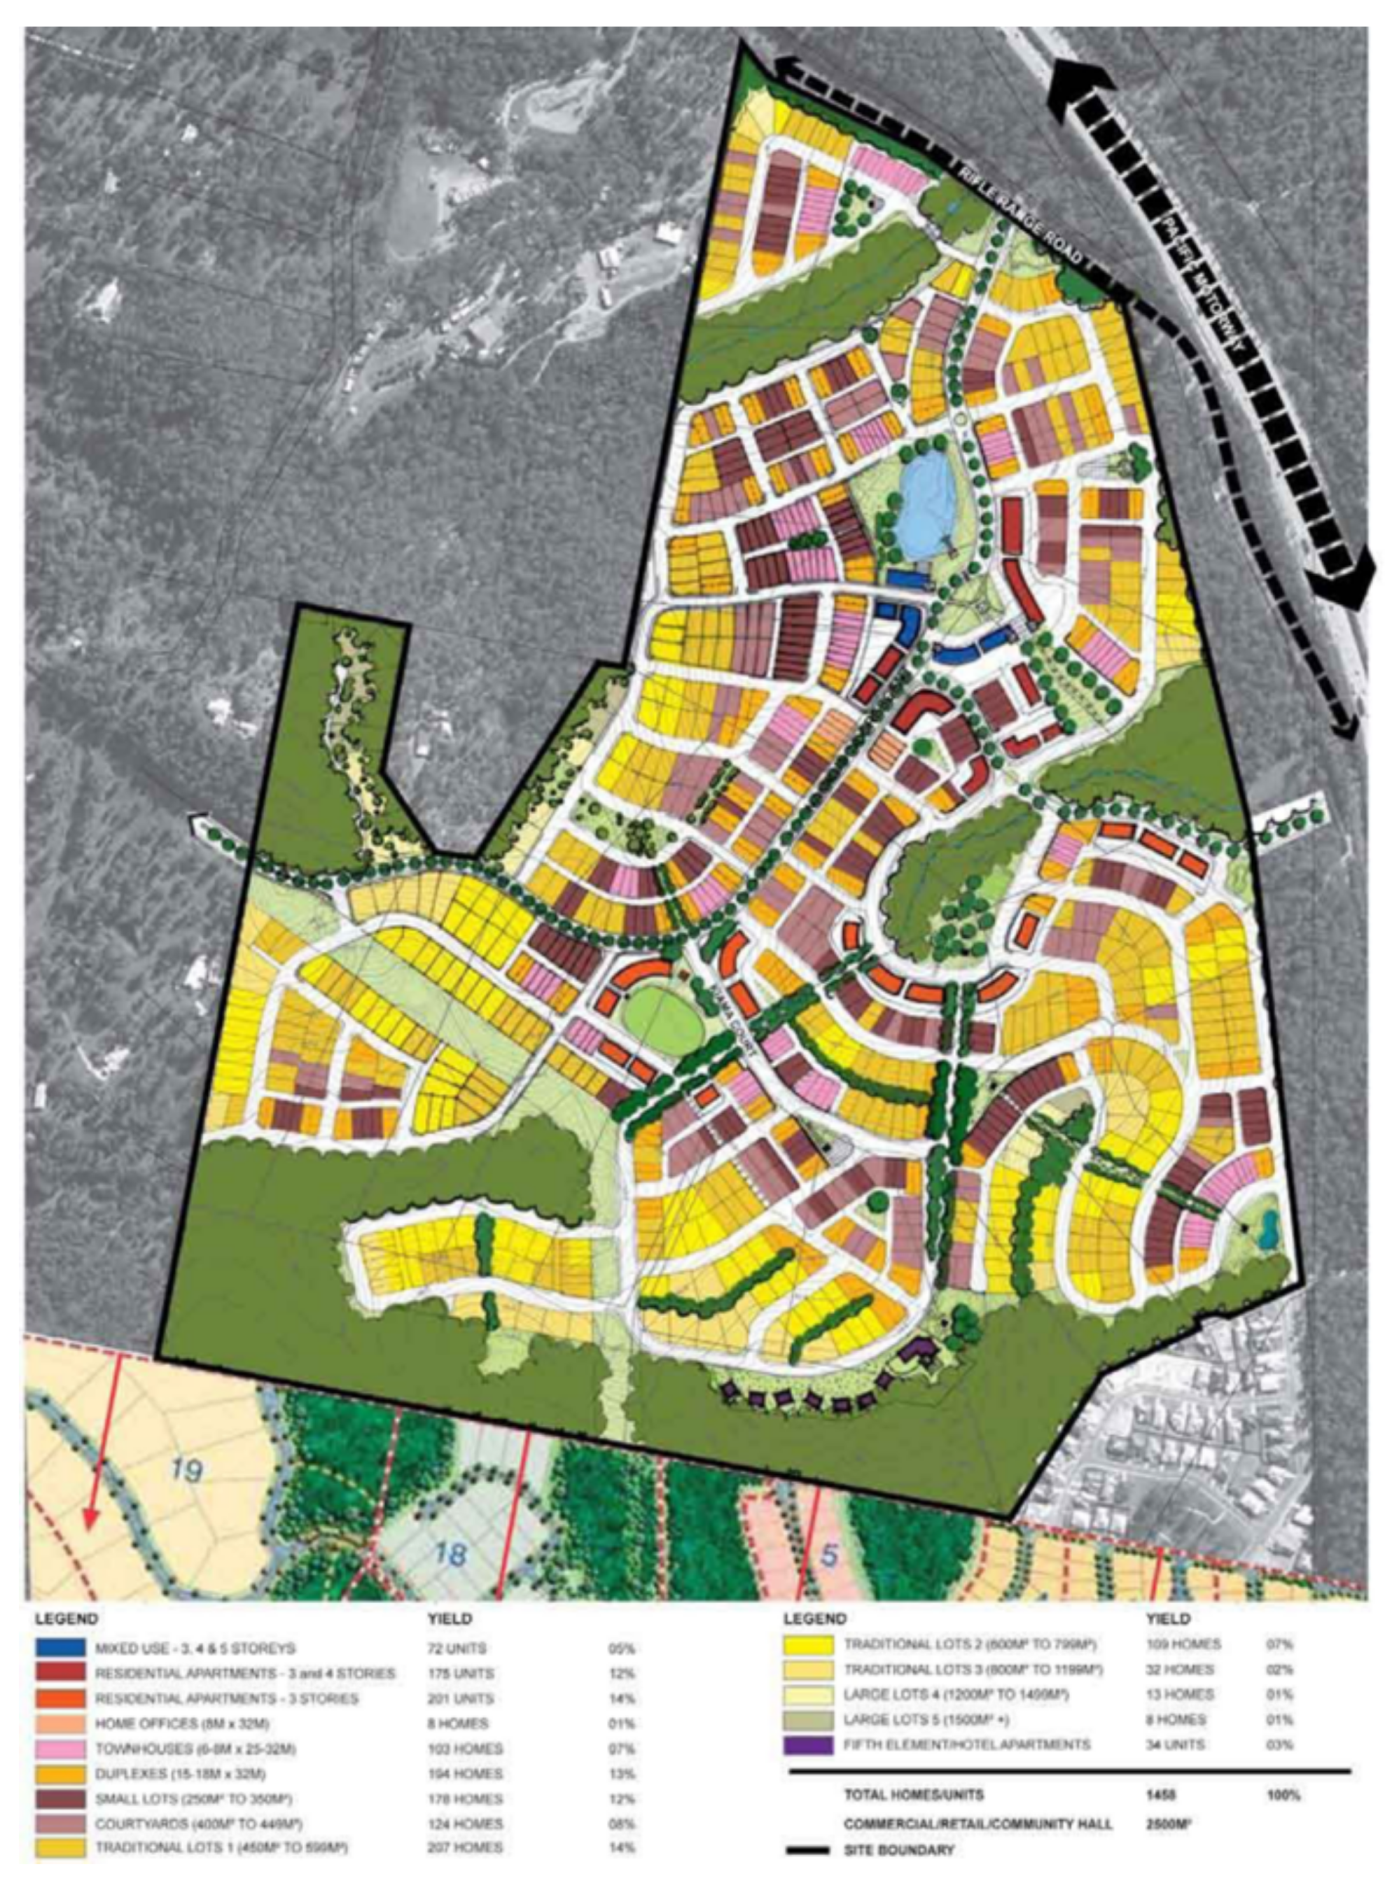
5.4.2. Allotment Types
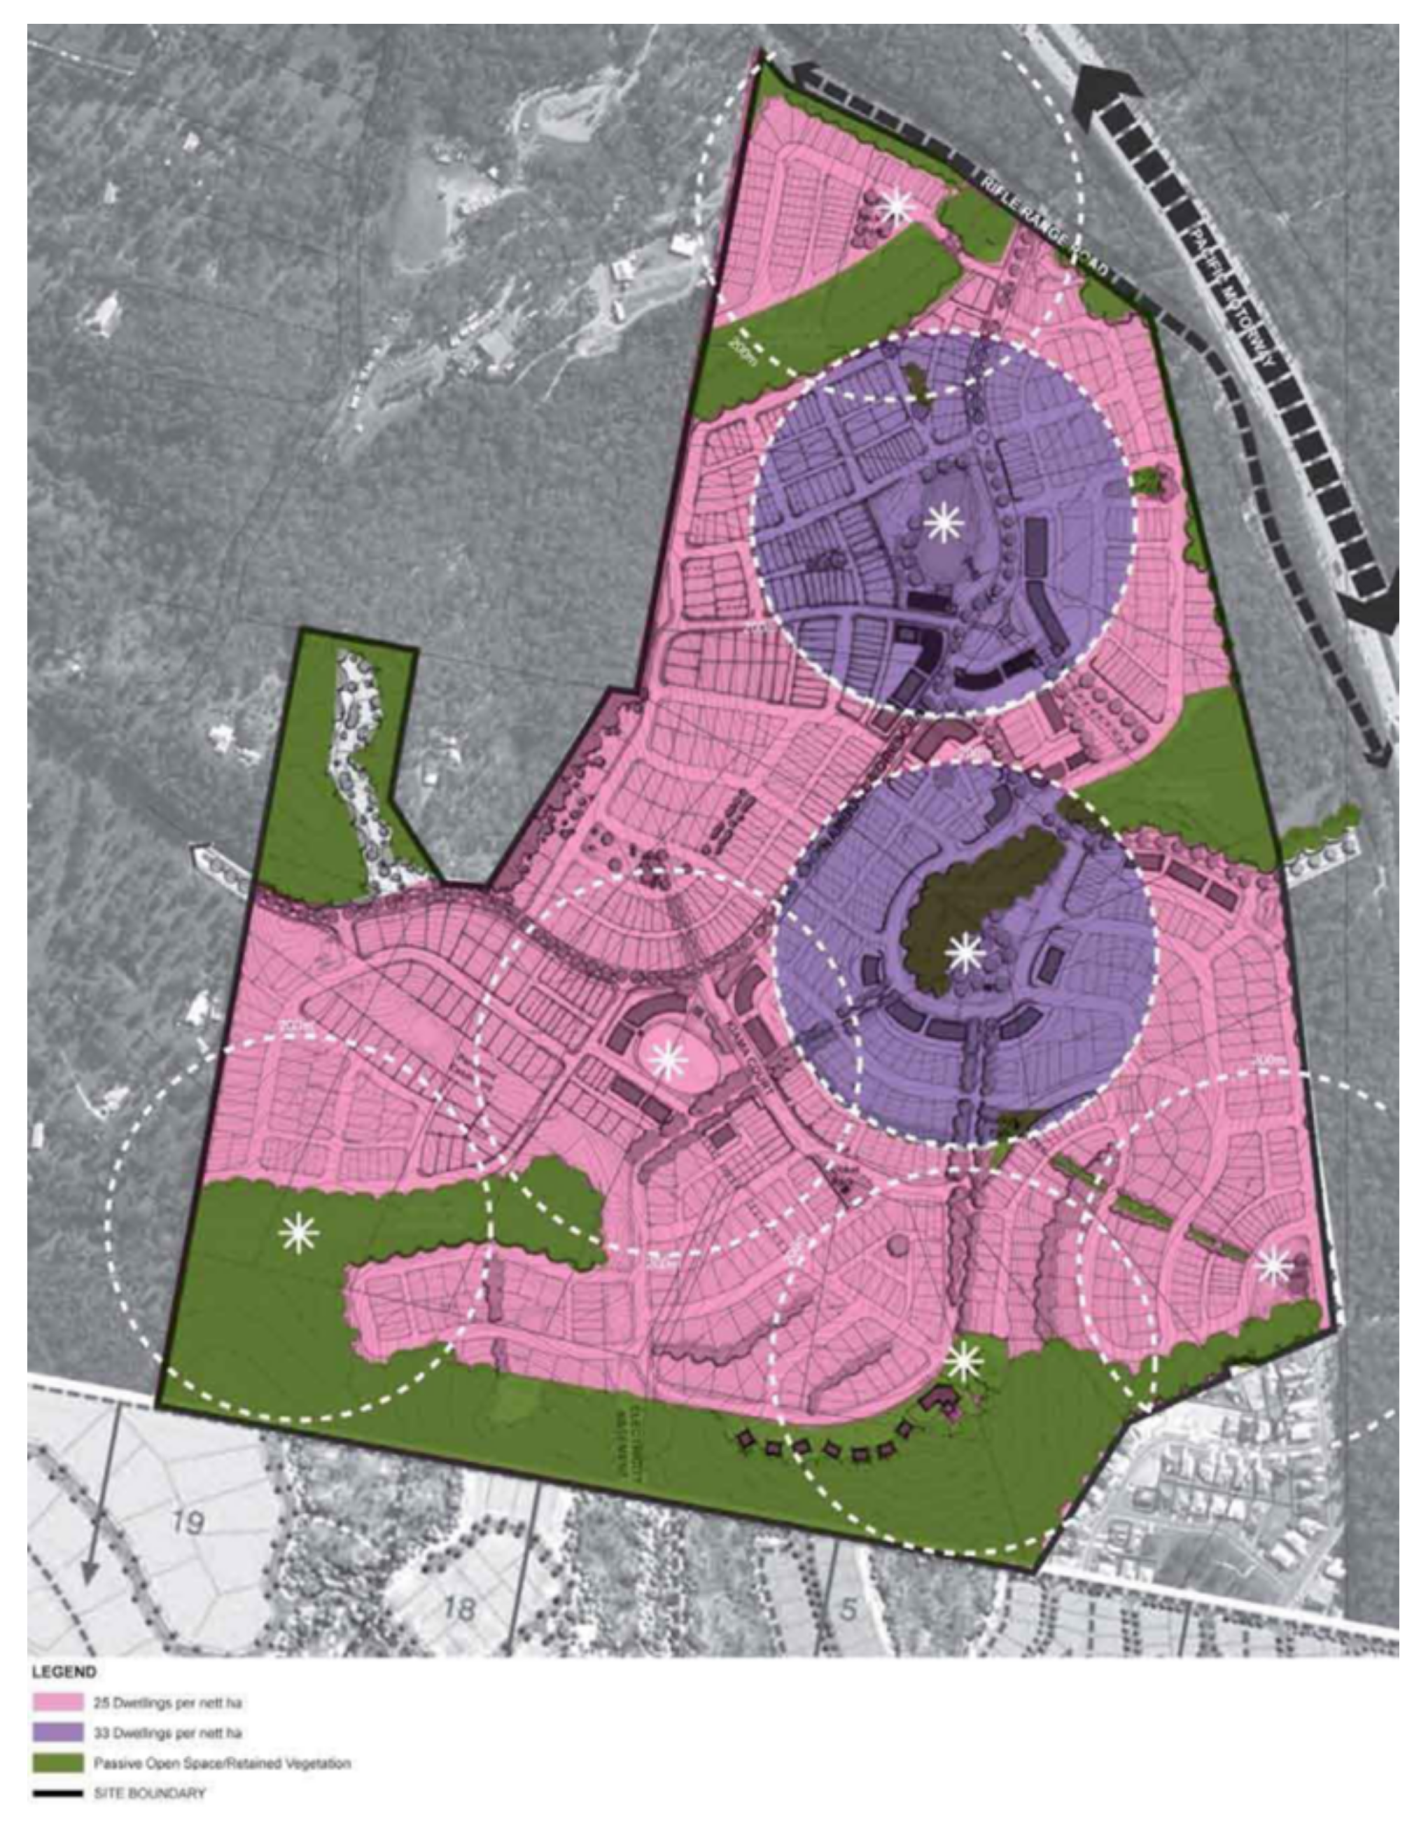
5.4.3. Density
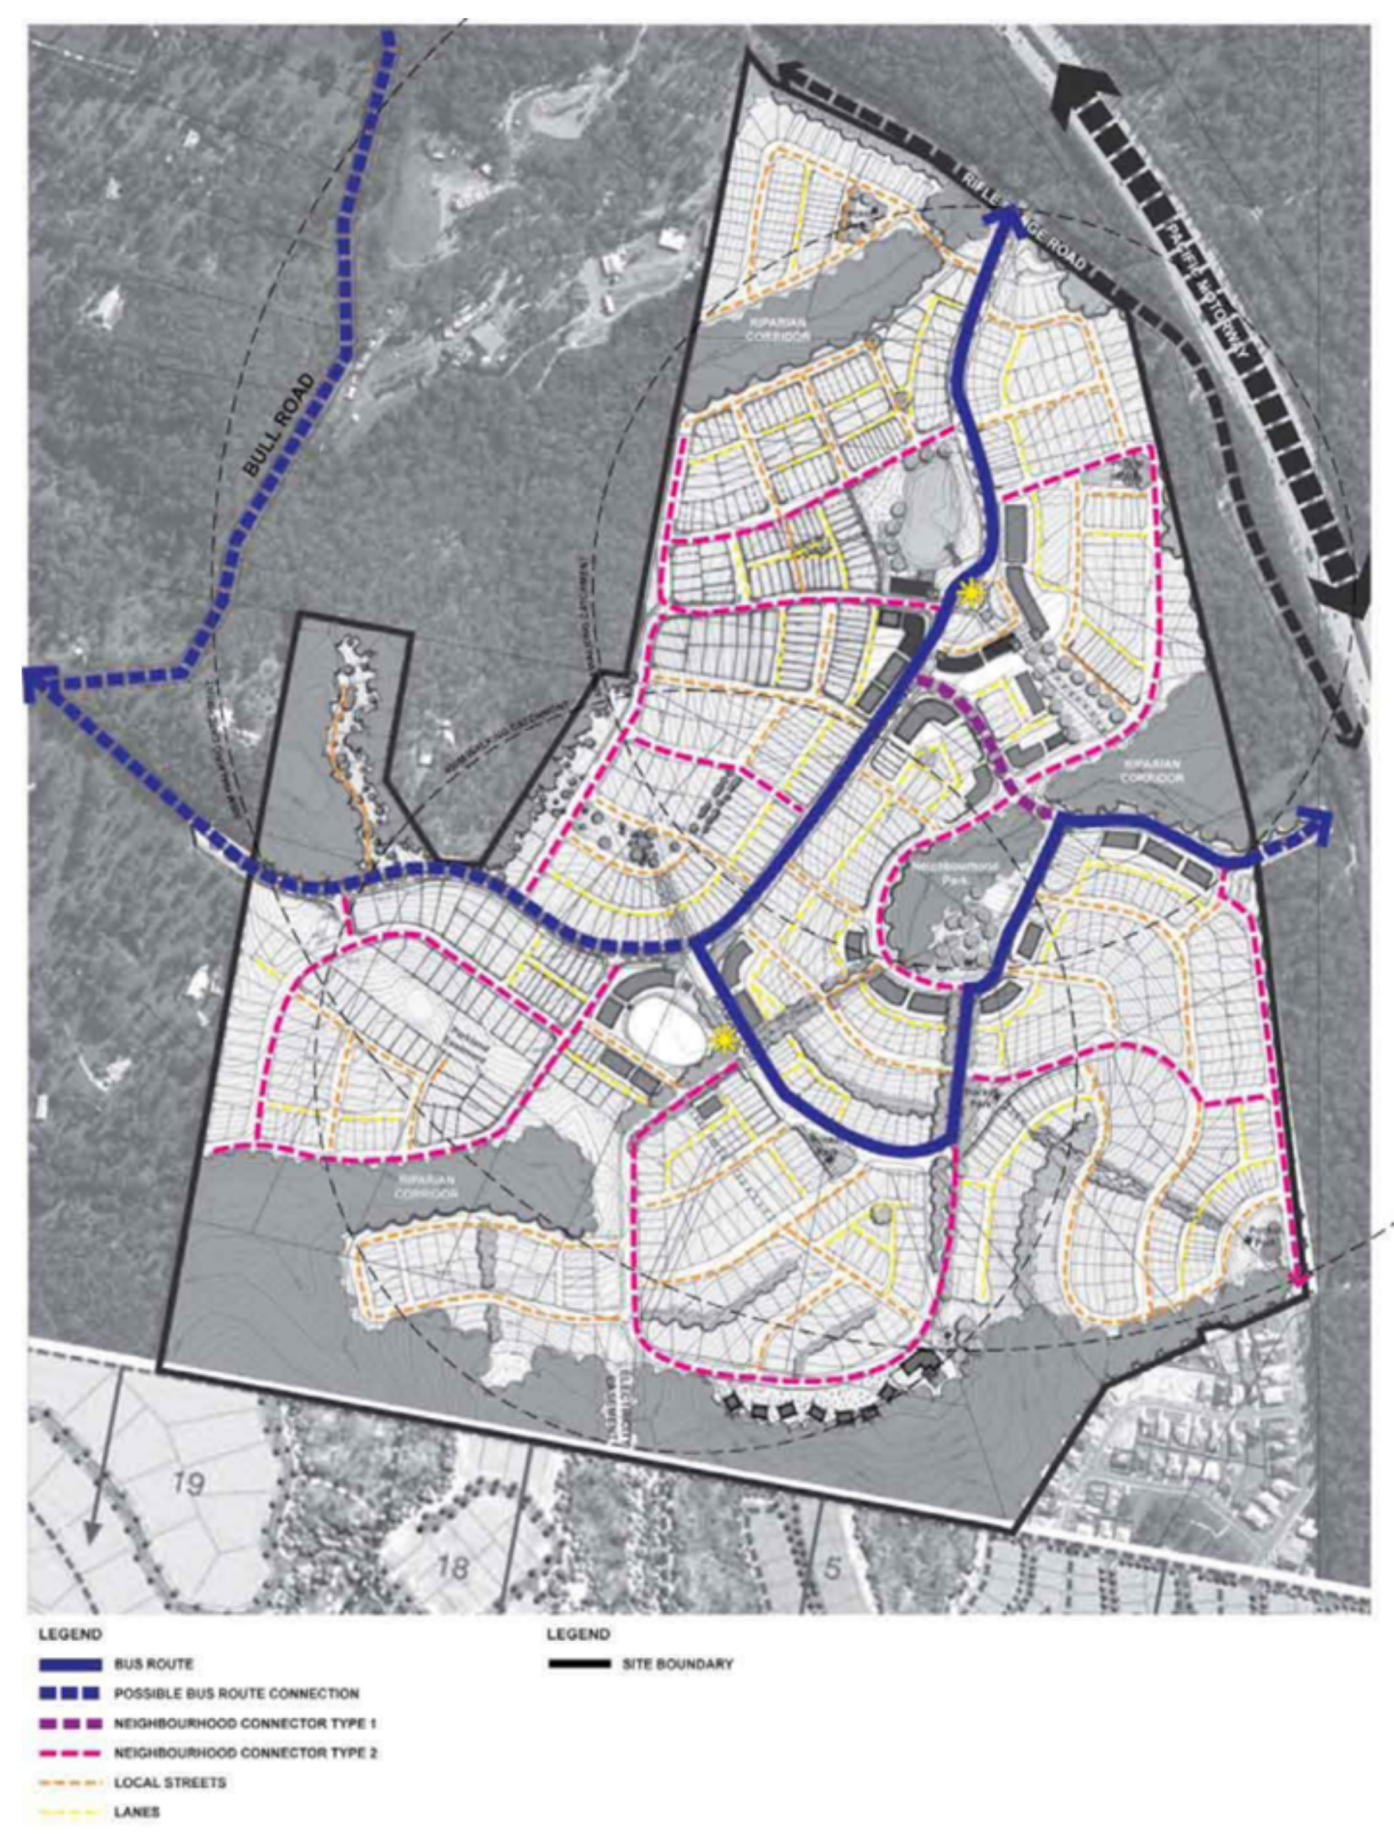
5.4.4. Road Network and Public Transport
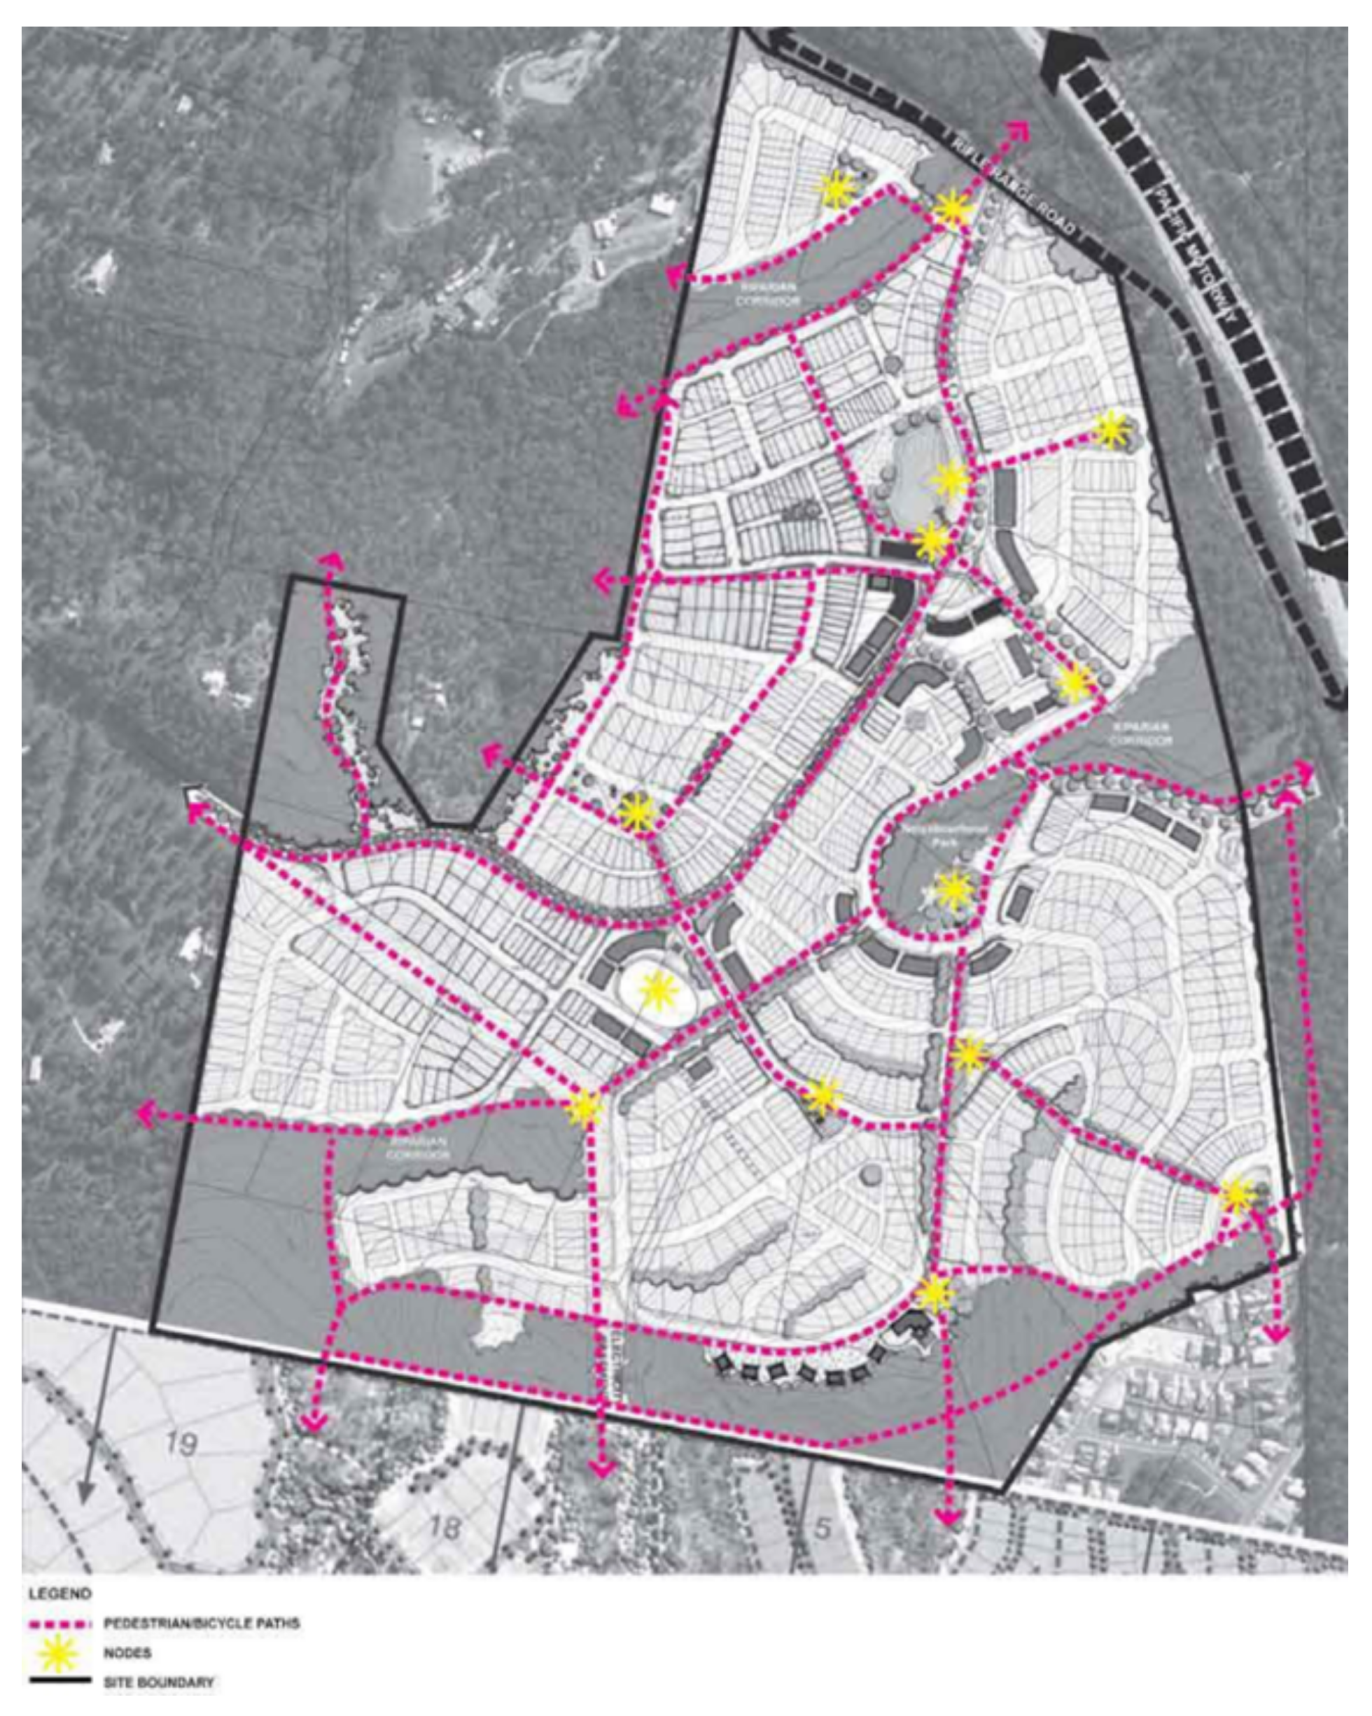
5.4.5. Pedestrian and Bicycle Network
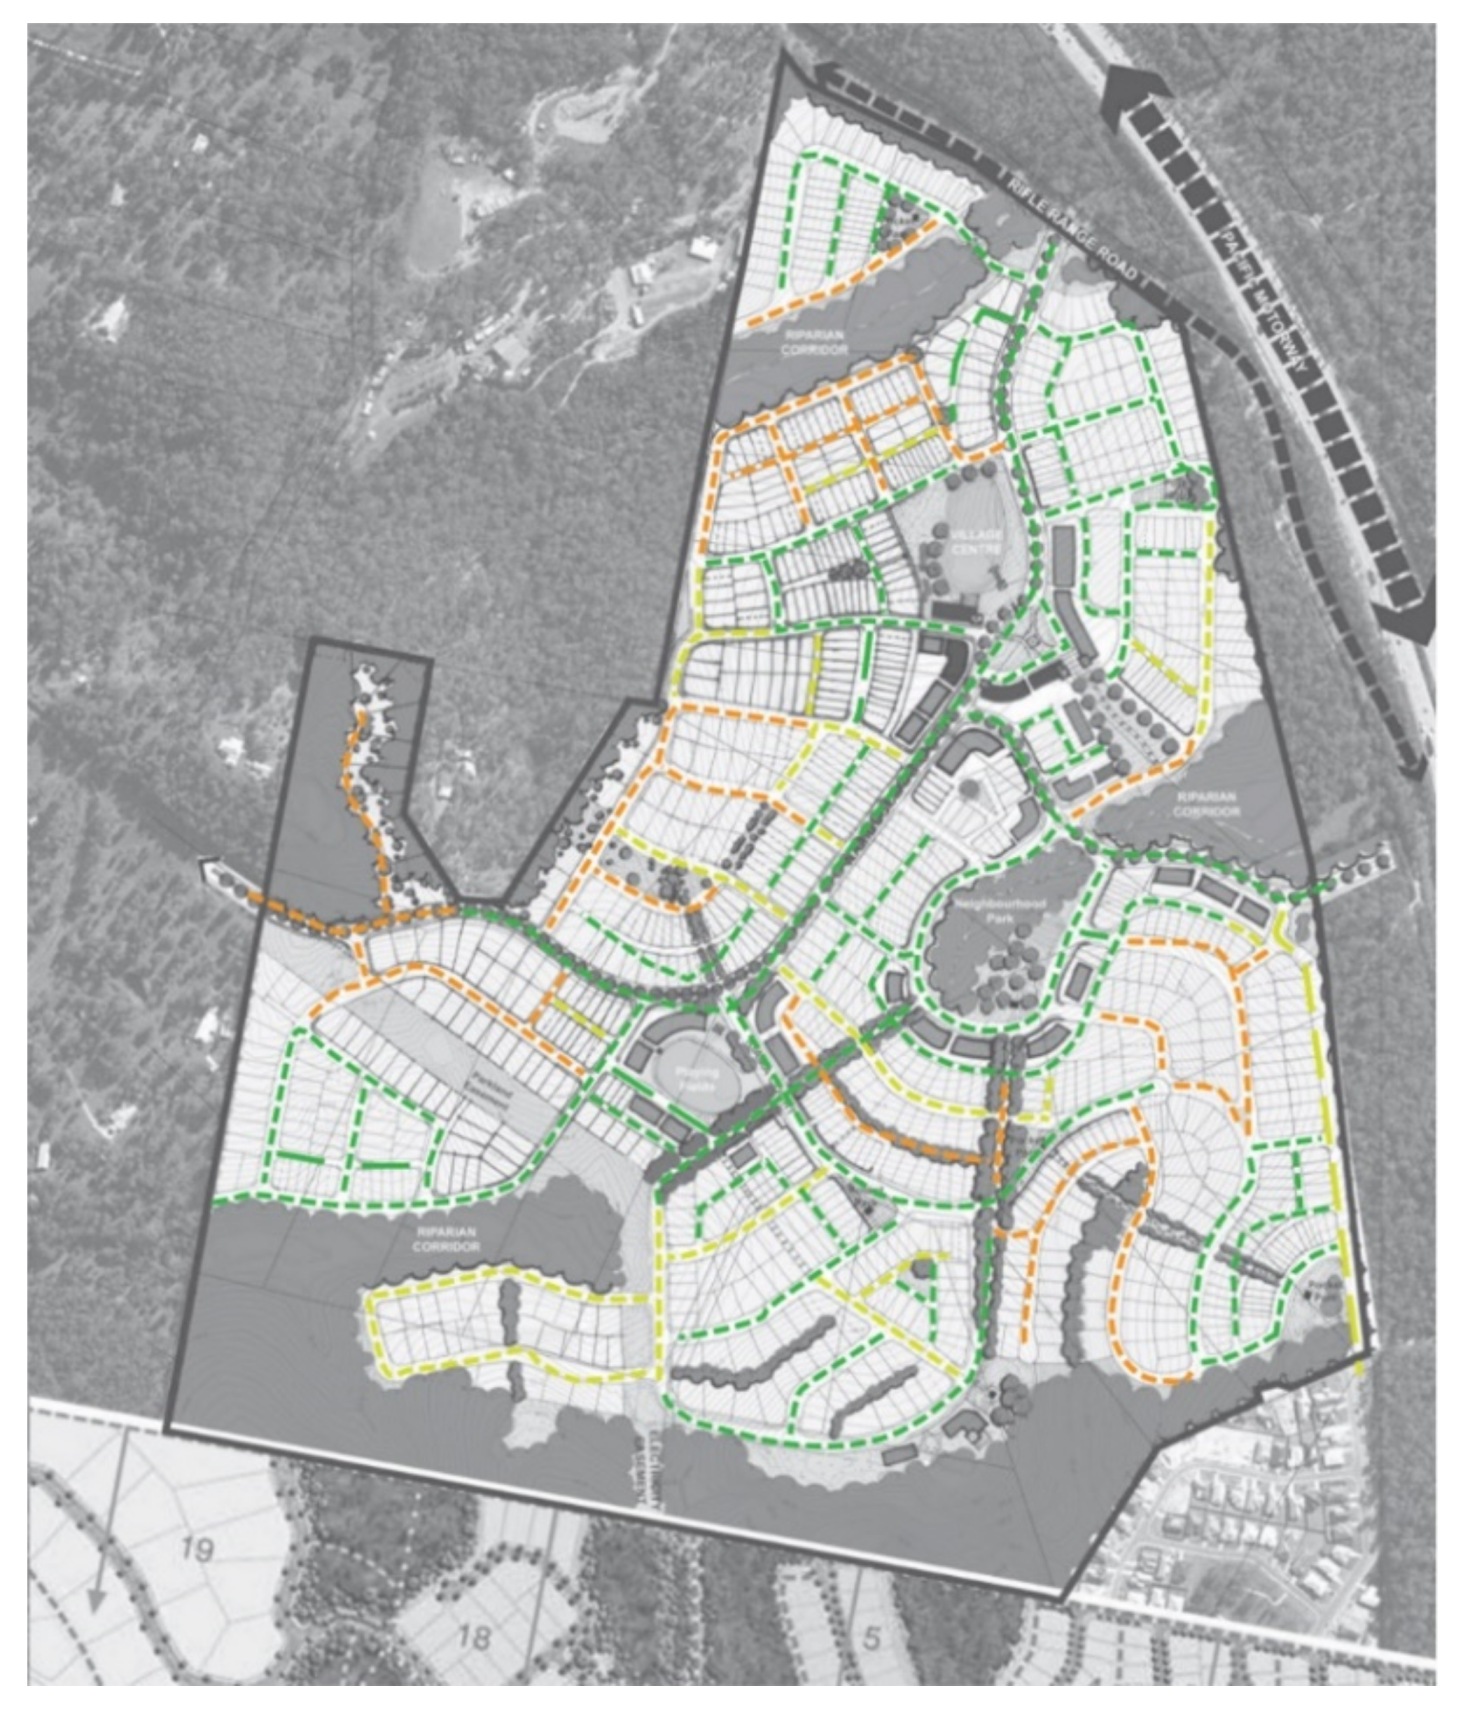
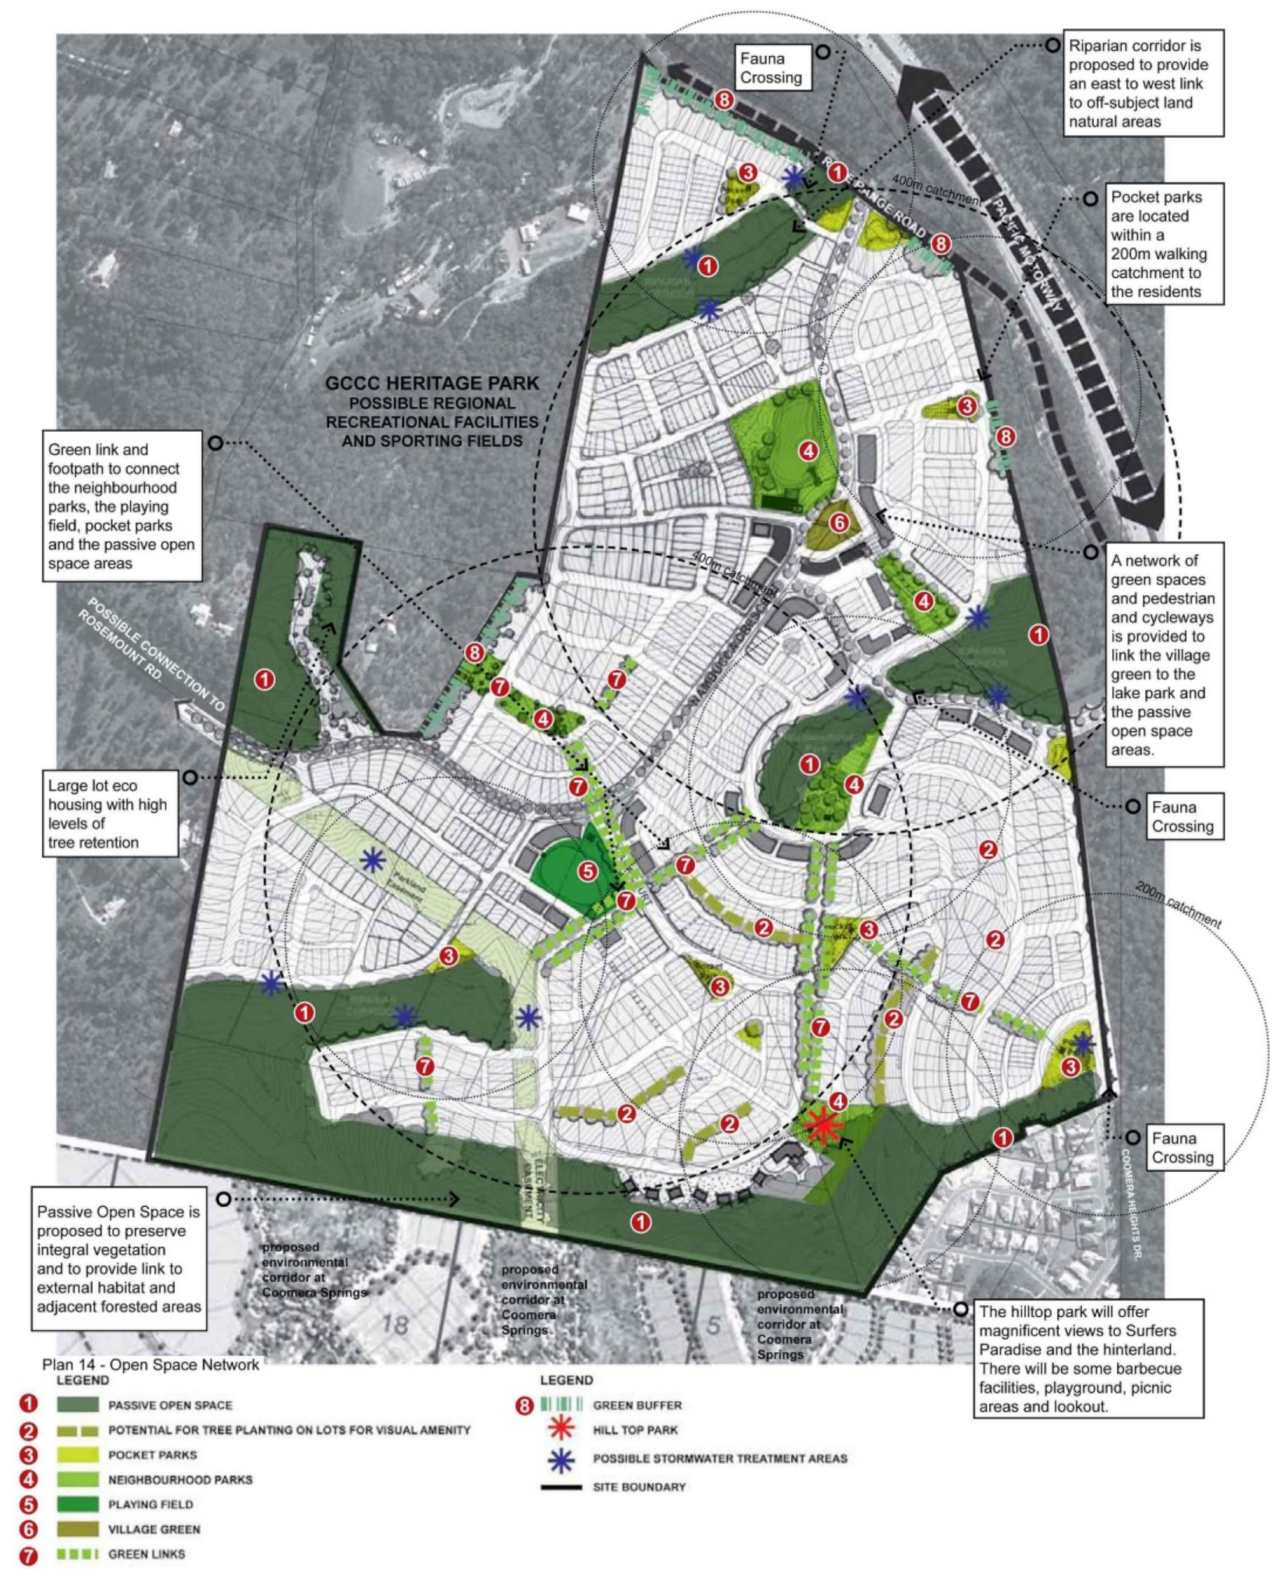
5.4.6. Open Space Network and Connectivity
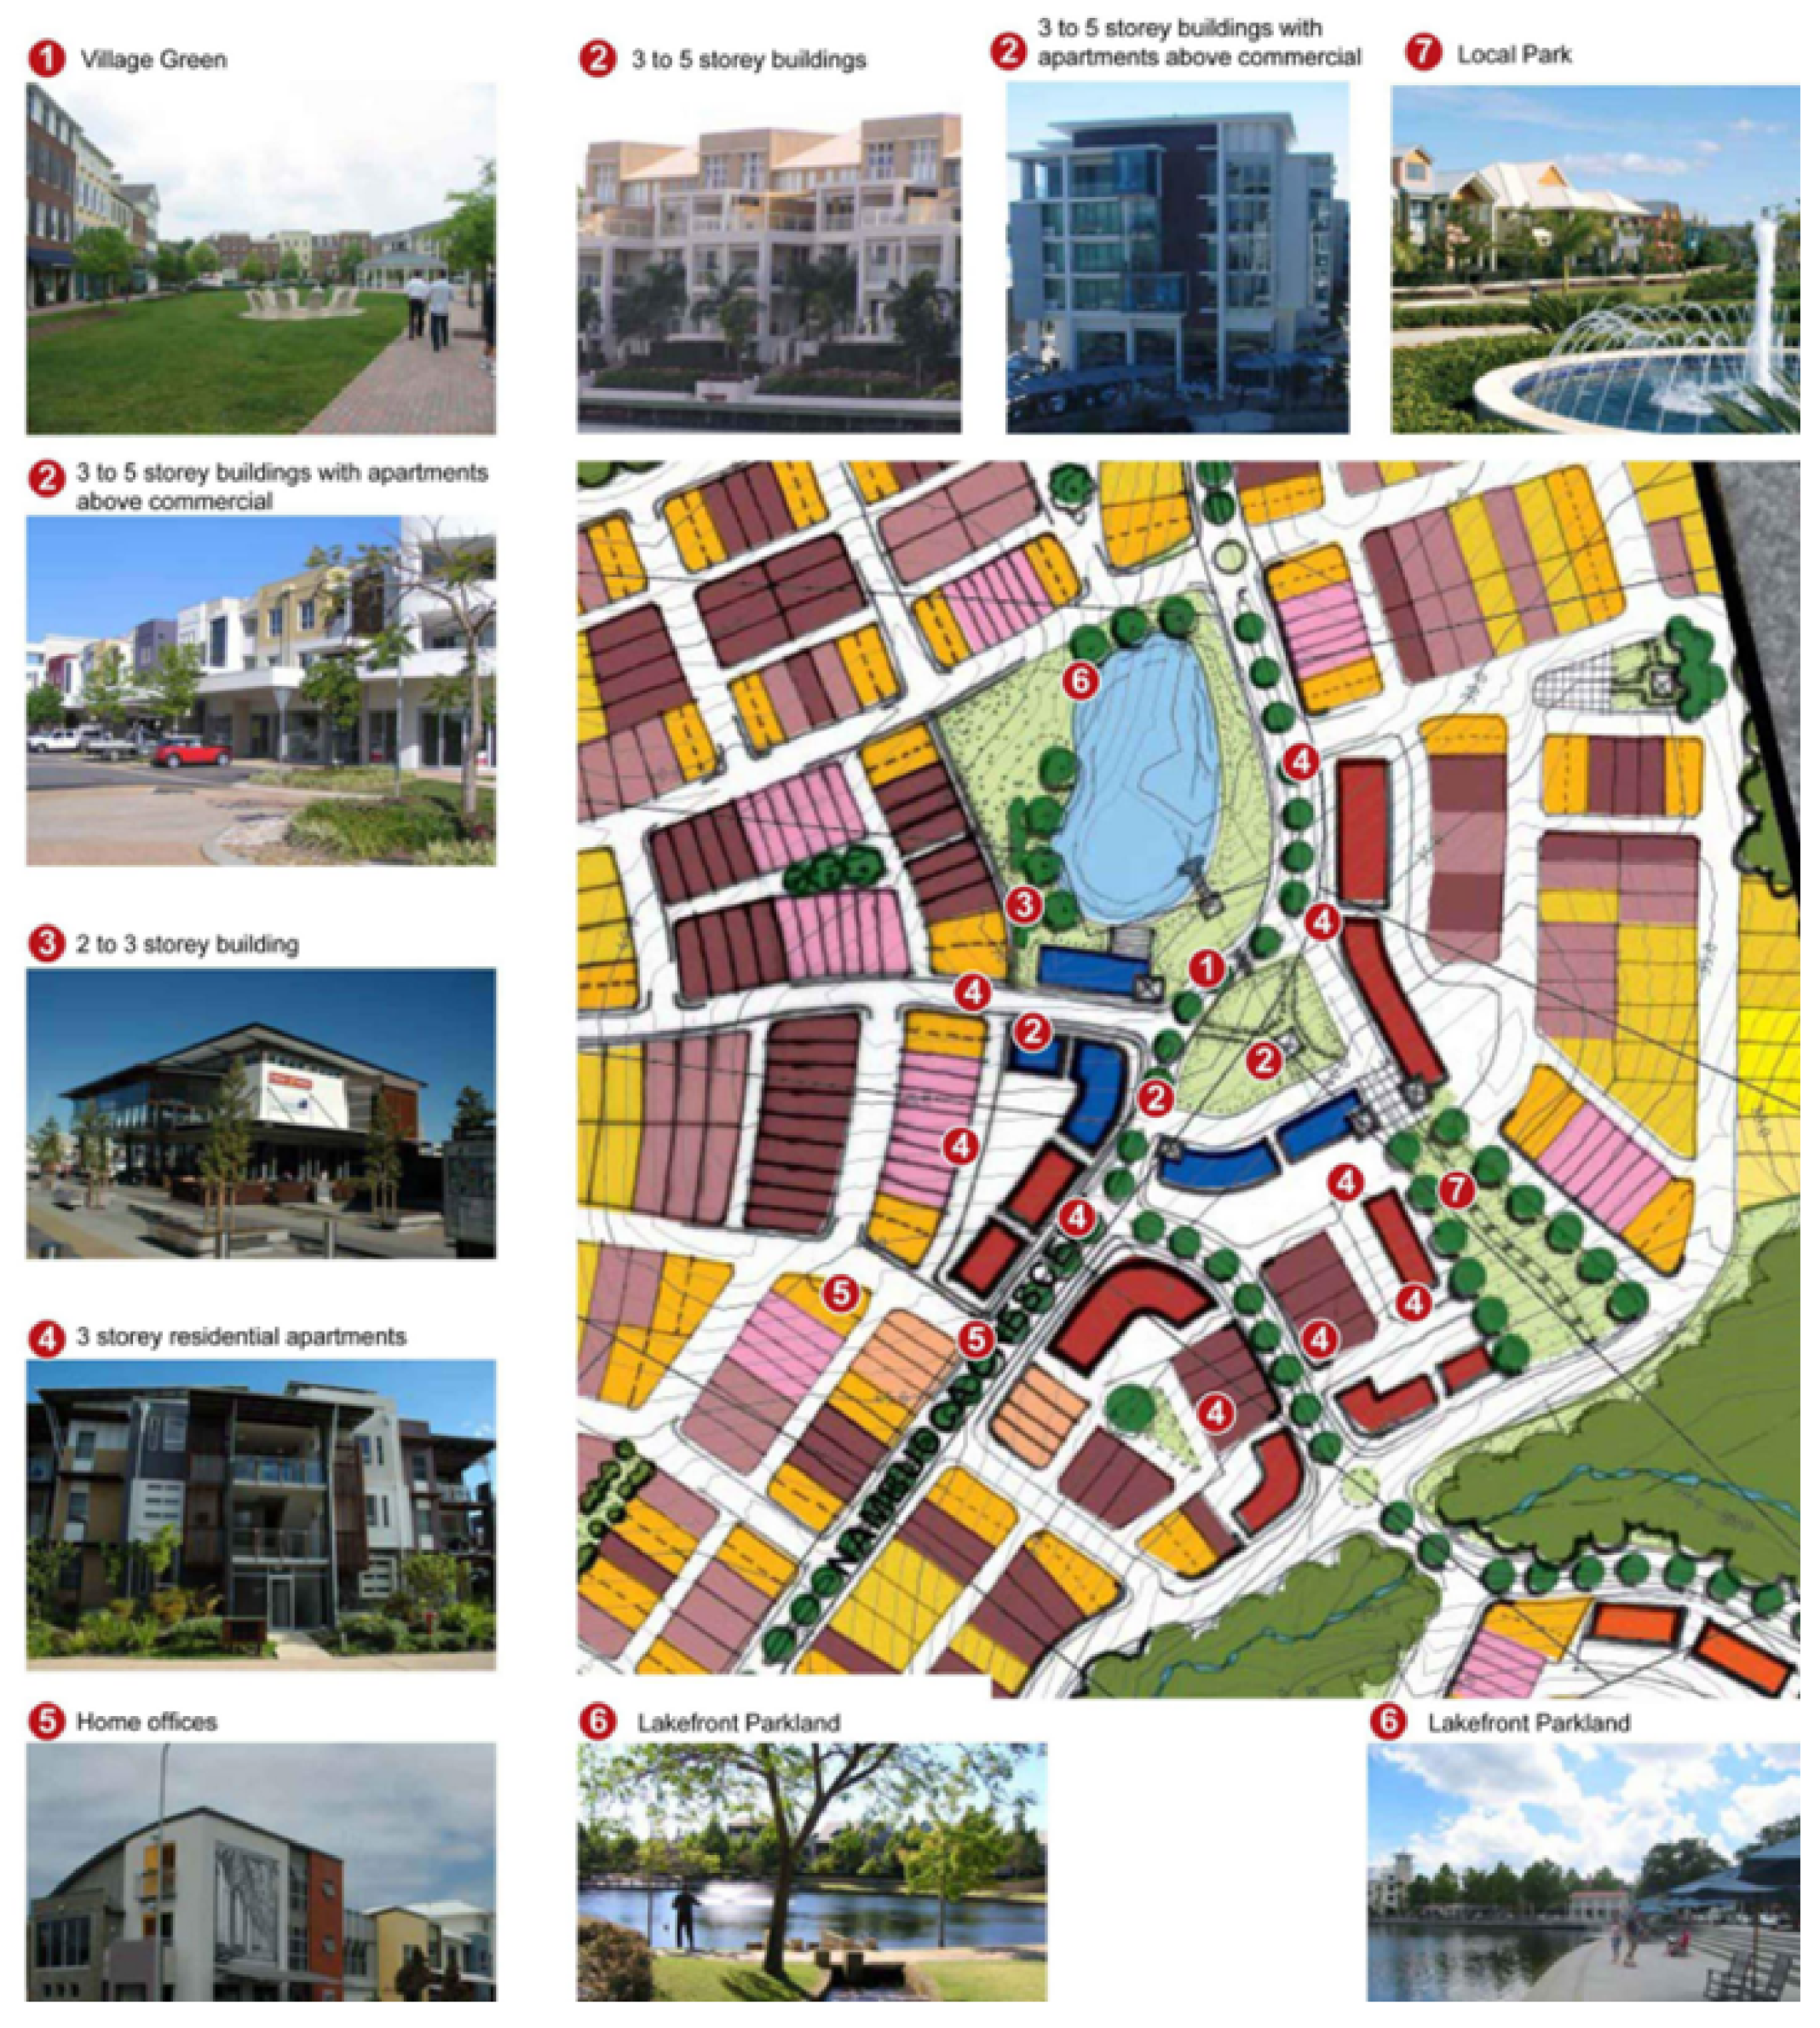
5.4.7. Proposed Mixed-Use Centre
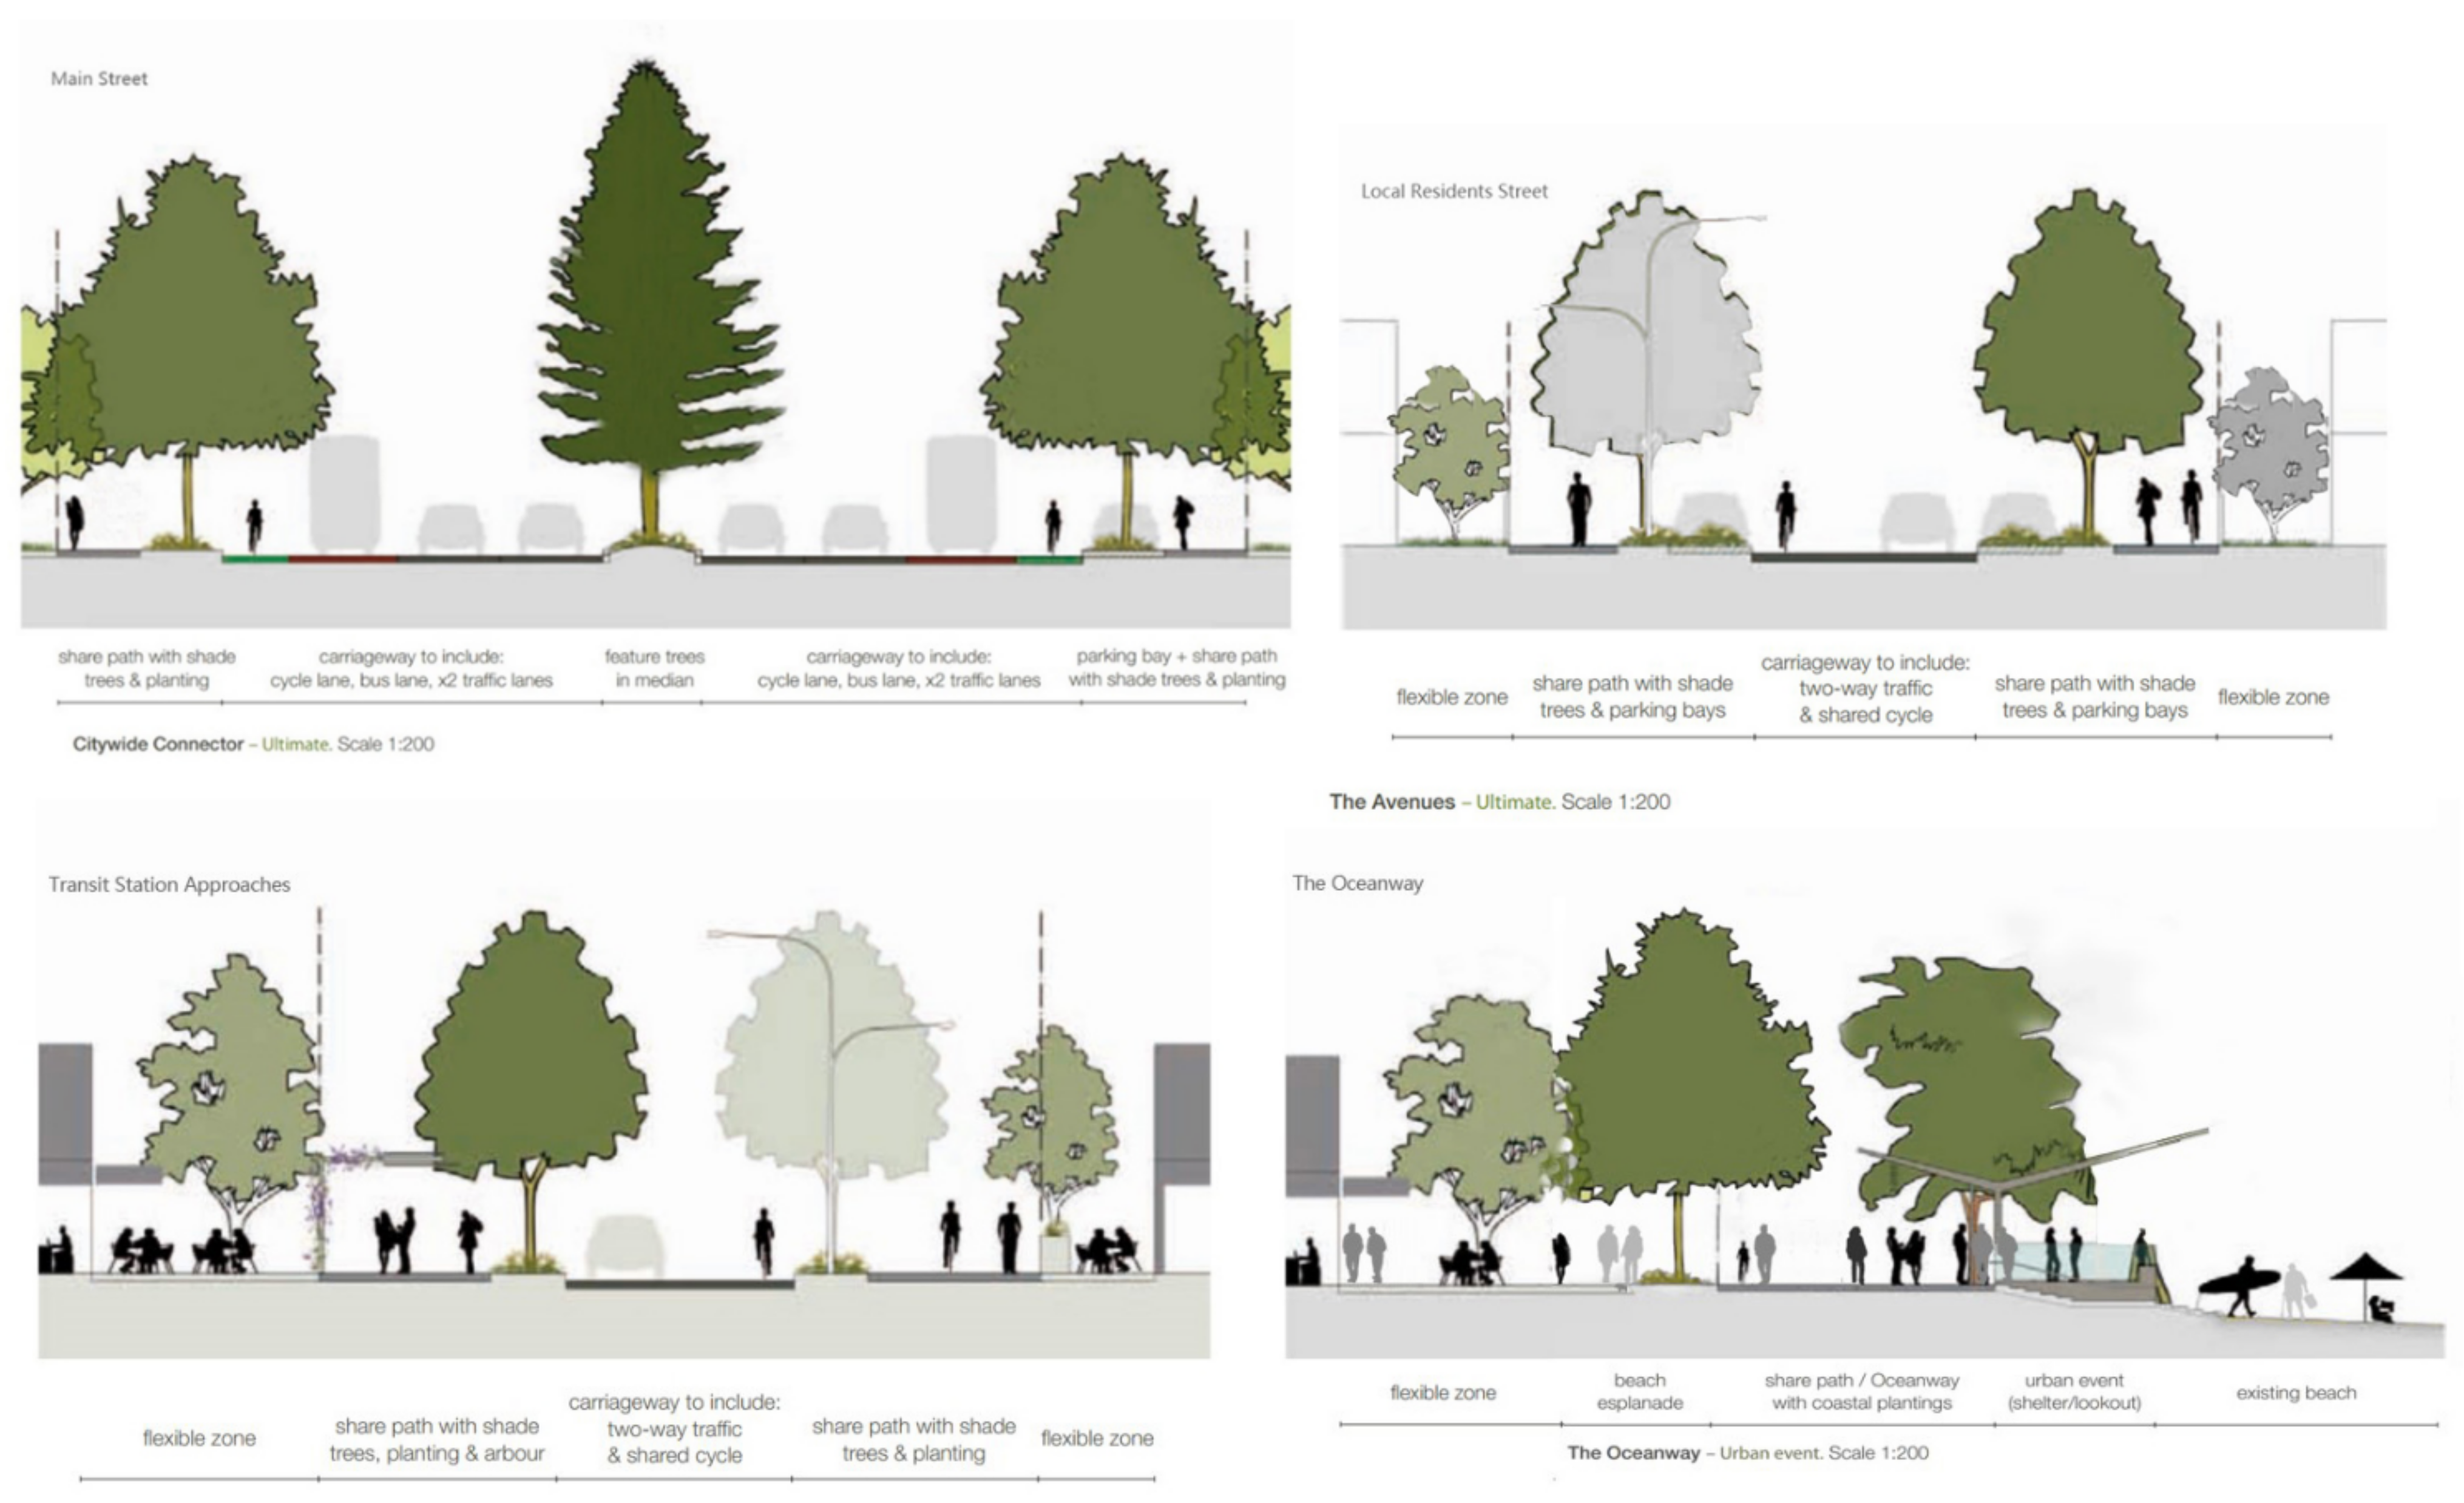
5.4.8. Detailed Street Design for Walkability
6. Conclusions
Author Contributions
Funding
Conflicts of Interest
References
- Mcmillen, D.P.; Smith, S.C. The Number of Subcenters in Large Urban Areas. J. Urban Econ. 2003, 53, 321–338. [Google Scholar] [CrossRef]
- Newman, P.; Jennings, I. Cities as Sustainable Ecosystems: Principles and Practices; Island Press: Washington, DC, USA, 2012. [Google Scholar]
- O’Riordan, T.; Voisey, H. The Transition to Sustainability: The Politics of Agenda 21 in Europe; Taylor & Francis: Abingdon, UK, 2013. [Google Scholar]
- Odland, J. The Conditions for Multi-Center Cities. Econ. Geogr. 1978, 54, 234–244. [Google Scholar] [CrossRef]
- Passerini, G.; Rodriguez, G.; Ricci, S. Coastal Cities and Their Sustainable Future III; WIT Press: Southampton, UK, 2019. [Google Scholar]
- South East Queensland Government. South East Queensland Regional Plan 2009–2031; Minister for Infrastructure and Planning: Brisbane, QLD, Australia, 2009.
- Gympie Regional Council. Part 3—Strategic Framework; Gympie Regional Council: Burnett, Australia, 2019.
- The Housing Corporation; English Partnerships; Roger Evans Associates; Llewelyn-Davies. Urban Design Compendium: Llewelyn-Davies, 2nd ed.; Llewelyn-Davies: London, UK, 2007; Volume 2, pp. 54–72.
- U.S. Federal Transit Administration; Transit Cooperative Research Program; Transportation Research Board of the National Academies. Transit-Oriented Development in the United States: Experiences, Challenges, and Prospects; Transportation Research Board: Washington, DC, USA, 2004; Volume 102, pp. 425–430.
- Newman, P.; Kenworthy, J. Urban design to reduce automobile dependence. Opolis 2006, 2, 35–52. [Google Scholar]
- Singh, R. Factors Affecting Walkability of Neighborhoods. Procedia Soc. Behav. Sci. 2016, 216, 643–654. [Google Scholar] [CrossRef] [Green Version]
- Ben-Joseph, E. Changing the residential street scene: Adapting the shared street (woonerf) concept to the suburban environment. J. Am. Plan. Assoc. 1995, 61, 504–515. [Google Scholar] [CrossRef]
- Buchanan, C. Traffic in Towns: A Study of the Long Term Problems of Traffic in Urban Areas; Routledge: London, UK, 2015. [Google Scholar]
- Speck, J. Walkable City: How Downtown Can Save America, One Step at a Time. Pedestrians 2012, 103, 120. [Google Scholar]
- Yuen, B.; Chor, C.H. Pedestrian streets in Singapore. Transportation 1998, 25, 225–242. [Google Scholar] [CrossRef]
- Marvin, S.; Yang, J.; Zheng, Y.; Rutherford, J. Correlation, Mechanism, Control: Research on High-density Urban Pedestrian Suitability Environment Construction Based on Micro-climate Assessment. Urban Plan. Int. 2019, 34, 16–26. [Google Scholar] [CrossRef]
- O’Hare, D. Urban Walkability in the Subtropical City: Some Intemperate Considerations from SEQ. In Subtropical Cities 2006 Conference Proceedings: Achieving Ecologically Sustainable Urbanism in a Subtropical Built Environment; Queensland University of Technology: Brisbane, Australia, 2006. [Google Scholar]
- Britain Government. Chapter Xli: Stationery Office. In Birmingham City Council Act 1985: Elizabeth II; Britain Government: London, UK, 1985. [Google Scholar]
- Kenworthy, J. Urban planning and transport paradigm shifts for cities of the post-petroleum age. J. Urban Technol. 2007, 14, 47–70. [Google Scholar] [CrossRef]
- Cook, S.; Tjandraatmadja, G.; Ho, A.; Sharma, A. Definition of Decentralised Systems in the South East Queensland Context; Urban Water Security Research Alliance: Brisbane, Australia, 2008. [Google Scholar]
- Ivory, V.C.; Blakely, T.; Pearce, J.; Witten, K.; Bagheri, N.; Badland, H.; Schofield, G. Could strength of exposure to the residential neighbourhood modify associations between walkability and physical activity? Soc. Sci. Med. 2015, 147, 232–241. [Google Scholar] [CrossRef] [Green Version]
- Marshall, W.E.; Piatkowski, D.P.; Garrick, N.W. Community design, street networks, and public health. J. Transp. Health 2014, 1, 326–340. [Google Scholar] [CrossRef]
- Etemadi, A.; Abnet, C.C.; Kamangar, F.; Islami, F.; Khademi, H.; Pourshams, A.; Dawsey, S.M. Impact of body size and physical activity during adolescence and adult life on overall and cause-specific mortality in a large cohort study from Iran. Eur. J. Epidemiol. 2014, 29, 95–109. [Google Scholar] [CrossRef] [Green Version]
- Bahrainy, H.; Khosravi, H. The impact of urban design features and qualities on walkability and health in under-construction environments: The case of Hashtgerd New Town in Iran. Cities 2013, 31, 17–28. [Google Scholar] [CrossRef]
- Zhang, Y.; Wu, W.; Lin, S.; Zhang, S. Study on the Aging of Outdoor Living Space in Urban Residential Areas—Taking Hangzhou as an Example. Archit. Cult. 2019, 7, 124–125. [Google Scholar]
- Gargiulo, C.; Zucaro, F.; Gaglione, F. A set of variables for elderly accessibility in urban areas. TeMA J. Land Use Mobil. Environ. 2018, 53–66. [Google Scholar] [CrossRef]
- Bian, Y.; Zhu, W. Walkability of Child Space: Learning from UNICEF Child-Responsive Urban Planning Handbook. Urban Design 2019, 3, 70–79. [Google Scholar]
- Yates, M.T.; Balmforth, D.; Lopez-Marco, A.; Uppal, R.; Oo, A.Y. Outcomes of patients diagnosed with COVID-19 in the early postoperative period following cardiac surgery. Interactive Cardiovasc. Thorac. Surg. 2020, 31, 483–485. [Google Scholar] [CrossRef]
- Algeciras, J.A.R.; Consuegra, L.G.; Matzarakis, A. Spatial-temporal study on the effects of urban street configurations on human thermal comfort in the world heritage city of Camagüey-Cuba. Build. Environ. 2016, 101, 85–101. [Google Scholar] [CrossRef]
- Huang, M.; Liu, G.; Tao, Y. Walk Score Calculation of Taipingqiao Street in Beijing; Beijing Surveying and Mapping: Beijing, China, 2017. [Google Scholar]
- Yang, J.; Wu, H.; Zheng, Y. Research on Characteristics and Interactive Mechanism of Street Walkability through Multi-Source Big Data: Nanjing Central District as a Case Study. Urban Plan. Int. 2019, 34, 33–42. [Google Scholar] [CrossRef]
- Zhang, H.; Jiang, Y.; Tao, C.; Wang, B.; Xia, H.; Pang, B. Walkability evaluation of daily service facilities based on low-carbon travel guide. Sichuan Build. Sci. 2016, 42, 97–101. [Google Scholar]
- Zhang, Y.; Jun, L.I. Spatial Pattern of Urban Streets Based on Low-Carbon Travel. Mod. Urban Res. 2016, 4, 60–67. [Google Scholar]
- Wu, S. Research on the Block Scale and Density of Road Network Planning Under the Guidance of Low-Carbon. Huazhong Archit. 2016, 7, 29–33. [Google Scholar]
- Abley, S.; Turner, S.; Agency, N.T. Predicting Walkability; NZ Transport Agency: Wellington, New Zealand, 2011.
- Blecic, I.; Cecchini, A.; Trunfio, G.A. Towards a Design Support System for Urban Walkability. Procedia Comput. Sci. 2015, 51, 2157–2167. [Google Scholar] [CrossRef]
- De Boer, E. Transport Sociology: Social Aspects of Transport Planning; Elsevier Science: Amsterdam, The Netherlands, 2013. [Google Scholar]
- Wang, L. Research on the Urban Rail Transit Design between Urban sub-center and Center of City. J. Railw. Eng. Soc. 2017, 34, 73–76. [Google Scholar]
- Reid, S. Fit for purpose: Evaluating walkability. In Proceedings of the Institution of Civil Engineers-Engineering Sustainability; Thomas Telford Ltd.: London, UK, 2008; Volume 161, pp. 105–112. [Google Scholar] [CrossRef]
- Shao, Z. New Urban Complex. The New Urban Area Development; Springer: Berlin/Heidelberg, Germany, 2015; pp. 321–323. [Google Scholar]
- Gong, F.-Y.; Zeng, Z.-C.; Zhang, F.; Li, X.; Ng, E.; Norford, L.K. Mapping sky, tree, and building view factors of street canyons in a high-density urban environment. Build. Environ. 2018, 134, 155–167. [Google Scholar] [CrossRef]
- Liang, C.; Zeng, J. Research on Optimization of Walking Environment in Historical District Based on Importance-performance Analysis: A Case Study of the Five Avenues, Tianjin. 2019. Available online: https://www.researchgate.net/publication/337020067_Research_on_Optimization_of_Walking_Environment_in_Historical_District_Based_on_Importance-performance_Analysis_A_Case_Study_of_the_Five_Avenues_Tianjin (accessed on 20 February 2021).
- Liu, M.; Jiang, Y.; He, J. Quantitative Evaluation on Street Vitality: A Case Study of Zhoujiadu Community in Shanghai. Sustainability 2021, 13, 3027. [Google Scholar] [CrossRef]
- Wang, H.; Yang, Y. Neighbourhood walkability: A review and bibliometric analysis. Cities 2019, 93, 43–61. [Google Scholar] [CrossRef]
- Yin, R.K. Estudo de Caso: Planejamento e Métodos; Bookman: Taipei, China, 2001. [Google Scholar]
- Zlatkovic, M.; Zlatkovic, S.; Sullivan, T.; Bjornstad, J.; Shahandashti, S.K.F. Assessment of effects of street connectivity on traffic performance and sustainability within communities and neighborhoods through traffic simulation. Sustain. Cities Soc. 2019, 46, 101409. [Google Scholar] [CrossRef]
- TTM Consulting Pty. Ltd. (Firm); Gold Coast City Council. Coomera Charrette Planning Study 1995 Report: Draft; TTM Consulting: Brisbane, QLD, Australia, 1995.
- Frey, H. Designing the City: Towards a More Sustainable Urban Form; Taylor & Francis: Abingdon, UK, 2003. [Google Scholar]
- Wisconsin Department of Transportation; Division of Investment Management; Bureau of Planning. Wisconsin State Highway Plan; Technical Report; Division of Investment Management; Wisconsin Department of Transportation: Madison, WI, USA; Bureau of Planning: Portland, OR, USA, 2000.
- Griffith, D.A. Modelling urban population density in a multi-centered city. J. Urban Econ. 1981, 9, 298–310. [Google Scholar] [CrossRef]
- O’Hare, D. Inner-Urban Sustainability: A Case Study of South Brisbane Peninsula. In Proceedings of the CIB 2003 Int’l Conference on Smart and Sustainable Built Environment, Queensland University of Technology, Brisbane, QLD, Australia, 19–21 November 2003; pp. 1–8. [Google Scholar]
- Ennis, G.M.; Finlayson, M.P.; Speering, G. Expecting a boomtown? Exploring potential housing-related impacts of large scale resource developments in Darwin. Hum. Geogr. 2013, 7, 33–42. [Google Scholar] [CrossRef] [Green Version]
- Garcia-López, M.-À.; Hémet, C.; Viladecans-Marsal, E. Next train to the polycentric city: The effect of railroads on subcenter formation. Reg. Sci. Urban Econ. 2017, 67, 50–63. [Google Scholar] [CrossRef] [Green Version]
- Setiyowati, T.R.; Handayani, W.; Damayanti, M.; Rudiarto, I. Towards an independent city: The role of Ungaran City as a urban sub-center of Semarang City. In IOP Conference Series: Earth and Environmental Science; IOP: Bristol, UK, 2018. [Google Scholar]
- Romanos, M.C. Household location in a linear multi-center metropolitan area. Reg. Sci. Urban Econ. 1977, 7, 233–250. [Google Scholar] [CrossRef]
- Sargeant, B.; Mitchell, N.; Webb, N. Place Making in the Urban Corridor; Modern Urban Research: Melbourne, VIC, Australia, 2009. [Google Scholar]
- Brooke, W.; Minnery, J. Understanding city fringe gentrification: The role of a‘potential investment gap’. In Proceedings of the Conference on State of Australian Cities, Griffith University, Brisbane, QLD, Australia, 30 November–2 December 2005; Volume 30. [Google Scholar]
- Hillsdon, M.; Panter, J.; Foster, C.; Jones, A. The relationship between access and quality of urban green space with population physical activity. Public Health 2006, 120, 1127–1132. [Google Scholar] [CrossRef]
- Iglesias, F.; Shinji, I. Creation and evolution of the open space in the sub center high raise zone of Nishi Shinjuku (Japan). J. Agric. Sci. 2002, 46, 250–264. [Google Scholar]


| Time | Policy | Presenter | Highlights | Implementing Country | Effect |
|---|---|---|---|---|---|
| 1928 | Radburn model | Radburn | Create a traffic model that separates people and vehicles, which is specifically manifested in setting up independent motorized traffic flow lines and pedestrian (bicycle) traffic flow lines [17]. | United States | Some new city constructions in the United States in the 1930s were based on Radburn model, such as the Senasai Garden City and cites in Ohio, Maryland and New Jersey, Wisconsin [17]. |
| 1960 | Traffic calming | Colin Buchanan | Completely separate motor vehicles from pedestrians, redevelop vehicle restricted areas in urban areas, and establish pedestrian corridors [13]. | Germany, Netherlands, and United Kingdom | The concept of traffic calming has aroused strong response and controversy in the United Kingdom and other European and American countries [18]. However, it has not become a government policy for a long time. |
| 1969 | Woonerf | Niek de Boer | Woonerf is a derivative of the idea of traffic tranquility, emphasizing that pedestrians, cyclists, and vehicles share the street space in the urban space [10,19]. | Canada, United Kingdom, Germany, France, Japan, and Singapore | In 1976, woonerf became a guide for urban road design in the Netherlands [20]. It was gradually accepted by most European and Asian countries and became one of the main forms of street design for modern, new residential areas. |
| 2014 | Walkable city | Jeff Speck | Emphasis is on improving the setting of safe pedestrian passages and reasonable space allocation of pedestrian facilities to make the city more walkable while ensuring travel safety and sustainable urban development [14]. | United States, United Kingdom, China, Singapore, etc. | The concept of a walkable city has become a hotspot of urban designresearch in recent years [14,20]. |
| Location | Setting | Predominant Housing Type | ||
|---|---|---|---|---|
| Detached & Linked Houses | Terraced Houses & Flats | Mostly Flats | ||
| Site within Town Center | Central | 240–1100 h/ha 240–435 u/ha Ave. 2.7 h/u | ||
| Urban | 200–450 h/ha 55–175 u/ha Ave. 3.1 h/u | 450–700 h/ha 165–275 u/ha Ave. 2.7 h/u | ||
| Urban Sub-Center | 220–350 h/ha 45–125 u/ha Ave. 3.8 h/u | 350–450 h/ha 125–180 u/ha Ave. 2.8 h/u | ||
| Sub-Urban | 240–250 h/ha 35–60 u/ha Ave. 4.2 h/u | 250–350 h/ha 80–120 u/ha Ave. 3.0 h/u | ||
| Sites along Transport Corridors and Sites close to a Town Center | Urban | 200–300 h/ha 50–110 u/ha Ave. 3.7 h/u | 300–450 h/ha 100–150 u/ha Ave. 3.0 h/u | |
| Urban Sub-Center | 150–200 h/ha 30–55 u/ha Ave. 4.3 h/u | 200–280 h/ha 50–85 u/ha Ave. 3.6 h/u | 350–400 h/ha 95–150 u/ha Ave. 3.0 h/u | |
| Sub-Urban | 150–200 h/ha 30-50 u/ha Ave. 4.6 h/u | 200–250 h/ha 50–80 u/ha Ave. 3.5 h/u | ||
| Currently Remote Sites | Sub-Urban | 150–200 h/ha 30-65 u/ha Ave. 4.4 h/u | ||
| Type | Minibus | Bus | Guided Bus | Light Rail | Rail |
|---|---|---|---|---|---|
| Stop interval (m) | 200 | 200 | 300 | 600 | 1000+ |
| Corridor width/area served (m) | 800 | 800 | 800 | 1000 | 2000+ |
| Catchment per stop (m) | 320–640 | 480–1760 | 1680–3120 | 4800–9000 | 2400–24,000 |
| Type | Distance (km) | Speed (km/h) | Waiting Time (min) | Transfer Time (min) | Travel Time (min) |
|---|---|---|---|---|---|
| Walk | 0~1 | 4 | - | - | 10~20 |
| Cycle | 1~6 | 15 | - | - | 10~30 |
| Car | >2 | 36 | - | - | >30 |
| Bus | 2~10 | 18 | 5 | 5 | 30~60 |
| Taxi | 2~13 | 36 | 4 | - | 10~60 |
| Subway | >1 | 37 | 1~3 | 1~3 | >10 |
| Type | Plant Configuration |
|---|---|
| Main street |
|
| Local residential approaches |
|
| Transit station streets |
|
| Ocean ways |
|
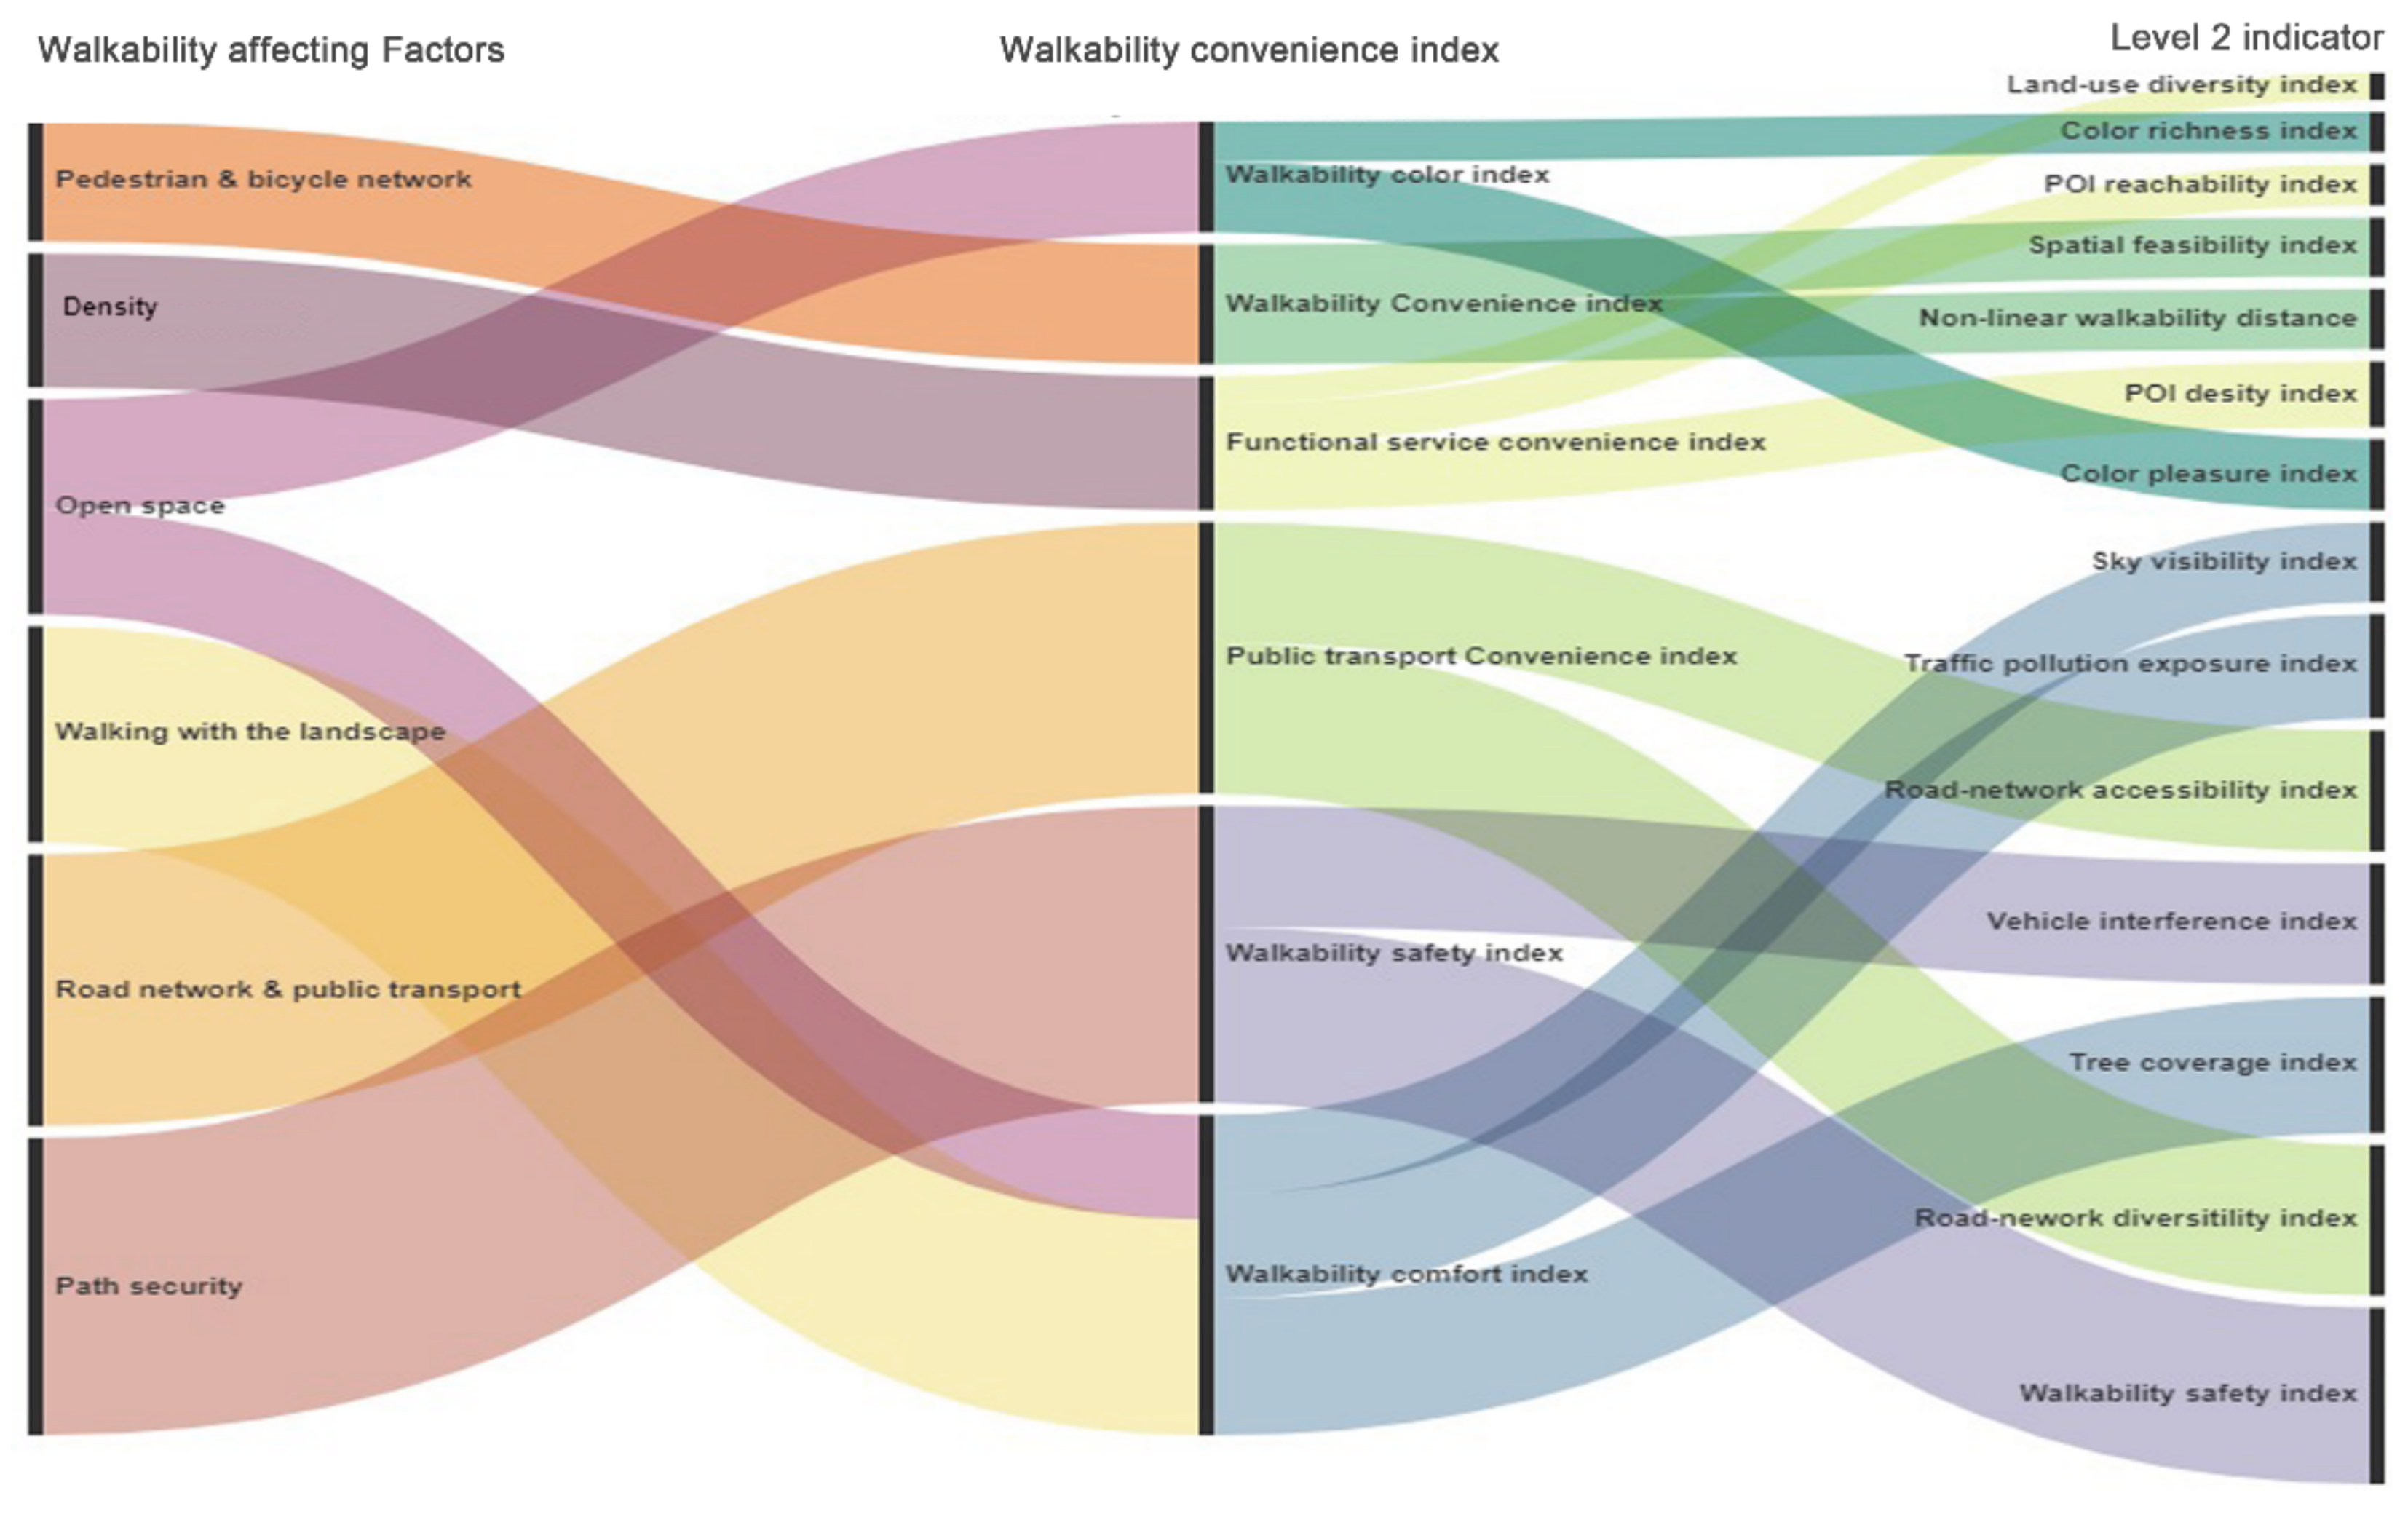
| Level 1 Indicator | Level 2 Indicator | Formula | Explanation | Correlation |
|---|---|---|---|---|
| Walkability convenience index | Road intersection density index | Cn is the number of road intersections in the unit space, and An is the best urban land area with public transport services. | _ | |
| Non-linear walkability distance | Lij is the actual road length between i and j points on the walking road, and Mij is the graph length between i and j points with a length range of 1.2–1.5 m. | _ | ||
| Spatial feasibility index | Wn is the total number of pixels in the street-view picture n, and Rn is the total number of pixels in the street-view picture. | + | ||
| Public transport convenience index | Road-network accessibility index | Ln is the total length of the central road line with bus lines, and An is the best urban land area with public transport services. | + | |
| Road-network diversity index | Ri is the number of public transport routes in unit space n, and An is the best urban land area with public transport services in the 400-m range. | + | ||
| Functional service convenience index | POI reachability index | Pi is the number of POIs in the 300-m range, Pj is the number of POIs in the 600-m range, and Pk is the number of POIs in the 900-m range. | + | |
| Land-use diversity index | Pi is the street area in cell space n that belongs to the i type, and J is the total number of land types in the cell space enclosure. | + | ||
| POI density index | Pn is the number of POIs in the unit space, and An is the area of urban land serviced by public transport. | + | ||
| Walkability comfort index | Sky visibility index | Vn is the number of sky pixels, and An is the total pixel number. | + | |
| Traffic pollution exposure index | Caver = ∑ CiTi | Caver is the average exposure level for individual PM, min.g/m3; Ci is the average PM concentration of the individual’s place of activity during time period i, sg/m3; and Ti is the commute time for time period i, min. | _ | |
| Tree coverage index | Gn is the number of vehicle pixels, and An is the total pixel number. | + | ||
| Walkability safety index | Walkability facility safety index | Sn is the number of pedestrian safety facilities in the unit space, and An is the area of urban land serviced by public transport. | + | |
| Vehicle interference index | Cn is the number of vehicle pixels, and Rn is the total pixel number. | _ | ||
| Walkability colour index | Colour pleasure index | Ai is the score of the i dominant color in Google Street View picture n. | + | |
| Colour richness index | qi is the score of the i dominant color in Google Street View picture n, and i is the total pixel number. | + |
Publisher’s Note: MDPI stays neutral with regard to jurisdictional claims in published maps and institutional affiliations. |
© 2021 by the authors. Licensee MDPI, Basel, Switzerland. This article is an open access article distributed under the terms and conditions of the Creative Commons Attribution (CC BY) license (https://creativecommons.org/licenses/by/4.0/).
Share and Cite
Shao, J.; Yang, M.; Liu, G.; Li, Y.; Luo, D.; Tan, Y.; Zhang, Y.; Song, Q. Urban Sub-Center Design Framework Based on the Walkability Evaluation Method: Taking Coomera Town Sub-Center as an Example. Sustainability 2021, 13, 6259. https://0-doi-org.brum.beds.ac.uk/10.3390/su13116259
Shao J, Yang M, Liu G, Li Y, Luo D, Tan Y, Zhang Y, Song Q. Urban Sub-Center Design Framework Based on the Walkability Evaluation Method: Taking Coomera Town Sub-Center as an Example. Sustainability. 2021; 13(11):6259. https://0-doi-org.brum.beds.ac.uk/10.3390/su13116259
Chicago/Turabian StyleShao, Jizhong, Minge Yang, Guan Liu, Ye Li, Dan Luo, Yanran Tan, Yuxin Zhang, and Qize Song. 2021. "Urban Sub-Center Design Framework Based on the Walkability Evaluation Method: Taking Coomera Town Sub-Center as an Example" Sustainability 13, no. 11: 6259. https://0-doi-org.brum.beds.ac.uk/10.3390/su13116259