
Interval Type-2 Fuzzy Super SBM Network DEA for Assessing Sustainability Performance of Third-Party Logistics Service Providers Considering Circular Economy Strategies in the Era of Industry 4.0


Abstract
:1. Introduction
2. Literature Review
2.1. Supply Chain Management in Industry 4 Era
2.2. 3PLs Role in Sustainable Supply Chain Management
3. Materials and Methods
The Extension of Interval Type-2 Fuzzy Network SBM DEA to Measure Efficiency and Super-efficiency
4. Results
5. Discussion
6. Conclusions
Author Contributions
Funding
Institutional Review Board Statement
Informed Consent Statement
Data Availability Statement
Conflicts of Interest
References
- González-Sánchez, R.; Settembre-Blundo, D.; Ferrari, A.M.; García-Muiña, F.E. Main Dimensions in the Building of the Circular Supply Chain: A Literature Review. Sustainability 2020, 12, 2459. [Google Scholar] [CrossRef] [Green Version]
- Akinade, O.O.; Oyedele, L.O. Integrating construction supply chains within a circular economy: An ANFIS-based waste analytics system (A-WAS). J. Clean. Prod. 2019, 229, 863–873. [Google Scholar] [CrossRef]
- Salehi-Amiri, A.; Zahedi, A.; Akbapour, N.; Hajiaghaei-Keshteli, M. Designing a sustainable closed-loop supply chain network for walnut industry. Renew. Sust. Energ. Rev. 2021, 141, 1–20. [Google Scholar] [CrossRef]
- Igl, J.; Kellner, F. Exploring greenhouse gas reduction opportunities for retailers in Fast Moving Consumer Goods distribution networks. Transp. Res. D Transp. Environ. 2017, 278, 296–313. [Google Scholar] [CrossRef]
- Cowan, K.; Guzman, F. How CSR reputation, sustainability signals, and country-of-origin sustainability reputation contribute to corporate brand performance: An exploratory study. J. Bus. Res. 2020, 117, 683–693. [Google Scholar] [CrossRef]
- Harfouche, A. ICT for an Inclusive World: Industry 4.0—Towards the Smart Enterprise; Springer: Berlin/Heidelberg, Germany, 2020; pp. 37–74. ISBN 3030342697. [Google Scholar]
- Moktadir, M.A.; Dwivedi, A.; SultanaKhan, N.; KumarPaul, S.; AhmedKhan, S.; Ahmed, S.; Sultana, R. Analysis of risk factors in sustainable supply chain management in an emerging economy of leather industry. J. Clean. Prod. 2021, 283, 124641. [Google Scholar] [CrossRef]
- Lu, S.; Zhu, L.; Wang, Y.; Xie, L.; Su, L. Integrated forward and reverse logistics network design for a hybrid assembly-recycling system under uncertain return and waste flows: A fuzzy multi-objective programming. J. Clean. Prod. 2020, 243. [Google Scholar] [CrossRef]
- Kellner, F.; Lienland, B.; Utz, S. An a posteriori decision support methodology for solving the multi-criteria supplier selection problem. Eur. J. Oper. Res. 2019, 272, 505–522. [Google Scholar] [CrossRef]
- Guarnieri, P.; Sobreiro, V.A.; Nagano, M.S.; Serrano, A.L.M. The challenge of selecting and evaluating third-party reverse logistics providers in a multi-criteria perspective: A Brazilian case. J. Clean. Prod. 2015, 96, 209–219. [Google Scholar] [CrossRef]
- Hammes, G.; Souza, E.D.D.; Rodriguez, C.M.T.; Millan, R.H.R.; Herazo, J.C.M. Evaluation of the reverse logistics performance in civil construction. J. Clean. Prod. 2020, 248, 119212. [Google Scholar] [CrossRef]
- Zarbakhshnia, N.; Soleimani, H.; Goh, M.; Razavi, S.S. A novel multi-objective model for green forward and reverse logistics network design. J. Clean. Prod. 2019, 208, 1304–1316. [Google Scholar] [CrossRef]
- Zarbakhshnia, N.; Soleimani, H.; Ghaderi, H. Sustainable third-party reverse logistics provider evaluation and selection using fuzzy SWARA and developed fuzzy COPRAS in the presence of risk criteria. Appl. Soft Comput. 2018, 65, 307–319. [Google Scholar] [CrossRef]
- Ali, A.; Chauhan, K.; Barakat, M.; Eid, A. The Role of Sustainability for Enhancing Third-Party Logistics Management Performance. J. Manag. Sustain. 2019, 9, 1925–4733. [Google Scholar] [CrossRef] [Green Version]
- Kalantary, M.; Farzipoor Saen, R. Assessing sustainability of supply chains: An inverse network dynamic DEA model. Comput. Ind. Eng. 2019, 135, 1224–1238. [Google Scholar] [CrossRef]
- Zhou, X.; Wang, Y.; Chai, J.; Wang, L.; Wang, S.; Lev, B. Sustainable supply chain evaluation: A dynamic double frontier network DEA model with interval type-2 fuzzy data. Inf. Sci. 2019, 504, 394–421. [Google Scholar] [CrossRef]
- Rodrigues, L.C.; Martins, R.S.; Wanke, P.F.; Siegler, J. Efficiency of specialized 3PL providers in an emerging economy. Int. J. Prod. Econ. 2018, 205, 163–178. [Google Scholar] [CrossRef]
- Qin, R.; Liu, Y.-K.; Liu, Z.-Q. Methods of critical value reduction for type-2 fuzzy variables and their applications. J. Comput. Appl. Math. 2011, 235, 1454–1481. [Google Scholar] [CrossRef]
- Dossou, P.E. Impact of Sustainability on the supply chain 4.0 performance. Procedia Manuf. 2018, 17, 452–459. [Google Scholar] [CrossRef]
- Pishdar, M.; Ghasemzadeh, F.; Antuchevičienė, J.; Saparauskas, J. Internet of Things and Its Challenges in Supply Chain Management: A Rough Strength-Relation Analysis Method. Ekon. Manag. 2018, 21, 208–222. [Google Scholar] [CrossRef]
- Yadav, G.; Luthra, S.; Jakhar, S.K.; Mangla, S.K.; Rai, D.P. A framework to overcome sustainable supply chain challenges through solution measures of Industry 4.0 and circular economy: An automotive case. J. Clean. Prod. 2020, 254, 120112. [Google Scholar] [CrossRef]
- Ghadge, A.; Kara, M.E.; Moradlou, H.; Goswami, M. The impact of Industry 4.0 implementation on supply chains. J. Manuf. Technol. Manag. 2020, 31, 669–686. [Google Scholar] [CrossRef]
- Bag, S.; Telukdarie, A.; Pretorius, J.H.C.; Gupta, S. Industry 4.0 and Supply Chain Sustainability: Framework and Future Research Directions. Bench. Inter. J. 2018, 1–41. [Google Scholar] [CrossRef]
- Birkel, H.; Müller, J.M. Potentials of Industry 4.0 for supply chain management within the triple bottom line of sustainability—A systematic literature review. J. Clean. Prod. 2020, 289, 125612. [Google Scholar] [CrossRef]
- Sharma, M.; Kamble, S.; Mani, V.; Sehrawat, R.; Belhadi, A.; Sharma, V. Industry 4.0 adoption for sustainability in multi-tier manufacturing supply chain in emerging economies. J. Clean. Prod. 2021, 281. [Google Scholar] [CrossRef]
- Massaro, M.; Secinaro, S.; Mas, F.D.; Brescia, V.; Calandra, D. Industry 4.0 and circular economy: An exploratory analysis of academic and practitioners’ perspectives. Bus. Strategy Environ. 2020, 30, 1213–1231. [Google Scholar] [CrossRef]
- Kumar, P.; Singh, R.K.; Kumar, V. Managing supply chains for sustainable operations in the era of Industry 4.0 and circular economy: Analysis of barriers. Resour. Conserv. Recycl. 2021, 164, 1–12. [Google Scholar] [CrossRef]
- Batarlienė, N.; Jarašūnienė, A. “3PL” Service Improvement Opportunities in Transport Companies. Procedia Eng. 2017, 187, 67–76. [Google Scholar] [CrossRef]
- Wang, F.; Yang, X.; Zhuo, X.; Xiong, M. Joint logistics and financial services by a 3PL firm: Effects of risk preference and demand volatility. Transp. Res. E-Log. 2019, 130, 312–328. [Google Scholar] [CrossRef]
- Vafaei, A.; Yaghoubi, S.; Tajik, J.; Barzinpour, F. Designing a sustainable multi-channel supply chain distribution network: A case study. J. Clean. Prod. 2020, 251, 119628. [Google Scholar] [CrossRef]
- Yavas, V.; Ozkan-Ozen, Y.D. Logistics centers in the new industrial era: A proposed framework for logistics center 4.0. Transp. Res. E-Log. 2020, 135, 1–18. [Google Scholar] [CrossRef]
- Adivar, B.; Hüseyinoğlu, I.O.Y.; Christopher, M.A. Quantitative performance management framework for assessing omnichannel retail supply chains. J. Retail. Consum. Serv. 2019, 48, 257–269. [Google Scholar] [CrossRef]
- Liu, C.L.; Lee, M.Y. Integration, supply chain resilience, and service performance in third-party logistics providers. Int. J. Logist. Manag. 2018, 29, 5–21. [Google Scholar] [CrossRef]
- Yang, Z.; Lun, V.; Lagoudis, L.N.; Lee, P.T.W. Container transportation: Resilience and sustainability. Transp. Res. D Transp. Environ. 2018, 61 Pt B, 420–422. [Google Scholar] [CrossRef]
- Renne, J.; Wolshon, B.; Murray-Tuite, P.; Pande, A. Emergence of resilience as a framework for state Departments of Transportation (DOTs) in the United States. Transp. Res. D Transp. Environ. 2020, 82, 1–11. [Google Scholar] [CrossRef]
- Leobons, C.M.; Campos, V.B.G.; Bandeira, R.A.M. Assessing Urban Transportation Systems Resilience: A Proposal of Indicators. Transp. Res. Procedia 2019, 37, 322–329. [Google Scholar] [CrossRef]
- Bonilla, S.H.; Silva, H.R.O.; Silva, M.T.D.; Gonçalves, R.F.; Sacomano, J.B. Industry 4.0 and Sustainability Implications: A Scenario-Based Analysis of the Impacts and Challenges. Sustainability 2018, 10, 3740. [Google Scholar] [CrossRef] [Green Version]
- Reis, J.Z.F.; Gonçalves, R.F. The Role of Internet of Services (IoS) on Industry 4.0 through the Service Oriented Architecture (SOA). In Proceedings of the IFIP WG 5.7 International Conference, APMS 2018, Seoul, Korea, 26–30 August 2018. [Google Scholar] [CrossRef]
- Ghobakhloo, M. The future of manufacturing industry: A strategic roadmap toward Industry 4.0. The future of manufacturing industry: A strategic roadmap toward Industry 4.0. J. Manuf. Technol. Manag. 2018, 29, 910–936. [Google Scholar] [CrossRef] [Green Version]
- Zameer, H.; Wang, Y.; Yasmeen, H. Reinforcing green competitive advantage through green production, creativity and green brand image: Implications for cleaner production in China. J. Clean. Prod. 2020, 247, 119119. [Google Scholar] [CrossRef]
- Zaid, A.A.; Jaaron, A.A.M.; Bon, A.T. The impact of green human resource management and green supply chain management practices on sustainable performance: An empirical study. J. Clean. Prod. 2018, 204, 965–979. [Google Scholar] [CrossRef]
- Singh, S.K.; Giudice, M.D.; Chierici, R.; Graziano, D. Green innovation and environmental performance: The role of green transformational leadership and green human resource management. Technol. Soc. Chang. 2021, 150, 1–12. [Google Scholar] [CrossRef]
- Stock, T.; Obenaus, M.; Kunz, S.; Kohl, H. Industry 4.0 as enabler for a sustainable development: A qualitative assessment of its ecological and social potential. Process Saf. Environ. 2018, 118, 254–267. [Google Scholar] [CrossRef]
- Sony, M.; Naik, S. Industry 4.0 integration with socio-technical systems theory: A systematic review and proposed theoretical model. Technol. Soc. 2020, 61, 1–45. [Google Scholar] [CrossRef]
- Raj, A.; Dwivedi, G.; Sharma, A.; Sousa Jabbour, A.B.L.; Rajak, S. Barriers to the adoption of Industry 4.0 technologies in the manufacturing sector: An inter-country comparative perspective. Int. J. Prod. Econ. 2020, 224, 1–48. [Google Scholar] [CrossRef]
- Beier, G.; Ullrich, A.; Niehoff, S.; Reißig, M.; Habich, M. Industry 4.0: How it is defined from a sociotechnical perspective and how much sustainability it includes—A literature review. J. Clean. Prod. 2020, 259, 1–13. [Google Scholar] [CrossRef]
- Evangelista, P.; Santoro, L.; Thomas, A. Environmental Sustainability in Third-Party Logistics Service Providers: A Systematic Literature Review from 2000–2016. Sustainability 2018, 10, 1627. [Google Scholar] [CrossRef] [Green Version]
- Mavi, N.K.; Mavi, R.K. Energy and environmental efficiency of OECD countries in the context of the circular economy: Common weight analysis for malmquist productivity index. J. Environ. Manag. 2019, 247, 651–661. [Google Scholar] [CrossRef]
- Trappey, A.J.C.; Trappey, C.V.; Govindarajan, U.H.; Chuang, A.C.; Sun, J.J. A review of essential standards and patent landscapes for the Internet of Things: A key enabler for Industry 4.0. Adv. Eng. Inf. 2017, 33, 208–229. [Google Scholar] [CrossRef]
- Burns, T.; Cosgrove, J.; Doyle, F. A Review of Interoperability Standards for Industry 4.0. Procedia Manuf. 2019, 38, 646–653. [Google Scholar] [CrossRef]
- Ozkan-Ozen, Y.D.; Kazancoglu, Y.; Kumar Mangla, S. Synchronized Barriers for Circular Supply Chains In Industry 3.5/Industry 4.0 Transition for Sustainable Resource Management. Resour. Conserv. Recycl. 2020, 161, 104986. [Google Scholar] [CrossRef]
- Guerrero-Lorente, J.; Gabor, A.F.; Ponce-Cueto, E. Omnichannel logistics network design with integrated customer preference for deliveries and returns. Comput. Ind. Eng. 2020, 144, 106433. [Google Scholar] [CrossRef]
- Rajesh, R.; Pugazhendhi, S.; Ganesh, K.; Muralidharan, C.; Sathiamoorthy, R. Influence of 3PL service offerings on client performance in India. Transp. Res. E-Log. 2011, 47, 149–165. [Google Scholar] [CrossRef]
- Gu, Y.; Fu, X.; Liu, Z.; Xu, X.; Chen, A. Performance of transportation network under perturbations: Reliability, vulnerability, and resilience. Transp. Res. E-Log. 2020, 133, 101809. [Google Scholar] [CrossRef]
- Barón, A.; Castro, R.D.; Giménez, G. Circular Economy Practices among Industrial EMAS-Registered SMEs in Spain. Sustainability 2020, 12, 9011. [Google Scholar] [CrossRef]
- Hyejune, P.; Kim, Y.K. Proactive versus reactive apparel brands in sustainability: Influences on brand loyalty. J. Retail. Consum. Serv. 2016, 29, 114–122. [Google Scholar] [CrossRef]
- Olfat, L.; Pishdar, M.; Ghasemzadeh, F. Type-2 Fuzzy Network Data Envelopment Analysis for FMCG Distributors’ Performance Evaluation with Sustainability Approach. Int. J. Ind. Eng. Theory 2019, 26, 663–687. [Google Scholar]
- Kumar, A.; Moktadir, M.D.A.; Rehman Khan, S.A.; Garza-Reyes, J.A.; Tyagi, M.; Kazançoğlu, Y. Behavioural factors on the adoption of sustainable supply chain practices. Resour. Conserv. Recycl. 2020, 158, 1–12. [Google Scholar] [CrossRef]
- Franco, N.G.; Ludovico Almeida, N.F.; Flora Calili, R. A strategic measurement framework to monitor and evaluate circularity performance in organizations from a transition perspective. Sustain. Prod. Consum. 2021, 27, 1165–1182. [Google Scholar] [CrossRef]
- Olfat, L.; Amiri, M.; Bamdad Soufi, J.; Pishdar, M. A Dynamic Network Efficiency Measurement of Airports Performance Considering Sustainable Development Concept: A Fuzzy Dynamic Network-DEA Approach. J. Air Transp. Manag. 2016, 57, 272–290. [Google Scholar] [CrossRef]
- European Union. Moving towards a Circular Economy with EMAS. Available online: https://ec.europa.eu/environment/emas/pdf/other/report_EMAS_Circular_Economy.pdf (accessed on 2 April 2021).
- Olfat, L.; Pishdar, M. Interval Type-2 Fuzzy Dynamic Network Data Envelopment Analysis with Undesirable Outputs Considering Double Frontiers: An Application to Iran Airports’ Sustainability Evaluation. Int. J. Ind. Eng. Theory 2017, 24, 635–662. [Google Scholar]
- Pishdar, M.; Ghasemzadeh, F.; Antuchevičienė, J. A mixed interval type-2 fuzzy best-worst MACBETH approach to choose hub airport in developing countries: Case of Iranian passenger airports. Transport 2019, 34, 639–651. [Google Scholar] [CrossRef] [Green Version]
- Lieb, K.J.; Lieb, R.C. Environmental sustainability in the third-party logistics (3PL) industry. Int. J. Phys. Distrib. Logist. Manag. 2010, 40, 524–533. [Google Scholar] [CrossRef]
- Ferraro, T.; Pais, L.; Rebelo Dos Santos, N.; Moreira, J.M. The Decent Work Questionnaire: Development and validation in two samples of knowledge workers. Int. Labour Rev. 2018, 157, 243–265. [Google Scholar] [CrossRef]
- Nazmul Islam, M.; Furuoka, F.; Idris, A. Mapping the relationship between transformational leadership, trust in leadership and employee championing behavior during organizational change. Asia Pac. Manag. Rev. 2020, in press. [Google Scholar] [CrossRef]
- Kähkönen, T.; Blomqvist, K.; Gillespie, N.; Vanhala, M. Employee trust repair: A systematic review of 20 years of empirical research and future research directions. J. Bus. Res. 2021, 130, 98–109. [Google Scholar] [CrossRef]
- Azadi, M.; Jafarian, M.; Farzippoor Saen, R.; Mirhedayatian, S.M. A new fuzzy DEA model for evaluation of efficiency and effectiveness of suppliers in sustainable supply chain management context. Comput. Oper. Res. 2015, 54, 274–285. [Google Scholar] [CrossRef]
- Wanke, P.; Barros, C.P.; Nwaogbe, O.R. Assessing productive efficiency in Nigerian airports using Fuzzy-DEA. Transp. Policy 2016, 49, 9–19. [Google Scholar] [CrossRef]
- Zadeh, L.A. The concept of a linguistic variable and its application to approximate reasoning. Inf. Sci. 1975, 8, 199–249. [Google Scholar] [CrossRef]
- Hu, J.; Zhang, Y.; Chen, X.; Liu, Y. Multi-criteria decision-making method based on possibility degree of interval type-2 fuzzy number. Knowl. Based Syst. 2013, 43, 21–29. [Google Scholar] [CrossRef]
- Abdullah, L.; Zulkifli, N. Integration of fuzzy AHP and interval type-2 fuzzy DEMATEL: An application to human resource management. Expert Syst. Appl. 2015, 42, 4397–4409. [Google Scholar] [CrossRef]
- Charnes, A.; Cooper, W.W.; Rodes, E. Measuring the efficiency of decision making units. Eur. J. Oper. Res. 1978, 2, 429–444. [Google Scholar] [CrossRef]
- Farrell, M.J. The Measurement of Productive Efficiency. J. R. Stat. Soc. 1957, 120, 253–281. [Google Scholar] [CrossRef]
- Banker, R.D.; Charnes, A.; Cooper, W.W. Some Models for Estimating Technical and Scale Inefficiencies in Data Envelopment Analysis. Manag. Sci. 1984, 30, 1078–1092. [Google Scholar] [CrossRef] [Green Version]
- Faramarzi, G.R.; Tavassoli, M.; Saen, R.F. Network DEA: A new Approach for determining component weights. Int. J. Manag. Sci. 2014, 9, 178–184. [Google Scholar] [CrossRef]
- Tone, K.; Tsutsui, M. Network DEA: A Slack-Based Measure Approach. EUR. J. Oper. Res. 2009, 197, 243–252. [Google Scholar] [CrossRef] [Green Version]
- Tone, K.; Tsutsui, M. Dynamic DEA with Network Structure: A Slack-Based Measure Approach. Omega 2014, 42, 124–131. [Google Scholar] [CrossRef] [Green Version]
- Hieu Tran, T.; Mao, Y.; Nathanail, P.; Siebers, P.O. Integrating Slacks-based Measure of Efficiency and Super-efficiency in Data Envelopment Analysis. Omega 2019, 85, 156–165. [Google Scholar] [CrossRef] [Green Version]
- Nestle. Creating Shared Value and Sustainability Report 2020. 2020. Available online: https://www.nestle.com/sites/default/files/2021-03/creating-shared-value-report-2020-en.pdf (accessed on 15 May 2021).
- Dutta, P.; Talaulikar, S.; Xavier, V.; Kapoor, S. Fostering reverse logistics in India by prominent barrier identification and strategy implementation to promote circular economy. J. Clean. Prod. 2021, 294, 126241. [Google Scholar] [CrossRef]


| Criteria | Sub-Criteria | Description | Some of the References |
|---|---|---|---|
| Governance | Management commitment to shape effective SCM 4.0 framework | Determination of sustainability vision and its publication while promoting shared values in the field of sustainability in the workplace and encourage employees to advance the principles of sustainability considering green governance principles | [6,33,34,35,36,37,38,39,40] |
| Coordination and cooperation among supply chain members | Effective cooperation is helpful to set sustainability principles through the whole supply chain and gain of integration. Network of machines, workers, and systems should be implemented in the whole supply chain to shape Industry 4 logic | [21,41,42,43,44,45,46] | |
| Technology innovation | The capability to adopt innovative and internet-based approaches to face the objectives of business partners and increase market penetration and clearance (E-commerce; Enterprise resource planning, Online status tracking systems, IOT, IOS, IOP and big data, or application of machine learning algorithms are some of the key technologies of Industry 4 | [45,46,47,48] | |
| Data Management | In Industry 4 all the processes related to data, information and knowledge are changed considering the inharmonious nature of raw data. So, importance of data integration and management is out of question | [44,46] | |
| Legislations and standards | Stakeholder management considering and external accountability, transparency and information sharing, and cooperation with other supply chain parts to enhance sustainability of the whole chain via shared strategies | [48,49,50,51] | |
| Commitment to the transparency of the supply chain | Stakeholder management considering internal and external accountability, transparency and information sharing, and cooperation with other supply chain parts to enhance sustainability of the whole chain via shared strategies | [48,50,51] | |
| Omni-channel strategy commitment | Seeking to synchronize inventory, logistics and distribution functions across all sales channels to meet consumer demand | [21,52,53] | |
| Resilience | A risk management approach concerned with how system prevent or deals with service disturbance; this is done paying attention to flexibility | [13,35,48,54] | |
| Economic | Quality | Seeking to define and update the values of the customer | [13,48,55,56,57] |
| Financial capability | Realized revenue less total cost per period of the organization and its reputation to obtain external financial resources | [12,13,48] | |
| Lead time | All the processing time, transit time, etc. needed to handle the inventory to the customer | [12,48] | |
| Delivery and Service | Value-added services that could be pre- and post-sale Pre- and post-sale services to customer considering problem resolution ability while commitment to continuous improvement | [12,48,55] | |
Environment
| Recycle | Gentle logistics service by looking toward a material-recycling society in compliance with all regulations | [13,48,55] |
| Disposal | Dealing with scrap, waste and refuse to prevent environmental pollution and waste of resources | [13,48,55,56] | |
| Green Remanufacturing | Manufacturing practices that do not harm the environment during any phases. It involves green redesign of products, use of environmentally friendly raw materials, eco-friendly packing, distribution, and reuse after end of life of product. It is totally related to green reverse logistics | [13,48,55,56] | |
| Green Technology | Technology that is invented to mitigate or reverse the effects of human activities on the environment. For water transportation for instance, it can be about hybrid-electrical propulsion systems in order to replace diesel engines and for road transportation it is about liquefied natural gas | [13,48,57] | |
| Environment protection certifications | The Eco-Management and Audit Scheme (EMAS) and ISO 14001 are two of such certifications | [13,48,57] | |
| Eco-design production | Manufacturing sustainable products to satisfy consumers considering logistics role | [13,48] | |
| Greenhouse gas emissions | Handling logistics operations such as transportation, warehousing and inventories to reduce greenhouse gas emissions | [12,48,55] | |
| Green HRM and Green transformational leadership | Policies, practices, and systems that stimulate a green behavior of a company’s employees in order to create an environmentally sensitive, resource efficient and socially responsible workplace and overall organization | [56,57,58] | |
| Environmental management system | To systematically ensure that commitment to environmental protection improvement exists in the business organizations towards environmental sustainability | [47,58,59,60,61] | |
| Social | Health and safety | Paying attention to the health and safety of the internal people and also accident rates and noises being created | [13,48,62] |
| Customization true voice of stakeholders | A systematic approach to understand the stakeholders’ needs and values to customize the services and products should be tracked. Industry 4.0 enables supply chains to better define customers’ behaviors and needs. | [13,46,48] | |
| Support for charity activities, arts and cultural expression | Culture protection ideas in product design and related services to support art and culture expressions in addition to participating in charity activities | [3,61,62] | |
| Human machine Interaction optimization | Setting framework to mutual human and machine communication, connections, collaboration and interfaces. This is a prerequisite of Industry 4 functions | [44,46,59] | |
| Decent work | Employment that respects the fundamental rights of the human person as well as the rights of workers in terms of conditions of work safety and remuneration. Respect for the physical and mental integrity of the worker in the exercise of his/her employment | [55,57,63,64] |
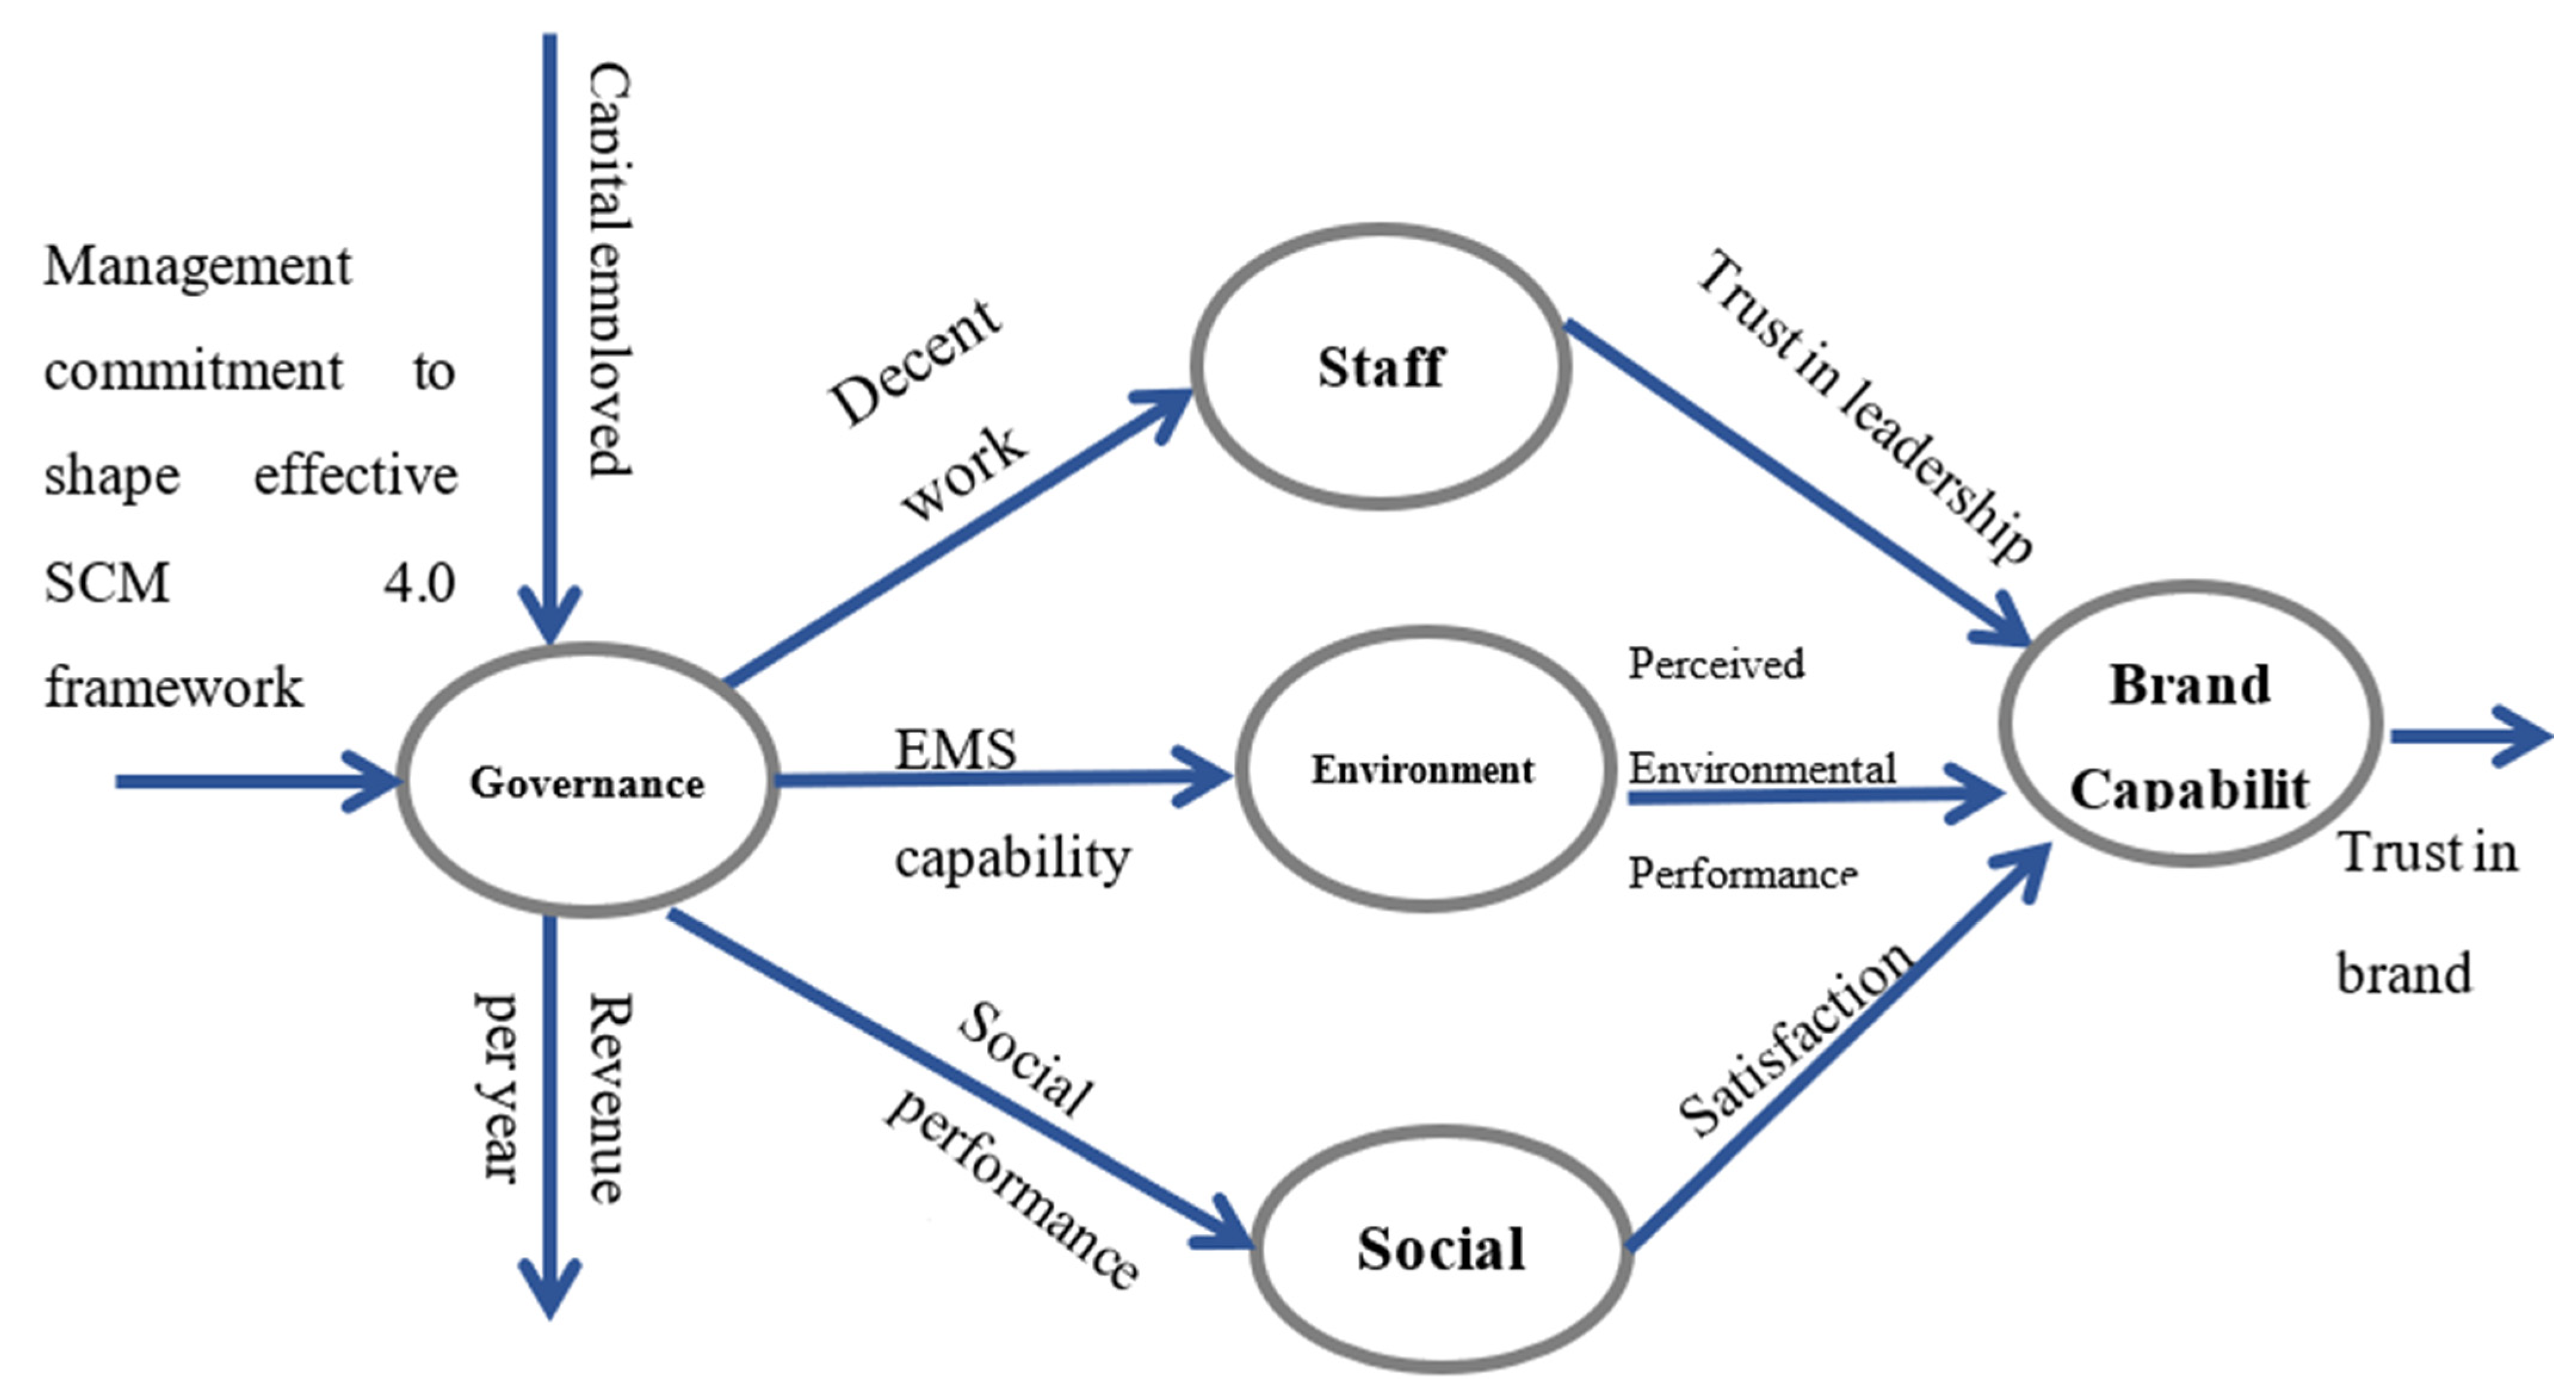
| Type | Nature | Value Estimation | |
|---|---|---|---|
| Management commitment | Input | Fuzzy | Senior managers opinions by the aid of questionnaire |
| Capital employed | Input | Crisp | Official documents |
| Revenue per year | Output | Crisp | |
| Decent work | Link | Fuzzy | Getting employees’ opinions by the aid of questionnaire |
| Employee trust in leadership | Link | Fuzzy | |
| EMS (Environmental Management System) | Link | Fuzzy | Consulting responsible managers |
| Environmental performance | Link | Fuzzy | Getting stakeholders opinions by the aid of questionnaire (Random sampling) |
| Social performance quality | Link | Fuzzy | |
| Satisfaction | Link | Fuzzy | |
| Trust in brand | Output | Fuzzy |
| Linguistic Variables | The Related Interval Type-2 Fuzzy Number |
|---|---|
| Strongly agree | (0.8,0.9,0.9,1:1,1) (0.85,0.9,0.9,0.95:0.9,0.9) |
| Agree | (0.6,0.7,0.7,0.8:1,1) (0.65,0.7,0.7,0.75:0.9,0.9) |
| Undecided | (0.4,0.5,0.5,0.6:1,1) (0.45, 0.5,0.5, 0.55:0.9,0.9) |
| Disagree | (0.2,0.3,0.3,0.4:1,1) (0.25,0.3,0.3,0.35:0.9,0.9) |
| Strongly Disagree | (0,0.1,0.1,0.1:1,1) (0,0.1,0.1,0.05:0.9,0.9) |
| Efficiency Value | |||||||||||||
|---|---|---|---|---|---|---|---|---|---|---|---|---|---|
| 3PLs | Total | Governance Node | Staff Node | Environment Node | Social Node | Brand Capability Node | |||||||
| 1 | TOR | [0.43,0.45] | 15 | [0.4,0.59] | 8 | [0.81,1] | 4 | [0.37,0.45] | 15 | [0.3,0.46] | 15 | [0.28,0.31] | 16 |
| 2 | KHA | [0.43,0.57] | 8 | [0.83,1] | 3 | [0.16,0.61] | 13 | [0.7,1] | 5 | [0.5,0.72] | 9 | [0.66,0.79] | 4 |
| 3 | ZANJ | [0.51,0.66] | 3 | [0.45,0.47] | 9 | [0.44,1] | 6 | [0.68,1] | 7 | [0.98,1.3] | 1 | [0.65,0.79] | 5 |
| 4 | KHF | [0.46,0.48] | 13 | [0.24,0.26] | 15 | [0.3,0.32] | 15 | [0.33,0.4] | 16 | [0.51,0.6] | 11 | [0.51,0.62] | 12 |
| 5 | KAL | [0.46,0.53] | 9 | [0.61,0.72] | 6 | [0.45,0.48] | 8 | [0.94,1] | 2 | [0.25,0.3] | 17 | [0.33,0.39] | 15 |
| 6 | PRES | [0.42,0.49] | 14 | [0.26,0.37] | 14 | [0.38,0.42] | 12 | [0.58,0.67] | 9 | [0.66,0.79] | 5 | [0.36,0.51] | 14 |
| 7 | TEH | [0.54,0.66] | 2 | [0.98, 1.2] | 2 | [1,1.1] | 1 | [0.84,1] | 4 | [0.75,1] | 2 | [0.89,1.22] | 1 |
| 8 | SHAR | [0.46,0.48] | 13 | [0.31,0.38] | 12 | [0.41,0.51] | 9 | [0.47,0.59] | 12 | [0.64,0.71] | 6 | [0.26,0.31] | 16 |
| 9 | DAR | [0.49,0.59] | 5 | [0.27,0.64] | 10 | [0.35,1] | 7 | [0.45,1] | 8 | [0.61,1] | 4 | [0.57,0.59] | 11 |
| 10 | PARS | [0.47,0.48] | 12 | [0.3,0.33] | 14 | [0.27,0.33] | 16 | [0.48,0.57] | 13 | [0.61,0.63] | 7 | [0.53,0.64] | 10 |
| 11 | SADI | [0.48,0.54] | 6 | [0.43,0.46] | 11 | [0.33,0.51] | 11 | [0.84,0.85] | 6 | [0.42,0.77] | 10 | [0.81,0.85] | 3 |
| 12 | ISF | [0.47,0.49] | 11 | [0.45,0.64] | 7 | [0.3,0.36] | 14 | [0.46,0.52] | 14 | [0.3,0.41] | 16 | [0.51,0.6] | 13 |
| 13 | ISA | [0.54,0.68] | 1 | [0.93,1.3] | 1 | [0.51,1] | 5 | [0.85,1.16] | 1 | [0.7,1] | 3 | [0.66,0.76] | 6 |
| 14 | IRAN | [0.48,0.49] | 10 | [0.22,0.45] | 13 | [0.2,0.21] | 17 | [0.32,0.37] | 17 | [0.43,0.51] | 13 | [0.62,0.64] | 8 |
| 15 | ABAD | [0.48,0.53] | 7 | [0.24,0.26] | 15 | [0.33,0.52] | 10 | [0.38,0.72] | 10 | [0.61,0.63] | 7 | [0.63,0.64] | 7 |
| 16 | BALO | [0.46,0.5] | 11 | [0.74,1] | 5 | [0.94,1] | 3 | [0.46,0.64] | 10 | [0.36,0.54] | 14 | [0.58,0.66] | 9 |
| 17 | BARES | [0.52,0.58] | 4 | [0.77,1] | 4 | [0.94,1.05] | 2 | [0.94,1] | 2 | [0.44,0.61] | 12 | [0.7,1] | 2 |
Publisher’s Note: MDPI stays neutral with regard to jurisdictional claims in published maps and institutional affiliations. |
© 2021 by the authors. Licensee MDPI, Basel, Switzerland. This article is an open access article distributed under the terms and conditions of the Creative Commons Attribution (CC BY) license (https://creativecommons.org/licenses/by/4.0/).
Share and Cite
Pishdar, M.; Danesh Shakib, M.; Antucheviciene, J.; Vilkonis, A. Interval Type-2 Fuzzy Super SBM Network DEA for Assessing Sustainability Performance of Third-Party Logistics Service Providers Considering Circular Economy Strategies in the Era of Industry 4.0. Sustainability 2021, 13, 6497. https://0-doi-org.brum.beds.ac.uk/10.3390/su13116497
Pishdar M, Danesh Shakib M, Antucheviciene J, Vilkonis A. Interval Type-2 Fuzzy Super SBM Network DEA for Assessing Sustainability Performance of Third-Party Logistics Service Providers Considering Circular Economy Strategies in the Era of Industry 4.0. Sustainability. 2021; 13(11):6497. https://0-doi-org.brum.beds.ac.uk/10.3390/su13116497
Chicago/Turabian StylePishdar, Mahsa, Masoumeh Danesh Shakib, Jurgita Antucheviciene, and Arvydas Vilkonis. 2021. "Interval Type-2 Fuzzy Super SBM Network DEA for Assessing Sustainability Performance of Third-Party Logistics Service Providers Considering Circular Economy Strategies in the Era of Industry 4.0" Sustainability 13, no. 11: 6497. https://0-doi-org.brum.beds.ac.uk/10.3390/su13116497