
Fault Detection and RUL Estimation for Railway HVAC Systems Using a Hybrid Model-Based Approach


1
TECNALIA, Basque Research and Technology Alliance (BRTA), 48170 Derio, Spain
2
Division of Operation and Maintenance Engineering, Department of Civil, Environmental and Natural Resources Engineering, Luleå University of Technology, 971 87 Luleå, Sweden
*
Author to whom correspondence should be addressed.
Sustainability 2021, 13(12), 6828; https://0-doi-org.brum.beds.ac.uk/10.3390/su13126828
Submission received: 22 April 2021
/
Revised: 8 June 2021
/
Accepted: 11 June 2021
/
Published: 16 June 2021
(This article belongs to the Special Issue Sustainable and Trustworthy Operation and Maintenance of Railway Systems)
Abstract
:Heating, ventilation, and air conditioning (HVAC) systems installed in a passenger train carriage are critical systems, whose failures can affect people or the environment. This, together with restrictive regulations, results in the replacement of critical components in initial stages of degradation, as well as a lack of data on advanced stages of degradation. This paper proposes a hybrid model-based approach (HyMA) to overcome the lack of failure data on a HVAC system installed in a passenger train carriage. The proposed HyMA combines physics-based models with data-driven models to deploy diagnostic and prognostic processes for a complex and critical system. The physics-based model generates data on healthy and faulty working conditions; the faults are generated in different levels of degradation and can appear individually or together. A fusion of synthetic data and measured data is used to train, validate, and test the proposed hybrid model (HyM) for fault detection and diagnostics (FDD) of the HVAC system. The model obtains an accuracy of 92.60%. In addition, the physics-based model generates run-to-failure data for the HVAC air filter to develop a remaining useful life (RUL) prediction model, the RUL estimations performed obtained an accuracy in the range of 95.21–97.80% Both models obtain a remarkable accuracy. The development presented will result in a tool which provides relevant information on the health state of the HVAC system, extends its useful life, reduces its life cycle cost, and improves its reliability and availability; thus enhancing the sustainability of the system.
1. Introduction
Sustainability is one of the driving forces of the twenty-first century. The major drivers of sustainability are governance and regulation, customers’ requirements, environmental priorities, natural resource shortages, and increasing energy costs [1,2]. The main aim of sustainable services and processes is to minimize the negative environmental impacts, conserve energy and natural resources, ensure safety conditions for employees, communities, and consumers, and be economically sound [3,4]. The principles defined by the three pillars of sustainability lead to reach those ends [5].
As the service life of assets increases, their degradation requires significant attention. Failures in some assets may result in fatal consequences for the environment, people, safety, and society [6]. This makes maintenance a major lever of organization efficiency in the current industrial revolution [7].
The standard EN 13306:2017 introduces condition-based maintenance (CBM) as maintenance strategy, whose main advantage is to allow companies to extend the life cycle of assets while ensuring assets behavior and function under required conditions of safety, reliability and effectiveness [8]. CBM is conducted by monitoring the condition of an asset in real-time to determine what maintenance action needs to be performed.
CBM is divided into diagnostics and prognostics processes. Diagnostics shows the current state of a system. It starts once a fault or abnormal behavior is detected and involves failure mode and effect analysis (FMEA) [9,10]. More specifically, a diagnostic process localizes a faulty component by detecting and isolating a fault based on a pre-selected failure mode (FM), and then, tracing the relationship between the data acquired from the system and degradation. The diagnostic process in HVAC systems, through CBM, is mainly implemented using data-driven models; a data-driven model for deploying fault detection and diagnostics processes for air handling units is presented in [11,12]. These processes are also developed using a combination of knowledge-guided and data-driven methods, which obtains a promising performance in HVAC systems [13]. The fault detection and diagnostics processes, based on the use of generative adversarial networks (GANs), is presented for HVAC systems in [14]. The aim of prognostics is to continuously estimate both the remaining useful life (RUL) and the end of life (EoL) of a system by assessing the changes in its behavior over time. RUL estimation evaluates the accumulated degradation and predicts the future health state. RUL must be assessed after identifying and assessing the damage using information observed in diagnostics. RUL prediction, based on feature fusion and genetic programming, has been used on a railway turnout system [15]. RUL prediction has also been developed for hydraulic piston pumps [16], for lithium-ion batteries [17], and for the air-handling systems, which are the key subsystems of HVAC systems [18].
1.1. Data Analysis
Diagnostics and prognostics models require information and data from the system of interest. This includes the characteristics of the physical asset and data collected by sensors embedded in the system, among others.
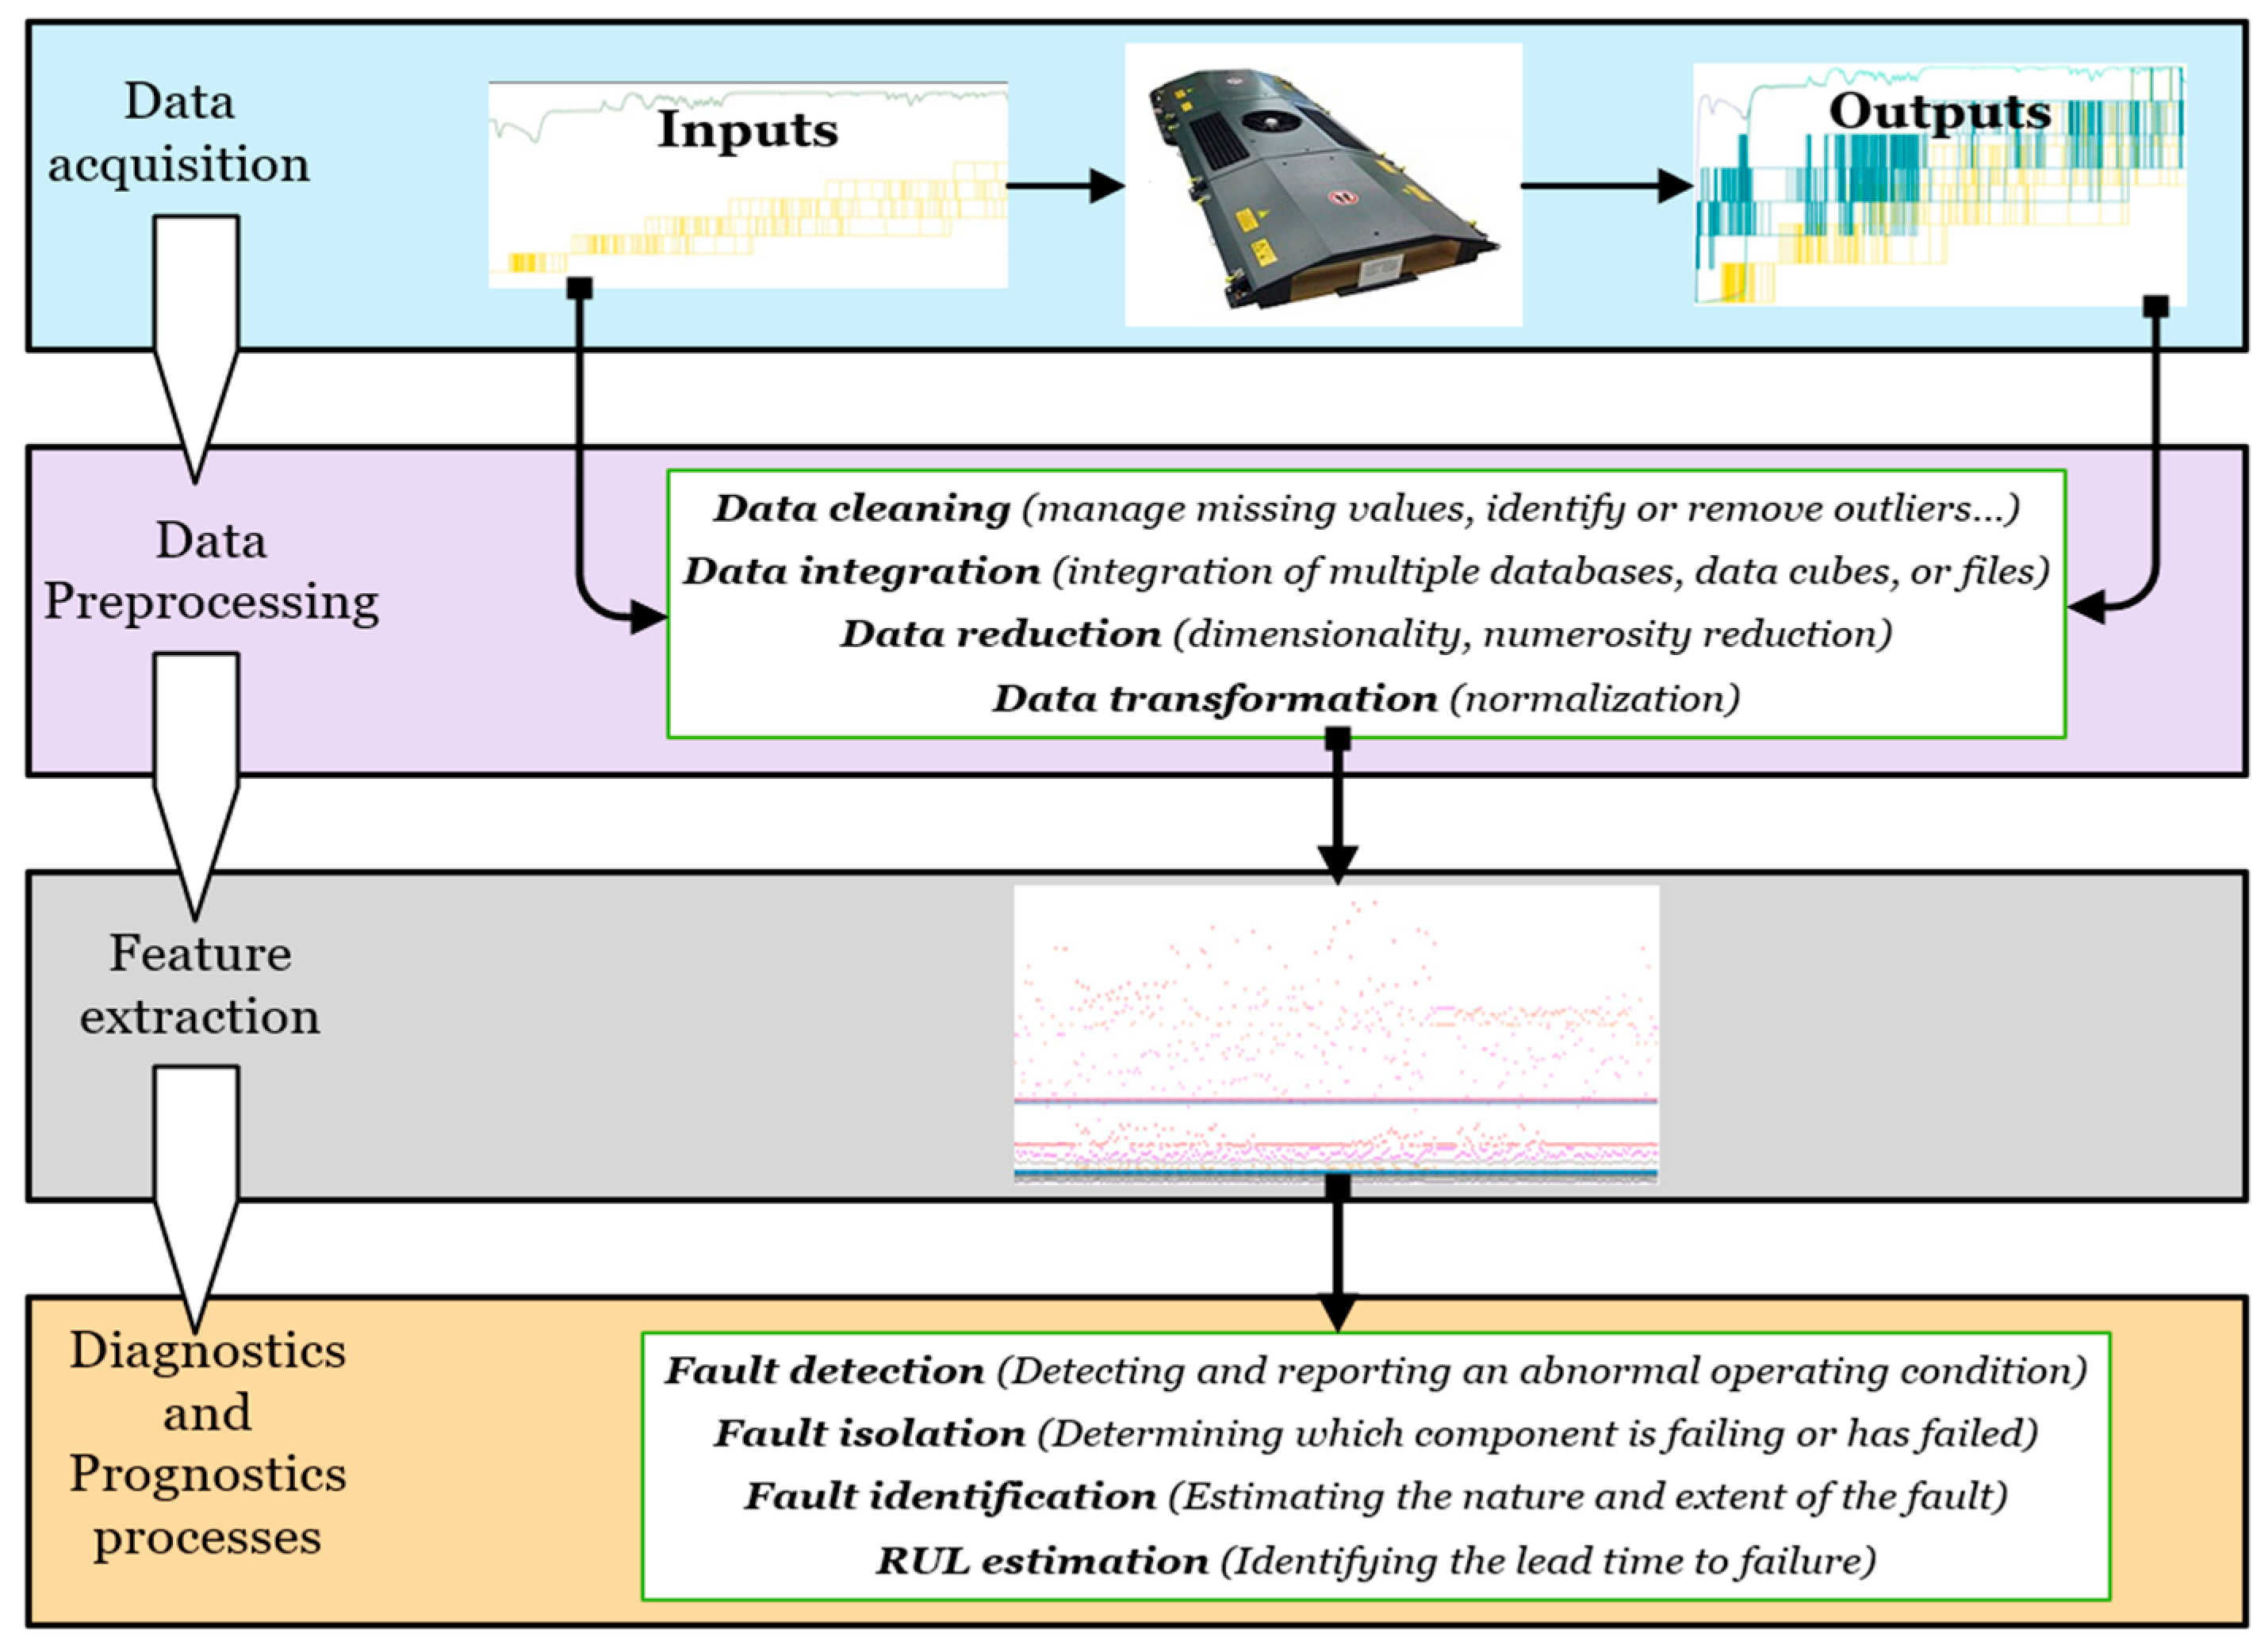
Figure 1 summarizes the main steps of a CBM strategy. Once data are acquired from sensors embedded in the real system, they must be pre-processed to avoid mistakes during the feature extraction process. The features represent the condition of the equipment; changes in these features indicate changes in the system’s behavior. Detection of change is part of the diagnostics process.
1.2. Technical Approaches
The three main approaches used to estimate RUL through prognostics are data-driven approaches, model-based (physics model-based) approaches, and hybrid model-based approaches (HyMas) [19]. These approaches integrate engineering experience and expert knowledge.
1.2.1. Model-Based Approaches
Model-based approaches are also known as physics-based approaches. Physics-based models are mathematical models of the physical system [20]. These models incorporate such characteristics as material properties, thermodynamic, and mechanical responses. An accurate physics-based model is more effective than other approaches [19]. Therefore, the approach is broadly used not only for FDD techniques but also for gaining a proper understanding of operation and system behavior and monitoring key variables. However, these models cannot always be appropriately built because they sometimes need too many resources; i.e., in complex systems or processes, some key parameters may be difficult or impossible to obtain. A dynamic, physics-based model of an HVAC system for FDD is proposed in [21]. The analysis, design, and experimental validation of a physics model-based fault detection and identification (FDI) method, for switching power converters, is presented in [22]. A model-based fault diagnostic is also developed for electric drives in [23] and for a DC-DC boost converter in [24]. In a more recent research work, this same technique is also developed for foreign object detection in wireless power transfer [25].
1.2.2. Data-Driven Approaches
Data-driven approaches predict the future state of a system using mathematical models and weight parameters. The models process data from the sensors embedded in the real system to make predictions. The techniques can be divided into two categories [19]. The first includes artificial intelligence (AI) approaches, such as neural networks (NNs) and fuzzy logic. The second includes statistical approaches; common techniques are linear regression, hidden Markov model, Gaussian process regression (GPR), and relevance vector machines (RVMs).
Data-driven approaches use operational data collected by sensors installed on the system under study. Data-driven approaches are more practical than model-based approaches for deploying FDD in complicated systems, or processes, because they only depend on historical and/or online data and do not consider system complexity, thus missing the relations between data and the physical world [26,27].
Data-driven models can be developed using supervised, unsupervised, or semi-supervised learning processes. Supervised models predict future events using labelled datasets; unsupervised models study how systems can infer a function to describe a hidden structure from unlabeled data, and semi-supervised models learn from both labelled and unlabeled datasets. Training, validation, and testing are the main steps to develop a learning process and ensure the results of models satisfy the established requirements, mainly in terms of accuracy [28,29].
These techniques can accurately predict the RUL, but they need to be trained using a large amount of historical information obtained from the operational data. Data are labelled to easily extract information at different stages of degradation. However, there can be difficulties obtaining run-to-failure data. To reduce the limitations of data-driven approaches, [30] uses GANs to generate synthetic data for faulty conditions of assets in the aeronautical industry. Research on data-driven approaches, for fault diagnosis of HVAC chillers, is discussed by [31,32]. Data-driven methods are used for fault detection and diagnosis in air handling units in [12,33] compares basic data-driven fault diagnosis methods for a system with variable refrigerant.
1.2.3. Hybrid Model-Based Approaches
Researchers have created a number of different hybrid models and used them in different ways. The following combinations of models and approaches are used in hybrid approaches [34].
- H1—Experience-based model + data-driven model.
- H2—Experience-based model + physics-based model
- H3—Data-driven model + data-driven model
- H4—Data-driven model + physics-based model
- H5—Experience-based model + data-driven model + physics-based model
Some combine data-driven models. For example, [35] combines a NN with clustering to predict the daily electric peak load. Other researchers combine supervised and unsupervised data-driven methods to implement an automated FDD process in an air handling unit [36], or to combine a convolutional neural network (CNN) with deep forest (gcForest) for fault diagnostics of rolling bearings [37]. Many researchers combine model-based and data-driven models [38,39,40,41,42].
The main advantage is the reduction in both the historical information required to train a data-driven model and the information needed for a robust physics-based model. This data fusion aims to improve FDD and prognostics processes. It is possible to overcome the lack of historical data, thus improving the ability to detect FMs and reducing the appearance of hidden FMs, metaphorically known as “black swan losses” [43].
It can be expensive, difficult, or impossible to install sensors in parts of a system that are of interest. Therefore, a balance between information and cost must be achieved. In these cases, soft sensors, also known as virtual sensors, are defined using data from the real system, physics-based models, and HyMs. These sensors are a common tool to improve the processes of fault detection and RUL estimation of monitored systems [44]. The aim of soft sensors is to deliver additional information to improve diagnostics and prognostics processes. A complete review of soft sensors, in the process industry, is presented in [45]. An interesting overview on hybrid approaches to FDD is presented in [46].
HVAC systems are not new, but they are the most remarkable advancements related to CBM to have been made in recent years. Nevertheless, it is still difficult to find research works that propose FDD and prognostics processes that detect faults, which can appear individually or together. There are researchers who combine faulty components, but such components are part of the same subsystem and the experiments are based on a run-to-failure basis. This paper presents a HyMA for implementing FDD and prognostics processes. The experiments are performed using data that contain faults in different levels of degradation. They can appear individually or together, and they come from the different subsystems of a HVAC system that is installed in a high-speed passenger train carriage. It keeps the carriage within a comfortable temperature range, with an acceptable concentration of CO2. A failure in this system affects people’s comfort and safety and could affect the environment. The proposed HyMA is validated using real data collected from the real system in a non-intrusive, sustainable form. Therefore, it must be noted that run-to-failure, intrusive experiments are not performed in this study. Previous work includes some dynamic models of HVAC systems and chiller systems for fault detection [38,47].
The paper proceeds as follows. Section 2 describes the methodology of the proposed hybrid modelling, describes the complexity of the HVAC system, explains the physics-based model, developed for data generation, and the process to prepare the data for feature extraction, and introduces the different classifiers trained, and validated, for the multiple fault detection model. Section 3 describes the experimental set-up and defines the assumptions considered for generating data. Section 4 discusses the results. Section 5 concludes the work and suggests future work to include new FMs in the proposed models.
2. Proposed Hybrid Modelling Methodology
The maintainers of the HVAC system under study are currently using approaches based on data, but they must use predetermined maintenance for critical components because there is insufficient information to train an RUL estimation model.
Railway systems have strict regulations for reliability, availability, maintainability, and safety, as specified in the standard EN 50126-1, 2017. Maintainers replace critical components in early stages of degradation for safety, environmental, and economic reasons, complicating the ability to acquire data in advanced stages of degradation and run-to-failure data. The HyM is developed to overcome the lack of data, thus improving the detectability of FMs and reducing hidden FMs, the aforementioned “black swan losses”. Therefore, this development provides a maintenance tool that makes the system more sustainable.
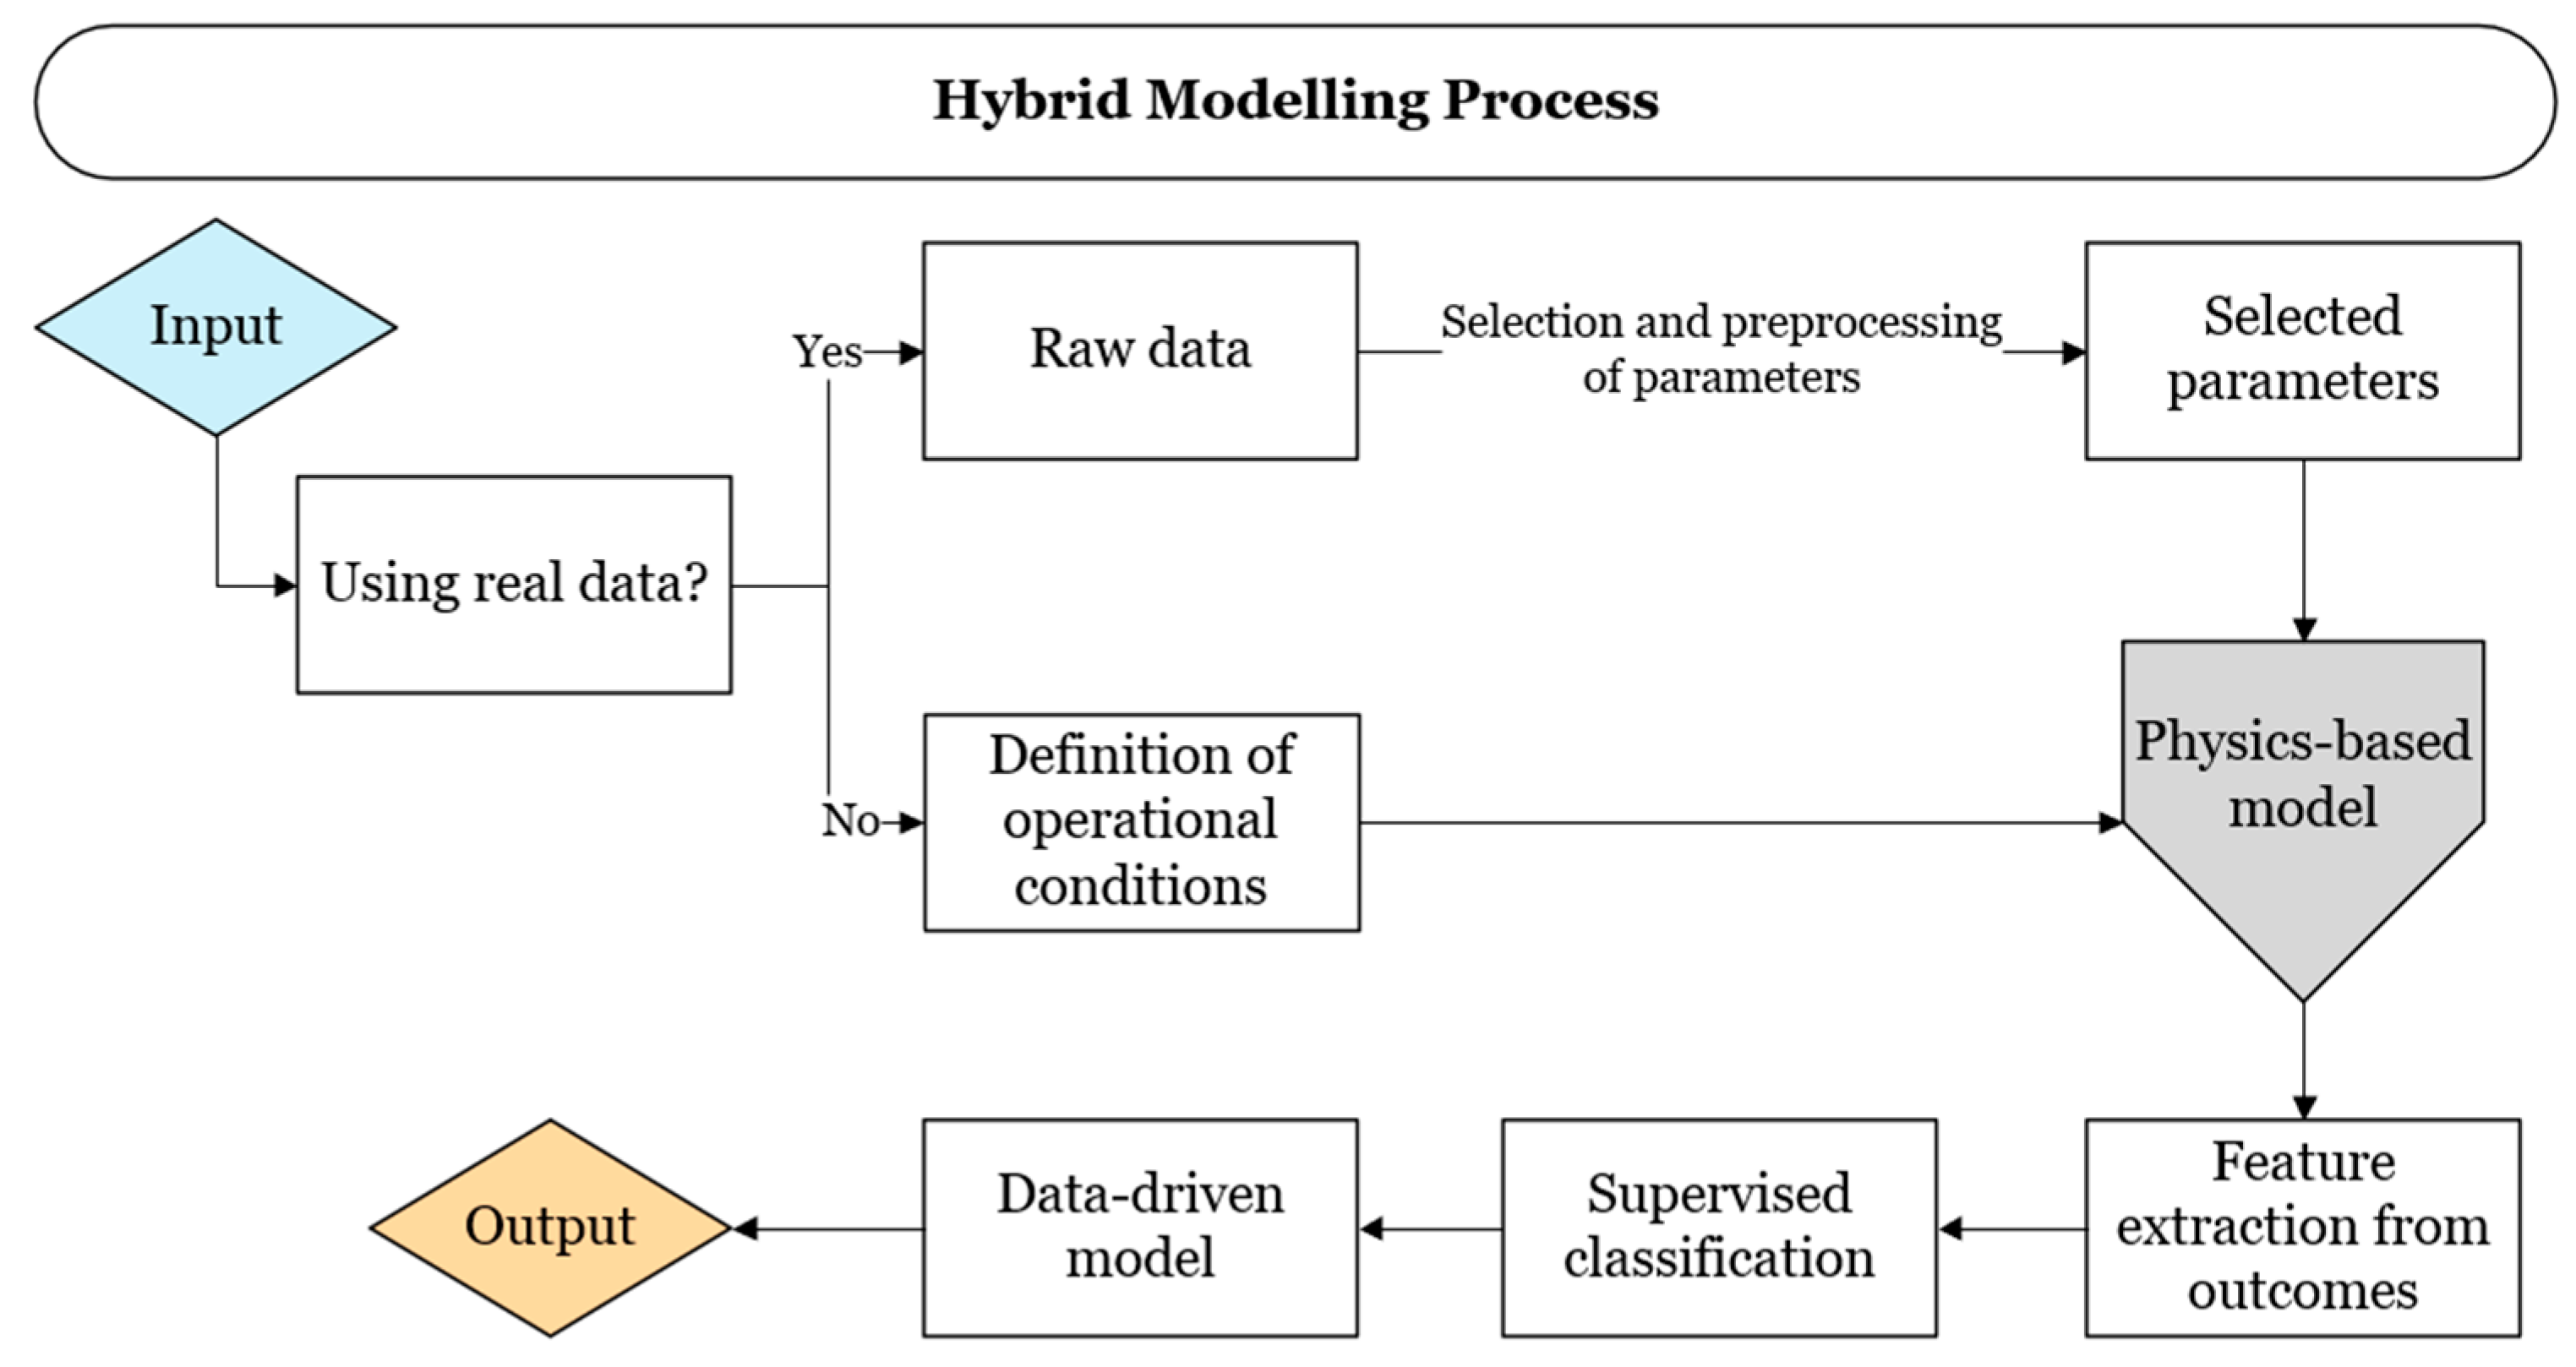
The HyMA of the HVAC system is developed in MATLAB R2019b. Figure 2 shows the methodology proposed for training, validating, and testing the HyM. The physics-based model is used to generate synthetic data in healthy and faulty states based on the modelled operational modes. The model has sensors, located in the real system, and soft sensors, which depend on the data measured in the real system. The response of the soft sensors, defined in the model, is obtained by loading the measured data into the physics-based model. The output of these simulations is recorded in a dataset which contains the data taken from the real system and the data from the soft sensors. The physics-based model can also generate synthetic data in healthy and faulty states when the required inputs are introduced. Every simulation generates a time series of every selected signal. The data related to a simulation are individually saved in a table, and each simulation is labelled with a fault code indicating the presence of a fault and type of fault. Thus, the features are related to a fault code and are used to build the model. A supervised learning process is then applied. The dataset containing the features related to a simulation is named the “fingerprint”.
2.1. HVAC System as a System of Systems
A system can be defined as a set of interrelated elements, at least two, which compose an entity to deliver a function. A system can be part of a system-of-systems (SoS). When an overall capability cannot be achieved by an individual system unaided, several systems interact with their surrounding systems to achieve the required function [48,49,50]. The American Department of Defense defines a SoS [51] as “a set or arrangement of systems that results when independent and useful systems are integrated into a larger system that delivers unique capabilities”. Although SoS is a system, not all systems are SoS [52].
The main purpose of an HVAC system is to provide thermal comfort and acceptable interior air quality, while remaining within reasonable operation and maintenance costs. The HVAC system, studied in this research, was designed to satisfy the comfort conditions established in the standard EN 14750-1, 2007. Thus, this regulation is one of the resources used to develop the physics-based model of the system.
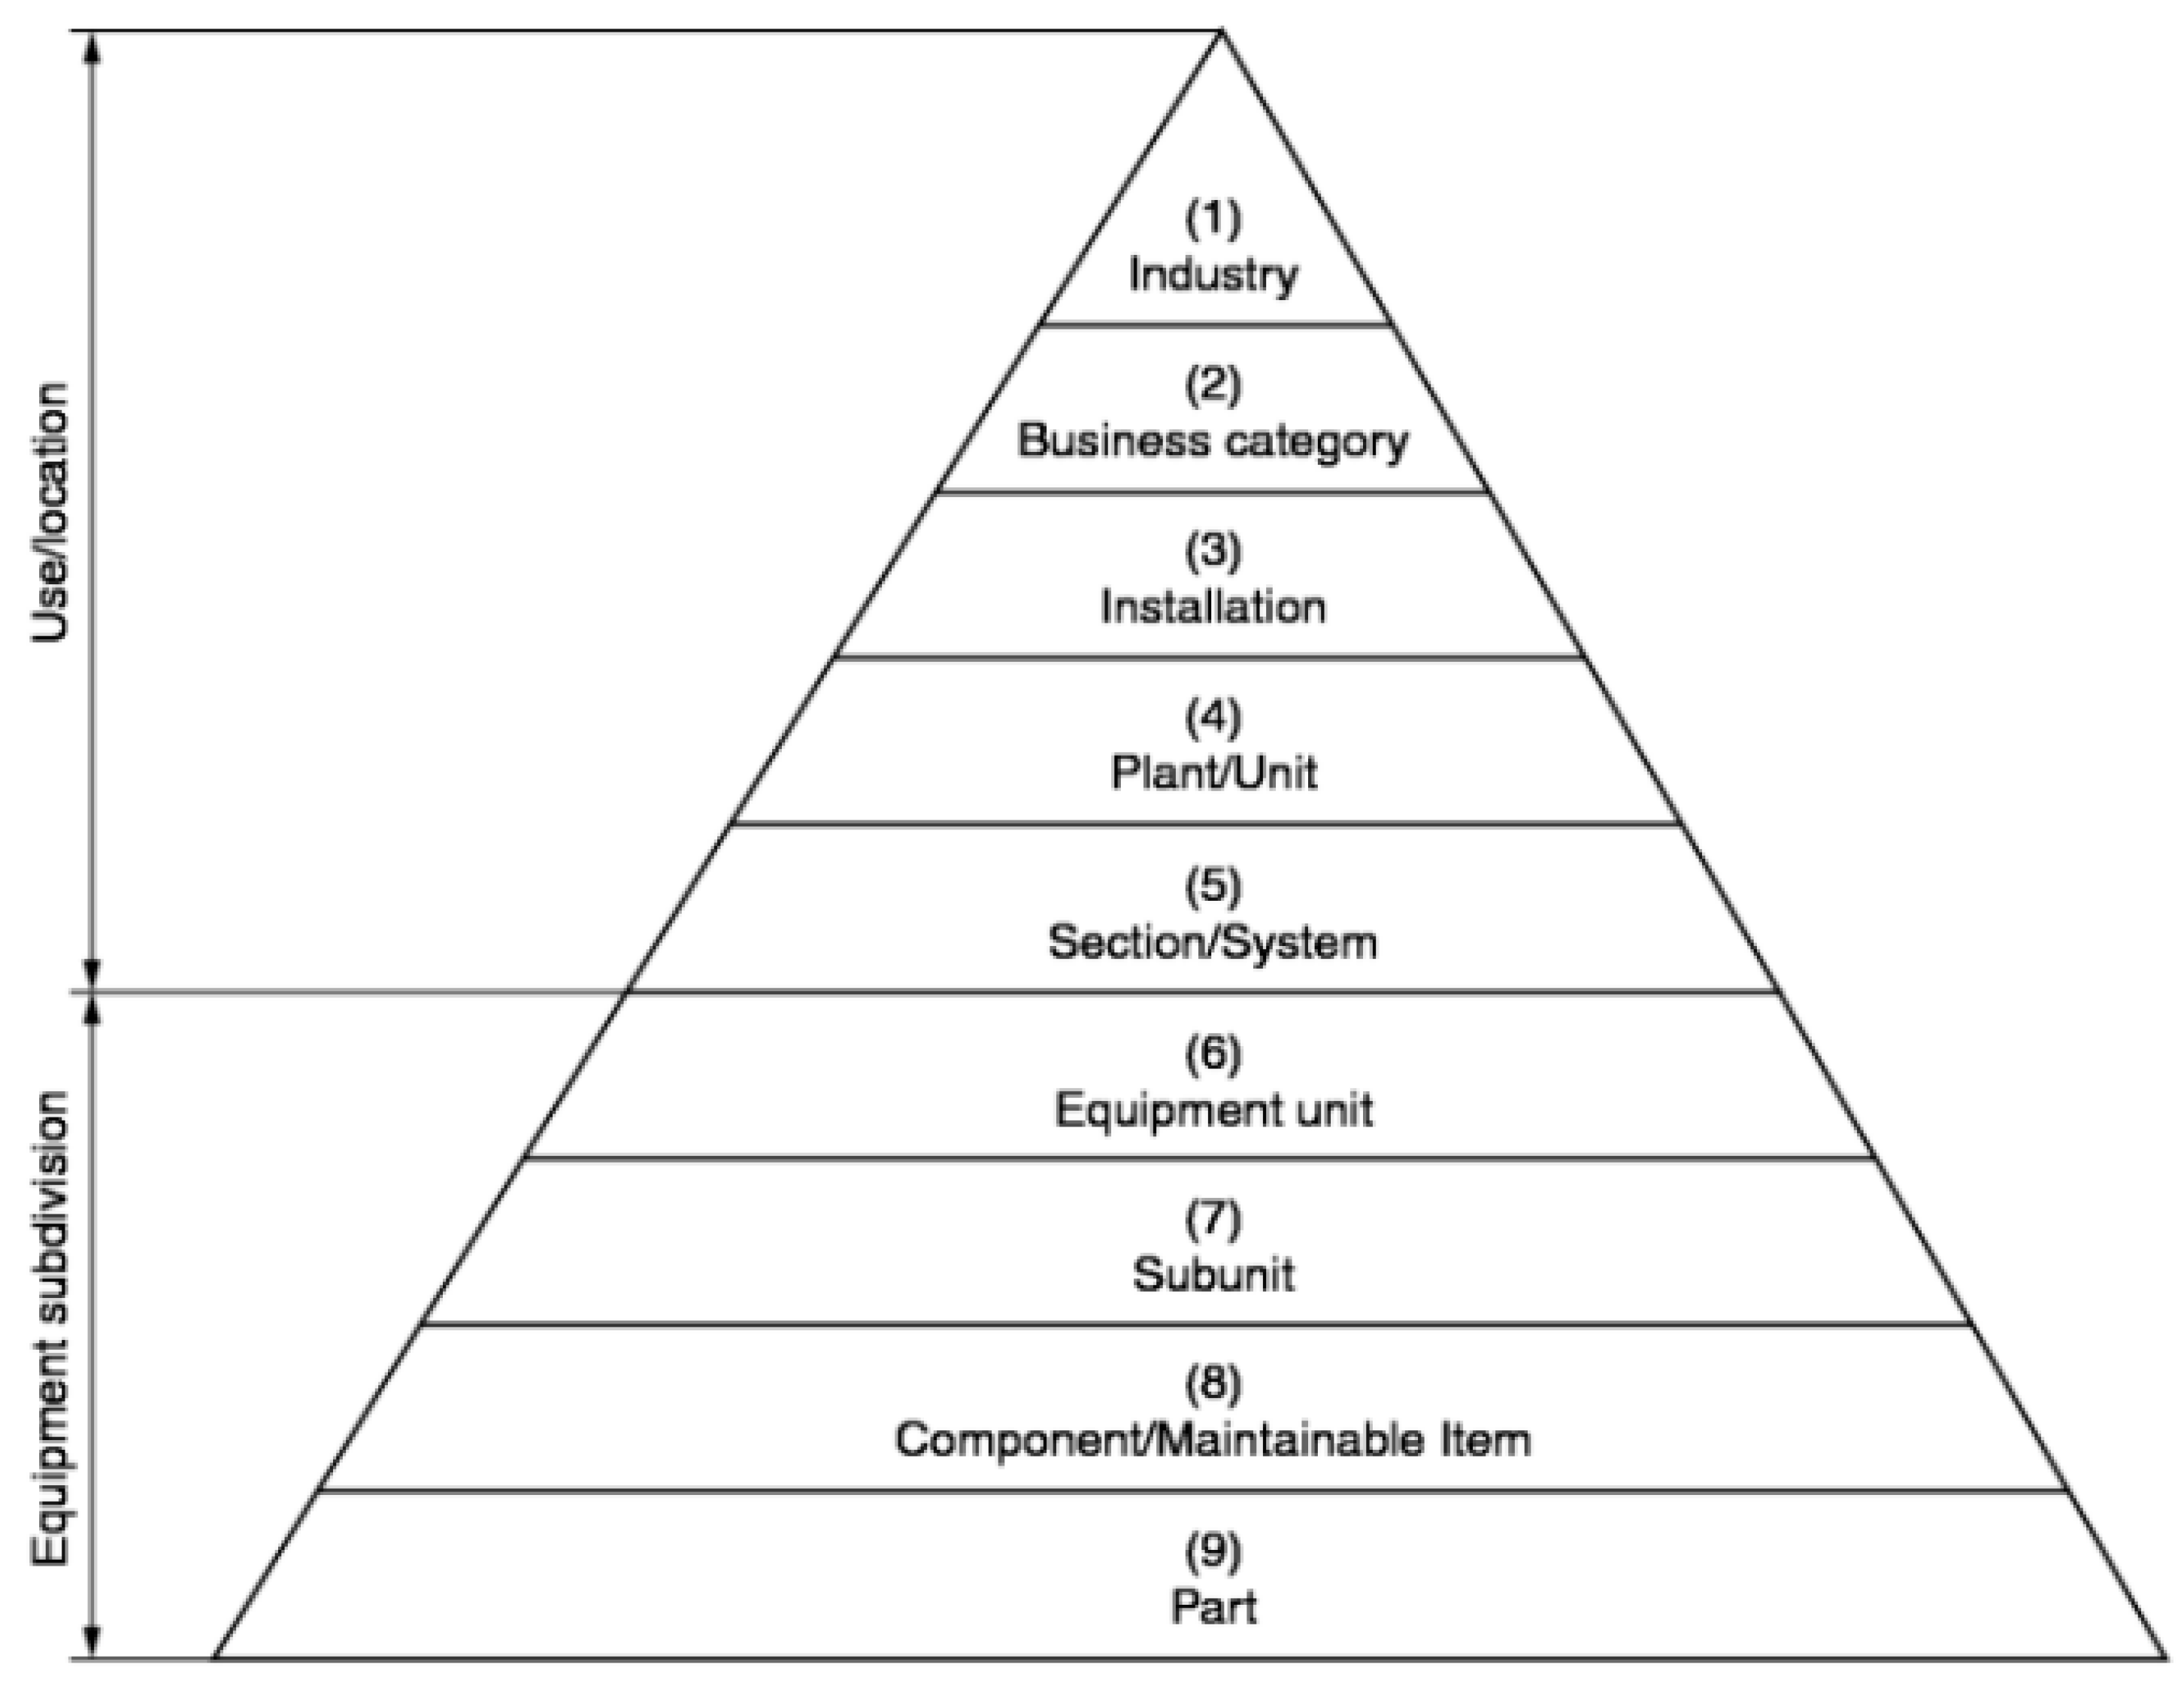
The standard ISO 14224-2016 is als o used for the taxonomy of the SoS. This research considers the HVAC system as including taxonomy 5 level to taxonomy 8 level (see Figure 3).
Figure 4 illustrates the taxonomy of the studied HVAC system and the most relevant items considered in this research. The wagon of the passenger train carriage studied is a passenger saloon with an HVAC system composed of two HVAC units. This means almost all components are duplicated.
Level 7 contains the subsystems of the HVAC system considered here. Some components, including contactors, breakers, electronic control card, and control panel, are not represented in Figure 4 because their FMs are not analyzed in the research. Level 8 includes components whose interactions are modelled based on the principles of thermodynamics, fluid mechanics, and heat transfer. The physics-based model also includes vehicle thermal networking, in this case, and the physics of the interactions between the high-speed passenger train and the environment.
2.2. Physics-Based Model of the HVAC System
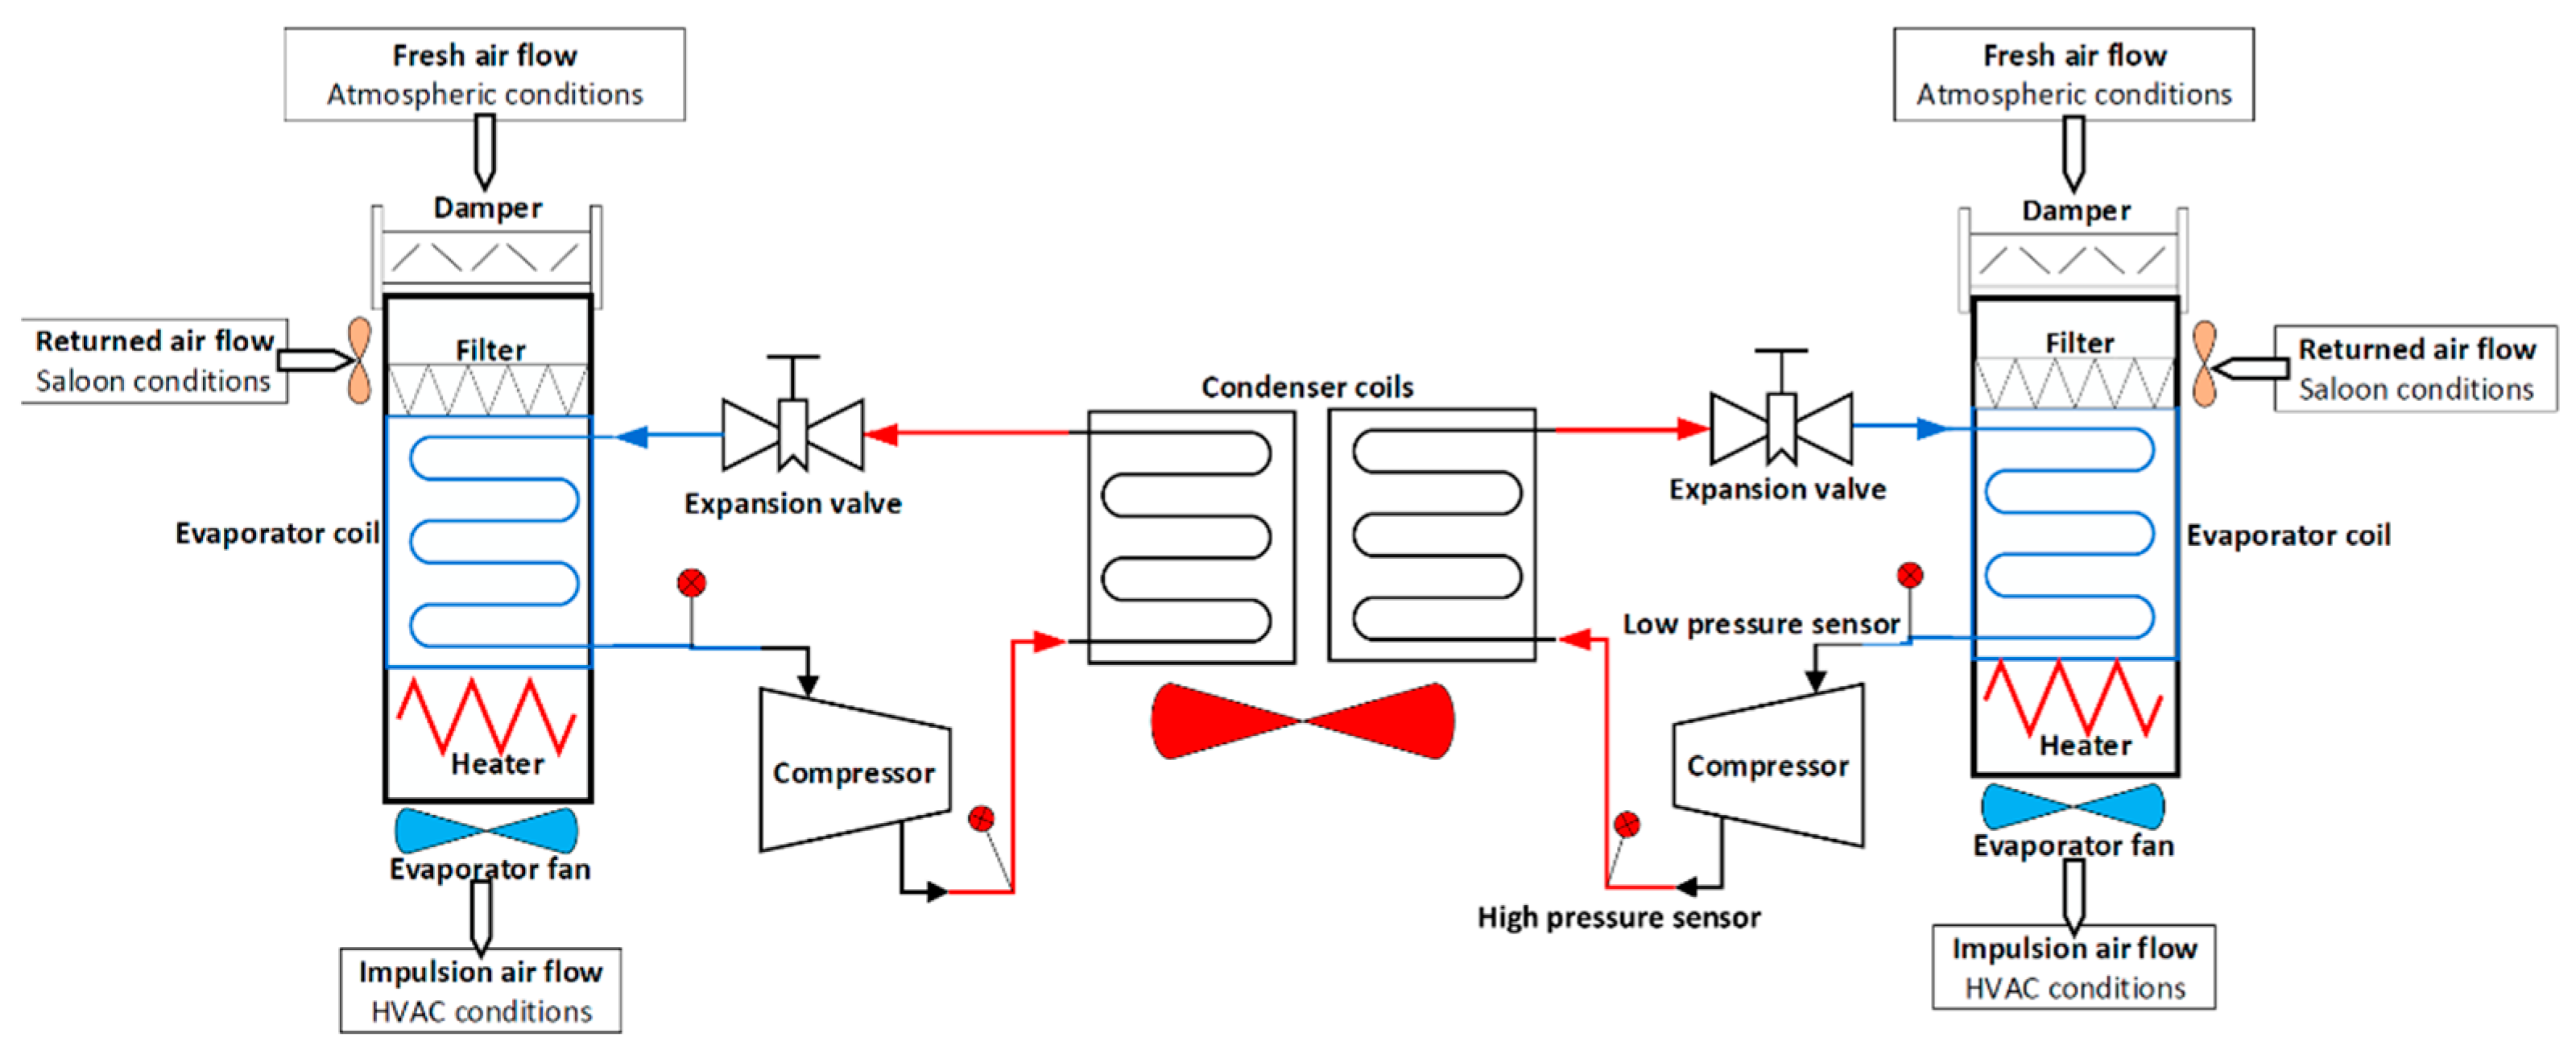
The physics-based model of the HVAC installed in the passenger train carriage is separated into cooling subsystems, heating subsystems, ventilation subsystems, and vehicle thermal networking systems. The temperature, and the concentration of CO2, are managed by two ventilation subsystems, two cooling subsystems, and two heating subsystems. Figure 5 shows a simple scheme of the modelled HVAC system, and Table 1 contains the set of sensors used in the real system labelled as “real”.
2.2.1. Fault Modelling
The FMs of the HVAC are detected by the sensors listed in Table 1. The model includes failures in the air filter, the compressor of the cooling subsystems, sensors measuring the pressure of refrigerant liquid, and the sensor measuring the CO2 concentration.
The sensors’ faults are modelled by introducing a drift to the sensors’ response; the deviation is controlled by a model variable, which indicates no sensor fault and faults at different stages of degradation. A component can be faulty for different reasons; thus, each FM is related to a cause. The physics-based model has soft sensors to improve the detectability of FMs. Soft sensors are important when there is an insufficient number of real sensors. In such cases, FMs resulting from different causes may have similar effects in the signals taken from sensors, making it difficult to distinguish between FMs. Hence, the soft sensors are related to a particular FM and to the signals that can be fed into the model once the HyM is implemented. Table 1 contains the soft sensors defined in the physics-based model; these sensors are labelled “virtual”.
2.2.2. Synthetic Data Generation
The physics-based model, used for generating synthetic data, was developed and validated in previous research [53]. This model generates synthetic data in healthy and faulty states based on the operational modes being modelled. The physics-based model has sensors located in the real system and soft sensors, which depend on the data from the real system. These soft sensors or virtual sensors generate key features for the detection of faults whose response is inferred by the measured data. Thus, as Figure 2 shows, measured data must be loaded into the physics-based model to simulate the response of the soft sensors. The output of these simulations is recorded in a dataset which contains the data taken from the real system and the data from the soft sensors. The physics-based model can also generate synthetic data, in healthy and faulty states, by introducing the required inputs. Every simulation generates a timeseries of every signal selected; the data related to a simulation are individually saved in a table.
The measured data must be pre-processed before loading it into the physics-based model. First, the raw dataset is cleaned to avoid mistakes during simulations and then, during the feature extraction process. Next, the cleaned dataset is analyzed in order to identify and classify key variables. This process is focused on identifying the operational modes that the HVAC has been working and the appearance of faults or deviation in sensors. Next, the data is classified considering the operational mode and the types of failures.
The physics-based model simulates the same response as the real system with the same inputs. Thus, the physics-based model has noise defined in some input parameters. The noise is related to a physical variable and controlled by analyzing the range of values the input can reach. The data generated also contain the response of the system in both healthy and faulty states. A fault in a component can appear at different levels of degradation, individually or in conjunction with other faults. The response of the system is defined by the parameters listed in Table 1.
Five different faults: mass of dust in the air filters, deviation detected in the CO2 sensor, deviation detected in the low pressure side of the refrigerant circuit, and the compression rate, which relates the high pressure side to the low pressure side of the refrigerant circuit. The deviation detected in the CO2 sensor and the deviation detected in the low-pressure side of the refrigerant circuit are tested using real data and synthetic data.
2.2.3. Feature Extraction
Once the data are generated by the physics-based model and organized in a table, each simulation is labelled with a fault code, indicating the presence of a fault and the type of fault. The features are then extracted from every signal loaded in the table. The features are related to a fault code and are used to train, validate, and test the data-driven model. The dataset containing the features related to a simulation is named “fingerprint”.
The HyM presented here computes the following features for each signal: mean (μ), standard deviation (σ), skewness (γ), kurtosis (κ), peak value (xpeak), root mean square (RMS), crest factor (CF), shape factor (SF), impulse factor, and clearance factor.
The most common step, after calculating all the features, is to reduce the dimensionality of the data, but the HyM presented in this paper does not take this step. All the features extracted from all signals are considered for training, validating, and testing the data-driven model because this case study was analyzed in two previous papers [54,55] in which different techniques were applied to reduce the dimensionality of the datasets and to assess the features yielding the most relevant information to distinguish between FMs. The previous research shows features which strongly identify a FM match when the severity of a fault increases, making it difficult to distinguish between FMs. To improve the accuracy of a multiple fault detection model, it is necessary to consider features that, theoretically, obtain a low score but can still distinguish an FM.
After the feature extraction process is performed, the data-driven model is designed. It is based on a supervised learning approach, as it is further described in the following section: Section 2.3 Data-Driven Model.
2.3. Data-Driven Model
A supervised classification approach is selected to build the multiple fault detection model. This machine learning technique develops a function or model able to identify, or predict, the category or class membership of an object based on its features [56]. A review of classification algorithms is presented in [57].
In this research work, several supervised learners are tested, given their particular learning capabilities and characteristics when fitting the data. They are the following: support vector machines (SVMs), logistic regression (LR), decision trees (DTs), k-nearest neighbors (k-NNs), ensemble classification, Naïve Bayes (NB), and discriminant analysis. As mentioned, the results are evaluated in terms of accuracy.
SVM employs linear combinations of different features to make classification decisions. SVM can manage a significant number of features to reach an optimized solution, thus avoiding overfitting and making feature selection less critical. SVM has been used in CM fields [58].
LR models are statistical models that evaluate the relationship between the mean response and one or more predictor variables which can be qualitative [59]. When the variables are dichotomic, the LR model is called binary or binomial logistic regression, and when there are variables with more than two values, the model is called multinomial logistic regression. LR models have recently been used as prediction models for fault detection in CBM [60].
DTs use the structure of a tree to divide a dataset into leaves and branches and perform the decision tree incrementally. The leaves represent class labels, and branches represent conjunctions of features that lead to those labels [61].
Boosted trees are a variation of DTs; the boosting method allocates equal weights to all preparation samples to accomplish a model from these preparation data. Next, when a weight is incorrectly classified; this case is improved, and used to attain an additional model, from these new preparation data. This process is repeated different times to build a robust classifier [62].
k-NN is a non-parametric algorithm that generates predictions. The inputs are the k nearest samples in the feature space, and the output can be either the most represented class among them, using a distance function in k-NN classification, or a value in k-NN regression, i.e., the average of the values of k-NN.
Ensemble classification integrates multiple models to improve the accuracy and reliability of estimations or decisions obtained using a single model [63].
An NB classifier is a simple probabilistic learning model based on applying the Bayesian rule. NB assumes the values of features are independent of any other features, given the class label [57].
Discriminant analysis models make predictions by finding a combination of features that characterize or separate two or more classes. The resulting combination is commonly used for dimensionality reduction before subsequent classification [64].
3. Experimental Set-Up
The validation of the proposed methodology to build an HyM for an HVAC system located in a passenger train carriage is based on the following assumptions:
- Damage is only produced in four components with specific damage; i.e., no other FMs are considered. Consequently, the diagnosis process is focused on finding the FM which has appeared.
- There are defined deviations in two sensors. The chance of a fault in other sensors is not considered.
The use of the real system and the physics-based model has some limitations:
- The company does not have run-to-failure data for the HVAC system installed in the passenger train carriage, and there is no possibility to do run-to-failure tests on the assessed equipment.
- The few number of sensors embedded in the real system makes it difficult to develop the identification process.
- There are only historical data for faults in the CO2 sensor and deviations in the low-pressure side of the refrigerant circuit. The lack of data in the other situations presented in this paper is overcome by using synthetic data. As it is detailed in Table 2, the dataset generated by the physics-based model generates 791 simulations. From those, 109 simulations contain historical data with faults.
- The resulting combination of real and synthetic data is split into training, validation and test sets in order to properly analyze the accuracy of the supervised learner and its generalization capabilities. More specifically, 629 (79% of the total) simulations are used as training and validation sets (60% for fitting the model and 20% for free parameter tuning, respectively), and the other 162 as testing set (21% of the total, for model evaluation on unseen data).
- The degradation of the air filter in the time-frame is known. Thus, the prognostics process is limited to quantifying the RUL of the air filter.
Apart from characteristics as material properties, thermodynamic, and mechanical responses, etc. used to develop the physics-based model, there is an input set used to increase the diversity of synthetic data. They are acquired from the real system during the condition monitoring process; then, the diversity increases by introducing noise in these inputs
- Atmospheric temperature. The temperature is introduced in the model as timeseries. The most representative timeseries used in this development contain operational data from 65 to 170 min. Before introducing variations in datasets of temperature, the temperature is analyzed considering the month when the dataset was collected to identify the maximum and minimum values of temperatures reached in that month. Next, a set of parameters is defined to apply noise to atmospheric temperature. This provides the signals with different values into a controlled range of temperatures.
- Air flow. This parameter identifies the fresh air flow that goes inside the cabin through the damper (see Figure 5). The HVAC introduces fresh air into the cabin depending on the needs. The fresh air flow is managed by the damper position; one position indicates that the damper is closed, and the others take the following values: 410 m3/h (+/−25%), 840 m3/h (+/−20%) and 1250 m3/h (+/−10%). The percentage behind the nominal flow represent variations in the air flow, these variations were supplied by the manufacturer of the system. Therefore, the data is generated, varying the air flow in the indicated range of flows that are directly related to the damper position.
- Number of passengers. The number of passengers can take the values between 0 and 125, which is the maximum passenger allowed in the cabin.
- Parameters defined for components degradation. There is one parameter defined for each FM. The sensors’ faults are modelled by introducing a drift to the sensors’ response; the deviation is controlled by a parameter which indicates no sensor fault and faults at different stages of degradation. The faults in components are defined by relating the response of the system with the parameters which indicate a fault. This relation is mainly defined by giving an understanding of the physics of the physical world. Furthermore, the degradation of the air filter is also defined using expert knowledge and previous experimental results.
Knowing the context in which the train is working is important to build a robust HyMA. The number of passengers, atmospheric conditions, and train speed, among others, are key factors to be considered. Therefore, the HyMA is tested under different operating conditions, including time series where the ventilation, heating, and air conditioning subsystems work individually or together.
4. Experimental Results and Discussion
This section discusses the results obtained after testing the multiple fault detection HyM and the RUL estimation model. As previously mentioned, the synthetic data are generated by the physics-based model to complete the original datasets which contain historical data taken from the real system. The synthetic data contain information on the HVAC system at different levels of degradation and in a healthy state.
The multiple fault detection model uses an ensemble classifier that integrates Boosted trees, as these obtain the best accuracy, 87.8%, on a validation set. A grid search is executed to configure all the tested models with the hyper-parameter values, leading to the best predictive performance. The selected classifier is tested with AdaBoost as the ensemble method; 225 as the maximum number of splits; 10 as the number of learners; and 0.961 as learning rate.
The model is trained, validated, and tested using real and synthetic data. The performance of the multiple fault detection model is represented by both the accuracy and the confusion matrix, obtained after testing the classification model. The confusion matrix is a two-dimension matrix, where the rows represent the true classes to which the data belong, and the columns represent the predicted classes according to the outputs of the classification process. The matrix gives the percentage, and the number of fingerprints corresponding to each class, as the class predicted by the testing process.
Table 3 contains the list of labels used for identifying FMs. Number 0 indicates health; number 1 takes a different position in the fault code or label to identify a specific FM. Therefore, if a fingerprint is labelled with a fault code that shows number 1 in a specific position, and this means that the fingerprint contains data about the FM related to that position.
Table 4 contains the list of trained models and the accuracy obtained with the validation and test sets.
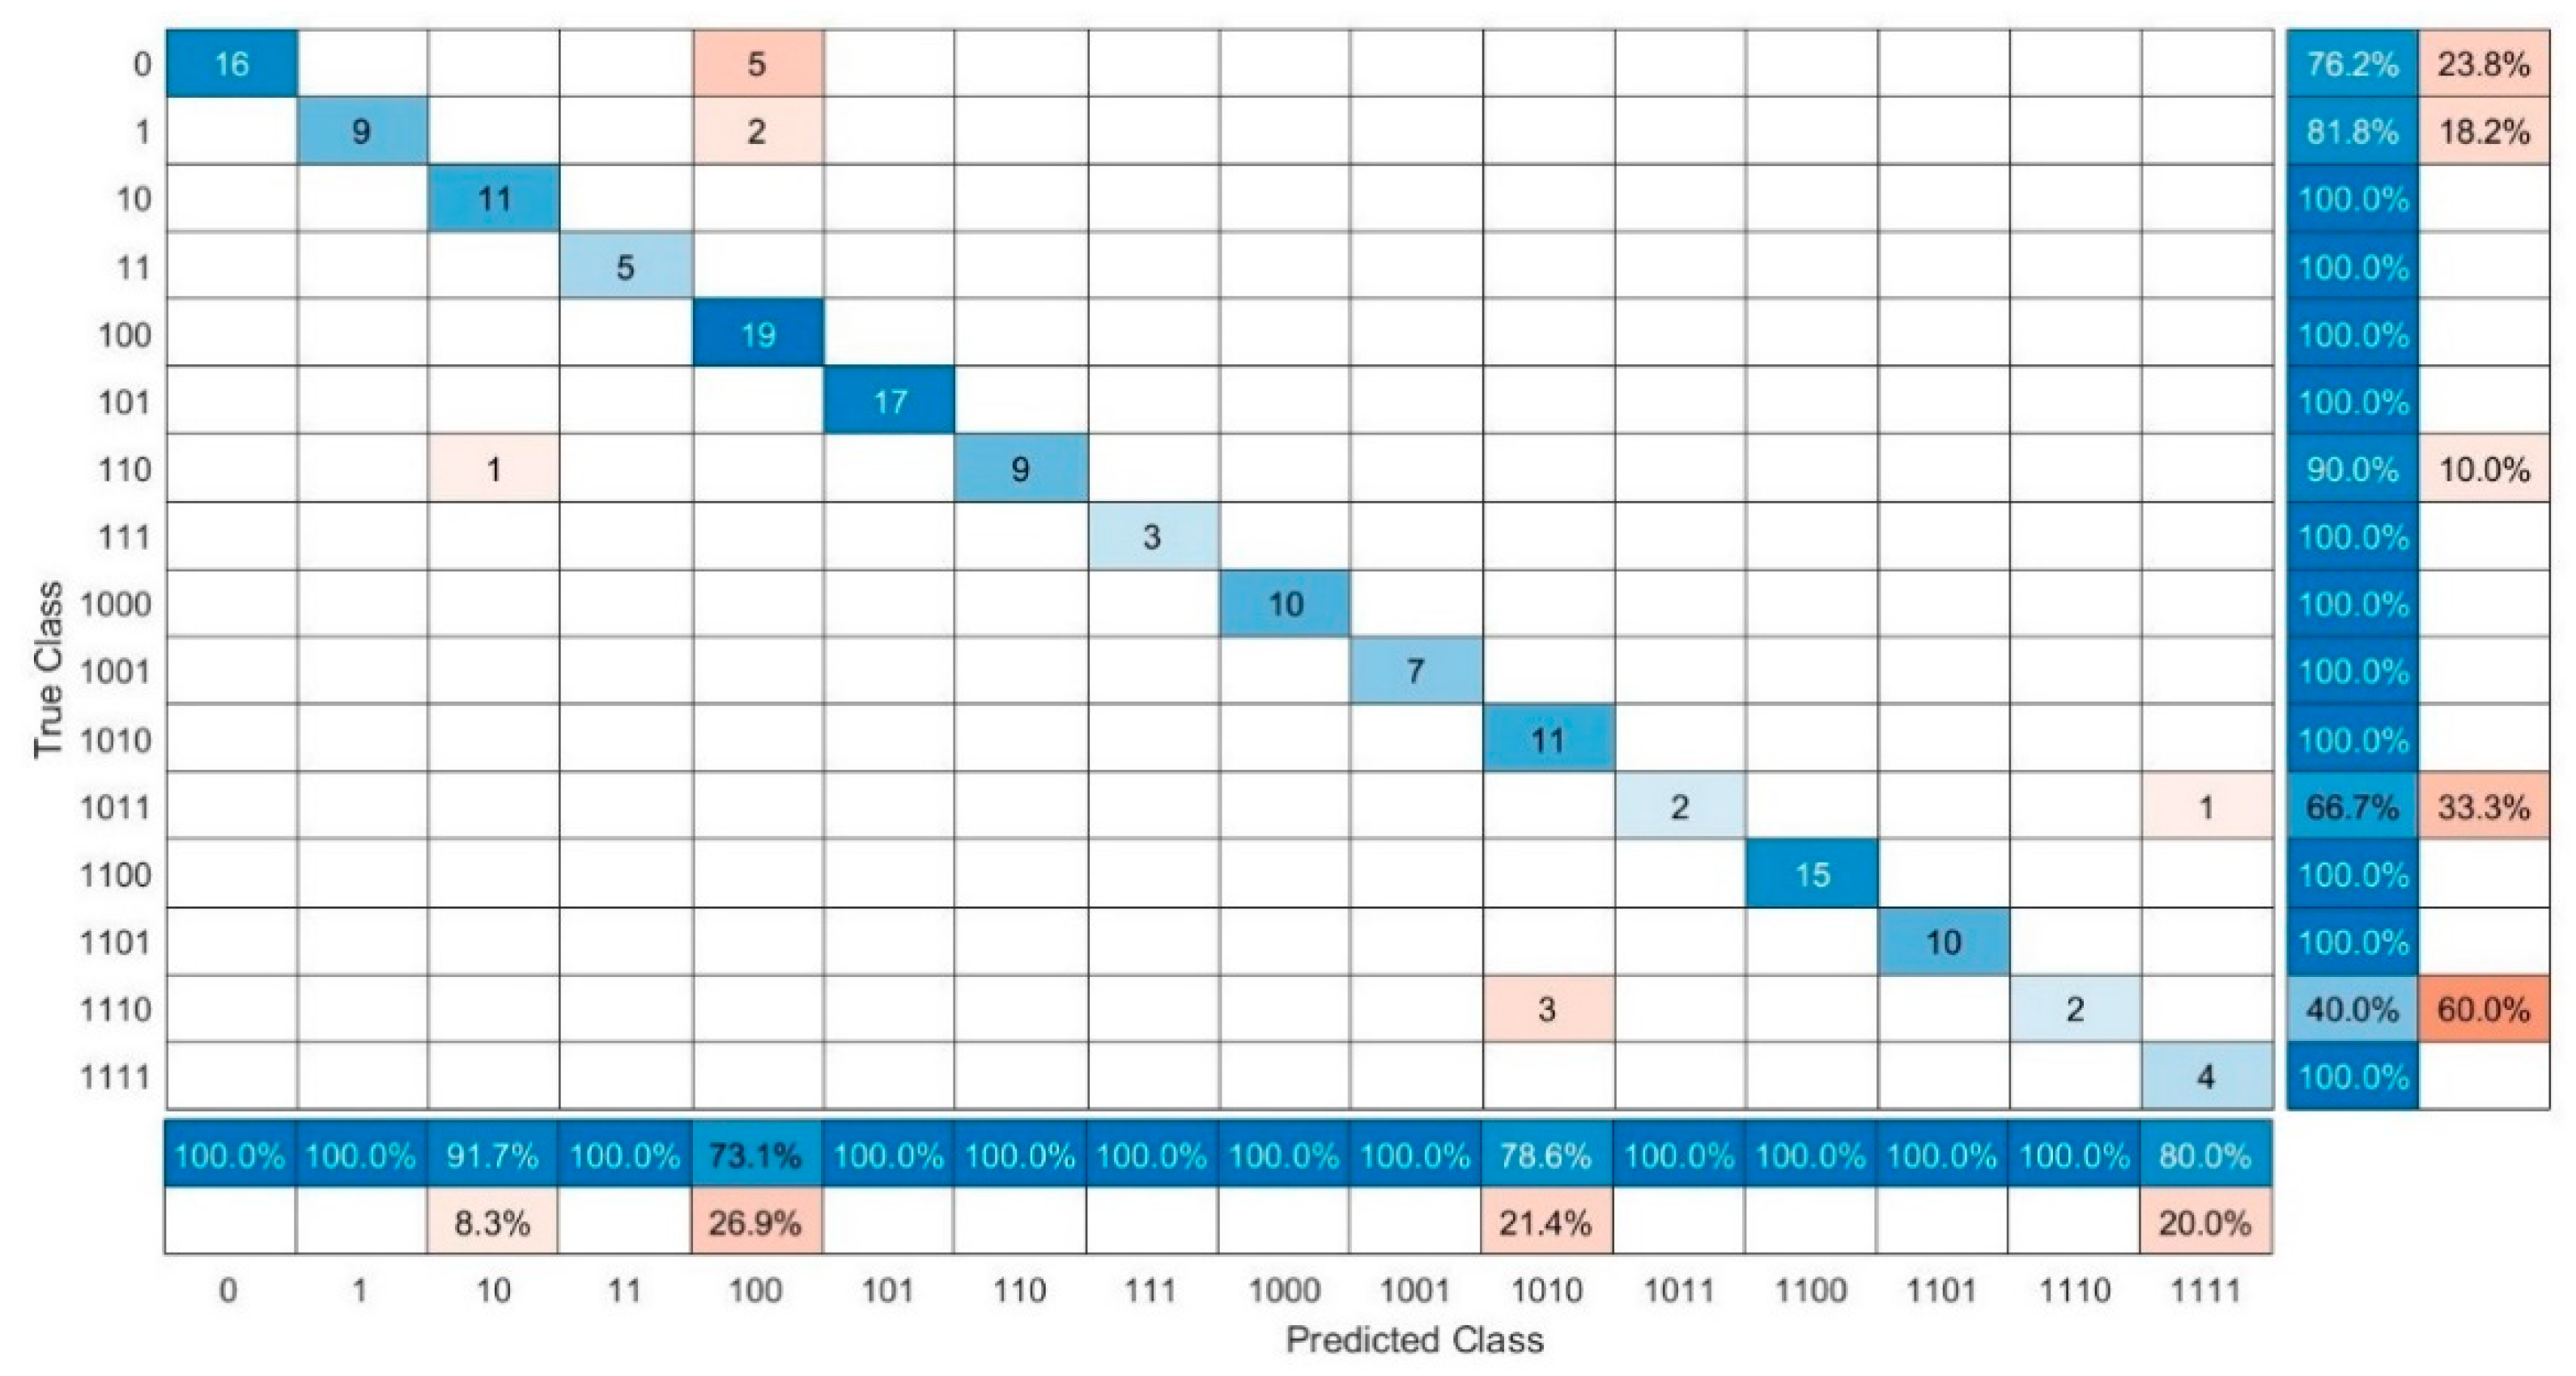
As it is mentioned the selected model is an ensemble classifier that integrates Boosted trees. The accuracy obtained after testing the model is 92.593%. The confusion matrix is represented in Figure 6.
Although the multiple fault detection model shows remarkable accuracy, there are some exceptions. These are summarized in Table 5. The table shows the false positives (FPs) and false negatives (FNs) obtained after testing the classification model.
The testing process indicates that when the model wrongly predicts a class, the incorrect fault code obtained is always the same for each class. In the depicted confusion matrix, when the fingerprint indicates a healthy state, fault code 0 or 0000, 23.8% of these fingerprints are predicted as a deviation in the CO2 sensor, fault code 0100; when the data indicates obstruction of the air filter, fault code 1 or 0001, 12.2% of fingerprints are predicted as a deviation in the CO2 sensor, fault code 0100; when the fingerprints indicates a deviation in the compression rate together with a deviation in the CO2 sensor, fault code 0110, 10% of the fingerprints do not detect the fault in the CO2 sensor, thus predicting fault code 0010; 33.3% of fingerprints that combine the obstruction of the air filter with a deviation of the compression rate and with a deviation in the low pressure side of the refrigerant circuit, fault code 1011, are predicted as fault code 1111. Finally, 60.0% of fingerprints that contain the combination of faults represented by fault code 1110 are predicted as 1010, thus missing the deviation in the CO2 sensor.
Real data are used to train, validate, and test the model. As mentioned, these data are limited to the FMs that indicate deviations in the CO2 sensor and in the pressure sensor located in the low pressure side of the refrigerant circuit. These faults appear individually or together. The fault codes are 0100, 1000, and 1100; this means all the faulty data taken from the real system are accurately detected by the multiple fault detection model.
As mentioned, the FDD process is performed for HVAC systems using different techniques. Different faults are studied in a HVAC system and interior building equipment using ANN, obtaining an accuracy up to 97%. Nevertheless, these faults are detected individually [65]. These processes are also performed using combined ANN and subtractive clustering analysis, the first technique obtained a missing alarm ratio of 8.3%, which indicates that some failures are not detected. The second technique, used perfectly, detects the faults individually [66]. There are other research works focused on the development of the FDD process for the cooling subsystem. A clustering, based on the severity level, which obtains an accuracy between 87% and 98.8%, is used in [67]. SVM for detecting multiple faults, obtaining an accuracy of 99.9%, is used in [68]. All these approaches are able to detect faults that can appear simultaneously and individually, but they cannot detect faults that come from different subsystems and can appear both simultaneously and individually.
Remaining Useful Life Estimation
The RUL is estimated for the air filter when there is an obstruction in it. There are no run-to-failure data for any component of the HVAC system. However, there is knowledge of the obstruction of the air filter in the given time-frame. This make it possible to use the physics-based model to generate run-to-failure data on the air filter.
The air filter modelled stops dust, dirt, and any type of solid particles. Thus, obstruction is the main cause of air filter deterioration. The FM modelled evaluates the behavior of the system when the solid particles in the air filter increase. The absorption capacity increases when the mass of dust increases in the filter. This implies a cumulative damage in the air filter; therefore, an exponential degradation model is chosen to estimate RUL. This model describes degradation using an exponential stochastic process. It predicts the RUL by extrapolating the model’s output to the lifetime value when degradation exceeds a prescribed threshold.
Figure 7 shows the dataset used to test the RUL estimation model. It is trained using datasets, which contain the mass of solid particles accumulated in the air filter; the mass is related to the number of hours the equipment has been working. The dataset plotted in Figure 7 is separated in three segments, highlighted in red, blue, and cyan.
The first estimation of the RUL is calculated at the end of the red segment; at this point, the system has been working for 158 h, and the mass of solid particles accumulated is 14.3248 g. The RUL obtained here is 428.48 h; therefore, 587.78 h is the prediction of the EoL of the air filter. The RUL estimation model can update the RUL estimation when more data are added, so a new RUL is predicted at the end of the blue segment. The data represented by both the red and blue segments are used to estimate the new RUL. It is now 105.76 h, and the EoL of the air filter is 603.76 h. The third segment, the cyan segment, represents how the testing dataset continues to the EoL, thus indicating the real EoL when the air filter works for 617.32 h.
The deviation of the real EoL from the first RUL estimation is 29.54 h, and with the second RUL estimation, the deviation is 13.56 h; the accuracy is in the range of 95.21–97.80%. Thus, the RUL estimation model improves its predictions when the amount of data increases. Once the model is completely developed, and ready to be deployed, the possibility of integrating a security factor must be studied. This could reduce the EoL of the system to avoid the possibility of erroneous predictions that might result in the appearance of a fault.
A methodology for estimating the RUL of a component with an individual fault, and with multiple faults, is presented in [69]. The research work mentioned presents four experiments for validating and testing different RUL estimation methods. Their accuracies range from 63.6% to 62.8%.
5. Conclusions and Outlook
This paper is based on the development of a HyMA for an HVAC system installed in a passenger train carriage. The proposed HyMA can accurately detect multiple faults and estimate the RUL of the HVAC’s air filters. A physics-based model, which contains soft sensors, is used to generate synthetic data for the air filter in healthy and faulty states at different levels of degradation and to generate run-to-failure data in the given time-frame. The inputs loaded in the physics-based model are real data collected by sensors embedded in the real system. Noise is generated and applied to some inputs to increase the diversity of data. A data-driven model is trained, validated, and tested using real and synthetic data to detect multiple faults, which can appear individually or together. Ultimately, an RUL estimation model is developed to estimate the RUL and EoL of the air filters.
The HVAC system is a SoS; this means several different systems work together to deliver a function. A SoS implies complexity in such aspects as the detection, localization, and identification of faults by the sensors embedded in the real system. The challenge of developing a robust multiple fault detection HyM increases when it is difficult to acquire faulty data on critical components. Nevertheless, it is possible to build a multiple fault detection model for a critical SoS using HyMAs. The physics-based model allows developers to define key factors, parameters, and sensors to increase the detectability of faults, but these models must be synchronized using data, measured in the real system, to ensure the simulations match the behavior of the system. These data are used to synchronize the physics-based model, and then, once the HyMA is deployed, to continue training the HyMA. Thus, this approach overcomes the lack of failure data on the HVAC system and increases the diversity of the data by applying noise to some inputs loaded in the physics-based model and thus obtaining a more realistic synthetic dataset.
The data-driven model is trained, validated, and tested by real data and synthetic data. The physics-based model generates data by combining four fault types: the presence of solid particles in the air filters, deviations in the compression rate of compressors, deviations in the CO2 sensor, and pressure deviations in the low pressure side of the refrigerant circuit. The real data contain healthy data and faulty data. The faulty data are deviations in the CO2 sensor and deviations of pressure in the low-pressure side of the refrigerant circuit. These two faults appear individually and together. After comparing different classifiers, the multiple fault detection model is built using an ensemble classifier using Boosted Trees because of the technique’s remarkable accuracy. Although the real faults are well predicted, a few combinations of faults must be improved. The remarkable accuracy demonstrates that the lack of failure data is overcame.
The RUL estimation model is developed for the obstruction of the air filters. This damage is cumulative; therefore, an exponential degradation model is chosen. The testing of this model shows that it accurately predicts the RUL and the EoL of the air filter, but predictions improve when the amount of data, used for estimating the RUL, is increased.
Therefore, the definition of both models provides relevant information on the health state of the HVAC system, improves its reliability and availability, extends its useful life, and reduces its life cycle cost. Moreover, the sustainability of the system is enhanced.
Nevertheless, this research suggests the need to install new sensors in the HVAC system, pressure sensors in the refrigerant circuit: one sensor located between the condenser coil and the expansion valve and another between the evaporator coil and the expansion valve. These two sensors, together with a power consumption sensor for the compressor, improve the FDD process in the cooling subsystems. Considering the importance of the air filter, and its replacement frequency, a power consumption sensor in the blower of the HVAC system may improve the detectability of air filter’s degradation. The research also indicates the need to set up experiments to obtain run-to-failure data to build a RUL estimation model of the whole HVAC system. These changes will results in a tool, which provides more information on the health state of the HVAC system, and thus improving the decision-making support process, whose main objectives lead to an increase in the sustainability of the system by extending, and reducing, its life cycle cost.
Author Contributions
Conceptualization, D.G., D.S., A.G. and A.D.-O.; methodology, A.G.; software, A.G.; validation, A.G., D.S., D.G. and A.D.-O.; formal analysis, A.G. and A.D.-O.; investigation, A.G., D.G. and D.S.; resources, A.G.; data curation, A.G.; writing—original draft preparation, A.G.; writing—review and editing, A.G.; visualization, A.G.; supervision, D.G., D.S. and A.D.-O.; project administration, D.G.; funding acquisition, D.G. All authors have read and agreed to the published version of the manuscript.
Funding
Research was funded by the Basque Government, through ELKARTEK (ref. KK-2020/00049) funding grant.
Institutional Review Board Statement
Not applicable.
Informed Consent Statement
Not applicable.
Conflicts of Interest
The authors declare no conflict of interest.
References
- Sáez-Martínez, F.J.; Lefebvre, G.; Hernández, J.J.; Clark, J.H. Drivers of sustainable cleaner production and sustainable energy options. J. Clean. Prod. 2016, 138, 1–7. [Google Scholar] [CrossRef]
- Franciosi, C.; Voisin, A.; Miranda, S.; Riemma, S.; Iung, B. Measuring maintenance impacts on sustainability of manufacturing industries: From a systematic literature review to a framework proposal. J. Clean. Prod. 2020, 260, 121065. [Google Scholar] [CrossRef]
- Moldavska, A.; Welo, T. The concept of sustainable manufacturing and its definitions: A content-analysis based literature review. J. Clean. Prod. 2017, 166, 744–755. [Google Scholar] [CrossRef]
- Wang, N.; Ma, M.; Liu, Y. The whole lifecycle management efficiency of the public sector in PPP infrastructure projects. Sustainability 2020, 12, 3049. [Google Scholar] [CrossRef] [Green Version]
- Eslami, Y.; Dassisti, M.; Lezoche, M.; Panetto, H. A survey on sustainability in manufacturing organisations: Dimensions and future insights. Int. J. Prod. Res. 2019, 57, 5194–5214. [Google Scholar] [CrossRef] [Green Version]
- Ai, Q.; Yuan, Y.; Mahadevan, S.; Jiang, X. Maintenance strategies optimisation of metro tunnels in soft soil. Struct. Infrastruct. Eng. 2017, 13, 1093–1103. [Google Scholar] [CrossRef]
- Jasiulewicz-Kaczmarek, M. The role and contribution of maintenance in sustainable manufacturing. IFAC Proc. Vol. 2013, 46, 1146–1151, 7th IFAC Conference on Manufacturing Modelling, Management, and Control. [Google Scholar] [CrossRef]
- Mishra, M. Prognostics and Health Management of Engineering Systems for Operation and Maintenance Optimisation. Ph.D. Thesis, Luleå University of Technology, Operation, Maintenance and Acoustics, Luleå, Sweden, 2018. [Google Scholar]
- Mishra, M.; Leturiondo-Zubizarreta, U.; Salgado-Picón, Ó.; Galar-Pascual, D. Hybrid modelling for failure diagnosis and prognosis in the transport sector. Acquired data and synthetic data. DYNA Ing. Ind. 2014, 90, 139–145. [Google Scholar] [CrossRef] [Green Version]
- Galar, D.; Kumar, U. (Eds.) Chapter 5—Diagnosis. In eMaintenance; Academic Press: Cambridge, MA, USA, 2017; pp. 235–310. [Google Scholar] [CrossRef]
- Yun, W.S.; Hong, W.H.; Seo, H. A data-driven fault detection and diagnosis scheme for air handling units in building HVAC systems considering undefined states. J. Build. Eng. 2021, 35, 102111. [Google Scholar] [CrossRef]
- Montazeri, A.; Kargar, S.M. Fault detection and diagnosis in air handling using data-driven methods. J. Build. Eng. 2020, 31, 101388. [Google Scholar] [CrossRef]
- Li, T.; Zhao, Y.; Zhang, C.; Luo, J.; Zhang, X. A knowledge-guided and data-driven method for building HVAC systems fault diagnosis. Build. Environ. 2021, 198, 107850. [Google Scholar] [CrossRef]
- Li, B.; Cheng, F.; Cai, H.; Zhang, X.; Cai, W. A semi-supervised approach to fault detection and diagnosis for building HVAC systems based on the modified generative adversarial network. Energy Build. 2021, 246, 111044. [Google Scholar] [CrossRef]
- Chen, C.; Xu, T.; Wang, G.; Li, B. Railway turnout system RUL prediction based on feature fusion and genetic programming. Measurement 2020, 151, 107162. [Google Scholar] [CrossRef]
- Sun, B.; Li, Y.; Wang, Z.; Ren, Y.; Feng, Q.; Yang, D. An improved inverse Gaussian process with random effects and measurement errors for RUL prediction of hydraulic piston pump. Measurement 2020, 2020, 108604. [Google Scholar] [CrossRef]
- Ge, M.F.; Liu, Y.; Jiang, X.; Liu, J. A review on state of health estimations and remaining useful life prognostics of lithium-ion batteries. Measurement 2021, 174, 109057. [Google Scholar] [CrossRef]
- Yan, Y.; Luh, P.B.; Pattipati, K.R. Fault prognosis of key components in HVAC air-handling systems at component and system levels. IEEE Trans. Autom. Sci. Eng. 2020, 17, 2145–2153. [Google Scholar] [CrossRef]
- Liao, L.; Köttig, F. A hybrid framework combining data-driven and model-based methods for system remaining useful life prediction. Appl. Soft Comput. 2016, 44, 191–199. [Google Scholar] [CrossRef]
- An, D.; Kim, N.H.; Choi, J.H. Practical options for selecting data-driven or physics-based prognostics algorithms with reviews. Reliab. Eng. Syst. Saf. 2015, 133, 223–236. [Google Scholar] [CrossRef]
- Bendapudi, S.; Braun, J.; Groll, E. A dynamic model of a vapor compression liquid chiller. In International Refrigeration and Air Conditioning Conference; Purdue University: West Lafayette, IN, USA, 2002. [Google Scholar]
- Poon, J.; Jain, P.; Konstantakopoulos, I.C.; Spanos, C.; Panda, S.K.; Sanders, S.R. Model-based fault detection and identification for switching power converters. IEEE Trans. Power Electron. 2017, 32, 1419–1430. [Google Scholar] [CrossRef]
- Murphey, Y.L.; Masrur, M.; Chen, Z.; Zhang, B. Model-based fault diagnosis in electric drives using machine learning. IEEE/ASME Trans. Mechatron. 2006, 11, 290–303. [Google Scholar] [CrossRef]
- Hafizi, M.; Izadian, A. Model-based fault diagnosis of a DC-DC boost converters using hidden Markov model. In Proceedings of the IEEE International Conference on Electro-Information Technology, Rapid City, SD, USA, 9–11 May 2013; pp. 1–4. [Google Scholar]
- Chu, S.Y.; Avestruz, A. Electromagnetic model-based foreign object detection for wireless power transfer. In Proceedings of the 2019 20th Workshop on Control and Modeling for Power Electronics (COMPEL), Toronto, ON, Canada, 16–19 June 2019; pp. 1–8. [Google Scholar] [CrossRef]
- Turner, W.; Staino, A.; Basu, B. Residential HVAC fault detection using a system identification approach. Energy Build. 2017, 151, 1–17. [Google Scholar] [CrossRef]
- Iyengar, S.; Lee, S.; Irwin, D.; Shenoy, P.; Weil, B. WattHome: A data-driven approach for energy efficiency analytics at city-scale. In Proceedings of the 24th ACM SIGKDD International Conference on Knowledge Discovery Data Mining, London, UK, 19–23 August 2018; Association for Computing Machinery: New York, NY, USA, 2018; pp. 396–405. [Google Scholar] [CrossRef]
- Fan, C.; Xiao, F.; Li, Z.; Wang, J. Unsupervised data analytics in mining big building operational data for energy efficiency enhancement: A review. Energy Build. 2018, 159, 296–308. [Google Scholar] [CrossRef]
- Mirnaghi, M.S.; Haghighat, F. Fault detection and diagnosis of large-scale HVAC systems in buildings using data-driven methods: A comprehensive review. Energy Build. 2020, 229, 110492. [Google Scholar] [CrossRef]
- Ortego, P.; Diez-Olivan, A.; del Ser, J.; Sierra, B. Data augmentation for industrial prognosis using generative adversarial networks. In Intelligent Data Engineering and Automated Learning—IDEAL 2020; Analide, C., Novais, P., Camacho, D., Yin, H., Eds.; Springer International Publishing: Cham, Switzerland, 2020; pp. 113–122. [Google Scholar]
- Kihoon, C.; Namburu, S.M.; Azam, M.S.; Luo, J.; Pattipati, K.R.; Patterson-Hine, A. Fault diagnosis in HVAC chillers. IEEE Instrum. Meas. Mag. 2005, 8, 24–32. [Google Scholar] [CrossRef]
- Namburu, S.M.; Azam, M.S.; Luo, J.; Choi, K.; Pattipati, K.R. Data-driven modeling, fault diagnosis and optimal sensor selection for HVAC chillers. IEEE Trans. Autom. Sci. Eng. 2007, 4, 469–473. [Google Scholar] [CrossRef]
- Zhou, Z.; Li, G.; Wang, J.; Chen, H.; Zhong, H.; Cao, Z. A comparison study of basic data driven fault diagnosis methods for variable refrigerant flow system. Energy Build. 2020, 224, 110232. [Google Scholar] [CrossRef]
- Liao, L.; Köttig, F. Review of hybrid prognostics approaches for remaining useful life prediction of engineered systems, and an application to battery life prediction. IEEE Trans. Reliab. 2014, 63, 191–207. [Google Scholar] [CrossRef]
- Amin-Naseri, M.; Soroush, A. Combined use of unsupervised and supervised learning for daily peak load forecasting. Energy Convers. Manag. 2008, 49, 1302–1308. [Google Scholar] [CrossRef]
- Piscitelli, M.S.; Mazzarelli, D.M.; Capozzoli, A. Enhancing operational performance of AHUs through an advanced fault detection and diagnosis process based on temporal association and decision rules. Energy Build. 2020, 226, 110369. [Google Scholar] [CrossRef]
- Xu, Y.; Li, Z.; Wang, S.; Li, W.; Sarkodie-Gyan, T.; Feng, S. A hybrid deep-learning model for fault diagnosis of rolling bearings. Measurement 2021, 169, 108502. [Google Scholar] [CrossRef]
- Hassanpour, H.; Mhaskar, P.; House, J.M.; Salsbury, T.I. A hybrid modeling approach integrating first-principles knowledge with statistical methods for fault detection in HVAC systems. Comput. Chem. Eng. 2020, 142, 107022. [Google Scholar] [CrossRef]
- Tidriri, K.; Tiplica, T.; Chatti, N.; Verron, S. A new hybrid approach for fault detection and diagnosis. In Proceedings of the 20th World Congress of the International Federation of Automatic Control, Toulose, France, 9–14 July 2017; Volume 50. [Google Scholar]
- Frank, S.; Heaney, M.; Jin, X.; Robertson, J.; Cheung, H.; Elmore, R.; Henze, G. Hybrid Model-Based and Data-Driven Fault Detection and Diagnostics for Commercial Buildings: Preprint. In Proceedings of the 2016 ACEEE Summer Study on Energy Efficiency in Buildings Conference, Pacific Grove, CA, USA, 21–26 August 2016. [Google Scholar]
- Alam, M.A.; Azarian, M.H.; Osterman, M.; Pecht, M. Prognostics of failures in embedded planar capacitors using model-based and data-driven approaches. J. Intell. Mater. Syst. Struct. 2011, 22, 1293–1304. [Google Scholar] [CrossRef]
- Luo, M.; Wang, D.; Pham, M.; Low, C.B.; Zhang, J.B.; Zhang, D.H.; Zhao, Y.Z. Model-based fault diagnosis/prognosis for wheeled mobile robots: A review. In Proceedings of the 31st Annual Conference of IEEE Industrial Electronics Society, IECON 2005, Raleigh, NC, USA, 6–10 November 2005. [Google Scholar] [CrossRef]
- Aven, T. On the meaning of a black swan in a risk context. Saf. Sci. 2013, 57, 44–51. [Google Scholar] [CrossRef]
- Tahir, F.; Islam, M.T.; Mack, J.; Robertson, J.; Lovett, D. Process monitoring and fault detection on a hot-melt extrusion process using in-line Raman spectroscopy and a hybrid soft sensor. Comput. Chem. Eng. 2019, 125, 400–414. [Google Scholar] [CrossRef] [Green Version]
- Kadlec, P.; Gabrys, B.; Strandt, S. Data-driven soft sensors in the process industry. Comput. Chem. Eng. 2009, 33, 795–814. [Google Scholar] [CrossRef] [Green Version]
- Wilhelm, Y.; Reimann, P.; Gauchel, W.; Mitschang, B. Overview on hybrid approaches to fault detection and diagnosis: Combining data-driven, physics-based and knowledge-based models. Procedia CIRP 2021, 99, 278–283, 14th CIRP Conference on Intelligent Computation in Manufacturing Engineering, 15–17 July 2020. [Google Scholar] [CrossRef]
- Bhanot, V.; Bacellar, D.; Ling, J.; Alabdulkarem, A.; Aute, V.; Radermacher, R. Steady state and transient validation of heat pumps using alternative lower-GWP refrigerants paper. In Proceedings of the 15th International Refrigeration and Air Conditioning Conference, Purdue, IN, USA, 14–17 July 2014; Purdue University: West Lafayette, IN, USA, 2014. [Google Scholar]
- Ackoff, R.L. Towards a System of Systems Concepts. Manag. Sci. 1971, 17, 661–671. [Google Scholar] [CrossRef]
- Abdoli, S.; Kara, S.; Hauschild, M. System interaction, system of systems, and environmental impact of products. CIRP Ann. 2019, 68, 17–20. [Google Scholar] [CrossRef]
- Uday, P.; Chandrahasa, R.; Marais, K. System importance measures: Definitions and application to system-of-systems analysis. Reliab. Eng. Syst. Saf. 2019, 191, 106582. [Google Scholar] [CrossRef]
- Office of the Deputy under Secretary of Defense for Acquisition and Technology, Systems and Software Engineering. Systems Engineering Guide for Systems of Systems, Version 1.0; ODUSD(A&T)SSE: Washington, DC, USA, 2008. [Google Scholar]
- Fornlöf, V.; Galar, D.; Syberfeldt, A.; Almgren, T. Aircraft engines: A maintenance trade-off in a complex system. In Proceedings of the International Conference on Quality, Reliability and Infocom Technology, Delhi, India, 28–30 December 2015. [Google Scholar]
- Gálvez, A.; Seneviratne, D.; Galar, D. Development and synchronisation of a physics-based model for heating, ventilation and air conditioning system integrated into a hybrid model. Int. J. Hydromechatron. 2021. [Google Scholar] [CrossRef]
- Gálvez, A.; Diez-Olivan, A.; Seneviratne, D.; Galar, D. Synthetic data generation in hybrid modelling of railway HVAC system. In Proceedings of the 17th IMEKO TC 10 and EUROLAB Virtual Conference: “Global Trends in Testing, Diagnostics Inspection for 2030”, Online, 20–22 October 2020; pp. 79–84. [Google Scholar]
- Galvez, A.; Seneviratne, D.; Galar, D.; Juuso, E. Feature assessment for a hybrid model. In Proceedings of the Fifth International Conference on Maintenance, Condition Monitoring and Diagnostics, MCMD 2021, Online, 16–17 February 2021. [Google Scholar]
- Bastos, P.; Lopes, I.; Pires, L. Application of data mining in a maintenance system for failure prediction. In Safety, Reliability and Risk Analysis: Beyond the Horizon: 22nd European Safety and Reliability; Taylor & Francis Group: London, UK, 2020; pp. 933–940. [Google Scholar]
- Zhang, C.; Liu, C.; Zhang, X.; Almpanidis, G. An up-to-date comparison of state-of-the art classification algorithms. Expert Syst. Appl. 2017, 82, 128–150. [Google Scholar] [CrossRef]
- Moosavian, A.; Ahmadi, H.; Sakhaei, B.; Labbafi, R. Support vector machine and K-nearest neighbour for unbalanced fault detection. J. Qual. Maint. Eng. 2014, 20, 65–75. [Google Scholar] [CrossRef]
- Wakiru, J.; Pintelon, L.; Muchiri, P.; Chemweno, P. A data mining approach for lubricant-based fault diagnosis. J. Qual. Maint. Eng. 2020. [Google Scholar] [CrossRef]
- Kabasakal, I.; Keskin, F.D.; Koçak, A.; Soyuer, H. A prediction model for fault detection in molding process based on logistic regression technique. In Proceedings of the International Symposium for Production Research 2019; Durakbasa, N.M., Gençyılmaz, M.G., Eds.; Springer International Publishing: Cham, Switzerland, 2020; pp. 351–360. [Google Scholar]
- Piryonesi, S.M.; El-Diraby, T.E. Data analytics in asset management: Cost-effective prediction of the pavement condition index. J. Infrastruct. Syst. 2019, 26. [Google Scholar] [CrossRef]
- Radha, P.; Divya, R. An Efficient Detection of HCC-recurrence in Clinical Data Processing using Boosted Decision Tree Classifier. Procedia Comput. Sci. 2020, 167, 193–204. [Google Scholar] [CrossRef]
- Santos, P.; Amado, C.; Coelho, S.T.; Leitão, J.P. Stochastic data mining tools for pipe blockage failure prediction. Urban Water J. 2017, 14, 343–353. [Google Scholar] [CrossRef]
- Martinez, A.M.; Kak, A.C. PCA versus LDA. IEEE Trans. Pattern Anal. Mach. Intell. 2001, 23, 228–233. [Google Scholar] [CrossRef] [Green Version]
- Magoulès, F.; Zhao, H.X.; Elizondo, D. Development of an RDP neural network for building energy consumption fault detection and diagnosis. Energy Build. 2013, 62, 133–138. [Google Scholar] [CrossRef]
- Du, Z.; Fan, B.; Jin, X.; Chi, J. Fault detection and diagnosis for buildings and HVAC systems using combined neural networks and subtractive clustering analysis. Build. Environ. 2014, 73, 1–11. [Google Scholar] [CrossRef]
- Li, D.; Hu, G.; Spanos, C. A data-driven strategy for detection and diagnosis of building chiller faults using linear discriminant analysis. Energy Build. 2016, 128, 519–529. [Google Scholar] [CrossRef]
- Han, H.; Gu, B.; Hong, Y.; Kang, J. Automated FDD of multiple-simultaneous faults (MSF) and the application to building chillers. Energy Build. 2011, 43, 2524–2532. [Google Scholar] [CrossRef]
- Yan, Y.; Cai, J.; Li, T.; Zhang, W.; Sun, L. Fault prognosis of HVAC air handling unit and its components using hidden-semi Markov model and statistical process control. Energy Build. 2021, 240, 110875. [Google Scholar] [CrossRef]
Figure 1.
Main steps of a CBM strategy.

Figure 2.
Scheme of proposed methodology to build the hybrid model.

Figure 3.
Taxonomy classification, from (ISO 14224, 2016).

Figure 4.
Principal items considered in the studied HVAC system.

Figure 5.
Principal components of the modelled HVAC system.

Figure 6.
Confusion matrix of the multiple fault detection model.

Figure 7.
Testing process of the RUL estimation model.


Table 1.
List of parameters for feature extraction.
| Variable | Type |
|---|---|
| Temperature after compressor 1—virtual | Signal (continuous) |
| Temperature after compressor 2—virtual | Signal (continuous) |
| Temperature before compressor 1—virtual | Signal (continuous) |
| Temperature before compressor 2—virtual | Signal (continuous) |
| Pressure after compressor 1—real | Signal (continuous) |
| Pressure after compressor 2—real | Signal (continuous) |
| Pressure before compressor 1—real | Signal (continuous) |
| Pressure before compressor 2—real | Signal (continuous) |
| Pressure after air filter—virtual | Signal (continuous) |
| Pressure before air filter—virtual | Signal (continuous) |
| Real heat transfer—virtual | Signal (continuous) |
| Mass flow rate—virtual | Signal (continuous) |
| CO2 level—real | Signal (continuous) |
| Vehicle temperature—real | Signal (continuous) |
| Impulsion temperature—real | Signal (continuous) |
| Fault code | Condition Variable (discrete) |
Table 2.
Distribution of healthy and faulty data in the combined dataset used to fit the supervised learner.
Table 2.
Distribution of healthy and faulty data in the combined dataset used to fit the supervised learner.
| Healthy | Faulty | ||
|---|---|---|---|
| Real | 41 | 109 | |
| Synthetic | 66 | 575 | |
| Total | 107 | 684 | 791 |
Table 3.
List of fault codes and failure modes.
| Fault Code | Failure Mode |
|---|---|
| 0 or 0000 | Healthy state of the system |
| 1 or 0001 | Obstruction of the air filter |
| 10 or 0010 | Deviation of the compression rate |
| 100 or 0100 | Deviation in the CO2 sensor |
| 1000 | Pressure deviation in the low-pressure side of the refrigerant circuit |
Table 4.
List of trained models and their accuracy.
| Trained Models | Accuracy—Validation Set | Accuracy—Testing Set |
|---|---|---|
| Decision Tree—Fine Tree | 73.3% | 67.3% |
| Decision Tree—Medium Tree | 63.4% | 56.8% |
| Decision Tree—Coarse Tree | 35.8% | 32.7% |
| Linear Discriminant | - | - |
| Quadratic Discriminant | - | - |
| Naïve Bayes—Gaussian Naïve Bayes | - | - |
| Naïve Bayes—Kernel Naïve Bayes | - | - |
| SVM—Linear SVM | 25.0% | 24.1% |
| SVM—Quadratic SVM | 26.1% | 24.1% |
| SVM—Cubic SVM | 28.5% | 24.7% |
| SVM—Fine Gaussian SVM | 13.5% | 13.6% |
| SVM—Medium Gaussian SVM | 15.9% | 18.5% |
| SVM—Coarse Gaussian SVM | 13.5% | 15.4% |
| k-NN—Fine k-NN | 15.9% | 25.9% |
| k-NN—Medium k-NN | 13.5% | 19.8% |
| k-NN—Coarse k-NN | 27.7% | 17.3% |
| k-NN—Cosine k-NN | 21.1% | 19.8% |
| k-NN—Cubic k-NN | 20.7% | 18.5% |
| k-NN—Weighted k-NN | 25.8% | 26.5% |
| Ensemble—Boosted Trees | 87.8% | 92.6% |
| Ensemble—Bagged Trees | 82.0% | 87.0% |
| Ensemble—Subspace Discriminant | 27.5% | 27.8% |
| Ensemble—Subspace k-NN | 42.8% | 48.1% |
| Ensemble—RUSBoosted Trees | 48.6% | 56.8% |
Table 5.
False positives and false negatives obtained from testing process.
| Fault Code | False Positives | False Negatives |
|---|---|---|
| 0000 | 0.0% | 23.8% |
| 0001 | 0.0% | 18.2% |
| 0110 | 0.0% | 10.0% |
| 1011 | 0.0% | 33.3% |
| 1110 | 0.0% | 60.0% |
Publisher’s Note: MDPI stays neutral with regard to jurisdictional claims in published maps and institutional affiliations. |
© 2021 by the authors. Licensee MDPI, Basel, Switzerland. This article is an open access article distributed under the terms and conditions of the Creative Commons Attribution (CC BY) license (https://creativecommons.org/licenses/by/4.0/).
Share and Cite
MDPI and ACS Style
Gálvez, A.; Diez-Olivan, A.; Seneviratne, D.; Galar, D. Fault Detection and RUL Estimation for Railway HVAC Systems Using a Hybrid Model-Based Approach. Sustainability 2021, 13, 6828. https://0-doi-org.brum.beds.ac.uk/10.3390/su13126828
AMA Style
Gálvez A, Diez-Olivan A, Seneviratne D, Galar D. Fault Detection and RUL Estimation for Railway HVAC Systems Using a Hybrid Model-Based Approach. Sustainability. 2021; 13(12):6828. https://0-doi-org.brum.beds.ac.uk/10.3390/su13126828
Chicago/Turabian StyleGálvez, Antonio, Alberto Diez-Olivan, Dammika Seneviratne, and Diego Galar. 2021. "Fault Detection and RUL Estimation for Railway HVAC Systems Using a Hybrid Model-Based Approach" Sustainability 13, no. 12: 6828. https://0-doi-org.brum.beds.ac.uk/10.3390/su13126828
Note that from the first issue of 2016, this journal uses article numbers instead of page numbers. See further details here.