Article

Assessing Livelihood Vulnerability of Minority Ethnic Groups to Climate Change: A Case Study from the Northwest Mountainous Regions of Vietnam

1
Centre for Applied Climate Sciences, University of Southern Queensland, Toowoomba 4350, Australia
2
Faculty of Natural Resources and Environment, Vietnam National University of Agriculture (VNUA), Trauquy, Gialam, Hanoi 12406, Vietnam
3
Centre for Sustainable Agricultural Systems, University of Southern Queensland, Toowoomba 4350, Australia
*
Author to whom correspondence should be addressed.
Sustainability 2021, 13(13), 7106; https://0-doi-org.brum.beds.ac.uk/10.3390/su13137106
Submission received: 13 May 2021 / Revised: 14 June 2021 / Accepted: 21 June 2021 / Published: 24 June 2021
(This article belongs to the Special Issue Climate Risk Management for Resilient Agricultural Systems)

Abstract

:
Climate variability, climate change, and extreme events can compound the vulnerability of people heavily reliant on agriculture. Those with intersecting disadvantages, such as women, the poor, and ethnic minority groups, may be particularly affected. Understanding and assessing diverse vulnerabilities, especially those related to ethnicity, are therefore potentially important to the development of policies and programs aimed at enabling adaptation in such groups. This study uses a livelihood vulnerability index (LVI) method, along with qualitative data analysis, to compare the vulnerability of different smallholder farmers in Son La province, one of the poorest provinces in Vietnam. Data were collected from 240 households, representing four minority ethnic groups. The results indicated that household vulnerability is influenced by factors such as income diversity, debt, organizational membership, support from and awareness by local authorities, access to health services, water resources, and location. Results revealed that two of the ethnic groups’ households were, on average, more vulnerable, particularly regarding livelihood strategies, health, water, housing and productive land, and social network items when compared to the other two ethnic groups. The study shows the need for targeted interventions to reduce the vulnerability of these and similarly placed small ethnic communities.

1. Introduction

Vietnam is ranked as one of the world’s ten most vulnerable countries to climate change and climate events such as rising sea levels, storms, floods, and droughts [1,2,3]. Under increasing climate variability, people whose livelihoods rely mostly on agricultural activities are relatively vulnerable, particularly in developing countries [4]. Reference [5] indicates that coastal people in Vietnam have generally higher vulnerability to climate change because nearly 60% of livelihoods are based on aquaculture and agriculture, whereas the mountainous regions have unstable and complex topography with poorer economic prospects, and people in those regions are highly sensitive to slight changes in the frequency and severity of climate events [6,7]. Vulnerability and adaptation research in Vietnam has largely focused on coastal areas, especially in the Mekong River Delta, with most work focusing on assessing the direct impacts of climate change. Significant threats include increases in the frequency and intensity of droughts and sea level rise driving saline intrusion in the Mekong River Delta, causing the loss of land for rice production, which could threaten national food security [8]. There may, however, be differences in the degree of vulnerability and capacity to adapt amongst different groups, especially considering various forms of social disadvantage. To develop proper adaptation strategies and solutions/policies to reduce rural households’ vulnerability and to improve their resilience, it is very important to understand the livelihood vulnerability of rural households, especially in countries depending heavily on agriculture.
Livelihood vulnerability can be a function of both physiological and social factors [9]. Physiological vulnerability is the extent to which communities are exposed to physical effects such as sea-level rise and an increase in sea temperature, and/or atmospheric temperature. Such exposure to climate change increases rural livelihood vulnerability and reduces households’ ability to cope with climate risks, shocks, and stress [10]. Rural households often have limited assets and thus adaptive capacity [11]. The social vulnerability can include factors such as relative inequality, the degree of urbanisation, and the rate of economic growth [9].
Vulnerability assessments have become a core means of understanding development challenges and climate change influence in many contexts. Such assessments can encompass the numerous methods utilized to systematically consider interactions between humans and their environmental surroundings, including physical and social aspects [12]. Approaches to vulnerability assessment include historical narrative, comparative analysis, statistical analysis, indicator-based methods, and agent-based modelling. Recently, the indicator-based method has been widely used to assess vulnerability to climate change and climate-induced disasters [13,14]. Almost all the approaches use indicators to characterize and quantify the different dimensions of vulnerability, with the common practice being to combine the diverse indicators into a single composite index [12,15]. The indicator approach has been used at different scales and domains to quantify system dynamics [13,16,17,18]). The Sustainable Livelihood Approach (SLA) (Figure 1) has been used to understand household livelihoods and to plan community development programs. This approach considers five types of household’s assets i.e., natural, social, financial, physical, and human, and uses multiple indicators to assess exposure level to natural disasters and climate change. Households’ economic characteristics affect households’ adaptive capacity, and the characteristics of health, food and water resources determine the household’s sensitivity to climate change impacts [19]. A major work in livelihood vulnerability assessment is that of [12], who developed two approaches. They first expressed LVI as a composite index, comprising seven major components. The second approach was based on the vulnerability definition of the Intergovernmental Panel on Climate Change (IPCC), whereby they decomposed the seven components into three: based on exposure, sensitivity, and adaptive capacity. The LVI approaches consist of variables indicating the level of exposure, sensitivity, and adaptive capacity to climate-induced disasters (for example, droughts and floods, landslide, etc.) and climate change. The LVI indicates a way to understand how vulnerability varies across time and space and to identify the main factors contributing to vulnerability, highlight strategies reducing the vulnerable level, and also evaluate how efficient these strategies are in different social and ecological environments [15]. In the past decade, the LVI has become a means of assessing farmers’ vulnerability to climate change and disasters around the world [4,15,20,21,22,23].
The Northwest mountainous region (NMR) of Vietnam is highly sensitive to slight changes in the frequency and extent of natural disasters with its fragile ecosystems, unstable geology, and complex topography [7]. The NMR is home to numerous marginalized ethnic minority groups that experience, in relative terms, extremely low-income levels and poor health care. The region is ranked the poorest and highest inequality region of Vietnam (with the overwhelming majority of the population (95.6%) being ethnic minorities) [25,26,27]. The level of education, especially among ethnic minorities, is far below the national average [28]. People living in this area also often experience substantial food shortage and low water quality due to climate change such as extreme weather events. Vietnam Institution of Meteorology, Hydrology and Climate Change [29] notes that, in Vietnam, vulnerability is concentrated in poor communities and it is crucial to address the underlying causes of vulnerability in the context of climate change to achieve sustainable development goals. Despite recognition of the need, there has been little attention focused on the vulnerability of communities’ livelihood systems to climate change in the mountainous regions of Vietnam and specifically on the challenges faced by ethnic minority communities. Further, NMR is a hilly remote region without advanced infrastructure, leading to significant barriers to access to even close cities or towns for living activities such as shopping, attending schools or seeking medical assistance or services. For the above mentioned reasons, work focusing on the NMR is particularly necessary to develop appropriate strategies in support of reducing the poverty and vulnerability of rural households and ethnic minority groups. Importantly, previous work conducted by [23] to assess household livelihood vulnerability to climate change in the NMR did not focus on the ethnicity perspective, which remains a major gap.
This research aims to explore the livelihood vulnerability of different ethnic groups living in the Phu Yen district, Son La province in the NMR. The ethnic groups in the Phu Yen district were selected as typical of communities in the region. We consider major factors driving different assessed outcomes among the ethnic groups which could then be addressed in climate change adaptation policies and programs. We hypothesized, based on previous vulnerability studies and studies of poverty in Vietnam, that minority ethnic groups would have relatively high levels of vulnerability, generally, and therefore in relation to climate change.
We apply the LVI [12] and reference the work of [30] but have modified or added a number of new indicators relevant to the Son La province in the NRM to better understand the livelihoods of local minority people and explore the main factors affecting the vulnerability of households to climate change. This research contributes to the literature concerning the assessment of vulnerability of rural households and provides a reference for policy making aimed at helping people living in similar economic and natural regions. More specifically, this research assists in developing targeted policy interventions aiming at improving resilience of the marginal ethnic groups in mountainous regions of Vietnam.

2. Materials and Methods

2.1. Description of the Study Area

The study was carried out in the Phu Yen district, Son La province (Figure 2). Son La is considered highly vulnerable to climate change because of its topography and geography [31]. According to the Ministry of Labour, War Invalids and Social Affairs of Vietnam (Decision 1095/QD-LDTBXH dated 8 August 2016), Son La was the province having the third-highest number of poor households in Vietnam during 2016–2020. Phu Yen is the third-largest rice-producing district of the northwest region but also one of the five poorest districts of Son La province. Phu Yen district is receiving support from the ‘National Target program for Sustainable Poverty Reduction in the 2016–2020 period’. There are 27 villages in Phu Yen district, of which 14 are located in the highlands and 11 belong to the groups considered as “especially difficult communes” specified under Program 135. The total natural area of Phu Yen district is 1227 km2 with a population of approximately 116,000 people. Agricultural production includes intensive rice, fruits and crop. Phu Yen district has four main ethnic groups: Thai, Muong, Dao, and Hmong. Among them, Thai and Muong make up the majority of the population. Some groups may have several compounding disadvantages, including isolation, social and economic exclusion, and a very high dependence on agricultural production. The Hmong and Dao people, for example, often live in high mountainous areas far from district/commune centres while the remaining ethnic groups mainly live in lowland areas (valleys) and/or near the district centre (Table 1). Thus, they are further from health and education services and labour markets. The people in the study area often experience economic loss because of natural hazards such as droughts and hot winds in the dry season, flash floods and landslides in the rainy season, and cold spells and frosts in winter [32]. In summary, the study site has known disadvantaged groups and high exposure to climatic variability, events, and change.

2.2. Data Collection

The questionnaire, largely based on items used in previous studies but applied elsewhere [12,15,22,33], consisted of eight sections, including household demographic profile, livelihood strategies; social networks and finance; health; food; water supply; housing and productive land; natural disasters and climate variability. There were initial in-depth interviews with experts from organizations such as Statistical Departments, Agriculture Department, Meteorological Centre, and the People’s Committee at both provincial and district level, in order to better understand the research context and to select study sites in Phu Yen district. A list of suggested components related to vulnerability assessment to climate variability and climate events was given to local officials and experts in the fields of agriculture and climate for advice on which components were relevant to the locality. These components were then revised for the household survey (see Appendix A). A survey of 240 households in the Phu Yen district was conducted from December 2018 to January 2019. Households were randomly selected from lists of all communities. As the primary purpose of this study is to focus on understanding and assessing ethnic minority vulnerability, all participants were categorised into one of four ethnic groups. Interviews were conducted by the lead author and one local assistant. Generally, interviews were conducted only with the head of the household but if he/she was not available, the main labourer was interviewed. Each interview took 1 to 1.5 h on average and was conducted in the Vietnamese language. The local people, including the various minority groups, have mostly used this language in daily communication. Surveys were conducted with the approval of the Human Research Ethics Committee of the University of Southern Queensland. Data were entered into, checked, and analysed within Excel software 2010. Secondary data on daily minimum and maximum temperatures, and daily precipitation were collected from the Phu Yen meteorological station and also obtained from the Hydro-Meteorological Data Centre of Vietnam (HMDC) from 1961 to 2017.

2.3. Data Analysis

As mentioned, this study applied the LVI and LVI-IPCC developed by [12] to calculate a composite LVI with weightings based on expert opinions and stakeholder discussions [17,34]. Calculation of LVI-IPCC is based on the IPCC definition [35], which defines livelihood vulnerability as a function of factors that contribute to exposure, sensitivity, and adaptive capacity. This then leads to proposals around adaptation. The methods for each of the vulnerability indices used in this study are provided in the following sections.

2.3.1. Composite Livelihood Vulnerability Index

We adapted the hierarchical approach [12] of constructing the LVI based on major components and associated subcomponents. In this study, the LVI has eight major components: (1) sociodemographic profile; (2) livelihood strategies; (3) social networks and finance; (4) health; (5) food; (6) water; (7) housing and productive land; and (8) natural disasters and climate variability. Compared to [12] and [30], we added a new major component—“Housing and productive land” in this research due to expected vulnerability, based on regional experience, related to injury/death as well as property damage/loss during extreme weather events. Furthermore, each major component is divided into specific sub-components (see Appendix A). Based on a review of existing literature, a field survey and consultations with numerous experts and local officials, 39 subcomponents (see Appendix A) were selected to assess the vulnerability level under the impact of climate change.
A balanced, weighted-average approach was employed to calculate the composite LVI [34]. Equal weighting of components was used in the absence of compelling evidence of a need and basis for differential weightings. Using equal weighting also makes the interpretation process simpler. This does, however, mean that while each subcomponent contributes equally to the overall vulnerability index, there is a difference in the number of subcomponents so that each major component contributes a different weighting to the overall vulnerability rating. Therefore, it is important to look closely at the subcomponent results. Data for the composite LVI are from household surveys, with the addition of regional precipitation and temperature data. The survey work was approved by the Human Research Ethics Committee of the University of Southern Queensland (approval for H18REA267).
Step 1: As many subcomponents are measured using different scales, e.g., numbers and percentages, each subcomponent needs to be standardized for comparability among them and for compiling the overall index as follows Equation (1).
I n d e x S C c = S C c S C min S C max S C min
where SCc is the actual value of a subcomponent for a community c; SCmin and SCmax are the minimum and maximum values of each subcomponent reflecting low and high vulnerability, respectively.
Step 2: An index for each major component of vulnerability is then created by averaging their respective standardized subcomponents given by Equation (2).
M C c = i = 1 n I n d e x S C c i n
where MCc represents each major components (eight major components) of the commune; and IndexSCci is the indexed subcomponent value of each major component MCc for the commune and n is the number of subcomponents in each major component.
Step 3: Once values for each of the major components for a community are calculated, they are averaged to obtain the community-level LVI, given by Equation (3).
L V I c = i = 1 8 w M C i M C c i i = 1 8 w M C i
where LVIc is the LVI for a community c which is the weighted average of the eight major components. The weights of each major component, wMCi are determined by the number of subcomponents making up each major component and are included to ensure that all subcomponents contribute equally to the overall LVI (see Appendix B for an example of an LVI calculation). After calculating the major components and the LVI for each group, a spider diagram was also created to compare the vulnerability level in each major component among the groups. The LVI was scaled in the range from 0 to 0.7. A higher value for the LVI denotes more vulnerable systems.

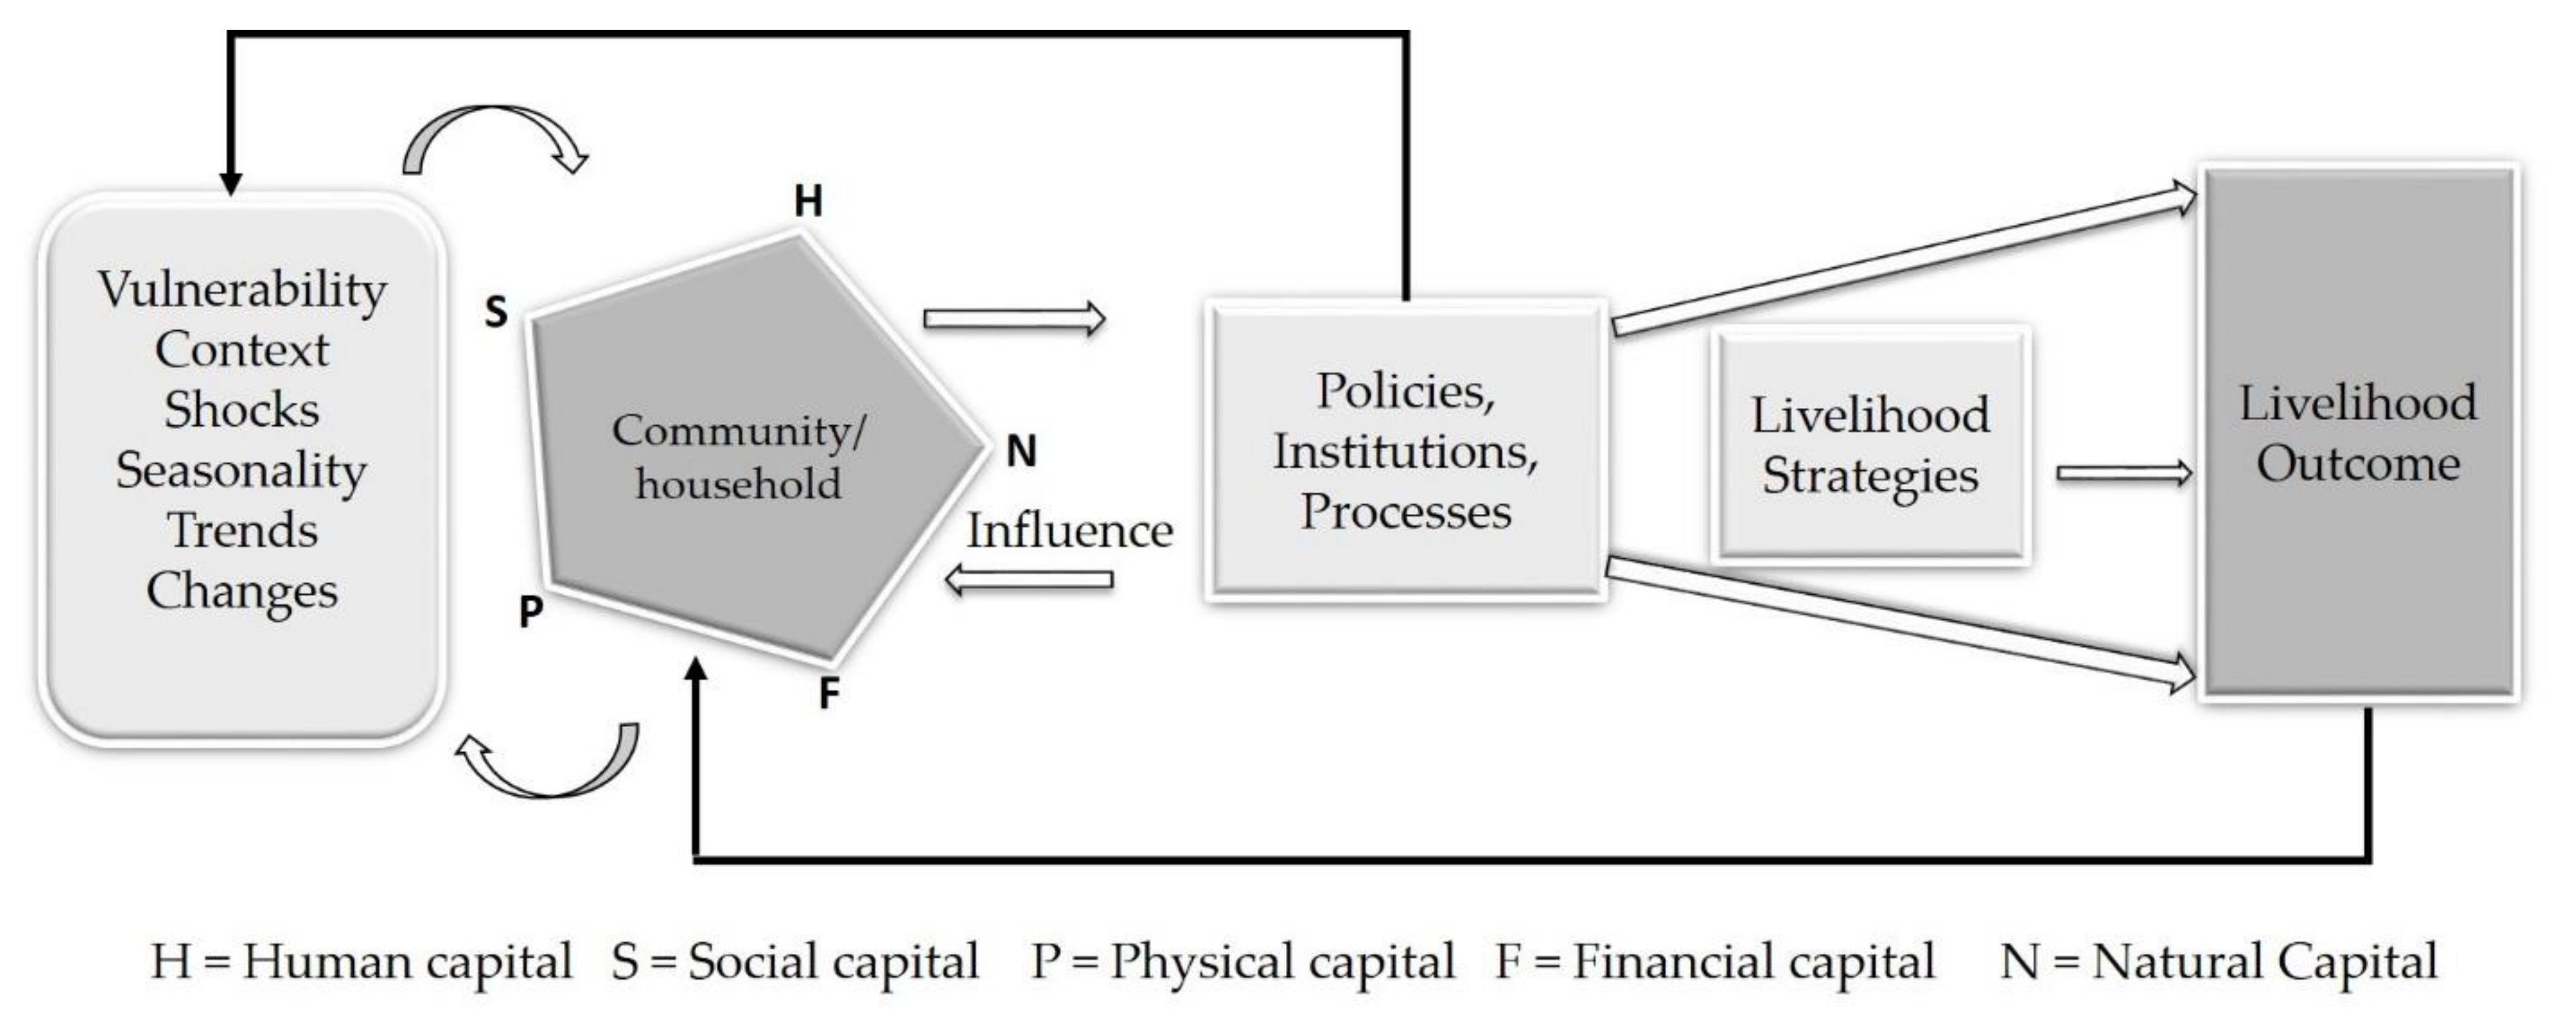
2.3.2. Livelihood Vulnerability Index by IPCC Framework Approach (LVI-IPCC)

The LVI-IPCC is also calculated, with three major components: exposure, adaptive capacity, and sensitivity. This approach diverges from the composite LVI in how the eight major components of LVI are combined (Table 2). There are three steps to complete the LVI-IPCC computation (see Appendix C), including the inverse of subcomponents for adaptive capacity; the grouping of indicators; and the calculation of LVI-IPCC (detailed below).
Step 1: The same subcomponents as with the previously described approach were used. However, to fit with the IPCC’s definition of vulnerability, the inverse of all subcomponents for adaptive capacity was calculated and then averaged in the relevant major components (see Appendix C for example).
Step 2: The IPCC-defined contributing factor of each category for a community c (CFc) was calculated by Equation (4)
C F c = i = 1 n w M C i M C c i i = 1 n w M C i
where wMCi is the weight of each major component and MCci is the index of a major component for a community c, and n is the number of major components in each contributing factor.
Step 3: After calculating the contributing factors, the LVI-IPCC index was derived using a linear function Equation (5)
LVI-IPCC c = CF c , exposure CF c , adaptive   capacity CF c , sensitivity
After calculating contributing factors and LVI-IPCC, these results were represented in vulnerability spider web diagrams for convenient visual comparison of the four groups. Each vertex of a web shows a contributing factor that can highlight differences between groups. The calculated values of the LVI-IPCC index represent the vulnerability level of each community, ranging from −1 to 1, i.e., from least to most vulnerable.

3. Results

3.1. Overview of Sample Groups

As expected, there were similarities and some differences between the ethnic groups as shown in Table 1. For similarities, all groups were highly dependent on their own farming for food, social network indicators were similar and more than 99% of all respondents could access information by television, radio, mobile phone, or internet. All groups were highly dependent on agriculture as the main source of income, with Muong having the lowest level of dependency. Most households reported that they had not had access to any training related to climate change preparedness. The Hmong and Dao groups are, on average, further from the district centre, younger, have larger families, are more dependent on agriculture, and have more people with very low education levels.

3.2. Differences between Groups by LVI Components

Based on the eight major components and the composite LVI, there were differences between groups (see details in Table 3, with scoring differences in components shaded). The Hmong and Dao groups had higher overall LVIs and were more vulnerable on all component scores, with those differences in scores being a function of particular but not necessarily common (between these two groups) sub-components.

3.2.1. Socio-Demographic Profile

The Hmong and Dao groups had higher dependency levels, with Hmong having the highest percentage of household heads who have not attended school, but with the percentage of young female-headed households being the lowest. Overall, the Hmong group was more vulnerable than the other three ethnic groups on the socio-demographic profile component.

3.2.2. Livelihood Strategies

Hmong and Dao groups showed greater vulnerability on the livelihood strategies, which, in this study, included growing crops, raising animals, and collecting natural resources. Hmong and Dao households employed fewer livelihood strategies. Furthermore, Thai and Muong households reported having a higher percentage of family members working outside the community than did Hmong and Dao households. Similarly, Thai, Muong, and Dao ethnic groups have more non-agricultural income sources than the Hmong ethnic group.

3.2.3. Social Networks and Finance

More than half of Hmong and Dao households reported that they approached their local government for assistance in the past 12 months, compared to one-third of Thai and Muong households. Approximately 45–50% of Thai and Muong households had attended agricultural professional training, compared to 20–30% for Hmong and Dao households. These latter two households reported that the ratio of borrowing money and lending at the local bank was higher than that of Thai and Muong households. Hmong and Muong households had a higher ratio of the frequency of borrowing to the lending of money from and to family and friends. That is, people in these two groups tended to borrow more often, relative to lending occurrences. However, the ratio of in-kind assistance from family and friends and providing assistance in the past month was quite similar in three ethnic groups, with Dao people having the lowest rate. Thai, Muong, and Dao ethnic groups reported participating in a social organization more than Hmong ethnic groups. Such organizations included Farmer’s Union, the Women’s Union, the Young’s Union, Farmer Interest Group, and Agricultural Cooperative. However, Hmong and Dao households reported that they mostly did not attend any training related to agriculture production. While there were variations across the sub-components, the net effect was that Hmong and Dao households were more vulnerable than Thai and Muong households on the social networks and finance components.

3.2.4. Health

Hmong and Dao reported travelling, on average, much further to the nearest health facility than did Thai and Muong households, the latter two reported higher rates of chronic illness amongst family members. Hmong and Dao households had higher rates of at least one family member missing work or school due to illness in the past 2 weeks. These two groups also had higher levels of dependent family members. Overall, the Hmong and Dao groups had higher health vulnerability scores.

3.2.5. Food

On average, Dao households had the longest average periods of food shortages. Muong households reported storing more crops for the next season than Thai, Hmong, and Dao households. Therefore, food vulnerability scores for Hmong and Dao ethnic groups were higher for the other groups.

3.2.6. Water

All Hmong and Dao households reported using a natural water source such as water from ravines, springs, or rivers to cook with and consume, which is presumed to increase vulnerability due to risks associated with water supply in the rainy season and water quality. Hmong and Dao households diverted water from ravines to plastic tanks through small water pipes. So while the average time to obtain water is relatively low, in the rainy season, these pipes are often buried by rocks and soil from the top of the hills or the mountains. Consequently, households in these areas can experience a short period of water deficits for daily needs. Meanwhile, nearly 70% of Thai and Muong households reported getting water from a personal well or clean water sources. Thai and Muong households have a greater water storage capacity, and more of the associated households have enough water for daily activities. Overall, the water vulnerability score for Hmong and Dao households was much higher than that for Thai and Muong households.

3.2.7. Housing and Productive Land

The majority of residential houses were built without technical guidance or professional instruction on reinforcement to mitigate the effects of natural disasters [36] but Hmong and Dao peoples have higher vulnerability scores in the housing and productive land component. Hmong especially have a higher average rate of using materials that have a low resistance to storms and hail. These materials include bamboo or unstable wooden planks and fibre cement sheeting. In addition, the physical location of a household is one important indicator considering the distribution of climate extreme events, especially in remote and hilly areas [2]. For example, households located along the river or stream networks are considered to be more vulnerable to flash-flood and bank erosion. Additionally, households situated at foothills’ edges are likely more vulnerable than others when landslides happen. There is a higher rate of Muong households with housing in areas susceptible to flooding, while Dao households are more likely to be in places prone to landslide than other groups. Most households reported their areas of agricultural land were more vulnerable to floods than droughts, except for Thai households, which were more vulnerable to droughts than floods.

3.2.8. Natural Disaster and Climate Variability

There is no difference by ethnicity in regard to opinions on the average frequency and types of natural disasters (floods, drought, landslides, and so on) that occurred in the study area over the past 5 years. As reported, there were around four types of natural hazards and an average of around 20–24 hazard events. In the study sites, all information related to warnings and risks is transmitted through different channels including the announcement by digital means (for example, television, radio, village speakers, or in-person public meetings in the village). More Hmong and Dao people reported that they did not receive any warning about the pending climate extreme events such as frost, heavy rain, thunderstorm, flash flood, or landslides. Therefore, when the above natural disasters happened, more Hmong and Dao people reported that their house/property/agriculture production was damaged than did Thai and Muong people. The variables for the period of 1961–2017 used to develop the climate change rating, included mean standard deviation (MSD) of monthly average maximum daily temperature and minimum daily temperature, MSD of monthly average rainfall, average numbers of hot days, cold days, and heavy rain days. Overall, regarding natural disasters and climate variability, the Hmong and Dao were more vulnerable than Thai and Muong households.

3.3. Comparing LVI Outcomes

As a result of the above components, Hmong and Dao ethnic groups had a higher overall LVI score than did Thai and Muong ethnic groups. The results of the major component calculations are shown in a spider web diagram (Figure 3). This diagram is based on 0.1 unit increments, from 0 (less vulnerable) at the centre of the web to 0.7 (most vulnerable) at the web edge. The diagram illustrates that overall, Hmong and Dao ethnic groups are more vulnerable than Thai and Muong to livelihood strategies, social networks and finance, health, food, water, housing, and productive land.

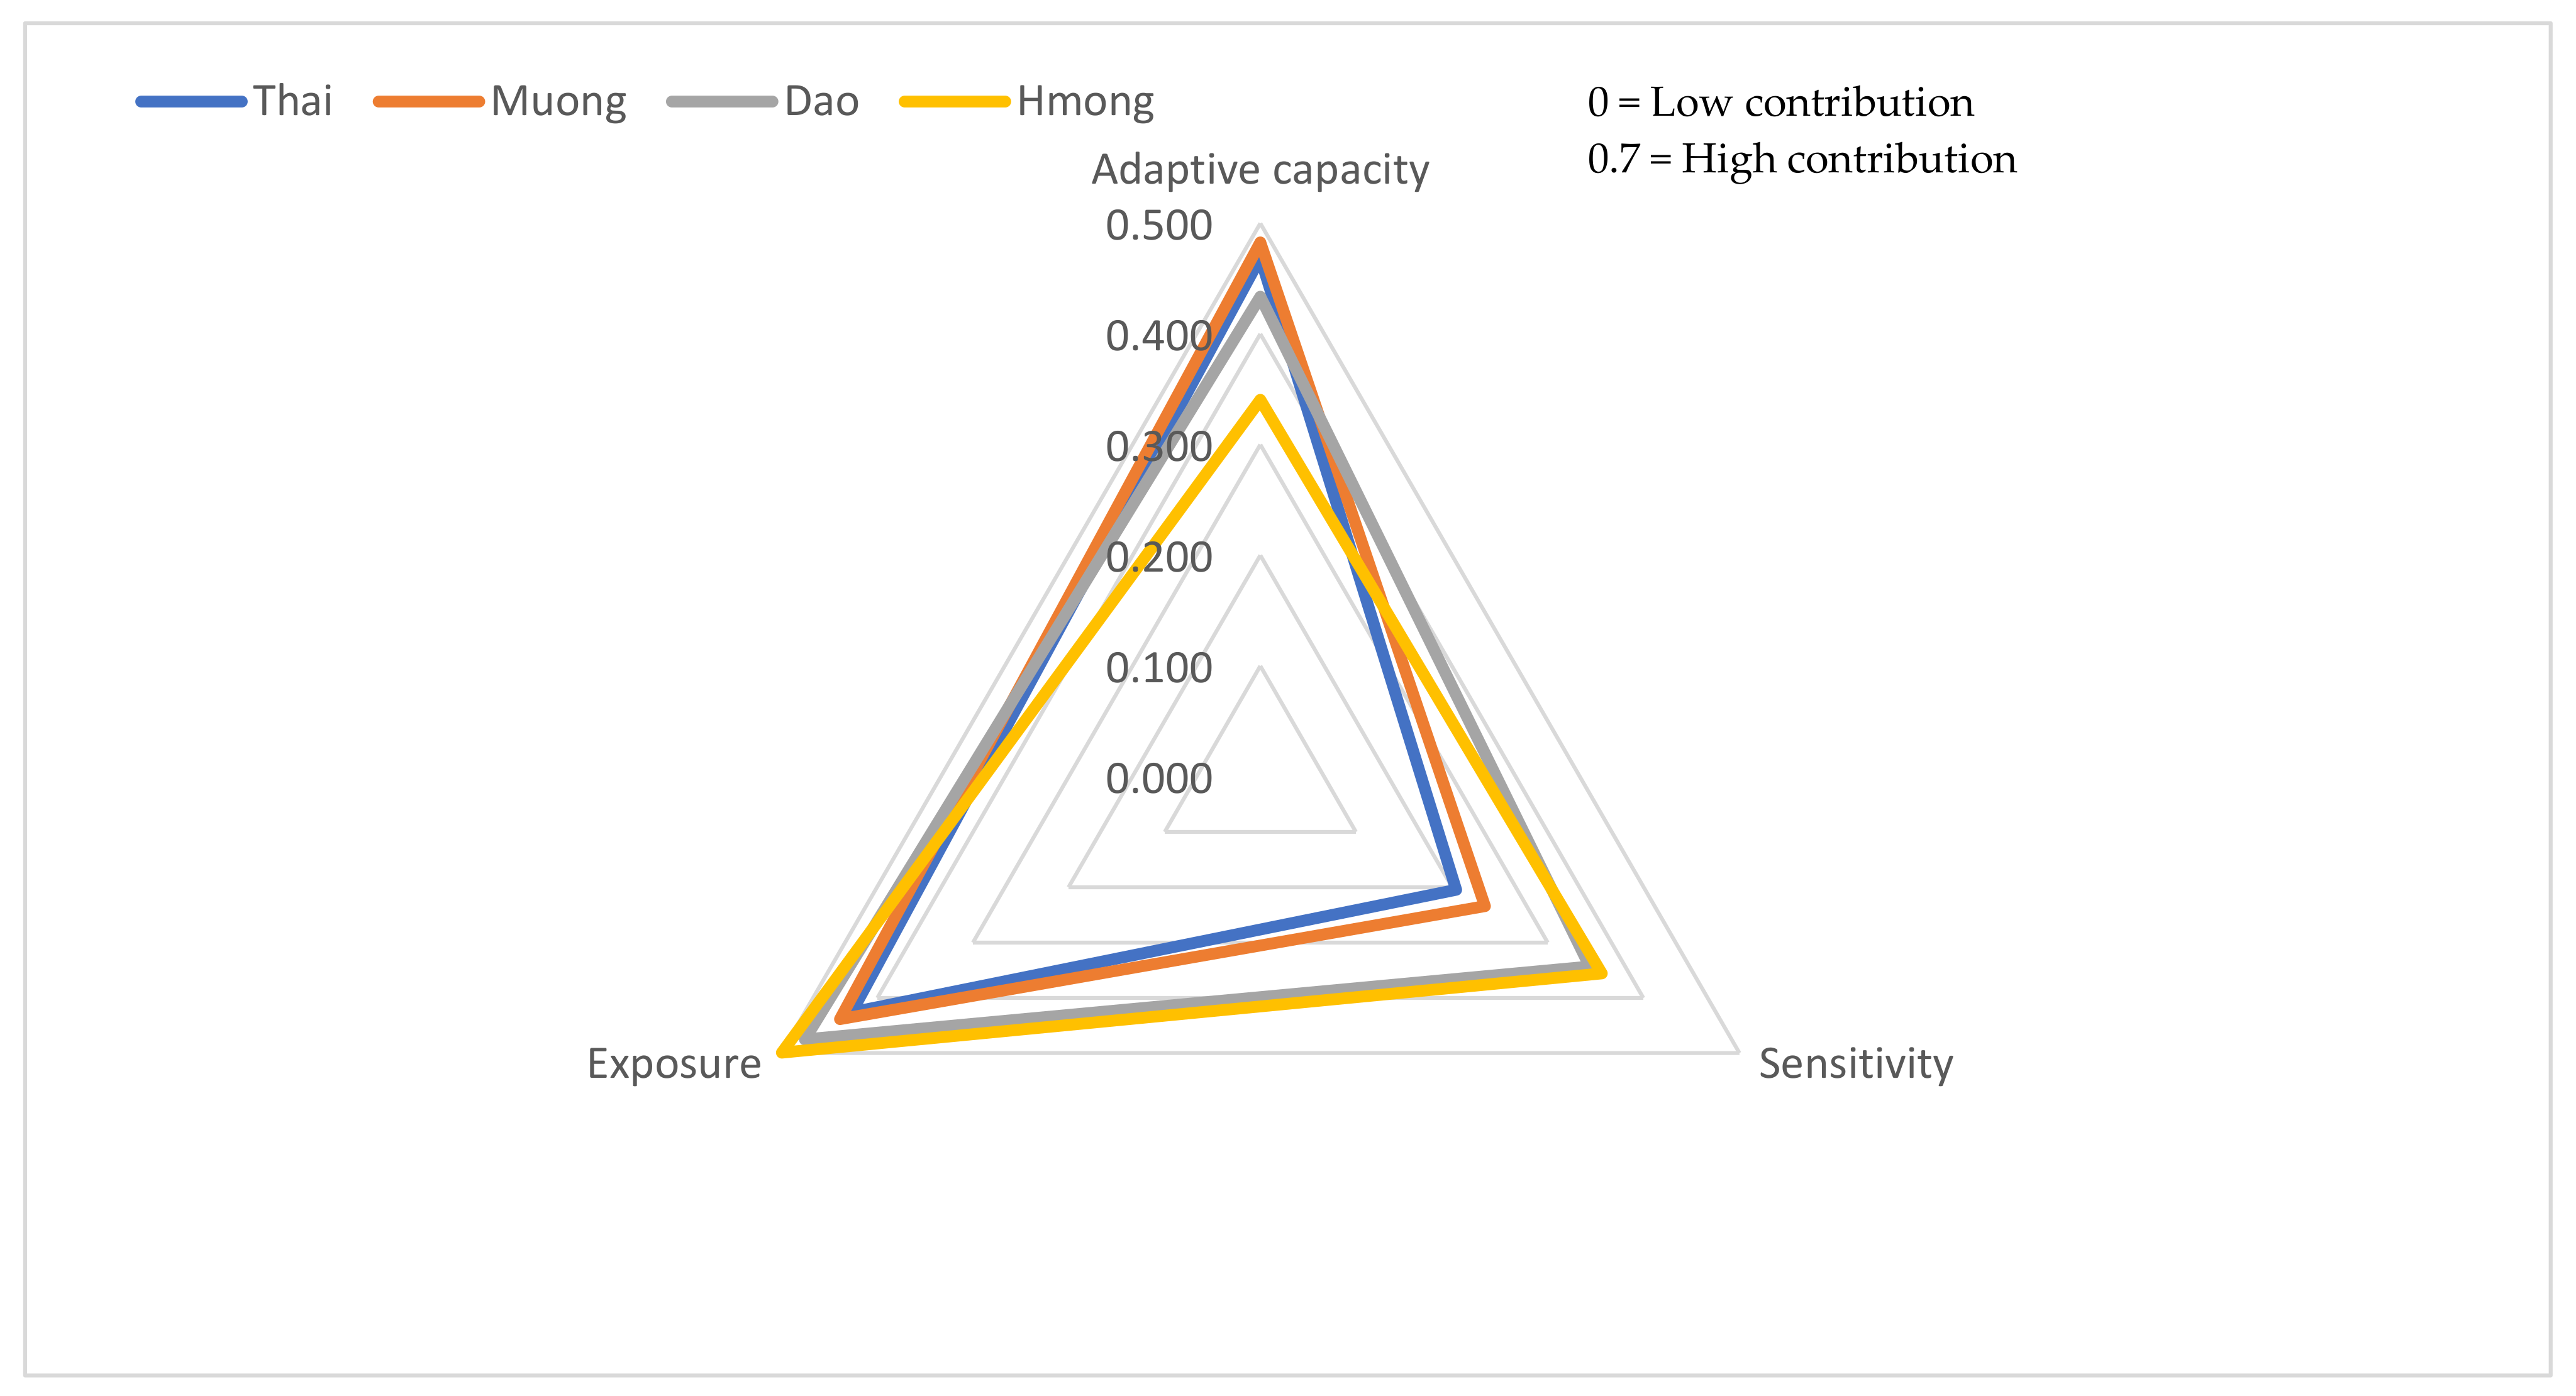
3.4. Comparing the Groups with the LVI-IPCC Index

The LVI-IPCC estimation indicated similar rankings among the four minority ethnic groups with the IPCC vulnerability value being highest for Hmong, followed by Dao, Thai, and then Muong (Table 4). Vulnerability triangles (Figure 4) present the values of contributing factors to the overall results of the groups, including exposure, adaptive capacity, and sensitivity. In terms of exposure, Hmong and Dao groups are more vulnerable than Thai and Muong groups. Hmong and Dao ethnic groups are more sensitive to climate variability than the other two groups, driven by differences in the health, food, water, housing and productive land components, as above. Thai and Muong had a higher adaptive capacity than Hmong and Dao groups, concerning demographics, livelihoods, and social networks and finance components. The overall LVI-IPCC index suggests Hmong may be particularly vulnerable.

4. Discussion

This study takes a case study approach to explore the importance of accounting for intersectionality in programs aimed at addressing vulnerability to climate risk in disadvantaged agriculturally dependent smallholder communities in the poor upland region of Vietnam. In total, we interviewed 240 households from four ethnic minority groups in the Son La Province. By using the LVI and LVI-IPCC approach, which has been successfully applied in different contexts [4,15,20,37,38], the results confirm that there are differences in vulnerability between four ethnic minority groups within the Phu Yen district, Son La province, in the NMR Vietnam, even though there is considerable disadvantage across the region and all groups. Generally, ethnic people living in the mountainous region have lower levels of education and income and poorer housing quality. This region has fragmented topography, highly remote areas, and roads in poor conditions, making transportation difficult to nearby cities or the centre of the district for shopping and to access health care services when needed, especially in the rainy season [39]. Additionally, ethnic households in this area are poor and mainly rely on their self-farmed production for daily meals. Variation in the level of vulnerability in the four studied ethnic minority groups living at different elevations indicated that livelihood vulnerability in the district is not the same and varies according to spatial distribution. This result is consistent with the work of [30] who found that livelihood vulnerability was not homogenous within the communities they studied.
In terms of adaptive capacity, differences in the index are largely driven by differences in diversity of sources of income, debt, agricultural training, and organization membership. All groups are highly dependent on agriculture, but the Hmong and Dao have a lower rate of off-farm income. That means they are most vulnerable to seasons and events that adversely affect production. Hmong and Dao peoples also rely more heavily on borrowed money, which implies a higher degree of financial hardship of the households, which potentially reduces the adaptive capacity of households in the face of adverse climatic conditions and events [40]. In order to improve households’ capacity and reduce the vulnerable level in climate-changing conditions, local governments could facilitate diversification through the development of off-farm employment opportunities, value-added industries such as handicrafts, job migration schemes and small business training [41], with some of those strategies supported by concessional loans programs [40,42]. Social network ratings were found to be potentially important factors in the vulnerability of households, especially in rural and poor areas [43]. Important social organizations that provided livelihood support included the Farmer’s Union, the Women’s Union, the Youth Union, the Farmer Interest Group, and Agricultural Cooperative. These can provide useful information on agricultural practices/activities such as new varieties, pest and disease status, price changes, crop calendar alteration, and managing climate extreme events. These groups could also strengthen social capital.
There may also be disparities in information flows. From our survey, Thai and Muong households reported they received more advice/training on farming activities from local authorities than did Hmong and Dao households. Possible factors in this difference are relative education levels, dependency rates with consequent constraining effects on households, rate of organization membership (lower for Hmong and Dao households), and remoteness. Remoteness may also contribute to fewer training opportunities (supply-side) and difficulty in getting to those opportunities. Therefore, local government could make a priority for education/awareness programs for remote and vulnerable ethnic groups, focusing more on Hmong and Dao groups to enhance their adaptive capacity. Furthermore, improved information regarding climate impacts and mitigation strategies provided by local government/governmental organizations could increase adaptive capacity.
In terms of sensitivity, access to health services and water sources are other areas of difference and apparent disadvantage. Access to health services has previously been proposed as affecting the health status of households [12,15,22]. From the present study, Hmong and Dao peoples travelled three times longer than Thai and Muong peoples did to health services. Remote roads are often in poor condition and the lack of compounds the problem for Hmong and Dao communities [39]. In addition to road improvement, as above, the government could also reduce health vulnerability through educational programs, make greater use of visiting health professionals, and further develop water quality strategies.
Water availability is more likely to be threatened under climate variability [44]. The reliance of ethnic households on natural water sources for drinking and agricultural purposes indicates high sensitivity to climate variability and change, especially during drought or in the dry season [45]. Based on the survey data, Hmong, Dao, and Muong households could be more vulnerable to water-borne diseases, such as cholera, diarrhoea, and measles-related to low water quality, whereas Thai peoples seem to have safer water sources due to the installation of boreholes. The vulnerability of households to water availability has been observed to be affected by conflict over scarce resources [46,47], with climate change potentially exacerbating these conflicts. However, in the present work, although some Muong households reported water conflicts, especially regarding using water for agricultural production, these conflicts were generally solved peacefully.
Regarding exposure, reference [2] found that the location of households is a key factor influencing how they prepared for natural hazards events. In this regard, Hmong and Dao groups are significantly affected by climate change compared to Muong and Thai peoples. The reason for this might be that Hmong and Dao people are not necessarily within the audible range of loudspeakers for announcements, are somewhat disconnected from general media, or are too far from the sites of public meetings that provide warnings and preparedness information. Government responses could therefore include improving communication technologies and reach, as well as outreach on preparedness training. Some households are also more vulnerable due to the flimsiness of housing materials, so housing reinforcement programs could enhance living conditions and resilience, which in turn, might also help alleviate poverty [4].
Our findings and recommendations are expected to support the Vietnamese national climate change adaptation plan for 2021–2030 with a long-term vision by the year 2050 (Decision No.1055/QD-TTg, dated 20 July 2020). We suggest targeted interventions (e.g., infrastructure development for market access, education and training programs for vulnerable ethnic groups) for enhancing resilience and adaptive capacity of communities, economic sectors, and ecosystems most vulnerable to climate change and variability.

5. Conclusions

Climate variability and climate events have been increasing in frequency and intensity in the NMR of Vietnam, which affects both livelihoods and production activities of various ethnic minority groups, and those who have lower levels of education and income and poor housing systems are likely to be especially affected. This study is the first assessment of the vulnerability of Thai, Muong, Dao, and Hmong ethnic groups in this region, using the livelihood vulnerability index framework (composite LVI and LVI-IPCC). The overall indices revealed differences based on ethnicity/location, with Hmong and Dao being the most vulnerable groups. This shows the potential of the two methods to identify what might be critical factors in more or less vulnerability and adaptive capacity. We conclude that an analysis of the sub-components of LVI are critical to formulating highly targeted responses, especially where program resources are very limited.
Our findings identified education levels, diversity of income sources, agricultural training, and organizational membership as the most important factors influencing the households’ adaptive capacity. The diversity of income among all groups is relatively low, with high dependence on agriculture, so there is a high exposure to climatic effects. We observed that while all four ethnic groups had relatively low education levels and high dependence ratios, Hmong and Dao were especially vulnerable on these sub-components. These then are likely constraints on people’s ability to receive and understand information and policies from the local government. Becoming a member of a social or professional organization or network provides more opportunities to get information on agricultural practices/activities/natural hazards and also to strengthen the connections among communities. Access to health services and water resources could also be important, with deficits in these areas further increasing vulnerability to climate variability, change, and events. Housing location and construction also contribute to household vulnerability, especially concerning extreme weather events.
In order to reduce the vulnerable level of ethnic groups to climate change, the study provides the following recommendations which may be of interest to researchers working in other remote rural areas in other regions:
  • In national and local adaptation planning, priority should be given to support the poorer communities (in our studies case, the Hmong and Dao ethnic communities) that are more vulnerable and have a low capacity to cope with climate change.
  • It is essential to enhance literacy, especially amongst disadvantaged groups (Hmong and Dao ethnic groups in the current work). This solution is important because this would increase the effectiveness of training and education programs, especially with understanding threats to livelihood, including climate change, and better enable the transfer of technology.
  • Governments could strengthen extension, through targeted programs and appropriately designed visual aids and materials. These will help in the adaptation of farm systems and disaster preparedness.
  • Local governments could facilitate income diversification strategies, supported by training and concessional loans.
  • The government could upgrade road infrastructure to link remote communities to larger towns and centres and water systems and treatment.
Finally, we reiterate that the subjective selection and weighting sub-components for major components in the LVI models, and its influence on the vulnerability of households or communes, can be a limitation of LVI methods [4,12,45]. This research suggests that effective identification of the sub-components could improve the precision of assessment of the vulnerability of livelihoods to climate change at the local or regional level. To achieve that goal, researchers need to have a deep understanding of local situations including the natural resources, livelihoods assets, social-economic aspects, and climate conditions. The results of LVI-IPCC models in this research recommend that researchers should use caution in case the scores of LVI are negative or counterintuitive (the adaptive capacity results are greater than the exposure results). Increasing sensitivity might reduce the overall level of vulnerability. Therefore, in this case, in applying the LVI-IPCC model, caution should be taken in suggesting the adaptation options to climate change.

Author Contributions

Conceptualization, V.T.T., G.C., S.M., and D.-A.A.-V.; formal analysis, V.T.T., D.-A.A.-V., and G.C.; methodology, V.T.T., G.C., S.M., and D.-A.A.-V.; writing—original draft preparation, V.T.T.; writing—review and editing, G.C., S.M., V.T.T., and D.-A.A.-V. All authors have read and agreed to the published version of the manuscript.

Funding

This research was funded by an USQ-VIED PhD Scholarship from the Vietnamese Government and the University of Southern Queensland (USQ). The APC and data collection expenditures were funded by the German Federal Ministry for the Environment, Nature Conservation, Building and Nuclear Safety (BMUB). All statements are the views of the authors and not the opinions of the funders or the Vietnamese Government.

Institutional Review Board Statement

The study was conducted according to the guidelines of the Declaration of Helsinki, and approved by Human Research Ethics Committee of the University of Southern Queensland (H18REA267, dated on 20 November 2018).

Informed Consent Statement

Informed consent was obtained from all subjects involved in the study.

Data Availability Statement

Data available on request due to restrictions.

Acknowledgments

The authors gratefully appreciate the contribution of all interviewed participants, and especially thank to the assistance of the local officers and colleagues in the Faculty of Environment Science, Vietnam National University of Agriculture for conducting the household survey. We also gratefully acknowledge the funding received from the German Federal Ministry for the Environment, Nature Conservation, Building and Nuclear Safety (BMUB).

Conflicts of Interest

The authors declare no conflict of interest.

Appendix A

Table A1. Major components and subcomponents of the composite LVI and information sources.
Major ComponentsSubcomponentsExplanation of Sub-ComponentData SourceExplanatory Notes
Socio-demographic profileFemale household headPercentage of households where the primary adult is female. Women are usually more vulnerable than men.Survey Adapted from [15,22]
Dependency ratioPercentage of household members who are outside employment age (under 15 and over 60 years old) as specified in Vietnam Labour Laws).Survey Modified from [12]. Modified the dependent age range to suit to the context of the study area
Household heads did not attend school Percentage of households where the head of the household reports that they have attended 0 years of school.Survey Adapted from [15,22]
Livelihood strategiesHouseholds without family members working in a different communityPercentage of households that report no family member working outside of the community for their primary work activity.Survey Adapted from [12,22]
Households income depends on agriculture/ forestry (cultivation, livestock, fishing, aquaculture, forest products collection)Percentage of households that report only agriculture as a source of income.Survey Adapted from [12,33]
Households without non-agricultural livelihood income contribution Percentage of households that report no family member working in non-agricultural sector.Survey Adapted from [15]
Average agricultural livelihood diversity indexThe inverse of (the number of agricultural livelihood activities +1) reported by a household, e.g., a household that farms, raise animals, and collects natural resources will have a Livelihood Diversification Index = 1/(4 + 1) = 0.2.Survey Adapted from [12,33]
Social networks and financeHouseholds without media access in the housePercentage of households that report that they do not have any access to media information.Survey Adapted from [4]
Need for assistance from the government in the last 12 months Percentage of households that report that they have asked their local government for any assistance in the past 12 months.Survey Adapted from [12,22]
Average receive/give ratioRatio of the number of types of help received by a household in the past month + 1) to (the number of types of help given by a household to someone else in the past month + 1).Survey Adapted from [12,22]
Average distance to the district’s centre (e.g., km or minutes) Survey Adapted from [15,48]
Average borrow/lend money ratio (0.5–2)Ratio of households borrowing money in the past month to a household lending money in the past month, e.g., If a household borrowed money but did not lend money, the ratio = 2:1 or 2 and if they lent money but did not borrow any, the ratio = 1:2 or 0.5.Survey Adapted from [12]
Ratio of saving: saving at present (saving money in a bank + 1)/(borrowing money from a bank + 1)Percentage of households that report that they do have not bank savings accounts.Survey New, added to reflect the context of study area: farmers often borrow money from a bank for agricultural production
Household without family members being a member of a cooperative society (such as women union, farmer union)Percentage of head of households that report that any family member is a member of a cooperative society.Survey Adapted from [48]
Households did not receive any climate change training Percentage of the heads of household that report that they have not participated in climate change training.Survey Adapted from [34,49,50]
Households did not receive training in their main profession/sPercentage of the head of households that report that they have not participated in professional trainingSurveyAdapted from [34,50]
HealthHouseholds with a family member having a chronic illnessPercentage of households that report at least 1 family member with chronic illness. Chronic illness was defined subjectively by the respondent. SurveyAdapted from [12]
Households with a family member missing work or school in the last 2 weeks due to illnessPercentage of households that report that at least 1 family member had to miss school or work due to illness in the last 2 weeks.Survey Adapted from [12]
Average distance to health center (or hospital)Average distance to the nearest health center (or hospital)Survey Adapted from [22,51]
Households with members needing dependent carePercentage of households that have at least one person needs to care for daily.Survey Adapted from [12,22]
FoodHouseholds primary dependent on self-farmed foodPercentage of households that get their food primarily from their personal farms.Survey Adapted from [15,33]
Average number of months households struggle to find food for the family (range: 0–12)Average number of months households that
struggle to obtain food for their family.
Survey Adapted from [12,33]
Average Crop Diversity Index The inverse of (the number of crops grown by a household + 1). A household that grows pumpkin, maize, and cassava will have a Crop Diversity Index = 1/ (3 + 1) = 0.25.Survey Adapted from [12,33]
Households that do not reserve crops Percentage of households that do not save crops from each harvest.Survey Adapted from [12,30]
WaterHouseholds use mainly natural water systems for domestic usePercentage of households that report a creek, river, lake, pool, or hole as their primary water sourceSurvey Adapted from [12]
Average time to main water supply resourceAverage time it takes the households to travel to their primary water source.Survey Adapted from [12]
Not enough water for domestic use for the whole yearPercentage of households report that they do not have sufficient water to use for year-round activitiesSurvey Adapted from [12]
Inverse of the average days of stored water per household The inverse of (the number of days water stored + 1)Survey Adapted from [12]
Housing and Productive LandHouseholds with weak thunderstorm/ hail resistant constructionPercentage of households report that their house is susceptible to extreme weather events such as thunderstorm, hail, etc.Survey Adapted from [15]
Households on the low ground which is easily inundated by floodsPercentage of households that report that their house is easily inundated by flood.Survey Adapted from [15]
Households located at the places being prone to a landslide Percentage of households with a house located in landslide-prone area.Survey New, added to emphasize the context of mountainous area which is more vulnerable to land slides
Average time to get to the agricultural landAverage time it takes the household to travel to their agricultural land.Survey New, added to address the sensitivity of production land location to climate in mountainous area. Agricultural land located farther from the household is more difficult to take care of the farm, especially in the case of extreme weather events
Average areas of agricultural land being vulnerable to floodsTotal area of household’s agricultural land which is vulnerable to floods.Survey
Average areas of agricultural land being vulnerable to droughtsTotal area of household’s agricultural land which is vulnerable to droughts.Survey
Natural disasters and Climate VariabilityAverage number of natural disaster in the past 5 yearsTotal number of extreme weather events that were reported by households in the past 5 years.SurveyAdapted from [12,49]
Average types of natural disasters happened in the past 5 years Modified from [12,48].
Household with losses physical assets and agricultural production in the past 5 yearsPercentage of households report that they had property loss and production because of extreme weather events in the past 5 years.SurveyModified from [15]. Agricultural production losses would directly impact on livelihood so it was added beside physical assets
Households with injury or death from natural disasters in the past 5 yearsPercentage of households that report either an injury to or death of one of their family members as a result of the most severe flood, drought, or cyclone in the past 5 years.Survey Adapted from [1]
Households did not receive a warning about the pending natural disastersPercentage of households that did not
receive a warning about the most severe flood, drought, and cyclone events in the past 5 years.
Survey Adapted from [12]
Mean standard deviation of monthly average minimum daily temperature (1961–2017)Standard deviation of the average daily minimum temperature by month between 1961 and 2017 was averaged.Data obtained from the Phu Yen meteorological station and HMDCAdapted from [12]
Mean standard deviation of monthly average maximum daily temperature (1961–2017)Standard deviation of the average daily maximum temperature by month between 1961 and 2017 was averaged.Adapted from [12]
Mean standard deviation of monthly average rainfall (1961–2017)Standard deviation of the average monthly precipitation between 1961 and 2017 was averaged.Adapted from [12]
Average numbers of hot days (1961–2017) (t ≥ 35 °C)Number of hot days per year (t ≥ 35 °C) between 1961 and 2017 was averaged.New, supported by decision 03/2020/QĐ-TTG that prescribes forecasting, warning and communication of natural disaster promulgated by the Prime Minister of Vietnam
Average numbers of cold days (1961–2017) (t ≤ 13 °C)Number of cold days per year (t ≤ 13 °C) between 1961 and 2017 was averaged.
Average number of days with heavy rain (1961–2017) (≥50mm/day)Number of days with heavy rain per year (≥50mm/day) between 1961 and 2017 was averaged.

Appendix B

Table A2. Calculating the livelihood strategies major component for the LVI for Thai ethnic group.
Subcomponent for Livelihood Strategies Major ComponentSubcomponent Values Max Subcomponent Value Min Subcomponent Value Index Value Livelihood Strategies Major Component Value
Percentage of household mainly income dependent on agriculture (LV1)92.4710000.9250.423
Percentage of households without family members working outside the community (LV2)38.7110000.387
Percentage of households without non-agricultural livelihood income contribution (LV3)21.5010000.215
Average agricultural livelihood diversity index (LV4)0.3310.20.165
Step 1: Calculating the index value of subcomponents (repeat for all subcomponents)
I n d e x L V 1 T h a i = 92.47 100 100 0 = 0.93
Step 2: Calculating the value of livelihood strategies major component (repeat for all major components
L i v e l i h o o d T h a i = i = 1 n I n d e x S C c i n = L V 1 T h a i + L V 2 T h a i + L V 3 T h a i + L V 4 T h a i 4 = 0.925 + 0.387 + 0.215 + 0.165 4 = 0.423
Step 3: Calculating LVI for Thai ethnic group
L V I c = i = 1 8 w M C i M C c i i = 1 8 w M C i = 3 0.379 + 4 0.423 + 10 0.363 + 4 0.142 + 4 0.300 + 4 0.298 + 6 0.121 + 10 0.426 ( 3 + 4 + 10 + 4 + 4 + 4 + 6 + 10 ) = 0.320

Appendix C

Table A3. Calculating the contributing factors and LVI-IPCC for Thai ethnic group.
Contributing FactorsMajor Components Major Components Value Number of Subcomponents for Major ComponentsValues of Contributing FactorsLVI-IPCC Value
ExposureNatural disaster and climate variability0.426100.426−0.009
Adaptive CapacitySocio-demographic profile0.62130.469
Livelihood strategies0.4944
Social network and finance0.41310
SensitivityHealth0.14240.204
Food0.3004
Water0.2984
Housing and productive land0.1216
Step 1: Calculate the index value for subcomponent and major component as presented in Appendix A. However, we need to take the inverse of all subcomponents for the contributing factor adaptive capacity (Socio-demographic profile; Livelihood strategies; Social Network and finance) before doing the calculation following Appendix A. An example for taking the inverse of subcomponents for Livelihood strategies major component is given below.
Table A4. The inverse of subcomponents for Livelihood strategies major component.
Subcomponent for Livelihood Strategies Major Component (LVI Calculation)Subcomponent Values for Thai Ethnic GroupSubcomponent for Livelihood Strategies Major Component (LVI-IPCC Calculation)Subcomponent Values for Thai Ethnic Group
Percentage of household mainly income dependent on agriculture (LV1)92.47Percentage of household with income no dependent on agriculture (LV1)7.53
Percentage of households without family members working outside the community (LV2)38.71Percentage of households with family members working outside the community (LV2)61.29
Percentage of households without non-agricultural livelihood income contribution (LV3)21.50Percentage of households with non-agricultural livelihood income contribution (LV3)78.50
Average agricultural livelihood diversity index (LV4)0.330Average agricultural livelihood diversity index (LV4)0.504
Step 2: Calculate the adaptive capacity value for Thai ethnic group, repeat for contributing factors: Sensitivity and Exposure
C F T h a i , a d p t i v e c a p a c i t y = i = 1 n w M C i M C c i i = 1 n w M C i = 3 0.621 + 4 0.494 + 10 0.413 17 = 0.469
Step 3: Calculate LVI_IPCC value (repeat for all of 3 ethnic groups)
LVI-IPCC T h a i = CF c , exposure CF c , adaptive   capacity CF c , sensitivity = ( 0.426 0.469 ) 0.204 = 0.009

References

  1. Dasgupta, S.; Laplante, B.; Meisner, C.; Wheeler, D.; Yan, J. The impact of sea level rise on developing countries: A comparative analysis. Clim. Chang. 2009, 93, 379–388. [Google Scholar] [CrossRef]
  2. Few, R.; Tran, P.G. Climatic hazards, health risk and response in Vietnam: Case studies on social dimensions of vulnerability. Glob. Environ. Chang. 2010, 20, 529–538. [Google Scholar] [CrossRef]
  3. Eckstein, D.; Künzel, V.; Schäfer, L. Global Climate Risk Index 2018; Germanwatch: Bonn, Germany, 2017. Available online: https://germanwatch.org/en/download/20432.pdf (accessed on 20 December 2018).
  4. Panthi, J.; Aryal, S.; Dahal, P.; Bhandari, P.; Krakauer, N.Y.; Pandey, V.P. Livelihood vulnerability approach to assessing climate change impacts on mixed agro-livestock smallholders around the Gandaki River Basin in Nepal. Reg. Environ. Chang. 2016, 16, 1121–1132. [Google Scholar] [CrossRef]
  5. Chaudhry, P.; Ruysschaert, G. Climate change and human development in Vietnam. Hum. Dev. Rep. 2007, 2008, 2. [Google Scholar]
  6. Lee, S.; Dan, N.T. Probabilistic landslide susceptibility mapping in the Lai Chau province of Vietnam: Focus on the relationship between tectonic fractures and landslides. Environ. Geol. 2005, 48, 778–787. [Google Scholar] [CrossRef]
  7. UNDP. Viet Nam Special Report on Managing the Risks of Extreme Events and Disasters to Advance Climate Change Adaptation; UNDP: Hanoi, Vietnam, 2015. Available online: http://www.vn.undp.org/content/vietnam/en/home/library/environment_climate/viet_nam_special_report_on_managing_the_risks_of_extreme_events_and_disasters.html (accessed on 25 June 2018).
  8. ISPONRE. Vietnam Assessment Report on Climate Change; Institute of Strategy and Policy on Natural Resources and Environment (ISPONRE): Hanoi, Vietnam, 2009. [Google Scholar]
  9. Cutter, S.L.; Mitchell, J.T.; Scott, M.S. Revealing the vulnerability of people and places: A case study of Georgetown County, South Carolina. Ann. Assoc. Am. Geogr. 2000, 90, 713–737. [Google Scholar] [CrossRef]
  10. Prowse, M.; Scott, L. Assets and adaptation: An emerging debate. IDS Bull. 2008, 39, 42–52. [Google Scholar] [CrossRef] [Green Version]
  11. Dulal, H.B.; Brodnig, G.; Thakur, H.K.; Green-Onoriose, C. Do the poor have what they need to adapt to climate change? A case study of Nepal. Local Environ. 2010, 15, 621–635. [Google Scholar] [CrossRef]
  12. Hahn, M.B.; Riederer, A.M.; Foster, S.O. The Livelihood Vulnerability Index: A pragmatic approach to assessing risks from climate variability and change—A case study in Mozambique. Glob. Environ. Chang. 2009, 19, 74–88. [Google Scholar] [CrossRef]
  13. Pandey, R.; Bardsley, D.K. Social-ecological vulnerability to climate change in the Nepali Himalaya. Appl. Geogr. 2015, 64, 74–86. [Google Scholar] [CrossRef] [Green Version]
  14. Salik, K.M.; Jahangir, S.; ul ZafarZahdi, W.; ul Hasson, S. Climate change vulnerability and adaptation options for the coastal communities of Pakistan. Ocean Coast. Manag. 2015, 112, 61–73. [Google Scholar] [CrossRef]
  15. Shah, K.U.; Dulal, H.B.; Johnson, C.; Baptiste, A. Understanding livelihood vulnerability to climate change: Applying the livelihood vulnerability index in Trinidad and Tobago. Geoforum 2013, 47, 125–137. [Google Scholar] [CrossRef]
  16. Brooks, N.; Adger, W.N.; Kelly, P.M. The determinants of vulnerability and adaptive capacity at the national level and the implications for adaptation. Glob. Environ. Chang. 2005, 15, 151–163. [Google Scholar] [CrossRef]
  17. Vincent, K. Uncertainty in adaptive capacity and the importance of scale. Glob. Environ. Chang. 2007, 17, 12–24. [Google Scholar] [CrossRef]
  18. Eakin, H.; Bojórquez-Tapia, L.A. Insights into the composition of household vulnerability from multi-criteria decision analysis. Glob. Environ. Chang. 2008, 18, 112–127. [Google Scholar] [CrossRef]
  19. Chambers, R.; Conway, G. Sustainable Rural Livelihoods: Practical Concepts for the 21st Century; Institute of Development Studies: London, UK, 1992. [Google Scholar]
  20. Nguyen, D.C.; Vo, H.T.; Chu, T.H. Application of Livelihood Vulnerability Index to Assess Risks from Flood Vulnerability and Climate Variability—A Case Study in the Mekong Delta of Vietnam. J. Environ. Sci. Eng. A 2013, 2, 476. [Google Scholar]
  21. Legese, S.A.; Olutayo, O.A.; Sulaiman, H.; Rao, P. Assessing Climate Change Impacts in the Lake Tana Sub-Basin, Ethiopia Using Livelihood Vulnerability Approach. J. Earth Sci. Clim. Chang. 2016, 7, 368. [Google Scholar]
  22. Adu, D.T.; Kuwornu, J.K.M.; Anim-Somuah, H.; Sasaki, N. Application of livelihood vulnerability index in assessing smallholder maize farming households’ vulnerability to climate change in Brong-Ahafo region of Ghana. Kasetsart J. Soc. Sci. 2018, 39, 22–32. [Google Scholar] [CrossRef]
  23. Huong, N.T.L.; Yao, S.; Fahad, S. Assessing household livelihood vulnerability to climate change: The case of Northwest Vietnam. Hum. Ecol. Risk Assess. Int. J. 2018, 1–19. [Google Scholar] [CrossRef]
  24. Morse, S.; McNamara, N. Sustainable Livelihoods Approach: A Critique of Theory and Practice; Springer Science & Business Media: Amsterdam, The Netherlands, 2013. [Google Scholar]
  25. GSO. Results of Vietnam Household Living Standard Survey 2014; General Statistical Office: Hanoi, Vietnam, 2015. [Google Scholar]
  26. Tuyen, T.Q. Income sources and inequality among ethnic minorities in the Northwest region, Vietnam. Environ. Dev. Sustain. 2016, 18, 1239–1254. [Google Scholar] [CrossRef]
  27. World Bank. The Social Dimensions of Adaptation to Climate Change in Vietnam. Discussion Paper Number 12 December 2010; Economics of Adaptation to Climate Change: Washington, DC, USA, 2010. [Google Scholar]
  28. Ha, T.T. The Impacts of the Doi Moi Process on Communities and Forest Land Management in Three Northeastern Provinces in the Northern Mountainous Region of Vietnam; The Australian National University: Canberra, Australia, 2007. [Google Scholar]
  29. IMHEN (Vietnam Institution of Meteorology, Hydrology and Climate Change); UNDP. Vietnam Special Report on Managing Risks of Extreme Events and Disasters to Advance Climate Change Adaptation; Vietnam Publishing House of Natural Resources, Environment and Cartography: Hanoi, Vietnam, 2015. [Google Scholar]
  30. Baffoe, G.; Matsuda, H. An Empirical Assessment of Households Livelihood Vulnerability: The Case of Rural Ghana. Soc. Indic. Res. 2018, 140, 1225–1257. [Google Scholar] [CrossRef]
  31. Le Ngoc, L.; Martínez-Valle, A.; Parker, L.; Bourgoin, C.; Nguyen Thi, T.; Guerten, N.; Grosjeans, G.; Pham Anh, H.; Vu Cong, L.; Vuong Thuc, T.; et al. Pragmatic Economic Valuation of Adaptation Risk and Responses Across scales. Case Study in Vietnam; Working Paper No. 185; CGIAR Research Program on Climate Change, Agriculture and Food Security (CCAFS): Copenhagen, Denmark, 2016; Available online: www.ccafs.cgiar.org (accessed on 23 May 2019).
  32. Phu Yen Office of Statistics. Socio-Economic Report of Phu Yen District; 2018; Unpublished Report (in the File of Tran Thanh Van). [Google Scholar]
  33. Masud, M.M.; Rahman, M.S.; Al-Amin, A.Q.; Kari, F.; Leal Filho, W. Impact of climate change: An empirical investigation of Malaysian rice production. Mitig. Adapt. Strateg. Glob. Chang. 2014, 19, 431–444. [Google Scholar] [CrossRef]
  34. Sullivan, C. Calculating a Water Poverty Index. World Dev. 2002, 30, 1195–1210. [Google Scholar] [CrossRef]
  35. IPCC. Climate Change 2001: Impacts, Adaptation and Vulnerability; Contribution of Working Group II to the Third Assessment Report of the Intergovernmental Panel on Climate Change Cambridge University Press: Cambridge, UK, 2011. [Google Scholar]
  36. Tran, T.; Tran, P.; Tuan, T.H. Review of Housing Vulnerability. Implications for Climate Resilient Houses; Discussion Paper series Sheltering from A Gathering Storm No.1; Institute for Social and Environmental Transition-International: Boulder, CO, USA, 2012. [Google Scholar]
  37. Tewari, H.R.; Bhowmick, P.K. Livelihood vulnerability index analysis: An approach to study vulnerability in the context of Bihar. J. Disaster Risk Stud. 2014. [Google Scholar] [CrossRef] [Green Version]
  38. Tjoe, Y. Measuring the livelihood vulnerability index of a dry region in Indonesia: A case study of three subsistence communities in West Timor. World J. Sci. Technol. Sustain. Dev. 2016, 13, 250–274. [Google Scholar] [CrossRef] [Green Version]
  39. Do, T.; Nguyen, C.; Phung, T. Assessment of Natural Disasters in Vietnam’s Northern Mountains; Paper No.54209; Munich Personal RePEC Archive (MPRA): University Library of Munich: Munich, Germany, 2013. [Google Scholar]
  40. Abdul-Razak, M.; Kruse, S. The adaptive capacity of smallholder farmers to climate change in the Northern Region of Ghana. Clim. Risk Manag. 2017, 17, 104–122. [Google Scholar] [CrossRef]
  41. Tongruksawattana, S.; Junge, V.; Waibel, H.; Diez, J.R.; Schmidt, E. Ex-Post Coping Strategies of Rural Households in Thailand and Vietnam. In Vulnerability to Poverty; Klasen, S., Waibel, H., Eds.; Palgrave Macmillan: London, UK, 2013; pp. 216–257. [Google Scholar]
  42. Soubry, B. How Can Governments Support Adaptation to Climate Change by Small-Scale Farmers? A Case Study from the Canadian Maritime Provinces? SSRN Electronic J. 2017. [Google Scholar] [CrossRef] [Green Version]
  43. Nawrotzki, R.J.; Riosmena, F.; Hunter, L.M.; Runfola, D.M. Amplification or suppression: Social networks and the climate change—migration association in rural Mexico. Glob. Environ. Chang. 2015, 35, 463–474. [Google Scholar] [CrossRef] [PubMed] [Green Version]
  44. Misra, A.K. Climate change and challenges of water and food security. Int. J. Sustain. Built Environ. 2014, 3, 153–165. [Google Scholar] [CrossRef] [Green Version]
  45. Etwire, P.; Al-Hassan, R.; Kuwornu, J.; Osei-Owusu, Y. Application of livelihood vulnerability index in assessing vulnerability to climate change and variability in Northern Ghana. J. Environ. Earth Sci. 2013, 3, 157–170. [Google Scholar]
  46. Gunasekara, N.; Kazama, S. Water conflict vulnerability of regions. Risk Water Resour. Manag. 2011, 347, 267–273. [Google Scholar]
  47. Gunasekara, N.K.; Kazama, S.; Yamazaki, D.; Oki, T. Water Conflict Risk due to Water Resource Availability and Unequal Distribution. Water Resour. Manag. 2014, 28, 169–184. [Google Scholar] [CrossRef]
  48. Alam, G.M.M.; Alam, K.; Mushtaq, S.; Filho, W.L. How do climate change and associated hazards impact on the resilience of riparian rural communities in Bangladesh? Policy implications for livelihood development. Environ. Sci. Policy 2018, 84, 7–18. [Google Scholar] [CrossRef]
  49. Pandey, R.; Jha, S. Climate vulnerability index-measure of climate change vulnerability to communities: A case of rural Lower Himalaya, India. Mitig. Adapt. Strateg. Glob. Chang. 2012, 17, 487–506. [Google Scholar] [CrossRef]
  50. Alam, G.M.; Alam, K.; Mushtaq, S. Influence of institutional access and social capital on adaptation decision: Empirical evidence from hazard-prone rural households in Bangladesh. Ecol. Econ. 2016, 130, 243–251. [Google Scholar] [CrossRef]
  51. Barua, A.; Katyaini, S.; Mili, B.; Gooch, P. Climate change and poverty: Building resilience of rural mountain communities in South Sikkim, Eastern Himalaya, India. Reg. Environ. Chang. 2014, 14, 267–280. [Google Scholar] [CrossRef]
Figure 1. The asset pentagon lies at the core of sustainable livelihood approach, within the vulnerability context [24].
Sustainability 13 07106 g001
Figure 2. Map showing the case study. (a) is the map of Son La province, Vietnam; (b) showing the study site.
Sustainability 13 07106 g002
Figure 3. Vulnerability spider diagram of the major components of the composite LVI for four ethnic group.
Sustainability 13 07106 g003
Figure 4. Vulnerability triangle diagram of the contributing factors of the LVI-IPCC for four ethnic groups.
Sustainability 13 07106 g004
Table 1. Brief characteristic for four ethnic groups in the Phu Yen District (source: from surveys).
CharacteristicsThai MuongDao Hmong
Average age of household head (age)49.7 ± 8.4449.6 ± 8.6641.3 ± 7.6841.6 ± 10.50
Average family members (number)4.9 ± 1.244.7 ± 1.005.05 ± 0.977.0 ± 2.12
Main income source (agricultural income, %)92.589.795.492.9
With some non-agricultural income (%)78.583.577.346.4
With outside community work (%)61.360.845.442.9
Limited formal education (%)54.854.659.167.9
Average distance to district centre (km)3.36 ± 1.817.5 ± 5.3315.2 ± 6.698.4 ± 1.85
Table 2. The contribution of the LVI eight major components to the LVI-IPCC.
LVI Major ComponentsIPCC Definition of Vulnerability (LVI-IPCC)
Natural disaster and climate variabilityExposure
Socio-demographic profileAdaptive capacity
Livelihood strategies
Social network and finance
HealthSensitivity
Food
Water
Housing and productive land
Table 3. Major components and subcomponents comprising the composite LVI.
Components (Major Components in Bold)ThaiMuongDaoHmong
Dependency 0.3420.3190.3780.396
Female headed household0.2470.1750.1820.107
Household heads did not attend school 0.5480.5460.5910.679
Socio-Demographic Profile0.3790.3470.3840.394
Household mainly income dependent on agriculture/forestry (cultivation, livestock, aquaculture, forest products collection)0.9250.8970.9550.929
Households without family members working outside the community0.3870.3920.5450.571
Households without non-agricultural livelihood income contribution 0.2150.1650.2270.536
Average agricultural livelihood diversity index0.1650.1600.1900.263
Livelihood Strategies0.4230.4030.4790.575
Household without access to information (TV/radio/telephone/internet)0.0000.0000.0000.071
Average media diversity index0.3870.3610.4090.905
Need for assistance from the local government in last 12 months 0.3870.4020.5450.679
Average receive/give ratio 0.1560.1220.0800.138
Average borrow/lend ratio from/to the community0.3800.4140.3600.476
Average borrow/lend ratio from/to the bank 0.5450.6120.8180.810
Average distance to the district centre0.1090.2470.5040.279
Households did not receive any agricultural training 0.5700.5050.6820.786
Households did not receive any climate change training course0.9570.9790.9551.000
Households without any family member being a member of a group0.1400.1130.2270.429
Social Networks and Finance0.3630.3760.4580.557
Households with a family member with chronic illness0.1180.1240.0000.000
Households with a family member had to miss work or school in the last 2 week due to illness0.0220.0930.1820.143
Household with members needing daily dependent care0.2580.2680.4090.464
Average distance to access to health center (or hospital)0.1680.1650.6070.517
Health0.1420.1620.2990.281
Households primary dependent on self-farmed food0.9250.9590.9550.964
Average number of months household struggle to find food for the family 0.0660.0620.1140.070
Average Crop Diversity Index 0.1870.1380.2090.207
Household without crops saving 0.0220.0100.3180.250
Food0.3000.2920.3990.373
Households utilize mainly natural water resources for domestic use0.2900.6801.0001.000
Average time to main water supply resource0.0160.0670.0300.029
Households do not have enough water for domestic use for the whole year0.3550.3920.5450.643
Inverse of the average days of stored water per household 0.5280.5620.4970.693
Water0.2980.4250.5180.591
Households with weak thunderstorm/hail resistant construction0.2150.2680.4090.750
Houses elevated by low ground and easily inundated by floods0.0650.1750.0910.107
Houses is located at the place prone to a landslide 0.0860.0620.2270.107
Average time to get to the agricultural land0.1850.1590.4250.358
Average areas of agricultural land vulnerability to floods0.0590.0170.1260.028
Average areas of agricultural land vulnerability to droughts0.1130.0190.0440.084
Housing and Productive Land0.1210.1170.2200.239
Average number of natural disaster in the past 5 years0.2980.3470.3080.347
Average types of natural disasters happened in the past 5 years0.4970.5620.5000.580
Household with losses physical assets and agricultural production in the past 5 years0.5700.5260.8640.750
Household did not receive a warning about the pending natural disasters0.2260.2780.4090.643
Natural Disasters and Climate Variability0.4260.4390.4750.499
Overall LVI0.3200.3340.4130.455
The shaded cells show scoring differences amongst the groups.
Table 4. LVI-IPCC contributing factors for four ethnic groups in Phu Yen district.
IPCC Contributing Factors to VulnerabilityThaiMuongDaoHmong
Adaptive capacity0.4690.4830.4340.340
Sensitivity0.2040.2340.3440.356
Exposure0.4260.4390.4750.499
LVI-IPCC−0.009−0.0100.0140.057
Publisher’s Note: MDPI stays neutral with regard to jurisdictional claims in published maps and institutional affiliations.

