
An Evaluation of Interventions for Improving Pro-Environmental Waste Behaviour in Social Housing


1
School of Applied Sciences, University of Brighton, Brighton BN2 4GJ, UK
2
Anthea Rossouw & Associates UK (ARA-UK), Peacehaven BN10 8RS, UK
*
Author to whom correspondence should be addressed.
Sustainability 2021, 13(13), 7272; https://0-doi-org.brum.beds.ac.uk/10.3390/su13137272
Submission received: 30 May 2021
/
Revised: 24 June 2021
/
Accepted: 25 June 2021
/
Published: 29 June 2021
(This article belongs to the Special Issue Management of Solid Waste)
Abstract
:Recycling levels have been stagnating for a decade in England. Over the last 2 years, 39% of local authorities have seen a reduction in their recycling rates. Social housing has historically been neglected in waste service provision and literature. Housing associations own 2.5 million dwellings, representing 10% of all housing stock in England. Improvements to waste services and increased resident engagement in social housing could address stalling recycling levels and contribute to the aim of the national waste strategy of moving towards a circular economy. This paper presents the results of engagement with housing association residents across 24 sites in England. Following community engagement workshops, a range of resident-led interventions were implemented, including improvements to recycling services and installation of onsite food waste composters. An inclusive resident engagement programme bespoke to each site was pioneered, including regular feedback on waste reduction and recycling performance. The impact of the project was evaluated using mixed methods, including monitoring of recycling levels and resident and stakeholder surveys. The interventions stimulated behaviour changes, leading to increased recycling rates (+10.4% per site compared to baseline), waste reduction (0.4 kg per flat per week compared to baseline), increased recycling quality, and social cohesion. The research outcomes provide a model for improving waste management in social housing globally.
1. Introduction
In England, recycling levels have been stagnating for a decade, and over the last 2 years, 39% of local authorities have seen a reduction in their recycling rates [1,2]. Reasons for this include government spending cuts impacting front-line services [3], recycling behaviour not being maintained—referred to as ‘recycling decay’ [4]—and a lack of consistency, with local authorities using different containers to collect different materials at different frequencies [5]. This lack of a joined-up approach can lead to confusion amongst the public on how to recycle [6]. The government committed to addressing the stagnating recycling rates in its most recent waste strategy, ‘Our Waste Our Resources’, whilst pledging to maximise resources to move towards a circular economy [5]. One specific area that has historically been overlooked in waste policy, recycling service provision, and the literature is waste management in social housing.
Granath Hansson and Lundgren’s [7] review of social housing found five common trends in the definition of social housing. Social housing provides a solution to a specific problem—a ‘target’ group—namely, households with limited financial resources. It includes ‘tenure’—usually rented housing that is provided for the long term rather than temporarily. There is a ‘provider’, which is typically the state, non-profit organisations, or a combination of the two. Social housing is publicly ‘subsidised’ to provide housing below market prices or rents. Finally, it can be a ‘public intervention’ linked to public policies to support those in need.
In England, the main models of social housing are dwellings owned and managed by private providers—commonly referred to as ‘housing associations’. In total, they own 2.5 million dwellings—10% of all housing stock [8]. Currently 85% of housing provided by housing associations is classified as low rental, with 40.6% of dwellings situated in the 20% most deprived areas. A total of 39% of housing association homes are classified as flats [9].
The Waste Strategy sets out the priorities of maximising the value of resources and minimising waste [5]. With housing association housing making up 10% of the total housing stock in England, it has an important role to play in meeting these priorities. Improved services in social housing could contribute to addressing the stagnation in recycling rates and will be imperative if the government’s aim of moving towards a circular economy is to be realised. Given the cuts to local authorities’ budgets and the uncertainties following COVID-19, housing associations could act as a facilitator to promote a change in behaviour with respect to waste.
The aim of this research was to evaluate the impact of interventions for improving the management of waste in social housing. The research was conducted in partnership with two housing associations and their residents by following an inclusive approach. The objectives of the research were to:
- Review the literature on waste management studies in social housing and flats;
- Engage with staff and residents at a sample of sites to identify the challenges and opportunities in the sustainable improvement of the waste management system;
- Implement and evaluate the impacts of interventions on behaviour change.
The paper presents the outcome of engaging with residents and implementing interventions across 24 Recognition sites. A qualitative and quantitative approach to monitoring was deployed with data collected at the baseline and throughout the project in order to understand changes in recycling levels and resident behaviour. For comparison, data were collected in parallel from 19 Control sites. This paper presents a review of the relevant literature on waste management in social housing and flats, followed by the methodology, results, discussion, and conclusion.
Literature Review
There is a surprising absence of peer-reviewed literature on waste management in social housing. However, 39% of English housing association dwellings are classified as flats, and studies have been published that evaluated waste management in flats. As such, this review focuses on flats and, where possible, integrates studies on social housing.
Flat dwellings include homes in purpose-built flats, converted buildings, and apartments above shops or in commercial buildings, and they range from high to low rise [10]. They can vary from luxury high-end flats to social housing or student residences. Waste management research in flats has been conducted in very different social contexts—for example, in private high-rise housing in Canada [11] and Hong Kong [12], socially deprived housing estates [13], student residences [14,15,16], and countries with cultures and social dynamics different from those of England [12,16,17,18]. Waste services for flat residents are influenced by who is managing the housing, the approach by the waste service provider (in England, this is the local authority), and the layout of the housing complex. Waste and recycling containers might be located on each floor, at centralised points, and internally or externally [16,19]. Due to these variables, care must be taken when interpreting the results. The findings from one study may not directly relate to those of another. By reviewing the literature, two main themes emerge: barriers to recycling in flats and interventions for changing the behaviour of residents.
Historically, the management of waste in flats has been poor, with recycling rates lower than those of single-occupancy housing [20,21]. Research suggests that many high-rise blocks still suffer from poor or non-existent recycling and food waste collections [22]. The lack of access to recycling bins was cited as the main barrier to recycling in high-density households in London [13]. Linked to this is convenience [11,14,20,23]. Inconvenience may stop people from recycling; Ando and Gosselin [20] described this as the ‘transaction cost of recycling’—with recycling participation being a function of time and effort. Studies have also identified the lack of services for specific waste streams—for example, electrical waste, textiles, and reuse [13,24].
The lack of storage space has been identified as a barrier to recycling in flats with limited internal and external space for containers [13,23,25]. The condition of communal waste and recycling areas can also be a barrier, with concerns regarding poor maintenance of these spaces, plus the presence of fly tipping and vermin [13].
Research suggests that the social contexts of flats can be a barrier and residents may feel social isolation, anonymity [26], and a lack of a sense of community [27], particularly in large, densely populated developments. Benton and Fox [28] suggested that the demographics of flat residents could also be a barrier to recycling. Their research found that flat dwellers are single, young, mobile, and less predisposed to recycle. The high turnover rate of residents could be a further barrier. McQuaid and Murdoch [23] supported this, suggesting that in multi-story flat dwellings with high resident turnover, there may be low levels of social networks that promote recycling. However, research suggests that the perception of transient populations in flats is not always the case—for example, Pedersen and Manhice [19] found that the average renting duration of flat dwellers in Copenhagen was 13 years.
Historically, local authorities have relied on passive forms of communication to engage with the public on waste, but since the 1990s, there has been greater emphasis on interactive forms [29]. An early example from 1991 is from Claremont, California, where consistent recyclers were invited to become ‘recycling block leaders’ and engage non-recycling neighbours in recycling [30]. De Young et al. [21] conducted one of the first studies to evaluate the impact of intervention techniques in multi-family flat complexes. The research found that no intervention performed better than the others; however, the size of the housing complex seemed to influence behaviour. The smaller the complex, the greater the weight of recycling per resident, with less contamination in recycling collections. Again, this might be due to the closer sense of community in smaller residences compared to the sense of anonymity and non-involvement in larger communities.
Christie and Waller [31] reported on the positive use of face-to-face contact when introducing communal composting in flats in Australia, and other studies have highlighted the positive impact of personal contact when introducing food waste collections in flats in China [17,18]. Studies have highlighted that, for a recycling scheme to be successful in social housing, close consultation among residents, housing management, local authority officers, and contractors is required. The scheme and messages should be tailored to the specific community, and frequent information and engagement are required [32]. Research has noted the lack of feedback to flat residents about their recyclable-sorting behaviour and that waste engagement campaigns should be developed by using a more collaborative approach [24].
The literature has highlighted the important role that housing companies and management can play in changing behaviour and improving waste management on site—they are the link between the residents and the waste collection system [21,24]. This view was supported by Ng [16], who researched the behaviour in flats in Hong Kong. The study found that 93% of residents living in sites where the management was proactive (e.g., organised recycling-related events) recycled compared to 81% where engagement from the management was low. Research has suggested that financial incentives can influence behaviour. Yau [12] showed how incentive schemes are common in Hong Kong—for example, property management companies have launched reward schemes in which residents exchange recyclable materials for commodities, such as food, toiletries, and dining vouchers. Li et al. [33] reported a similar scheme in flats in China. However, there are strengths and weaknesses to incentive schemes [33], and previous research has shown the varying responses to incentive schemes in terms of behaviour in flats [34,35].
This literature review informed the development of the intervention in this research in order to promote sustainable pro-environmental waste behaviour among social housing residents. The intervention aimed to improve the accessibility of services [11,13,14,22,23] by using a collaborative approach with the residents and the wider eco-system [21,24,32,34] to affirm their important role in waste management. It aimed to build social cohesion in order to overcome the social challenges identified by the literature [26,27] and it integrated interactive face-to-face engagement [17,18] with residents on an ongoing basis [31,32].
2. Materials and Methods
2.1. Selection of Sites
This research was developed in partnership with two housing associations. Housing and Care21 manage 18,000 flats across 470 sites throughout the UK. They focus on residents that are over 50 years of age, including vulnerable people. Conversely, AmicusHorizon provides housing to over 28,000 households, covering a broad profile of residents, including families and youth; they are based in the south-east of England. The housing associations therefore complemented each other and represented a wide spectrum of multi-cultural residents in their flats.
A list of sites was provided by each housing association, and an initial desktop site assessment was conducted to assess the suitability for the project. The criteria for omitting sites included pending changes in key staff at sites or notification that the local authority was making changes to waste services during the lifetime of the project, which would have an impact on the research.
Meetings were held with the manager and relevant staff at shortlisted sites to explain the project and their involvement. Opinion leaders were identified at the meeting and included chairpersons of resident associations, residents who were concerned about the environment, and active gardeners. A checklist detailing the characteristics of each site was completed, including the demographics of residents and the details of communal areas and outdoor spaces. Data on the waste system were collected, including data on the waste and recycling containers that were present, the range of recyclable materials collected, the signage on waste containers, accessibility, and any other relevant information.
Following these visits, 43 sites were included in the study. The visits highlighted the variation in waste service provision; at the start of the project, many sites did not have basic or adequate service provision. Some sites did not have any recycling facilities on site at all, whilst others had limited services compared to the neighbouring single households—for example, they had paper-only collections, whilst the adjacent single households had multi-material collections.
The sites were divided into two categories—see Table 1. ‘Recognition’ sites were those in which the staff and residents would be engaged with interventions that were applied to improve the waste services, and their recycling efforts would be recognised through an on-going communication campaign. In the ‘Control’ group, no contact or interventions would be made by the project team, thereby allowing for a robust comparison against the Recognition group. Previous research has suggested that the size of a housing complex can influence the levels of recycling [21]; hence, the aim was to choose comparable sites in both categories (see Table 1).
2.2. Engagement with Residents and Staff
The literature highlighted that if a recycling scheme is to be successful in social housing, there is a need for close engagement between stakeholders. Waste services and messages should be tailored to the specific community, and frequent information and engagement are required [32]. These key elements were integrated throughout the lifecycle of the project. Following the initial visits, interactive workshops were held at each Recognition site. The workshops provided a platform for disseminating important information on waste and stimulating discussion on the waste services available at the site. Similarly to Christie and Waller [31], the idea was to provide an informal social event in order to help foster a sense of community and give residents a platform to contribute to change in a welcoming environment.
The workshops were led by a social and behaviour change management specialist with expertise in working with a diverse, multi-cultural range of stakeholders. They led the development of the workshop format to ensure maximum participation, inclusivity, and sharing of ideas and values. All residents and staff, including cleaners and those responsible for the waste areas, were invited to attend, along with the waste service providers. Table 2 provides an overview of the workshop activities—on average, the participative workshops lasted 2.5 h.
2.3. Implementation of the New Waste Management Scheme
The project team worked with the housing associations and local authorities to follow up on the action plan for each site based on residents’ and other stakeholders’ input. This included: working with local authorities to introduce recycling from scratch at some sites; changing the bin configuration to be conducive to the needs of residents; redevelopment of bin storage areas; improving accessibility for people with physical challenges; developing clearer signage bespoke to each site on which materials could be recycled and bin labelling; setting up the collection of additional materials, including small WEEE, textiles, batteries, and items for reuse.
2.4. Ongoing Engagement
The following strategic engagement was implemented at Recognition sites to acknowledge the efforts of participating residents and provide updates on progress: (a) release of a series of newsletters bespoke to the project; (b) by working with the housing associations’ communications departments, articles were included into their national newsletters, which were circulated to every resident; (c) a thermometer poster bespoke to each site was on display in communal areas of each site to indicate the current recycling rate. This was updated after each round of data collection. (d) A multimedia approach included articles in local, national, and social media. Both the newsletter (a) and recycling thermometer (c) featured images of residents at that specific site.
2.5. Evaluating the Impact of Interventions
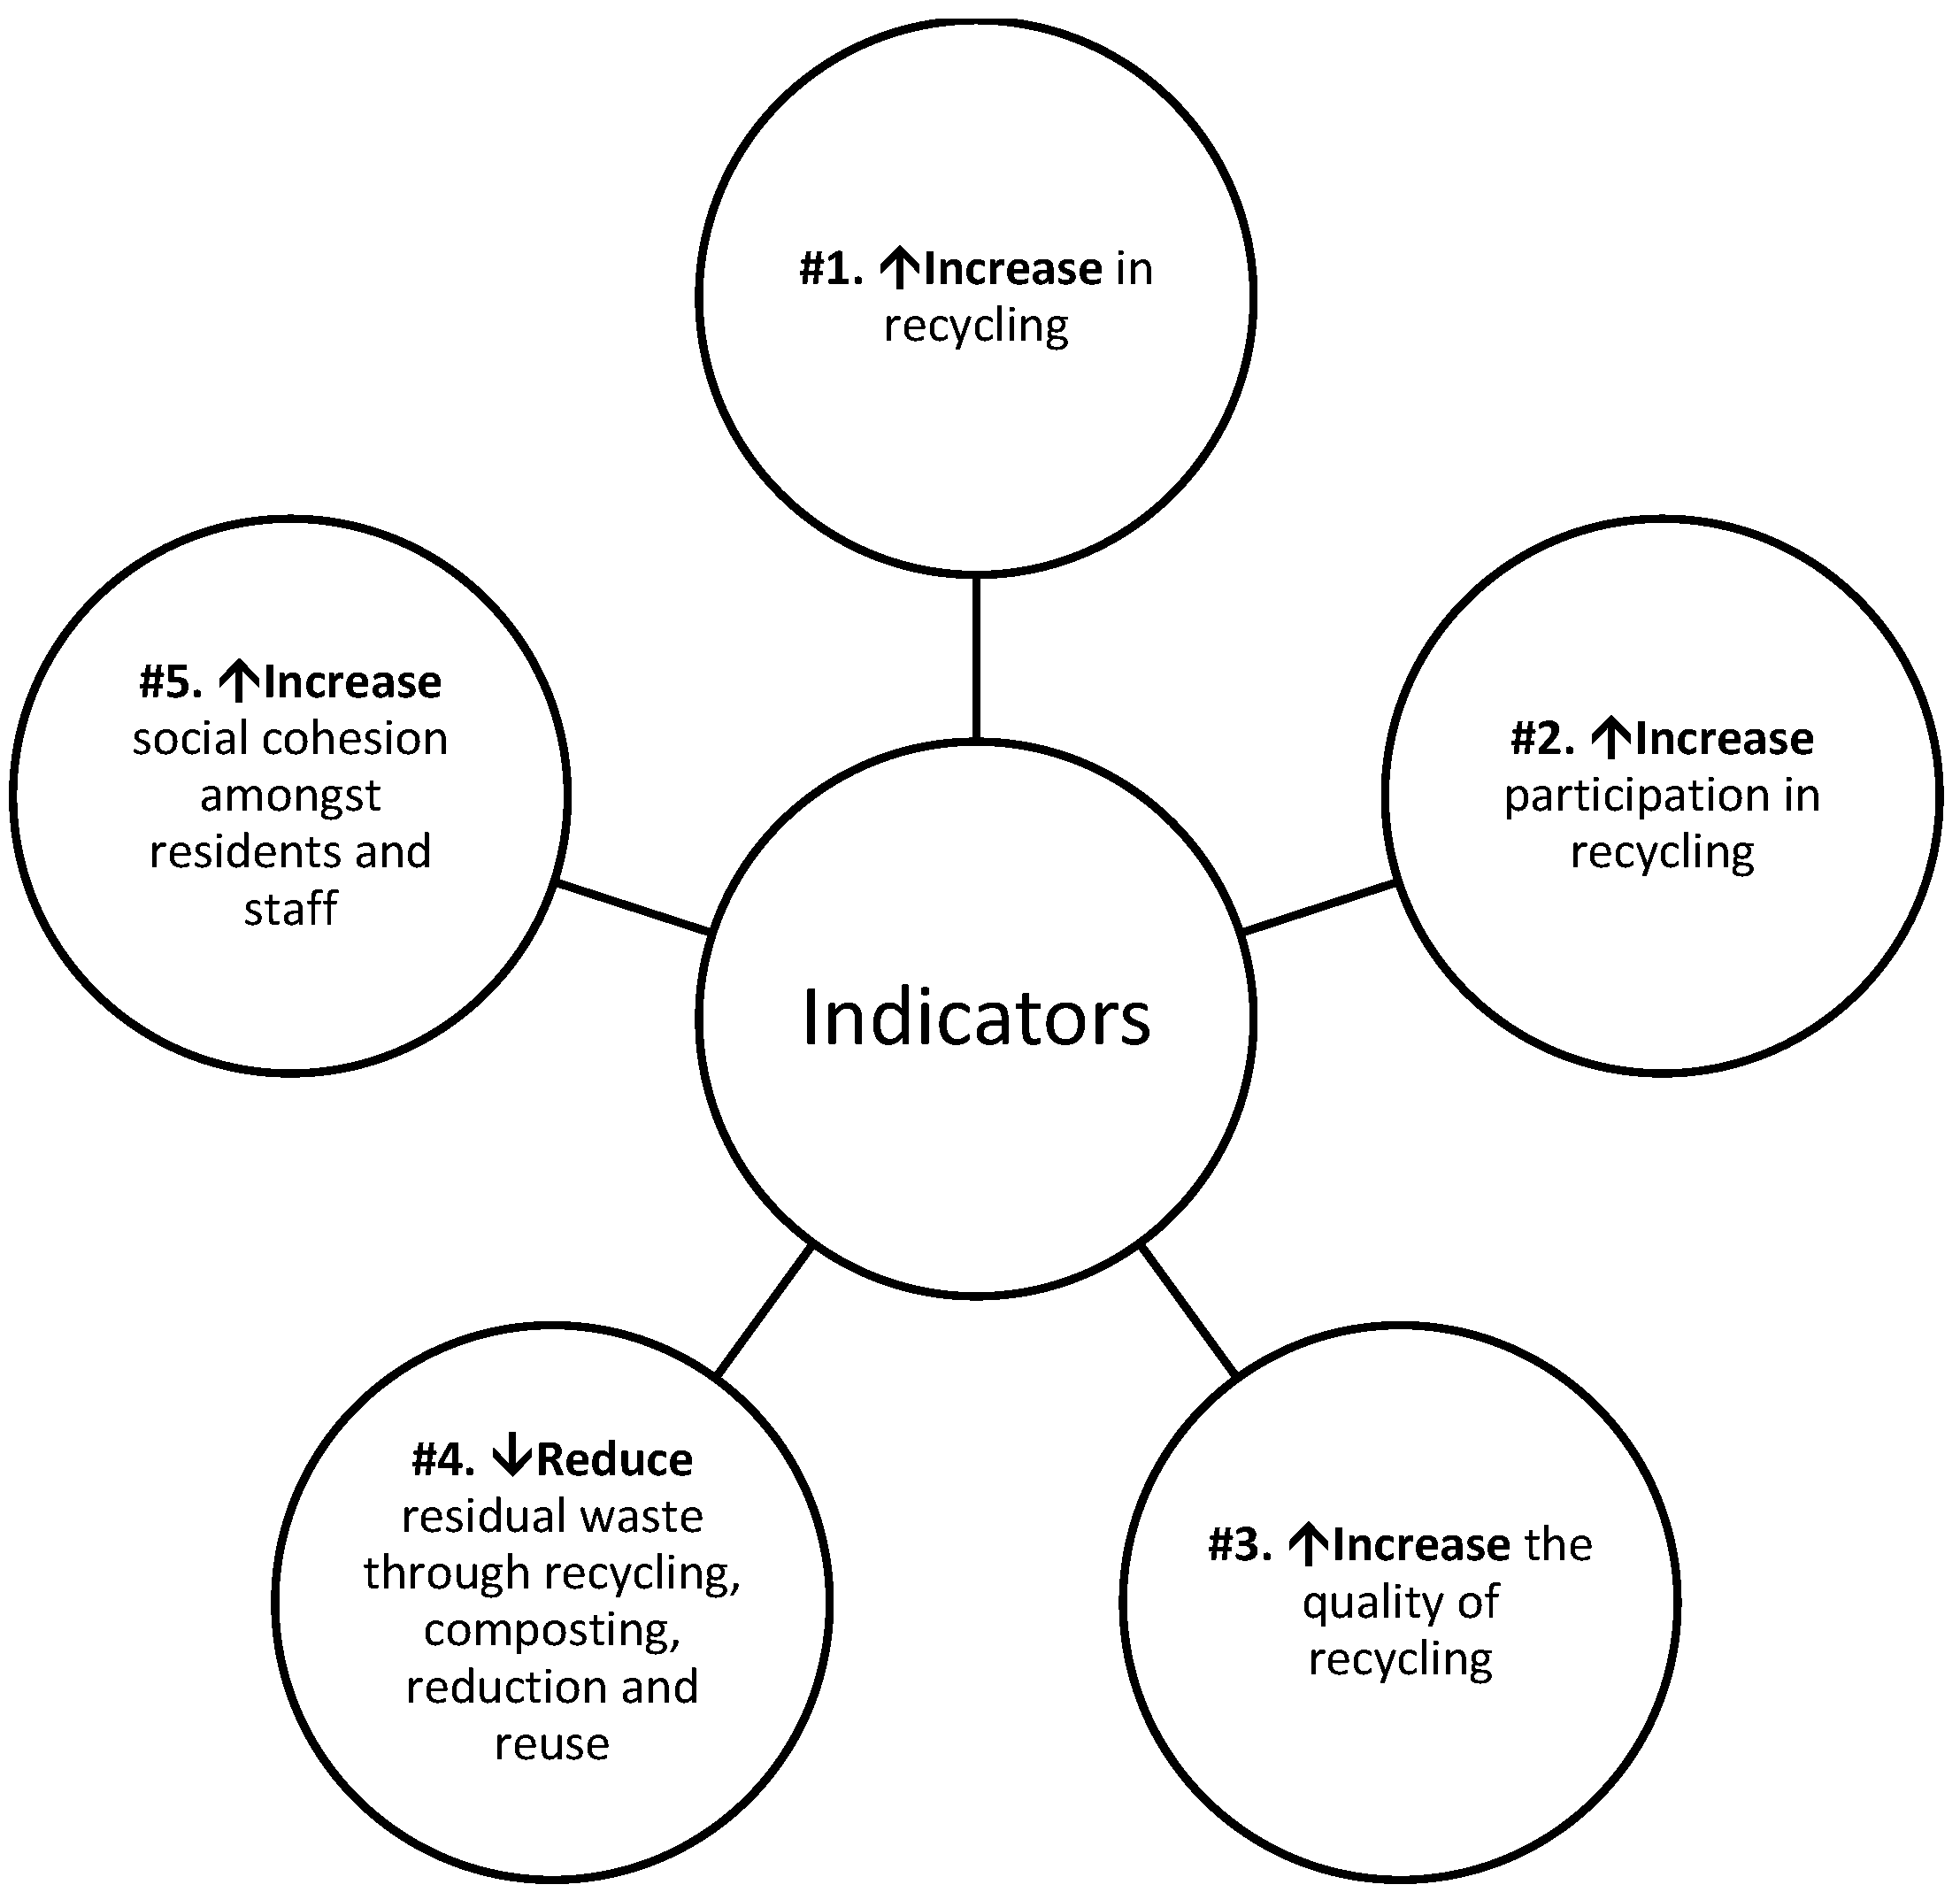
This study adopted triangulation, in which the researchers searched for convergence among different sources of information to form themes [37]. The idea behind triangulation is that the more different data sources agree on a particular issue, the more reliable the interpretation of the data is. This ensures that the subject is not looked at from one side, but through a multiplicity of lenses, which allows for many facets of the phenomenon to be exposed and understood [38]. To evaluate the impact of the project, indicators were developed (see Figure 1) that were informed by the following methods.
2.5.1. Quantitative Data Collection
Local Authority Collection
Data were collected on the waste and recycling levels at each site. Ideally, actual weight data would have been used; however, this was not possible due to the local authorities’ collection vehicles not having on-board weighing capabilities. Due to the size of the collection containers, it was not possible to weigh them in situ—for example, 75% of sites had four-wheeled bins that held over 600 litres, which could not be weighed on conventional scales. Visual observation was used to record the levels of waste and recycling. A representative at each site (normally, the site manager) collected data after training provided by the project team. The protocol was based upon guidance [39] where monitors observed how full each bin was prior to collection in 25% increments. Each bin was labelled with corresponding information on the recording sheet, including the size of the bin and the materials collected. A visual estimate was collected on the levels of waste and recycling for all waste streams, and the data were submitted to the project team, who then converted the volume data into weights using published density data, which were mainly from WRAP [40]. Variants of this approach have been adopted in other flat studies [13,21].
There were four phases of data collection for all sites. As per Ordoñez et al. [24], these were intentionally run outside of the Christmas, Easter, and peak summer holiday periods, which could be unrepresentative. Baseline data were collected at least one month before the workshops commenced. Data were then collected after the intervention, part of the way through the project, and at the end, with data from the Control sites collected in parallel. In each phase, 4–6 weeks of data were collected—therefore, all sites had at least 16 weeks of data. The data were analysed by the project team to calculate the average weekly weight of residual waste and recycling, allowing the recycling rate to be calculated for each phase. The recycling rates cited in this paper considered all of the waste streams collected by the local authorities—residual waste, dry recycling, and food waste. Garden waste was excluded from the recycling rate calculations due to the variation in services across participating sites and the differences in the sizes of the sites, with some having very large gardens. Due to the variables in the sizes of the sites and types of waste systems in operation, the data were normalised per flat to allow for comparisons across sites. In total, there were 344 datasets submitted (43 sites × 4 sets of data on recycling and 4× sets on residual waste).
Spot checks were undertaken at each site by the project team to corroborate the data. On average, 5 spot checks were completed per site throughout the research. During the spot checks, the quality of recycling was assessed by using a five-point scale, with 0 being no contamination and 4 being completely contaminated. This method was based on that recommended by WRAP [39] and a similar approach that was deployed in other studies [21]. The data were used to compare how the contamination levels changed during the project with a comparison with the baseline. It was not possible to do this for all sites, as in some, there was no recycling collection being offered at the baseline or recycling had been collected when the spot check was undertaken. During the spot check visits, mentoring of the site management also took place, along with any troubleshooting.
Other Materials
Based on the residents’ feedback, 10 Recognition sites had collections of batteries set up and 14 sites had three monthly textile and reuse collections offered. Where logistically possible, the contractor provided weight data for each site and for each collection. Food waste composting estimates were based upon the use of a combination of food waste diary data and estimates of the number of flats participating in composting at least once a month. At a sample of participating sites, the residents were asked to keep a diary of how much food waste they put into the Green Johanna for composting each month. Every time that they emptied the caddy, they recorded if it was 25%, 50%, 75%, or 100% full. Samples of caddies were taken to calculate the average weights. The volume and weight data were combined to calculate the average quantity of food waste being set out each month by participating flats. Site managers were contacted for an estimate of how many flats were taking part in composting at least once per month. This was applied to the weight data to estimate the levels of food waste being composted. In addition to food waste, other materials, such as cardboard, paper, and garden waste, could be composted. During spot checks, an assessment was made to ensure that the correct materials were being composted and how full the composters were. Therefore, a detailed picture was developed of how each composter was being used. The behaviour survey also contained questions on participation in and knowledge of composting.
2.5.2. Qualitative Data Collection
A baseline resident behaviour survey was run to help understand recycling behaviour and to assess the knowledge and satisfaction levels across the Recognition and Control sites. This was repeated approximately 3 months after the workshops and at the end of the project, with changes in behaviour noted. Table 3 shows the number of responses by flat and, in brackets, the response rate. Based on guidance from WRAP [41], the aim was to achieve a 20% response rate in each phase. This was met, except for the final survey of the Control group. Anecdotal data showed that the response rates were reduced after the baseline due to survey fatigue, especially in the Control group, where residents did not experience any changes in service over the duration of the project.
A stakeholder survey was also conducted at the end of the project with 7 site managers, 4 local authority officers, 5 housing association staff members that were responsible for all sites in specific areas, 1 member of the project staff, and 2 contractors. The aim was to understand their perspectives on the project, including its strengths, weaknesses, and impact—a similar approach was used in other studies [42]. Throughout the project, photographic evidence was collected and a photo library containing over 2000 images was developed, which provided valuable insight into the waste behaviours and the impact of the project. Examples are included in the online Supplementary Materials along with survey responses and changes in recycling rate data.
3. Results
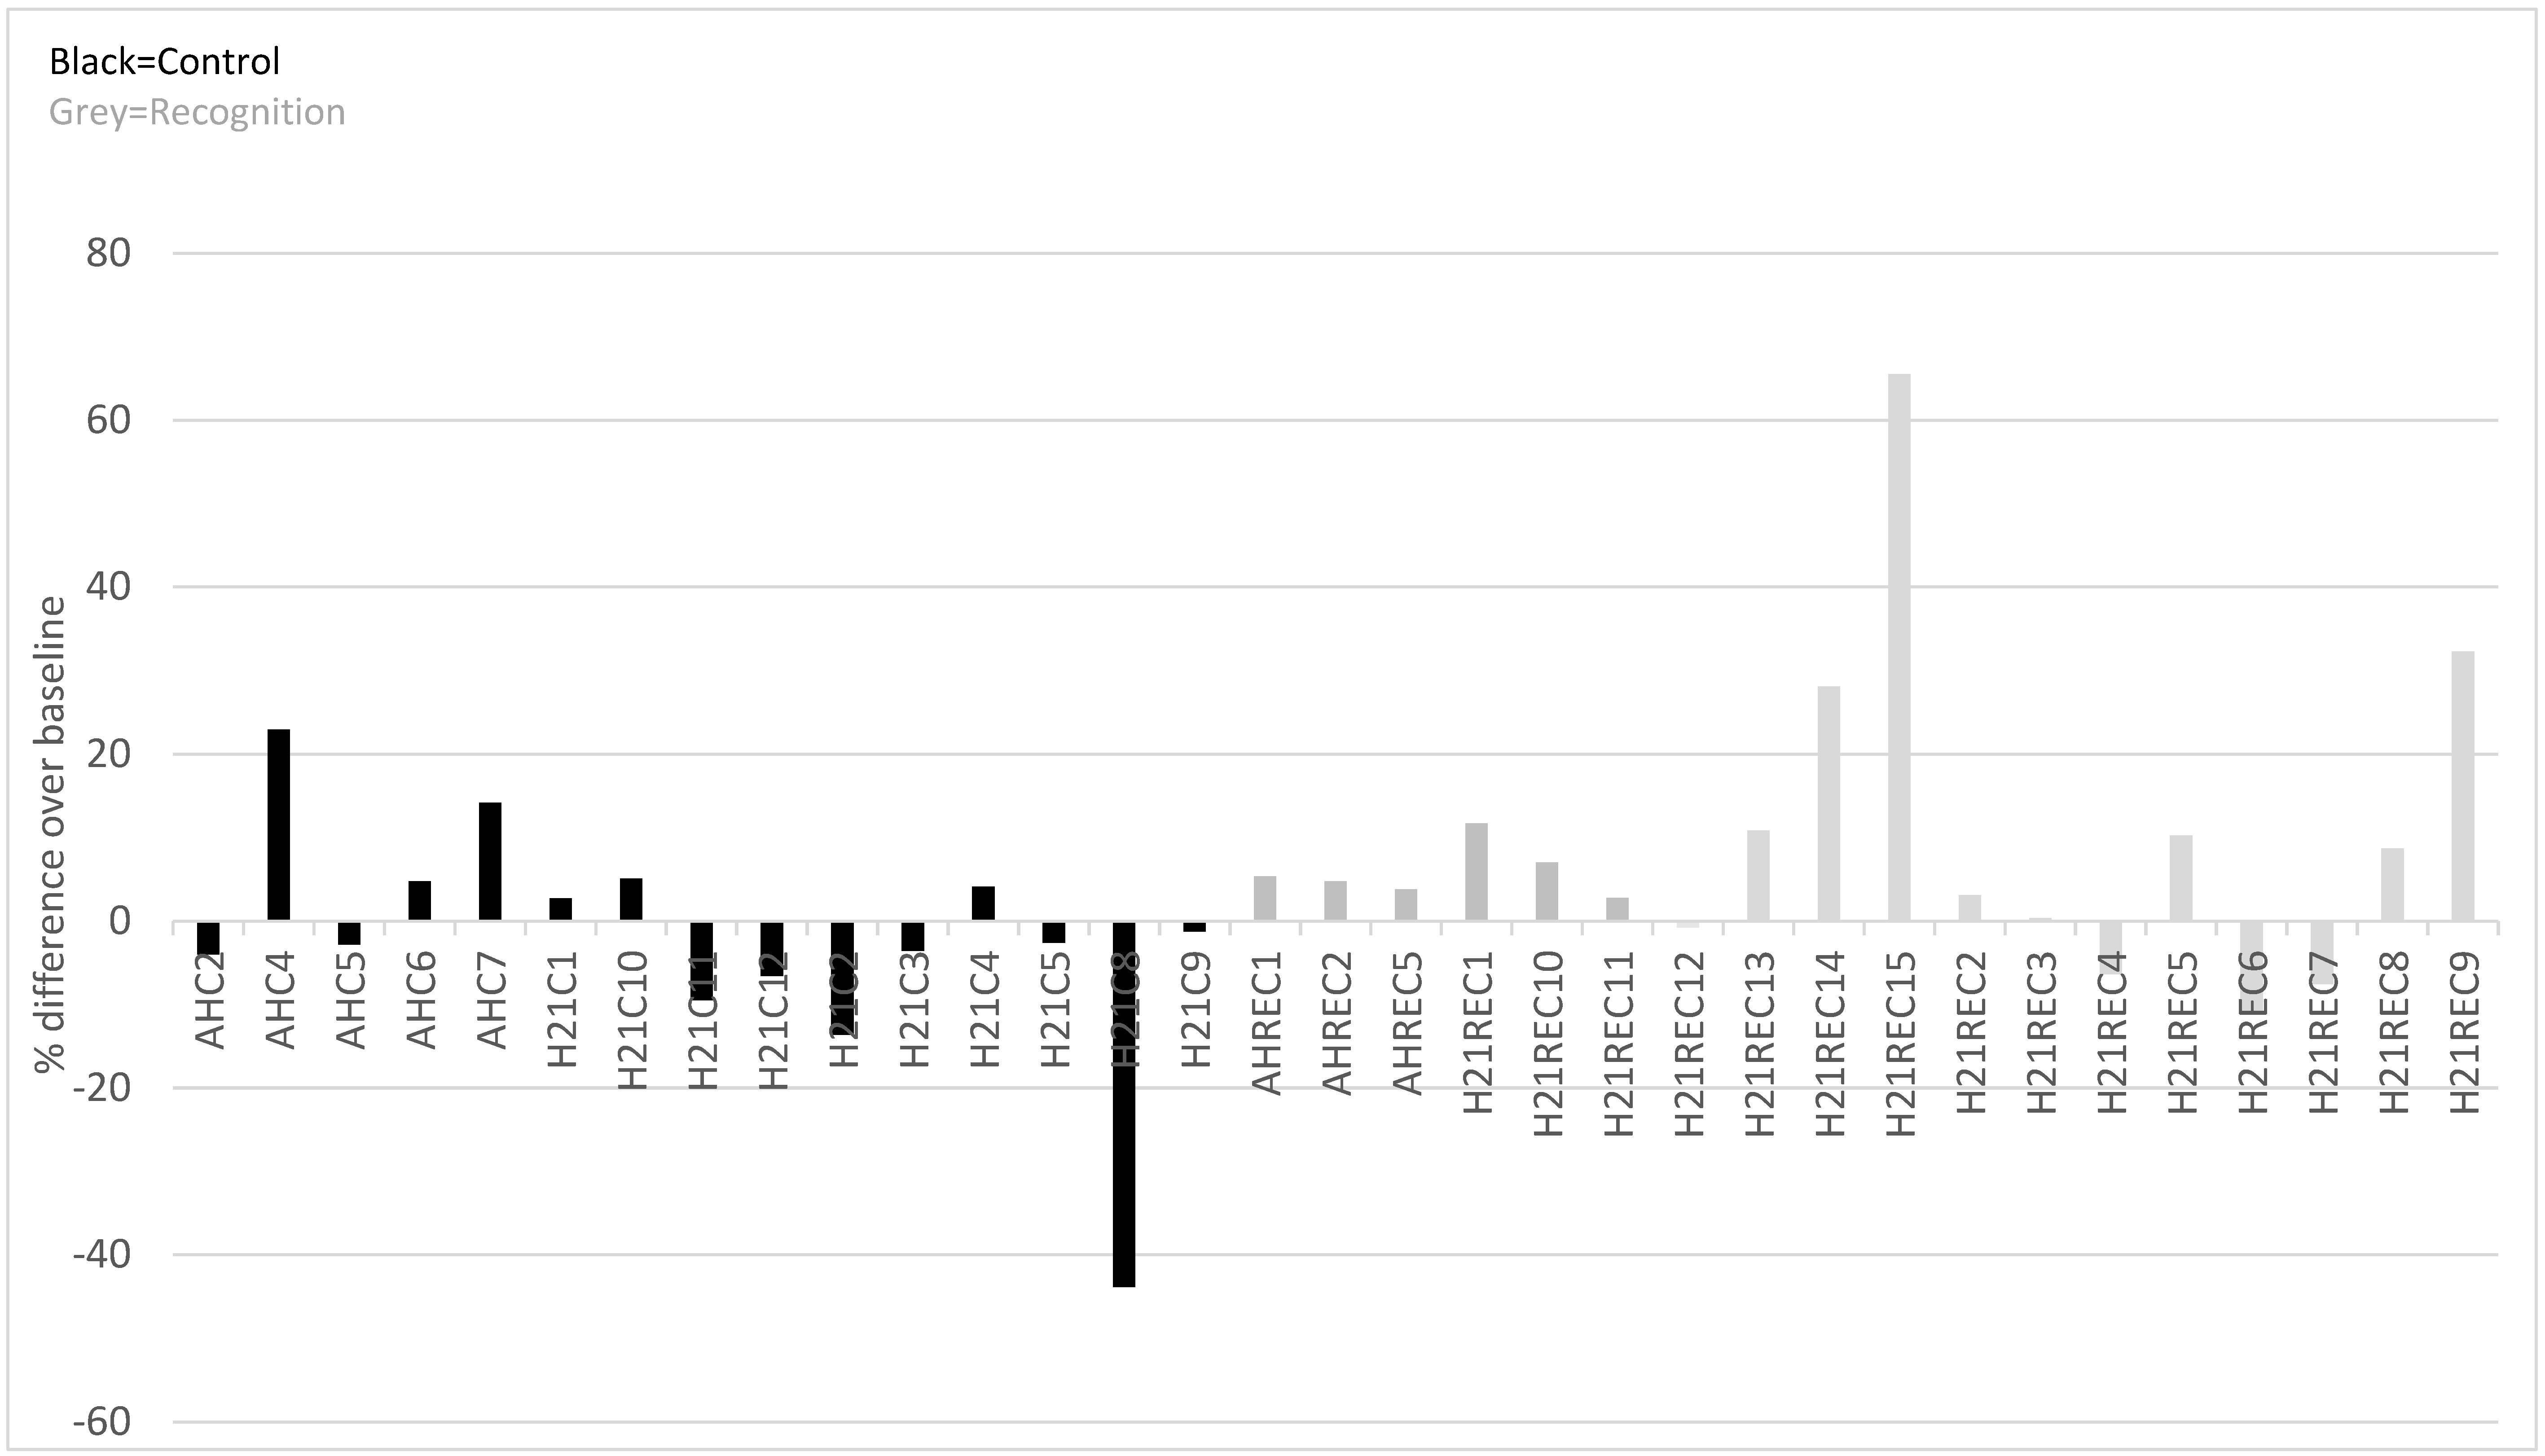
Table 4 provides an overview of the quantitative data, with Figure 2 showing the changes in the recycling rates for the sites in comparison with the baseline. This excludes the quantitative data from the six Recognition sites where recycling was introduced after the baseline—at these specific sites, by the end of the project, the recycling rates varied between 7.0% and 31.7%. Table 5 provides an overview of the qualitative data from the behaviour survey responses. Due to the mixed methods adopted, the results have been clustered by indicator and are presented in turn below.
3.1. Indicator #1: Increase in Recycling
Table 4 sets out the key trends in recycling rates, weights of waste, and recycling collected by comparing the baseline data with the final data. For the eighteen Recognition sites, the median recycling rate increased from 29.0% at the baseline to 39.4% by the end of the project—an increase of 10.4 percentage points. By comparison, the rates at the Control sites were reduced by 4.5 percentage points from the baseline to 26.8% (based on fifteen sites). There was a 0.5 kg increase per week in recycling per flat at the Recognition sites compared with a 0.2 kg reduction at the Control sites. It is important to note that there was significant variation in the recycling rates, with four Recognition sites and nine Control sites seeing a reduction in the recycling rates compared to the baseline—see Figure 2. At the Recognition sites, the highest increase in recycling rates over the baseline was 65.5%, and conversely, the greatest reduction was –10.8%.
3.2. Indicator #2: Increase Participation in Recycling
The survey results (see Table 5) showed the changes in recycling behaviour in order to corroborate the trends in the quantitative recycling data. At the Recognition sites, 16.2% of respondents stated that they did not recycle in the baseline survey compared to only 2.8% in the final survey (−13.4%). In comparison, there was an increase of 25 percentage points in the non-recyclers within the Control group over the baseline. At the Recognition sites, there was also a positive response to the questions about recycling as much as possible, recycling more compared to last year, and the greater awareness of which materials can be recycled (see Table 5). The levels of satisfaction with the waste services provided increased at the Recognition sites by 22.3% over the baseline, as opposed to the reduction of 1.2% in the Control group.
3.3. Indicator #3: Increase the Quality of Recycling
Table 6 presents an overview of the findings from the assessment of the levels of contamination based on the spot checks. The final average recycling contamination score was less than 1 at the Recognition sites, which indicates less than 5% contamination. The actual levels of contamination were very low. By comparison, the average contamination for the Control sites was 5–10%. At some Control sites, the contamination levels were reported to be over 10%. Due to the high rates of contamination at one Control site, recycling was withdrawn by the end of the project.
The survey results corroborated these data, with the residents changing their behaviours to reduce contamination (Table 5). A total of 84.8% of the respondents at the Recognition sites agreed that it was important to wash out cans and bottles before recycling, an increase of 19.9 percentage points over the baseline. Conversely, 32.7% of the participants from the Control sites agreed, which was a reduction of 18.1 percentage points compared to the baseline. Residents were asked if they were better at washing things out before putting them into the recycling compared to before the project commenced. A total of 16.5% of the residents of the Recognition sites agreed, compared to 1.0% at the Control sites.
In the stakeholder survey, local authorities were given the opportunity to comment on the impact of the project, and the responses included:
“The contamination rate at the sites involved in the project has gone down, whilst this has not happened at other sites outside of the project”. Regional Housing Manager
“There was contamination but since the project this has now been eliminated. I’ve never had to visit the site through any further problems and no contamination is reported any more. So the project is very good”. Local authority officer
3.4. Indicator #4: Reduce Residual Waste Generated
The median residual waste generated per flat at the Recognition sites was reduced to 0.4 kg per week compared to an increase of 0.1 kg per week at the Control sites (see Table 4). There are several reasons for why this reduction occurred. Elevated levels of recyclable materials were diverted to recycling and residents participated in other pro-environmental behaviours, leading to the diversion of waste from the residual stream. For example, by the end of the project, 57.9% of the residents at the Recognition sites agreed that they composted their food waste (an increase of 36.4 percentage points over the baseline); 38.7% stated that they were composting for the first time, compared to 0% at the Control sites. In addition, 14 sites had three monthly textile and reuse collections offered—the contractor was able to provide weight data for 21 collections, and the average weight of material donated for reuse was 35 kg per collection per site quarterly.
3.5. Indicator #5: Increase Social Cohesion Amongst Residents and Staff
The data from the behaviour surveys suggest that the project helped to increase social engagement. When comparing the responses to “How often do you take part in community activities held here?”, those that answered “Often” or “Sometimes” increased by 23.0 percentage points for the Recognition sites in the final survey compared to the baseline. By the end of the project, the levels stood at 69.1% at the Recognition sites compared to 58.6% at the Control sites.
In the final stakeholder survey, the participants were asked to identify the three main benefits of the project for the residents. Out of 19 respondents, nine stated that fostering a ‘sense of community’ was one of the main benefits. Six stated that their motivation to get involved was ‘to enhance the sense of community spirit and cohesion onsite’. The residents’ and stakeholders’ feedback showed that the project had several additional benefits: increased pride in the local surroundings, more active residents through composting and gardening, including growing food, facilitating well-being, improvement of relationships with local authorities’ staff and contractors, improvements in the local environmental quality through refurbished communal waste areas, better signage, and reduced littering (see the online Supplementary Materials for examples).
A housing manager provided the following quote: “The community development outcomes from this project were outstanding—I saw ‘hard to reach’ people with dependencies not just involved but leading, communal areas that have been barren for decades are now in use and some of the people you identified have become more involved with us. I struggle to encourage social capital in self-contained multi-occupancy buildings, this achieved it”.
4. Discussion
Overall, the project led to increases in recycling, participation in recycling, improvements in recycling quality, reduced residual waste, and improvements in the social cohesion and local environmental quality at the Recognition sites. However, the results highlight the lack of consistency in waste services across social housing, with differences in containers, materials collected, and frequencies of collection. At the beginning of the project, the sites were at varying starting points regarding waste service provision. Some had established recycling schemes, whilst at other sites, services were non-existent. The levels of recycling and resident engagement at the beginning of the project would, therefore, influence the results. Due to these complexities, the focus was on understanding the impact of these changes at each site in comparison with the baseline and in comparison with the control group. Moreover, mixed methods were adopted in order to generate an inclusive and holistic understanding of the impacts of the interventions.
The literature review identified that the social contexts of flats can be a barrier, and residents may feel social isolation, anonymity [26], and a lack of a sense of community [27]. The literature also highlighted the importance of a collaborative approach to the development of effective waste management in flats [21,24,32]. Bringing the community together was a core principle of the project, as highlighted by the ongoing and multi-faceted interactive engagement. The approach seems to have been effective in improving the waste management systems at the Recognition sites. The project delivered on many of the needs expressed by the residents during the engagement process. The inclusive, consultative approach and the recognition of their values as important stakeholders were affirmed through concrete actions that changed the waste management where they lived. Residents felt that their input was valid and important and that they were being listened to—that the project was not just a ‘talk shop exercise’, but rather led to real change that they were a part of. In the final behaviour survey, 24.7% of the Recognition respondents felt that they were ‘part of something important’.
An important facilitator of changes in behaviour was ongoing dialogue that used a bottom-up community-based approach, as opposed to a top-down, short-term, and generic intervention. The interventions were bespoke to every site and appeared to have encouraged behaviour changes by gaining trust and involvement from residents from the initiation to the project’s completion. The communication was geared towards uniting residents around a common cause.
As indicated in the literature, historically, the focus of local authorities has been rolling out recycling services to individual households, as there is a perception that flat residents are ‘hard to reach’. This was emphasised at the start of the project, as 10 Recognition sites had no recycling services provided at all. This is despite the requirement under the Household Waste Recycling Act [43] for local authorities to provide recycling services to households unless the cost of doing so would be unreasonably high or comparable alternative arrangements are available. At the workshops, a significant number of residents felt that they were being offered services inferior to those of single-occupancy households and that local authorities had a biased opinion, believing that it was not possible to offer effective recycling at their social housing sites. The project facilitated a resident-driven approach in collaboration with stakeholders, including local authorities, thereby changing perceptions. By the end of the project, many sites had better services than those of single-occupancy households on the same street. The residents could see that they influenced progress where they lived, thus facilitating ownership of the changes. The local authorities expressed that the project made a significant difference in the behaviours and attitudes of residents towards waste and recycling. Seven Recognition sites recorded recycling rates in excess of 50%, therefore highlighting that, through effective engagement, high rates of recycling in social housing are achievable.
The literature review identified a range of further barriers to effective recycling in flats. However, this research calls the validity of these general perceptions into question. For example, the literature suggests that flat dwellers are transient, leading to low levels of social networks that promote recycling [23]. This research has shown that this perception is questionable, as a significant number of resident participants had been living in the accommodations for at least 3 years, and some for over 30 years. Similarly, the lack of storage space has been identified as a barrier to recycling in flats [13,23,25]. Through effective stakeholder engagement and site reconfiguration, it was possible to implement a comprehensive recycling service on all Recognition sites and to identify spaces that could host composters.
A limitation of the study was the variation in the waste systems operating across the Recognition and Control sites. There were differences in the types of containers, materials collected, and frequencies of collection. This presented a challenge when comparing waste management performance. The government has acknowledged that this lack of consistency in collections across England can lead to confusion amongst residents, and they have pledged to develop a more consistent system [5], which would facilitate more accurate comparisons of performance across geographic areas. Another limitation was that of the recycling and residual waste data. Due to the lack of on-board weighing equipment on local authorities’ vehicles, weight data were not available. Similarly, due to the sizes of many of the containers, it was not possible to use portable scales. As such, the weights were estimated based upon volume data. Though this approach is widely deployed in waste management research [13,21,40], the data are less accurate than when weight data are recorded. This research was conducted over a protracted period, and factors outside the scope of the project could impact the results—for example, changes in residents and staff, waste media coverage that could negatively or positively impact behaviour, or reliability of the collection services. A further limitation was the reduction in questionnaire response rates during the project; this was likely due to survey fatigue, as residents were asked similar questions several times. This was more apparent in the Control group, which was likely due to the residents not seeing any direct improvements in services despite providing feedback.
5. Conclusions
This paper has demonstrated that inclusive community engagement and value-based recognition can lead to significant improvements in pro-environmental waste behaviour in social housing. Through co-created solutions, at most Recognition sites, there was an increase in recycling, reduction in residual waste, an improvement in recycling quality, and an uptake in composting. Follow-up work at participating sites has shown that the residents have taken ownership of the project and the behaviour has been sustained.
The intervention followed a communication and resident engagement plan that was bespoke to each site. It appears that this specific approach encouraged changes in behaviour and gained trust and involvement from residents. This approach could be used as a duplicable model to significantly improve the quality and quantity of recycling in flats and social housing globally.
This research highlighted that there are still communities in England that have access to limited recycling services. The Waste Strategy sets out the priorities of maximising the value of resources and minimising waste. If the government intends to address these priorities, it needs to recognise that resources are needed to provide inclusive services to all. With housing association dwellings representing 10% of the national housing stock, they can have a pivotal role in meeting the government’s aspiration of moving towards a circular economy. The COVID-19 pandemic has highlighted the importance of in-person contact in order to address isolation and well-being. Increasingly, there is a shift towards the use of social media to engage with the public in waste communication campaigns. However, this research has highlighted the importance of face-to-face engagement in order to overcome challenges, develop solutions, and foster social action. Therefore, social media should not be seen as the ‘silver bullet’ for effective community engagement for sustainable outcomes.
Further research could assess if the approach adopted and implemented in this paper has similar impacts in additional social housing and other contexts. The literature has identified the potential role that incentives can play in changing the behaviours of flat residents. Additional research could look at the roles of incentives in social housing and if they have any discernible impact in comparison with the use of only engagement.
Supplementary Materials
The following are available online at https://0-www-mdpi-com.brum.beds.ac.uk/article/10.3390/su13137272/s1, 1. Examples from the photo library documenting the project. 2. Behaviour survey data 3. Recycling data.
Author Contributions
R.W. and A.R. jointly developed the research project. A.R. led the engagement with housing associations and residents, implemented interventions, and was responsible for the deployment and collection of data. R.W. led the development of the data collection methods, data analysis, and engagement with the literature. Both authors acquired the funding and wrote the paper. All authors have read and agreed to the published version of the manuscript.
Funding
This research was partially funded by DEFRA through the Reward and Recognition Fund.
Institutional Review Board Statement
The study was conducted according to the guidelines of the Declaration of Helsinki, and approved by DEFRA and participating housing associations.
Informed Consent Statement
Informed consent was obtained from all subjects involved in the study.
Data Availability Statement
Data from the behaviour surveys and recycling rates for the Recognition and Controls sites is available under Supplementary Materials.
Acknowledgments
The authors acknowledge and thank the residents and staff from all sites and the teams at Housing and Care21 and Amicus Horizon for participating in the research. Furthermore, we acknowledge other stakeholders, including the local authority officers, contractors, and DEFRA, for funding part of the project. The authors also acknowledge and thank the following for their valuable assistance throughout: Mark Allum, Sara Giorgi, Simon Holroyd, Sandra Mills, and Graham Morrow.
Conflicts of Interest
The authors declare no conflict of interest. The funders had no role in the design of the study; in the collection, analyses, or interpretation of data; in the writing of the manuscript, or in the decision to publish the results.
References
- Department for Environment, Food and Rural Affairs. Local Authority Collected Waste Generation from April 2000 to March 2020 (England and Regions) and Local Authority Data April 2019 to March 2020. Available online: https://www.gov.uk/government/statistical-data-sets/env18-local-authority-collected-waste-annual-results-tables (accessed on 1 March 2021).
- Department for Environment, Food and Rural Affairs, Local Authority Collected Waste Generation from April 2000 to March 2018 (England and Regions) and Local Authority data April 2017 to March 2018. Available online: https://www.gov.uk/government/statistical-data-sets/env18-local-authority-collected-waste-annual-results-tables (accessed on 1 March 2021).
- Chartered Institution of Waste Management and Ricardo-AEA. Waste on the Front Line—Challenges and Innovations; The impacts of austerity across local authority waste recycling and street cleansing services; CIWM: Northampton, UK, 2015. [Google Scholar]
- Coggins, C. Who is the recycler? J. Waste Manag. Resour. Recovery 1994, 1, 69–75. [Google Scholar]
- Department for Environment, Food and Rural Affairs. Our Waste, Our Resources: A Strategy for England; HM Government: London, UK, 2018. [Google Scholar]
- Waste Resources Action Programme. Barriers to Recycling: A Review of Evidence since 2008; WRAP: Banbury, UK, 2014. [Google Scholar]
- Granath Hansson, A.; Lundgren, B. Defining Social Housing: A Discussion on the Suitable Criteria. Hous. Theory Soc. 2019, 36, 149–166. [Google Scholar] [CrossRef] [Green Version]
- Ministry of Housing, Communities and Local Government. English Housing Survey Profile and Condition of the English Housing stock, 2018–19; HMSO: London, UK, 2020. [Google Scholar]
- Department of Communities and Local Government. English Housing Survey Housing Stock Report 2008; DCLG: London, UK, 2010. [Google Scholar]
- Office for National Statistics. 2011 Census: Key Statistics and Quick Statistics for Local Authorities in the United Kingdom; ONS: London, UK, 2014. [Google Scholar]
- Lakhan, C. Out of sight, out of mind: Issues and obstacles to recycling in Ontario’s multi residential buildings. Resour. Conserv. Recycl. 2016, 108, 1–9. [Google Scholar] [CrossRef]
- Yau, Y. Stakeholder Engagement in Waste Recycling in a High-Rise Setting. Sust. Dev. 2012, 20, 115–127. [Google Scholar] [CrossRef]
- Rispo, A.; Williams, I.D.; Shaw, P.J. Source segregation and food waste prevention activities in high-density households in a deprived urban area. Waste Manag. 2015, 44, 15–27. [Google Scholar] [CrossRef] [PubMed]
- DiGiacomo, A.; Wu, D.W.L.; Lenkic, P.; Fraser, B.; Zhao, J.; Kingstone, A. Convenience improves composting and recycling rates in high density residential buildings. J. Environ. Plan. Manag. 2018, 61, 309–331. [Google Scholar] [CrossRef]
- Dupré, M. The comparative effectiveness of persuasion, commitment and leader block strategies in motivating sorting. Waste Manag. 2014, 34, 730–737. [Google Scholar] [CrossRef]
- Ng, S.L. An assessment of multi-family dwelling recycling in Hong Kong: A managerial perspective. Waste Manag. 2019, 89, 294–302. [Google Scholar] [CrossRef]
- Huang, Y.Y.; Tamas, P.A.; Harder, M.K. Information with a smile—Does it increase recycling? J. Clean. Prod. 2018, 178, 947–953. [Google Scholar] [CrossRef]
- Dai, Y.C.; Gordon, M.P.R.; Ye, J.Y.; Xu, D.Y.; Lin, Z.Y.; Robinson, N.K.L.; Woodard, R.; Harder, M.K. Why doorstepping can increase household waste recycling. Resour. Conserv. Recycl. 2015, 102, 9–19. [Google Scholar] [CrossRef] [Green Version]
- Pedersen, J.T.S.; Manhice, H. The hidden dynamics of household waste separation: An anthropological analysis of user commitment, barriers, and the gaps between a waste system and its users. J. Clean. Prod. 2020, 242, 116–285. [Google Scholar] [CrossRef]
- Ando, A.W.; Gosselin, A.Y. Recycling in multifamily dwellings: Does convenience matter? Econ. Inq. 2005, 43, 426–438. [Google Scholar] [CrossRef]
- De Young, R.; Boerschig, S.; Carney, S.; Dillenbeck, A.; Elster, M.; Horst, S.; Kleiner, B.; Thomson, B. Recycling in Multi-Family Dwellings: Increasing Participation and Decreasing Contamination. Popul. Environ. 1995, 16, 253–267. [Google Scholar] [CrossRef]
- Green Alliance. Towering Ambitions: Transforming High Rise Housing into Sustainable Home; Green Alliance: London, UK, 2012. [Google Scholar]
- McQuaid, R.W.; Murdoch, A.R. Recycling policy in areas of low income and multi-storey housing. J. Environ. Plan. Manag. 1996, 39, 545–562. [Google Scholar] [CrossRef] [Green Version]
- Ordoñez, I.; Harder, R.; Nikitas, A.; Rahe, U. Waste sorting in apartments: Integrating the perspective of the user. J. Clean. Prod. 2015, 106, 669–679. [Google Scholar] [CrossRef] [Green Version]
- Ng, S.L. Predicting multi-family dwelling recycling behaviors using structural equation modelling: A case study of Hong Kong. Resour. Conserv. Recycl. 2019, 149, 468–478. [Google Scholar] [CrossRef]
- Freedman, J. Crowding and Behavior; WH Freeman and Co: San Francisco, CA, USA, 1975. [Google Scholar]
- Sherrod, D.R.; Cohen, S. Density, personal control and design. In Residential Crowding and Design; Aiello, J.R., Ed.; Plenum: New York, NY, USA, 1976; pp. 217–227. [Google Scholar]
- Benton, C.H.; Fox, R. Commingled recycling tested in apartments. Resour. Recycl. 1990, 9, 48–50. [Google Scholar]
- Read, A. “A weekly doorstep recycling collection, I had no idea we could!” Overcoming the local barriers to participation. Resour. Conserv. Recycl. 1999, 26, 217–249. [Google Scholar] [CrossRef]
- Burn, S.M. Social psychology and the stimulation of recycling behaviors: The block leader approach. J. Appl. Soc. Psychol. 1991, 21, 611–629. [Google Scholar] [CrossRef] [Green Version]
- Christie, B.; Waller, V. Community learnings through residential composting in apartment buildings. J. Environ. Educ. 2019, 50, 97–112. [Google Scholar] [CrossRef]
- Waste Watch. Recycling on Estates; Waste Watch: London, UK, 1996. [Google Scholar]
- Li, J.; Huang, Y.Y.; Harder, M.K. Incentives for food waste diversion: Exploration of a long term successful Chinese city residential scheme. J. Clean. Prod. 2017, 156, 491–499. [Google Scholar] [CrossRef]
- Harder, M.K.; Woodard, R. Systematic studies of shop and leisure voucher incentives for household recycling. Resour. Conserv. Recycl. 2007, 51, 732–753. [Google Scholar] [CrossRef]
- AEA Technology. Evaluation of Local Authority Experience of Operating Household Waste Incentives Schemes. A Report Produced for DEFRA Waste Strategy Division; AEA Technology: Didcot, UK, 2005. [Google Scholar]
- Waste Resources Action Programme. Guidance for on-Site Treatment of Organic Waste from the Public and Hospitality Sectors; WRAP: Banbury, UK, 2013. [Google Scholar]
- Creswell, J.; Miller, D. Determining Validity in Qualitative Inquiry. Theory Pract. 2000, 39, 124–130. [Google Scholar] [CrossRef]
- Baxter, P.; Jack, S. Qualitative Case Study Methodology: Study Design and Implementation for Novice Researchers. Qual. Rep. 2008, 13, 544–559. [Google Scholar] [CrossRef]
- Waste Resources Action Programme. Guide Bring Banks; WRAP: Banbury, UK, 2013. [Google Scholar]
- Waste Resources Action Programme. Material Bulk Densities Report; WRAP: Banbury, UK, 2010. [Google Scholar]
- Waste Resources Action Programme. Monitoring and Evaluation Guidance; WRAP: Banbury, UK, 2011. [Google Scholar]
- Xu, D.Y.; Lin, X.Y.; Gordon, M.P.R.; Robinson, N.K.L.; Harder, M.K. Perceived key elements of a successful residential food waste sorting program in urban apartments: Stakeholder views. J. Clean. Prod. 2016, 134, 362–370. [Google Scholar] [CrossRef] [Green Version]
- Great Britain. Household Waste Recycling Act; HMSO: London, UK, 2003. [Google Scholar]
Figure 1.
Indicators for evaluating the impact of interventions.

Figure 2.
Percentage point difference in recycling rates in the final data compared to the baseline (sample for 33 sites that had recycling at the baseline).
Figure 2.
Percentage point difference in recycling rates in the final data compared to the baseline (sample for 33 sites that had recycling at the baseline).


Table 1.
Breakdown of the project by numbers of sites, flats, and residents.
| Category | Sites | Flats | Residents | ||||
|---|---|---|---|---|---|---|---|
| Total | Total | Median Flats per Site | St. Dev | Total | Median Residents per Site | St. Dev | |
| Recognition | 24 | 759 | 30 | 15 | 947 | 39 | 16 |
| Control | 19 | 637 | 32 | 20 | 804 | 39 | 26 |
| Total | 43 | 1396 | - | - | 1751 | - | - |
Table 2.
Overview of the workshop activities.
| Activity | Detail |
|---|---|
| Introduction | As residents walked into the room, they were greeted by a projection of a large image of their own site and the neighbouring environment with the strap line ‘Waste Its Mine Its Yours’™®, to set a personal, community-responsive tone for the project. |
| Singalong | Once the project had been introduced, the importance and historical relevance of the ‘bin man’ was brought back to life by a humorous re-enactment and role play of the song “My old Man’s a Dustman”, a famous song in British popular culture. The lyrics were changed in a fun way to relate to how residents could have been managing their waste. Those who remembered the song were encouraged to sing along spontaneously. This was an important component to help break the ice and engage with residents. |
| Presentation | An interactive presentation was given by the project team, which included role play to highlight the following: waste issues at the global through to the local level and, finally, at their specific site, the impacts of waste, and consideration of each tier of the waste hierarchy, including the importance of recycling quality. |
| Challenges and solutions | Residents were encouraged to share problems and challenges that they experienced regarding the waste services on site, as well as to provide ideas and practical solutions. This included consideration of materials that they were currently throwing out that could be reused or recycled and sharing knowledge on how to reduce waste. This activity empowered the development of an action plan bespoke to each site. |
| Demonstration of composter | The workshop contained information on food waste, including the environmental and social impacts. Participants shared ideas on how to reduce levels. A Green Johanna food waste composter (see [36] for more information) set up in the room was unveiled, information was shared on how it worked, and samples of compost were provided. Residents were asked if they thought composters on site would be useful. On positive affirmation, composters were installed on site in areas identified as best suited by the residents and the project team. Residents who were enthusiastic to compost were handed their own free food waste caddies and food waste data recording sheets. It was made clear to residents that their participation was voluntary, but they were encouraged to ‘give it a go’. |
Table 3.
Response rates to the resident behaviour surveys.
| Stage of Project | Control | Recognition |
|---|---|---|
| Baseline (before any engagement) | 118 (31.6%) | 321 (42.3%) |
| Follow-up (3 months after workshop) | 159 (25.0%) | 178 (23.5%) |
| Final (at end of project) | 104 (16.3%) | 194 (25.6%) |
Table 4.
Evaluation of the changes by the end of project in comparison with the baseline.
| Category | Recognition | Control | |
|---|---|---|---|
| Number of Sites | 18 | 15 | |
| Indicator #1: Increase Recycling | |||
| Median recycling rate % | Baseline | 29.0 | 31.3 |
| Final | 39.4 | 26.8 | |
| Percentage point difference | +10.4 | −4.5 | |
| Highest increase over baseline | +65.5 | +23.0 | |
| Highest reduction over baseline | −10.8 | −43.9 | |
| Standard deviation | 17.7 | 14.7 | |
| Median weight of recycling collected—kg per week | Baseline | 68.2 | 60.8 |
| Final | 84.0 | 55 | |
| Kg difference/site | +15.8 | −5.8 | |
| Kg difference/flat | +0.5 | −0.2 | |
| Indicator #4: Reduce Residual Waste Generated for Collection | |||
| Median residual waste collected—kg per week | Baseline | 149.0 | 128.9 |
| Final | 127.7 | 159.6 | |
| Kg difference/site | −21.3 | +31.6 | |
| Kg difference/flat | −0.4 | +0.1 | |
Table 5.
Changes in claimed behaviour by the end of the project compared to the baseline.
| % Agreeing with the Following Statements: Final Survey | Percentage Point Change Over Baseline (N/a Denotes That the Question Was Not Asked at Baseline) | |||
|---|---|---|---|---|
| Recognition | Control | Recognition | Control | |
| Indicator #2: Increase participation | ||||
| I don’t recycle anything | 3 | 33 | −13.4 | +25.0 |
| I try to recycle as much as possible | 88 | 60 | +14.1 | −1.3 |
| I am recycling more compared to last year | 80 | 39 | N/a | N/a |
| I don’t know what can be recycled here | 5 | 16 | −32.3 | +0.3 |
| Satisfied with waste services | 86 | 53 | +22.3 | −1.2 |
| Indicator #3: Increase quality of recycling | ||||
| It is important to wash out cans and bottles before recycling | 85 | 33 | +19.9 | −18.1 |
| Are you better at washing things out before putting them in recycling compared to at the project’s commencement? | 17 | 1.0 | N/a | N/a |
| Indicator #4: Reduce residual waste | ||||
| I recycle most of my food waste | 58 | 16 | +36.4 | +6.4 |
| I know a great deal about turning food waste into compost | 22 | 0 | +16.4 | -2.5 |
| Satisfied with waste services | 86 | 53 | +22.3 | −1.2 |
| Indicator #5: Increase social cohesion | ||||
| I take part in community activities here often/sometimes | 69 | 58 | +23 | +14 |
Table 6.
Overview of the changes in contamination levels recorded during the project.
| Category | Sites (33) | Increase in Contamination over Baseline (Sites) | No Change (Sites) | Reduction in Contamination over Baseline (Sites) | Average Score at End of Project |
|---|---|---|---|---|---|
| Recognition | 11 | 3 | 3 | 5 | 0.9 |
| Control | 12 | 3 | 7 | 2 | 1.6 |
Publisher’s Note: MDPI stays neutral with regard to jurisdictional claims in published maps and institutional affiliations. |
© 2021 by the authors. Licensee MDPI, Basel, Switzerland. This article is an open access article distributed under the terms and conditions of the Creative Commons Attribution (CC BY) license (https://creativecommons.org/licenses/by/4.0/).
Share and Cite
MDPI and ACS Style
Woodard, R.; Rossouw, A. An Evaluation of Interventions for Improving Pro-Environmental Waste Behaviour in Social Housing. Sustainability 2021, 13, 7272. https://0-doi-org.brum.beds.ac.uk/10.3390/su13137272
AMA Style
Woodard R, Rossouw A. An Evaluation of Interventions for Improving Pro-Environmental Waste Behaviour in Social Housing. Sustainability. 2021; 13(13):7272. https://0-doi-org.brum.beds.ac.uk/10.3390/su13137272
Chicago/Turabian StyleWoodard, Ryan, and Anthea Rossouw. 2021. "An Evaluation of Interventions for Improving Pro-Environmental Waste Behaviour in Social Housing" Sustainability 13, no. 13: 7272. https://0-doi-org.brum.beds.ac.uk/10.3390/su13137272
Note that from the first issue of 2016, this journal uses article numbers instead of page numbers. See further details here.