
Experimental Study of Thermal Response of Vertically Loaded Energy Pipe Pile

College of Water Conservancy & Engineering, Zhengzhou University, Zhengzhou 450001, China
*
Author to whom correspondence should be addressed.
Sustainability 2021, 13(13), 7411; https://0-doi-org.brum.beds.ac.uk/10.3390/su13137411
Submission received: 22 May 2021
/
Revised: 16 June 2021
/
Accepted: 21 June 2021
/
Published: 2 July 2021
(This article belongs to the Special Issue Advances in Geotechnical Engineering during Deep Energy Exploitation)
Abstract
:Energy piles are a relatively new technology that have dual function as heat transferring and load bearing. Due to the influence of temperature cycles, additional thermal stress and relative displacement of the pile will be generated; this is different from the load transferring mechanism of the conventional pile. In order to study the thermodynamic characteristics of the energy pipe pile under dual working conditions and temperature cycles, field tests were carried out on the PHC (prestressed high-strength concrete) energy pipe pile without constraining on the top of the piles. Displacement gauges were arranged on the top of the pile, and concrete strain gauges (temperature, strain) were embedded in the pile. The variation laws of temperature, thermal strain, thermal stress, side friction resistance, and displacement of the pile top during the temperature cycling were analyzed. The test results show that the heat exchange system reached a stable state after being heated for 5 days in summer. The average temperature of the pile increased by 15.17 °C, to 34.68 °C; it was low at both ends and high in the middle part. After 5 days in the winter environment, the average temperature of the pile decreased by 10.09 °C, to 9.54 °C, which was high at both ends and low in the middle. The thermal stress was generated inside the pile, and the maximum compressive stress was 3.446 MPa and the maximum tensile stress was 2.69 MPa. The neutral point of the side friction resistance appeared 8 m below the pile top, about 2/3 of the pile length. The maximum negative side friction resistance under the summer condition was 42.06 KPa, the maximum positive side friction resistance under the winter condition was 29.93 KPa, and the lateral resistance of the pile degraded in winter. Under the influence of thermal load, the final pile top displacements in the summer and winter were −0.7 mm (0.175%D) and 0.77 mm (0.193%D), respectively.
1. Introduction
Energy piles are a relatively new technique of building that are energy saving, have an economic benefit, and environment-friendly advantages. The ground source heat pump heat exchange tubes are embedded in the pile foundations of traditional buildings to provide heat exchange and cooling for the upper building space. Compared with traditional ground source heat pump systems, it can take full use of the larger thermal conductivity of concrete and the contact area with the surrounding soil to improve heat exchange efficiency and save underground space resources, and it has been implemented in many countries [1,2,3,4].
The energy pile plays the dual role of heat exchanging with the surrounding soil and bearing the load of the superstructure. At present, researchers mainly focus on heat transferring efficiency and mechanical property. Many previous studies only focused on underground thermal energy utilization and heat transferring efficiency of the heat pump system, but studying the mechanical performance of the energy pile under the impact of varying temperatures is limited. Some investigations of the field energy pile have been conducted while subjecting it to monotonic heating or cooling [5,6,7,8,9,10,11,12,13,14,15,16,17]. Laloui et al. [5] conducted a field test on a cast-in-place energy pile located in the Lausanne Institute of Technology; it was found that its average temperature was raised by 1 °C, generating an additional axial force of 100 kN. Similarly, Bourne-Webb et al. [6] found the ultimate lateral resistance was 75 Kpa under the impact of temperature cycling, which was slightly lower than the average ultimate lateral resistance of the London clay, of 90 Kpa. Murphy et al. [8] found that when the pile temperature increased by 18 °C, the maximum compressive stress was 4.0~5.1 MPa, which is about 25% of the compressive strength of concrete. Sung et al. [13] conducted an in-situ thermal response test on the cast-in-place pile, with the pile top on the gneiss; when the pile body was heated, the maximum temperature compressive stress was about 2.6 MPa, which is 10% of the design value of the concrete compressive strength. Murphy and McCartney [10] have numerically investigated seasonal temperature variation, and it was observed that the mobilized side shear stresses nonlinearly change with the depth; the magnitudes of thermomechanical axial stresses were observed to increase most greatly near the toe of both foundations while being heated. Fewer field-scale evaluations on radial thermal reactions of energy pile were conducted [11,14,15]. It is found that the axial strain of the pile is smaller than the radial strain when the pile body expands or contracts. The radial thermal strain is close to those corresponding to free thermal expansion/contraction, indicating that the soil can provide minimal resistance to radial thermal expansion/contraction [14].
However, the field test is always restricted by site condition, there are many uncontrollable factors, and the test period is long; so, the model test becomes a more effective method for energy pile research. Through the centrifuge test on the energy pile in the sand, Ng et al. [18,19,20] analyzed the thermal response of the energy pile under multiple temperature cycles and the development of the displacement of the pile top. The results showed that the side friction resistance of the soil around the pile changed under the action of heating and cooling cycles. By conducting indoor model tests, Yavari et al. [21] investigated the cumulative effect of the displacement of the energy pile top in saturated clay under the action of temperature cycling, and analyzed the effect of pile top load on the cumulative effect of pile top displacement; Goode et al. [22] studied the cumulative effect of pile top displacement and the influence of partial restraint on the thermodynamic characteristics of the energy pile under the impact of temperature cycling.
When the pile is heated or cooled, the contact between the soil and the pile will change, which leads to a change in the pile–soil load transferring mechanism [23,24,25,26]. It was found that the soli–concrete interface was affected by cyclic degradation, but not affected directly by temperature. Conversely, the response of the clay–concrete interface changed at different temperatures, showing an increase in strength with increasing temperature [23]. Although some scholars use the load transfer method to analyze the pile–soil load transfer, this mechanism cannot be completely understood [27,28,29,30]. Guo et al. [27], based on the ideal elastoplastic model and the hyperbolic model, proposed a new pile–soil load transfer model, considering Masing’s rule.
At present, the experimental research of energy pile is mainly focused on the cast-in-place pile in the summer, and nearly without in-situ experimental researches on the PHC energy pile under dual working conditions and temperature cycling conditions. The PHC pipe pile has the characteristics of convenient construction, low cost, strong ability to penetrate the soil, and wide applications. It can be applied to the foundation treatment, industrial workshops, and multi-story and high-rise buildings. In order to study the thermal response characteristics of PHC energy pipe pile under temperature cycling conditions, through field thermal response tests, PHC energy pipe pile in layered soil was chosen as the research object in this paper, and the pile body force and lateral friction resistance were analyzed; besides, the change in top pile displacement is able to provide reference and basis for the design and application of similar PHC energy pipe piles.
2. Field Test Details
2.1. Geological Conditions
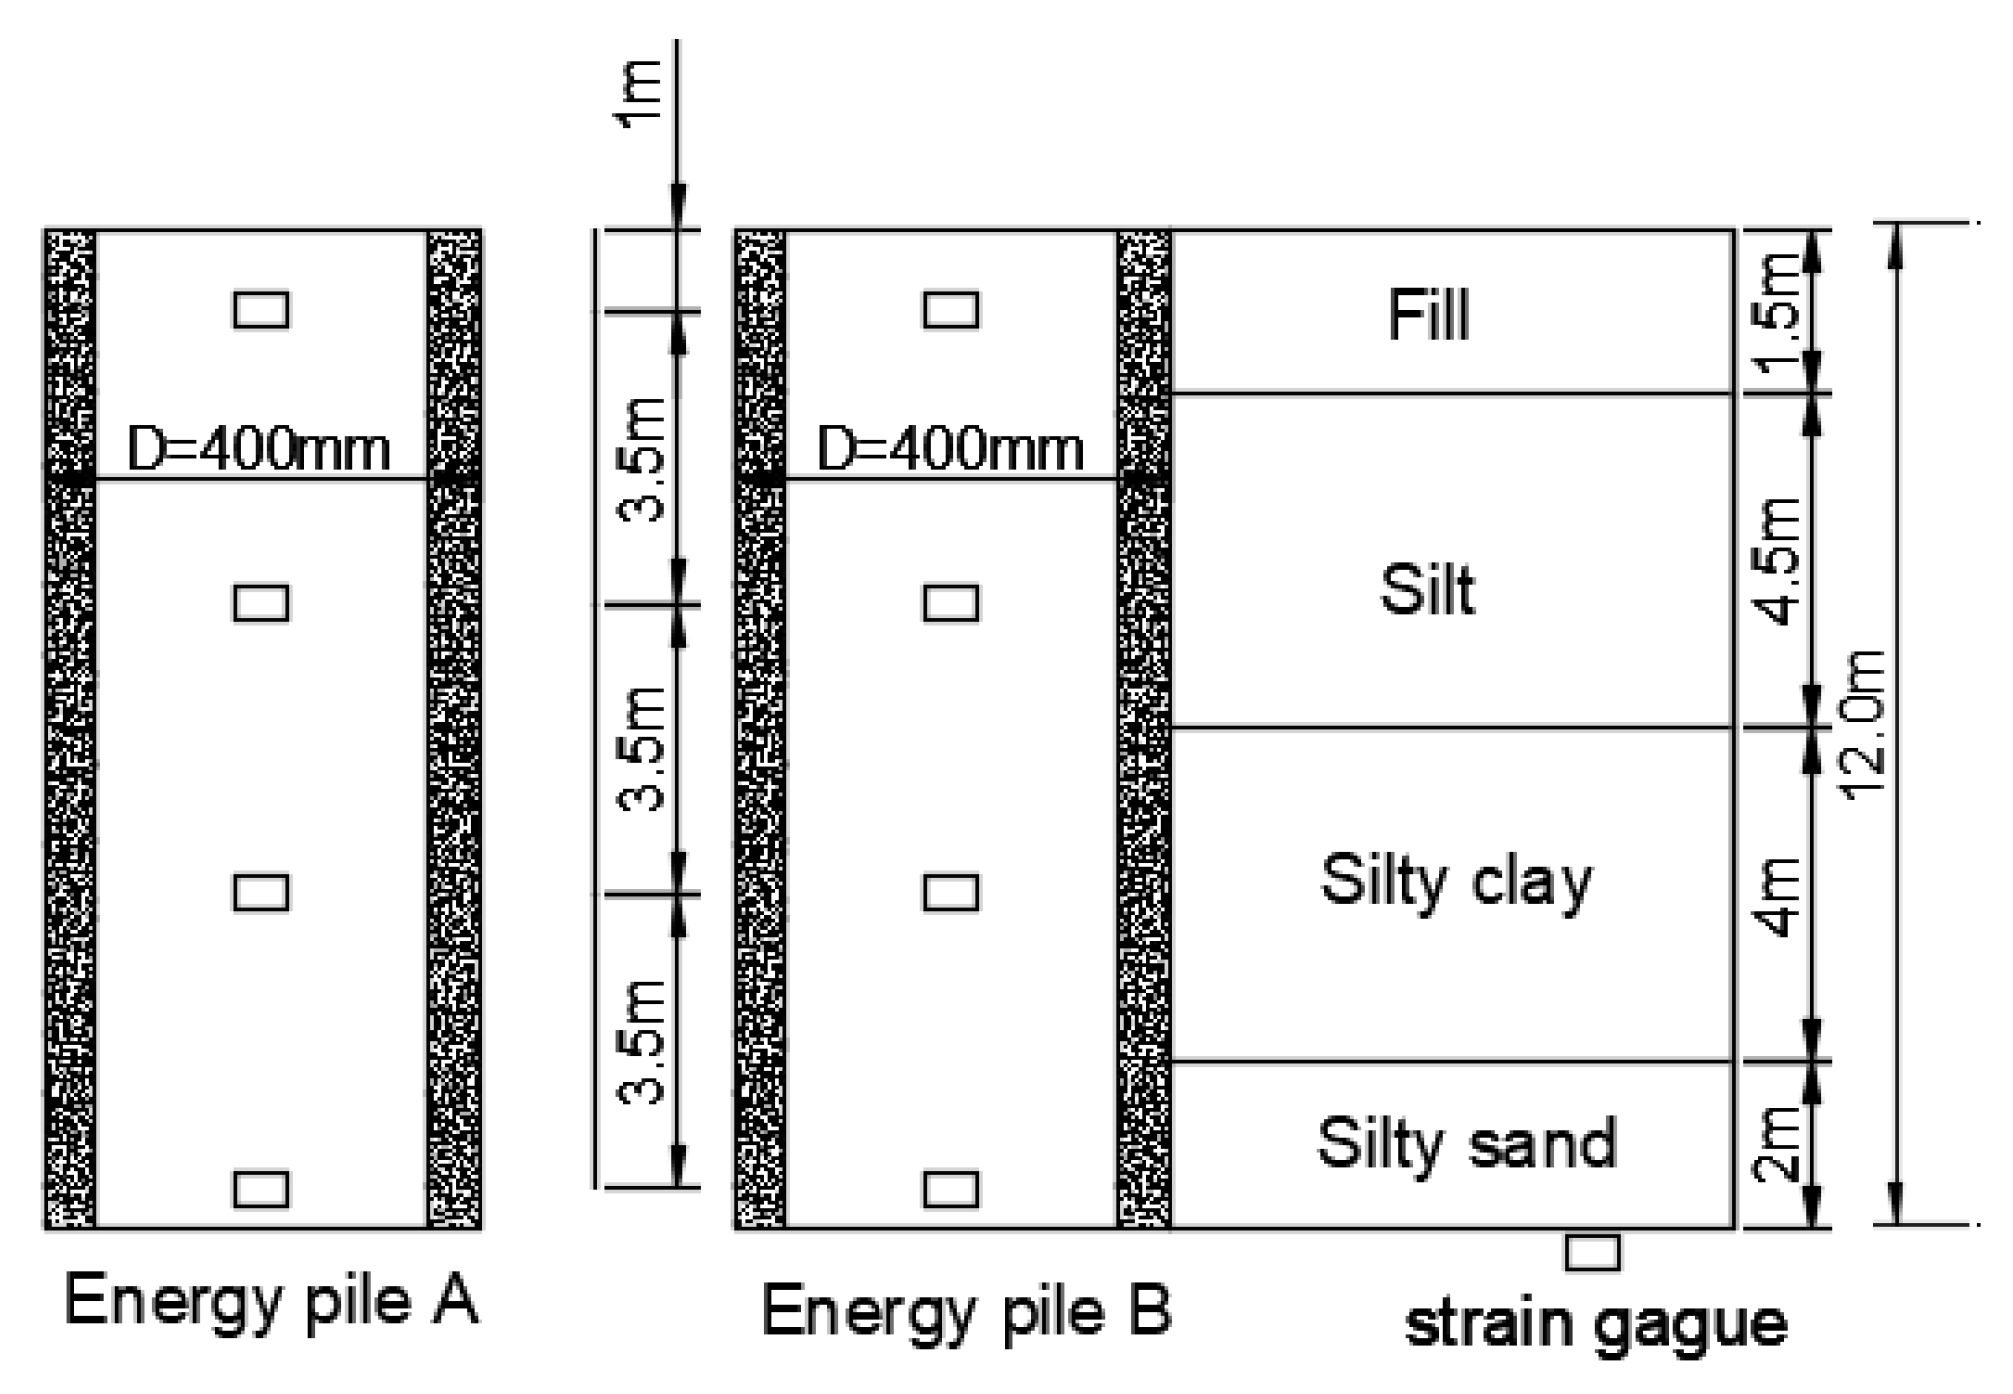
The site of the experiment was located in Zhoukou, Henan province of China. The soil is mainly silty clay and silt. According to the results of the geotechnical engineering survey, the groundwater level was found to be located in the range of 3.5 m to 3.7 m depth. The basic physical parameters of the soil were tested and shown in Table 1.
2.2. Energy Pile and Instrumentation
The PHC energy pipe piles A and B were selected, and the thermal response test of the PHC energy pipe pile in layered soil under free restraint conditions was carried out. The outer diameter and inner diameter of the test pile were 400 mm and 305 mm, respectively. The effective pile length was 12 m, and it was pressed into the soil using the method of press-in piling. The heat exchange tube is made of high-density polyethene plastic pipe, with outer and inner pipe diameters of 20 and 17.7 mm, respectively, and the hole of the pipe pile was backfilled with cement mortar to a dense state.
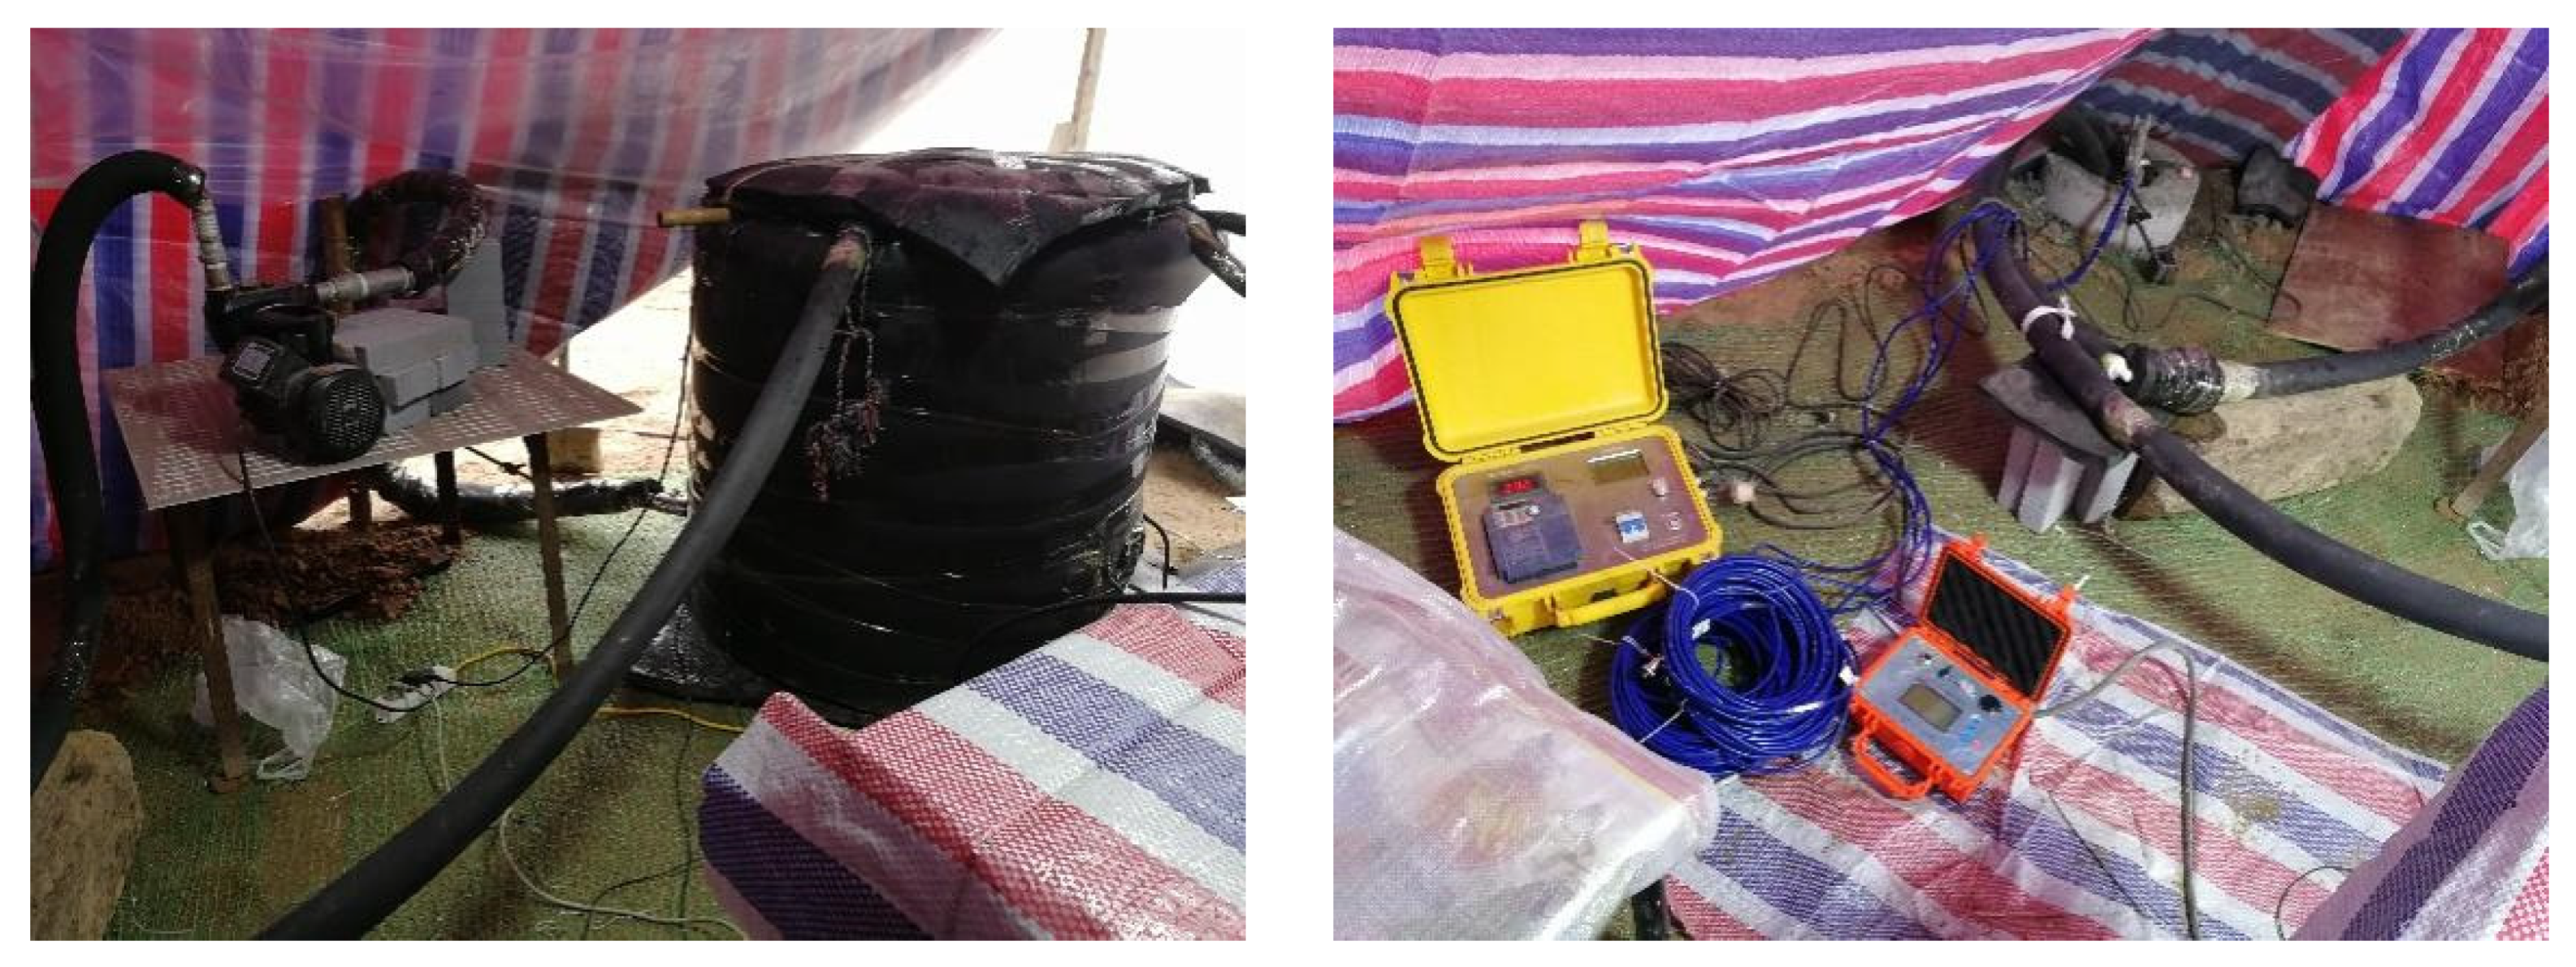
In this test, the energy pile A was heated for 120 h to simulate the summer working condition, with a constant inlet temperature of 40 °C; the energy pile B was cooled for 120 h to simulate the winter working condition, with a constant inlet temperature of 4 °C. In the test, the circulating fluid flow rate was 0.6 m/s, and the input power of the system was 1.2~1.4 KW. At the same time, two displacement gauges were symmetrically arranged on the top of the pile to measure the change in the displacement of the pile top. According to the soil distribution of the field test site, a set of concrete strain gauges of model XHX-115 were installed at 1 m, 4.5 m, 8 m and 11.5 m below the pile top, respectively, to monitor the strain and temperature variation, and the concrete strain gauges and PE heat exchange pipes were placed along the transverse direction, binding the φ12 threaded steel bars; the sensor layout is shown in. Figure 1. The picture of the test scene is shown in Figure 2. The measuring equipment used during the test are shown in Table 2.
3. Results and Discussion
3.1. Temperature Profiles along with Test Pile
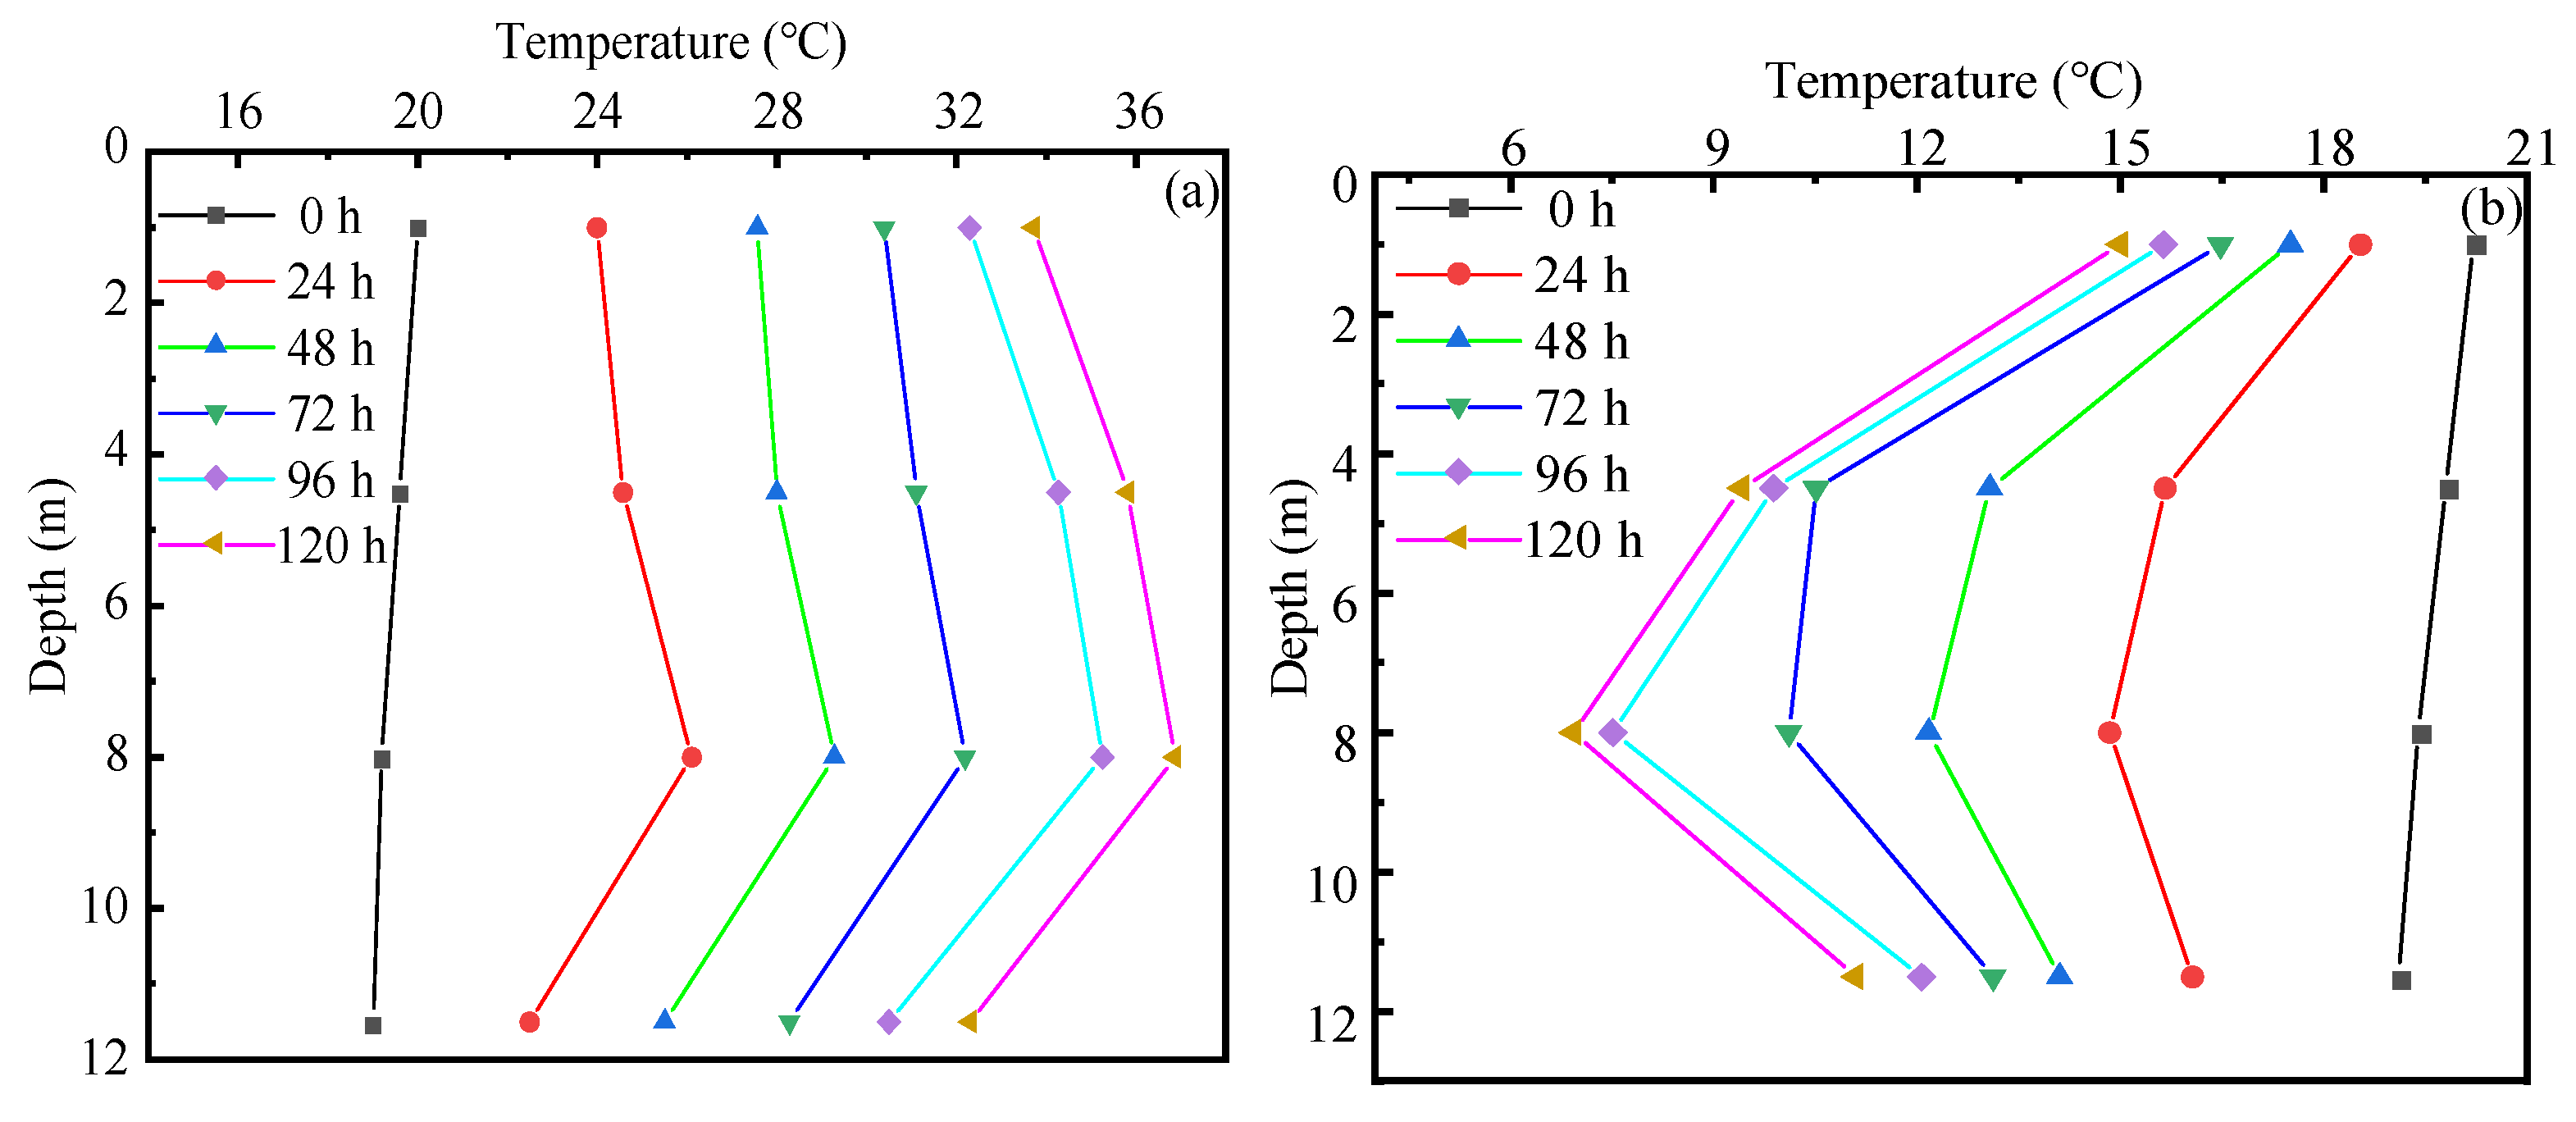
During the continuous heating, the sensors embedded in each section of the pile and the water temperature monitor at the entrance and exit are used to observe the temperature change in energy pile A and energy pile B. The temperature variation curve of the pile was updated every 24 h, as shown in Figure 3.
At the beginning of the test, the initial temperature of the soil appears to be the highest at the upper part and decreases sequentially along with the pile. As Figure 3a shows, the initial average temperature of pile A was 19.51 °C, and it rose rapidly at the beginning of the test; as the test continued, the change in the temperature gradually tended to be slow. After heating for 5 days, the average temperature of the pile increased by 15.17 °C, to 34.68 °C. It needs to be noticed that the temperature increase of each part of the pile is uneven; this is because the upper part of the pile is close to the ground surface and is easily affected by the external environment of the ground surface. Moreover, this is because the soil around the upper part of the pile is loose and the heat dissipation is perfect. It was also found that the temperature increment in the pile end was smaller than that in the top and the middle of the pile; this is due to the sandy soil layer around the pile end and its better heat diffusion performance. Therefore, the temperature distribution of the pile generally showed a trend of low at both ends and high at the middle part.
Figure 3b shows that the initial average temperature of the pile body was 19.63 °C. After 5 days, the average temperature of the pile decreased by 10.09 °C, to 9.54 °C. Because the test was in summer, the surface temperature was relatively high. Because the upper part of the pile is close to the ground surface, it is easily affected by the surface temperature. Compared with the middle part, its temperature decrease was lower; as the heat exchanged, the pile–soil temperature gradient became smaller, and the heat exchange capacity gradually decreased in the test process. The lower part of the pile had a lower temperature drop, so the lower part of the pile was higher than the middle part of the pile.
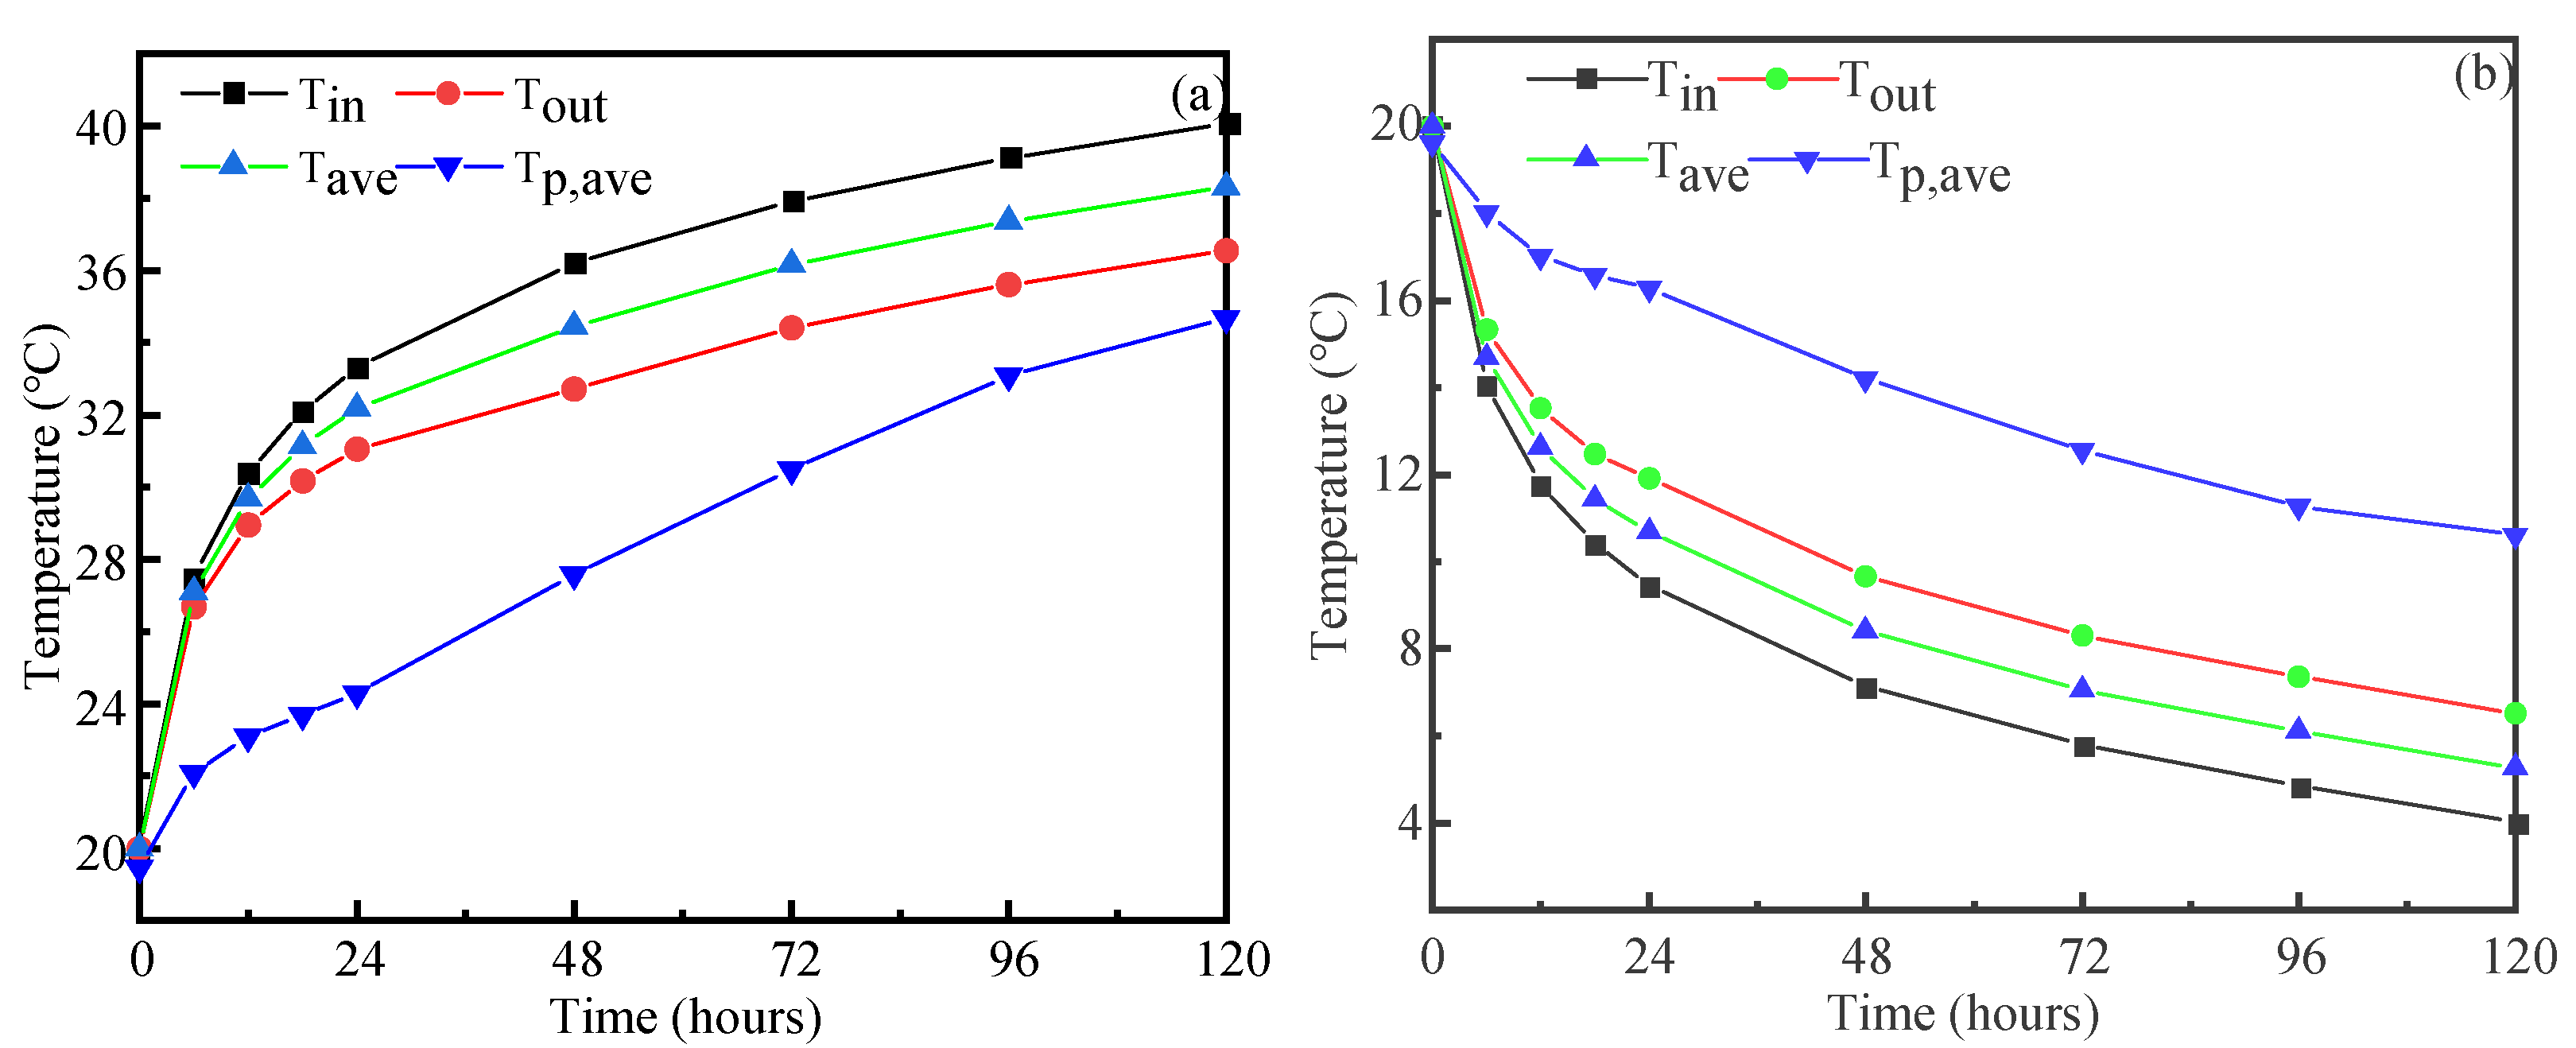
Figure 4 shows the temperature change in the water inlet and outlet of the circulating pipe during the test. It can be seen in Figure 4a that, in the summer, the temperature of the pile is always lower than the temperature of the water outlet; this is because the heat transferring process of the energy pile gradually changes from transient to steady. When the temperature of the pile was lower than the water inlet and outlet temperature, the temperature of the pile gradually increased to the temperature of the water outlet. The heat exchange reaches a steady state, and there is a similar law under the winter condition.
3.2. Thermo-Mechanical Strain Profiles along with Test Pile
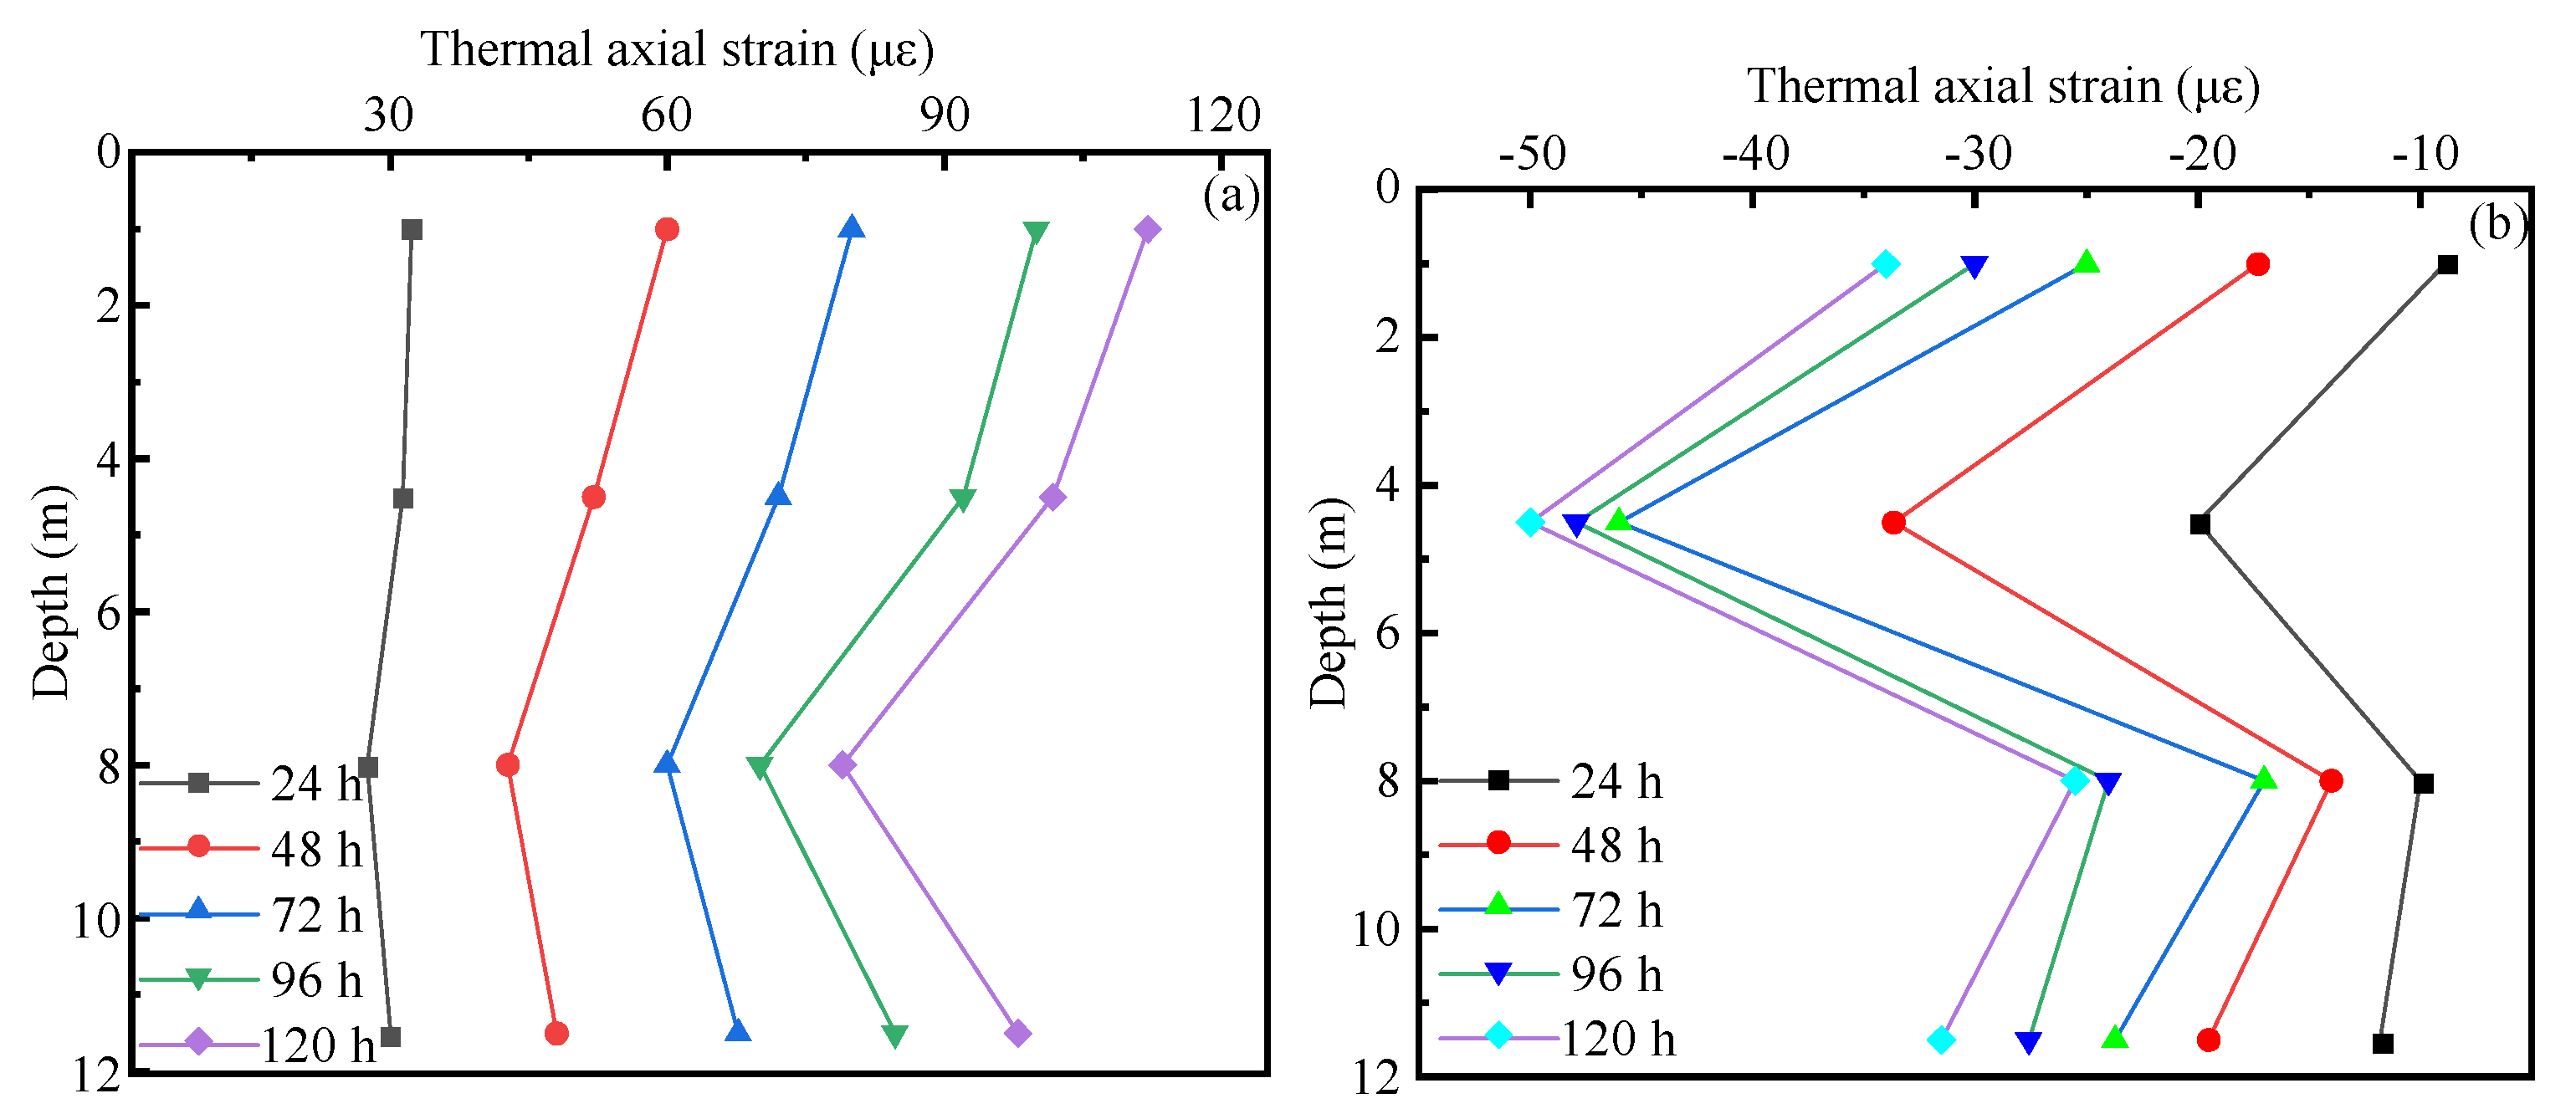
During the heating and cooling process, the pile tend to expand, stretch, or contract at both ends, but the soil around the pile restrain the pile end, while the pile top is unconstrained to expand freely, and the pile sides appear to be partially restrained; thus, corresponding restraint strains are generated.
The strain of each sensor of the pile changed every 24 h during the test in the summer and winter, which can be seen in Figure 5. It can be seen from Figure 5a that in the summer, the strain at each measuring point of energy pile B gradually increased with the time; at the same time, the strain first decreased with the depth, and then increased again, showing a distribution pattern of large at both ends and small in the middle. Because the middle of the pile is restrained by the upper part and the soil surrounding the end of the pile, its restraining stiffness is relatively large, and the strain in the middle of the pile is relatively small. By contrast, the top of the pile is free, and the soil around the upper part of the pile has less restriction on the pile, so the top of the pile is close to the state of free expansion. Moreover, the pile top is located in a dense sand layer, and the degree of restraint is stronger than the soil around the upper part of the pile. Therefore, the observed strain at 11.5 m below the pile top was smaller those that at 1 m and 4.5 m below the pile top.
It can be seen from Figure 5b that in the winter, the shrinkage strain of each measuring point of pile B gradually increased, and the shrinkage strain of the pile was generally large at both ends and small in the middle; this is because the upper and lower soil layers restrain the middle of the pile, resulting in a stronger restraint effect. Due to the same reason as that in summer, although the pile tip is located in a dense sand layer, the observed strain at 11.5 m was still larger than the pile shrinkage strain at 1 m. This is due to the large change in temperature of the 11.5 m strain. In summary, it is indicated that the strain distribution of the pile is related to the distribution of the soil around the pile and the constraint on the pile ends.
3.3. Thermo-Mechanical Stress Profiles along with Test Pile
As the temperature of the pile changed, the additional thermal stress was generated due to the constraint of the surrounding soil on the pile. The additional thermal stress at each measuring point of the pile and the corresponding strain can be calculated as follows:
where is the axial thermal strain of the pile without constraining, and is the change in temperature of the concrete at the location of the gage. The observed strain of the pile body can be obtained from the strain gauge, the is the strain of the pile body with concrete C80, which is grade from the following Chinese code classification: “Code for design of concrete structures”. It is the characteristic strength of a standard concrete cube. [31] The constraining is the linear thermal expansion coefficient of the concrete, the pile concrete strength grade is C80, , and the elastic modulus is E = 38 Gpa, assuming the elastic modulus and linear thermal expansion coefficient of the concrete to be constant for the temperatures in the paper. The sign of the measured strain was defined to be positive, which is consistent with geotechnical sign conventions [32,33,34,35,36,37,38,39,40,41].
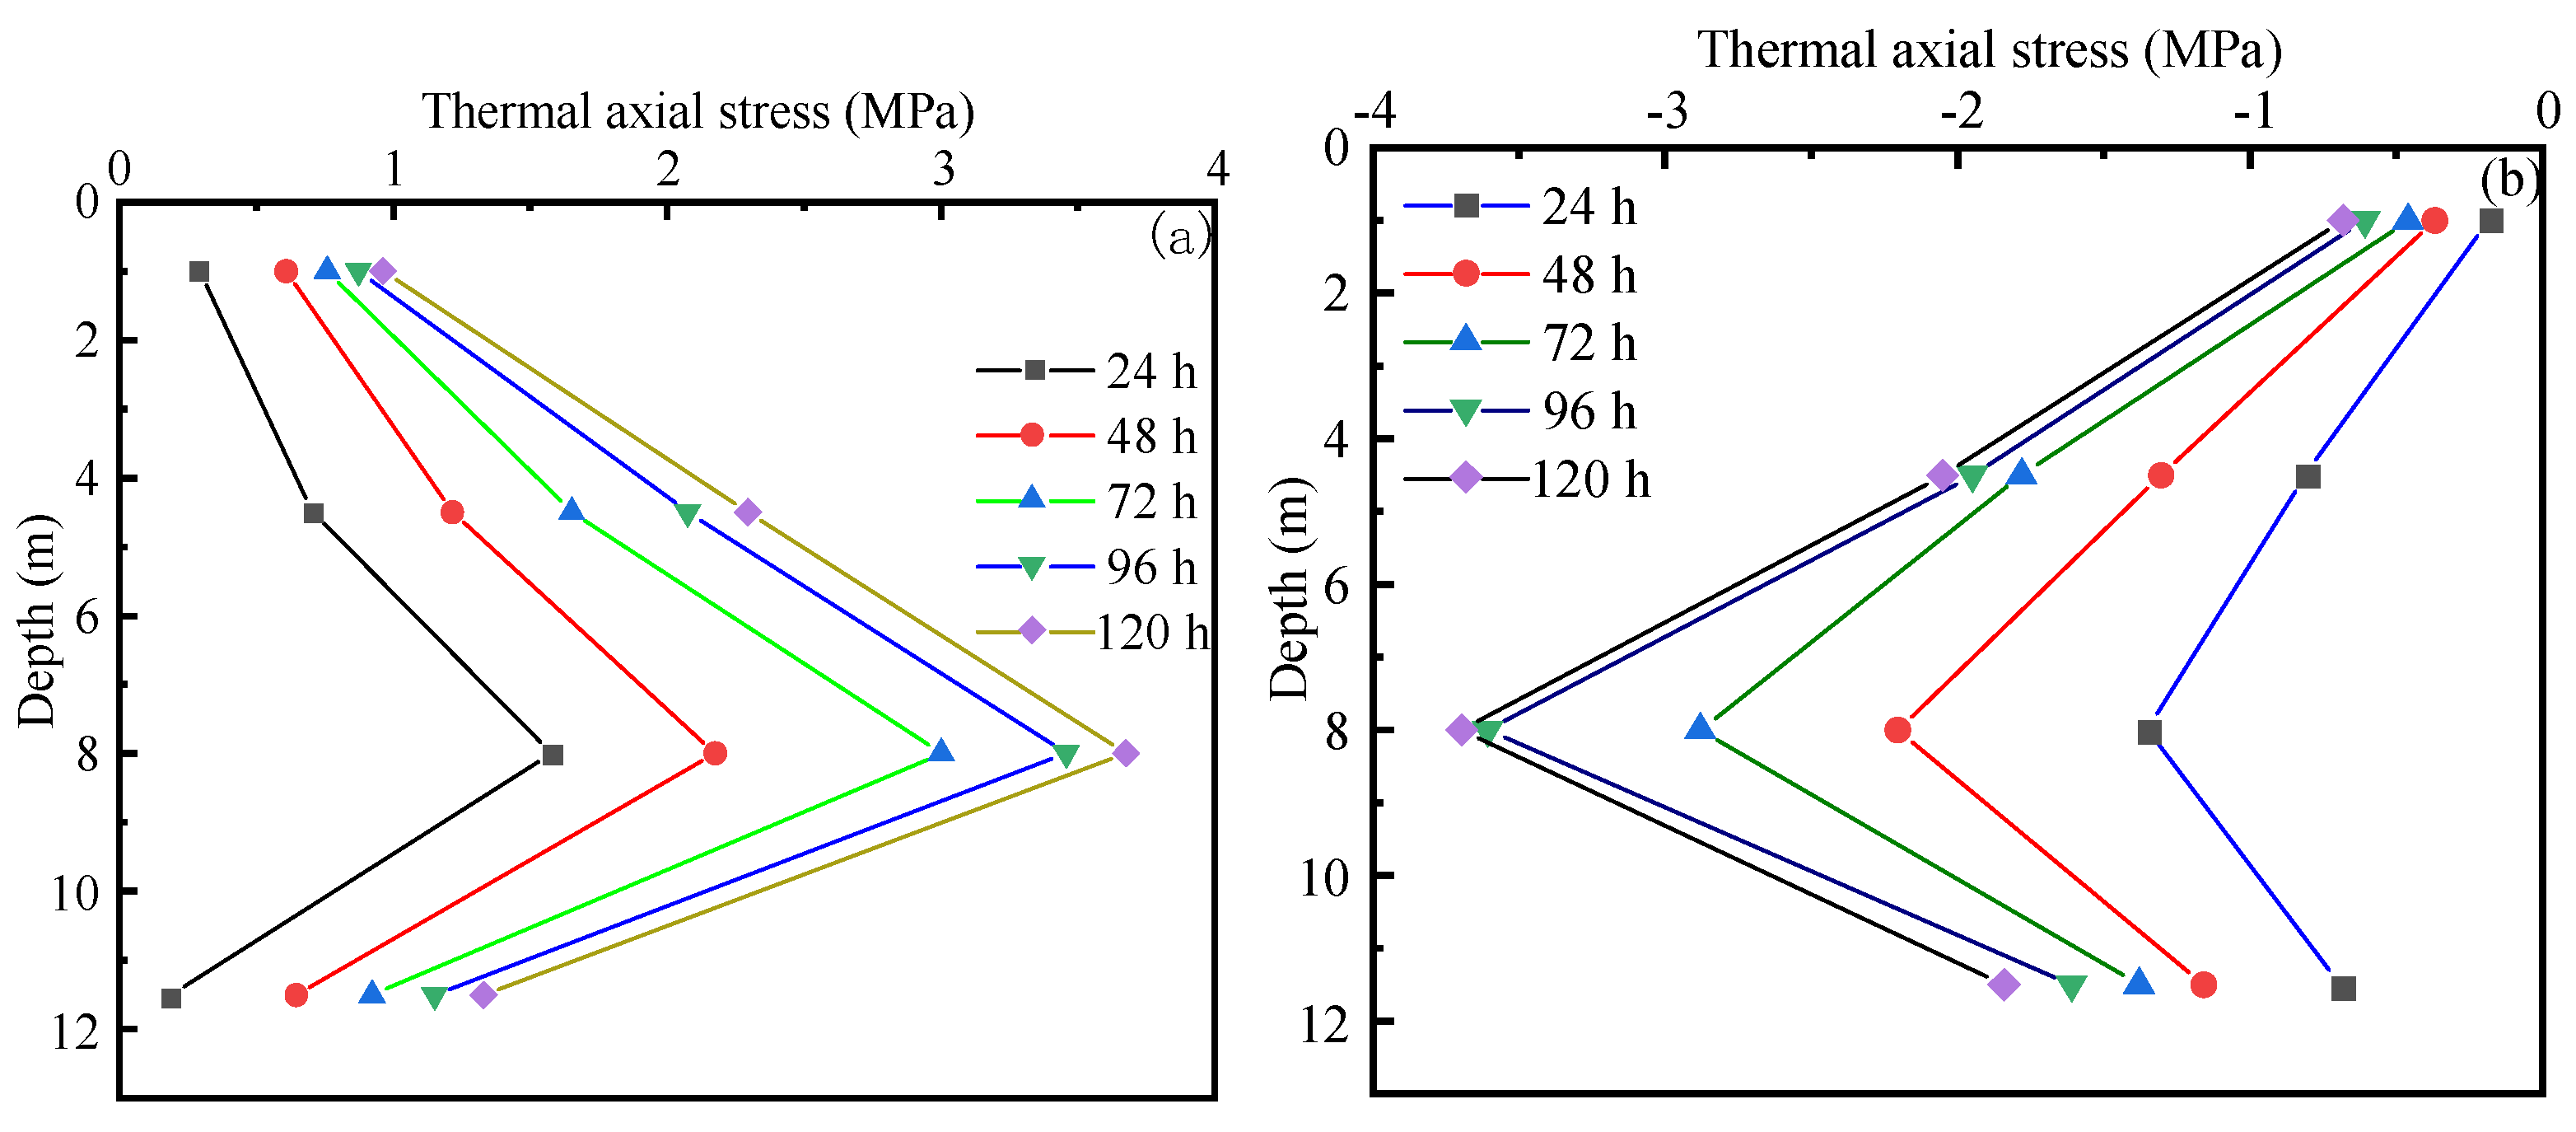
The temperature stress distribution curve of the pile is shown in Figure 6. It can be seen from Figure 6a that during the heating process, the axial thermal compressive stress of energy pile A was generated inside the pile. At 120 h, the minimum thermal compressive stress of 961.4 KPa was shown at the upper part of the pile, while the maximum thermal compressive stress of 3.446 MPa was shown at 8 m below the pile top. The thermal stress of the pile was small at both ends and large in the middle, and maintained a consistent trend during the heating process, and the position of the neutral point remains unchanged. Since the strain gauge is 11.5 m away from the pile top, and is close to the pile end, its thermal compressive stress is close to the pile top stress, which is 1.406 MPa. It can be indicated that the dense sand layer at the pile tip provided strong resistance to the pile. Consequently, the maximum thermal stress is always close to the pile tip.
Figure 6b shows that during the cooling process, the axial thermal tensile stress of energy pile B was generated inside the pile; at the end of the temperature cycle (120 h), the minimum thermal tensile stress of 831.43 KPa appeared at 1 m and the maximum thermal tensile stress of 2.69 MPa was shown at 8 m. The thermal stress of the pile was small at both ends and large in the middle, which is similar to the thermal stress distribution in the summer.
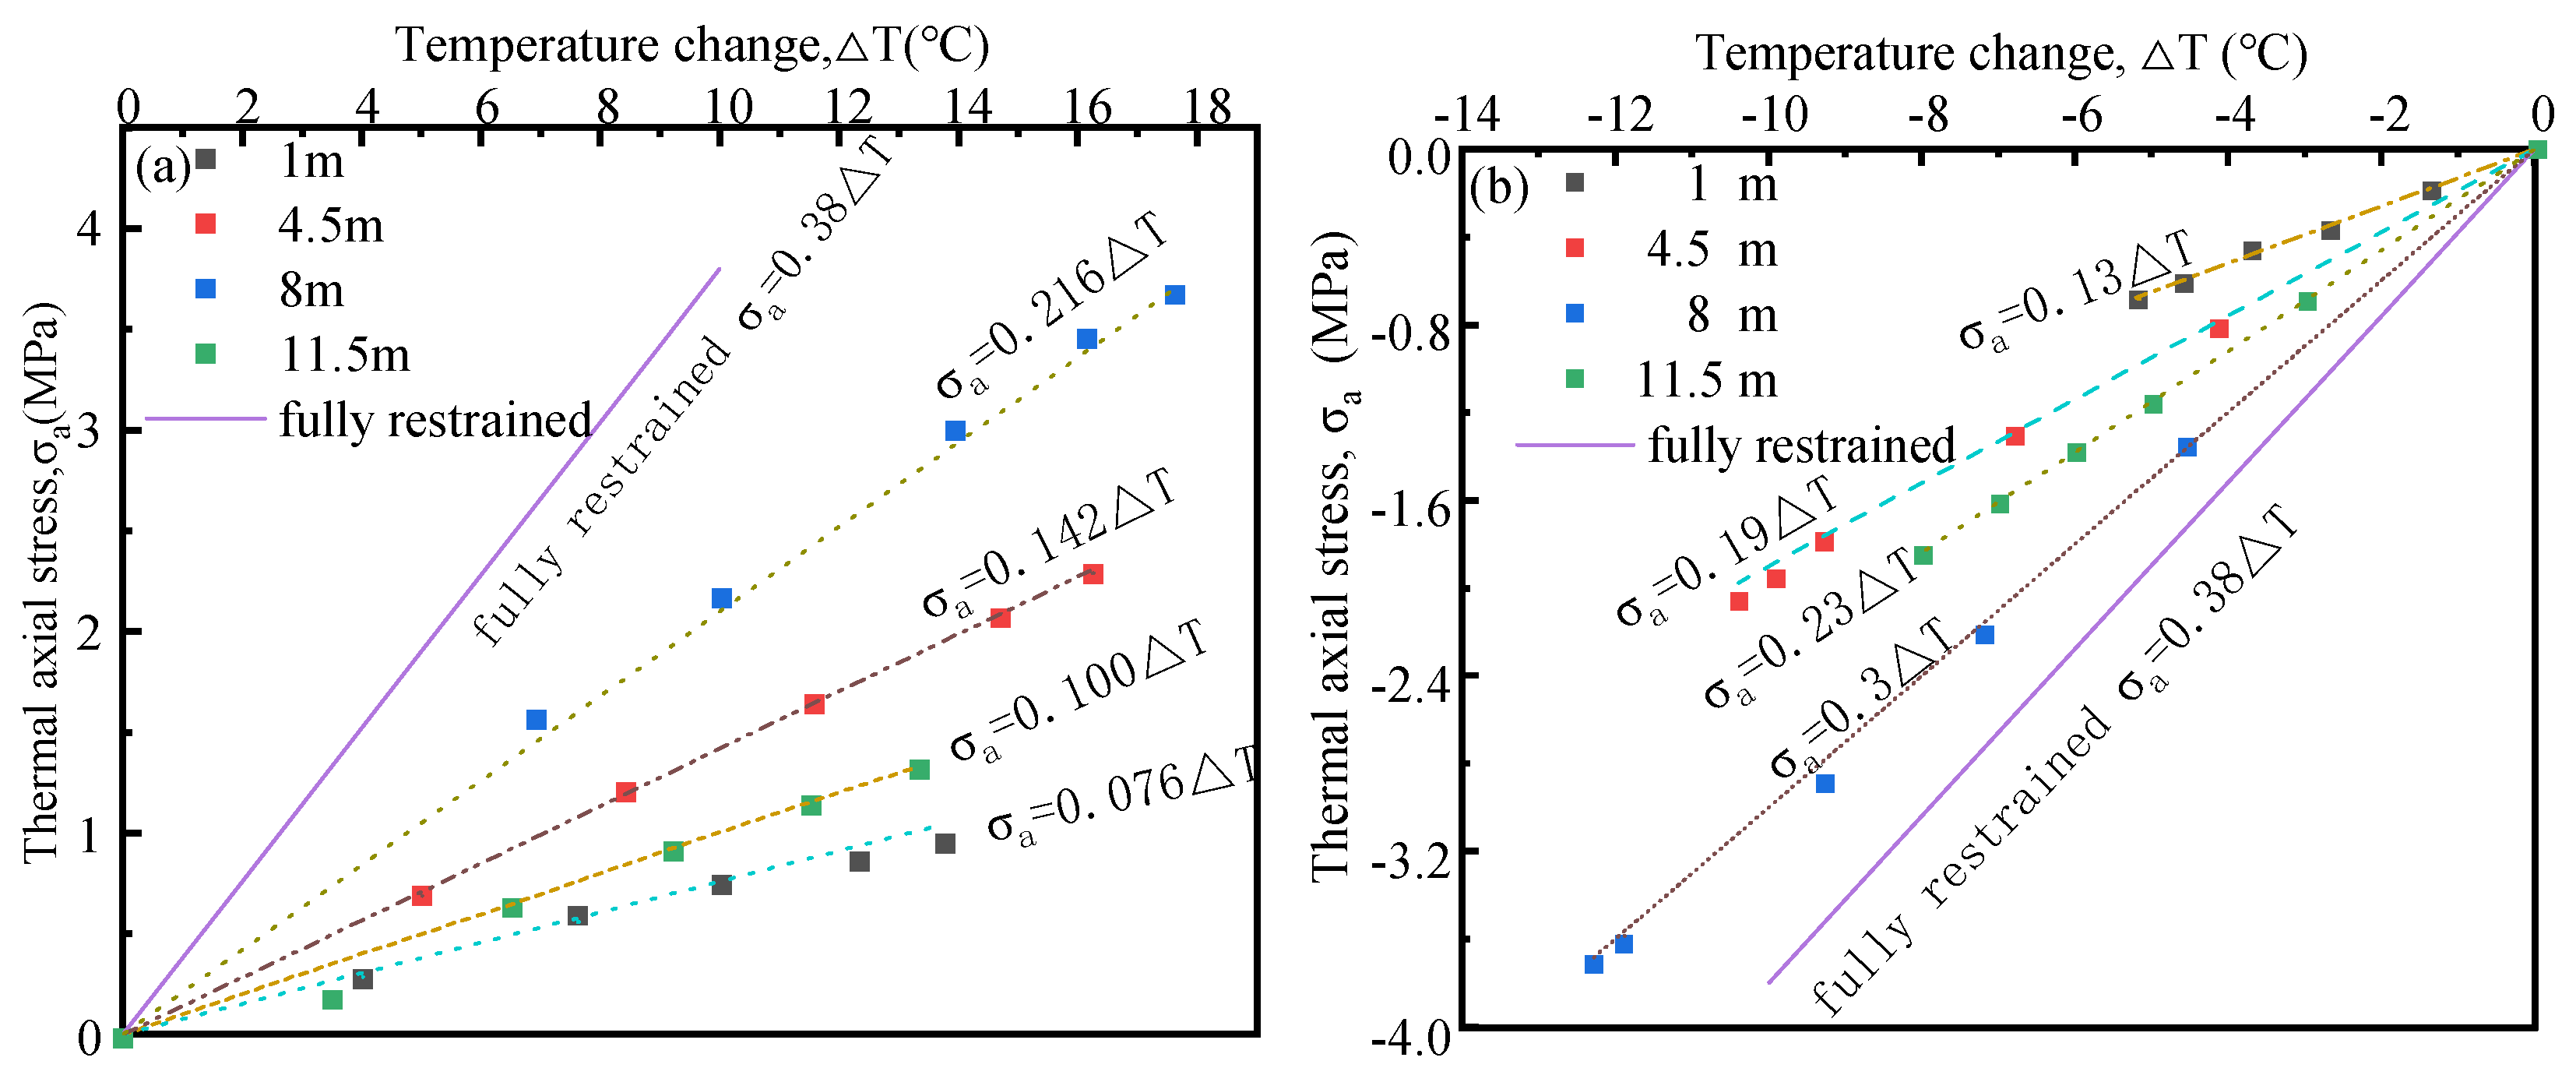
Figure 7 shows that the relationship between the axial thermal stress of the pile and the temperature difference is basically linear, which can be regarded as a linear thermo-elastic change. The linear fitting coefficient denotes the thermal stress per unit temperature difference, and the unit is MPa/°C. It can be seen that the maximum thermal compressive stress is always in the middle and lower part of the pile, and the relationship between the temperature difference and thermal compressive stress can be fitted as , and the unit is MPa. The corresponding maximum axial force of the pile was 203.28 KN, which was about 11.96% of the design load of 1700 KN. The maximum thermal tensile stress was always in the middle and lower part of the pile, and the relationship between the thermal difference and thermal tensile stress can be expressed as , and the unit is MPa.
3.4. Assessment of Mobilized Side Shear Stresses
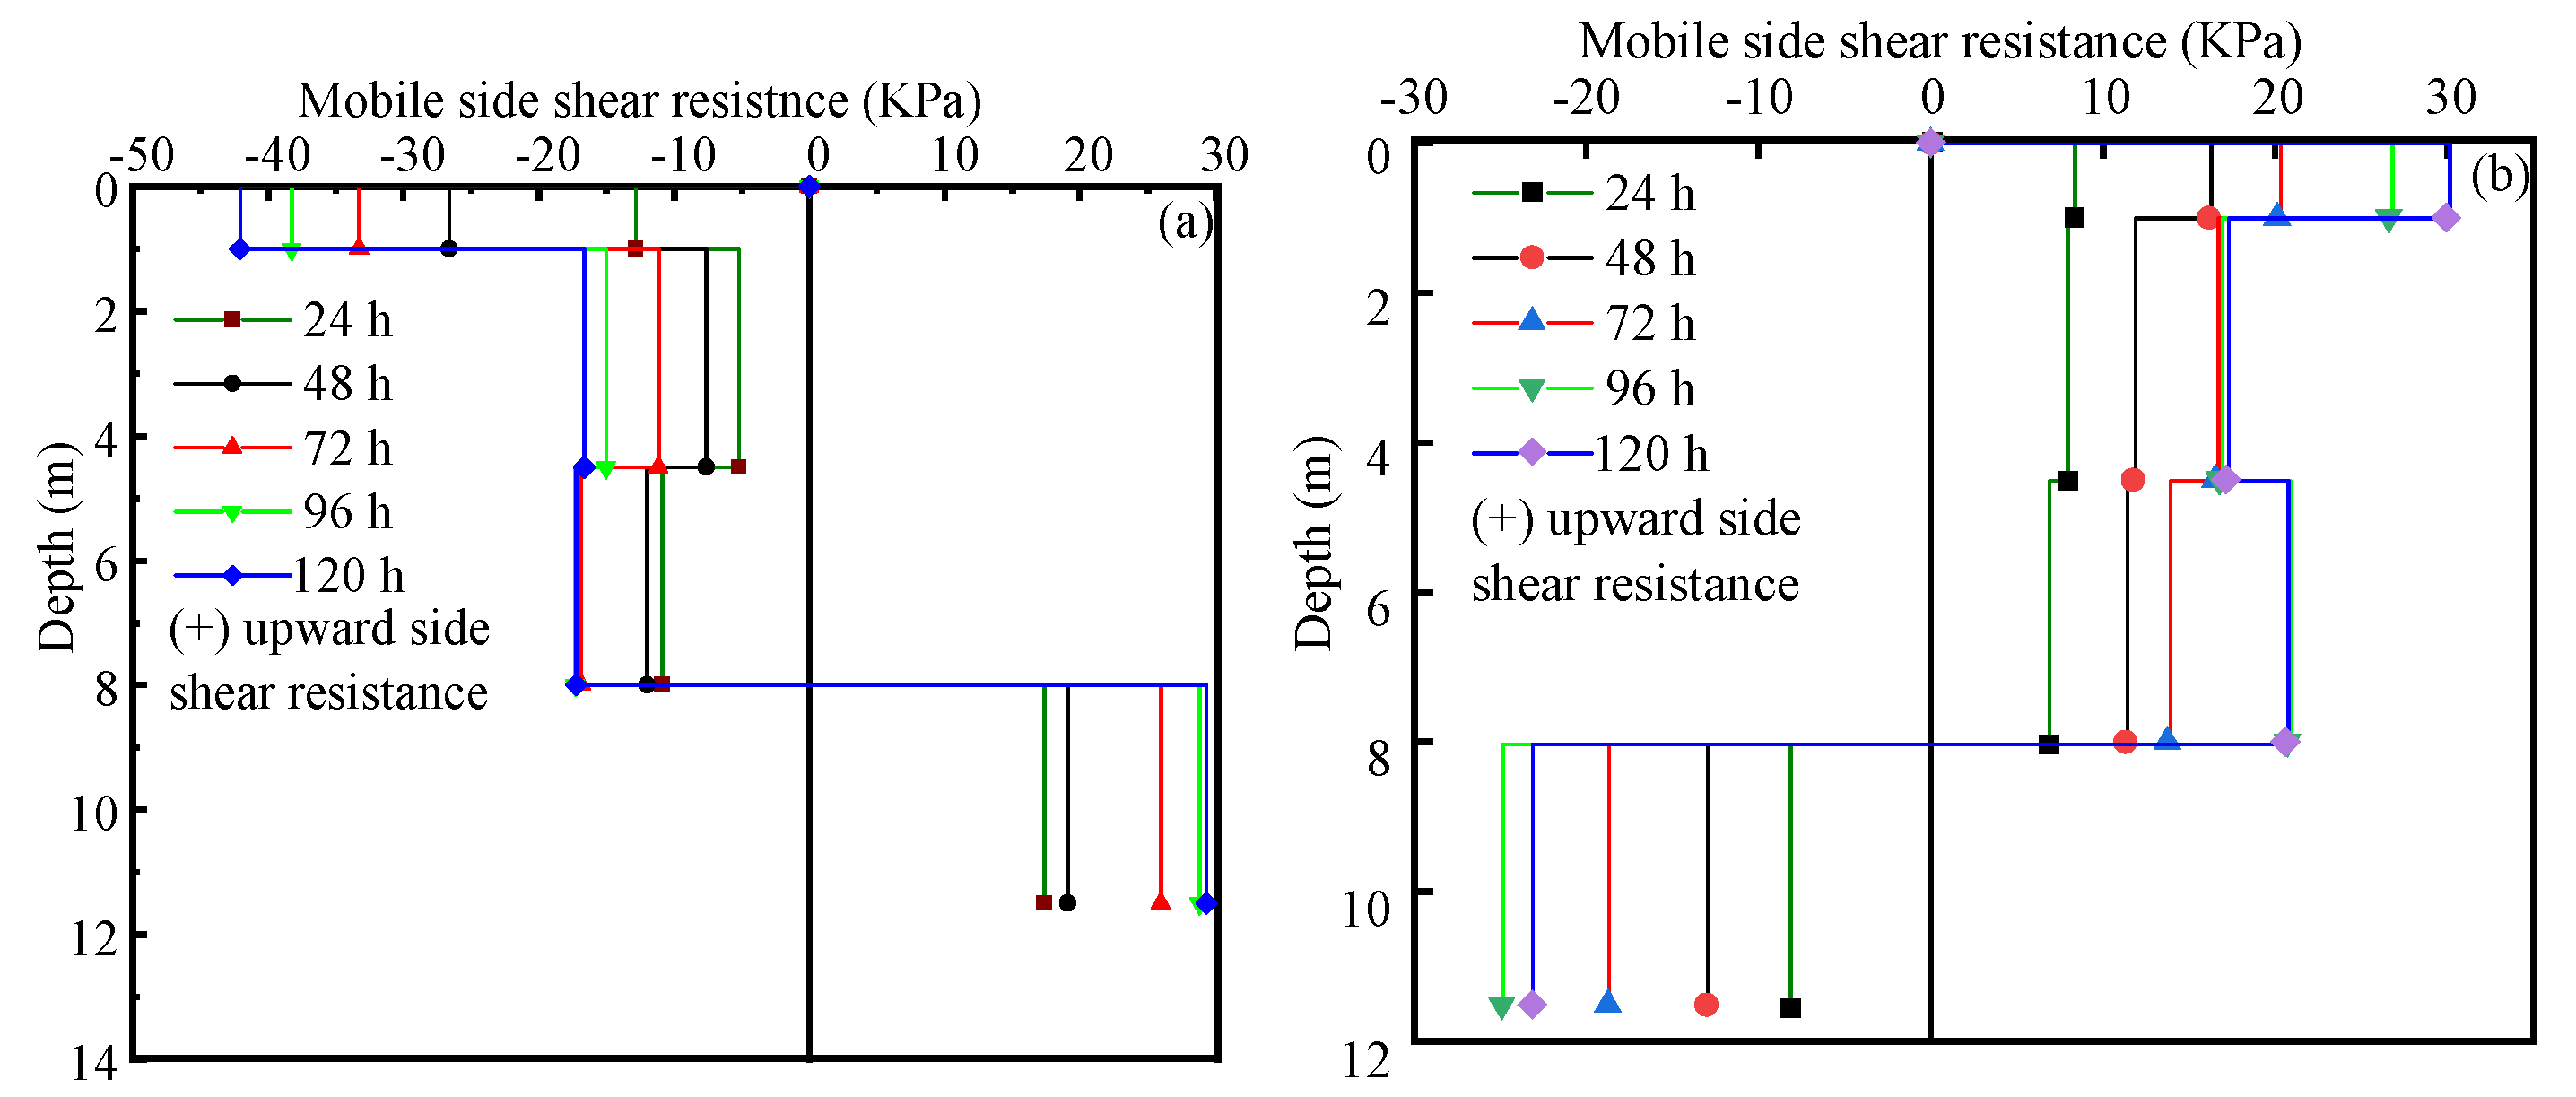
During the temperature cycle, the pile underwent expansion and contraction deformation, and the relative displacement between the pile and the soil induced the mobile side friction resistance on the pile–soil contact surface. Under the summer condition, the upper part of the pile produced negative friction; this is because the displacement of the upper part of the pile is larger than the displacement of the soil, leading to an upward displacement relative to the soil. Correspondingly, the pile–soil contact surface at the lower part of the pile produced positive side friction resistance, which is because the lower part of the pile expands downwards and produces a downward displacement relative to the soil. There is a similar law under the winter condition, but the signs and directions are opposite. There exists a special point of the pile called the neutral point, where the relative displacement of the pile–soil is 0, and the direction of the upper and lower friction resistance at above and below the position is the opposite, and the relative displacement of the upper and lower pile of the neutral point is the opposite.
The calculation of the mobile side friction resistance of the pile can be calculated according to Equation (4), and the calculation result is the average side friction resistance of the soil layers.
where is the average mobile side friction resistance, D is the outer diameter of the pipe pile, and d is the inner diameter of the pipe pile; is the distance between the two measuring point strain gauges; is the axial stress of the pile at the upper strain gauge; is the axial stress of the pile at the lower strain gauge; j = 1,2,3,..., which means the position of the strain gauge from the top of the pile to the bottom of the pile, and positive is upward, negative is downward.
The distribution of mobile side friction resistance during the test is shown in Figure 8a, which shows that in summer, the side friction resistance was generally negative at the upper part and positive at the lower part. The neutral point was located between 8 and 11.5 m, about 9.75 m at the lower part of the pile. The larger the temperature difference of the pile, the larger the side friction resistance of the pile. When the average temperature of the pile was risen by 15.23 °C, the maximum negative friction in the range 0~1 m was 42.06 KPa, and the maximum positive side friction resistance in the range 8~11.5 m was 29.31 KPa, which was closer to the neutral point, and the absolute value was smaller. It is also found that the closer the pile top and pile end, the larger its value; this is because the relative displacement of the pile–soil at the neutral point is 0, and the farther the point is from the neutral point, the larger the relative displacement of the soil, and the easier it is to exert the side friction resistance. Therefore, the absolute value of the average side friction resistance of the soil near the pile top and the pile top is larger. At the same time, it can be seen that the absolute value of the side friction above the neutral point was greater than that below the neutral point because the upper part of the pile has a smaller degree of restraint than the lower part of the pile, inducing a larger pile–soil displacement. The side friction resistance is easier to produce, which indicates that the distribution of side friction is related to the degree of restraint of the pile top.
Figure 8b shows that in the winter, the pile side friction resistance was generally positive at the upper part and negative at the lower part. The neutral point was between 8 and 11.5 m, about 9.75 m near the lower part of the pile. Due to the largest settlement at the top of the pile, the absolute value of the frictional resistance of the soil near the top of the pile is always the largest. Because of the extension of the pile, the greater the decrease in the temperature of the pile, the greater the side friction of the pile. When the average temperature of the pile was reduced by 10.9 °C, a maximum positive side friction resistance of about 29.93 KPa appeared in the range 0~1 m; when the pile was cooled for 96 h, a maximum negative friction resistance of about 24.94 KPa was in the range 8~11.5 m. It can be indicated that the side friction resistance of the pile produced redistribution in the process of the continuous change in the pile temperature. At 96 h, the positive frictional resistance of the soil within the range of 4.5 to 8 m was 20.72 KPa, and the negative frictional resistance of the soil within the range of 8 to 11.5 m was 24.94 Kpa. At 120 h, the positive frictional resistance of the soil was located in the range of 4.5 to 8 m, the side friction resistance was 20.57 Kpa, and the negative frictional resistance of the soil located in the range 8~11.5 m was 23.18 Kpa. The side friction resistance in the two soil layers decreased, which may be due to the degradation of the side friction resistance of the soil layers.
3.5. Assessment of Thermo-Mechanical Displacement Profiles
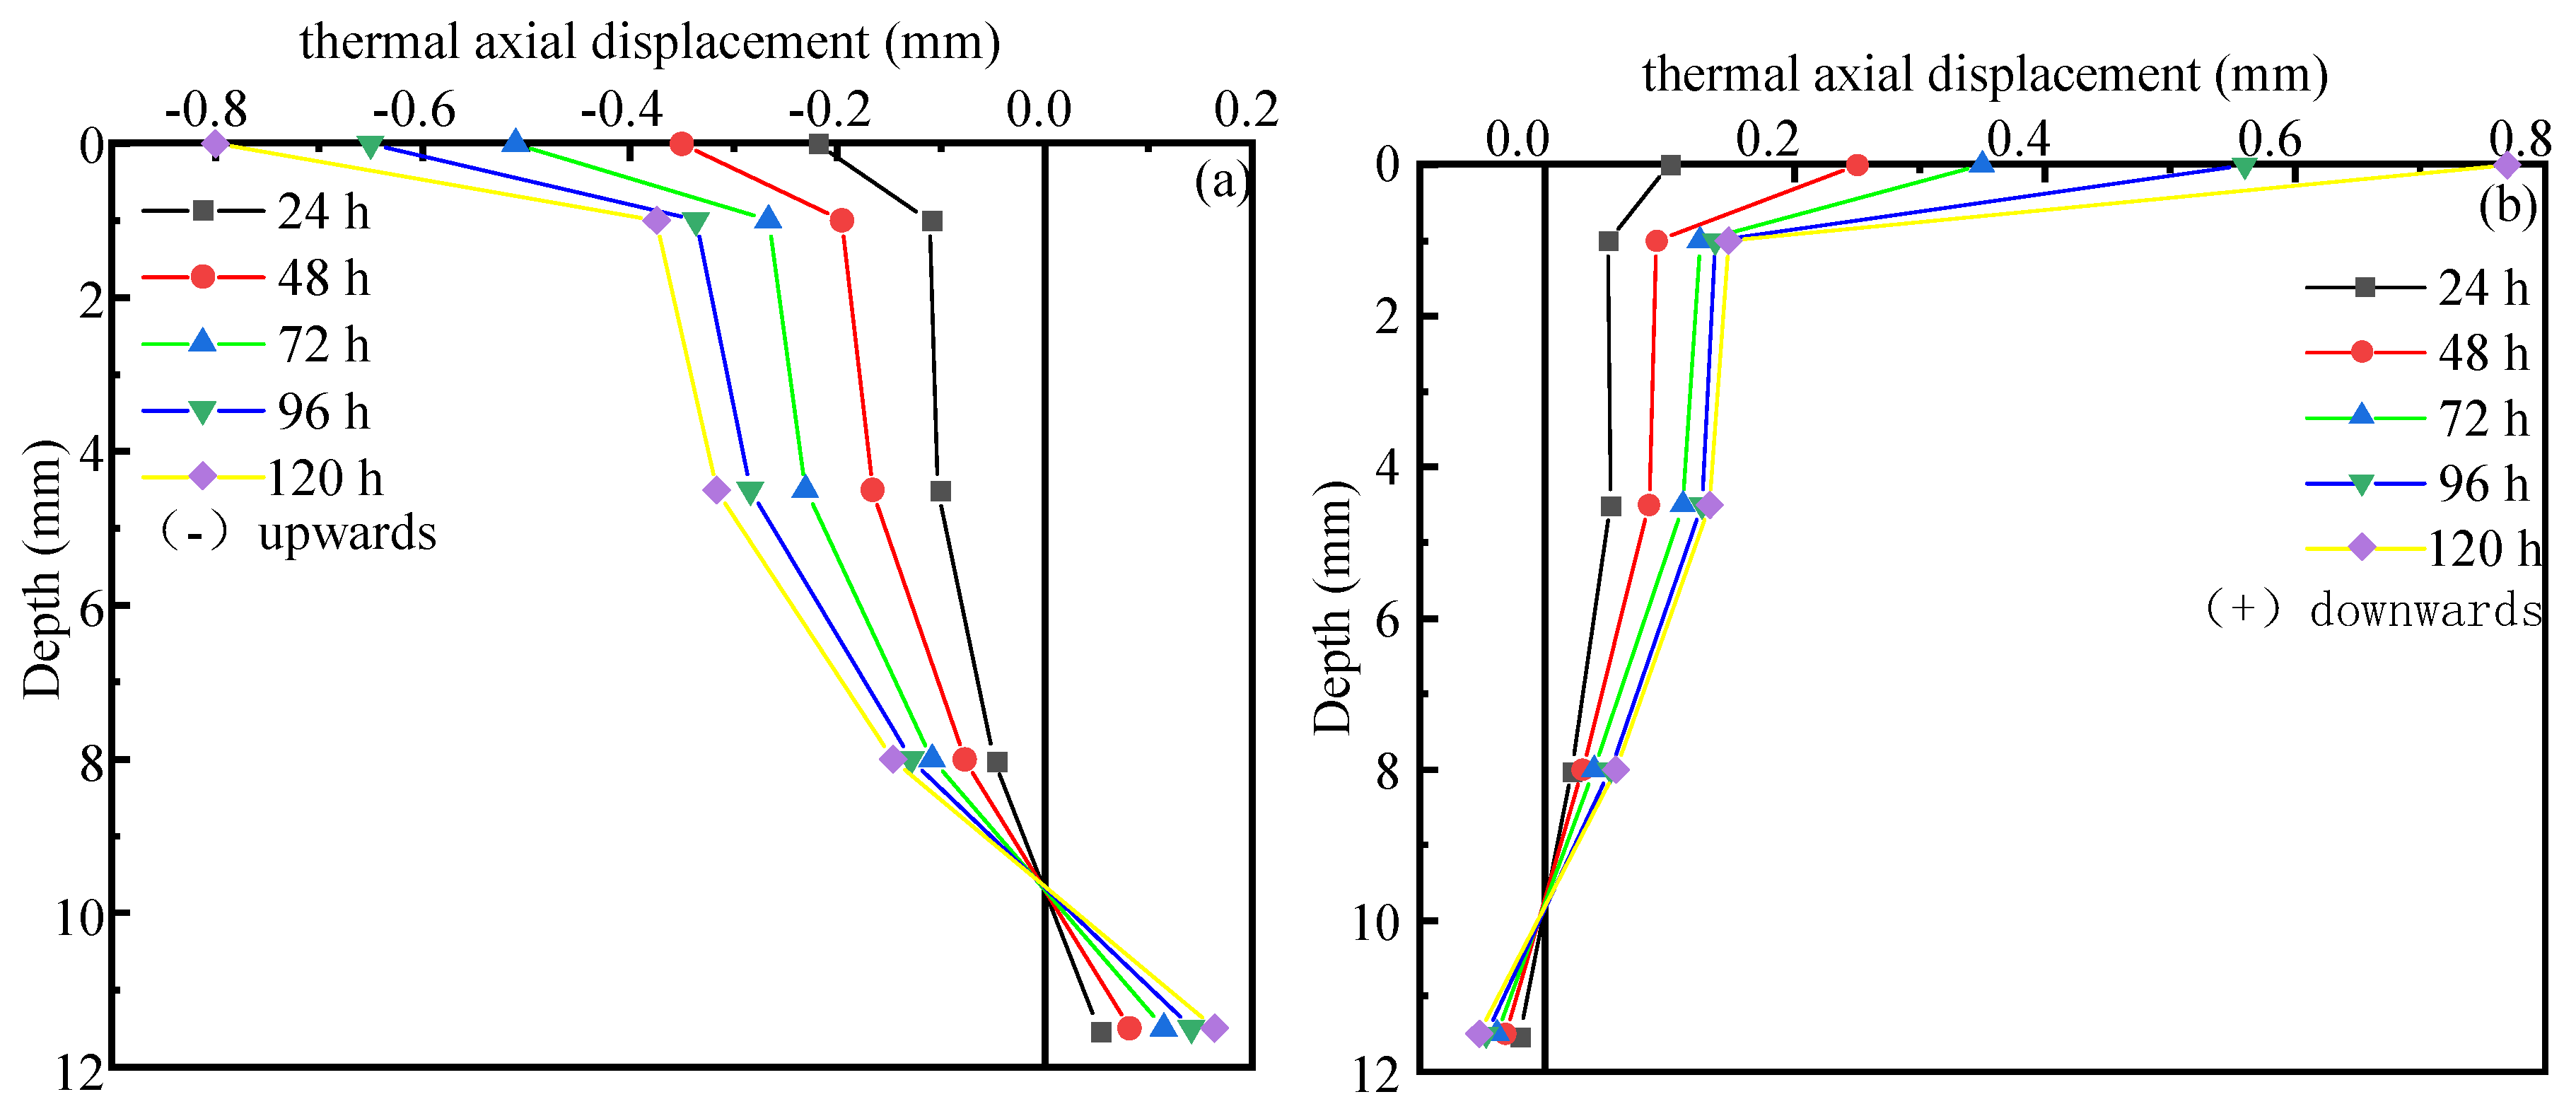
Due to the expansion and contraction of the pile, the displacement of the pile top and the deformation of the pile emerged; the relative displacement of any measuring point of the pile can be calculated according to Equation (5).
where is the thermal axial displacement at the midpoint between two gauges at different depths; is the observed strain at the gauge i; and is the distance between the two gauges. It is assumed to be that positive is downward, negative is upward.
During the test, the displacement changes of 1 m, 4.5 m, 8 m, 11.5 m below the pile top are shown in Figure 9. It can be seen from Figure 9a that in the summer, as the temperature of the pile increased, the relative displacement of each measured point of the pile became larger and larger. The farther away from the neutral point, the greater the relative displacement, and the largest displacement is shown at the top of the pile; since the end of the pile is in a sandy soil layer, and the restraining stiffness is larger than that of the top of the pile, the displacement of the top of the pile is larger than the relative displacement at 11.5 m of the pile. The overall displacement of the pile has an upward trend relative to the soil. It is assumed to be positive for the upward displacement and negative for the downward displacement. After the test was carried out for 120 h, the displacement of the pile top was −0.7 mm (0.175%D).
It can be seen from Figure 9b that in the winter, since the pile top is in a dense sand soil layer and the restraining stiffness is relatively large relative to the pile top, the additional displacement was gradually transmitted upwards, and the displacement at the pile top was larger than the displacement near the pile top, which also indicates that the neutral point of the pile is always near the stronger restrained end. After the test was carried out for 120 h, the displacement of the pile top was 0.77 mm (0.193%D). Compared with the summer condition, the displacement of the pile top changes greatly; this may be due to the shrinkage of the pile and the weakened restraints of the soil around the pile.
4. Conclusions
In this paper, based on the in situ thermal response test of the PHC energy pile, the variation in temperature and thermal stress were monitored and analyzed, and the following conclusions can be drawn:
- (1)
- During the operation of the PHC energy pile in the summer and winter, the temperature of the pile gradually changed. The temperature in the initial stage changed rapidly; as the test progressed, the temperature increment gradually decreased. In short, the temperature was low at the two ends and high in the middle;
- (2)
- Under both the summer and winter conditions, the thermal stress gradually increased with the pile’s temperature, due to the joint constraints of the soil around the pile and the soil at the pile top; the thermal stress was small at both ends and large in the middle, and this is probably because the pile top is located at the dense sand layer and the restraint rigidity is relatively large. At the end of the summer test, the maximum compressive stress at 8 m of the pile was 3.446 MPa; in the winter, the maximum tensile stress at 8 m of the pile was 2.69 MPa. The thermal stress has a linear relationship with the temperature increment. The relationship between the maximum compressive stress and the temperature difference is ; the relationship between the maximum temperature tensile stress and the temperature difference is . The results showed that the temperature stress generated under the dual temperature cycle conditions would not affect the safety of the pile foundation and the superstructure;
- (3)
- The pile is constrained by the soil around during the temperature cycle and cannot be deformed freely, leading to side friction resistance. In the summer, the soil around the upper part of the pile produced negative side friction resistance, and the soil around the lower part of the pile produced positive side friction resistance; the situation is the opposite in the winter. The neutral point is about 10.75 m away from the pile top, and it did not move during the whole test, indicating that the neutral point of the pile is close to the end of the pile with a higher degree of restraint. The side friction resistance of the pile increased with the increase in the temperature difference and increased along with the neutral point to the two ends of the pile, and the absolute value of the soil friction resistance of the upper part of the pile was larger than the that of the lower part. Under the winter condition, the side friction resistance degraded from 4.5 to 11.5 m during the test. In addition, the results show that the position of the neutral point of the pile is affected by the pile end restraint condition, and it is always close to the end of the pile with stronger restraint;
- (4)
- During the test, the displacement of the pile top and other measuring points had been increasing, and the displacement of the point above the neutral point was greater than the displacement of the point below the neutral point. The test results show that at the end of the summer test, the displacement of the pile top was 0.7 mm, about 0.175%D. In the winter, as the temperature of the pile gradually decreased, the displacement of the pile top gradually increased. At the end of the test, the displacement of pile top gradually increased, and the maximum displacement was 0.4 mm, about 0.1%D.
The paper mainly focuses on the thermo-mechanical behavior of energy piles, lacking an analysis and observation of the temperature of the soil layers around the pile. It would also be better if it investigated the characteristic of pile–soil interface.
Author Contributions
Funding acquisition, J.W.; investigation, J.W.; supervision, J.W.; writing—original draft, Z.L.; writing—review and editing, J.W. All authors have read and agreed to the published version of the manuscript.
Funding
This research was funded by National Natural Science Foundation of China (no. 51978630).
Acknowledgments
We thank all the authors who contributed to this article.
Conflicts of Interest
The authors declare that no conflict of interest.
References
- Jiang, Q.Q.; Jiao, Y.Y.; Luo, J.; Wang, H. Review and prospect on heat transfer and bearing performance of energy piles. Rock Soil Mech. 2019, 40, 3351–3362. [Google Scholar]
- Cui, Y.L.; Zhu, J.; Meng, F.R. Techno-economic evaluation of multiple energy piles for a ground-coupled heat pump system. Energy Convers. Manag. 2018, 178, 200–216. [Google Scholar] [CrossRef]
- Brandl, H. Energy foundations and other thermo-active groundstructures. Géotechnique 2006, 56, 81–122. [Google Scholar] [CrossRef]
- Liu, H.W.; Maghoul, P.; Bahari, A.; Kavgic, M. Feasibility study of snow melting system for bridge decks using geothermal energy piles integrated with heat pump in Canada. Renew. Energy 2019, 136, 1266–1280. [Google Scholar] [CrossRef]
- Laloui, L.; Nuth, M.; Vulliet, L. Experimental and numerical investigations of the behaviour of a heat exchanger pile. Int. J. Numer. Anal. Methods Geomech. 2006, 30, 763–781. [Google Scholar] [CrossRef]
- Bourne-Webb, P.J.; Amatya, B.; Soga, K.; Amis, T.; Davidson, C.; Payne, P. Energy pile test at LambethCollege, London: Geotechnical and thermodynamic aspects of pile response to heat cycles. Géotechnique 2009, 59, 237–248. [Google Scholar] [CrossRef]
- Guo, Y.M.; Zhang, G.Z.; Liu, S.Y. Investigation on the thermal response of full-scale PHC energy pile and ground temperature in multi-layer strata. Appl. Therm. Eng. 2018, 143, 836–848. [Google Scholar] [CrossRef]
- Murphy, K.D.; McCartney, J.S.; Henry, K.S. Evaluation of thermo-mechanical and thermal behavior offull-scale energy foundations. Acta Geotech. 2014, 10, 179–195. [Google Scholar] [CrossRef]
- Chen, Y.H.; Xu, J.; Li, H.; Chen, L. Performance of a Prestressed Concrete Pipe Energy Pile during Heating and Cooling. J. Perform. Constr. Facil. 2017, 31, 1–7. [Google Scholar] [CrossRef]
- Murphy, K.D.; McCartney, J.S. Seasonal Response of Energy Foundations During Building Operation. Geotech. Geol. Eng. 2015, 33, 343–356. [Google Scholar] [CrossRef]
- Wang, B.; Bouazza, A.; Singh, R.M.; Haberfield, C.; Barry-Macaulay, D.; Baycan, S. Posttemperature Effects on Shaft Capacity of a Full-Scale Geothermal Energy Pile. J. Geotech. Geoenviron. Eng. 2015, 141. [Google Scholar] [CrossRef] [Green Version]
- McCartney, J.S.; Murphy, K.D. Investigation of potential dragdown/uplift effects on energy piles. Geomech. Energy Environ. 2017, 10, 21–28. [Google Scholar] [CrossRef] [Green Version]
- Sung, C.; Park, S.; Lee, S.; Oh, K.; Choi, H. Thermo-mechanical behavior of cast-in-place energy piles. Energy 2018, 161, 920–938. [Google Scholar] [CrossRef]
- Faizal, M.; Bouazza, A.; Haberfield, C.; McCartney, J.S. Axial and Radial Thermal Responses of a Field-Scale Energy Pile under Monotonic and Cyclic Temperature Changes. J. Geotech. Geoenviron. Eng. 2018, 144. [Google Scholar] [CrossRef] [Green Version]
- Faizal, M.; Bouazza, A.; McCartney, J.S.; Haberfield, C. Effects of Cyclic Temperature Variations on Thermal Response of an Energy Pile under a Residential Building. J. Geotech. Geoenviron. Eng. 2019, 145. [Google Scholar] [CrossRef] [Green Version]
- Sutman, M.; Brettmann, T.; Olgun, C.G. Full-scale in-situ tests on energy piles: Head and base-restrainingeffects on the structural behaviour of three energy piles. Geomech. Energy Environ. 2019, 18, 56–68. [Google Scholar] [CrossRef]
- Arzanfudi, M.M.; Al-Khoury, R.; Sluys, L.J.; Schreppers, G.M.A. A thermo-hydro-mechanical model for energy piles under cyclic thermal loading. Comput. Geotech. 2020, 125, 103560. [Google Scholar] [CrossRef]
- Ng, C.W.W.; Ma, Q.J.; Gunawan, A. Horizontalstress change of energy piles subjected to thermal cycles in sand. Comput. Geotech. 2016, 78, 54–61. [Google Scholar] [CrossRef] [Green Version]
- Ng, C.W.W.; Ma, Q.J. Energy pile group subjected to non-symmetrical cyclic thermal loading in centrifuge. Geotech. Lett. 2019, 9, 173–177. [Google Scholar] [CrossRef]
- Ng, C.W.W.; Zhang, C.; Farivar, A.; Gomaa, S.M.M.H. Scaling effects on the centrifuge modelling of energy piles in saturated sand. Géotech. Lett. 2020, 10, 57–62. [Google Scholar] [CrossRef]
- Yavari, N.; Tang, A.M.; Pereira, J.M.; Hassen, G. Mechanical behaviour of a small-scale energy pile in saturated clay. Géotechnique 2016, 66, 878–887. [Google Scholar] [CrossRef]
- Goode, J.C.; McCartney, J.S. Centrifuge Modeling of End-Restraint Effects in Energy Foundations. J. Geotech. Geoenviron. Eng. 2015, 141. [Google Scholar] [CrossRef] [Green Version]
- Adi, D.; Ferrari, A.; Laloui, L. Experimental investigations of the soil-concrete interface: Physical mechanisms, cyclic mobilization, and behaviour at different temperatures. Can. Geotech. J. 2016, 53, 659–672. [Google Scholar]
- Li, Q.; Chen, L.; Qiao, L. Thermal Effect on Structural Interaction between Energy Pile and Its Host Soil. Adv. Mater. Sci. Eng. 2017, 2017, 7121785. [Google Scholar] [CrossRef] [Green Version]
- Olgun, C.G.; Ozudogru, T.Y.; Arson, C.F. Thermo-mechanical radial expansion of heat exchanger piles and possible effects on contact pressures at pile-soil interface. Géotech. Lett. 2014, 4, 170–178. [Google Scholar] [CrossRef] [Green Version]
- Yavari, N.; Tang, A.M.; Pereira, J.-M.; Hassen, G. Effect of temperature on the shear strength of soils and soil/structure interface. Can. Geotech. J. 2016, 53, 1186–1194. [Google Scholar] [CrossRef]
- Guo, H.R.; Qiao, L.; Li, Y. Research on the bearing performance of energy piles using an improved load-transfer model on pile-soil interface. Rock Soil Mech. 2018, 39, 4042–4052. [Google Scholar]
- Fei, K.; Dai, D.; Hong, W. A simplified method for working performance analysis of single energy piles. Rock Soil Mech. 2019, 40, 70–80. [Google Scholar]
- Fei, K.; Zhu, Z.H.; Shi, Y.H.; Zhou, Y. A simplified method for geotechnical analysis of energy pile groups. Rock Soil Mech. 2020, 41, 1–10. [Google Scholar]
- Sutman, M.; Olgun, C.G.; Laloui, L. Cyclic Load–Transfer Approach for the Analysis of Energy Piles. J. Geotech. Geoenviron. Eng. 2019, 145. [Google Scholar] [CrossRef]
- Ministry of Housing and Urban-Rural Development of People’s Republic of China. GB50010-2010: CODE for Design of Concrete Structures; China Architecture & Building Press: Beijing, China, 2010.
- Sun, Y.T.; Li, G.C.; Zhang, N.; Chang, Q.L.; Xu, J.S.; Zhang, J.F. Development of ensemble learning models to evaluate the strength of coal-grout materials. Int. J. Min. Sci. Technol. 2021, 31, 153–162. [Google Scholar] [CrossRef]
- Zhang, Y.G.; Zhang, Z.; Xue, S. Stability analysis of a typical landslide mass in the Three Gorges Reservoir under varying reservoir water levels. Environ. Earth Sci. 2020, 79. [Google Scholar] [CrossRef]
- Lawal, A.I.; Kwon, S.; Hammed, O.S.; Idris, M.A. Blast-induced ground vibration prediction in granite quarries: An application of gene expression programming, ANFIS, and sine cosine algorithm optimized ANN. Int. J. Min. Sci. Technol. 2021, 31, 265–277. [Google Scholar] [CrossRef]
- Zhang, Y.G.; Yang, L.N. A novel dynamic predictive method of water inrush from coal floor based on gated recurrent unit model. Nat. Hazards 2020, 16. [Google Scholar] [CrossRef]
- Wang, G.; Qin, X.J.; Han, D.Y.; Liu, Z.Y. Study on seepage and deformation characteristics of coal microstructure by 3D reconstruction of CT images at high temperatures. Int. J. Min. Sci. Technol. 2021, 31, 175–185. [Google Scholar] [CrossRef]
- Zhang, Y.G.; Tang, J.; He, Z.Y.; Tan, J.K.; Li, C. A novel displacement prediction method using gated recurrent unit model with time series analysis in the Erdaohe landslide. Nat. Hazards 2020, 18. [Google Scholar] [CrossRef]
- Hou, W.T.; Wang, H.P.; Yuan, L.; Wang, W.; Xue, Y.; Ma, Z.W. Experimental research into the effect of gas pressure, particle size and nozzle area on initial gas-release energy during gas desorption. Int. J. Min. Sci. Technol. 2021, 31, 253–263. [Google Scholar] [CrossRef]
- Zhang, Y.G.; Xie, Y.L.; Zhang, Y.; Qiu, J.B.; Wu, S.X. The adoption of deep neural network (DNN) to the prediction of soil liquefaction based on shear wave velocity. Bull. Eng. Geol. Environ. 2021, 16. [Google Scholar] [CrossRef]
- Shao, S.H.; Wu, C.L.; Hao, M.; Song, X.L.; Su, X.Y.; Wang, W.H.; Li, G.S.; Shi, B.B. A novel coating technology for fast sealing of air leakage in underground coal mines. Int. J. Min. Sci. Technol. 2021, 31, 313–320. [Google Scholar] [CrossRef]
- Zhang, Y.G.; Qiu, J.; Zhang, Y.; Wei, Y. The adoption of ELM to the prediction of soil liquefaction based on CPT. Nat. Hazards 2021, 15. [Google Scholar] [CrossRef]
Figure 1.
Geological profiles and layout of sensors.

Figure 2.
Schematic diagram of model test arrangement.

Figure 3.
Temperature profiles along (a) energy pile A; (b) energy pile B during the heating and cooling episode.
Figure 3.
Temperature profiles along (a) energy pile A; (b) energy pile B during the heating and cooling episode.

Figure 4.
Change in inlet/outlet water temperature along (a) energy pile A; (b) energy pile B during the heating and cooling episode.
Figure 4.
Change in inlet/outlet water temperature along (a) energy pile A; (b) energy pile B during the heating and cooling episode.

Figure 5.
Thermally induced axial strain profile along (a) energy pile A; (b) energy pile B during the heating and cooling episode.
Figure 5.
Thermally induced axial strain profile along (a) energy pile A; (b) energy pile B during the heating and cooling episode.

Figure 6.
Thermal axial stress profile along (a) energy pile A; (b) energy pile B during the heating and cooling episode.
Figure 6.
Thermal axial stress profile along (a) energy pile A; (b) energy pile B during the heating and cooling episode.

Figure 7.
Thermal axial stress variation with temperature along (a) energy pile A; (b) energy pile B during the heating and cooling episode.
Figure 7.
Thermal axial stress variation with temperature along (a) energy pile A; (b) energy pile B during the heating and cooling episode.

Figure 8.
Friction resistance profiles along (a) energy pile A; (b) energy pile B during the heating and cooling episode.
Figure 8.
Friction resistance profiles along (a) energy pile A; (b) energy pile B during the heating and cooling episode.

Figure 9.
Thermal axial displacements along (a) energy pile A; (b) energy pile B during the heating and cooling episode.
Figure 9.
Thermal axial displacements along (a) energy pile A; (b) energy pile B during the heating and cooling episode.


Table 1.
Basic physic parameters of soil layers.
| Layer | Soil Type | Gravimetric Water Content (%) | Void Ratio | Cohesion/(KPa) | Internal Angel (°) |
|---|---|---|---|---|---|
| 2-1 | Silt | 22.3 | 0.605 | 10.2 | 18.6 |
| 2-2 | Silty clay | 26.9 | 0.737 | 17.2 | 10.8 |
| 2-3 | Silty sand | 20.0 | 0.616 | 10.2 | 18.6 |
Table 2.
Instrumentation summary.
| Instrument | Datalogger | Strain gauges | Circulating pump | Digital thermometer | Dial gauge |
| Model | XHY-ZHX | XHX-115 | 1WZB-25 | XMZ-131 | UPM50 |
| Measurement | Record data | Strain in the pile | Circulating the water | The inlet/outlet water temperature | Pile top displacement |
Publisher’s Note: MDPI stays neutral with regard to jurisdictional claims in published maps and institutional affiliations. |
© 2021 by the authors. Licensee MDPI, Basel, Switzerland. This article is an open access article distributed under the terms and conditions of the Creative Commons Attribution (CC BY) license (https://creativecommons.org/licenses/by/4.0/).
Share and Cite
MDPI and ACS Style
Wang, J.; Li, Z. Experimental Study of Thermal Response of Vertically Loaded Energy Pipe Pile. Sustainability 2021, 13, 7411. https://0-doi-org.brum.beds.ac.uk/10.3390/su13137411
AMA Style
Wang J, Li Z. Experimental Study of Thermal Response of Vertically Loaded Energy Pipe Pile. Sustainability. 2021; 13(13):7411. https://0-doi-org.brum.beds.ac.uk/10.3390/su13137411
Chicago/Turabian StyleWang, Junlin, and Zhao Li. 2021. "Experimental Study of Thermal Response of Vertically Loaded Energy Pipe Pile" Sustainability 13, no. 13: 7411. https://0-doi-org.brum.beds.ac.uk/10.3390/su13137411
Note that from the first issue of 2016, this journal uses article numbers instead of page numbers. See further details here.