
Can HCI Help Increase People’s Engagement in Sustainable Development? A Case Study on Energy Literacy


1
Associação Comercial e Industrial do Funchal, Nova University Lisbon, 1099-085 Lisbon, Portugal
2
Faculty of Exact Sciences and Engineering, University of Madeira, 9000-072 Funchal, Portugal
3
Interactive Technologies Institute, LARSyS, 9020-105 Funchal, Portugal
*
Author to whom correspondence should be addressed.
Sustainability 2021, 13(14), 7543; https://0-doi-org.brum.beds.ac.uk/10.3390/su13147543
Submission received: 10 May 2021
/
Revised: 21 June 2021
/
Accepted: 30 June 2021
/
Published: 6 July 2021
(This article belongs to the Special Issue Sustainable Human-Computer Interaction Development)
Abstract
:The adoption of energy efficiency practices and increased penetration of renewable energy sources in the power system are estimated to play a key role in the decarbonization of the energy sector, helping reduce greenhouse gas emissions and ultimately fight climate change. To foster energy transition, energy education initiatives should primarily target the citizens and be designed adopting a User-Centered Design (UCD) approach and HCI methodologies. This paper describes how UCD/HCI can inform the design of citizens’ energy education initiatives by presenting a case study—the development of an information platform targeting Madeiran citizens. The article describes the design process, from ideation to prototype and validation. Methods used in each phase (card sorting, semi-structured interviews, brainstorming sessions, think-aloud protocol and surveys) are described. Results of each phase and how they have informed the following steps are presented, together with a detailed description of the resulting information platform and initial results in terms of acceptance and interaction with the system. Our initial results support the hypothesis that adopting an HCI perspective can nurture the development of energy education initiatives targeting citizens, bringing a user-centered approach to the design of such initiatives.
1. Introduction
A number of strategies and policy measures are being implemented at the regional, national and European levels to facilitate the transition towards a sustainable, low-carbon energy system and ultimately address one of the greatest challenges of our time: climate change. As outlined by the United Nations in the 2030 Agenda for Sustainable Development [1], two are the primary goals that should be achieved to cope with climate change and mitigate its impact: ensuring universal access to affordable, reliable and clean energy (Sustainable Development Goal (SDG) 7) and promoting sustainable energy production and consumption patterns (SDG 12).
Several are the actions that can be implemented in order to achieve such goals [2]—in particular, those targeting (i) an increase in the production and consumption of renewable energy, (ii) the significant electrification of relevant sectors such as heat and transport, and (iii) broader adoption of sustainable habits. The transition from the current electricity system, which is centralized and fossil-fuel-based, to one mainly based on distributed renewable energy generation, presents several challenges (technical, infrastructural, regulatory, and social) [3]. Renewable Energy Sources (RES) are hard to predict and intrinsically variable, and the electrification of the heat and transport sectors significantly increases the energy demand and reshapes the load curve. Moreover, to manage such changes in the energy system, the ICT infrastructure of distribution networks must be enhanced.
Lopes and colleagues [4] outlined 11 relevant challenges for future power systems (PS), all related to the simultaneous increase in renewable generation and the electrification of the economy. The authors claim that the changes in the PS will pass through the power electronics converters to increase the volume of renewables connected to the grid— a multilevel energy storage solution to balancing load versus generation and relieving local technical constraints—and the participation of the consumer in the grid management to adjust the consumption with the available generation resources.
Much work is being done to address the technical and regulatory shortcomings of the current energy system. However, we also observe increasing attention to the social challenges of the energy transition. Several initiatives aimed at fostering citizen engagement on the energy matter (e.g., calls for citizen participation in the European Green Deal [5]) and promoting the implementation of Renewable Energy Communities (RECs) and Citizen Energy Communities (CECs) [6] have been launched.
Around 29% of global energy consumption is due to households [7]. Therefore, increasing people’s energy literacy is a key prerequisite for energy transition [8]. An energy-literate person understands the role of energy in daily lives, the impacts and consequences of his/her habits, and thus can make informed energy use decisions [9]. Several studies on the relevance of energy literacy [10], as well as its dimensions and influencing aspects [11], have been conducted. What emerges from the existing literature is a general, low level of energy literacy [12,13,14]. Energy education is even more crucial for those people and communities living in rural areas [8] or very complex geographic contexts like, for example, Madeira Island (Portugal).
Madeira Island is a total energy island, meaning that due to the isolated nature of its electric grid (i.e., not interconnected to continental Europe), it can be significantly affected by the uncertain and intermittent nature of renewable production [15]. Furthermore, the island has only one Distribution System Operator (DSO), a publicly owned company that is responsible for the entire electrical grid infrastructure as well as for energy generation, transmission and distribution. As such, there is no competitiveness in the electricity market on the island, being the energy prices regulated by the National Regulatory Authority of Portugal. Moreover, being Madeira an autonomous region, the regional legal framework differs from that of mainland Portugal. Being an island and also one of the outermost regions makes it hard, expensive and time-consuming to access multiple options (i.e., suppliers, installers, etc.). Raising people’s awareness of such constraints and helping them understand how these affect the local energy system is fundamental to foster citizens’ participation in energy management and ultimately further boost energy transition.
In Madeira, some initiatives such as workshops have been organized to foster energy literacy. Moreover, energy-awareness campaigns were conducted, and flyers to share best practices for improving energy efficiency at the household level have been circulated. Nevertheless, most of those initiatives were addressed to experts and policymakers and did not directly engage citizens.
Despite the effort on energy education, there is evidence of the poor energy performance of the island. Among all the Portuguese regions, Madeira has one of the highest rates of energy consumption, with an average of 3.235 kWh per inhabitant in 2019 [16]. Additionally, a relevant portion of the island consists of rural areas. The average consumption of rural areas is higher than that of urban areas (4.178 kWh per inhabitant vs. 3.746 kWh per inhabitant of the capital, Funchal) [16]. In terms of energy poverty, Portugal is still considered one of the most vulnerable countries in Europe, despite all the measures that are being implemented to fight against it. Madeira suffers from the same circumstances as the mainland, with high levels of energy poverty. Madeiran citizens face several issues, in particular those related to the inability to keep the house warm, due to the lack of heating equipment in the households [17]. Madeira, in line with Portuguese regulations, has the highest electricity prices in Europe when measured with the purchasing power parity [17]. Considering the replacement of old appliances with new and more efficient ones, Madeira has low replacement rates, only 20–29% [17,18], which could be attributed not only to economic factors but also to the lack of knowledge about the energy labels and how appliances work. In terms of building efficiency, most of the buildings (73%) are certified with Energy Class “C” or lower, meaning poor levels of energy efficiency [18]. In terms of small-scale renewable energy installations, Madeira is far from meeting the potential of PV installations, with a registered number of 834 units in 2018. Finally, a study conducted by the National Energy Regulator Authority (ERSE) in 2020 [19], concluded that Portuguese people, in general, have low levels of energy literacy, with an index of 42.8%, and particularly, people from Madeira island show even lower levels on this matter.
This lower performance in terms of energy efficiency and efficacy in Madeira, despite the economic factors involved, reveals low levels of energy literacy. Additionally, the outcomes expected from the initiatives held to improve this issue were not successfully achieved, as revealed from the status of the energy context mentioned. We verify those initiatives as lacking a fundamental aspect that they did not focus directly on “bringing people into the conversation”; instead they targeted specific publics and marginalized the empowerment of general consumers as key players in attaining more energy efficiency behavior if educated and better informed about energy.
The lack of initiatives and energy education programs for citizens was also observed by the authors of the present article during the research activity conducted under the scope of the H2020 Smart Island Energy systems (SMILE) project. While recruiting participants and performing project dissemination activities, members of the local community reported having several issues in retrieving and understanding context-specific energy-related information. In particular, energy users—whether consumers and/or prosumers (i.e., users equipped with small-scale energy generation unit(s), for instance Solar Photovoltaic (PV) panels, which function as both energy producer and consumer [20])—argued that existing information is widespread, sometimes contradictory and not easy to understand (i.e., extensive use of technical or legal jargon). Several prosumers also highlighted that the variety of existing sources makes it difficult to distinguish reliable from unreliable information, especially when it comes to local rules and requirements for renewable energy production.
In order to develop more ‘solid’ energy education initiatives, one should adopt a user-centered design (UCD) approach and HCI methodologies. UCD focuses on the users’ needs and interests by making products that are usable and understandable. It does so by following the four following principles created by Norman [21]: (1) Make it easy to determine what actions are possible at any moment; (2) Make things visible, including the conceptual model of the system, the alternative actions, and the results of actions; (3) Make it easy to evaluate the current state of the system; and (4) Follow natural mappings between intentions and the required actions, between actions and the resulting effect, and between the information that is visible and the interpretation of the system state. In a nutshell, bring users’ needs into focus by using methodologies and processes that focus on the user throughout the product life cycle [22]. As such, it includes three key principles: an early focus on users and tasks, empirical measurement and iterative design [22]. Rather than just bringing users in the testing phase, it advocates for users to be integrated into the design in the early phases of research through surveys, interviews, contextual inquiries, shadowing or participatory design [22]. By empirical measurement, it means conducting usability evaluation throughout to improve ease of learning and error-free use, and iterative design by collecting experiences, designing and modifying these with users as often as needed, with diverse prototyping techniques and interactivity levels. These principles can be used to sustain a smoother transition in terms of energy initiatives and actions because the information will be gathered and presented according to users’ needs, interests and knowledge level. This approach allows for tailored interventions that directly address users’ needs, not just at the level of energy and renewable products but also the knowledge needed to make informed choices when purchasing such equipment according to their regional constraints, needs and resources. Only this way will users be more likely to understand and participate in energy-related initiatives. HCI methodologies offer the most adequate strategies to leverage user’s energy-related knowledge because these suggest which ones can be used to optimize the collection of needs, how to test and refine the prototypes and how to measure the user experience throughout the whole process [22].
In fact, energy has become recognized as a crucial subject of interest for HCI research, mainly regarding the area of sustainable HCI [23,24]. Although the utmost of the HCI research centers on eco-feedback technologies (i.e., the technology provides the feedback on behaviors to reduce environmental impact), other works focus on the study of energy as an intricate design concept (i.e., both an immaterial concept but also a commodified and functional resource) [25] and investigate the ongoing changes at the energy infrastructure level (i.e., peer-to-peer energy trading between self-consumers) [26,27,28].
Engaging communities on the energy matter is gaining increasing attention. In such a scenario, the adoption of an HCI perspective could offer a fundamental contribution by providing the methodological tools to bring the users into the conversation. Here we present a user-centered design project meant to achieve this goal.
This paper illustrates the different phases that led to the development of Energias Madeira [29], an information platform for energy consumers and/or prosumers. The goal of Energias Madeira is to gather reliable and user-friendly information in a single place to engage people in energy transition/efficiency, raising awareness and fostering sustainable behaviors. The information platform is part of a larger pilot developed in the context of Madeira Island in the SMILE project.
We emphasize that the work described in this manuscript is an example of how HCI methodology can guide and inform the development of interactive systems aimed at raising awareness in sustainability and increase energy literacy. This should be considered as a case study to demonstrate the value of adopting an HCI perspective in the design of such interactive systems.
The remainder of this paper is organized as follows. Materials and HCI methods used to build the information platform are thoroughly described in Section 2. In Section 3, the results of the different phases tested with users can be found. Finally, discussion and conclusions are presented in Section 4 and Section 5, respectively.
2. Materials and Methods
A user-centered approach was adopted throughout the design process, which consisted of three main phases: (i) understanding users’ information needs and ideation; (ii) content gathering and validation; and (iii) prototype and test. A description of the purposes and methods used in each phase is provided in the following subsections.
2.1. Phase One—Understanding Users’ Information Needs and Ideation
In order to understand the information needs of potential users, we conducted two studies involving, respectively, energy consumers and prosumers. The first study consisted of an open card sorting exercise (N = 6), while for the second study, semi-structured interviews (N = 4) were carried out. Findings from the two studies were used as the basis for brainstorming sessions with HCI experts and interaction designers that took place to define the appropriate design for the platform and its information architecture.
2.1.1. Card Sorting
Card sorting is a simple but effective user-centered design method, which proves particularly useful for designing the information architecture of a website because it helps understand how people organize contents and categorize knowledge according to their mental model [30,31,32].
The individual open card sorting exercise was conducted with a group of 6 energy consumers (three males and three females, average age was 37.6 years). Participants were selected according to the following criteria: (i) were Madeiran-born or long-term residents; (ii) Portuguese native speakers; (iii) had average self-reported knowledge of aspects related to energy consumption—i.e., participants ranked themselves around 3 on a scale from 1, “no knowledge” to 5 “expert knowledge”; (iv) had limited or no self-reported experience with Renewable Energy Sources (RES) generation (score of 1 or 2 on a five-point Likert scale), but claimed to be potentially interested in the matter.
The card sorting exercise started with a brief introduction on the purpose and procedure of the study given by the researchers. Participants were then provided with a set of 42 cards, each one with an energy-related statement or image printed on it (e.g., the image of an energy label, a detail of the electricity bill, a diagram representing the components of a solar PVs installation) and asked to categorize them according to their similarities and describe the resulting groups. Card items were previously selected through brainstorming sessions with a group of six experts with experience in energy and sustainability domains. In addition, participants were given some empty cards they could use to write down items that they would like to find on a website providing information about energy consumption and renewable energy production. Additional qualitative data was gathered through the think-aloud description of the card sorting exercise. In particular, we encouraged participants to describe how they would interpret each card and asked them whether they had doubts about the meaning of some items or terms used. The sessions lasted between 35 and 47 min and were video recorded with consent from participants.
2.1.2. Semi-Structured Interviews
Semi-structured individual interviews were conducted with four prosumers (all are solar PVs owners) recruited among the participants in the H2020 SMILE project. At the time of the study, participants had an average of around 3 years of experience as energy prosumers (ranging from 2 to 4 years), with average power capacity installed corresponding to 2530 W. One of the participants installed a secondhand system. Out of four solar PV generation units, three have been installed by professionals (certified electricians and installers) and one by the owner himself. Three families out of four have children. Age ranges of participants and family members vary between 15 years old and 74. Professional occupation and educational background are very diverse among the sample.
Interviews started with a warm-up discussion about their experience as prosumers before moving on to issues faced and what they wish they would have known before becoming an energy producer. Other questions targeted the way they searched for and got all information and/or support needed to turn into prosumers, as well as current needs and motivations for improving their installation. Interviews lasted between 15 and 25 min, were conducted over the phone, recorded (with consent), and transcribed. Interviews were analyzed using an inductive–deductive approach [35]. All individual statements were printed on separate cards. Affinity diagrams were used to identify main themes and categories [34]. To ensure the reliability of the analysis, three researchers analyzed and coded each interview independently. The resulting themes and categories were compared and discussed. The researchers deliberated on coding discrepancies and disagreements until consensus was reached.
2.1.3. Brainstorming Sessions
A series of brainstorming sessions with HCI experts and interaction designers was conducted to define the information architecture of the platform and its design. Results from the thematic analysis were used to inform the sessions and help generate ideas. The entire platform, from the overall architecture to the individual pages, was iteratively designed using diagrams, whiteboard wireframes and paper mockups.
It should be pointed out that the ideation phase was carried out contemporary to phase 2 “content gathering and validation”. Indeed, although our methodology is here described in a linear fashion, the research steps were not conducted linearly. The user interface (UI) design was informed by the typology of content gathered, and all material collected was carefully analyzed prior to defining a set of formats for content presentation.
2.2. Phase Two—Content Gathering and Validation
The diagrams representing the information architecture of our system were used to form a table of content, which then guided extensive desk research aimed at gathering all content and materials to be included in the platform. Such content was collected from multiple sources including scientific literature, policy and regulatory documents, technical reports, and various internet sources. Information search was based on two main criteria:
- content produced/released by a reliable source (e.g., peer-reviewed journals, governmental authorities, utility companies, and various institutions working in the energy-environment domain).
- relevant for the specific context of Madeira island.
The information gathered underwent an extensive editing process aimed, in particular, at producing a more ‘user-friendly’ version of the text (e.g., translate complex jargon or remove unnecessary technical language). The editing and reviewing work was particularly demanding and followed a two-step process. First, an initial version of the text was drafted and iteratively reviewed by several researchers from the SMILE project team. Second, the resulting document was shared with external experts working for (i) the Regional Directorate of Economy and Inland Transports (DRETT), Funchal, Portugal, (ii) the Empresa de Eletricidade da Madeira (EEM—the local DSO), Funchal, Portugal, and (iii) the Regional Agency for Energy and Environment of the Autonomous Region of Madeira (AREAM), Funchal, Portugal, to verify completeness, quality, and correctness of the content.
2.3. Phase Three—Prototype and Test
A high-fidelity prototype of the platform was thereafter created and tested with potential users (N = 5). For the purpose of the study, the methods used were observation combined with the concurrent think-aloud protocol and a survey to assess information retrieval and usability, and more in general, to investigate how participants use the system.
An additional card-sorting exercise (N = 3) was conducted to further assess structure and labeling of the navigation menus.
2.3.1. Study 1—Think-Aloud Protocol and Survey
The study was conducted during the Covid-19 pandemic. It took place outdoors and in compliance with the Covid-19 prevention protocol.
The study started with a survey aimed at collecting demographic information. This was followed by a think-aloud protocol and a questionnaire aimed at collecting some quantitative data about the system’s usability.
Three females and two males with ages ranging from 44 to 49 years (average age was 46 years) participated in the study. Three live in a family with children (one, two, and four children respectively, with ages ranging from 7 months to 18 years), and two live with a partner. None of the participants is a prosumer, three out of five own a solar water heating system, and one has recently purchased an electric vehicle.
Think-Aloud
The think-aloud is one of the most popular HCI techniques to evaluate interactive systems [36]. Participants in a concurrent think-aloud session are asked to verbalize whatever crosses their mind while performing a given task. This method is therefore particularly useful in contextual inquiry because it allows “to get users’ inferences, intuitions, and mental models” [37] (p. 137).
In order to observe how potential users would interact with our system as well as assess aspects related to information retrieval and usability, the following seven tasks were given to participants:
- Find information about the purpose of the platform and how it works;
- Read the title of the menu items and tell us what you think they are about;
- Tell us the main energy-related information you would like to know more about and find it on the platform;
- Find information about existing energy tariffs and cycles;
- Find information about the existing energy labels;
- Find information about the main steps to take in order to install a solar PV generation system;
- Find information about the main components of a solar PV system.
The sessions were carried out individually. Participants took an average of 25 min to complete the tasks, and all gave consent to video record the think-aloud sessions.
Prior to each session, researchers explained the think-aloud procedure to participants and demonstrated how to verbalize while thinking. During data collection, one researcher silently observed the participant as he/she worked through problems and noted specific events of the protocol. At the end of each task, follow-up questions were asked for clarification.
The results were obtained by analyzing (i) task performance and (ii) verbalization data. Specifically,
- task performance was determined considering whether the task was completed correctly or not and the number of wrong clicks before successfully completing a task (‘good performance’ = 0 or 1 wrong clicks, ‘moderate’ = between 2 and 4 wrong clicks, and ‘poor’ ≥ 4 wrong clicks). Overall performance for each task was obtained using mean value of wrong clicks.
- verbalizations made while performing the tasks were transcribed and thematically analyzed using a general inductive approach. Two researchers coded the major processes of task completion independently before reviewing the codes jointly until consensus was reached.
Survey
In order to collect additional data about perceived usability, after completion of the think-aloud task, participants were asked to fill in an online survey containing the System Usability Scale (SUS), developed by Brooke [38], and a set of additional questions (see Table 1). Specifically:
- 8 closed-ended questions rated on a 5-point Likert scale (1 ‘totally disagree’ to 5 ‘totally agree’) addressing aspects related to information retrieval, perceived quality and reliability of the content, and perceived usefulness; and
- 3 open questions regarding positive and negative aspects of the platform and suggestions for improvements.
2.3.2. Study 2—Card-Sorting
Parallel to the think-aloud session, a second study consisting of a closed card-sorting exercise was conducted to further test structure and labeling of the navigation menus. Unlike the open version, in closed card-sorting, participants are given a set of predefined categories in advance (i.e., the main section of our information platform) and asked to sort the remaining cards (i.e., topics and subsections of all webpages) according to their semantic closeness to those categories [31]. This type of card sorting was chosen because it proves particularly useful when “redesigning the existing information architecture of a website” [39] (p. 11). Once again, the exercise was combined with a think-aloud description of the cards.
Three subjects, all females (average age was 30.3 years), participated in the study. Participants were recruited among researchers and Ph.D. students in HCI and digital media at the Madeira Interactive Technologies Institute. The exercise lasted around 20 min and was conducted in compliance with the Covid-19 prevention protocol. Informed consent was provided to participants. The study was conducted by two researchers: one facilitator and one note-taker. Pictures were taken throughout the exercise to support data analysis, which followed a general inductive approach.
3. Results
This section aims to describe the results obtained for each research phase as explained in Section 2. Phase 1 provides a summary of the information needs emerged from the card sorting exercise conducted with energy consumers, and the semi-structured interviews with prosumers. Phase 2 characterizes the desk research conducted to gather content for the platform. Phase 3 outlines the results from the platform’s prototyping and testing. The section ends with a report of users’ interactions with the platform over a period of four months after its release.
3.1. Phase One—Information Needs
3.1.1. Card Sorting
The main information needs detected among consumers through the card sorting exercise evolved around the following aspects: personal impact on energy consumption, further understanding of the electricity bill, and lack of knowledge about the electrical appliances and its energy use.
Participants could easily associate routines to family members, through certain time periods within their household, and which devices were being used; however, they felt there could be some space for improvement. As mentioned by C5, “I’ve organized according to my routines, and the more family members there are the more consumption, even more if you have children, it tends to increase the electricity use in the home (…) and in terms of times of the week, weekends we use different things”. In that sense, they would like to know more about how personal aspects impacted energy consumption. For instance, having a system that could provide customized suggestions to improve their efforts in managing their household consumption—not so much using household members identification, but more in terms of activities as grouped in the card sorting exercise given during the sessions. If there was not a system that would automatically suggest these, they would like to learn more about other types of personal variables that affect consumption so they could correct some behaviors within their home. As mentioned by C1, “I’d like to know if I’m using too much in the mornings or in the evening, if I should rather change these activities and perform them on the weekend for example”.
In terms of the electricity paper-based bill, participants did not know how to read the bill, other than the information on how and how much to pay for it. Their lack of knowledge was evident when trying to read and explain the taxes and why they were being charged certain amounts. In addition, they were not sure what was the power contracted and what it meant for their household, or if they could do anything to change it. As voiced by C1, “I don’t know what that means (power), it’s not something I hear everyday, they put it here but people don’t know what it means, I only look at the price”. Or following what C6 quoted as “I don’t know why I have to pay this (audiovisual tax), I know it’s mandatory but why do I need to pay this? Why is it related to electricity? Do you know why?”.
In what concerns electrical appliances, participants knew how to use the devices, that some affected the bill more than others; nevertheless, they could not differentiate between high consuming devices through long periods of time, consumption measurement or practical understanding of the energy classification that would allow them to purchase more efficient appliances in the long term. One consumer organized the appliances all in one pile as a reflection of this limited knowledge C4, “I’ll just place it here with all the electronics”. In fact, they revealed the need to learn more about the electrical appliances power and the energy classification. In spite of having a general understanding of these energy categories, these could be even more user-friendly language oriented because they would most of the time rely on price to purchase such devices along with the energy classification. Our general understanding is that the most efficient devices are known to be the most expensive.
When approaching the topic of energy production, consumers had very little information about the topic. In fact, the most referred aspect was equipment costs, with cost being a major aspect of the decision if they were to become prosumers at some point in their life. As revealed by C6, “The idea that I have is that it is very expensive (to produce your own energy at home) (…) another thing is how much space do I have to have to install the panels? Is my house in a good position to capture solar energy or in a way I can place solar panels?”. Participants had very little information about other cards shown, but once they read about it, they were curious to learn more about the equipment needed and legislation.
3.1.2. Semi-Structured Interviews
Problems Prosumers Initially Faced
The starting point for prosumers was either the need to explore new technology, invest some personal money in productive and long-term gains in mind, or to be able to use green energy. As for the latest, prosumers assumed that it would be an easy process to do because the news would mention a series of intentions from the governments to pursue more green energy initiatives. However, while researching on how to install photovoltaic panels and setting up their home energy production unit, they realized there were a few obstacles that made it harder for them to do so. As one prosumer mentioned P4, “I did my homework for several months (…) exchanged several emails with several companies, budgets, shipping costs, types of equipment”. For instance, the legislation was not clear or hard to find, especially the one about the regional area where they lived. As shared by prosumer P1, “My main problem was my house, I live in an apartment, I had to request permission from the management company and other apartment owners because I needed to have cables reach my 1st floor apartment (…) I did not know how to do it, I asked around”.
When contacting the local energy company, they would be discouraged to install such equipment, or the arguments would be they were not allowed, but no specific mention to which rules or laws were not being followed. In some cases, they could not reach or be given the most adequate person in the company who could provide the most updated and correct information. As stated by P2, “I tried to know their relationship with (the company) energy producers, then I realized they no longer purchased energy surplus from them (…) I didn’t know where to look any further (…) I believed the installer would be more honest and install the right equipment (…) I did not feel I could count on the company (electricity supplier)”.
In addition, prosumers could not find a list of installers or professional sellers in the island who they could talk to or even purchase the equipment needed for energy production, as prosumer P3 said “I must have talked to three or four installers, did not hear back, eventually found one to install the panels”. In fact, local companies would at the time discredit it as a possibility and underestimate its benefits as shared by one prosumer P4, “I remember the lack of credibility (…) I approached local company X and they said it was not worth producing energy and storing it, it was not profitable enough (…) my understanding is that they were trying to discourage me from installing panels”.
As a result, prosumers felt the need to research on their own and learn more about the components because they came to find, these could be adjusted to their own needs, depending on their household size, location and sun exposure, among other variables. As P2 shared, “I think it is really important to check the type of electrical installation in your house, the consumption you make and then choose the panels among the available prices and options, to assess if it is really worth it or not”. On one hand, they learned while studying more the matter, mostly on the internet or conversations with electricians. On the other, it was a significant part of their personal financial investment, and they needed to make sure they were buying the right equipment for their needs. Learning about the components helped them to make more informed decisions while eventually approaching installers in the mainland.
In terms of their experience throughout time, once the equipment was installed, they expected more production and more savings than the ones promised by the equipment. Later they learned more about other aspects, such as the need to conduct maintenance to improve the panels performance, or the need to adapt personal habits using the appliances to match the highest solar production times in the day. Indeed, P4 stated “If I were to install the panels today, I’d change the location, because my recent web search indicates I can produce more energy if these are in the roof, which in my case they are not”. At the end of the study, P4 phoned the team and had actually changed the panels to the roof of his house, ignoring the lack of aesthetics (which was his first concern when he installed the panels), to further optimize his energy production system.
Prosumer Information Search
In terms of information search, as described, prosumers found it hard to find, very widespread, or, when they found it, hard to interpret and understand. It was also difficult to find local information about the laws; the information was either confusing or not official. Their main source was online through installers they found in Portugal mainland.
The next stage for the prosumers already established revealed their quest for more information continues because they feel they still have a lot to learn. Overall, there is still a lack of resources and guidance on how to upgrade their current installations. For instance, having additional sources of information, understanding and learning more about additional equipment they could install to improve their production such as smart meters, Battery Energy Storage Systems (BESS), adding more photovoltaic panels, among other aspects. Or in the case, they do not have more money or space to add more hardware, they would like to learn of other alternatives they could apply to optimize their production, whether it could be change of habits, purchasing electrical appliances that are more recent, replacing a current component for a more recent one, or any other measure known to help optimize even further the energy domestic production. As stated by P1, “I’m very much interested in improving my installation, I want to upgrade it by adding a wind turbine (…) but companies do not seem to know how to do it (…) I have already received my building’s permission, just have to find a company that supplies it and knows what they are doing (…) I think it could be used to collect energy during the night, when there is plenty of wind available, and then I’d use the panels during the day”.
The sessions conducted with prosumers served as a guide to understand resources used and contact points if any in the island used to start home energy production units. As a result, the following patterns were categorized as a guide that future consumers could follow on their journey becoming prosumers.
The patterns identified were expectations to be considered, advantages and reasons to become a prosumer, steps to be conducted in terms of roles, responsibilities, location assessment and installer analysis. In addition, information specific to equipment, explanations of main components and how these work, to support informed decisions while approaching installers, as well as an updated list of installers either based or shipping to the island. Each section was composed to answer specific questions, as we believe this format would support the information search process in a user-centered perspective. Table 2 displays the questions for each type of consumer chosen to support the information search process.
3.1.3. Brainstorming and Ideation/Info Architecture
The next stage comprised the organization of the information platform content. The goal was to gather the content to fill in each question listed in the Table 1 to support information needs verified in Phase 1. The strategy used to create the questions was splitting these into smaller and simpler categories or sections, in order to create a step-by-step learning experience. Especially for the case of technical related concepts, a gradual exposure to such elements seemed the most adequate strategy—in order to reach different user starting-knowledge levels—where users could easily navigate, without feeling overwhelmed, and select the depth of information as desired or needed. An example of the information architecture used in the consumer section can be seen in Figure 1.
The consumer section was grouped into the three main following areas:
- How to read/interpret my electricity bill? The goal of this question is to increase the energy literacy specific to terms used in the electricity bill as it emerged as a potential knowledge gap that could empower consumers to feel more informed and in control of their monthly expenses.
- How do my appliances consume/use energy? An additional knowledge issue was associated with appliances and how they use energy, namely the power and how it works. This area was formulated around the explanation of the power concept and it differs for different appliances. Furthermore, explain as well the existing energy labels and why these are important when purchasing an appliance. An example of this can be seen in Figure 1.
- How do we (users) influence our energy consumption? Users could easily associate their routines to their consumption but wanted to further learn of others factors they could perhaps act upon to reduce or control it. For that matter, the ideation resulted in the research of additional factors which are explained with detailed descriptions, for instance, type of house, moments of the week/weekend versus work days, moments of the day, number of family members, having allergies in the family, and activities (laundry, meal preparing, cleaning, among others).
The Prosumer section was structured in six areas:
- What does it mean being a prosumer? This question gathers information about what defines a prosumer, and what to expect from it.
- Why become one? This area describes reasons and benefits to encourage more people to consider becoming one.
- How to start? This section focuses on providing cues users can use to learn to identify contextual characteristics in terms of responsibilities and who to contact or how to select the most adequate installer. As well as conduct location assessment by analyzing the following characteristics: type of house, technical characteristics and/or potential limitations.
- What is next? This section focused on listing estimation in terms of equipment costs, explaining how it works, referring to logistics in terms of photovoltaic characteristics and placement, and finally how to conduct its maintenance.
- Who? This area lists professionals, and both informal and formal sources of information to be used as guidance.
- Further improvements—this area was destined to prosumers with equipment who want to upgrade their current systems, description of additional components, suggestions of alternative equipment or even a list of software available in the market that could help optimize their photovoltaic panels even further.
3.2. Phase Two—Content Gathering and Validation
During the content gathering phase, we encountered the same issues reported by people during the SMILE participants recruitment process and the several dissemination activities performed throughout the project. That is, the information is
- widespread;
- not easy to understand (very technical or full of complex jargon);
- often contradictory or unreliable (several unofficial sources that provide different and misleading information).
Therefore, results from desk research support the need for a comprehensive, context-specific, reliable and, most importantly, user-friendly information tool. For this purpose, the extensive body of information gathered underwent an editing process aimed not only at simplifying the language but also at ‘translating’ the content (as much as possible) into a visual form. In this sense, ‘content gathering’ and ‘ideation’ were conducted contemporary. The ‘information blocks’ gathered for each section of the platform were analyzed at the semantic level. As a result, the following design guidelines and set of formats for content presentation were defined:
- Remove complex jargon and unnecessary technical language. When not possible to do that (e.g., terms relevant to ‘interpret’ the legislation), include a user-friendly explanation of the terminology;
- Processes (e.g., bureaucratic steps to register a solar PV installation) should be presented in a visual form, for example a timeline or a bullet list;
- Technical description of hardware (HW) components should always be combined with a realistic or diagrammatic representation of the element, so as to help user understand and ‘visualize’ it;
- In-depth descriptions of the components of a more complex element (e.g., the electricity bill or energy label) should be presented in the form of a visual diagram containing interactive hotspots that give access to further information.
- Use different visual languages to differentiate the typology of information. For instance, illustrations and videos to describe social-related aspects (e.g., how some behaviors could influence energy consumption), while pictures or diagrams should be used to represent technical content.
Finally, the UI design was detailed using wireframes and paper mockups (Figure 2).
3.3. Phase Three—Prototype and Test
After textual and visual content was gathered, edited and validated by experts, we created a high-fidelity prototype of the information platform (Figure 3). The prototype was tested with potential users (N = 5) in order to assess aspects related to information retrieval and usability. An additional card-sorting exercise (N = 3) was conducted to further assess structure and labeling of the navigation menus. Results of both studies are reported below. The section ends with a summary of results from phase three and consequent refinements made to the platform.
3.3.1. Think Aloud
Task Performance
In terms of task performance, the think-aloud sessions produced good results (summarized in Table 3). Six out of seven tasks were successfully completed by all participants, with average performance levels ranging between good (T01, T03, T05 and T07) and moderate (T06). While task 04 was not completed by any participant.
Verbalization Data
Task 01—Find information about the purpose of the platform and how it works:
All participants successfully completed the task without any difficulty. Interestingly, even before starting to perform the task—i.e., searching for the web-page that provides such information—one participant was able to tell us the main purpose of the platform and its target audience by looking at the top menu, “it looks like an informative website to me. It’s for those who produce energy (moved the mouse over the item “self-consumers”) …but it also provides information for energy consumers (moved the mouse over “consumers” and started reading the items of the drop-down menu)” (C6). This suggests that the way the menu structure is designed and displayed provides insights on what to expect not only in terms of content but also functionalities.
Task 02—Read the title of the menu items and tell us what you think they are about:
All participants provided a correct description of the menu and submenu items related to the “consumer” section. However, several comprehension issues emerged with the items belonging to the submenu “self-consumers”. This result could be partially explained by the fact that all participants in the study are not prosumers, and therefore not familiar with aspects related to renewable energy production: “I’m not even sure what a self-consumer is. It would be interesting to have an official definition for it” (C5).
The most critical items (all participants had difficulties in providing a definition for them) were (i) where to start; (ii) how it works; (iii) professionals; and (iv) improvements. Verbalization data suggests that those items were perceived as too generic. For example, when talking about “how it works” a participant stated, “‘Where to start’…mmmm, I don’t know. It’s quite general. If I have to guess, I’d say it could be about where one can buy the equipment or…I don’t know” (C5). Such a lack of specificity led to several misleading interpretations and hesitant guesses: “‘Professionals’ might be a list of companies that have solar panels and sell the energy they produce” (C7) and “(Professionals) could be a list of suggestions to become a pro; to learn more about energy production” (C9).
Task 03—Tell us the main energy-related information you would like to know more about and find it on the platform:
All participants successfully completed the task without any difficulty. However, two out of five confessed that they picked a piece of information that caught their attention while performing task 02 instead of thinking about an existing information need: “I choose ‘energy label because I knew it was there. Anyway, that is something I was already curious about” (C6). Although the main goal of this task was to test information retrieval, this finding suggests that the topics selected during phase 1 (i.e., understanding users’ information needs and ideation) are indeed relevant to our target audience. Almost every participant, while performing task 02, showed genuine interest and curiosity about several items, “(interpreting the item ‘factors that influence consumption’) That’s interesting. I’d like to know more about what affects my energy consumption and whether there is something I can do to reduce it” (C8).
Task 04—Find information about existing energy tariffs and cycles:
None of the participants completed this task. Two different but related issues led to such result: (i) lack of affordance and (ii) lack of consistency.
(i) This specific piece of information was accessible only through one of the interactive hotspots embedded in the sample image of an electricity bill (see Figure 4). However, none of the participants understood that the sample bill was an interactive element and therefore kept searching for information about tariffs and cycles throughout the page: “(to one of the researchers) If you hadn’t told me, I would have never selected those green circles on the bill. I thought that was just an image” (C8). The main bottleneck here was a lack of affordances—i.e., properties of an element of the UI which provide a prompt on how to interact with it.
(ii) Normally, after selecting one of the hotspots, a pop-up window providing a description of the item opens (see Figure 4). However, unlike the other interactive items, the amount of information regarding energy tariffs and cycles is too extensive to fit into a pop-up window. Therefore, after a short description of the item, a link that leads to a stand-alone page with further information on the subject is provided.
After the researchers revealed that the sample bill was an interactive element, all participants found the correct hotspot, but only three out of five accessed (not without any difficulties) the ‘tariffs and cycles’ page by selecting the link at the bottom of the pop-up window. The difficulties experienced in finding the link could be explained by a lack of consistency in the mode of interaction. Indeed, throughout the platform, whenever the user is given the possibility to access further information about a topic, such feature is provided through a green, “Read More” button (Figure 4). Such a lack of consistency was clearly highlighted by one of the participants during another task: “(talking about the “Learn More” button) here it is clear that I can open another page and find more information” (C5).
Task 05—Find information about the existing energy labels:
All participants successfully completed the task without any difficulty. Part of the information regarding the energy label was provided through a visual diagram containing interactive hotspots, similar to the one involved in task 04. Participants immediately recognized it as an interactive element, “This must be like the bill! Let me see what these symbols mean (selected some hotspots)” (C8). Once again, this suggests that the only issue with such format is the lack of affordances, which makes it very similar to any other static image. However, users just need to experience it once to immediately interiorize it.
Task 06—Find information about the main steps to take in order to install a solar PV generation system:
All participants experienced some difficulties in performing this task. From the verbalization data it emerges that all obstacles are linked to unclear or misleading labeling. In particular, three menu items were the major source of confusion: “being an energy producer” (about legal framework), “where to start” (about the steps to become a prosumer), and “how it works” (describing the components of a solar PV system). C5, for example, went first to ‘how it works’, “if I want to install solar PVs I need to know how that works”, then to ‘being an energy producer’, “perhaps this one…being an energy producer in the sense of how to become one”, and selected the right section only on the third try.
Participants also appreciated the way the information was presented (i.e., the steps were visualized in the form of a timeline) “I like the timeline. It’s easy to understand; a sort of step-by-step guide” (C6).
Task 07—Find information about the main components of a solar PV system:
All participants completed the task without any difficulty. However, it must be pointed out that four out of five subjects had already explored that page while performing the previous task, therefore they already knew where to go. In this regard, several suggestions on how to relabel the item were provided: “I’d rather call it ‘the system’ or something like that” (C8) and “‘Components’ is more appropriate. ‘How it work’ makes me think about something related to procedures” (C7).
3.3.2. Survey
A survey containing the SUS and a set of additional questions was administered to collect additional data about perceived usability and perceived quality of the platform. Individual responses to the SUS items (Table 4) indicated that all participants considered usability of the platform as ‘excellent’ and ‘best imaginable’ [40] (p. 592), with scores ranging from 75.0 to 87.5. The overall mean score was 83, therefore ‘excellent’.
The SUS items were followed by a questionnaire composed of (i) eight closed-ended questions addressing information retrieval, quality and reliability of the content, and perceived usefulness, and (ii) three open-ended items focusing on more general topics such as positive and negative aspects. All the eight closed-ended items scored high and the responses were homogeneous among participants (see Table 5).
Unsurprisingly, the two items with lower scores are those related to information retrieval (item 1) and content structure (item 6). Such results are consistent with those from the think-aloud sessions, where participants experienced difficulties while performing information search tasks due to some misleading labels. On the other end, respondents seem to perceive the platform as a reliable tool and have appreciated the quality of the information provided in terms of both content and presentation. Usefulness (C6 and C9), quality of the information (C6, C7 and C8) and content presentation (C5 and C6) were also reported in the three open-ended items as positive aspects of the system. As expected, the main negative aspects that emerged overlap with the bottlenecks experienced during the think-aloud sessions, in particular, unclear labeling (reported by all participants) and lack of affordance of some interactive elements (C5 and C8). Besides listing positive and negative aspects, some participants provided suggestions for improvements. Most of them regarded the need for relabeling some menu items (C5, C6 and C7) and increasing visibility of interactive features (C5 and C8). C8 also suggested implementing a search functionality to facilitate information retrieval.
3.3.3. Card Sorting
All participants easily sorted the cards related to energy consumers and placed them in the ‘right’ category, with only minor differences from the original content architecture.
Difficulties emerged with the content of the section about energy producers. Once again, this could be partially explained by the fact that none of the participants is a prosumer and therefore is not familiar with aspects related to energy production. Participants attempted a semantic interpretation to sort those cards whose meaning was unknown to them, “‘irradiance’ must have something to do with light and solar radiation so, it could be an aspect that influences the amount of energy produced by solar PVs” (C11). By adopting this strategy, they managed to sort almost all of the remaining cards. However, a few cards were left aside by all participants, in particular those related to more ‘technical aspects’ such as: Demand Side Response Strategies, Inverter, Energy Monitoring Systems. Interestingly, participants in the think-aloud did not report any issues regarding those items. This could be explained by the fact that in the platform, technical terms are always combined with a user-friendly explanation and/or some visual support (see design guidelines Section 3.2).
Another issue that emerged from the card-sorting exercise (also reported by the participants in the think-aloud sessions) is that some of the menu labels were too generic, suggesting the need for detailing them further: “(talking about ‘improvements’, which was one of the fixed categories of self-consumers) This one could also belong to consumers. People can make improvements to reduce their consumption” (C10). Finally, the menu items reported as the major source of confusion were consistent with those that emerged in the previous study: “I had doubts on whether to put this one in ‘being an energy producer’ or ‘where to start’. These two categories have pretty much the same meaning to me” (C12).
The results obtained in this phase show the excellent usability of the platform, in particular from the findings of the SUS administered to the participants. However, results from think-aloud and card sorting enable the identification of the main problems that needed to be addressed and also enlighten us with valid and relevant solutions, taking into account the input collected from the participants. In fact, the two main problems detected were that some labels are too general that led to mismatch and therefore unknowing the content-related inside some sections, and that the navigation aids were not clear or immediately detected and perceived. Consequently, we had the conditions to make the changes to improve the platform. Concerning the navigation aids, we added “Learn more” to access pages about “Tariff and Cycles” and increased the dimension of hotspots and animated instructions on how to use the interactive diagram in “How to read my electric bill” and in “Energy Label”. Finally, we rephrased the labels based on suggestions provided, as shown in Table 6.
3.4. Users’ Interactions with the Platform
Energias Madeira was refined according to the results of the prototype and test phase, and ultimately released. For that purpose, the local SMILE partners—(i) Associação do Comércio e Indústria do Funchal (ACIF-CCIM), Funchal, Portugal, (ii) EEM, Funchal, Portugal, (iii) PRSMA, Funchal, Portugal, and (iv) Interactive Technologies Institute (ITI), Funchal, Portugal—organized a public event to launch the platform. The event was held at the headquarter of ACIF-CCIM and attended by a representative of the Regional Energy Regulator. To ensure effective dissemination of Energias Madeira, the full event was covered by local television and the platform promoted on the Social Media channels of the SMILE partners.
The users’ interactions with the platform have been constantly monitored via Google Analytics. When comparing data of month 1 (February 2021) with that of month 4 (May 2021), we observe an increase in all the metrics (see Table 7). Particularly relevant is the percentage of returning visitors, which increased from 0.4% of February to 15% of May. This very preliminary result suggests not only that the information platform keeps attracting new users, but also, and especially, it seems to retain an increasing number of them.
4. Discussion
Access to reliable information about energy consumption and production without overwhelming the users will be an essential condition to sustain a transition towards a higher share of renewables. Similarly, as done in the UCD approach, focusing on the users’ needs and interests [21,22], it will do so by bringing more users to get involved in the energy management and generation, by becoming themselves energy collaborators in the design of this renewable future. Our work uncovered information gaps and lack of resources faced by consumers and energy producers, which later were used to build an information platform we believe will help sustain the transition mentioned above.
In spite of the large number of initiatives to raise awareness and foster sustainable behaviors, the “top-down approach” used through the creation of new policies, technological improvement, economic incentives, etc., fails to reach consumers’ needs and concerns. More specifically, it does not address the first and most important problem that prevents users from getting involved, which is the low energy literacy as seen in [12,13,14]. This case study intends to demonstrate a “bottom-up approach” while looking at end-users and their needs, which is at the heart of HCI practice and UCD approach [21,22]. Despite HCI being involved only at the end of the design process (validation/usability/testing), the current work presented an example of how HCI methodologies could be used throughout the entire design process, from ideation to validation. For this particular case, it works from users’ current knowledge assessed in the early phases of the design process, without assuming users’ knowledge levels. By doing so, the chances to reach more effective and less “expensive” actions or measures are much greater. Nevertheless, we would like to emphasize that our main focus is on the process and methodology adopted to design the platform, which should therefore be regarded as a case study.
When user needs are considered and directly collected, users are more likely to participate, feel heard, and more prone to engage in green energy-related initiatives [9,10,11]. The key to user engagement relies on the supply of information that is directly relevant but also provides benefits that are clear for the users. As a result, for certain cultural contexts, some benefits might be more relevant than others. As such, the HCI process and methodologies that aim to increase user engagement seem the most adequate because they will consider the unique characteristics of each location [6,25,26,27,28]. Being that Madeira has a complex geographic context, this methodology seems to be adequate in delivering the energy education needed to address the low literacy levels as suggested by [8]. In fact, these methodologies are a great contribution since its practices for modeling the link between interactive technologies, human values, and lived experiences were the perfect tool to adopt in this case study. Its focus is particularly fundamental when designing digitally mediated experiences aimed at raising awareness on environmental issues and energy efficiency. In particular, energy literacy, essential to have users on board to learn of other ways they can increases energy efficiency within their households [7,8].
The process used here, namely, research through design, was the most appropriate approach to design the platform, as it combined an iterative approach where user’s needs in the ongoing research project were thoroughly analyzed. At the beginning of SMILE, the team faced great difficulties recruiting users that could join the project, which later came to explain that the island’s energy literacy was still far from the numbers reported in other European areas—not due to the lack of attempts, but to the lack of reliable and centralized sources of information that could help users understand, learn and participate in the energy green initiatives, energy production being one of them. This work provides a description of the steps and how HCI methodology was used to bring these users into the conversation on energy efficiency and smart grids. At least the remaining users, which were a large section of the population, as part of the ones eventually recruited to the project, were essential to structure and model the knowledge gaps into the tool we described—the information platform.
Increasing energy literacy meant matching the current information gaps in terms of energy consumption and production, directly relevant to the ongoing research project. As a result, the iterative nature of the work conducted involved transforming the content in several stages, where the main concerns were removing unnecessary complex language, complementing technical descriptions with diagrammatic representations, in-depth descriptions when necessary, and finally, the use of visual language to support the step-by-step learning experience. Such strategies helped leverage the knowledge as measured in the prototyping and testing sessions. The preliminary analysis of the user access to the information platform indicates that a user-centered approach does attract users to explore the information and come back to it, retaining them throughout time. Further work would be necessary to evaluate if the knowledge gain was sustained over time. Being that the platform an always accessible and living tool, it can be consulted at any time the consumers feel the need to and will be updated according to changes that may occur about the sections displayed.
5. Conclusions
We presented the development of an information platform targeting Madeiran citizens using UCD and HCI methodologies to understand and assess users’ energy literacy. Unlike other user-driven initiatives, this work describes one that brings users throughout all stages of design. The creation of such a platform had the essential collaboration of the energy players in the regional context, which were in part identified in the need collection phase while interviewing both consumers and prosumers. Finding the formal and reliable sources involved navigating the complex and bureaucratic nature of such aspects, and in fact, was facilitated through the HCI methodologies previously described. Finding such elements in the community as soon as possible is one of the contributions while adopting such work tools. It not only validates the work but also adds credibility, especially for smaller regions such as islands. On the other hand, further work would need to be conducted to verify if similar information gaps and needs would be found in other regions across Europe. If so, we would recommend the approach used in this case study.
We would like to emphasize that the number of participants was limited due to the restricted access to users imposed by COVID-19 confinement measures. If it were not so, a validation study would have been conducted using a workshop format with further prosumers. Nevertheless, it allowed for a more qualitative approach while refining the information platform.
This work can be extended in several ways, one being the inclusion of other emergent topics such as electric cars and smart charging technologies and approaches. Other ways include by evaluating knowledge gains over time, understanding how to help citizens learn green initiative terms, or even determine how the information platform can be used to support institutions addressing their users’ current energy literacy. This work’s goal will be to update the platform as needed to strengthen the energy literacy of consumers and turn them into the energy collaborators of the future.
Author Contributions
Conceptualization, Methodology, Validation, Formal Analysis, Investigation, Data Curation, Writing—Original Draft Preparation, Writing—Review & Editing, Visualization, S.S., C.P., M.B. and L.B.; Supervision, Project Administration, S.S. and M.B. All authors have read and agreed to the published version of the manuscript.
Funding
This project has received funding from the European Union’s Horizon 2020 research and innovation program under grant agreement No 731249.
Institutional Review Board Statement
Ethical approval was not sought for the present study because no more than minimal risk was identified. This study meets the necessary ethical requirements and does not include activities or results that pose safety problems for the participants. Data were properly anonymized and informed consent was obtained at the time of original data collection. Data storage meets current Data Protection regulations.
Informed Consent Statement
Informed consent was obtained from all subjects involved in the study.
Acknowledgments
This publication reflects only the author’s view. The European Commission and the Innovation and Networks Executive Agency (INEA) are not responsible for any use that may be made of the information it contains. The authors would like to express their gratitude to all the participants that took time and interest to participate in card sorting, interviews, tested the platform and answered the questionnaire. Authors would also like to thank EEM, AREAM, DRETT and researchers from SMILE project for their contribution in reviewing the content of the information platform.
Conflicts of Interest
The authors declare no conflict of interest.
References
- United Nations. Transforming our World: The 2030 Agenda for Sustainable Development: Resolution Adopted by the General Assembly on 25 September 2015. Available online: https://www.un.org/en/development/desa/population/migration/generalassembly/docs/globalcompact/A_RES_70_1_E.pdf (accessed on 5 October 2020).
- Kang, J.-N.; Wei, Y.-M.; Liu, L.-C.; Han, R.; Yu, B.-Y.; Wang, J.-W. Energy systems for climate change mitigation: A systematic review. Appl. Energy 2020, 263, 114602. [Google Scholar] [CrossRef]
- Perri, C.; Giglio, C.; Corvello, V. Smart users for smart technologies: Investigating the intention to adopt smart energy consumption behaviors. Technol. Forecast. Soc. Chang. 2020, 155, 119991. [Google Scholar] [CrossRef]
- Lopes, J.A.P.; Madureira, A.; Matos, M.; Bessa, R.; Monteiro, V.; Afonso, J.L.; Santos, S.F.; Catalão, J.P.S.; Antunes, C.H.; Magalhães, P. The future of power systems: Challenges, trends, and upcoming paradigms. Wiley Interdiscip. Rev. Energy Environ. 2020, 9, e368. [Google Scholar] [CrossRef]
- European Commission. The European Green Deal. Available online: https://eur-lex.europa.eu/resource.html?uri=cellar:b828d165-1c22-11ea-8c1f-01aa75ed71a1.0002.02/DOC_1&format=PDF (accessed on 18 June 2021).
- Caramizaru, A.; Uihlein, A. Energy Communities: An Overview of Energy and Social Innovation; Publications Office of the European Union: Luxembourg, 2020. [Google Scholar]
- United Nations. Goal 12: Ensure Sustainable Consumption and Production Patterns. Available online: https://www.un.org/sustainabledevelopment/sustainable-consumption-production/ (accessed on 16 June 2021).
- Chodkowska-Miszczuk, J.; Kola-Bezka, M.; Lewandowska, A.; Martinát, S. Local Communities’ Energy Literacy as a Way to Rural Resilience—An Insight from Inner Peripheries. Energies 2021, 14, 2575. [Google Scholar] [CrossRef]
- US Department of Energy. Energy Literacy: Essential Principles and Fundamental Concepts for Energy Education; US Department of Energy: Washington, DC, USA, 2017.
- Martins, A.; Madaleno, M.; Dias, M.F. Energy literacy: What is out there to know? Energy Rep. 2020, 6, 454–459. [Google Scholar] [CrossRef]
- Martins, A.; Madaleno, M.; Dias, M.F. Energy literacy assessment among Portuguese university members: Knowledge, attitude, and behavior. Energy Rep. 2020, 6, 243–249. [Google Scholar] [CrossRef]
- Filippini, M.; Blasch, J.; Boogen, N.; Kumar, N. Energy Efficiency, Bounded Rationality and Energy-Related Financial Literacy in the Swiss Household Sector; ETH Zurich: Zurich, Switzerland, 2018. [Google Scholar]
- Sovacool, B.; Blyth, P.L. Energy and environmental attitudes in the green state of Denmark: Implications for energy democracy, low carbon transitions, and energy literacy. Environ. Sci. Policy 2015, 54, 304–315. [Google Scholar] [CrossRef]
- DeWaters, J.E.; Powers, S.E. Energy literacy of secondary students in New York State (USA): A measure of knowledge, affect, and behavior. Energy Policy 2011, 39, 1699–1710. [Google Scholar] [CrossRef]
- Notton, G.; Nivet, M.L.; Voyant, C.; Paoli, C.; Darras, C.; Motte, F.; Fouilloy, A. Intermittent and stochastic character of renewable energy sources: Consequences, cost of intermittence and benefit of forecasting. Renew. Sustain. Energy Rev. 2018, 87, 96–105. [Google Scholar] [CrossRef]
- Instituto Nacional de Estatística. Consumo de energia elétrica por habitante (kWh/ hab.) por local de residência (anual). Available online: https://www.ine.pt/xportal/xmain?xpid=INE&xpgid=ine_indicadores&indOcorrCod=0008228&xlang=pt&contexto=bd&selTab=tab2 (accessed on 18 June 2021).
- Data Europa. Special Eurobarometer 468: Attitudes of European Citizens towards the Environment. Available online: https://data.europa.eu/data/datasets/s2156_88_1_468_eng?locale=en (accessed on 18 June 2021).
- Agência para a Energia. Energia em Números: Edição 2020. Available online: https://www.dgeg.gov.pt/media/43zf5nvd/energia-em-n%C3%BAmeros-edi%C3%A7%C3%A3o-2020.pdf (accessed on 18 June 2021).
- Entidade Reguladora dos Serviços Energéticos. Estudo de Literacia dos Consumidores na Área da Energia: Relatório Final. Available online: https://www.erse.pt/media/y23jkwk5/estudo-literacia-consumidores-energia.pdf (accessed on 18 June 2021).
- Park, C.; Yong, T. Comparative review and discussion on P2P electricity trading. Energy Procedia 2017, 128, 3–9. [Google Scholar] [CrossRef]
- Norman, D. The Design of Everyday Things: Revised and Expanded Edition; Basic Books: New York, NY, USA, 2013. [Google Scholar]
- Baxter, K.; Courage, C.; Caine, K. Understanding Your Users: A Practical Guide to User Research Methods; Morgan Kaufmann: Burlington, MA, USA, 2015. [Google Scholar]
- Dourish, P. HCI and environmental sustainability: The politics of design and the design of politics. In Proceedings of the 8th ACM Conference on Designing Interactive Systems, Aarhus, Denmark, 16–20 August 2010; pp. 1–10. [Google Scholar]
- Blevis, E. Sustainable Interaction Design: Invention & Disposal, Renewal & Reuse. In Proceedings of the SIGCHI Conference on Human Factors in Computing Systems, San Jose, CA, USA, 28 April–3 May 2007; pp. 503–512. [Google Scholar]
- Pierce, J.; Paulos, E. Materializing energy. In Proceedings of the 8th ACM Conference on Designing Interactive Systems, Aarhus, Denmark, 16–20 August 2010; pp. 113–122. [Google Scholar]
- Scuri, S.; Tasheva, G.; Barros, L.; Nunes, N.J. An HCI Perspective on Distributed Ledger Technologies for Peer-to-Peer Energy Trading. In IFIP Conference on Human-Computer Interaction; Springer: Cham, Switzerland, 2019; pp. 91–111. [Google Scholar]
- Wilkins, D.J.; Chitchyan, R.; Levine, M. Peer-to-peer energy markets: Understanding the values of collective and community trading. In Proceedings of the 2020 CHI Conference on Human Factors in Computing Systems, Honolulu, HI, USA, 25–30 April 2020; pp. 1–14. [Google Scholar]
- Meeuw, A.; Schopfer, S.; Ryder, B.; Wortmann, F. Lokalpower: Enabling local energy markets with user-driven engagement. In Proceedings of the Extended Abstracts of the 2018 CHI Conference on Human Factors in Computing Systems, Montreal, QC, Canada, 21–26 April 2018; pp. 1–6. [Google Scholar]
- ACIF-CCIM; ITI; PRSMA; EEM. EnergiasMadeira. Available online: https://energiasmadeira.pt/ (accessed on 10 May 2021).
- Spencer, D. Card Sorting: Designing Usable Categories; Rosenfeld Media: New York, NY, USA, 2009. [Google Scholar]
- Wood, J.R.; Wood, L.E. Card sorting: Current practices and beyond. J. Usabil. Stud. 2008, 4, 1–6. [Google Scholar]
- Spencer, D.; Warfel, T. Card sorting: A definitive guide. Boxes Arrows 2004, 2, 1–23. [Google Scholar]
- Thomas, D.R. A general inductive approach for analyzing qualitative evaluation data. Am. J. Eval. 2006, 27, 237–246. [Google Scholar] [CrossRef]
- Holtzblatt, K.; Wendell, J.B.; Wood, S. Rapid Contextual Design: A How-to Guide to Key Techniques for User-Centered Design; Elsevier: Amsterdam, The Netherlands, 2004. [Google Scholar]
- Swain, J. A Hybrid Approach to Thematic Analysis in Qualitative Research: Using a Practical Example; SAGE Publications Ltd.: Thousand Oaks, CA, USA, 2018. [Google Scholar]
- Nielsen, J.; Clemmensen, T.; Yssing, C. Getting access to what goes on in people’s heads? Reflections on the think-aloud technique. In Proceedings of the Second Nordic Conference on Human-Computer Interaction. Aarhus, Denmark, 19–23 October 2002; pp. 101–110. [Google Scholar]
- Hackos, J.T.; Redish, J. User and Task Analysis for Interface Design; Wiley: New York, NY, USA, 1998; Volume 1. [Google Scholar]
- Brooke, J. Sus: A ‘quick and dirty’ usability. In Usability Evaluation in Industry; CRC Press: Boca Raton, FL, USA, 1996; pp. 189–196. [Google Scholar]
- Shinde, P. Application of Existing k-means Algorithms for the Evaluation of Card Sorting Experiments. Master Thesis, Paderborn University, Paderborn, Germany, 2017. [Google Scholar]
- Bangor, A.; Kortum, P.T.; Miller, J.T. An empirical evaluation of the system usability scale. Int. J. Hum.-Comput. Interact. 2008, 24, 574–594. [Google Scholar] [CrossRef]
Figure 1.
The diagram representing the information architecture of the page “How do my appliances consume/use energy?”, which belongs to the “consumers” section.
Figure 1.
The diagram representing the information architecture of the page “How do my appliances consume/use energy?”, which belongs to the “consumers” section.

Figure 2.
The paper mockup for the “Electricity bill” page.

Figure 3.
Three screenshots of the high-fidelity prototype used during the test. “Homepage” (top-left), “Aspects that influence production” (bottom-left), and “Steps to become a prosumer” (right).
Figure 3.
Three screenshots of the high-fidelity prototype used during the test. “Homepage” (top-left), “Aspects that influence production” (bottom-left), and “Steps to become a prosumer” (right).

Figure 4.
Three screenshots of the interactive elements that were discussed by participants during the think-aloud sessions: (a) the interactive image of a sample electricity bill when none of the hotspot is selected; (b) example of the pop-up windows that open when selecting an interactive hotspot; (c) two of the “read more” buttons that give access to additional information.


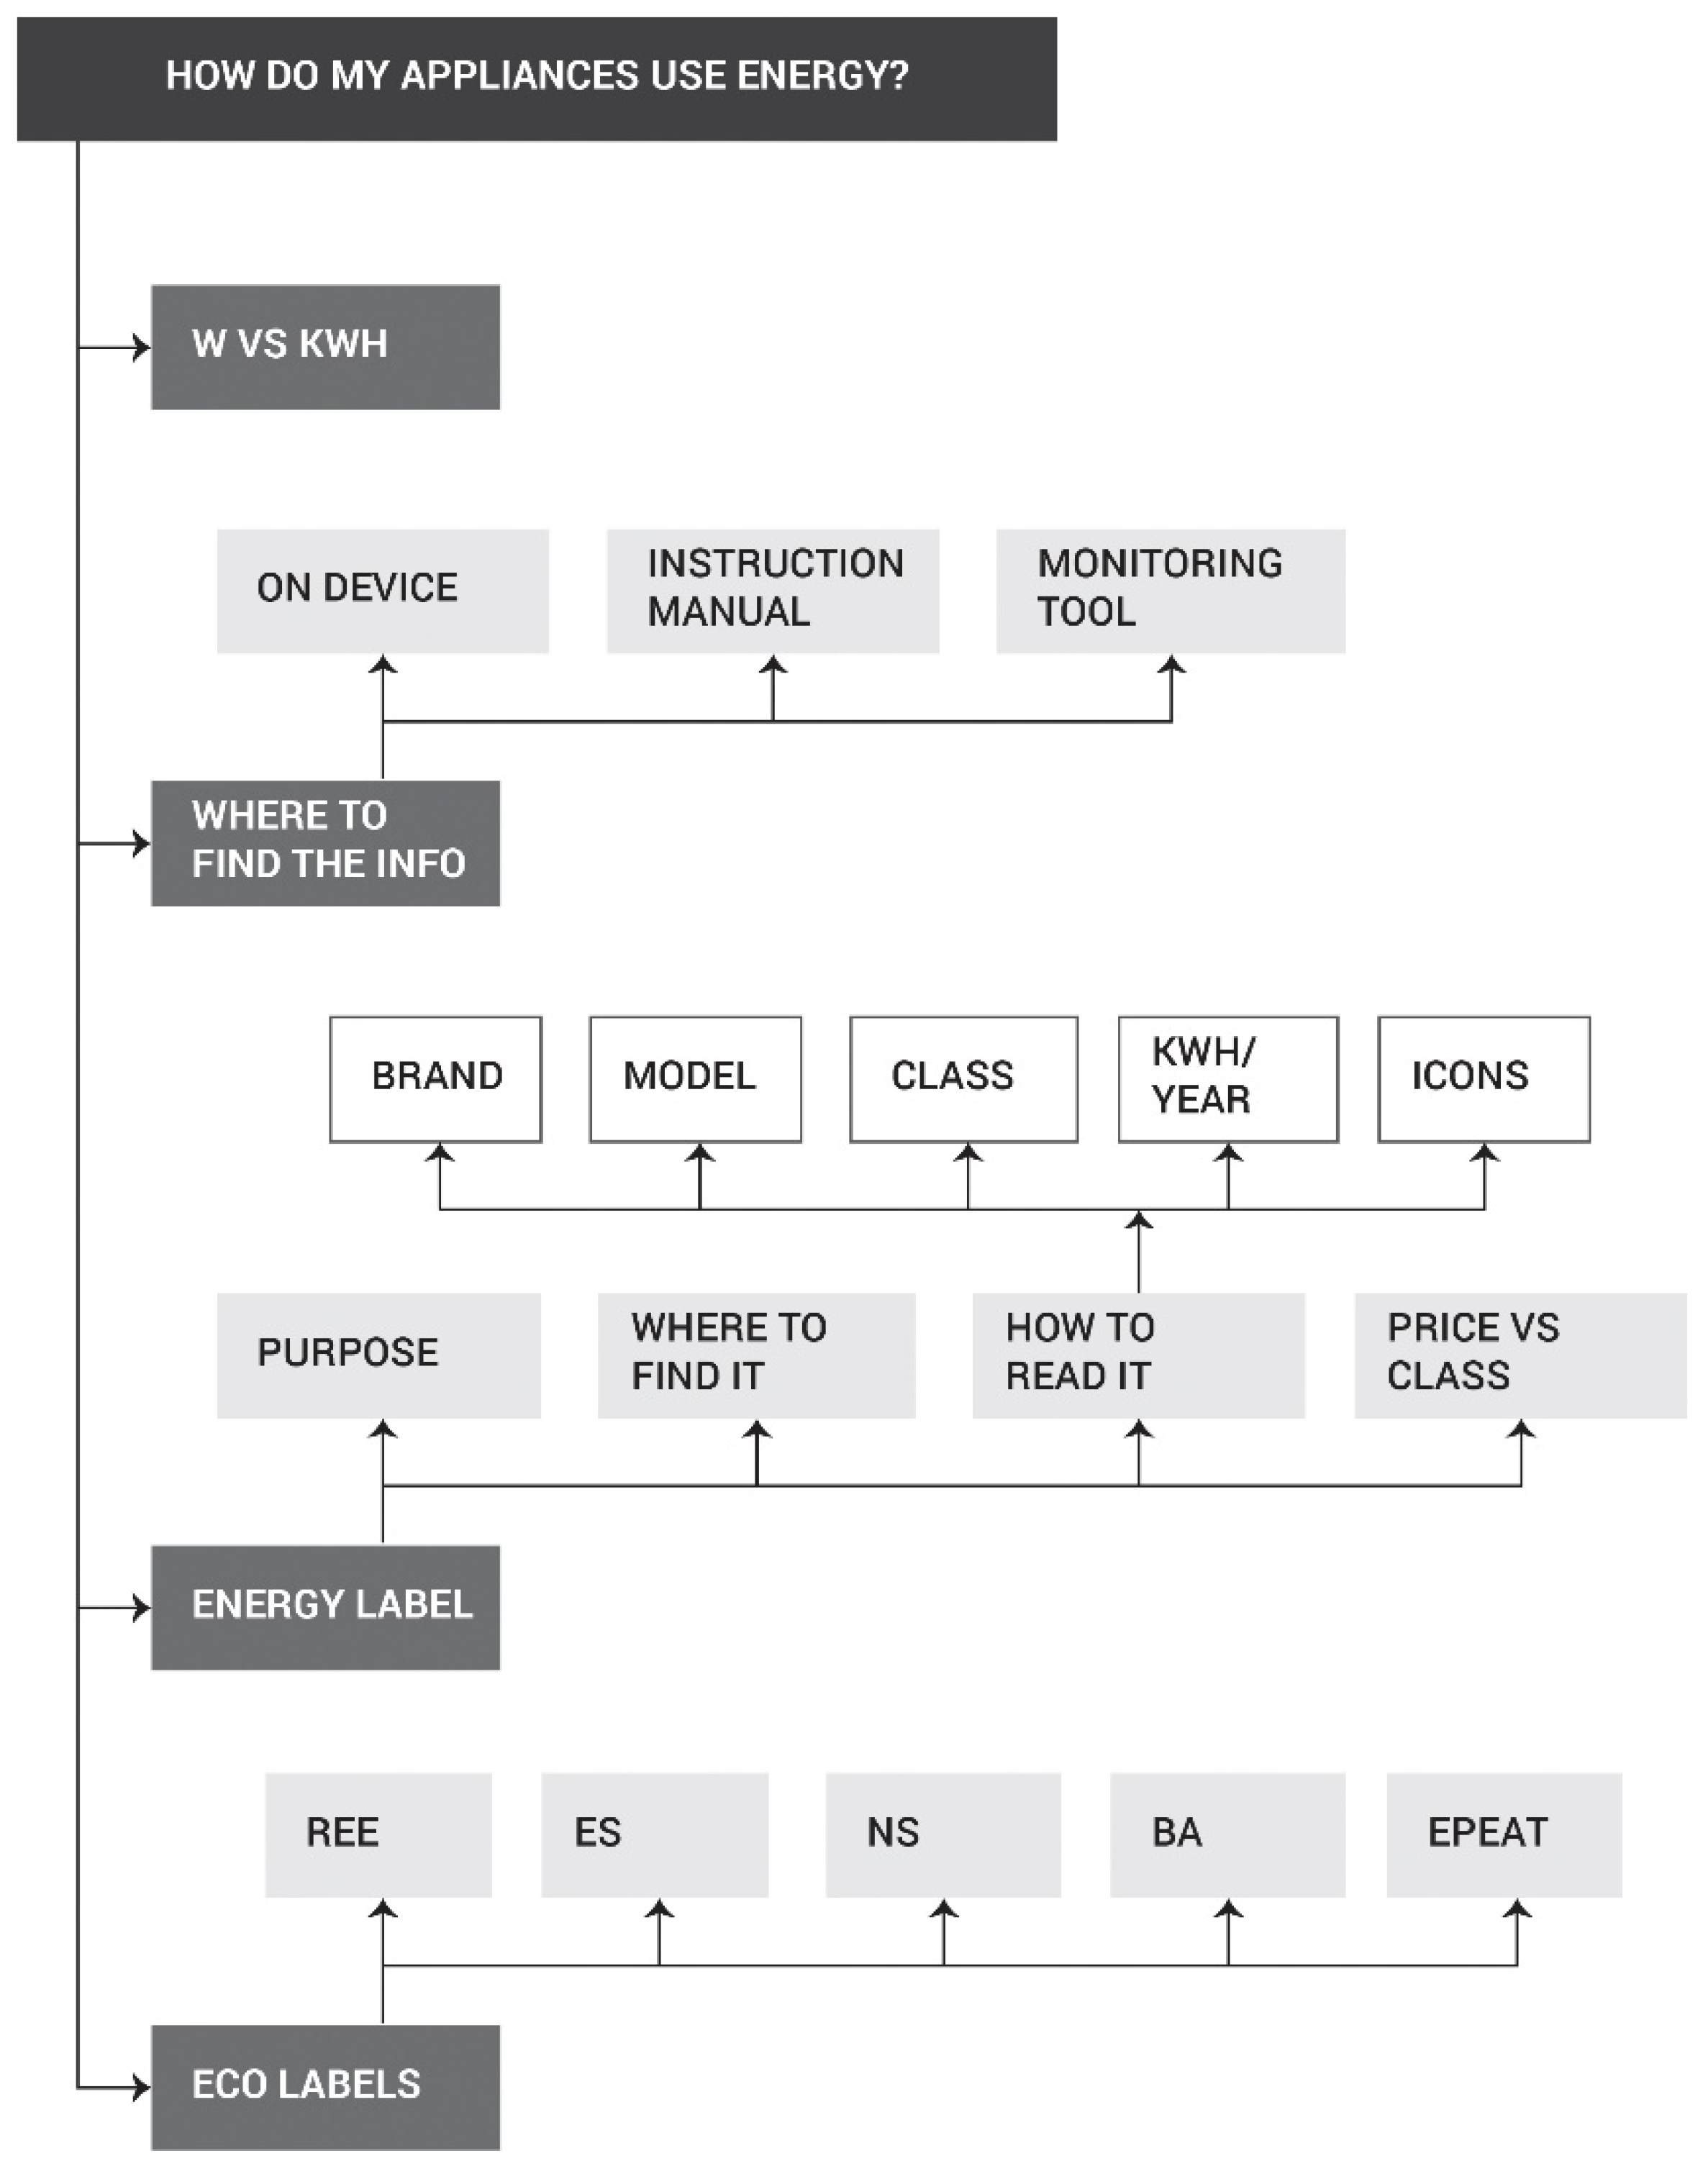
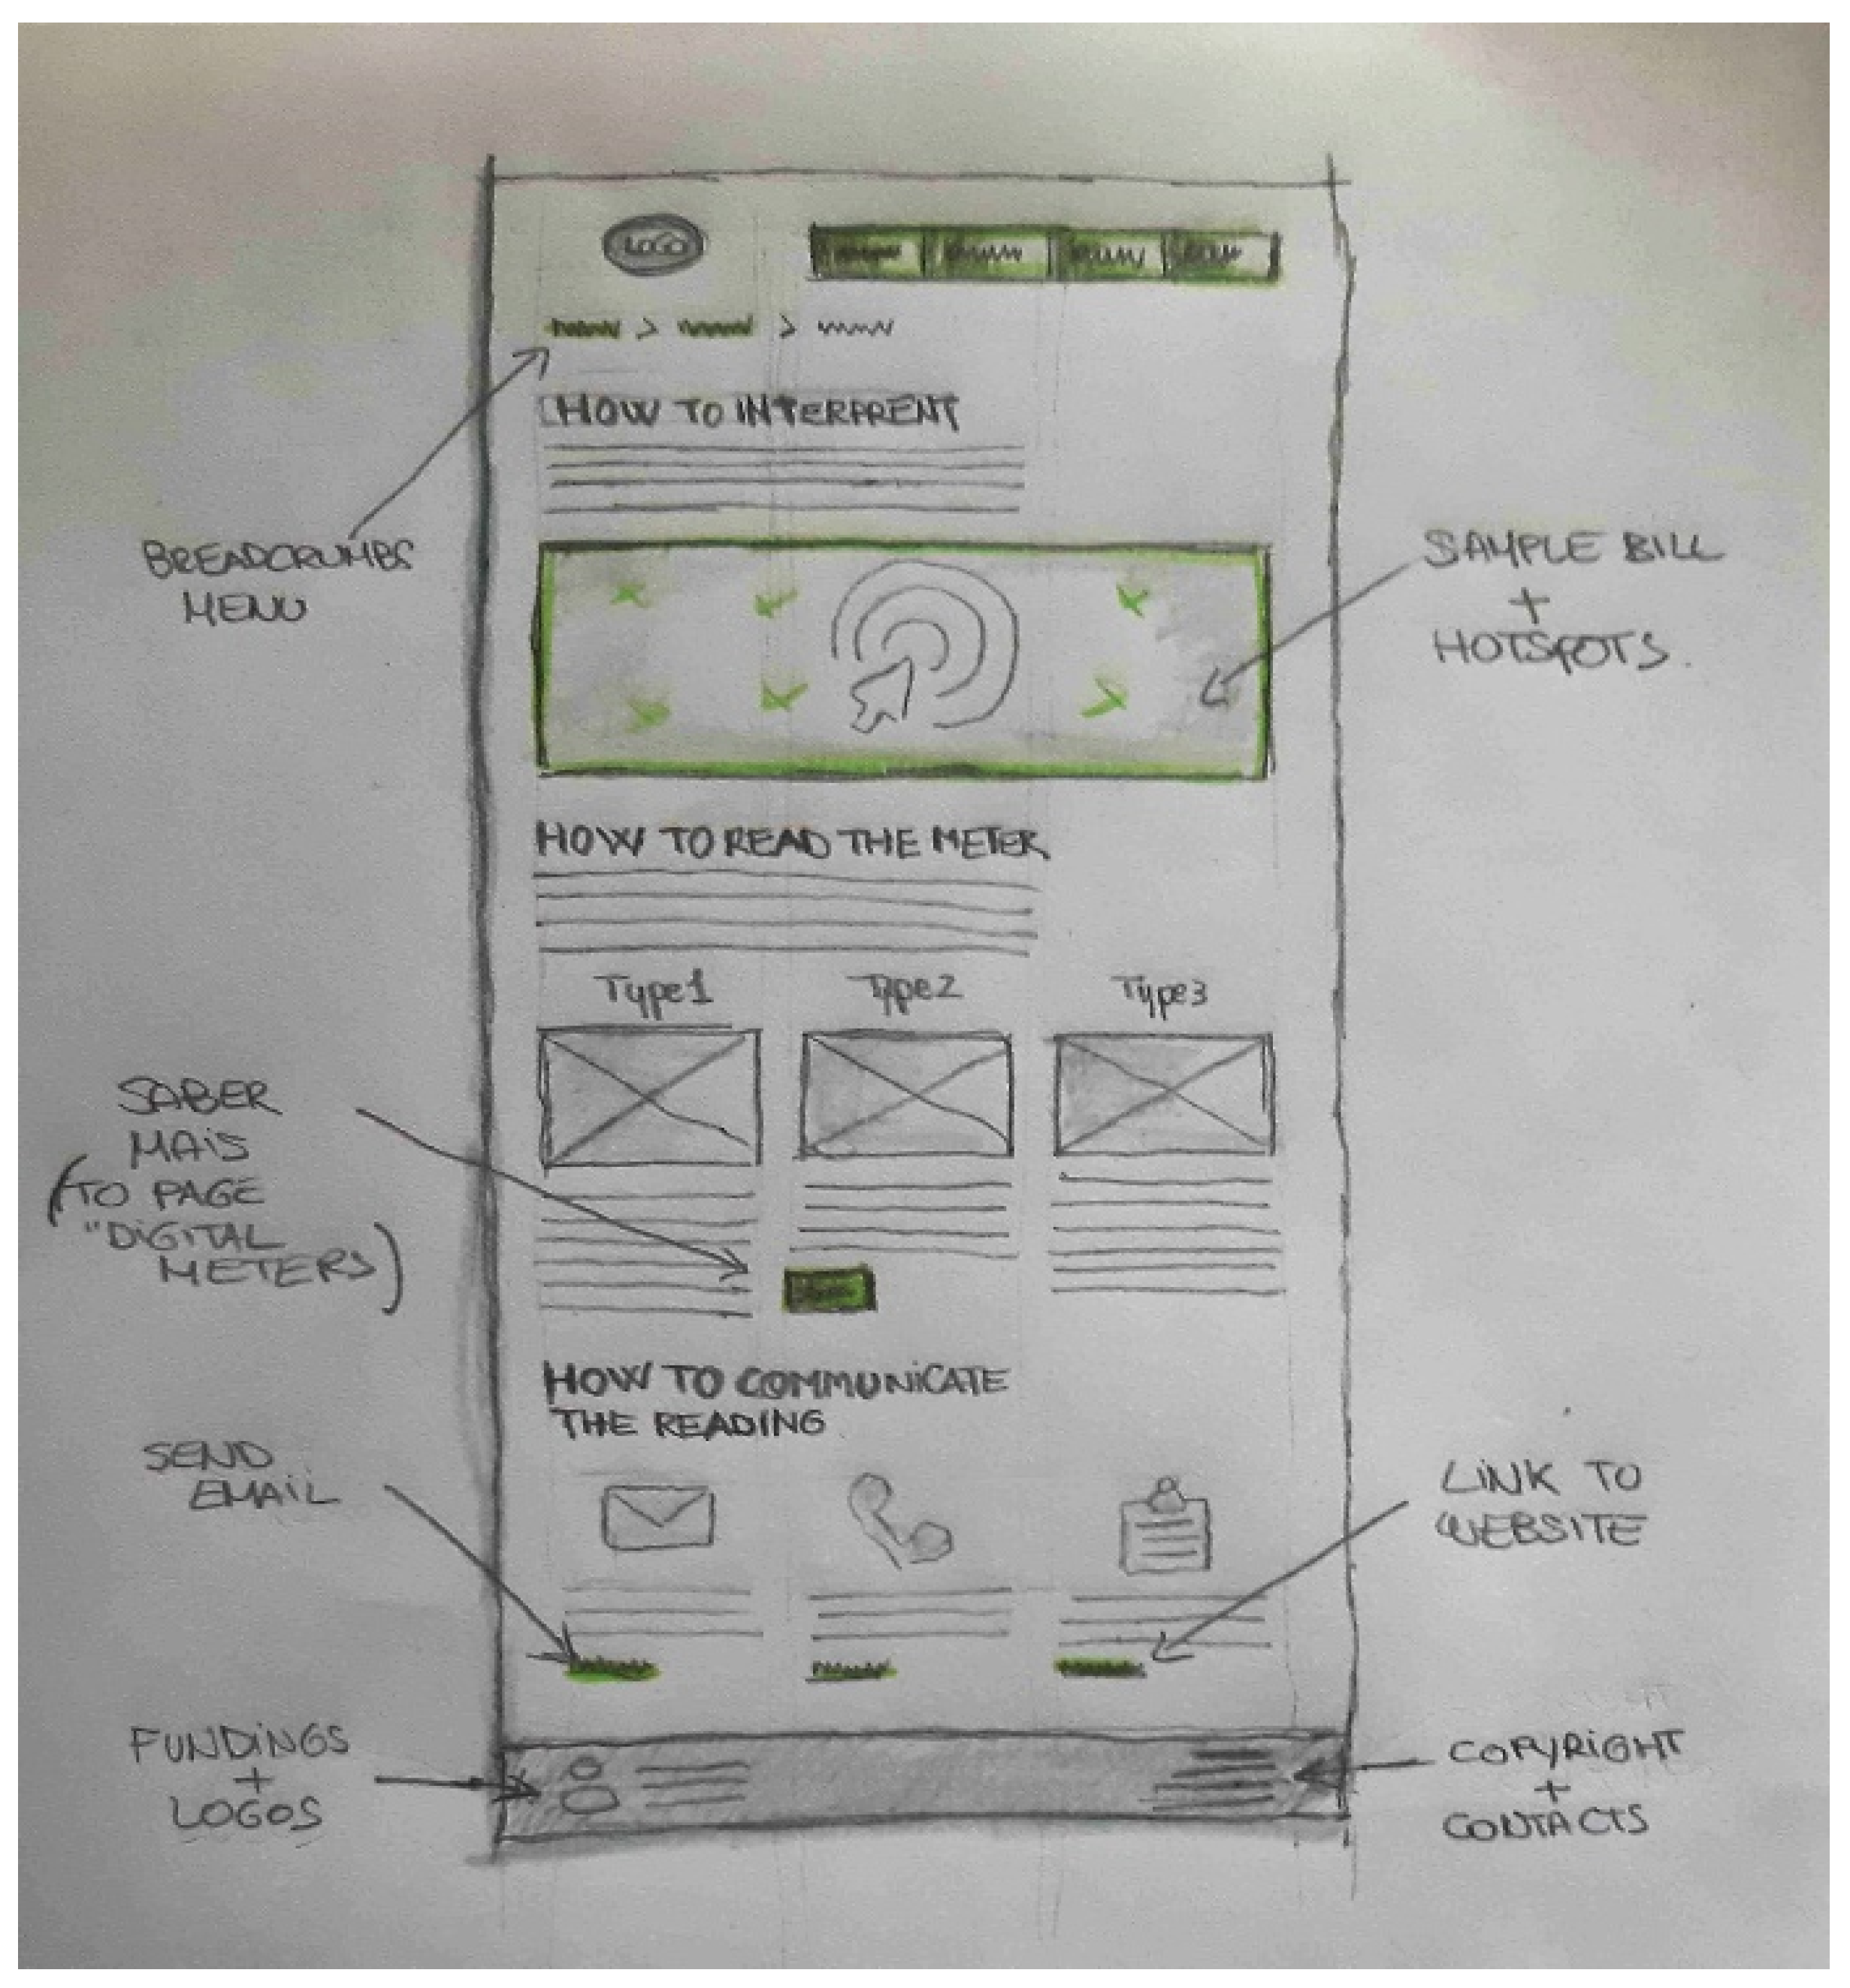
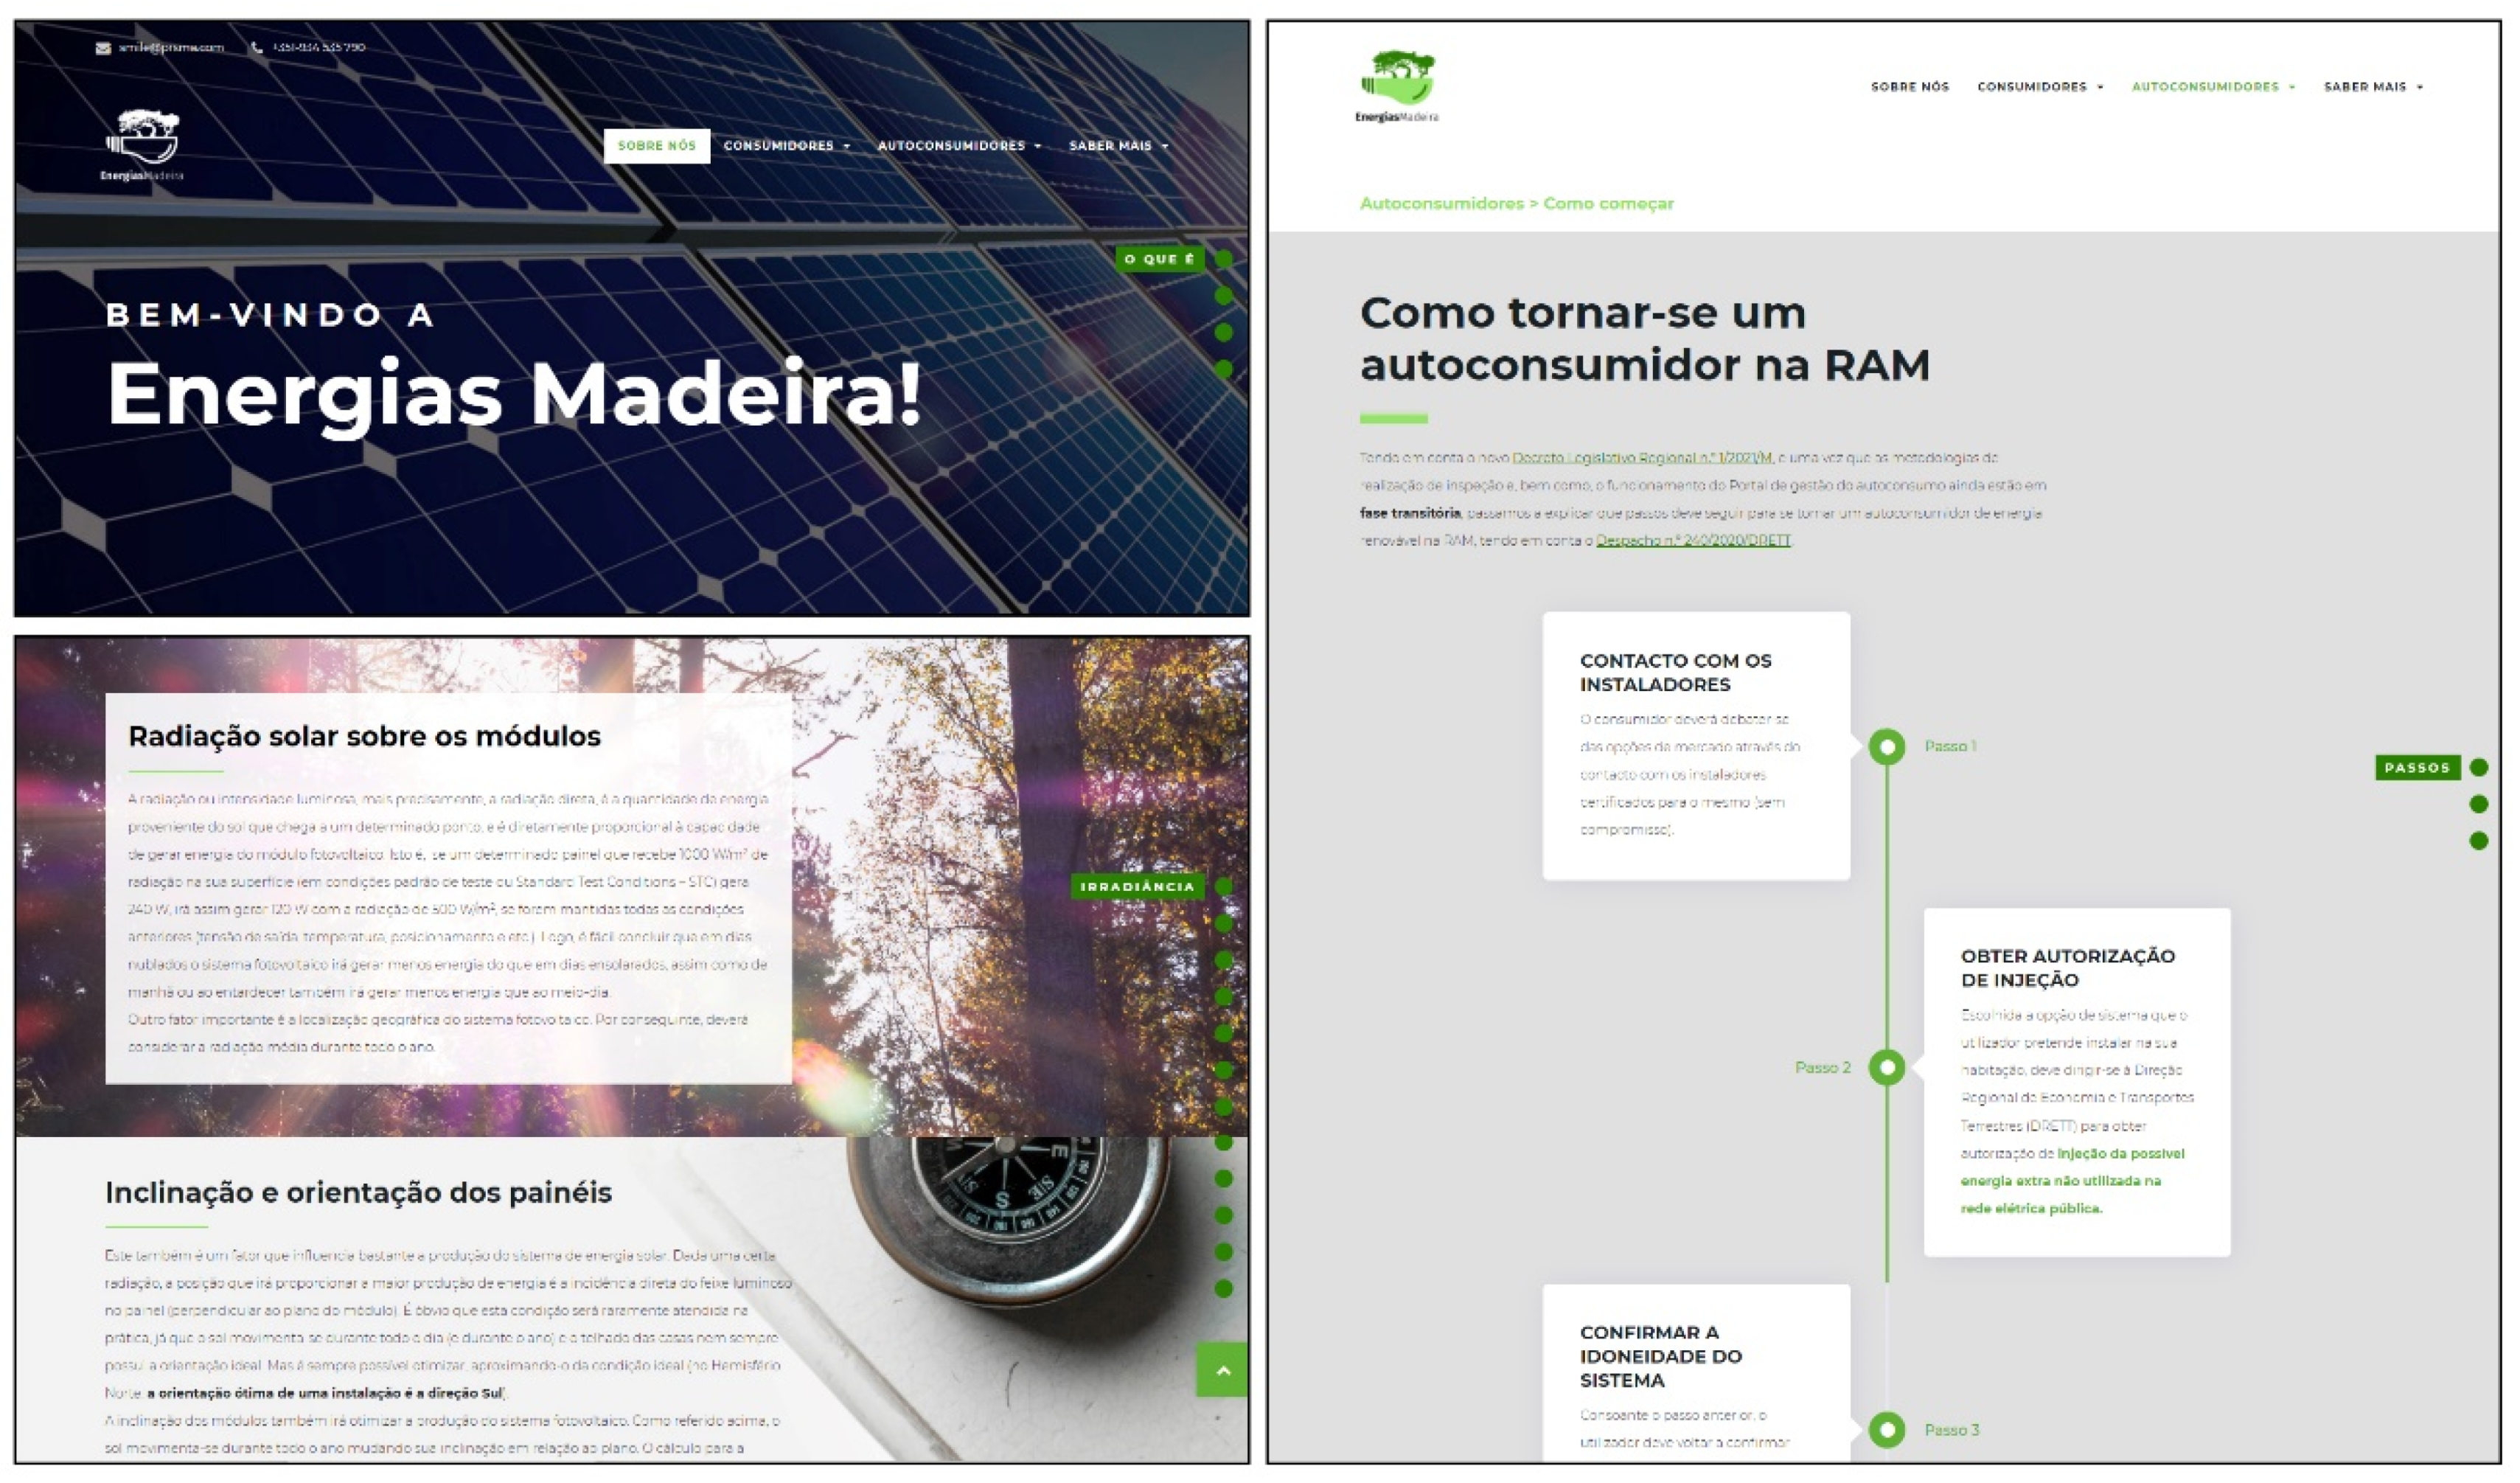
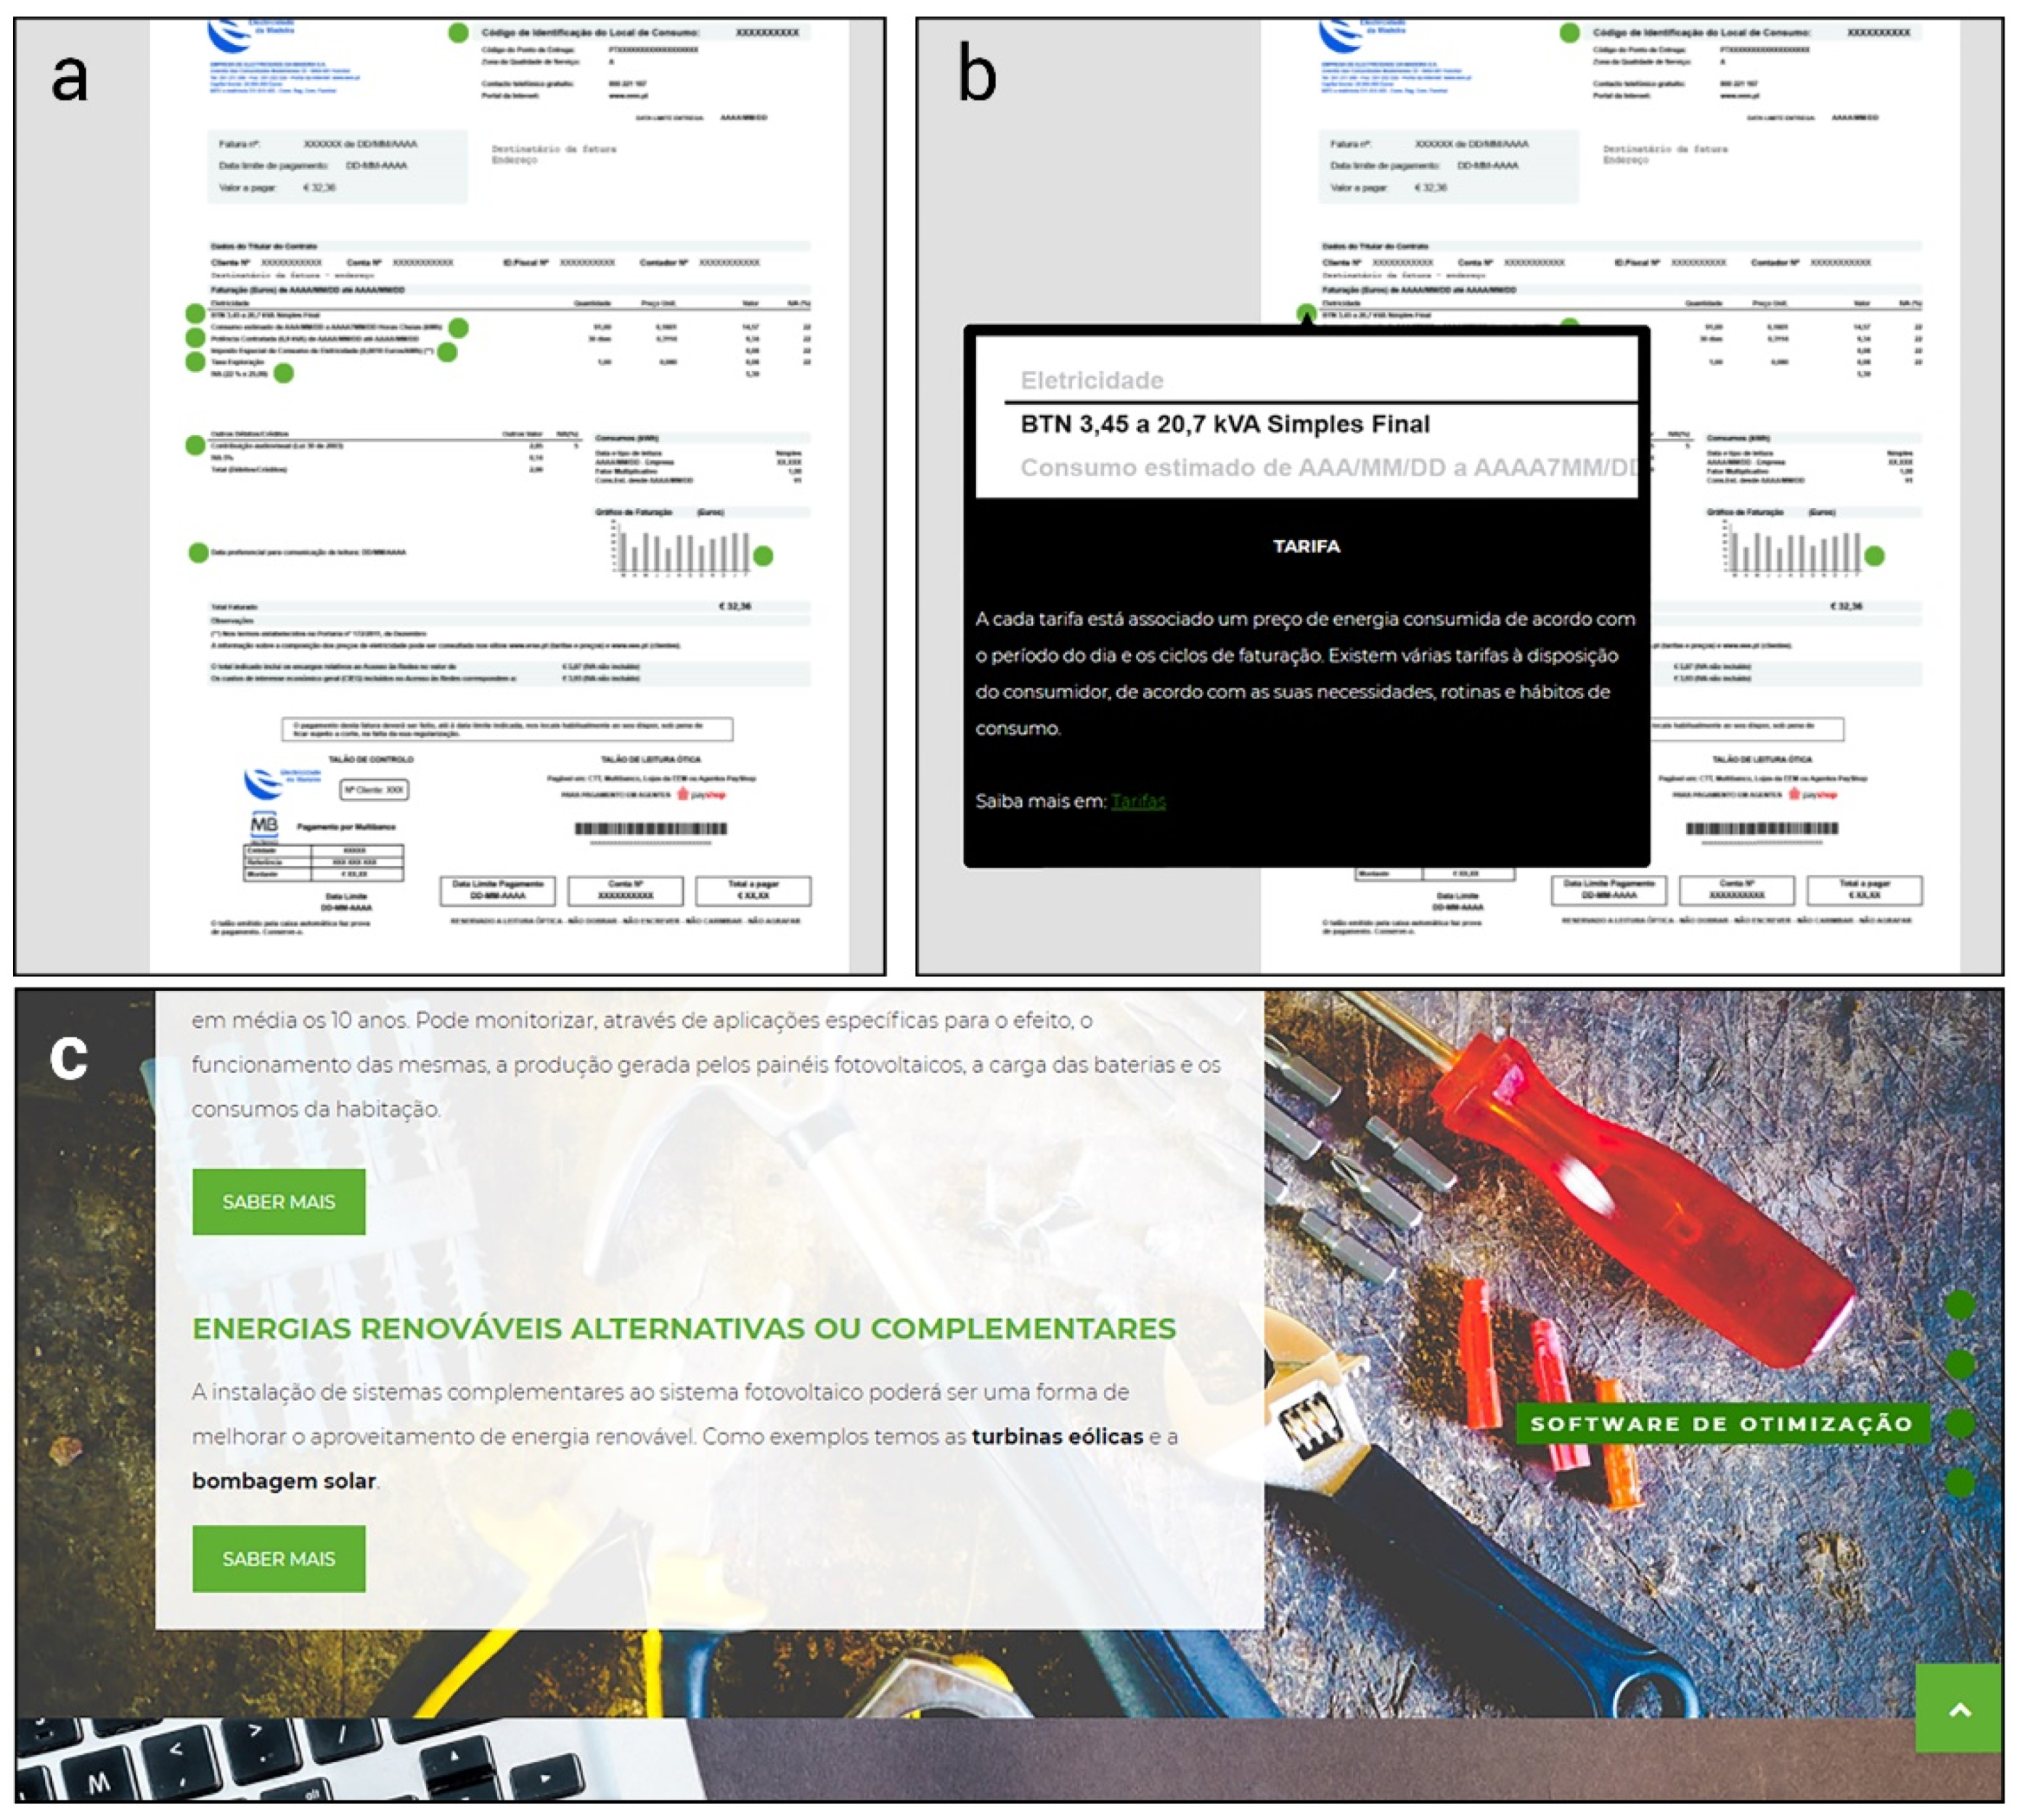
Table 1.
List of additional questions included in the survey.
| Item | Closed-Ended | Open-Ended |
|---|---|---|
| 1. It’s easy to find the information I’m looking for. | X | |
| 2. The information provided is of quality. | X | |
| 3. The amount of information provided is adequate. | X | |
| 4. The information provided is reliable | X | |
| 5. The graphics, images, and videos aid the understanding of the text. | X | |
| 6. The platform is well organized (content/section structure). | X | |
| 7. This type of platform is relevant to me. | X | |
| 8. There is nothing innovative in this platform. It’s similar to others. | X | |
| 9. List up to 3 weaknesses of this platform. | X | |
| 10. List up to 3 strengths of this platform. | X | |
| 11. Which are the aspects that could be improved? | X |
Questions were addressed to all participants in this order.
Table 2.
Questions supporting information search by type of user.
| Questions | Consumer | Prosumer |
|---|---|---|
| How do I interpret my electricity bill? | X | |
| How do my appliances consume energy? | X | |
| How do we influence our energy consumption? | X | |
| What does it mean to be a prosumer? | X | |
| Why become a prosumer? | X | |
| How/where to start? | X | |
| What is next and how does it work? | X | |
| Who can help me? | X | |
| How can I further improve my current energy production home unit? | X |
Table 3.
Task completion and performance per each task in the think-aloud.
| Task | Task Completion | Performance Level |
|---|---|---|
| T01. Find information about the purpose of the platform and how it works | Successfully completed | Good |
| T02. Read the title of the menu items and tell us what you think they are about | Successfully completed | * |
| T03. Tell us the main energy-related information you would like to know more about and find it on the platform | Successfully completed | Good |
| T04. Find information about existing energy tariffs and cycles | Not completed | |
| T05. Find information about the existing energy labels | Successfully completed | Good |
| T06. Find information about the main steps to take in order to install a solar PV generation system | Successfully completed | Moderate |
| T07. Find information about the main components of a solar PV system | Successfully completed | Good |
* Given its nature, the performance of this task was not evaluated considering the number of ‘wrong clicks’. Results of this task are provided below.
Table 4.
Results of the SUS.
| Items | Participant ID | ||||
|---|---|---|---|---|---|
| C5 | C6 | C7 | C8 | C9 | |
| 1. I think that I would like to use this system frequently. | 5 | 4 | 3 | 4 | 3 |
| 2. I found the system unnecessarily complex. | 2 | 2 | 2 | 1 | 2 |
| 3. I thought the system was easy to use. | 2 | 4 | 4 | 4 | 4 |
| 4. I think that I would need the support of a technical person to be able to use this system. | 1 | 2 | 1 | 1 | 1 |
| 5. I found the various functions in this system were well integrated. | 5 | 4 | 4 | 5 | 4 |
| 6. I thought there was too much inconsistency in this system. | 1 | 2 | 1 | 1 | 2 |
| 7. I would imagine that most people would learn to use this system very quickly | 5 | 4 | 5 | 4 | 4 |
| 8. I found the system very cumbersome to use. | 1 | 1 | 1 | 2 | 2 |
| 9. I felt very confident using the system. | 4 | 4 | 5 | 4 | 4 |
| 10. I needed to learn a lot of things before I could get going with this system. | 1 | 2 | 1 | 1 | 2 |
| Individual total score | 87.5 | 77.5 | 87.5 | 87.5 | 75.0 |
| Overall score (mean) | 83.0 | ||||
1 ‘totally disagree’ to 5 ‘totally agree’.
Table 5.
Results of the eight closed-ended items.
| Items | Participant ID | ||||
|---|---|---|---|---|---|
| C5 | C6 | C7 | C8 | C9 | |
| 1. It’s easy to find the information I am looking for. | 5 | 4 | 4 | 4 | 4 |
| 2. The information provided is of quality. | 5 | 5 | 5 | 5 | 4 |
| 3. The amount of information provided is adequate. | 5 | 5 | 5 | 5 | 4 |
| 4. The information provided is reliable. | 5 | 5 | 5 | 5 | 4 |
| 5. The graphics, images, and videos aid the understanding of the text. | 5 | 5 | 4 | 5 | 5 |
| 6. The platform is well structured (content, sections). | 5 | 4 | 4 | 4 | 4 |
| 7. This type of platform is relevant to me. | 5 | 5 | 5 | 5 | 4 |
| 8. There is nothing innovative in this platform. It’s similar to others. | 2 | 1 | 1 | 1 | 1 |
1 ‘totally disagree’ to 5 ‘totally agree’.
Table 6.
Labeling refinements: changes made to the most critical items of the menus.
| Original Label | Revised Label |
|---|---|
| Producer | Self-consumer * |
| Being an energy Producer | Legal and operational framework |
| Where to start | How to start |
| How it works | PV system components |
| Improvements | System optimization |
| Professionals | Useful Contacts |
* Though throughout the article we refer to this section as “prosumers”, for semantic rigor, we put in the table the literal English translation of the Portuguese term used for this label (i.e., “autocosumidores”). Such term refers specifically to the energy producers that operate in self-consumption mode only.
Table 7.
Users’ interaction data.
| Metrics | Month 1 | Month 4 | Trend (M1 vs. M2) |
|---|---|---|---|
| Nº of users | 383 | 448 | +16.97% |
| Nº of sessions per user | 1.08 | 1.21 | +12.07% |
| Pageviews | 559 | 858 | +53.49% |
| Average session duration (seconds) | 80 | 104 | +30.50% |
| % of new visitors | 94.6% | 85% | |
| % of returning visitors | 0.4% | 15% |
Source: Google Analytics.
Publisher’s Note: MDPI stays neutral with regard to jurisdictional claims in published maps and institutional affiliations. |
© 2021 by the authors. Licensee MDPI, Basel, Switzerland. This article is an open access article distributed under the terms and conditions of the Creative Commons Attribution (CC BY) license (https://creativecommons.org/licenses/by/4.0/).
Share and Cite
MDPI and ACS Style
Pestana, C.; Barros, L.; Scuri, S.; Barreto, M. Can HCI Help Increase People’s Engagement in Sustainable Development? A Case Study on Energy Literacy. Sustainability 2021, 13, 7543. https://0-doi-org.brum.beds.ac.uk/10.3390/su13147543
AMA Style
Pestana C, Barros L, Scuri S, Barreto M. Can HCI Help Increase People’s Engagement in Sustainable Development? A Case Study on Energy Literacy. Sustainability. 2021; 13(14):7543. https://0-doi-org.brum.beds.ac.uk/10.3390/su13147543
Chicago/Turabian StylePestana, Carla, Luísa Barros, Sabrina Scuri, and Mary Barreto. 2021. "Can HCI Help Increase People’s Engagement in Sustainable Development? A Case Study on Energy Literacy" Sustainability 13, no. 14: 7543. https://0-doi-org.brum.beds.ac.uk/10.3390/su13147543
Note that from the first issue of 2016, this journal uses article numbers instead of page numbers. See further details here.