
A Review of Global Collaboration on COVID-19 Research during the Pandemic in 2020

1
Graduate School of Management of Technology, Sungkyunkwan University, Seoburo 2066, Suwon 16419, Korea
2
Department of Systems Management Engineering & Graduate School of Management of Technology, Sungkyunkwan University, Seoburo 2066, Suwon 16419, Korea
*
Author to whom correspondence should be addressed.
Sustainability 2021, 13(14), 7618; https://0-doi-org.brum.beds.ac.uk/10.3390/su13147618
Submission received: 3 June 2021
/
Revised: 4 July 2021
/
Accepted: 5 July 2021
/
Published: 7 July 2021
(This article belongs to the Special Issue Transnational Research Collaboration and Its Impact)
Abstract
:In response to the COVID-19 crisis, which has become a severe threat to the health and sustainability of human life, scholars have published numerous research results. Although the importance of international research collaboration has been highlighted as a means of overcoming this global crisis, research on this particular problem has been lacking. Therefore, this study focused on the response of academia to COVID-19 by examining the collaboration between international research, and its impact. This study extracted data from Scopus, sampling articles and reviews published in 2020. By analyzing scenarios by country and international research collaboration based on data on authors’ nationalities and the research areas of documents, this study revealed that the United States and China contributed the most. In all countries, most research was conducted on medicine. European and American countries demonstrated significant interest in the social sciences and Asian countries in the life sciences. Furthermore, some countries, including Belgium and Pakistan, extended their research interests through international research collaboration. The results of this study highlight the importance of international research collaboration across various areas by overcoming the regional imbalance in intercountry collaboration and the concentration on a limited scope of subjects.
1. Introduction
Infectious diseases have always been a part of human history [1]. In particular, because pandemics have caused numerous sicknesses and deaths, humans have developed science and medicine to combat such occurrences. However, infectious diseases continue to affect humans. In 2003, severe acute respiratory syndrome (SARS) infected 8422 people across 29 countries, resulting in 916 deaths [2]. In 2009, H1N1 infected more than 130,000 people in over 214 countries and caused 18,449 deaths [3]. In 2014, the Ebola virus, which first emerged in Africa, infected 28,616 people and caused 11,310 deaths [4]. In 2015, the Middle Eastern respiratory syndrome (MERS) infected 2502 people in 27 countries and caused 861 deaths [5]. In 2016, the Zika virus spread through 43 countries (mostly in Latin America), infecting more than 1,600,000 people [6].
To describe the extent of the spread of infectious disease, the World Health Organization (WHO) in 1999 established a five-stage classification system and updated it to a six-stage classification in 2005, which is currently in use [7]. Moreover, in May 2016, the WHO announced the “R&D Blueprint”, which is an initiative to implement anticipatory actions in terms of research and development on infectious diseases. An initial list of priority pathogens, which included seven diseases to be urgently addressed based on nine metrics, was published: (1) Crimean–Congo hemorrhagic fever virus, (2) Filovirus diseases (i.e., Ebola virus disease and Marburg), (3) highly pathogenic emerging coronaviruses (CoVs) relevant to humans (MERS- and SARS-CoV), (4) Lassa fever, (5) Nipah virus, (6) Rift Valley fever virus, and (7) a new severe infectious disease. Additionally, three severe diseases that require urgent action were included: (1) Chikungunya virus, (2) severe fever with thrombocytopenia syndrome, and (3) congenital abnormalities and other neurological complications associated with the Zika virus [8]. After a round of amendments in 2017, the WHO published the “WHO R&D Blueprint (2018)”, to which “Disease X”, defined as an unexpected future infectious disease, was added [9].
In December 2019, an infectious disease caused by a new virus that first emerged in Wuhan, China, rapidly spread worldwide [10,11]. The International Committee on Taxonomy of Viruses (ICTV) termed the virus severe acute respiratory syndrome coronavirus 2 (SARS-CoV-2), and the WHO termed the infectious disease coronavirus disease 2019 (COVID-19) [12]. The common perspective is that COVID-19 is the first example of Disease X to emerge [13,14,15]. On March 11, the WHO classified this outbreak as a pandemic, which is the most severe spread of infectious diseases [16,17]. COVID-19 is not the first infectious disease that has attained the level of a pandemic, but it is the first to have such a global impact [18]. The disease continued to spread, and according to the WHO’s official statistics, there were 150,995,295 cases of infection and 3,173,668 deaths as of 1 May, 2021 [19].
The world realized the importance of international collaboration in overcoming infectious diseases after it experienced SARS and MERS [20]. The article “A Coordinated Global Research Roadmap: 2019 Novel Coronavirus”, based on the R&D Blueprint strategy and published by the WHO, mentions the importance of nurturing scientific collaboration [21]. The International Chamber of Commerce [22] also published a statement highlighting the importance of international collaboration in response to the COVID-19 pandemic. Therefore, global research collaboration has become increasingly important in addressing the current global problem [23].
According to the Royal Society [24], the share of papers with more than one international author was approximately 25% in 1996, and this increased to over 35% by 2008. According to Gazni et al. [25], the share of papers from multinational publications was 14% of all documents in 2000, but this percentage increased to 18% in 2009. The share of papers with multinational publications varies depending on the subject area. According to this study, the share of multinational publications was highest in space science (49.18%) and lowest in social sciences (9.3%). According to Wagner et al. [26], the share of internationally co-authored documents increased from 10% in 1990 to 25% in 2011. In addition, according to the National Science Foundation (NSF), a public funding institution in the United States [27], the share of international collaboration of authors from at least two countries increased from 17% in 2008 to 23% in 2018. However, note that the quantitative metrics used to estimate global research collaboration have discrepancies across investigation periods and organizations. Nonetheless, all studies have concluded that global research collaboration is increasing.
Although global research collaboration is gaining interest, no research on its practical benefits has yet been conducted, particularly regarding its impact on national research capabilities. Academic publications are the most common method of sharing new results in academia [28]. Therefore, this paper examines the publication of papers based on countries and subjects. Subsequently, international research collaboration is analyzed through network analysis. Finally, it compares major research areas per country and the subject in which collaborative research occurs most frequently. By analyzing the gap between the two, we can infer whether knowledge has expanded through international research collaboration.
2. Literature Review
2.1. Research Trends on Infectious Diseases
Previous studies have consistently demonstrated that, whenever an infectious disease emerges, academia reacts immediately. Zhang et al. [29] studied the response of academia to the emergence of Zika, H1N1, Ebola, and SARS over the past two decades and discovered that the number of research publications decreased, after an increase in the two years following the initial emergence of the diseases. The number of publications was highest in the United States, China, and the United Kingdom. In particular, the United States published the most on Zika, H1N1, and Ebola, whereas China published the most on SARS. An analysis of data from the Web of Science, PubMed, and CNKI databases on 7 April, 2020, indicated that the initial research on COVID-19 was most active in the United States and China, and that collaborative research between the two countries was also prominent. Bonilla-Aldana et al. [30] studied articles on the coronavirus from the Science Citation Index (SCI), Scopus, and PubMed databases from 1951 to January 2020. The findings revealed that after the emergence of SARS and MERS, research publications emerged rapidly across all three databases. Malik et al. [31] studied articles related to coronavirus after 1900 (a total of 28,846 articles) and observed a surge in publications in 2003–2006 and 2013–2016, when SARS and MERS emerged, respectively. Specifically, 4009 articles (13.9%) were published between 1900 and 1999, 11,403 articles (39.5%) between 2000 and 2019, and 13,434 articles (46.5%) in 2020. Moreover, research collaboration frequently occurred between developed countries.
Infectious disease studies are mostly published in affected countries, with life sciences and medicine being the major research subjects. Sa’ed [32] studied research publications related to MERS-CoV between 2012 and 2015 and observed that 883 documents were published in 92 countries. Among them, Saudi Arabia published the second highest number of documents (113 publications) after the United States (319 publications). Sa’ed explained that this was because Saudi Arabia was the country that isolated the MERS virus. Zhang and Shaw [11] studied the trend of research on coronaviruses over the past two decades and examined the trend of research on virology, epidemiology, and infectious diseases following the emergence of SARS in 2003 and MERS in 2012. The most popular research topics were (1) the structural changes and interactions of the virus upon its entry into the human body, and (2) patient cases of immune reactions, diagnosis, and treatment. In contrast, almost no studies connect biological dangers, such as infectious diseases, to disaster response.
Research has also been conducted from the perspective of funding sources. Fitchett et al. [33] surveyed the annual changes in the size of public and philanthropic funding for infectious disease research from 1997 to 2010, and observed an increase in public funding and the uncertainty of philanthropic funding due to the global financial crisis.
2.2. Research Trends on COVID-19
Bibliometric research on COVID-19 focuses on the publication of documents and major research areas. Aristovnik et al. [34] studied documents published between 1 January and 1 July, 2020, and observed that the United States, China, and Italy published the greatest amount of research. The categorization of publications by the All Science Journal Classification (ASJC) of Scopus indicates that health sciences are the most popular research area, and the three most popular keywords therein are “patient, health, and healthcare” for health sciences; “protein, human, and vaccine” for life sciences; “factor, lockdown, and area” for physical sciences; and “crisis, pandemic, and mental” for social sciences. According to Sa’ed and Al-Jabi [35], who conducted a survey of publications between December 2019 and 19 June 2020, the ten countries that had published the most research on COVID-19 since its initial spread published 16,952 articles (89%); the top countries were the United States (23.5%), China (17.4%), Italy (12.2%), and the United Kingdom (10.4%). Research areas can be categorized into “clinical features studies”, “pathological findings and therapeutic design”, “care facilities preparation and infection control”, and “maternal, perinatal and neonatal outcomes”.
Moreover, Martinez-Perez et al. [36] used a citation network of documents related to COVID-19 (published between January and July, 2020) to identify research areas. The countries that published the most documents were the United States (26.75%), China (14.55%), and Italy (12.32%). Research topics were categorized into 16 groups: Group 1, virus transmission and treatment; Group 2, vulnerability of cancer patients to COVID-19; Group 3, psychological and physical pressure of medical personnel; and Group 4, research on the possibility of early diagnosis through computed tomography (CT). Hossain [37] conducted a bibliometric analysis of documents published on COVID-19 until 1 April, 2020, which revealed that the major research areas included genetic, epidemiological, zoonotic, and other biological topics. Dehghanbanadaki et al. [38] analyzed publications between 1 December 2019 and 1 April 2020, and observed that China published the greatest number of documents (348), followed by the United States (160) and the United Kingdom (80). In addition, collaboration was most frequent between the United States and China, and the most popular research topics were pathogenesis, epidemiology, transmission, diagnosis, treatment, prevention, and complications.
Research trends within specific topics were also analyzed. Yang et al. [39] sought to identify content that needs to be updated in diagnosis and treatment guidelines by comparing published research on COVID-19 and treatment guidelines from the WHO, the United States, and China. Fan et al. [40] compared documents written in English and Chinese and observed that English-language documents tended to include the exchange of information among medical personnel and scientists, and provide the background required for major policy decisions (for example, obligatory wearing of masks and minimizing gathering), while Chinese-language documents tended to focus on the delivery of key information to regional medical personnel. Yang et al. [41] analyzed research on traditional Chinese medicine and observed five major topics, one of which was the analysis of the law around traditional Chinese medicine based on data mining. In another study, Ng [42] observed that traditional Chinese medicine and vitamin D were often mentioned as alternative therapies before the introduction of any medication or vaccine. Lee et al. [20] determined the major research areas of studies supported by public funds in the United States, the European Union, Japan, and South Korea, and analyzed the characteristics of each country. This study observed that in South Korea, research mostly focused on immune reaction platforms, vaccine development, and diagnosis, and thereby inferred the South Korean government’s development policies for biotechnology industries and the impacts of government-led research and development.
2.3. Trend of Research on International Research Collaboration
Gazni et al. [25] categorized countries into four groups according to the extent of their technological advancement, and studied the percentage of collaboration among these groups. This study observed that research collaboration occurred most frequently between scientifically advanced countries and scientifically proficient countries. By categorizing countries according to their levels of economic development, this study observed that high-income Organization for Economic Co-operation and Development (OECD) countries are the major collaboration partners of countries from all other groups, and collaboration occurred most frequently between high-income OECD countries and upper-middle-income non-OECD countries. Velez-Estevez et al. [43] observed discrepancies in academic influence by categorizing papers published under the categories of computer science and artificial intelligence (from the Web of Science in 2015) according to the type of collaboration into “one country and one affiliation”, “one country and two or more affiliations”, and “more than one country”. Academic influence was measured by the rate of citation, and this study observed that collaborative research papers were cited more frequently. Additionally, the same keywords could belong to different areas in the strategic diagram depending on the type of collaboration. Sweileh [44] compared intercountry collaboration through documents published between 1996 and February 2005 with respect to eight new pathogens proposed by the WHO (Ebola, Marburg, Lassa, Rift Valley, Crimean–Congo, Nipah, MERS, and SARS). This study observed that the rate of international collaboration differed significantly by country, ranging between 21.1% (Turkey) and 86.9% (Switzerland), and that there is a significant relationship (Pearson correlation r = 0.52, p = 0.01) between the rate of international collaboration and the citation rate per paper.
Moreover, Wagner et al. [45] used the openness index derived from the mobility data and the percentage of international co-authored articles, and field-weighted the citation impact of the relevant area. The findings indicated that more internationally open countries tend to produce more impactful science papers than countries that are less open. Chinchilla-Rodríguez et al. [46] compared the rate of cited papers with no collaboration, those with national collaboration, and those with international collaboration using the mean normalized citation score (MNCS), and observed that research collaboration has a positive effect on citation. However, although higher ratios of R&D investment in GDP result in greater MNCSs, the difference between MNCSs of different research types decreases [46].
As mentioned earlier, previous studies on COVID-19 have focused on articles published until the first half of 2020, and tended to only examine research trends during the early stages of the pandemic. Major research topics included the analysis of researchers, research institutions, nations, and international research collaborations using bibliometric tools. They identified major research topics using methods such as the analysis of simultaneously occurring keywords. Thus, studies on global research collaboration related to COVID-19 explored the quantitative aspects of international collaborative research. Previous studies on the achievements of global research collaboration presented an increase in citations and publications of papers in impactful journals as qualitative achievements.
This study reviewed research efforts that were made during the first year of the COVID-19 pandemic to overcome the situation and return to normal life, and analyzed the status quo and effects of global research collaboration. Therefore, in addition to quantitative indicators, this study evaluated the major research areas per country and the benefits of research collaboration from the perspective of academic capability (instead of quantitative measures).
3. Materials and Methods
3.1. Data Collection
This study gathered data from Scopus, which is an academic database provided by Elsevier. The reason for using Scopus is journal coverage. Web of Science provides data from 1900, and Scopus provides data from 1966 [47]. On the other hand, Scopus is the world’s largest database service, providing over 25,100 source titles [48,49,50]. In particular, in the Biomedical Research field and Social Sciences field, the coverage of Scopus is wider than that of Web of Science, with many exclusive journals [49]. For this reason, there may be differences in detailed data depending on the database selected as the data source. This study used Scopus to verify as effectively as possible the document data published during 2020.
Based on the studies indicating that research tends to surge in the first 2 to 3 years after the emergence of an infectious disease, this study analyzed the publications from 2020 to study the early response of academia to COVID-19 [29,30,31]. To decrease false-positive results and increase accuracy during reference research, this study searched for titles that best captured the theme of articles and that contained terms including “Coronavirus”, “COVID”, or “SARS-CoV-2” [31,51,52]. This study used the term COVID, even though the WHO officially named the disease COVID-19, so as to not exclude early publications that used the name COVID-2019 (i.e., the shortened version of coronavirus disease 2019). Only English-language articles were included in this study.
Using the standards outlined above, this study gathered a total of 75,359 publications, which are listed in Table 1. A CVS-format file was downloaded from Scopus with data including citation information and author affiliation for 40,782 articles and 8560 reviews. Data were obtained from 14 to 16 March 2020.
3.2. Extracting Nationality Information of Authors by Document Type
This study surveyed international research collaborations using the authors’ nationalities. For this, the national information of authors by document type was extracted. The nationality of authors was based on the nationality of their affiliated institution; it was extracted from the nationality information registered in the affiliation section of the data downloaded from Scopus. In some cases, the affiliation of more than one country was listed among the authors. The reasons for having multiple international affiliations include various points, such as research resources or financial benefits. However, it is difficult to accurately determine the role of each affiliated university or institution in the study from the publication. Additionally, multiple international affiliations help link institutions or transfer knowledge [53]. Therefore, such affiliation was reflected in the findings of all countries that referred to the author’s affiliation. Accordingly, some documents were counted as research outcomes of multiple countries.
Furthermore, 246 samples without registered author information were excluded from this study. In some cases, an author was registered, but the affiliation section did not provide sufficient information to identify their nationality (i.e., it indicated only the institution’s name and its city, or nothing at all). Instead, author IDs, which were assigned by Scopus, were used in such cases, as these were available on all articles. Therefore, for articles for which it was impossible to identify nationality via the information registered in the affiliation section, this study searched for the author ID in order to identify affiliated institutions and nationalities. There were 392 cases in which it was not possible to identify affiliated institutions and nationalities, and these were excluded from this study. Thus, the authors’ nationalities could be verified in 48,704 articles.
3.3. Technology Classification by Document Type
This study used the ASJC code, a four-digit number used by Scopus to denote technology areas to classify documents [54]. An ASJC code was assigned to each journal, and the code of the journal in which a document was published was assigned to the document itself.
ASJC codes categorized the technology area of a journal into three levels: supergroup > subject area > field. Supergroup is the highest level and has four categories: health sciences, life sciences, social sciences, and physical sciences. Under the supergroup is the subject area; as shown in Table 2, there are five subject areas (e.g., medicine) under health sciences, five (e.g., agricultural and biological sciences) under life sciences, six (e.g., arts and humanities) under social sciences, and ten (e.g., chemical engineering) under physical sciences. In addition, there are 27 subject areas, including multidisciplinary ones, that do not belong to any of the four supergroups. Subject areas are divided into greater detail into 334 fields (including multidisciplinary subjects), and each field has a unique code.
3.4. Analysis of Current Research Trends by Country
This study analyzed publications by country using a bibliometric methodology. An analysis was conducted on research quantity, research quality, and the international collaboration index. Research quantity is the total number of articles published in a country. Research quality is the total number of citations by country, average citation rate (total number of citations/total publication number), and h-index. Frequently, the citation rate is an index used to measure the impact of a publication or to evaluate the impact of a researcher. Therefore, this study calculated the sum of citation rates of all documents published in a country so as to compare research quality by country. However, because the total citation rates tended to increase as the number of documents increased, this study calculated the average citation rate by dividing the total citation number by the number of articles.
The index that is most widely used to evaluate a researcher’s ability is the h-index, proposed by Hirsch [55] in 2005. The h-index is an index that simultaneously captures the productivity, quality, and quantity of a paper defined as “if h of his or her Np papers have at least h citations each and the other (Np–h) papers have ≤h citations each” (p. 16569, [55]). This study also used the h-index, which is commonly used to represent an individual’s research capability and to represent a country’s research capability [32,56]. For this, this study applied the definition of the individual h-index to countries, namely, that “if h of a country’s Np papers has at least h citations each and the other (Np–h) papers have ≤h citations each”.
Finally, the international research collaboration index is the number of collaborative research projects and the ratio of research collaboration (the number of collaborative research documents/the total number of documents). This study categorized all documents per country into single-national and multinational documents, and verified the ratio between the number of collaborative research documents by country and the total number of documents.
3.5. Analysis of the Current State of the Global Research Network
A node is used to signify entities such as persons and goods, and a network is used to present the relationship among nodes using links; thus, it is used to represent the interactive relationships among entities. Network analysis is an analytical method derived from graph theory, and is advantageous in that it can clearly define and organize the relationships among entities in a network [57]. The co-authorship network analysis, in particular, is an analytical tool that clarifies the pattern of collaboration and flow of knowledge among researchers. This study applied the co-authorship network analysis method to analyze research networks among countries so as to examine the current state of global research collaboration [58].
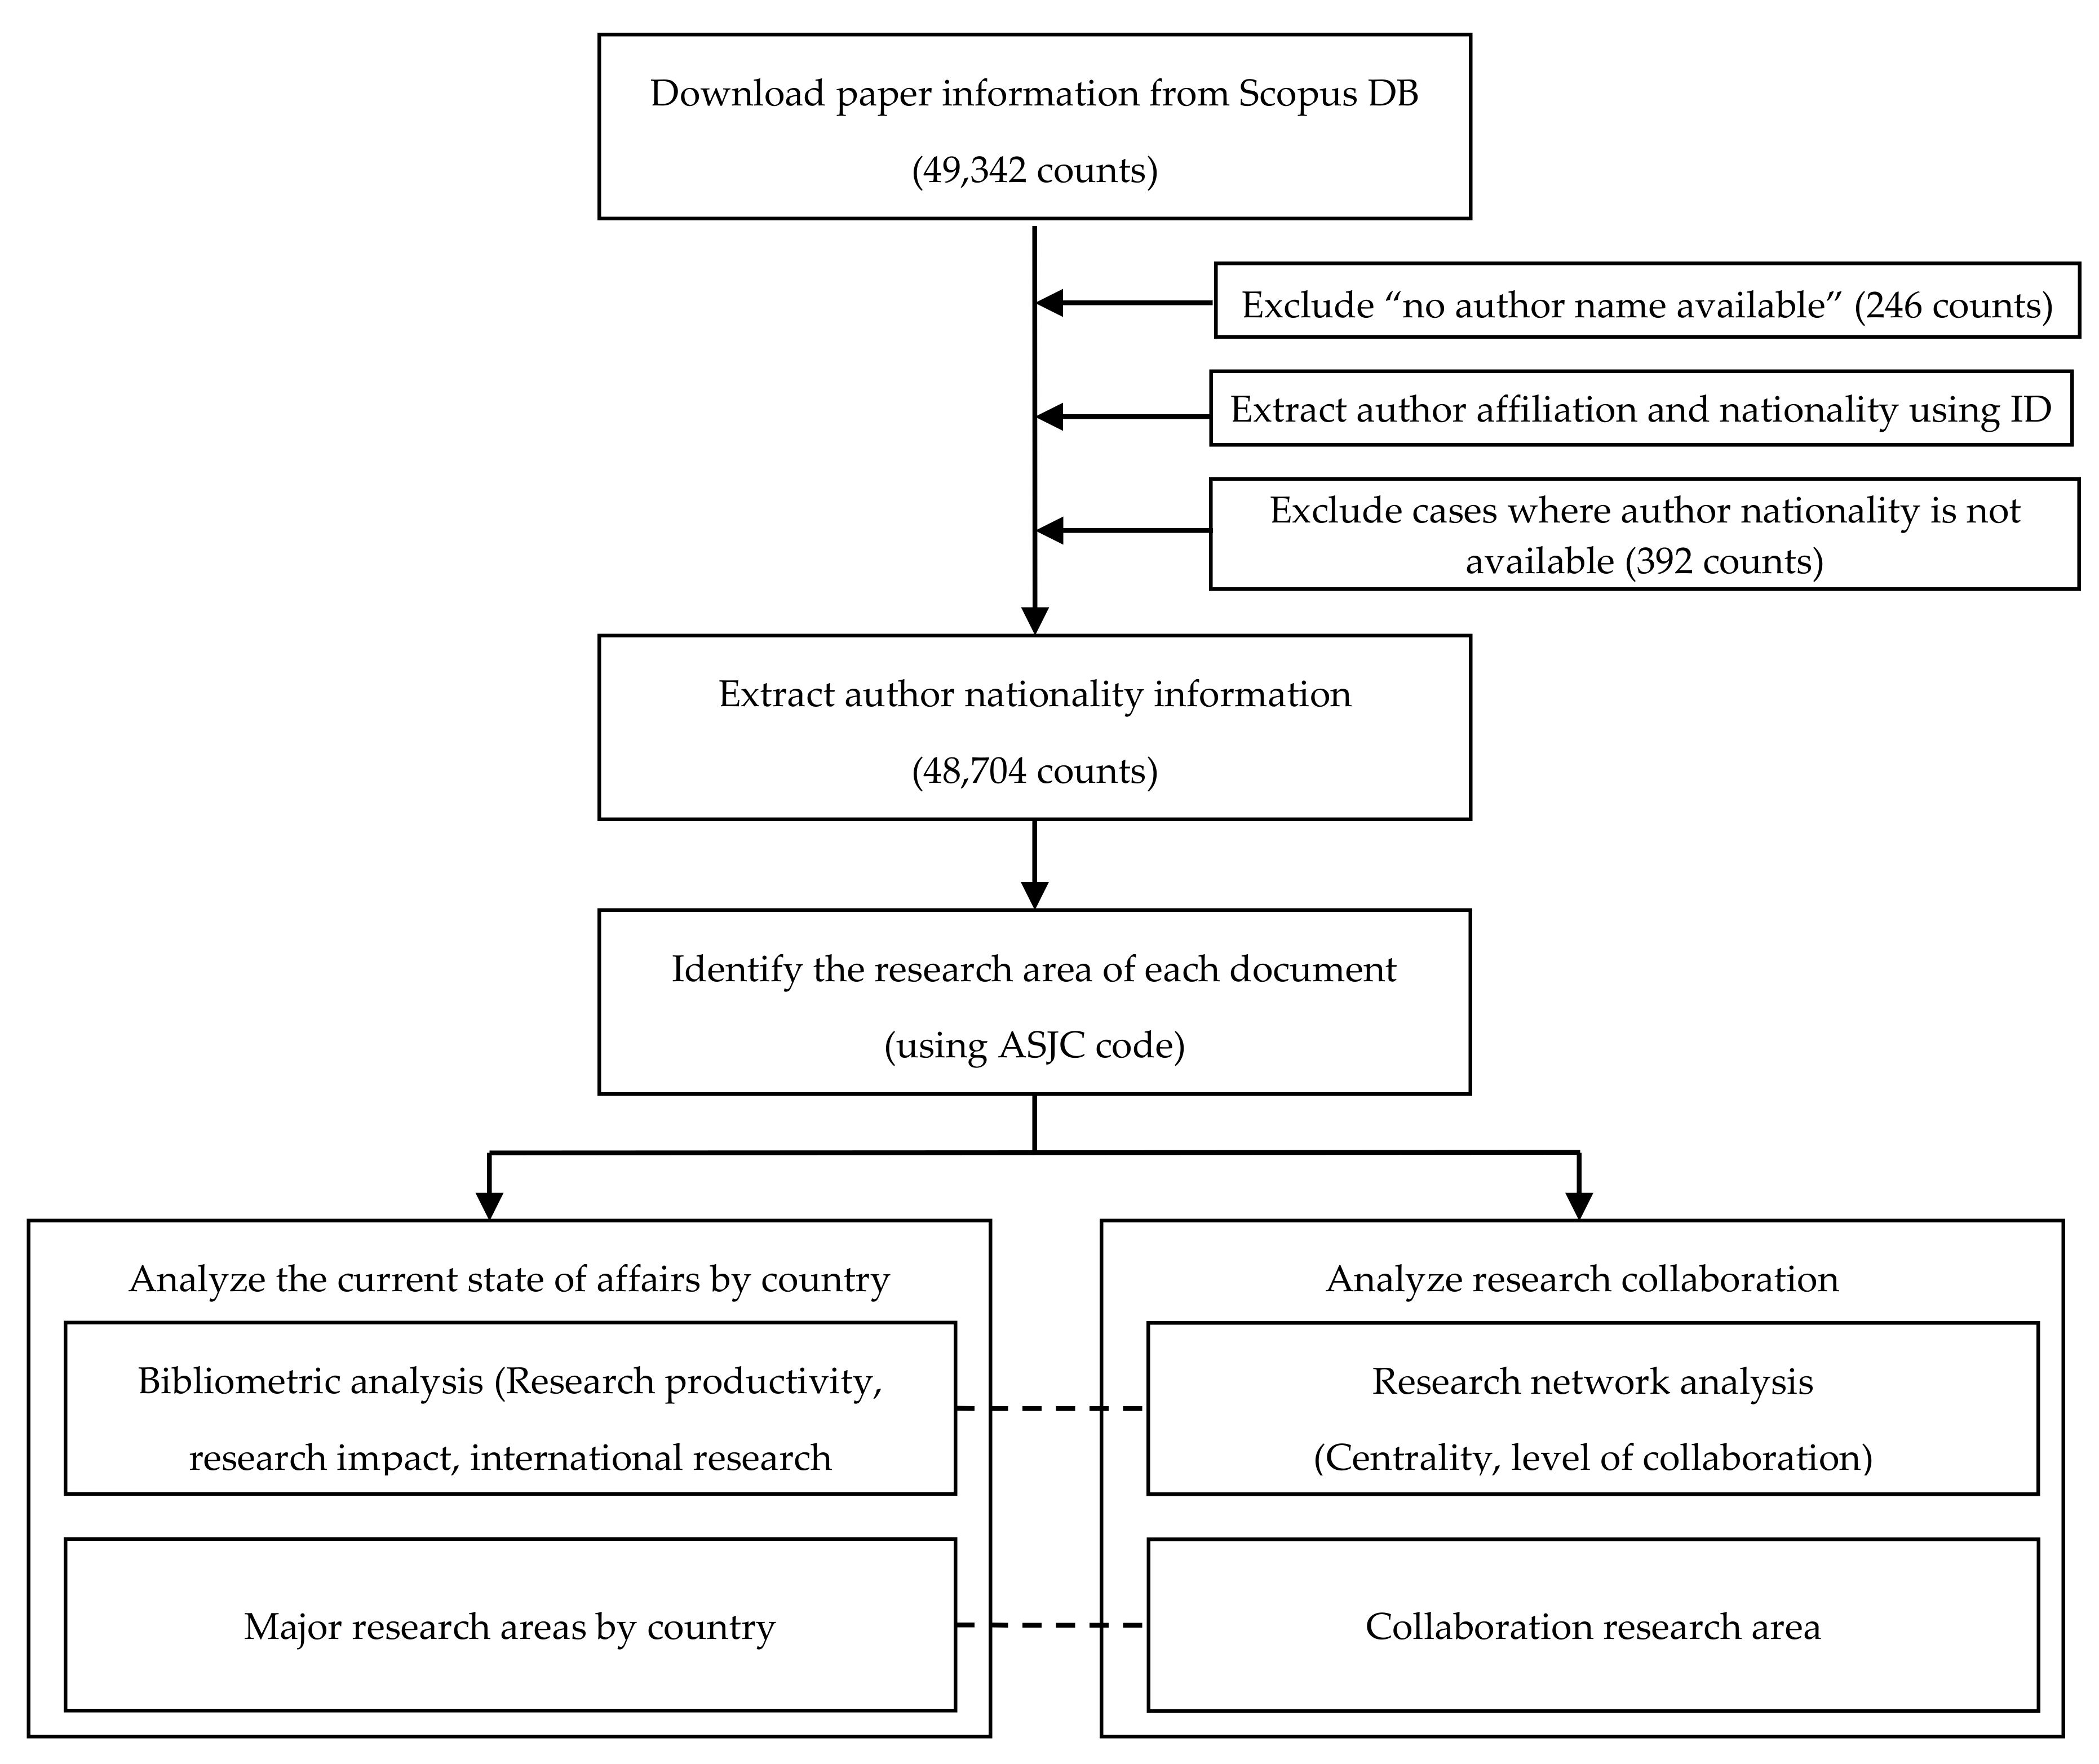
This study analyzed the position of each country in a global research network using the centrality index proposed by Freeman [59]. The mathematically calculated centrality index indicates positions and relationships within a network [60] using degree centrality, betweenness centrality, and closeness centrality. Degree centrality is a measure of the number of other nodes to which a node is directly connected; betweenness centrality is a measure of how well a node is connected to other nodes; and closeness centrality is a measurement of how short the distance is from one node to others. An analysis and visualization of the closeness centrality of the international collaboration network was conducted using the Gephi version 0.9.2 software. The analysis methodology is shown in Figure 1.
4. Results
4.1. Highly Contributing Countries
4.1.1. Comparison of the Level of Impact Using the Number of Publications
A total of 158 author nationalities were observed in a sample of 48,704 documents. The country that published the highest number of documents was the United States (13,742 counts); 28.2% of all documents had an author from the United States. This was followed by China (6554; 13.5%), the United Kingdom (5407; 11.7%), Italy (4657; 9.6%), and India (4256; 8.7%). Including the seven countries, each of which published three documents, there were 26 countries with less than 10 publications, 53 countries with 11 to 50 publications, and 13 countries with 51 to 100 publications. Furthermore, 92 countries, which comprise 58% of the 158 countries, published less than 100 documents.
To determine whether a relationship existed between the number of COVID-19 infections or deaths and research on COVID-19, this study evaluated the number of infections and deaths per country as of 31 December, 2020 (from the WHO website), and examined its relationship with the number of publications per country [19]. A calculation of the correlation coefficient using the SPSS program yielded a significant correlation between the number of publications and the number of infections per country (Pearson correlation = 0.820, p < 0.001), as well as between the number of publications and number of deaths per country (Pearson correlation = 0.792, p < 0.001). However, such a correlation does not necessarily imply that more research has been conducted in countries in which an infectious disease emerged or had the largest impact [29]. This is because most countries with high levels of infections or deaths are OECD or G20 countries, thus indicating a similar tendency as in prior studies, whereby high-income countries were observed to lead research [43].
4.1.2. Comparison of the Level of Impact Using Citation Rates
Of the 48,704 articles, 32,784 (67.3%) were cited more than once. The article that was cited most (12,738 times) was that of Huang et al. [61], who studied the clinical features of 41 of the first 59 suspected patients. China had the highest total number of article citations (288,108 times, compared with 223,364 in the United States). Although China had a lower number of total publications and a higher citation rate than the United States, there was a significant correlation between the number of documents and the citation rate. An analysis of the correlation between the number of articles published by the top 25 countries and the total number of citations yielded a Pearson correlation of 0.839, where p < 0.001.
The average citation rate (the total citation number/total document number) was highest for China (44), followed by the Netherlands (29.6), Singapore (26.9), and Germany (25.7). The United States, which published the most documents, had an average citation rate of 16.3, the 14th highest among the top 25 countries. An analysis of the total number of articles and the average citation rate of the top 25 countries indicated that the correlation was not significant, with a Pearson correlation of 0.196, where p = 0.348.
The h-index by country was the highest for China (233), followed by the United States (196). The average citation rate per article was also similar in the United Kingdom (128) and Italy (112), as in the United States. The number for other countries was lower than 90. Table 3 shows the top 25 countries that published the most documents and their COVID-19 scenarios, numbers of documents, citation rates, and h-indexes on 31 December, 2020.
4.1.3. Comparison of the Level of Impact Using Research Collaboration Indexes
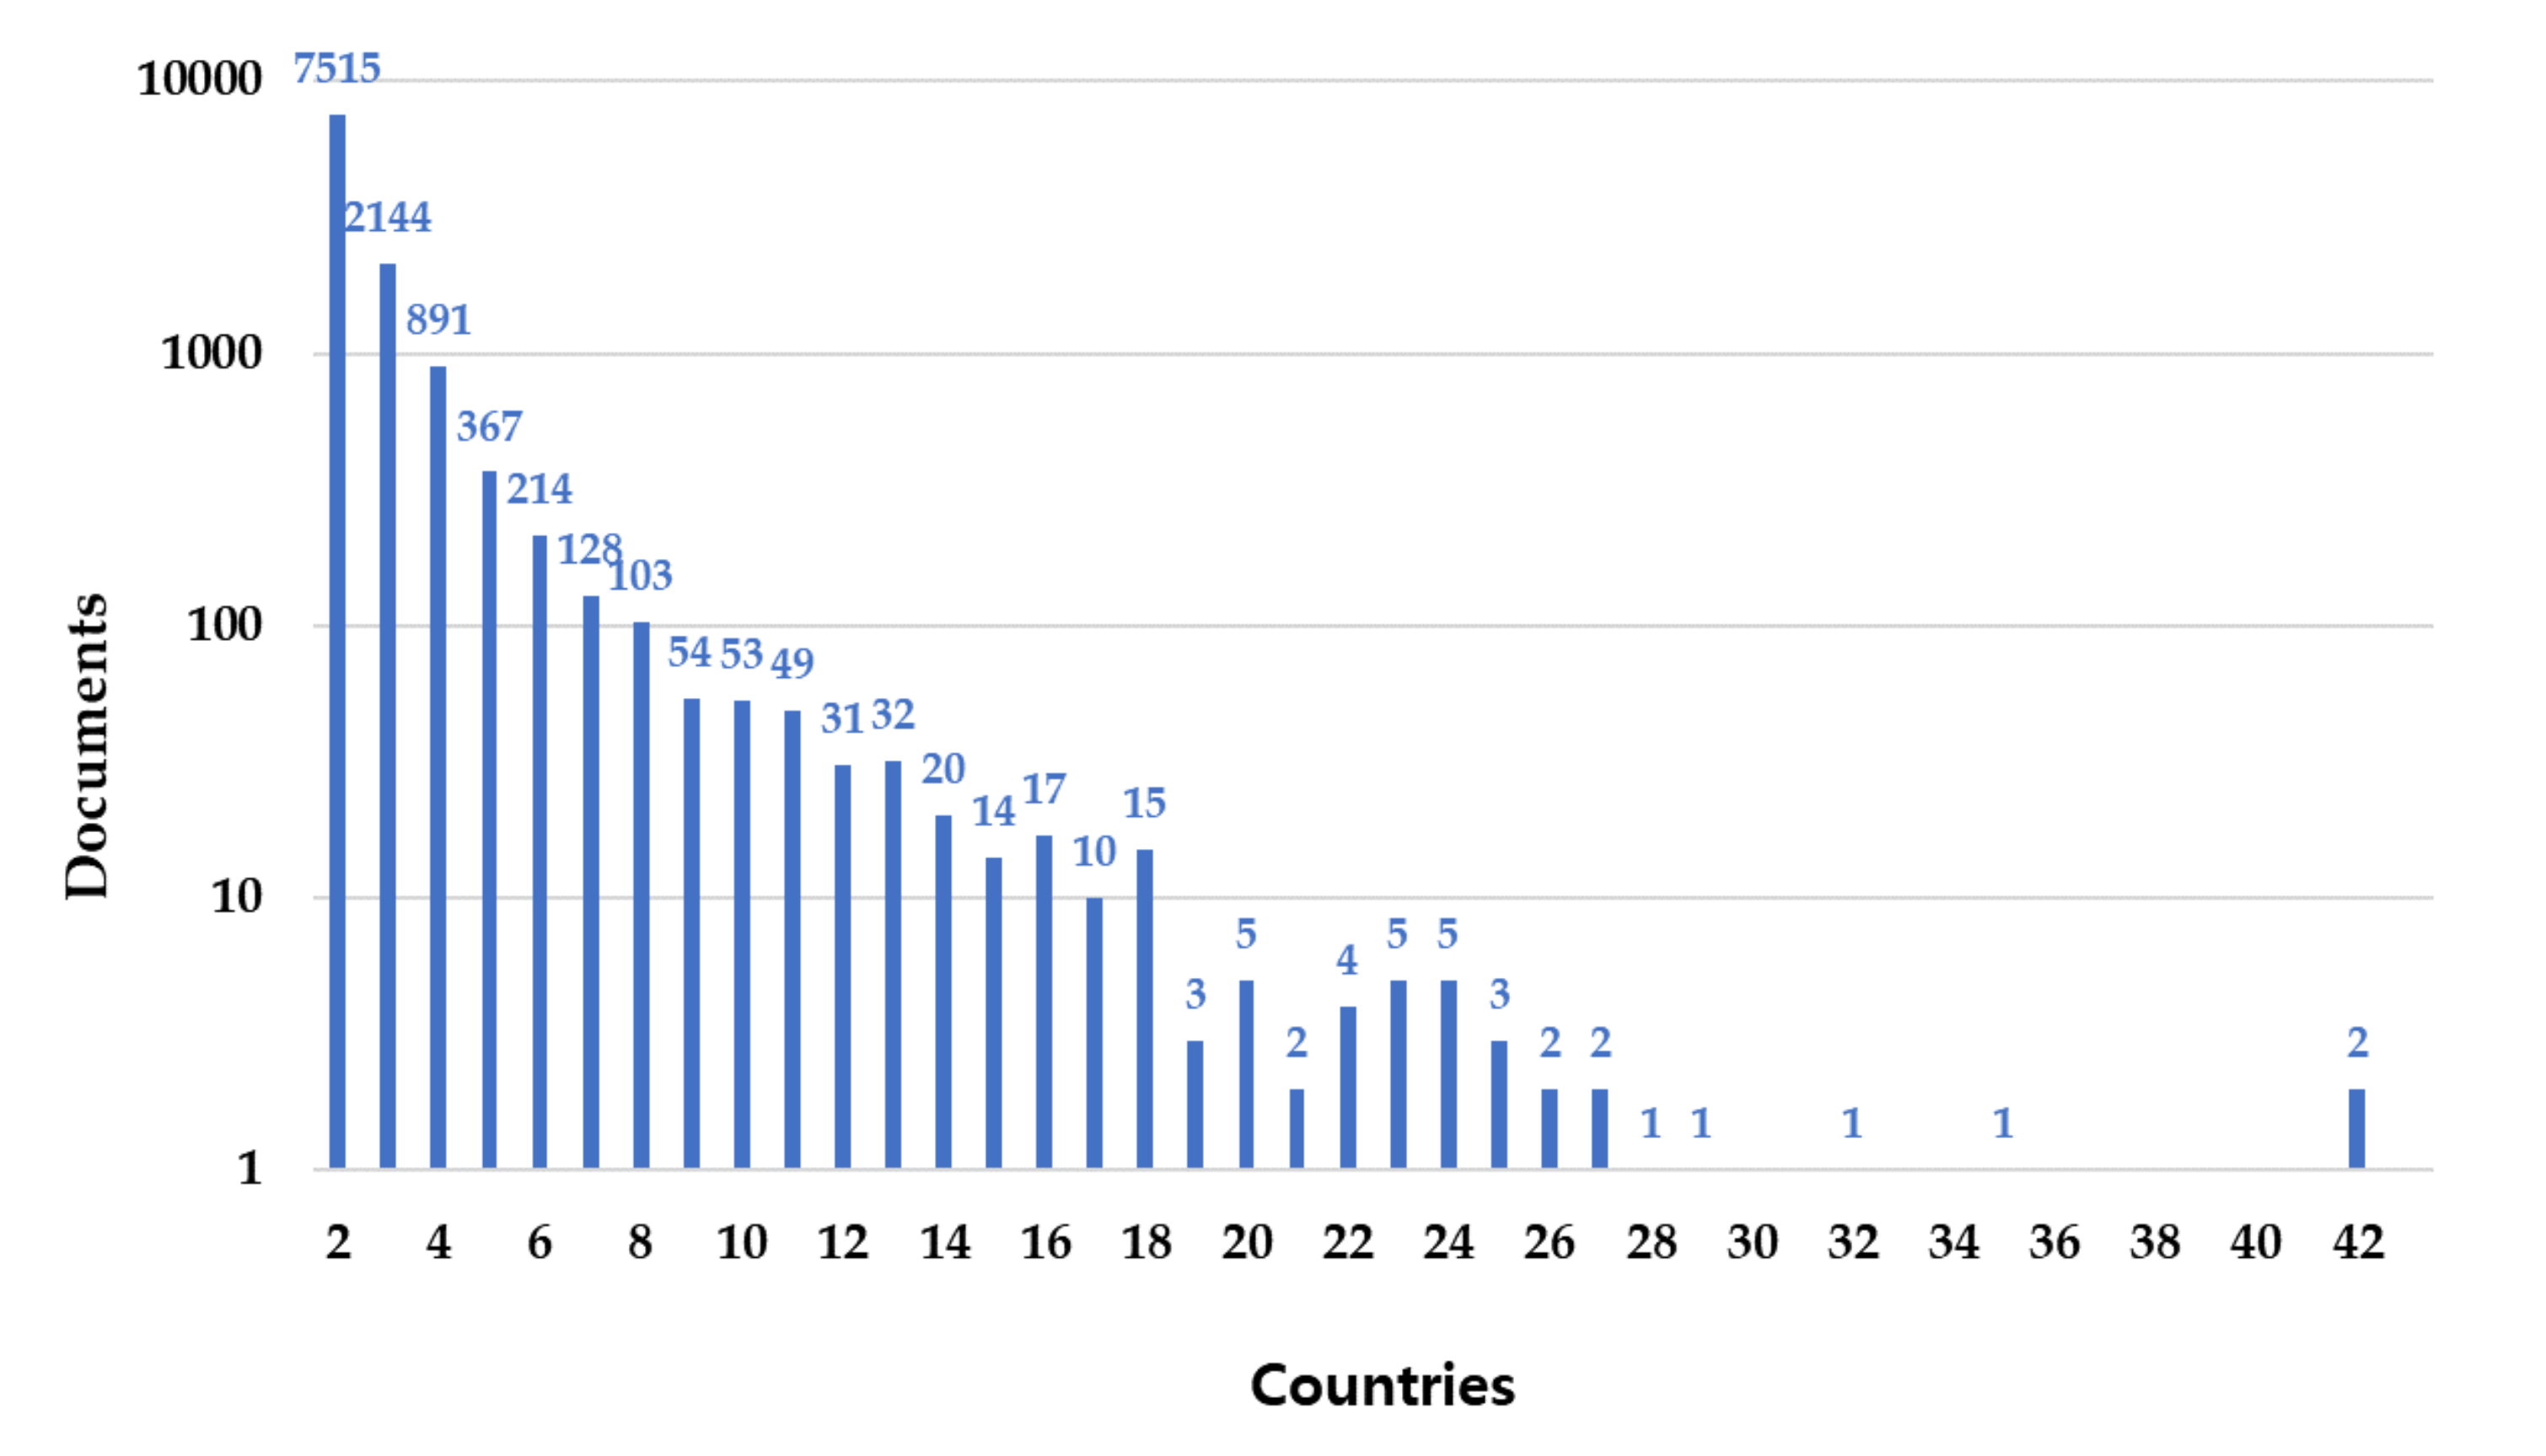
There were 37,010 articles (76%) with single-nationality authors and 11,694 (24%) with multinational authors. Directly comparing this to the general trend is difficult since the samples were drawn from a database that was limited to publications related to COVID-19; however, this was crudely similar to the research outcome of Wagner et al. [45], who observed that approximately 25% of Scopus articles were internationally co-authored. There were 7515 publications (64.3%) for which two countries collaborated, 2144 publications for which three countries collaborated (18.3%), and 2035 (17.4%) for which more than four countries collaborated. Figure 2 shows the number of articles according to the number of collaborating countries.
The studies in which the greatest number of countries collaborated were two publications that observed a lack of interferon as a reason for a COVID-19 patient having severe symptoms, explaining 14% of the reasons cited for a person developing a severe COVID-19 infection [62]. These two papers, published in SCIENCE, were written by different authors, but researchers from a total of 42 countries collaborated on them. For example, a total of 743 authors are listed in “Autoantibodies against type I IFNs in patients with life-threatening COVID-19” [63], and 813 authors are listed for “Inborn errors of type I IFN immunity in patients with life-threatening COVID-19” [64].
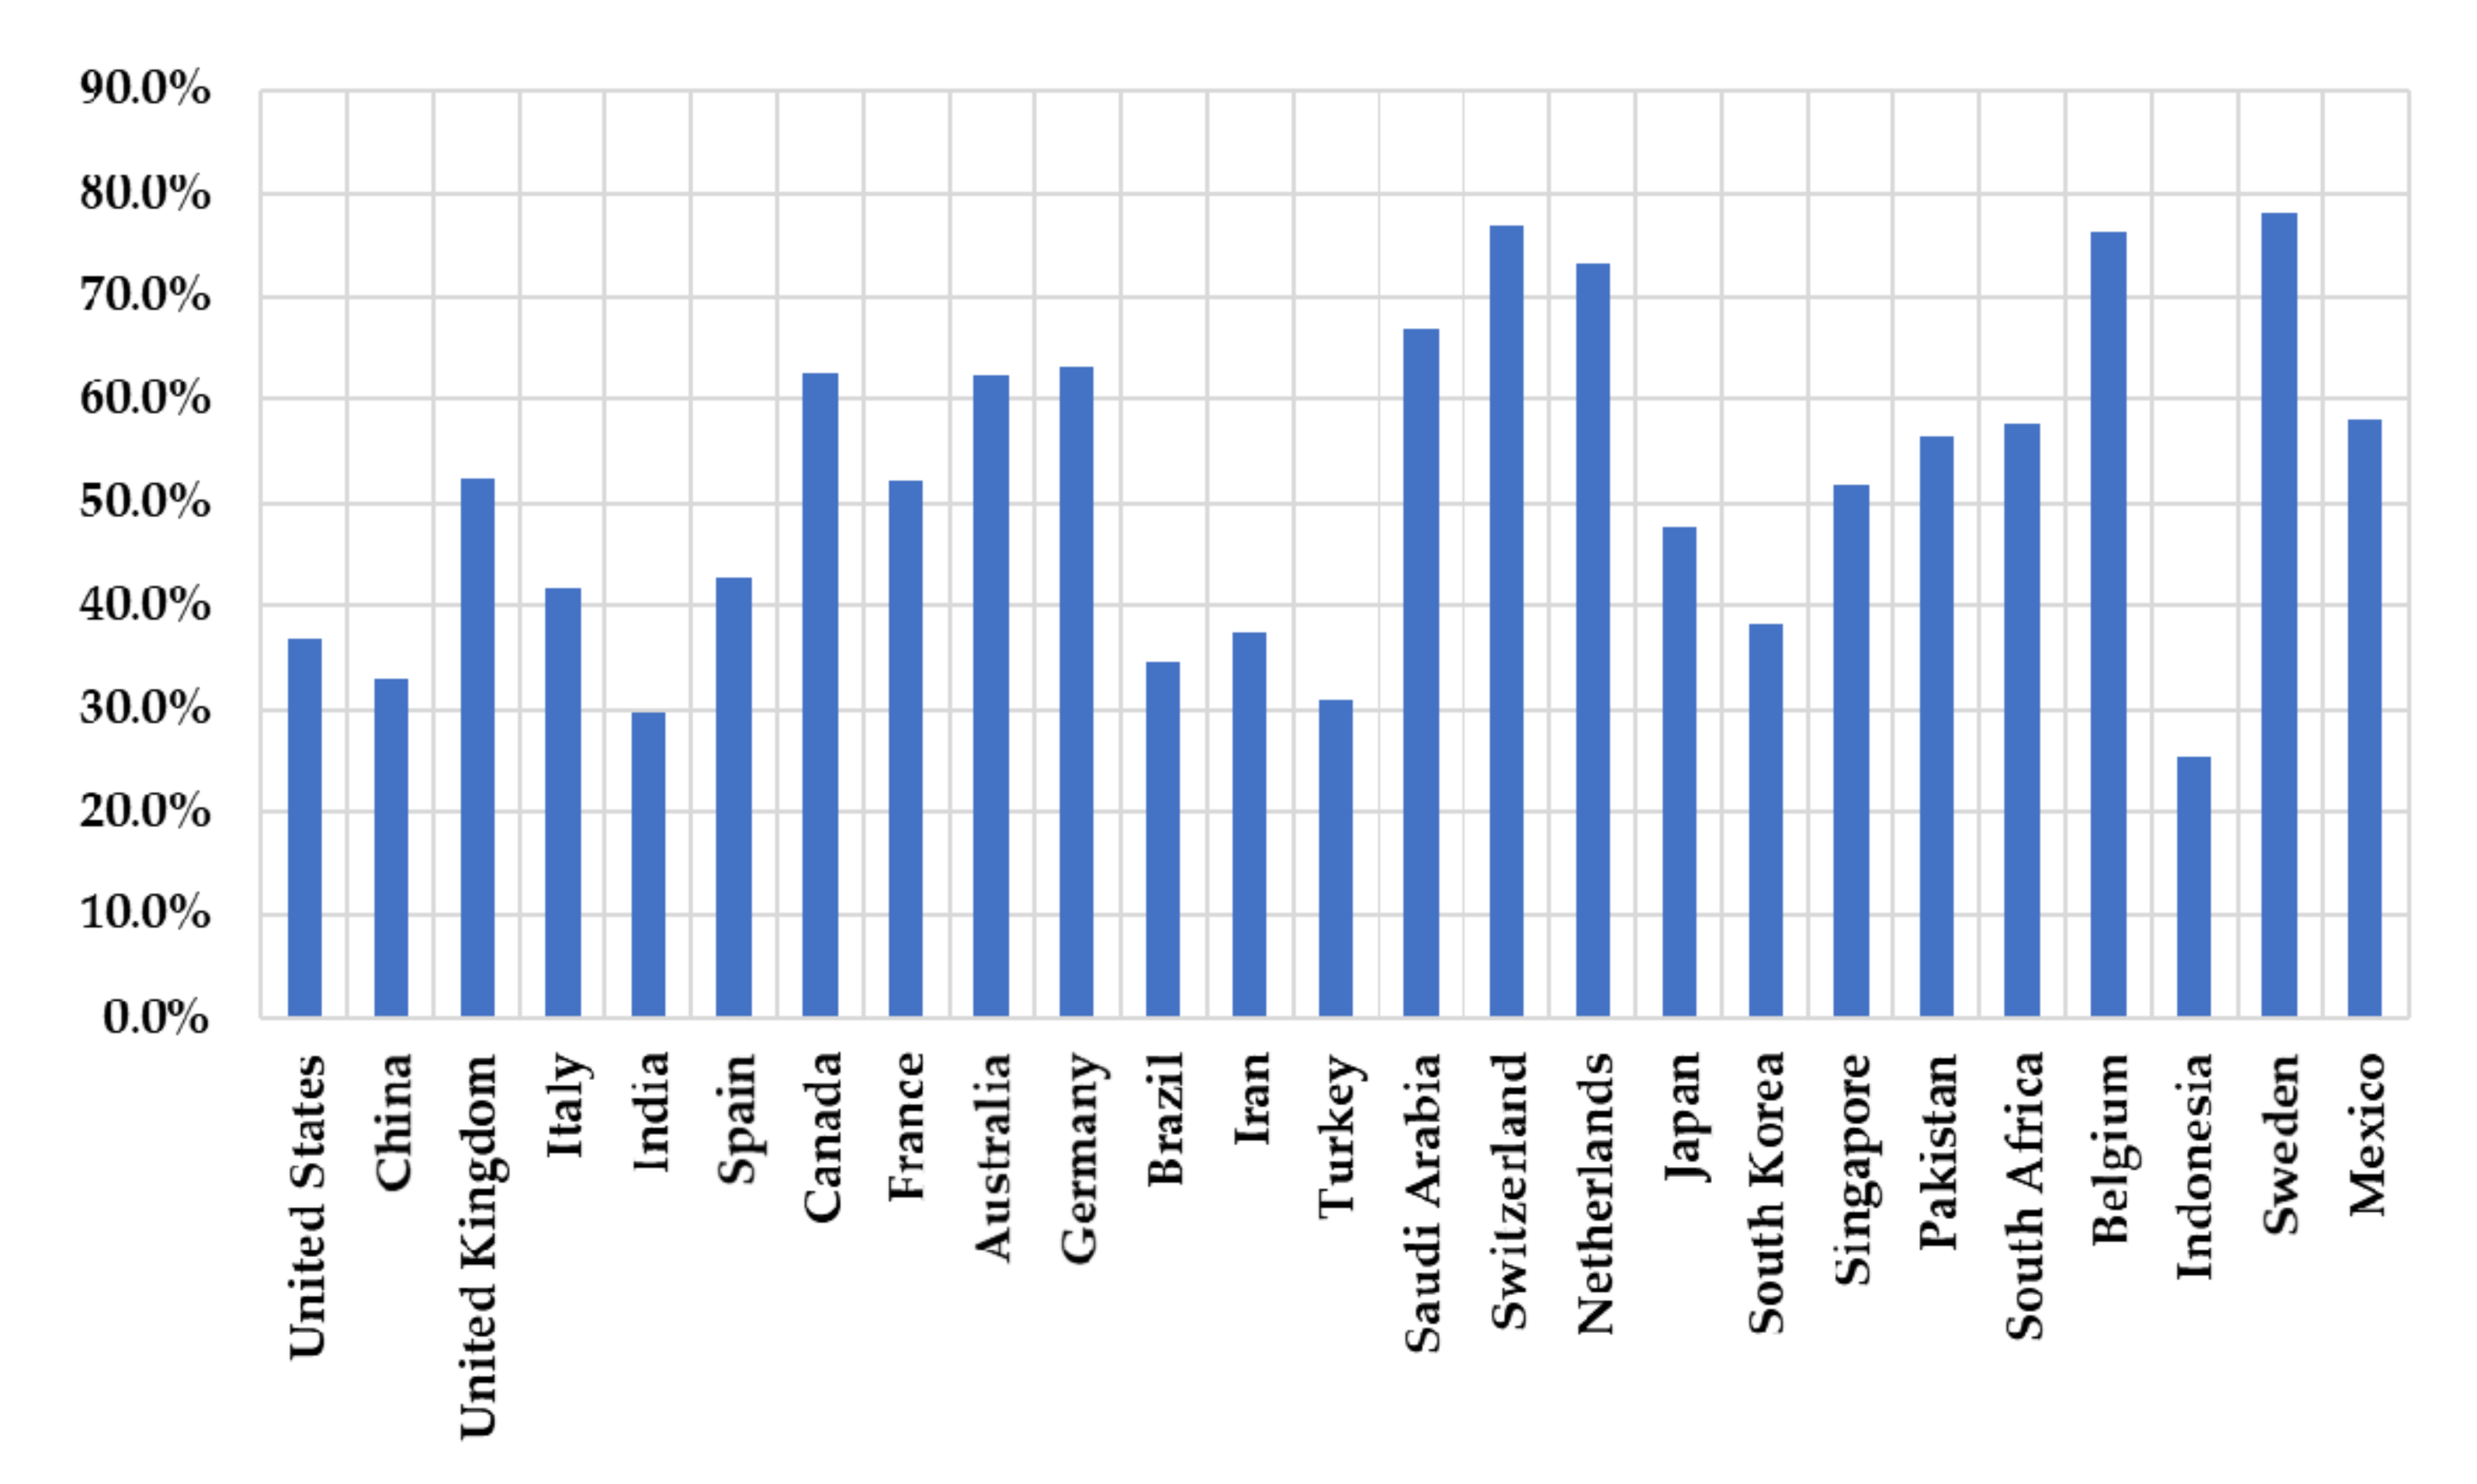
This study examined the share of collaborative research in each country. Figure 3 shows that the United States, which published the highest number of documents, released 5043 collaborative research documents (36.7%) out of 13,742. Meanwhile, China had 2361 (36%) out of 6554. Other countries that had a high share of collaborative research included Canada, Australia, Germany, and Saudi Arabia (more than 60%), as well as Switzerland, the Netherlands, Belgium, and Sweden (more than 70%).
4.2. Global Research Collaboration
4.2.1. Levels of the Global Research Network
Links within the global research network do not exhibit any orientation. Therefore, if all 158 countries are connected, 12,403 links are theoretically possible. An analysis of the international research network using the national information of coauthors indicated that 4987 links connect 158 countries with a density of 0.402. Thus, 40% of the total number of intercountry links that were theoretically calculated were connected. From the average distance connecting all countries (1.6), we can infer that most countries were either directly connected or indirectly connected through a third country. Each country was directly connected to an average of 63 other countries.
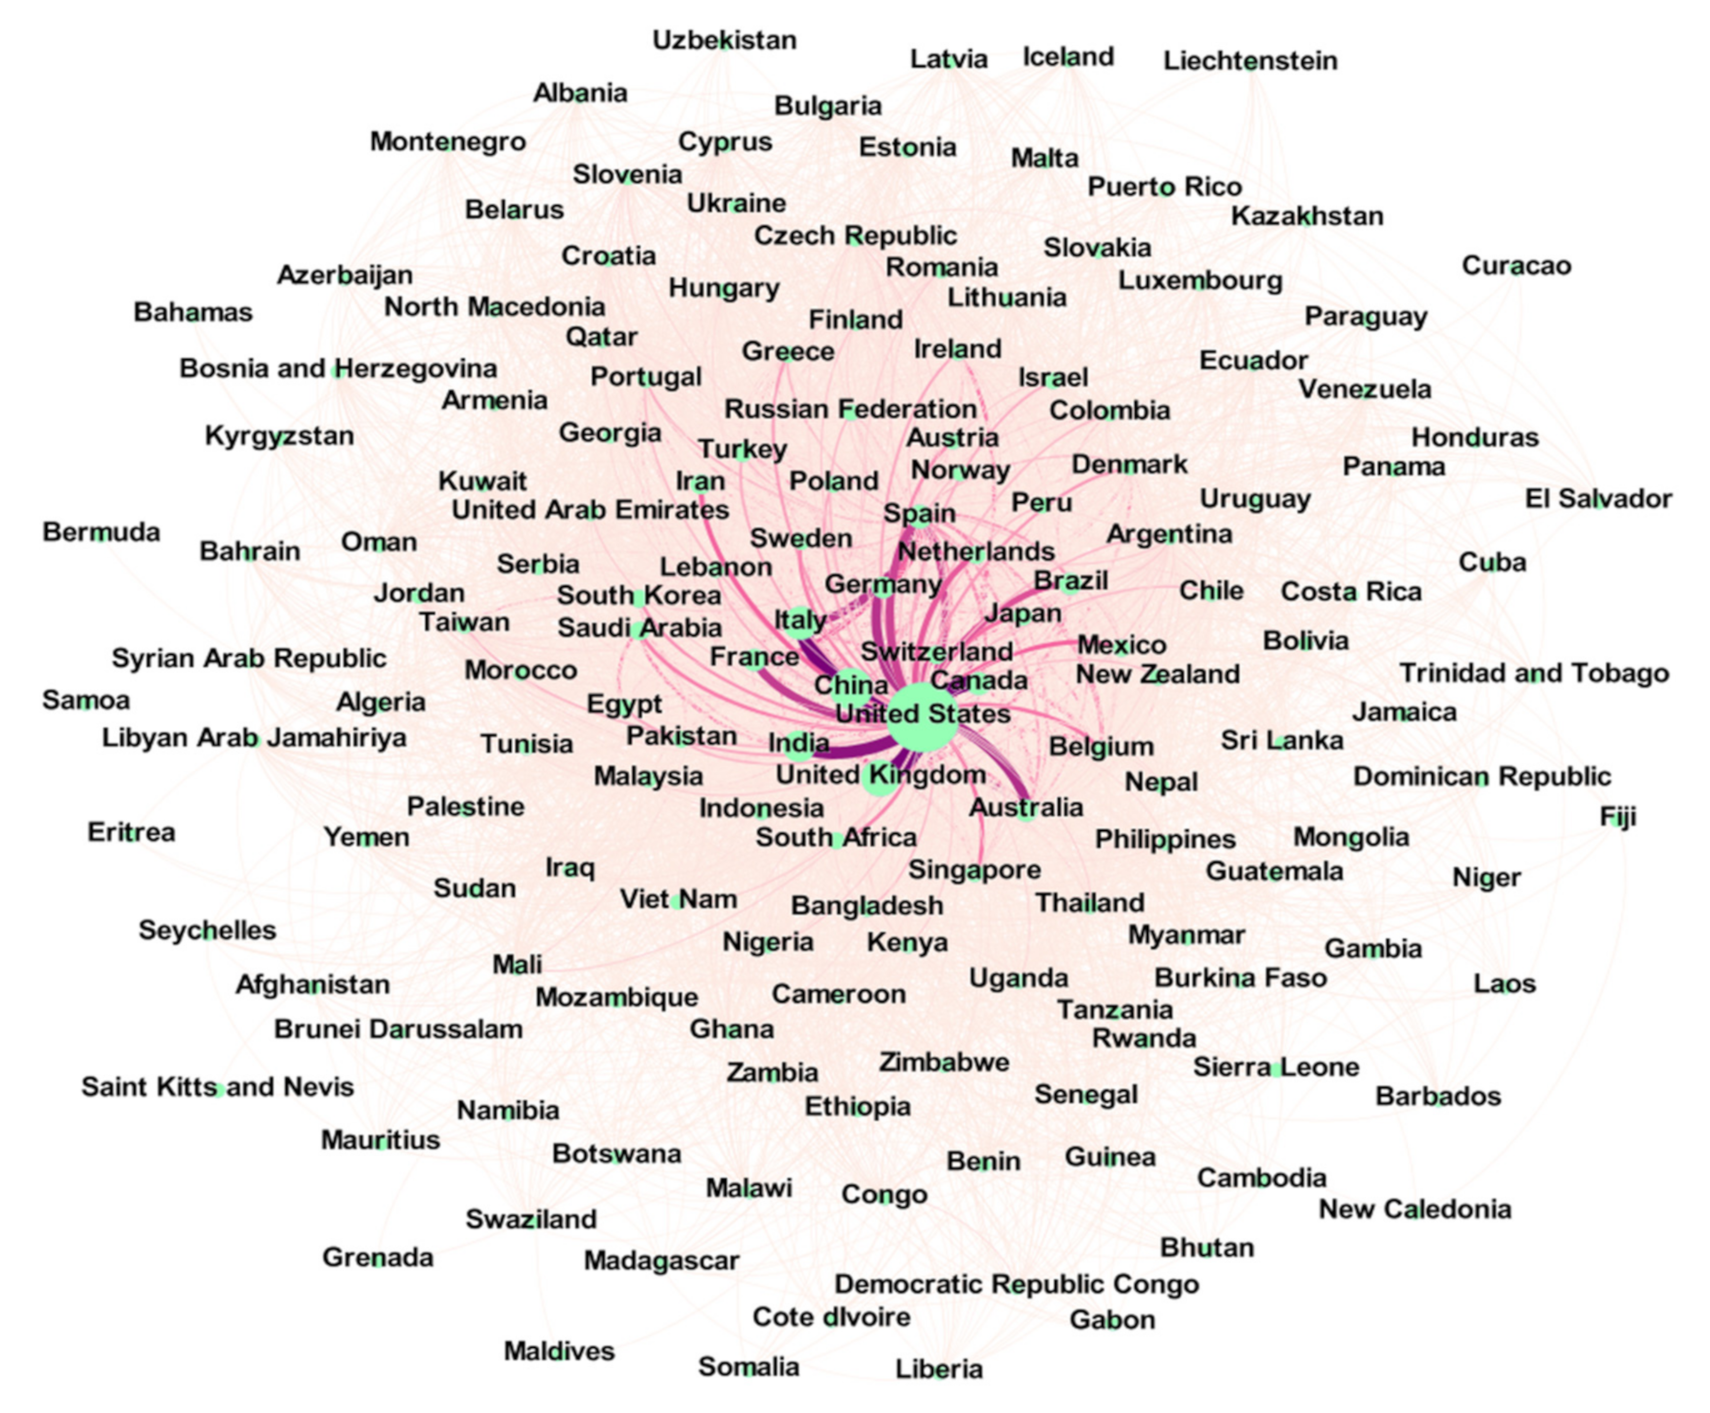
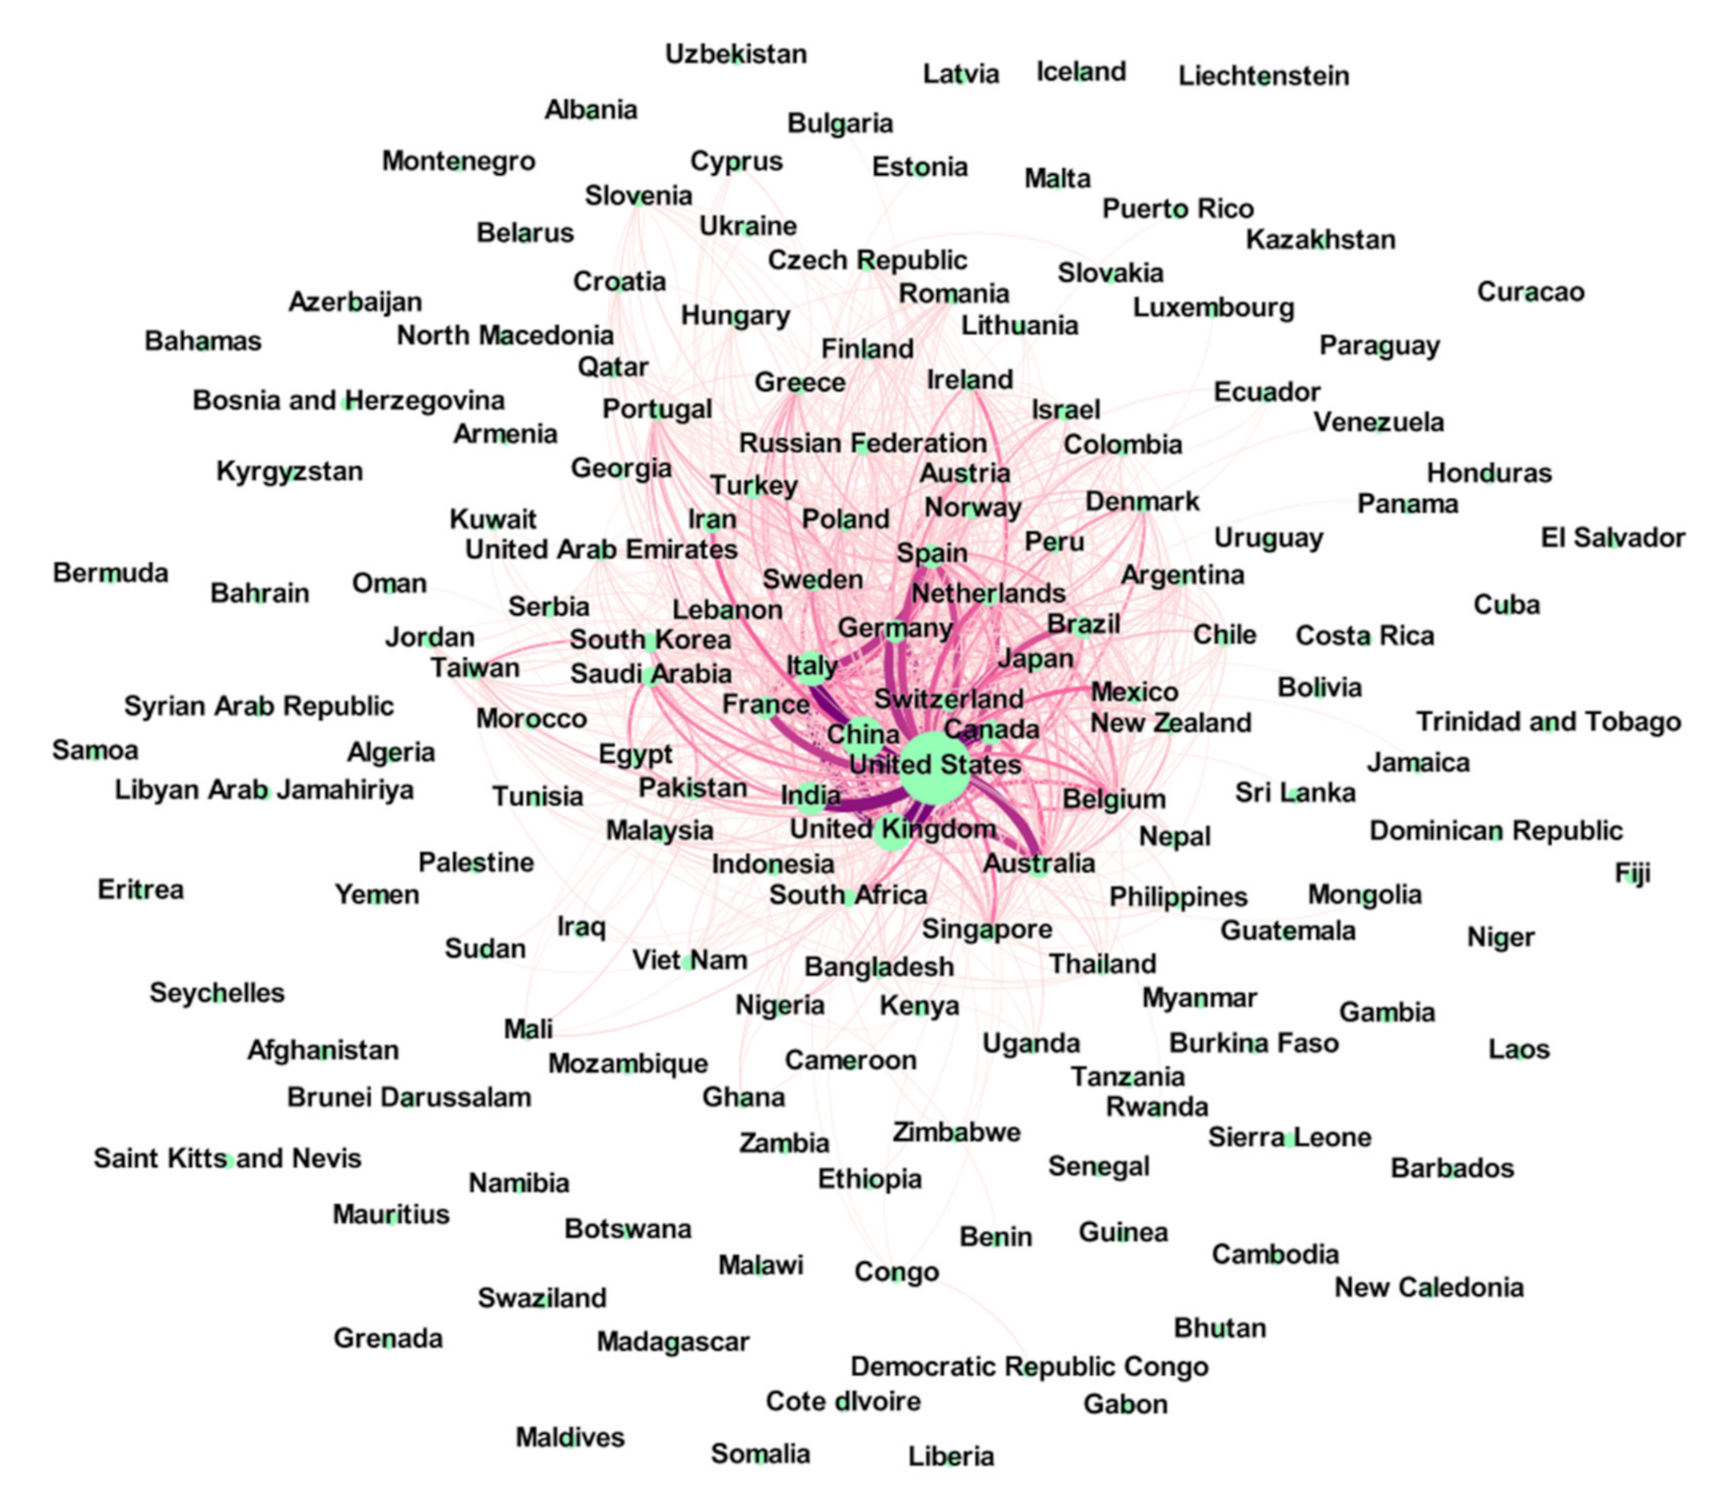
Figure 4 depicts the intercountry collaborative research network. The size of each node represents the number of documents. That is, the larger the node, the greater the number of published documents. The thickness and color of each link connecting the countries represents the frequency of research collaboration. In other words, the more frequent the collaboration, the thicker and darker the link. The most frequent research collaboration represented by the thickest link within the network was observed between the United States and China, with a total of 1026 times. Next was that between the United States and the United Kingdom (909), the United States and Italy (752), the United States and Canada (726), and the United Kingdom and Italy (617). However, as shown in Figure 4, a significant number of links were thin and pale. Of a total of 4987 links, 1544 (31.1%) were only one-time collaborations, 778 (15.6%) collaborated twice, and 463 (9.3%) collaborated three times. The average number of collaborations between countries was 12.7 times.
Table 4 shows the changes in the characteristics of the network, excluding the scenarios with low collaboration frequency. There were 928 links (18.6%) for which the number of research collaborations was 13, which is higher than the average number of 12.7. Figure 5 shows that when only those scenarios with more than 13 collaborations were considered, 66 out of the initial 158 countries were not connected to any other country.
4.2.2. Perspective of Centrality in the Network
Table 5 shows the centrality of the top 25 countries in terms of the number of documents published. The degree centrality and closeness centrality have similar tendencies. The degree centrality represents the number of nodes to which a node is directly connected, whereby the more nodes one is connected to, the shorter its distance to other nodes [65].
The United States had the highest degree centrality, closeness centrality, and betweenness centrality. China, which had the highest citation rate and h-index (both of which are measurements of research impact), ranked sixth for degree centrality and closeness centrality, and ranked fifth for betweenness centrality. The United Kingdom ranked higher than China for degree centrality. The betweenness centrality for India was 443.787, the second highest after the United States. Among countries with more than 60% collaboration, Australia, Switzerland, and the Netherlands had higher betweenness centralities than other countries that had published a similar number of documents.
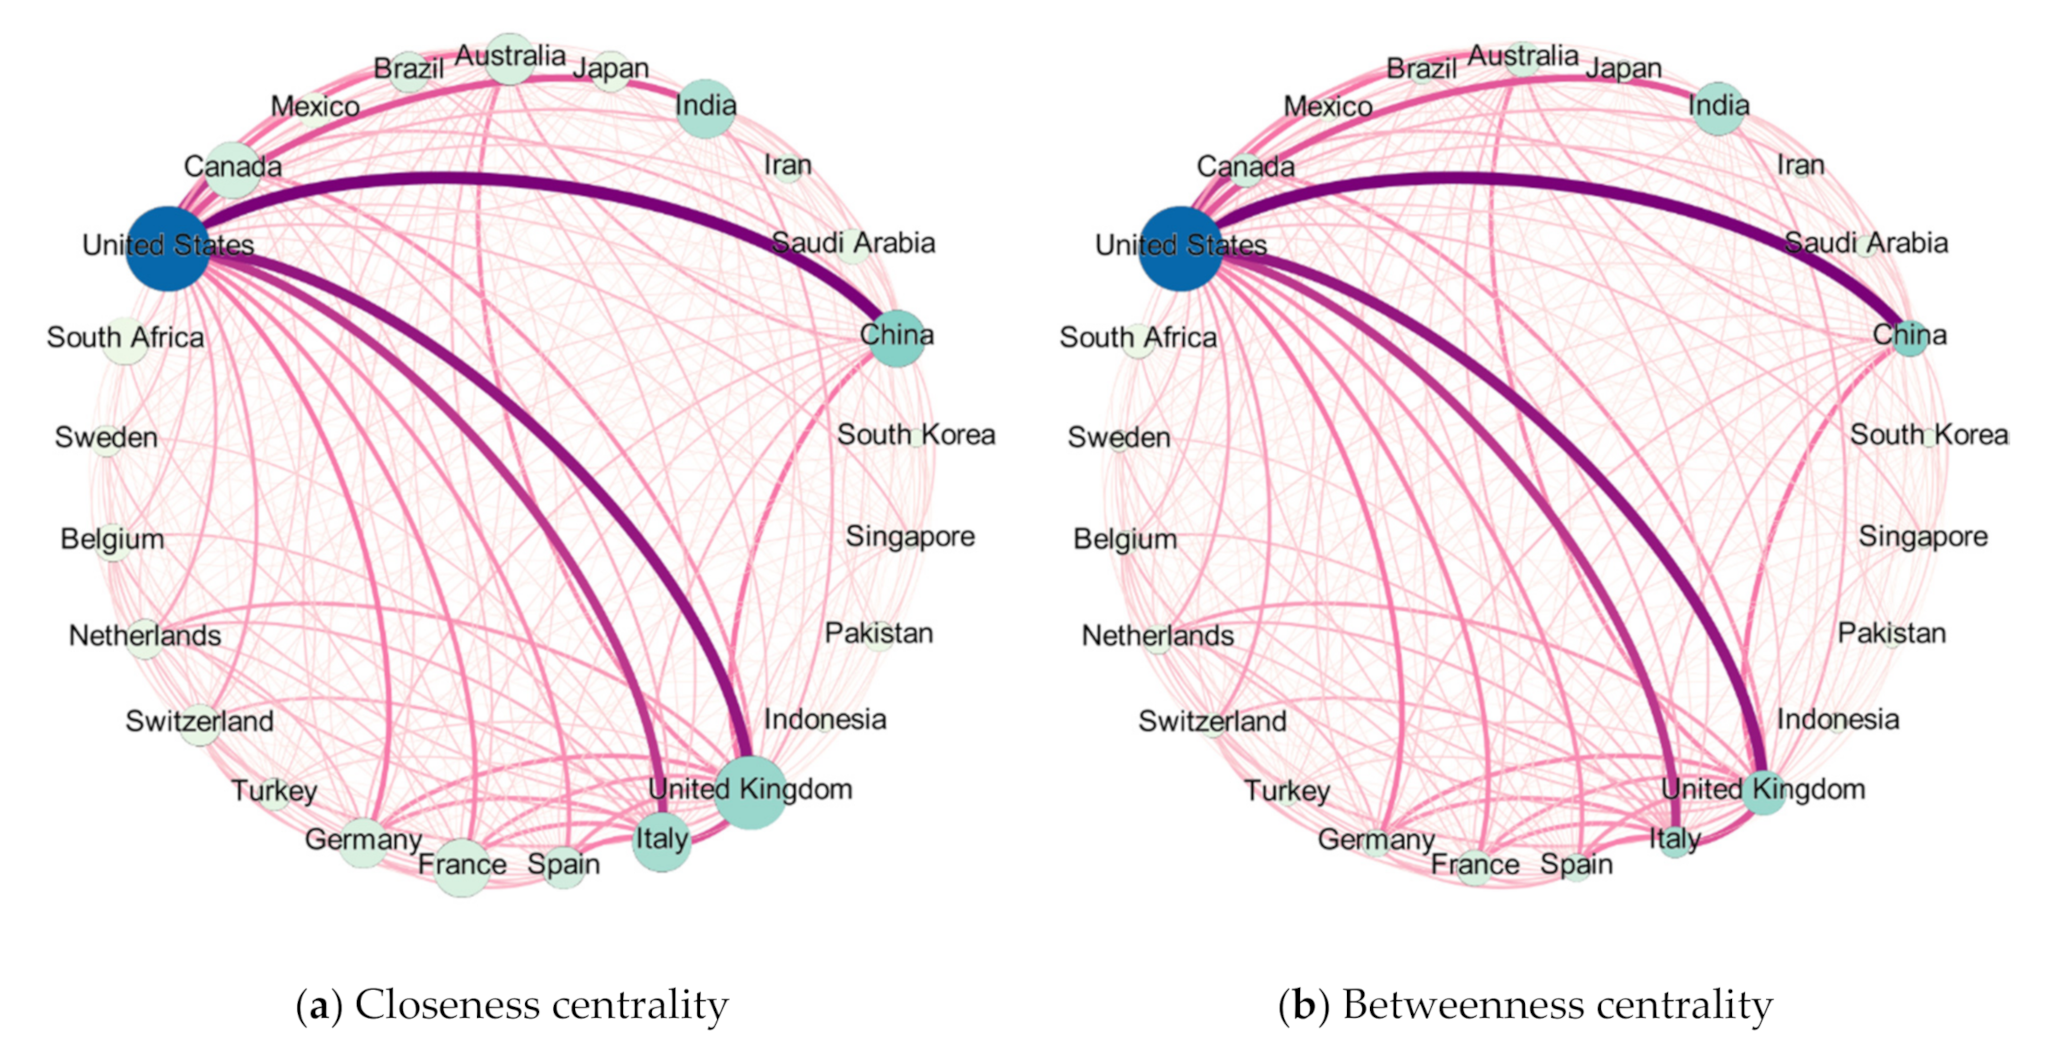
The closeness centrality and betweenness centrality of the 25 countries are shown in Figure 6 along with the research network. The deeper the color of a node, the greater the number of articles it represents. The size of a node represents a comparison of closeness centrality and betweenness centrality.
This graph shows that the United States was the most intensively connected to all other countries. Moreover, degree centrality was higher for European countries, indicating that they actively engaged in mutual research collaboration. In comparison, despite their geographical proximity, Asian countries did not actively collaborate in research, and their degree centrality was low. The two countries that published the highest numbers of articles, China and India, collaborated with many countries, but their only deep-colored and thick links are the ones that connect them to the United States and the United Kingdom.
4.3. Major Research Areas in Global Research Collaboration
4.3.1. Current State of Research per Technology Area
An analysis was conducted using the ASJC codes assigned to each document. The results indicate that research on health sciences constituted the largest share of all the articles, accounting for 56.9%. More specifically, medicine accounted for 51.7% and was the most researched area, followed by biochemistry, genetics and molecular biology (7.2%), and immunology and microbiology (5.2%). These were the three most actively researched subject areas from a total of 27. The ratios of documents by supergroup and subject area are listed in Table 6.
4.3.2. Comparison of Research Areas per Country
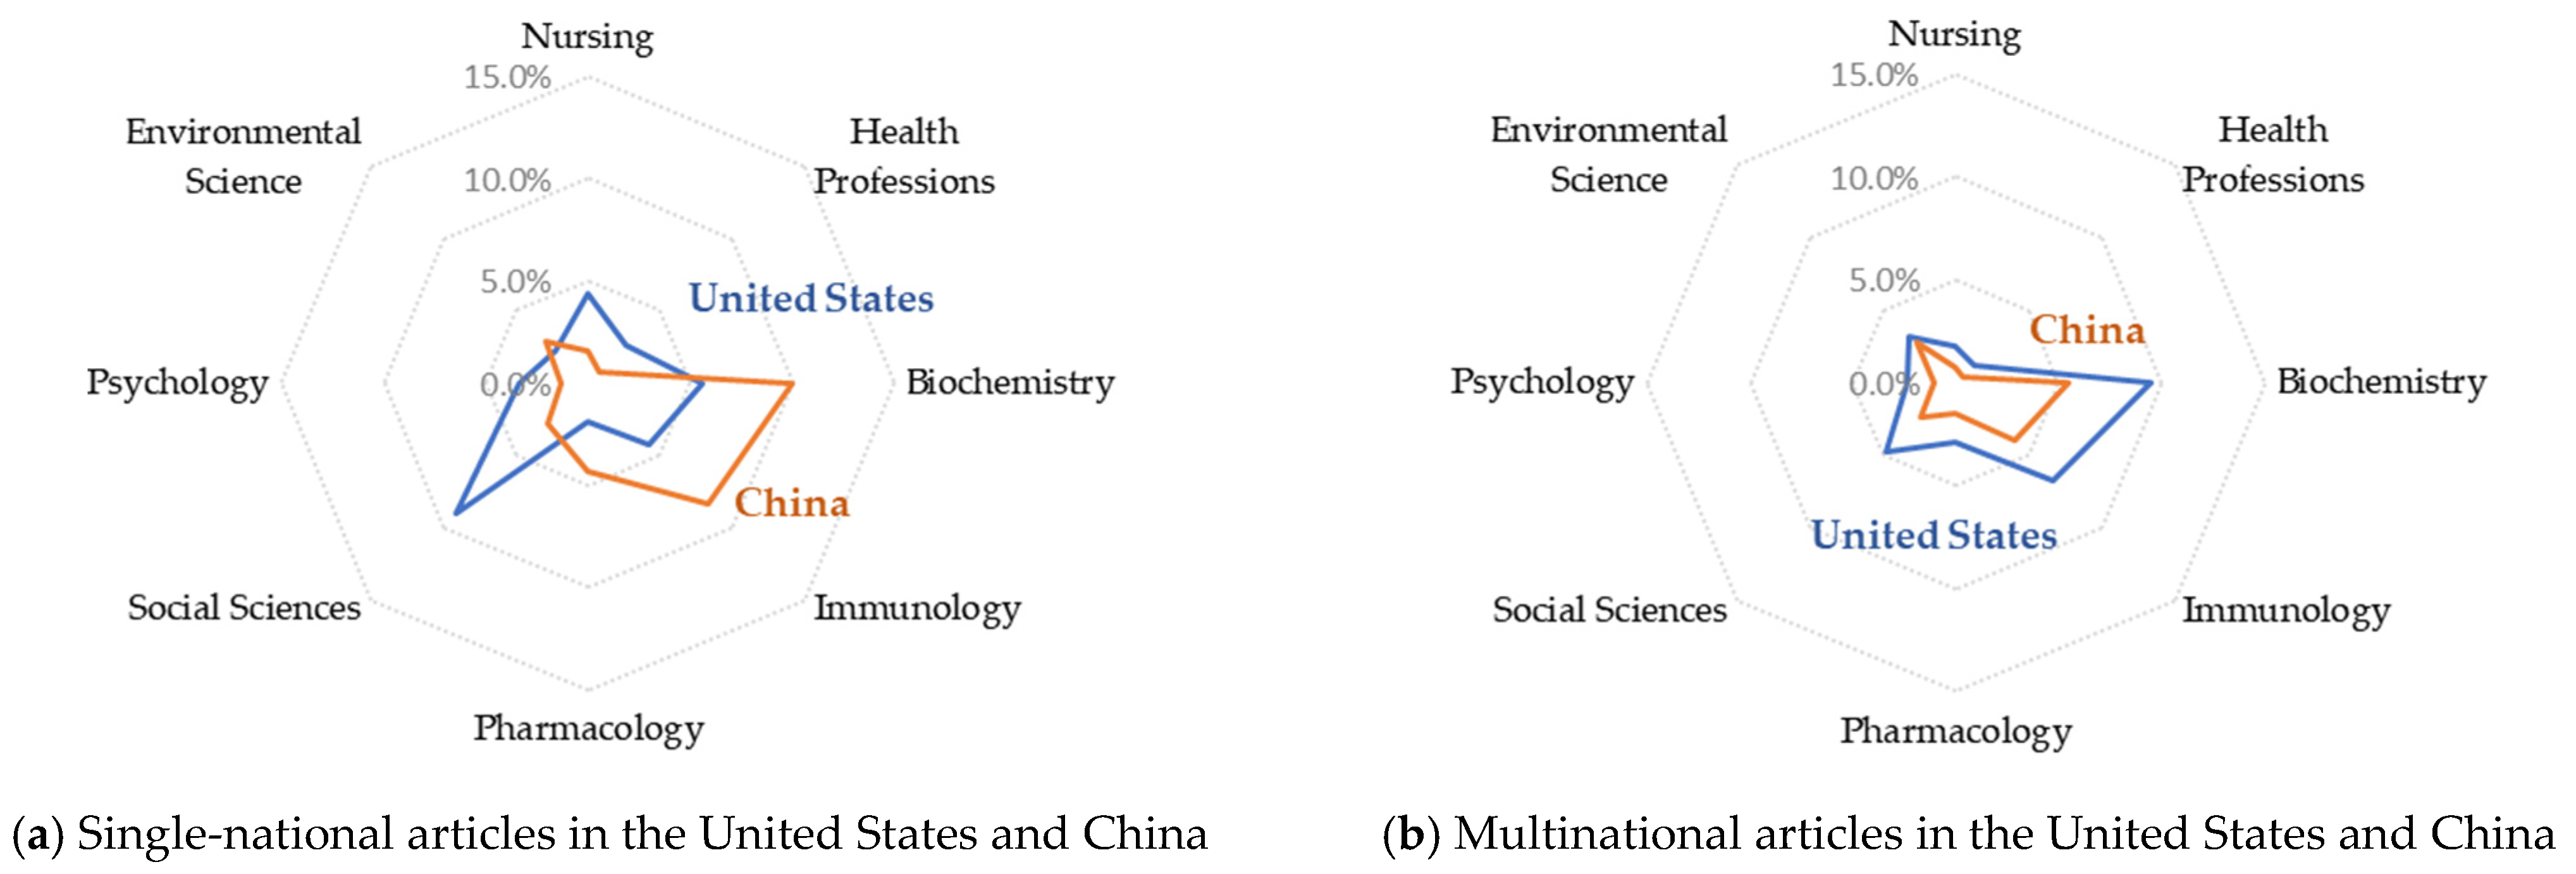
Figure 7 shows a comparison of the current state of research by country for eight subject areas (nursing; health professions; biochemistry, genetics, and molecular biology; immunology and microbiology; pharmacology, toxicology, and pharmaceutics; social science; psychology; and environmental science), which account for more than 2% of the subject areas in Table 6. Medicine, which was the subject area most frequently studied in all countries, is excluded from Figure 7 in order to compare areas of international collaborative research.
This study compared the major research areas of the United States and China, the two countries that published the highest number of documents. Multinational documents were excluded from this study, and only single-national documents from these two countries were included to deliver a more accurate comparison between the features of major research areas by country. This study examined 8699 out of 13,742 articles from the United States and 4397 out of 6554 articles from China. In the United States, the second most researched area after medicine (50.4%) was social sciences (9.1%), followed by biochemistry, genetics, and molecular biology (5.6%). In addition to social sciences, research has been conducted on psychology (6.5%) and business, management, and accounting (3.4%), thereby demonstrating that researchers are interested in not only the mechanism of COVID-19 but also its impacts on society and the challenges it has caused. The major research areas in China were medicine (50.6%); biochemistry, genetics, and molecular biology (10%); and immunology and microbiology (8.3%). The research on social sciences in China accounted for only 2.8%, which was significantly lower than that in the United States. Such differences are illustrated in Figure 7a, which compares the major research areas in China and the United States.
Although the major research areas differed by country, Figure 7b shows that the United States and China had similar trends in the subject areas of collaborative documents. The trend of extensive research in the social sciences in the United States was limited to single-national documents. Its global research collaboration tended to focus on life sciences, such as biochemistry, genetics, molecular biology, and immunology and microbiology. This indicates that intercountry collaborative research tended to focus more on life sciences and medicine than on social sciences.
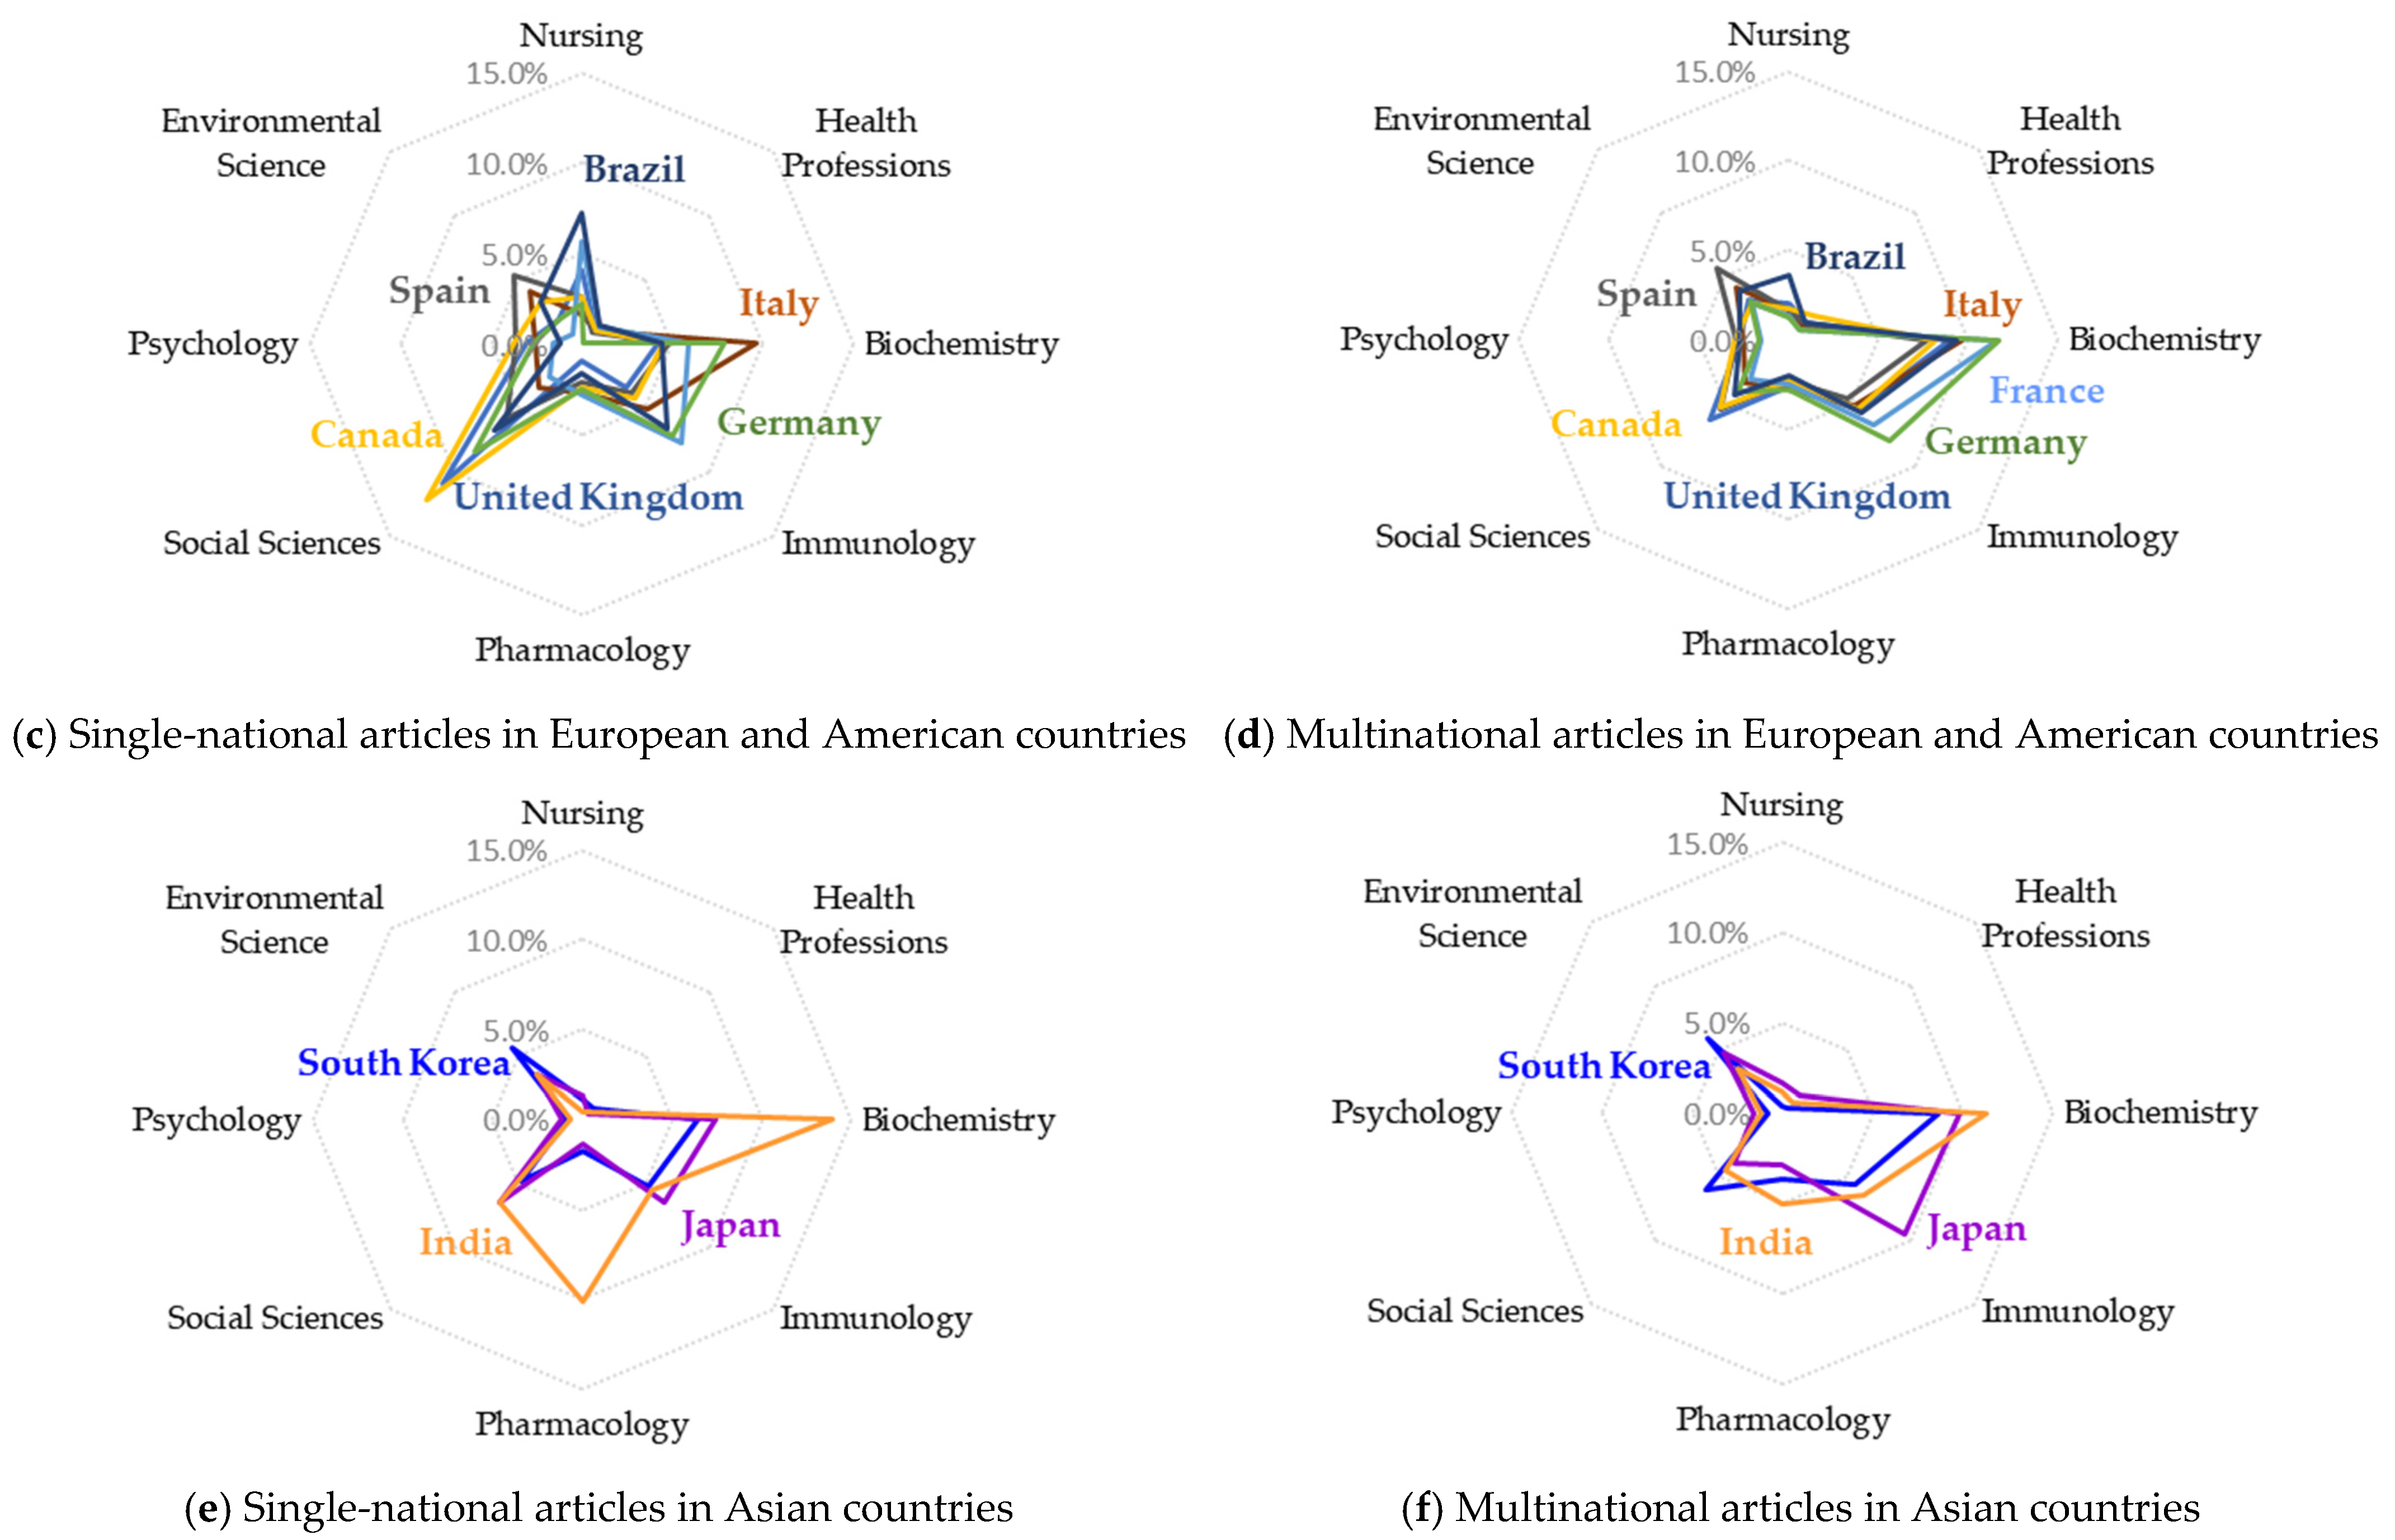
A similar tendency was observed for other European, American, and Asian countries. Figure 7c shows the subject areas across these countries. The European countries that were examined included the United Kingdom, Italy, France, Germany, and Spain. The countries examined in the Americas were Canada and Brazil. The Asian countries examined included India, South Korea, and Japan. Some differences were observed between European and American countries, but most countries exhibited an interest in social sciences. The share of research on social sciences was 12.2% in Canada, 10.9% in the United Kingdom, 8.4% in Germany, 6.8% in Brazil, and 5.8% in Spain. In contrast to other European countries, Italy focused more on biochemistry genetics and molecular biology (9.6%) than on social sciences (3.4%).
In South Korea, as in China, less than 5% of all publications were in the social sciences. In India and Japan, the share of research on social sciences (6.5%) was higher than that in China or South Korea, but more attention was given to biochemistry, genetics, and molecular biology (14%) and pharmacology, toxicology, and pharmaceutics (10.1%). South Korea and Japan conducted more research on biochemistry, genetics, molecular biology, and immunology and microbiology.
Despite the differences between major research areas in different countries, Figure 7b,d,f show that international research collaboration occurred most frequently in the field of life sciences, including biochemistry, genetics, molecular biology, immunology, and microbiology. In other words, international research collaboration occurred more frequently in life sciences and medicine than in the social sciences.
4.3.3. Knowledge Expansion through Intercountry Research Collaboration
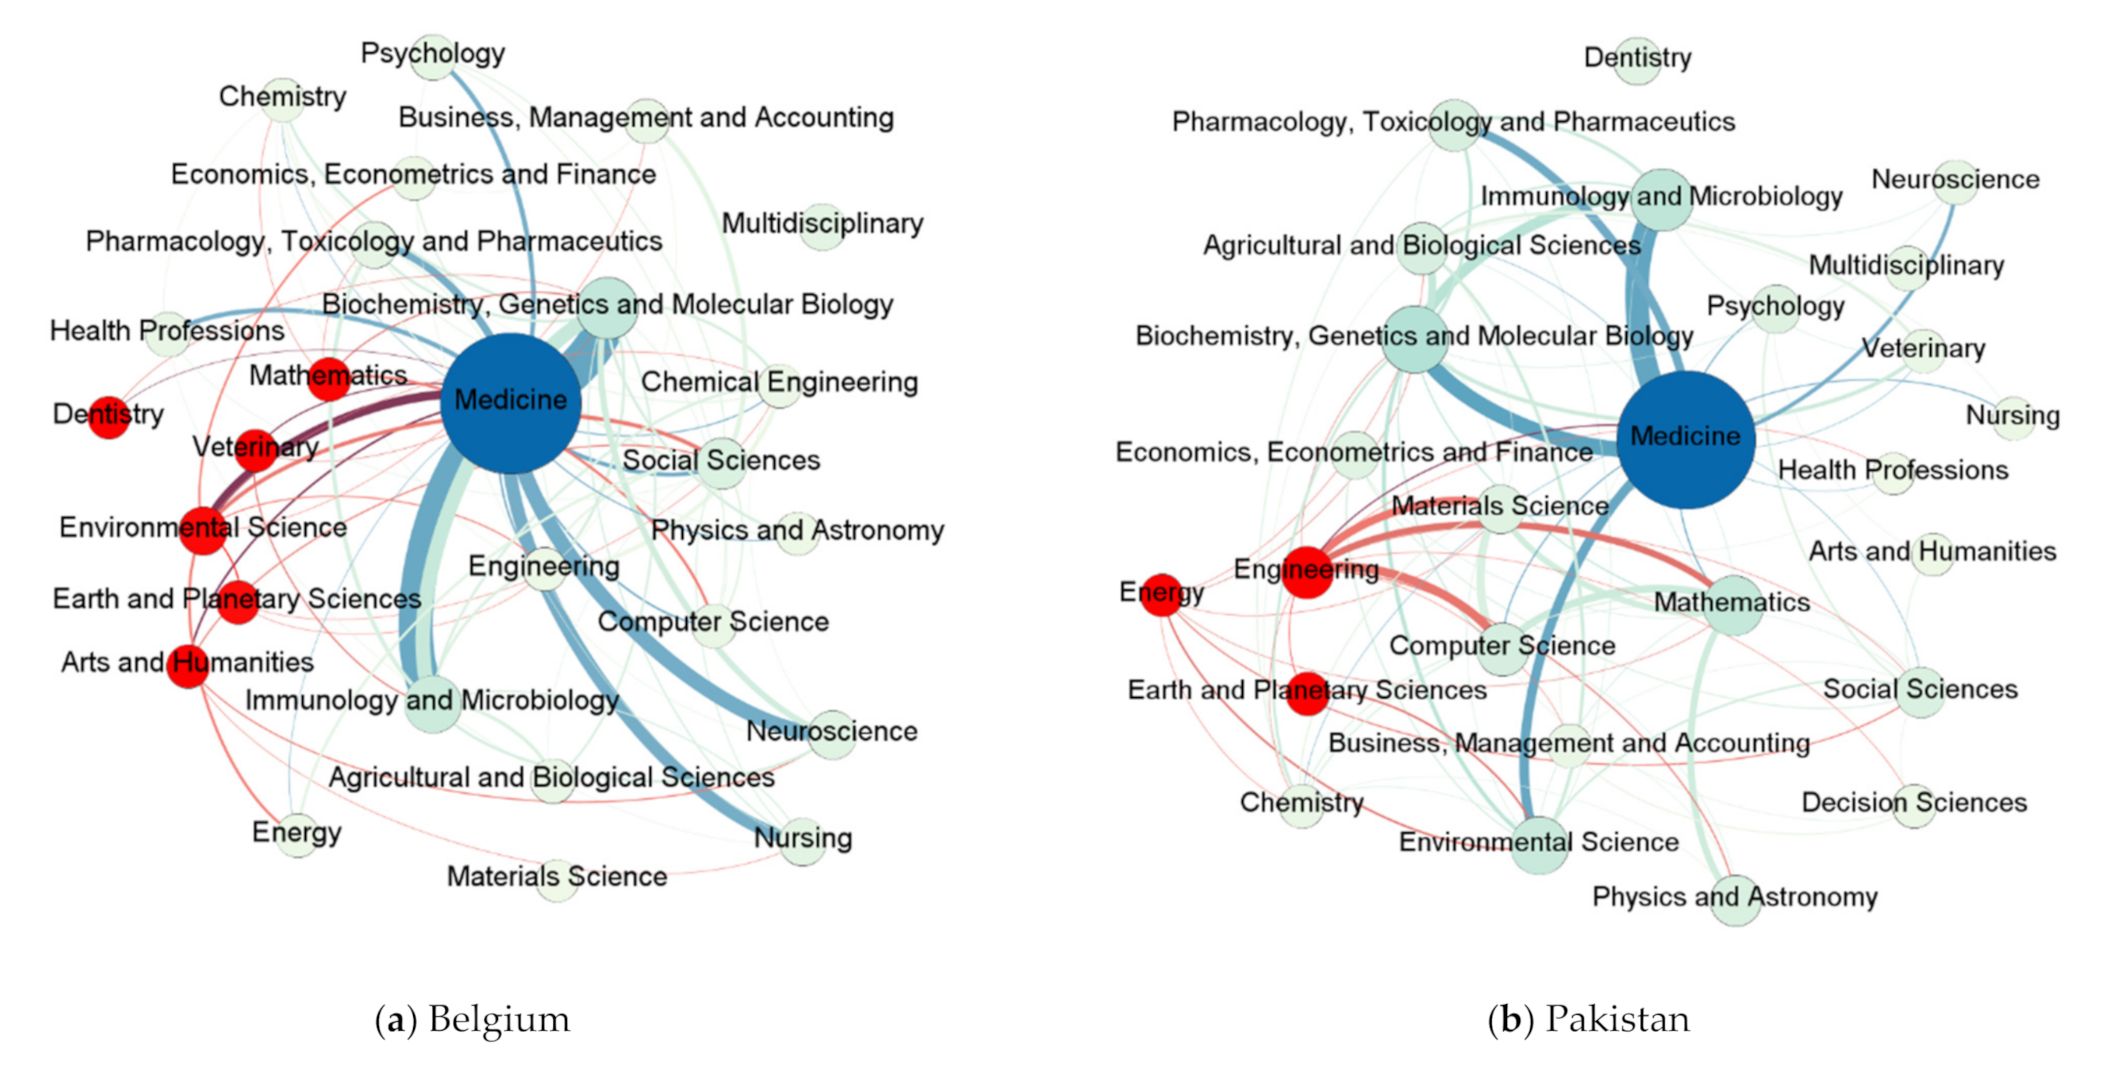
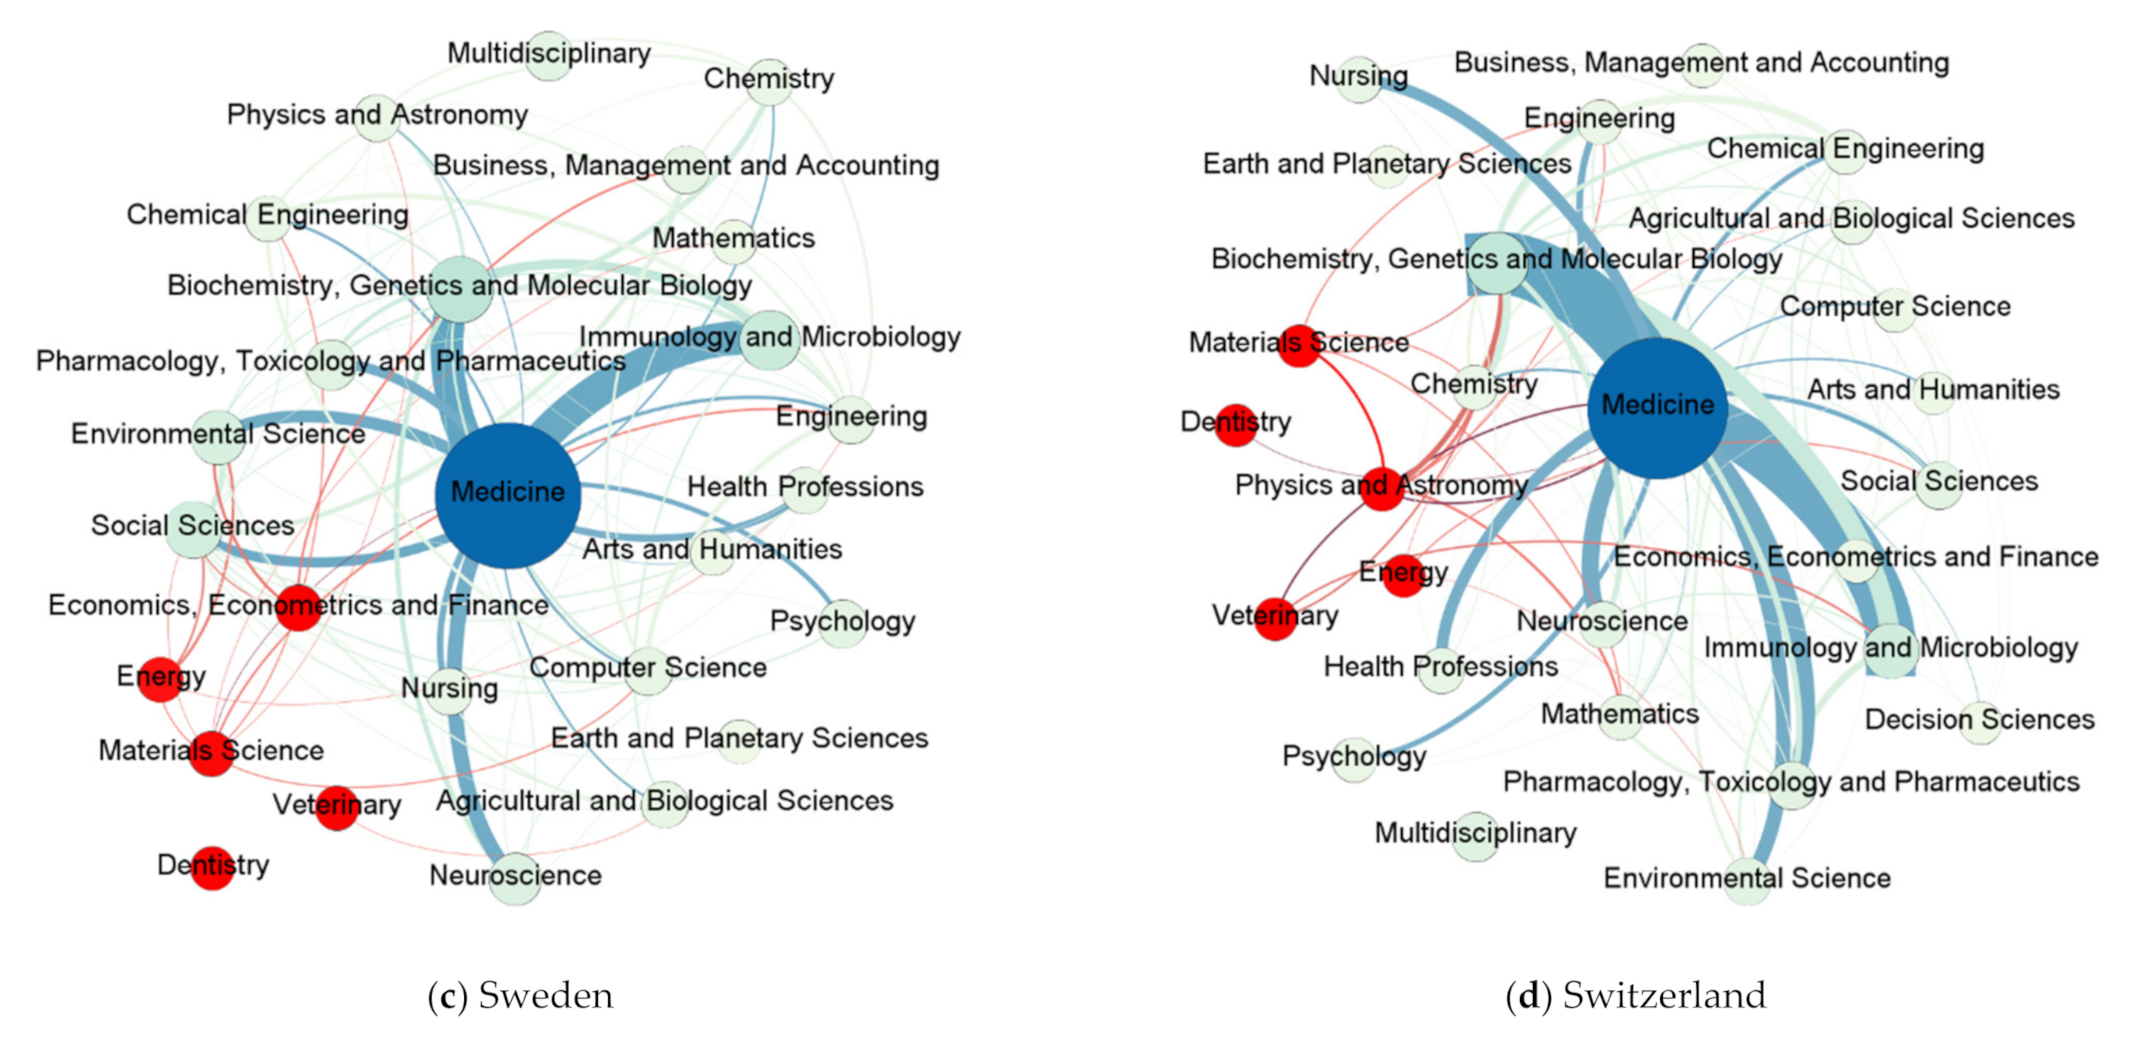
There are differences in the major research areas between single-country-author articles and multinational articles. This study observed the phenomenon of expanding subject areas in multinational documents in some countries. Despite the slight differences among countries, 8.8% of collaborative research articles in Belgium were on research areas that did not appear in single-national articles from the country; the same was observed for 8.3% of collaborative research articles in Pakistan, 4.3% in Sweden, and 2.3% in Switzerland. Figure 8 shows the subject areas of multinational articles by country. The red nodes represent the subject areas newly appearing in collaborative research articles.
In Belgium, 43 out of the 490 multinational articles (8.8%) were on research areas that were not observed in single-country-author articles and that had recently emerged through research collaboration. Furthermore, 24 of them were on environmental science, 7 on mathematics, 5 on earth and planetary sciences, 4 on arts and humanities, 2 on veterinary science, and 1 on dentistry. Most research collaboration occurred in the area of environmental science, including a study on the impact of temperature and humidity on social distancing [66] and a study on resources and wastes [67].
In Pakistan, 31 out of 375 multinational articles (8.3%) were on new research areas, 23 on engineering, 5 on earth and planetary sciences, and 3 on energy. In particular, in the field of engineering, many studies were conducted on computer science and mathematics, including machine learning [68], artificial intelligence [69], and mathematical remodeling [70].
In Sweden, 19 out of 443 multinational articles (43%) were on new research areas, with 13 of them being on economics, management and accounting; 4 on materials science; 1 on earth and planetary sciences; and 1 on veterinary sciences. In the most popular fields of economics, management and accounting, studies have been conducted on the impact of infectious diseases on the tourism industry [71], audits [72], public budgets [73], and public capital markets [74].
In Switzerland, 24 out of 742 multinational documents (3.2%) were on new research areas, with 12 being on physics and astronomy, 4 on materials science, 4 on veterinary, 3 on energy, and 1 on dentistry. In the most popular fields of physics and astronomy, studies have been conducted on biosensors [75], applications of nanotechnology [76], and radiation therapy [77,78].
5. Discussion
The WHO declared a pandemic on 11 March, 2020, a few months after patients with an unidentified disease were reported in Wuhan, China, on 31 December, 2019 [16,17]. COVID-19, which has become the first example of Disease X, has physically, mentally, and economically threatened sustainable human life [9,79]. Secretary-General Kituyi of the United Nations Conference on Trade and Development stressed the importance of international collaboration in responding to COVID-19, stating that “collaboration is the engine of global science” [80].
This study examined the status of international collaboration by conducting a bibliometric analysis and network analysis of research conducted during the first year of the COVID-19 pandemic. This study observed that academic benefits could be derived from international collaboration as well as by identifying research areas that require more attention. Thus, this study analyzed a total of 48,704 English-language articles and reviews (with “Coronavirus,” “COVID,” or “SARS-CoV-2” in their titles) from the Scopus database that were published in 2020 and with confirmable author nationality.
5.1. Contribution by Country and Research Collaboration
A total of 158 countries contributed to research on COVID-19, according to the nationality of the authors of each article. However, the level of national contribution and the current state of research collaboration differed significantly by country. The countries that contributed the most to publishing research related to COVID-19 were the United States and China. Research collaboration occurred most actively between these two countries. This finding is consistent with those of other studies [81,82]. Belli et al. [83] argued that these two countries are equipped with excellent science infrastructure.
The United States, which published the highest number of articles, ranked first across all centrality measures in the network analysis. This is significant because it is a leading country in research and has a significant impact on other countries [23]. China published a total of 6554 articles, which accounted for approximately 47.7% of those published by the United States (13,742); however, it ranked highest for total citation number, average citation number, and national h-index, demonstrating the highest qualitative contribution. However, the results of the network analysis indicate that its centrality measures were lower than those of some European countries, such as the United Kingdom, Italy, and France. Moreover, its betweenness centrality was even lower than that of India. Thus, from the perspective of intercountry connectivity, India is more important than China, as it has maintained collaborative relationships with various countries from various continents, including Libya, Bhutan, Kazakhstan, Jamaica, and Bahrain.
In addition, research on COVID-19 has been concentrated in a few countries, as has research collaboration. Among 158 countries, 92 (58%) published fewer than 100 articles. Excluding countries in which the frequency of research collaboration was lower than 12.7, 66 countries did not collaborate with other countries at all. Notably, whereas European countries in close geographical proximity tended to collaborate actively with one another for research, Asian countries such as China, India, South Korea, and Japan collaborated closely with the United States, but did not collaborate actively amongst themselves. A study by Molton et al. [84] examining the current status of international research collaboration in Asia on tuberculosis revealed that Asian countries collaborated more with North American and European countries, and collaborated among themselves at a very low rate of 8%. This was because of the nature of funding, which requires research to be conducted within national boundaries, as well as the diversity of languages.
5.2. Research Areas by Country and Effects of Research Collaboration
An analysis of research areas using ASJC codes from Scopus revealed that among the four (health sciences, life sciences, social sciences, and physical sciences), health sciences was the most popular research area (56.9%). To categorize it into more specific subject areas, medicine was observed to be the most popular research area (51.7% of the total articles), followed by biochemistry, genetics and molecular biology (7.2%), and social science (6.3%).
However, there are differences between the United States, European countries, and Asian countries in terms of major research areas. The United States and European countries demonstrate a high level of interest in social sciences. In contrast, Asian countries tend to focus on the health and life sciences. Despite the differences in major research areas, international research collaboration frequently occurs in medicine under health sciences, and in biochemistry, genetics and molecular biology, and immunology and microbiology in life sciences. Gazni et al. [25] explained that such theory-based research on social sciences frequently occurs with less collaboration.
The COVID-19 pandemic has introduced unprecedented ethical and moral challenges [85]. For example, there is increasing concern regarding its impact on mental health issues, including depression and anxiety. While the high-risk group for depression comprised 3.8% of the population before the emergence of COVID-19, this number increased to 22.1 and 18.9% for depression and anxiety, respectively, 9 months into the pandemic [86,87]. In addition, measures to limit the spread of the virus have meant that people spend more time indoors using televisions and other electrical devices, thereby aggravating the risk of behavioral addiction. Similarly, social distancing implemented to prevent the spread of COVID-19 has triggered a psychological and emotional sense of loss [88,89,90]. Quarantine due to one’s own infection or contact with someone else who is infected has triggered post-traumatic stress symptoms and avoidance behaviors [91]. In addition, the public’s fear of infectious disease may result in discrimination, stigmatization, and scapegoating [92]. For instance, the United States has experienced an increase in anti-Asian hate crimes, and on 21 April, 2021, the United States Senate passed the Anti-Asian Hate Crimes Bill [93]. Therefore, academia must respond to and implement collective actions against such social problems, and public funding for infectious disease research ought to consider this.
Research collaboration is a means of delivering knowledge and technology that has not been documented [94] and creating a channel of knowledge flow [95]. According to Edler [96], the motivations for international collaboration are knowledge acquisition and resolving problems that cannot be solved using only domestic resources. Moreover, knowledge sharing through research collaboration promotes research activities and development, and contributes significantly to research productivity [97,98]. Thus, research collaboration is a channel for extending knowledge into new areas. Indeed, this study demonstrated that some countries have engaged in research on subject areas in which no domestic research has been conducted. For example, Belgium expanded its research into environmental science, Pakistan into engineering, Sweden into economics, management and accounting, and Switzerland into physics and astronomy. This is not a result of surveys on all 158 countries; therefore, we expect that an analysis of more countries would reveal a higher number of scenarios. Although the objective of collaborative research is not to expand knowledge, but to increase academic value by collaborating with researchers with the necessary knowledge and capacity, the expansion of knowledge through research collaboration is clearly occurring, even if only in selected countries.
A year after the pandemic, COVID-19 continues to threaten the sustainability of our health and lives, and this has caused rapid and dramatic changes. Eventually, this infectious disease will be overcome, but it will not be the last Disease X to occur. Therefore, countries should combine their knowledge and capabilities to encourage such collaboration.
6. Conclusions
This study examined articles published in the first year of the COVID-19 pandemic, and presented the status and effects of international research collaboration.
First, because research on COVID-19 has focused on health sciences and life sciences, more focus should be given to social challenges as the pandemic continues. Public funds should consider this when establishing policies. Second, the level of international research collaboration varies across countries and regions. For example, the United States and European countries actively collaborate, whereas Asian countries do not actively collaborate, despite their geographical proximity. Third, different countries are interested in different research areas. Therefore, expanding research capacities into new research areas through international collaboration is necessary.
When analyzing the data, this study did not address the different types of research collaborations and the weight of each country. For example, this study did not consider the share of contributions of each author in co-authored documents, nor did it consider the differences in the number of authors from each country who participated in a publication. Therefore, if a country had many authors participating in one article and another country had only one author in the same article, they were both counted as having the same weight. Furthermore, if an author describes multiple international affiliations, an over-count may occur in the number of studies by country and the status of research collaboration. Moreover, this study did not consider the differences between the impacts of journals and articles. There is also a data limitation, in that the Scopus database used in this study does not cover all journal data. Better results can be obtained if all of the above factors are considered.
Author Contributions
Conceptualization, K.K.; methodology, K.K.; software, K.K.; validation, K.T.C.; formal analysis, K.K.; writing—original draft preparation, K.K.; writing—review and editing, K.K. and K.T.C.; supervision, K.T.C. Both authors have read and agreed to the published version of the manuscript.
Funding
This research received no external funding.
Conflicts of Interest
The authors have no conflict of interest to declare.
References
- Kitayama, S. Psychological Science in the Era of Infectious Disease. APS Obs. 2020, 33. Available online: https://www.psychologicalscience.org/observer/era-of-infectious-disease (accessed on 5 May 2021).
- Chan-Yeung, M.; Xu, R.H. SARS: Epidemiology. Respirology 2003, 8, S9–S14. [Google Scholar] [CrossRef] [PubMed]
- WHO. Pandemic (H1N1) 2009—Update 112. Available online: https://www.who.int/csr/don/2010_08_06/en/ (accessed on 5 May 2021).
- CDC. Number of Cases and Deaths in Guinea, Liberia, and Sierra Leone during the 2014–2016 West Africa Ebola Outbreak. Available online: https://www.cdc.gov/vhf/ebola/history/2014-2016-outbreak/case-counts.html (accessed on 5 May 2021).
- WHO. MERS Situation Update, January 2020. Available online: http://www.emro.who.int/pandemic-epidemic-diseases/mers-cov/mers-situation-update-january-2020.html (accessed on 5 May 2021).
- Wikipedia. 2015–2016 Zika Virus Epidemic. Available online: https://en.wikipedia.org/wiki/2015%E2%80%932016_Zika_virus_epidemic (accessed on 5 May 2021).
- WHO. Pandemic Influenza Preparedness and Response: A WHO Guidance Document. Available online: https://0-www-ncbi-nlm-nih-gov.brum.beds.ac.uk/books/NBK143061/ (accessed on 5 May 2021).
- WHO. An R&D Blueprint for Action to Prevent Epidemics. Available online: https://www.who.int/publications/m/item/an-r-d-blueprint-for-action-to-prevent-epidemics (accessed on 5 May 2021).
- WHO. 2018 Annual Review of Diseases Prioritized Under the Research and Development Blueprint. Available online: https://www.who.int/news-room/events/detail/2018/02/06/default-calendar/2018-annual-review-of-diseases-prioritized-under-the-research-anddevelopment-blueprint (accessed on 5 May 2021).
- Wu, Y.; Ho, W.; Huang, Y.; Jin, D.-Y.; Li, S.; Liu, S.-L.; Liu, X.; Qiu, J.; Sang, Y.; Wang, Q. SARS-CoV-2 is an appropriate name for the new coronavirus. Lancet 2020, 395, 949–950. [Google Scholar] [CrossRef]
- Zhang, H.; Shaw, R. Identifying research trends and gaps in the context of covid-19. Int. J. Environ. Res. Public Health 2020, 17, 3370. [Google Scholar] [CrossRef] [PubMed]
- Zhai, F.; Zhai, Y.; Cong, C.; Song, T.; Xiang, R.; Feng, T.; Liang, Z.; Zeng, Y.; Yang, J.; Yang, J. Research progress of coronavirus based on bibliometric analysis. Int. J. Environ. Res. Public Health 2020, 17, 3766. [Google Scholar] [CrossRef] [PubMed]
- Pergolizzi, J.V., Jr.; Magnusson, P.; LeQuang, J.A.; Breve, F.; Paladini, A.; Rekatsina, M.; Yeam, C.T.; Imani, F.; Saltelli, G.; Taylor, R., Jr. The current clinically relevant findings on COVID-19 pandemic. Anesthesiol. Pain Med. 2020, 10, e103819. [Google Scholar] [CrossRef] [PubMed] [Green Version]
- Jiang, S.; Shi, Z.-L. The first disease X is caused by a highly transmissible acute respiratory syndrome coronavirus. Virol. Sin. 2020, 35, 263–265. [Google Scholar] [CrossRef] [PubMed] [Green Version]
- Hanney, S.R.; Wooding, S.; Sussex, J.; Grant, J. From COVID-19 research to vaccine application: Why might it take 17 months not 17 years and what are the wider lessons? Health Res. Policy Syst. 2020, 18, 61. [Google Scholar] [CrossRef]
- Hua, J.; Shaw, R. Corona virus (Covid-19) “infodemic” and emerging issues through a data lens: The case of china. Int. J. Environ. Res. Public Health 2020, 17, 2309. [Google Scholar] [CrossRef] [Green Version]
- WHO. Archived: WHO Timeline—COVID-19. Available online: https://www.who.int/news/item/27-04-2020-who-timeline---covid-19 (accessed on 5 May 2021).
- Brem, A.; Viardot, E.; Nylund, P.A. Implications of the coronavirus (COVID-19) outbreak for innovation: Which technologies will improve our lives? Technol. Forecast. Soc. Chang. 2021, 163, 120451. [Google Scholar] [CrossRef]
- WHO. WHO Coronavirus (COVID-19) Dashboard. Available online: https://covid19.who.int/ (accessed on 5 May 2021).
- Lee, D.; Heo, Y.; Kim, K. A strategy for international cooperation in the COVID-19 pandemic era: Focusing on national scientific funding data. Healthcare 2020, 8, 204. [Google Scholar] [CrossRef]
- WHO. A Coordinated Global Research Roadmap: 2019 Novel Coronavirus. Available online: https://www.who.int/publications/m/item/a-coordinated-global-research-roadmap (accessed on 5 May 2021).
- ICC. COVID-19: Lessons for International Research Collaboration and Information Exchange. Available online: https://iccwbo.org/publication/covid-19-lessons-for-international-research-collaboration-and-information-exchange/ (accessed on 5 May 2021).
- Lee, J.J.; Haupt, J.P. Scientific globalism during a global crisis: Research collaboration and open access publications on COVID-19. High. Educ. 2021, 81, 949–966. [Google Scholar] [CrossRef]
- Wilsdon, J. Knowledge, Networks and Nations: Global Scientific Collaboration in the 21st Century; The Royal Society: London, UK, 2011. [Google Scholar]
- Gazni, A.; Sugimoto, C.R.; Didegah, F. Mapping world scientific collaboration: Authors, institutions, and countries. J. Am. Soc. Inf. Sci. Technol. 2012, 63, 323–335. [Google Scholar] [CrossRef]
- Wagner, C.S.; Park, H.W.; Leydesdorff, L. The continuing growth of global cooperation networks in research: A conundrum for national governments. PLoS ONE 2015, 10, e0131816. [Google Scholar] [CrossRef] [Green Version]
- NSF. Publications Output: U.S. Trends and International Comparisons. Available online: https://ncses.nsf.gov/pubs/nsb20206/executive-summary (accessed on 5 May 2021).
- Persson, O.; Melin, G.; Danell, R.; Kaloudis, A. Research collaboration at Nordic universities. Scientometrics 1997, 39, 209–223. [Google Scholar] [CrossRef]
- Zhang, L.; Zhao, W.; Sun, B.; Huang, Y.; Glänzel, W. How scientific research reacts to international public health emergencies: A global analysis of response patterns. Scientometrics 2020, 124, 747–773. [Google Scholar] [CrossRef]
- Bonilla-Aldana, D.K.; Quintero-Rada, K.; Montoya-Posada, J.P.; Ramírez-Ocampo, S.; Paniz-Mondolfi, A.; Rabaan, A.A.; Sah, R.; Rodríguez-Morales, A.J. SARS-CoV, MERS-CoV and now the 2019-novel CoV: Have we investigated enough about coronaviruses?–A bibliometric analysis. Travel Med. Infect. Dis. 2020, 33, 101566. [Google Scholar] [CrossRef]
- Malik, A.A.; Butt, N.S.; Bashir, M.A.; Gilani, S.A. A scientometric analysis on coronaviruses research (1900–2020): Time for a continuous, cooperative and global approach. J. Infect. Public Health 2021, 14, 311–319. [Google Scholar] [CrossRef]
- Sa’ed, H.Z. Global research trends of Middle East respiratory syndrome coronavirus: A bibliometric analysis. BMC Infect. Dis. 2016, 16, 255. [Google Scholar]
- Fitchett, J.R.; Head, M.G.; Cooke, M.K.; Wurie, F.B.; Atun, R. Funding infectious disease research: A systematic analysis of UK research investments by funders 1997–2010. PLoS ONE 2014, 9, e105722. [Google Scholar] [CrossRef] [Green Version]
- Aristovnik, A.; Ravšelj, D.; Umek, L. A bibliometric analysis of COVID-19 across science and social science research landscape. Sustainability 2020, 12, 9132. [Google Scholar] [CrossRef]
- Sa’ed, H.Z.; Al-Jabi, S.W. Mapping the situation of research on coronavirus disease-19 (COVID-19): A preliminary bibliometric analysis during the early stage of the outbreak. BMC Infect. Dis. 2020, 20, 561. [Google Scholar]
- Martinez-Perez, C.; Alvarez-Peregrina, C.; Villa-Collar, C.; Sánchez-Tena, M.Á. Citation network analysis of the novel coronavirus disease 2019 (COVID-19). Int. J. Environ. Res. Public Health 2020, 17, 7690. [Google Scholar] [CrossRef]
- Hossain, M.M. Current Status of Global Research on Novel Coronavirus Disease (COVID-19): A Bibliometric Analysis and Knowledge Mapping. Version 1. 2020. Available online: https://papers.ssrn.com/sol3/Papers.cfm?abstract_id=3547824 (accessed on 5 May 2021).
- Dehghanbanadaki, H.; Seif, F.; Vahidi, Y.; Razi, F.; Hashemi, E.; Khoshmirsafa, M.; Aazami, H. Bibliometric analysis of global scientific research on Coronavirus (COVID-19). Med. J. Islamic Repub. Iran 2020, 34, 51. [Google Scholar]
- Yang, F.; Zhang, S.; Wang, Q.; Zhang, Q.; Han, J.; Wang, L.; Wu, X.; Xue, F. Analysis of the global situation of COVID-19 research based on bibliometrics. Health Inf. Sci. Syst. 2020, 8, 30. [Google Scholar] [CrossRef]
- Fan, J.; Gao, Y.; Zhao, N.; Dai, R.; Zhang, H.; Feng, X.; Shi, G.; Tian, J.; Chen, C.; Hambly, B.D. Bibliometric analysis on COVID-19: A comparison of research between English and Chinese studies. Front. Public Health 2020, 8, 477. [Google Scholar] [CrossRef]
- Yang, K.-L.; Jin, X.-Y.; Gao, Y.; Xie, J.; Liu, M.; Zhang, J.-H.; Tian, J.-H. Bibliometric analysis of researches on traditional Chinese medicine for coronavirus disease 2019 (COVID-19). Integr. Med. Res. 2020, 9, 100490. [Google Scholar] [CrossRef]
- Ng, J.Y. Global research trends at the intersection of coronavirus disease 2019 (COVID-19) and traditional, integrative, and complementary and alternative medicine: A bibliometric analysis. BMC Complement. Med. Ther. 2020, 20, 353. [Google Scholar] [CrossRef]
- Velez-Estevez, A.; García-Sánchez, P.; Moral-Munoz, J.; Cobo, M. Thematical and Impact Differences Between National and International Collaboration on Artificial Intelligence Research. In Proceedings of the 2020 IEEE Conference on Evolving and Adaptive Intelligent Systems (EAIS), Bari, Italy, 27–29 May 2020; pp. 1–8. [Google Scholar]
- Sweileh, W.M. Global research trends of World Health Organization’s top eight emerging pathogens. Glob. Health 2017, 13, 9. [Google Scholar] [CrossRef] [Green Version]
- Wagner, C.S.; Whetsell, T.; Baas, J.; Jonkers, K. Openness and impact of leading scientific countries. Front. Res. Metr. Anal. 2018, 3, 10. [Google Scholar] [CrossRef]
- Chinchilla-Rodríguez, Z.; Sugimoto, C.R.; Larivière, V. Follow the leader: On the relationship between leadership and scholarly impact in international collaborations. PLoS ONE 2019, 14, e0218309. [Google Scholar] [CrossRef] [PubMed] [Green Version]
- Falagas, M.E.; Pitsouni, E.I.; Malietzis, G.A.; Pappas, G. Comparison of PubMed, Scopus, web of science, and Google scholar: Strengths and weaknesses. FASEB J. 2008, 22, 338–342. [Google Scholar] [CrossRef]
- Reidpath, D.D.; Allotey, P.; Pokhrel, S. Social sciences research in neglected tropical diseases 2: A bibliographic analysis. Health Res. Policy Syst. 2011, 9, 1–12. [Google Scholar] [CrossRef] [PubMed] [Green Version]
- Mongeon, P.; Paul-Hus, A. The journal coverage of Web of Science and Scopus: A comparative analysis. Scientometrics 2016, 106, 213–228. [Google Scholar] [CrossRef]
- SCOPUS. Scopus Content Coverage Guide. Available online: https://0-www-elsevier-com.brum.beds.ac.uk/?a=69451 (accessed on 5 May 2021).
- Ekundayo, T.C.; Okoh, A.I. A global bibliometric analysis of Plesiomonas-related research (1990–2017). PLoS ONE 2018, 13, e0207655. [Google Scholar] [CrossRef] [PubMed] [Green Version]
- Aleixandre, J.L.; Aleixandre-Tudó, J.L.; Bolaños-Pizarro, M.; Aleixandre-Benavent, R. Mapping the scientific research in organic farming: A bibliometric review. Scientometrics 2015, 105, 295–309. [Google Scholar] [CrossRef]
- Hottenrott, H.; Lawson, C. A first look at multiple institutional affiliations: A study of authors in Germany, Japan and the UK. Scientometrics 2017, 111, 285. [Google Scholar] [CrossRef] [PubMed] [Green Version]
- SCOPUS. What Is the Complete List of Scopus Subject Areas and All Science Journal Classification Codes (ASJC)? Available online: https://0-service-elsevier-com.brum.beds.ac.uk/app/answers/detail/a_id/15181/supporthub/scopus/ (accessed on 5 May 2021).
- Hirsch, J.E. An index to quantify an individual’s scientific research output. Proc. Natl. Acad. Sci. USA 2005, 102, 16569–16572. [Google Scholar] [CrossRef] [Green Version]
- Hou, Q.; Mao, G.; Zhao, L.; Du, H.; Zuo, J. Mapping the scientific research on life cycle assessment: A bibliometric analysis. Int. J. Life Cycle Assess. 2015, 20, 541–555. [Google Scholar] [CrossRef]
- Park, E.; Koh, M.; Cho, K. Dynamic Analysis of Automotive Firm’s Convergence Patents using Social Network Analysis. J. Technol. Innov. 2018, 26, 1–36. [Google Scholar] [CrossRef]
- Singh, J. Collaborative networks as determinants of knowledge diffusion patterns. Manag. Sci. 2005, 51, 756–770. [Google Scholar] [CrossRef] [Green Version]
- Freeman, L.C. Centrality in social networks conceptual clarification. Soc. Netw. 1978, 1, 215–239. [Google Scholar] [CrossRef] [Green Version]
- Choi, Y.G.; Cho, K.T. Analysis of Safety Management Characteristics Using Network Analysis of CEO Messages in the Construction Industry. Sustainability 2020, 12, 5771. [Google Scholar] [CrossRef]
- Huang, C.; Wang, Y.; Li, X.; Ren, L.; Zhao, J.; Hu, Y.; Zhang, L.; Fan, G.; Xu, J.; Gu, X. Clinical features of patients infected with 2019 novel coronavirus in Wuhan, China. Lancet 2020, 395, 497–506. [Google Scholar] [CrossRef] [Green Version]
- Wadman, M. Hidden Immune Weakness Found in 14% of Gravely Ill COVID-19 Patients. Available online: https://www.sciencemag.org/news/2020/09/hidden-immune-weakness-found-14-gravely-ill-covid-19-patients (accessed on 5 May 2021).
- Bastard, P.; Rosen, L.B.; Zhang, Q.; Michailidis, E.; Hoffmann, H.-H.; Zhang, Y.; Dorgham, K.; Philippot, Q.; Rosain, J.; Béziat, V. Autoantibodies against type I IFNs in patients with life-threatening COVID-19. Science 2020, 370, eabd4585. [Google Scholar] [CrossRef]
- Zhang, Q.; Bastard, P.; Liu, Z.; Le Pen, J.; Moncada-Velez, M.; Chen, J.; Ogishi, M.; Sabli, I.K.; Hodeib, S.; Korol, C. Inborn errors of type I IFN immunity in patients with life-threatening COVID-19. Science 2020, 370, eabd4570. [Google Scholar] [CrossRef]
- Valente, T.W.; Coronges, K.; Lakon, C.; Costenbader, E. How correlated are network centrality measures? Connect. (Tor. Ont.) 2008, 28, 16. [Google Scholar]
- Feng, Y.; Marchal, T.; Sperry, T.; Yi, H. Influence of wind and relative humidity on the social distancing effectiveness to prevent COVID-19 airborne transmission: A numerical study. J. Aerosol Sci. 2020, 147, 105585. [Google Scholar] [CrossRef]
- Neumeyer, X.; Ashton, W.S.; Dentchev, N. Addressing resource and waste management challenges imposed by COVID-19: An entrepreneurship perspective. Resour. Conserv. Recycl. 2020, 162, 105058. [Google Scholar] [CrossRef]
- Rustam, F.; Reshi, A.A.; Mehmood, A.; Ullah, S.; On, B.-W.; Aslam, W.; Choi, G.S. COVID-19 future forecasting using supervised machine learning models. IEEE Access 2020, 8, 101489–101499. [Google Scholar] [CrossRef]
- Jamshidi, M.; Lalbakhsh, A.; Talla, J.; Peroutka, Z.; Hadjilooei, F.; Lalbakhsh, P.; Jamshidi, M.; La Spada, L.; Mirmozafari, M.; Dehghani, M. Artificial intelligence and COVID-19: Deep learning approaches for diagnosis and treatment. IEEE Access 2020, 8, 109581–109595. [Google Scholar] [CrossRef] [PubMed]
- Naveed, M.; Baleanu, D.; Rafiq, M.; Raza, A.; Soori, A.H.; Ahmed, N. Dynamical behavior and sensitivity analysis of a delayed coronavirus epidemic model. Comput. Mater. Contin. 2020, 65. Available online: http://earsiv.cankaya.edu.tr:8080/handle/20.500.12416/4556 (accessed on 5 May 2021).
- Gössling, S.; Scott, D.; Hall, C.M. Pandemics, tourism and global change: A rapid assessment of COVID-19. J. Sustain. Tour. 2020, 29, 1–20. [Google Scholar] [CrossRef]
- Albitar, K.; Gerged, A.M.; Kikhia, H.; Hussainey, K. Auditing in times of social distancing: The effect of COVID-19 on auditing quality. Int. J. Account. Inf. Manag. 2020. [Google Scholar] [CrossRef]
- Argento, D.; Kaarbøe, K.; Vakkuri, J. Constructing certainty through public budgeting: Budgetary responses to the COVID-19 pandemic in Finland, Norway and Sweden. J. Public Budg. Account. Financ. Manag. 2020. [Google Scholar] [CrossRef]
- Halling, M.; Yu, J.; Zechner, J. How Did COVID-19 Affect Firms’ Access to Public Capital Markets? Rev. Corp. Financ. Stud. 2020, 9, 501–533. [Google Scholar] [CrossRef]
- Qiu, G.; Gai, Z.; Tao, Y.; Schmitt, J.; Kullak-Ublick, G.A.; Wang, J. Dual-functional plasmonic photothermal biosensors for highly accurate severe acute respiratory syndrome coronavirus 2 detection. ACS Nano 2020, 14, 5268–5277. [Google Scholar] [CrossRef] [Green Version]
- Weiss, C.; Carriere, M.; Fusco, L.; Capua, I.; Regla-Nava, J.A.; Pasquali, M.; Scott, J.A.; Vitale, F.; Unal, M.A.; Mattevi, C. Toward nanotechnology-enabled approaches against the COVID-19 pandemic. ACS Nano 2020, 14, 6383–6406. [Google Scholar] [CrossRef]
- Thomson, D.J.; Palma, D.; Guckenberger, M.; Balermpas, P.; Beitler, J.J.; Blanchard, P.; Brizel, D.; Budach, W.; Caudell, J.; Corry, J. Practice recommendations for risk-adapted head and neck cancer radiation therapy during the COVID-19 pandemic: An ASTRO-ESTRO consensus statement. Int. J. Radiat. Oncol. Biol. Phys. 2020, 107, 618–627. [Google Scholar] [CrossRef]
- Guckenberger, M.; Belka, C.; Bezjak, A.; Bradley, J.; Daly, M.E.; DeRuysscher, D.; Dziadziuszko, R.; Faivre-Finn, C.; Flentje, M.; Gore, E. Practice recommendations for lung cancer radiotherapy during the COVID-19 pandemic: An ESTRO-ASTRO consensus statement. Radiother. Oncol. 2020, 146, 223–229. [Google Scholar] [CrossRef]
- Carvalho Aguiar Melo, M.; de Sousa Soares, D. Impact of social distancing on mental health during the COVID-19 pandemic: An urgent discussion. Int. J. Soc. Psychiatry 2020, 66, 625–626. [Google Scholar] [CrossRef]
- Kituyi, M. COVID-19: Collaboration Is the Engine of Global Science–Especially for Developing Countries; World Economic Forum: Cologny, Switzerland, 2020. [Google Scholar]
- Wagner, C.S.; Bornmann, L.; Leydesdorff, L. Recent Developments in China–U.S. Cooperation in Science. Minerva 2015, 53, 199–214. [Google Scholar] [CrossRef] [Green Version]
- Yuan, L.; Hao, Y.; Li, M.; Bao, C.; Li, J.; Wu, D. Who are the international research collaboration partners for China? A novel data perspective based on NSFC grants. Scientometrics 2018, 116, 401–422. [Google Scholar] [CrossRef]
- Belli, S.; Mugnaini, R.; Baltà, J.; Abadal, E. Coronavirus mapping in scientific publications: When science advances rapidly and collectively, is access to this knowledge open to society? Scientometrics 2020, 124, 2661–2685. [Google Scholar] [CrossRef]
- Molton, J.S.; Singh, S.; Chen, L.J.; Paton, N.I. International tuberculosis research collaborations within Asia. BMC Res. Notes 2017, 10, 462. [Google Scholar] [CrossRef]
- Tisdell, C.A. Economic, social and political issues raised by the COVID-19 pandemic. Econ. Anal. Policy 2020, 68, 17–28. [Google Scholar] [CrossRef]
- Sim, M. Psychological Effects of the Coronavirus Disease 2019 Pandemic. Korean J. Med. 2020, 95, 360–363. [Google Scholar] [CrossRef]
- Gao, J.; Zheng, P.; Jia, Y.; Chen, H.; Mao, Y.; Chen, S.; Wang, Y.; Fu, H.; Dai, J. Mental health problems and social media exposure during COVID-19 outbreak. PLoS ONE 2020, 15, e0231924. [Google Scholar]
- Kar, S.K.; Arafat, S.Y.; Sharma, P.; Dixit, A.; Marthoenis, M.; Kabir, R. COVID-19 pandemic and addiction: Current problems and future concerns. Asian J. Psychiatry 2020, 51, 102064. [Google Scholar] [CrossRef]
- Williams, S.N.; Armitage, C.J.; Tampe, T.; Dienes, K. Public perceptions and experiences of social distancing and social isolation during the COVID-19 pandemic: A UK-based focus group study. BMJ Open 2020, 10, e039334. [Google Scholar] [CrossRef]
- Lewnard, J.A.; Lo, N.C. Scientific and ethical basis for social-distancing interventions against COVID-19. Lancet Infect. Dis. 2020, 20, 631–633. [Google Scholar] [CrossRef] [Green Version]
- Brooks, S.K.; Webster, R.K.; Smith, L.E.; Woodland, L.; Wessely, S.; Greenberg, N.; Rubin, G.J. The psychological impact of quarantine and how to reduce it: Rapid review of the evidence. Lancet 2020, 395, 912–920. [Google Scholar] [CrossRef] [Green Version]
- Torales, J.; O’Higgins, M.; Castaldelli-Maia, J.M.; Ventriglio, A. The outbreak of COVID-19 coronavirus and its impact on global mental health. Int. J. Soc. Psychiatry 2020, 66, 317–320. [Google Scholar] [CrossRef] [PubMed] [Green Version]
- Kane, P. Bill to Combat Hate Crimes Against Asian Americans Passes Senate with Bipartisan Support. Available online: https://www.washingtonpost.com/politics/asian-american-hate-crime-senate/2021/04/22/4c7755f0-a36a-11eb-85fc-06664ff4489d_story.html (accessed on 5 May 2021).
- Katz, J.S.; Martin, B.R. What is research collaboration? Res. Policy 1997, 26, 1–18. [Google Scholar] [CrossRef]
- Adams, J.D.; Black, G.C.; Clemmons, J.R.; Stephan, P.E. Scientific teams and institutional collaborations: Evidence from US universities, 1981–1999. Res. Policy 2005, 34, 259–285. [Google Scholar] [CrossRef]
- Edler, J. The Role of International Collaboration in the Framework Programme. Expert Analysis in Support of the Ex Post Evaluation of FP6; Manchester Institute of Innovation Research: Manchester, UK, 2008. [Google Scholar]
- Bindu, N.; Sankar, C.P.; Kumar, K.S. Research collaboration and knowledge sharing in e-governance. Transform. Gov. People Process Policy 2019. [Google Scholar] [CrossRef]
- Huang, J.S. Building Research Collaboration Networks—An Interpersonal Perspective for Research Capacity Building. J. Res. Adm. 2014, 45, 89–112. [Google Scholar]
Figure 1.
Flowchart of data collection, processing, and analysis.

Figure 2.
Number of documents by the number of countries collaborating in research.

Figure 3.
Share of multinational documents by country.

Figure 4.
Collaborative research network among 158 countries.

Figure 5.
Collaborative research network for which more than 13 collaborations occurred between countries.
Figure 5.
Collaborative research network for which more than 13 collaborations occurred between countries.

Figure 6.
Global research collaboration network (node color represents the number of articles; the node size represents the degree centrality; and the color and thickness of a link represents the frequency of collaborative research).
Figure 6.
Global research collaboration network (node color represents the number of articles; the node size represents the degree centrality; and the color and thickness of a link represents the frequency of collaborative research).

Figure 7.
Comparison of major research areas by country.


Figure 8.
Subject area categorization of international research collaboration articles (nodes in red represent technology categories that have emerged through research collaboration).
Figure 8.
Subject area categorization of international research collaboration articles (nodes in red represent technology categories that have emerged through research collaboration).


Table 1.
Number of publications by document type.
| Document Type | Number of Documents | Percentage |
|---|---|---|
| Article | 40,782 | 54.117% |
| Letter | 12,820 | 17.012% |
| Review | 8560 | 11.359% |
| Note | 5602 | 7.434% |
| Editorial | 4661 | 6.185% |
| Conference Paper | 1530 | 2.030% |
| Short Survey | 691 | 0.917% |
| Erratum | 554 | 0.735% |
| Data Paper | 88 | 0.117% |
| Book Chapter | 56 | 0.074% |
| Book | 9 | 0.012% |
| Retracted | 5 | 0.007% |
| Conference Review | 1 | 0.001% |
| Total | 75,359 | 100% |
Table 2.
Categories by ASJC code.
| Supergroup | Subject Area | Code |
|---|---|---|
| - | Multidisciplinary | 1000 |
| Life Sciences | Agricultural and Biological Sciences | 11 ** |
| Social Sciences | Arts and Humanities | 12 ** |
| Life Sciences | Biochemistry, Genetics, and Molecular Biology | 13 ** |
| Social Sciences | Business, Management, and Accounting | 14 ** |
| Physical Sciences | Chemical Engineering | 15 ** |
| Physical Sciences | Chemistry | 16 ** |
| Physical Sciences | Computer Science | 17 ** |
| Social Sciences | Decision Sciences | 18 ** |
| Physical Sciences | Earth and Planetary Sciences | 19 ** |
| Social Sciences | Economics, Econometrics and Finance | 20 ** |
| Physical Sciences | Energy | 21 ** |
| Physical Sciences | Engineering | 22 ** |
| Physical Sciences | Environmental Science | 23 ** |
| Life Sciences | Immunology and Microbiology | 24 ** |
| Physical Sciences | Materials Science | 25 ** |
| Physical Sciences | Mathematics | 26 ** |
| Health Sciences | Medicine | 27 ** |
| Life Sciences | Neuroscience | 28 ** |
| Health Sciences | Nursing | 29 ** |
| Life Sciences | Pharmacology, Toxicology, and Pharmaceutics | 30 ** |
| Physical Sciences | Physics and Astronomy | 31 ** |
| Social Sciences | Psychology | 32 ** |
| Social Sciences | Social Sciences | 33 ** |
| Health Sciences | Veterinary | 34 ** |
| Health Sciences | Dentistry | 35 ** |
| Health Sciences | Health Professions | 36 ** |
** two digits for field.
Table 3.
COVID-19 scenario and research index per country.
| Country | Articles | COVID-19 Scenario (31 December 2020) | Citation | h-Index | ||
|---|---|---|---|---|---|---|
| Cases (Cumulative) | Deaths (Cumulative) | Total | Average | |||
| United States | 13,742 | 19,346,790 | 335,789 | 223,364 | 16.3 | 196 |
| China | 6554 | 96,673 | 4788 | 288,108 | 44 | 233 |
| United Kingdom | 5407 | 2,432,892 | 72,548 | 89,248 | 16.5 | 128 |
| Italy | 4657 | 2,083,689 | 73,604 | 72,136 | 15.5 | 112 |
| India | 4256 | 10,266,674 | 148,738 | 28,168 | 6.6 | 65 |
| Spain | 2205 | 2,020,702 | 52,448 | 29,158 | 13.2 | 69 |
| Canada | 2120 | 565,506 | 15,378 | 35,942 | 17 | 83 |
| France | 1867 | 2,556,708 | 64,004 | 39,611 | 21.2 | 84 |
| Australia | 1863 | 28,381 | 909 | 32,890 | 17.7 | 74 |
| Germany | 1836 | 1,719,737 | 33,071 | 47,109 | 25.7 | 87 |
| Brazil | 1740 | 7,563,551 | 192,681 | 12,868 | 7.4 | 48 |
| Iran | 1398 | 1,218,753 | 55,095 | 11,879 | 8.5 | 50 |
| Turkey | 1143 | 2,194,272 | 20,642 | 8181 | 7.2 | 42 |
| Saudi Arabia | 1025 | 362,601 | 6214 | 9513 | 9.3 | 43 |
| Switzerland | 965 | 451,148 | 7298 | 20,108 | 20.8 | 63 |
| Netherlands | 926 | 786,084 | 11,293 | 27,407 | 29.6 | 71 |
| Japan | 858 | 230,304 | 3414 | 15,146 | 17.7 | 50 |
| South Korea | 822 | 60,726 | 900 | 14,121 | 17.2 | 58 |
| Singapore | 707 | 58,569 | 29 | 18,988 | 26.9 | 58 |
| Pakistan | 666 | 477,240 | 10,047 | 5115 | 7.7 | 32 |
| South Africa | 661 | 1,039,161 | 28,033 | 4194 | 6.3 | 29 |
| Belgium | 642 | 647,590 | 19,505 | 12,598 | 19.6 | 50 |
| Indonesia | 576 | 735,124 | 21,944 | 3312 | 5.8 | 24 |
| Sweden | 567 | 437,303 | 9657 | 11,111 | 19.6 | 45 |
| Mexico | 560 | 1,401,529 | 123,845 | 7334 | 13.1 | 33 |
Table 4.
Changes in the characteristics of the network according to the frequency of international research collaboration.
Table 4.
Changes in the characteristics of the network according to the frequency of international research collaboration.
| Research Collaboration | Link | Average Degree | Density | Average Path Length |
|---|---|---|---|---|
| More than 1 | 4987 (100%) | 63.127 | 0.402 | 1.601 |
| More than 2 | 3443 (69%) | 43.582 | 0.278 | 1.754 |
| More than 3 | 2665 (53.4%) | 33.734 | 0.215 | 1.779 |
| More than 4 | 2202 (44.2%) | 27.873 | 0.178 | 1.812 |
| More than 5 | 1897 (38%) | 24.013 | 0.153 | 1.825 |
| More than 6 | 1675 (33.6%) | 21.203 | 0.135 | 1.847 |
| More than 7 | 1507 (30.2%) | 19.076 | 0.122 | 1.845 |
| More than 8 | 1368 (27.4%) | 17.316 | 0.110 | 1.850 |
| More than 9 | 1247 (25%) | 15.785 | 0.101 | 1.885 |
| More than 10 | 1152 (23.1%) | 14.582 | 0.093 | 1.876 |
| More than 11 | 1057 (21.2%) | 13.380 | 0.085 | 1.861 |
| More than 12 | 990 (19.9%) | 12.532 | 0.080 | 1.868 |
| More than 13 | 928 (18.6%) | 11.747 | 0.075 | 1.885 |
Table 5.
Degree centrality by country.
| Country | Documents | Degree Centrality | Closeness Centrality | Betweenness Centrality |
|---|---|---|---|---|
| United States | 13,742 | 147 | 0.945 | 816.206 |
| China | 6554 | 128 | 0.848 | 255.583 |
| United Kingdom | 5407 | 140 | 0.907 | 358.620 |
| Italy | 4657 | 130 | 0.857 | 200.595 |
| India | 4256 | 130 | 0.857 | 443.787 |
| Spain | 2205 | 117 | 0.800 | 162.052 |
| Canada | 2120 | 128 | 0.848 | 234.070 |
| France | 1867 | 129 | 0.852 | 256.888 |
| Australia | 1863 | 124 | 0.830 | 249.589 |
| Germany | 1836 | 123 | 0.825 | 161.246 |
| Brazil | 1740 | 115 | 0.792 | 118.473 |
| Iran | 1398 | 105 | 0.754 | 60.076 |
| Turkey | 1143 | 108 | 0.765 | 101.944 |
| Saudi Arabia | 1025 | 111 | 0.776 | 93.226 |
| Switzerland | 965 | 116 | 0.796 | 129.810 |
| Netherlands | 926 | 114 | 0.788 | 179.980 |
| Japan | 858 | 115 | 0.792 | 88.840 |
| South Korea | 822 | 94 | 0.716 | 42.195 |
| Singapore | 707 | 93 | 0.712 | 39.636 |
| Pakistan | 666 | 106 | 0.757 | 90.552 |
| South Africa | 661 | 121 | 0.817 | 231.450 |
| Belgium | 642 | 113 | 0.784 | 118.094 |
| Indonesia | 576 | 94 | 0.716 | 66.976 |
| Sweden | 567 | 107 | 0.761 | 84.863 |
| Mexico | 560 | 111 | 0.776 | 104.560 |
Table 6.
Ratios of documents by supergroup and subject area.
| Supergroup | Subject Area |
|---|---|
| Health Sciences (56.9%) | Medicine (51.7%), Nursing (2.8%), Health Professions (1.4%), Dentistry (0.6%), Veterinary (0.4%) |
| Life Sciences (18.8%) | Biochemistry, Genetics, and Molecular Biology (7.2%), Immunology and Microbiology (5.2%), Pharmacology, Toxicology and Pharmaceutics (3.1%), Neuroscience (1.7%), Agricultural and Biological Sciences (1.6%) |
| Social Sciences (12.3%) | Social Sciences (6.3%), Psychology (2.1%), Business, Management, and Accounting (1.4%), Economics, Econometrics and Finance (1.2%), Arts and Humanities (1.1%), Decision Sciences (0.2%) |
| Physical Sciences (9.8%) | Environmental Science (2.5%), Engineering (1.4%), Computer Science (1.3%), Chemistry (1%), Mathematics (1%), Physics and Astronomy (0.8%), Chemical Engineering (0.6%), Materials Science (0.5%), Energy (0.4%), Earth and Planetary Sciences (0.3%) |
| Multidisciplinary (2.2%) | Multidisciplinary (2.2%) |
Publisher’s Note: MDPI stays neutral with regard to jurisdictional claims in published maps and institutional affiliations. |
© 2021 by the authors. Licensee MDPI, Basel, Switzerland. This article is an open access article distributed under the terms and conditions of the Creative Commons Attribution (CC BY) license (https://creativecommons.org/licenses/by/4.0/).
Share and Cite
MDPI and ACS Style
Kim, K.; Cho, K.T. A Review of Global Collaboration on COVID-19 Research during the Pandemic in 2020. Sustainability 2021, 13, 7618. https://0-doi-org.brum.beds.ac.uk/10.3390/su13147618
AMA Style
Kim K, Cho KT. A Review of Global Collaboration on COVID-19 Research during the Pandemic in 2020. Sustainability. 2021; 13(14):7618. https://0-doi-org.brum.beds.ac.uk/10.3390/su13147618
Chicago/Turabian StyleKim, Kyungkook, and Keun Tae Cho. 2021. "A Review of Global Collaboration on COVID-19 Research during the Pandemic in 2020" Sustainability 13, no. 14: 7618. https://0-doi-org.brum.beds.ac.uk/10.3390/su13147618
Note that from the first issue of 2016, this journal uses article numbers instead of page numbers. See further details here.