
Quantitative Assessment of Environmental Sensitivity to Desertification Using the Modified MEDALUS Model in a Semiarid Area


Abstract
:1. Introduction
2. Materials and Methods
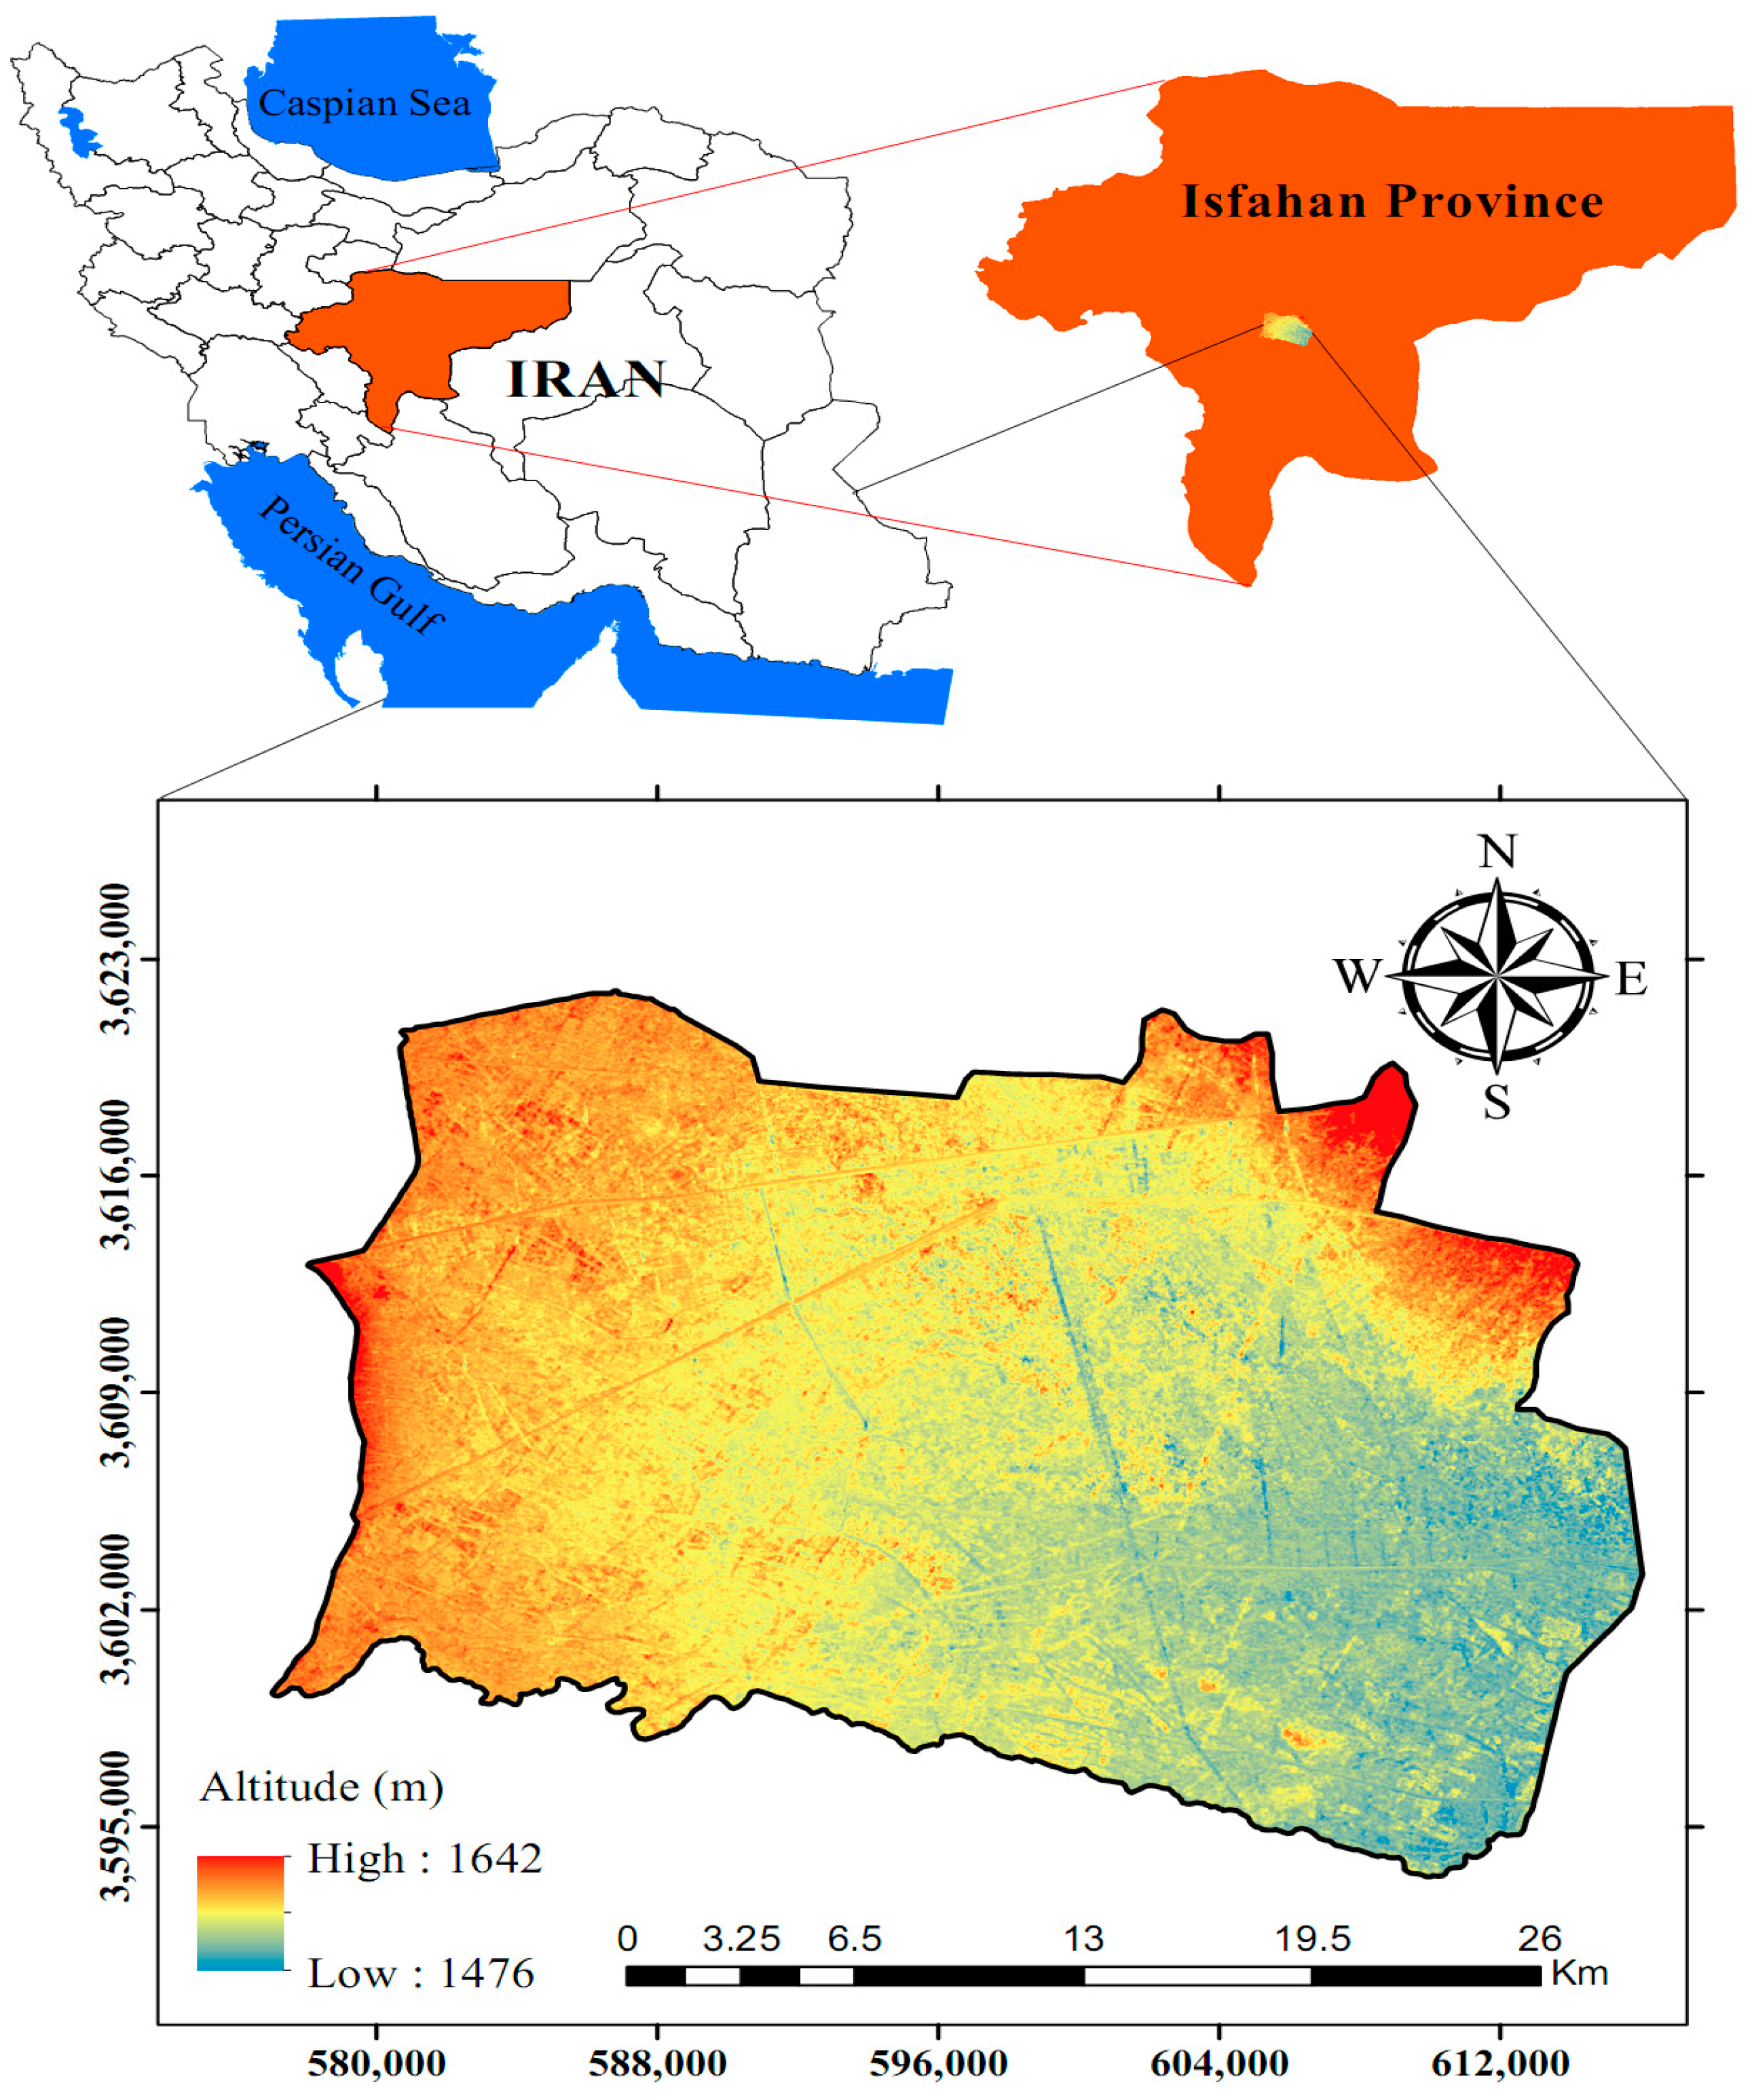
2.1. Study Area
2.2. Methodology
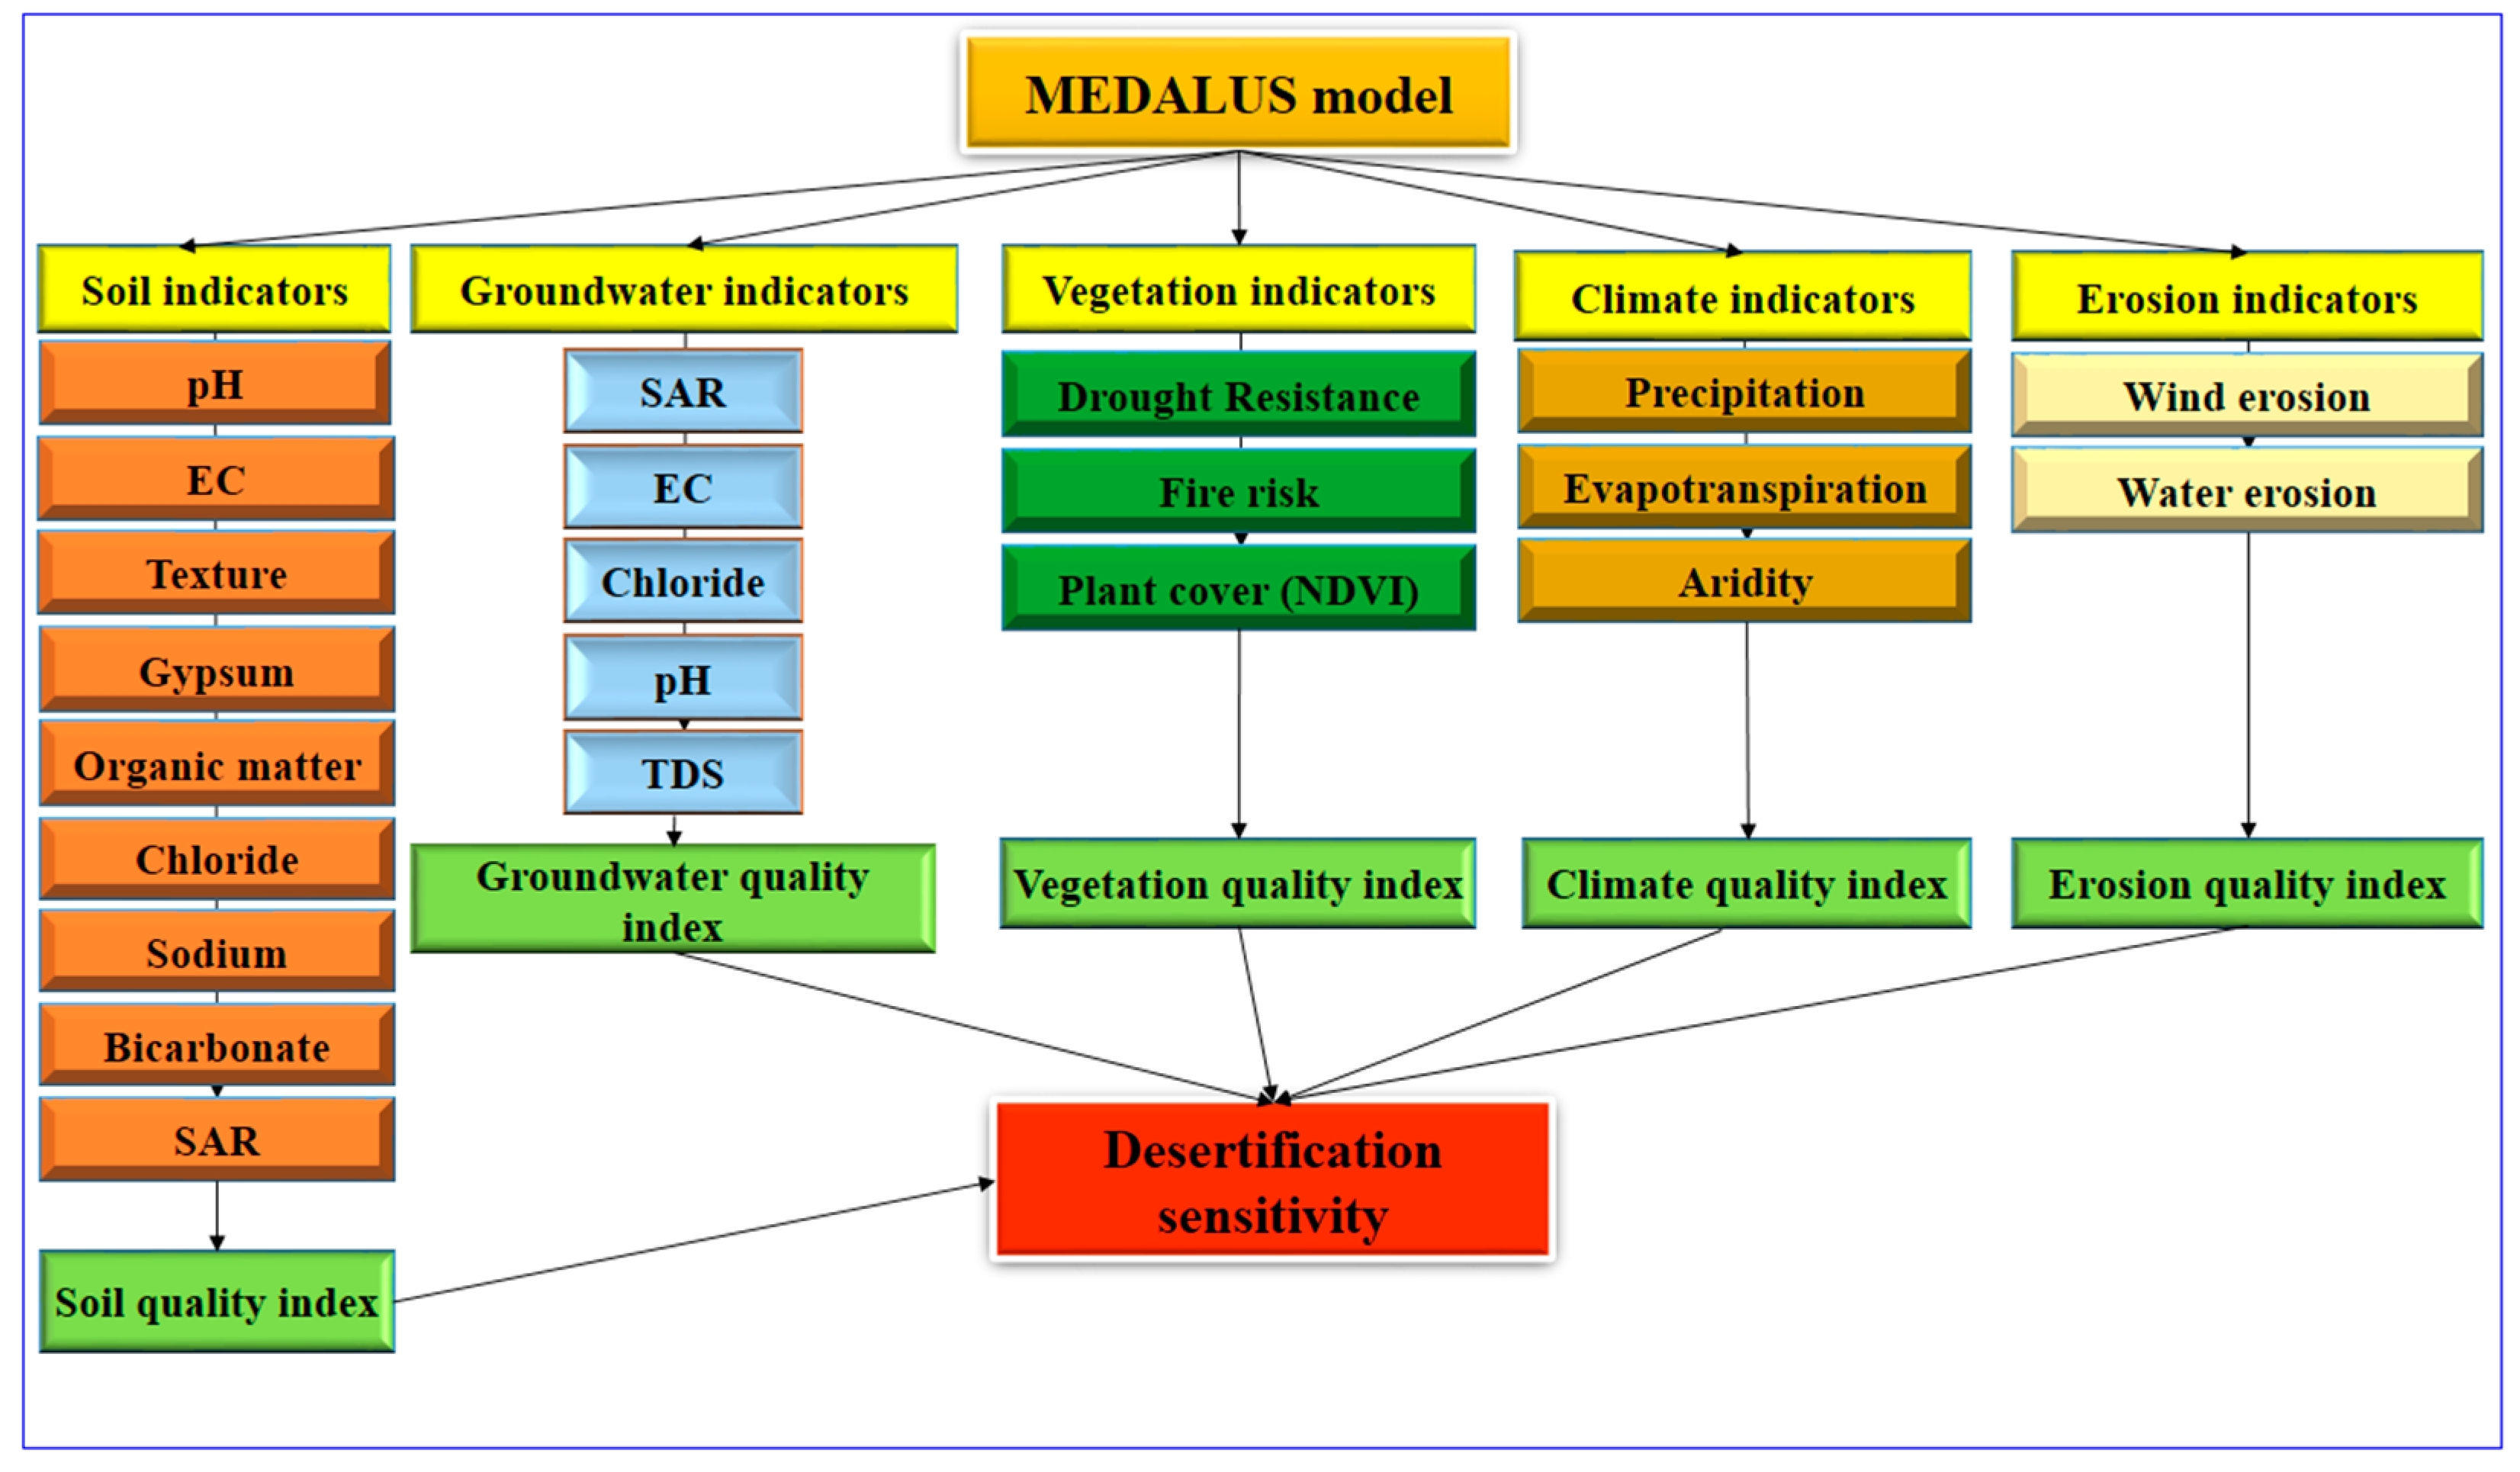
2.2.1. General Applied MEDALUS Framework
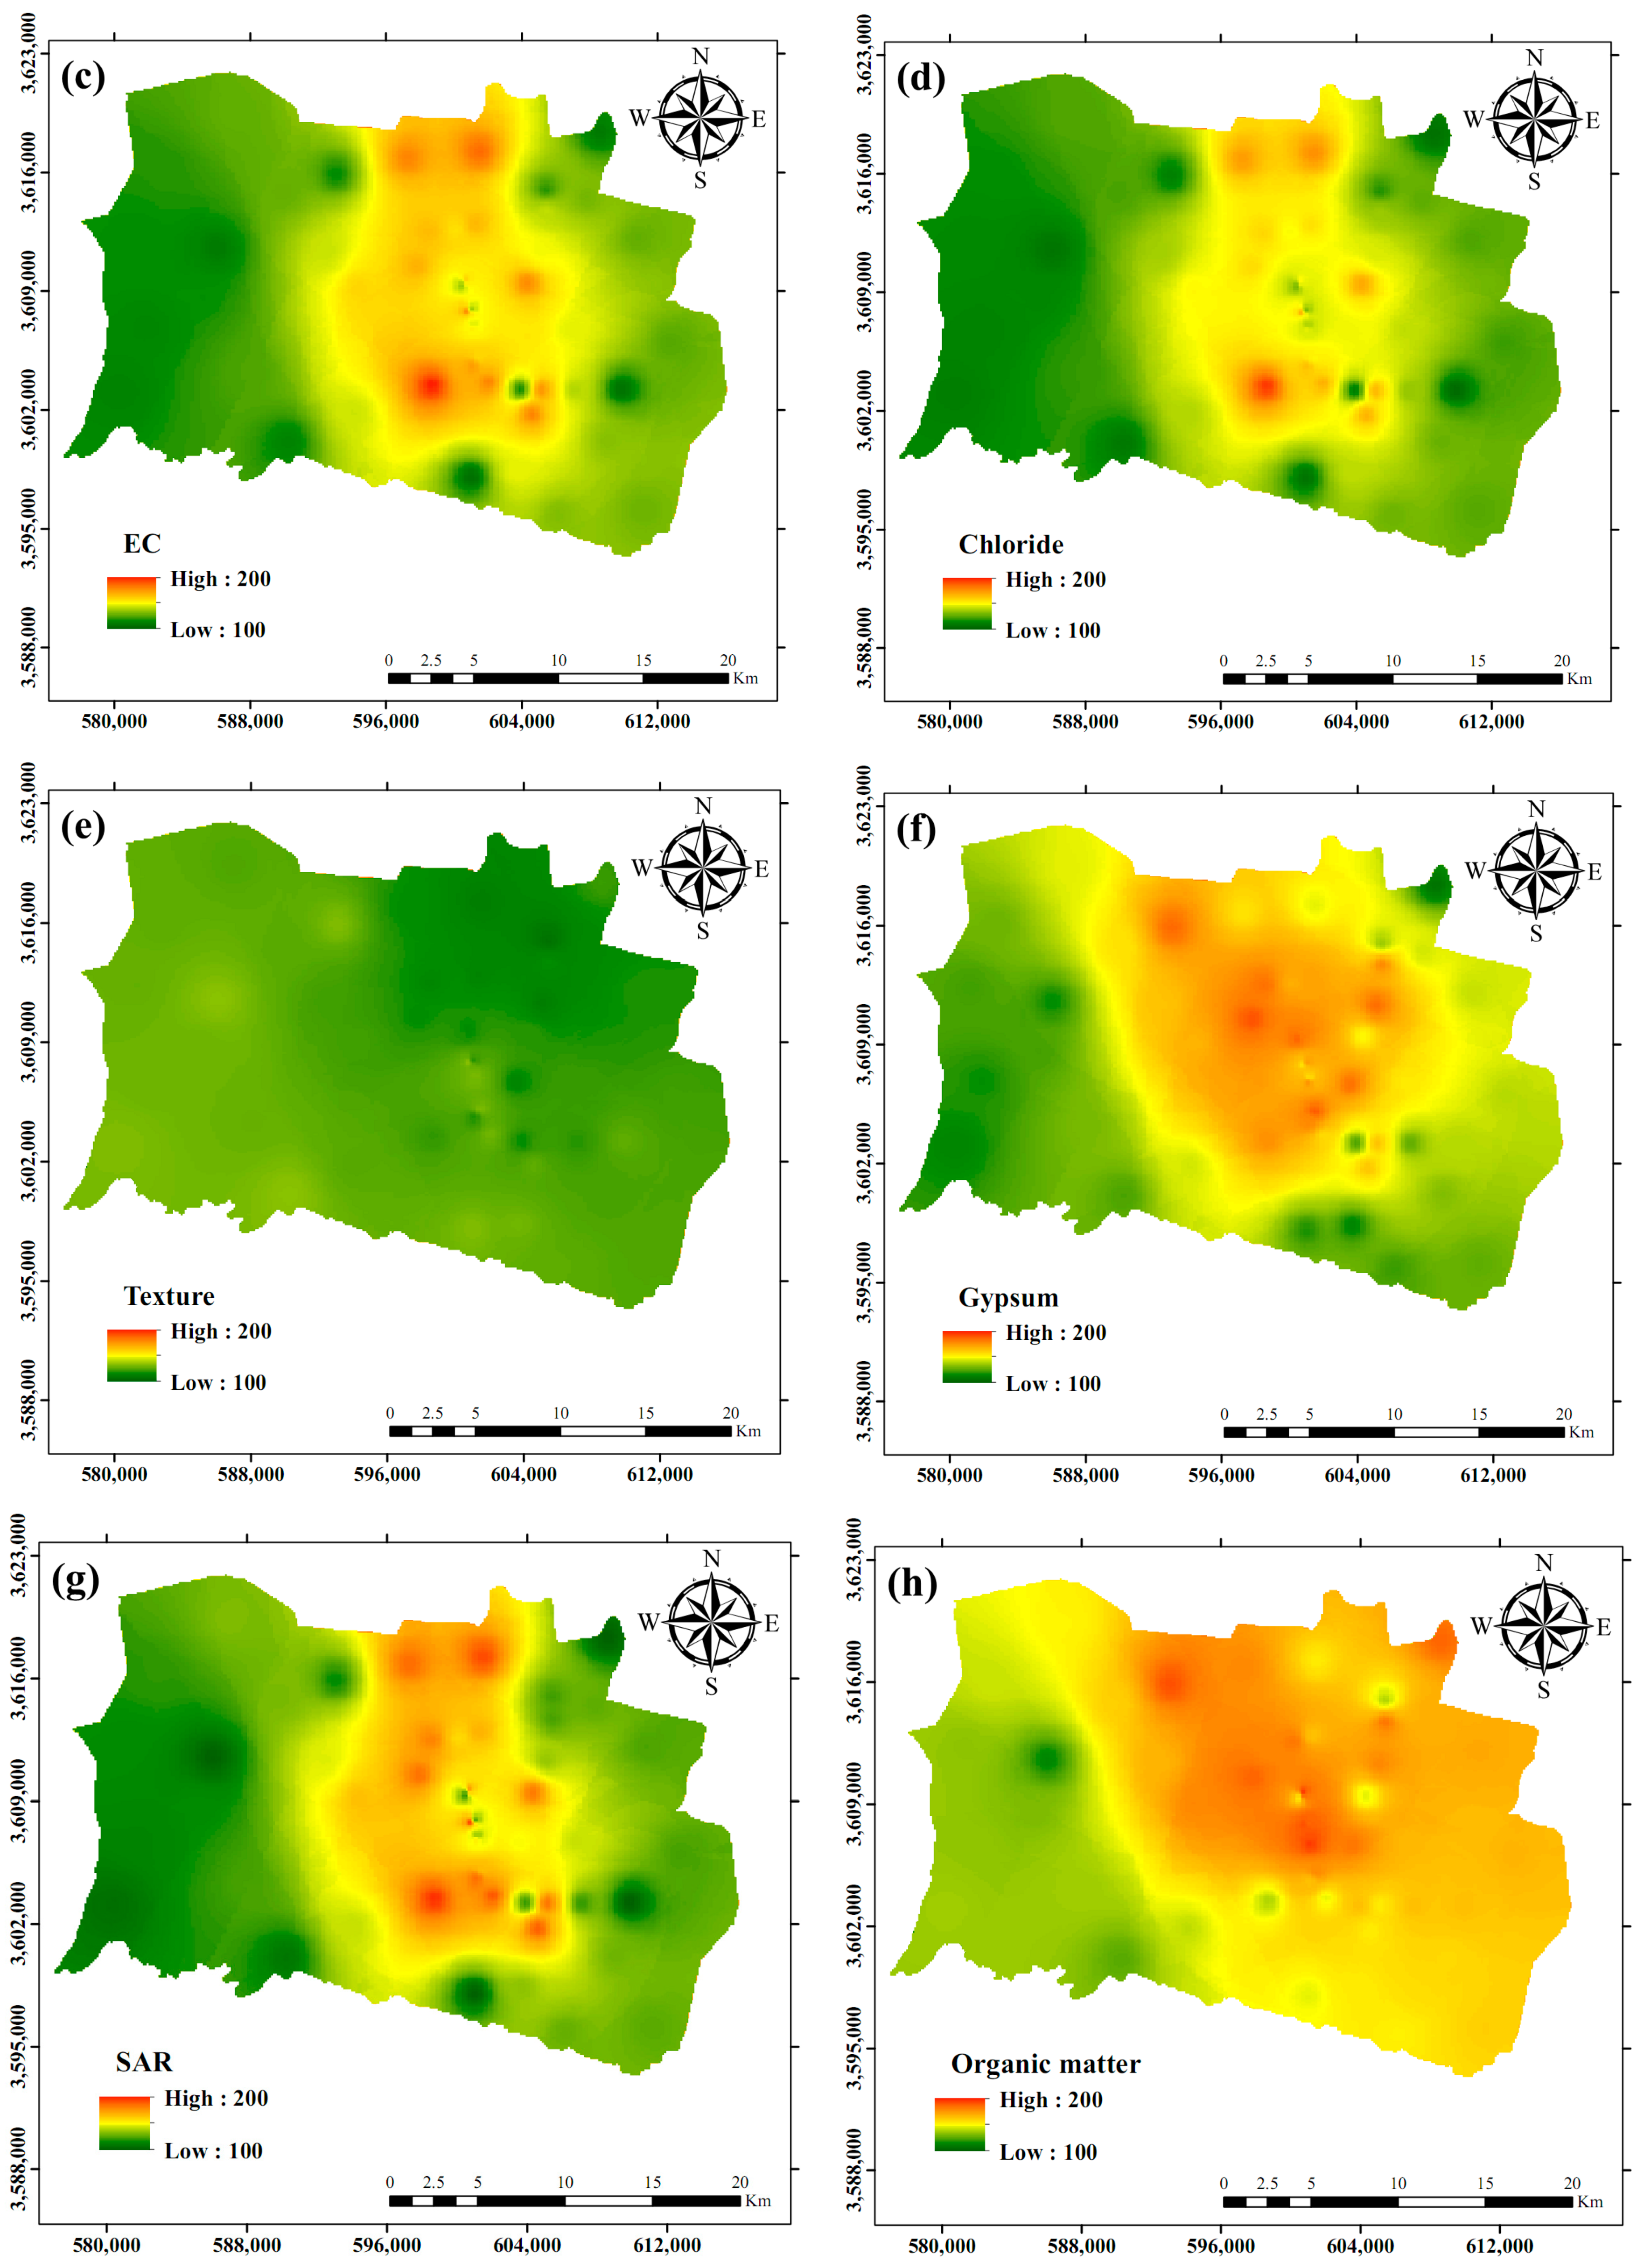
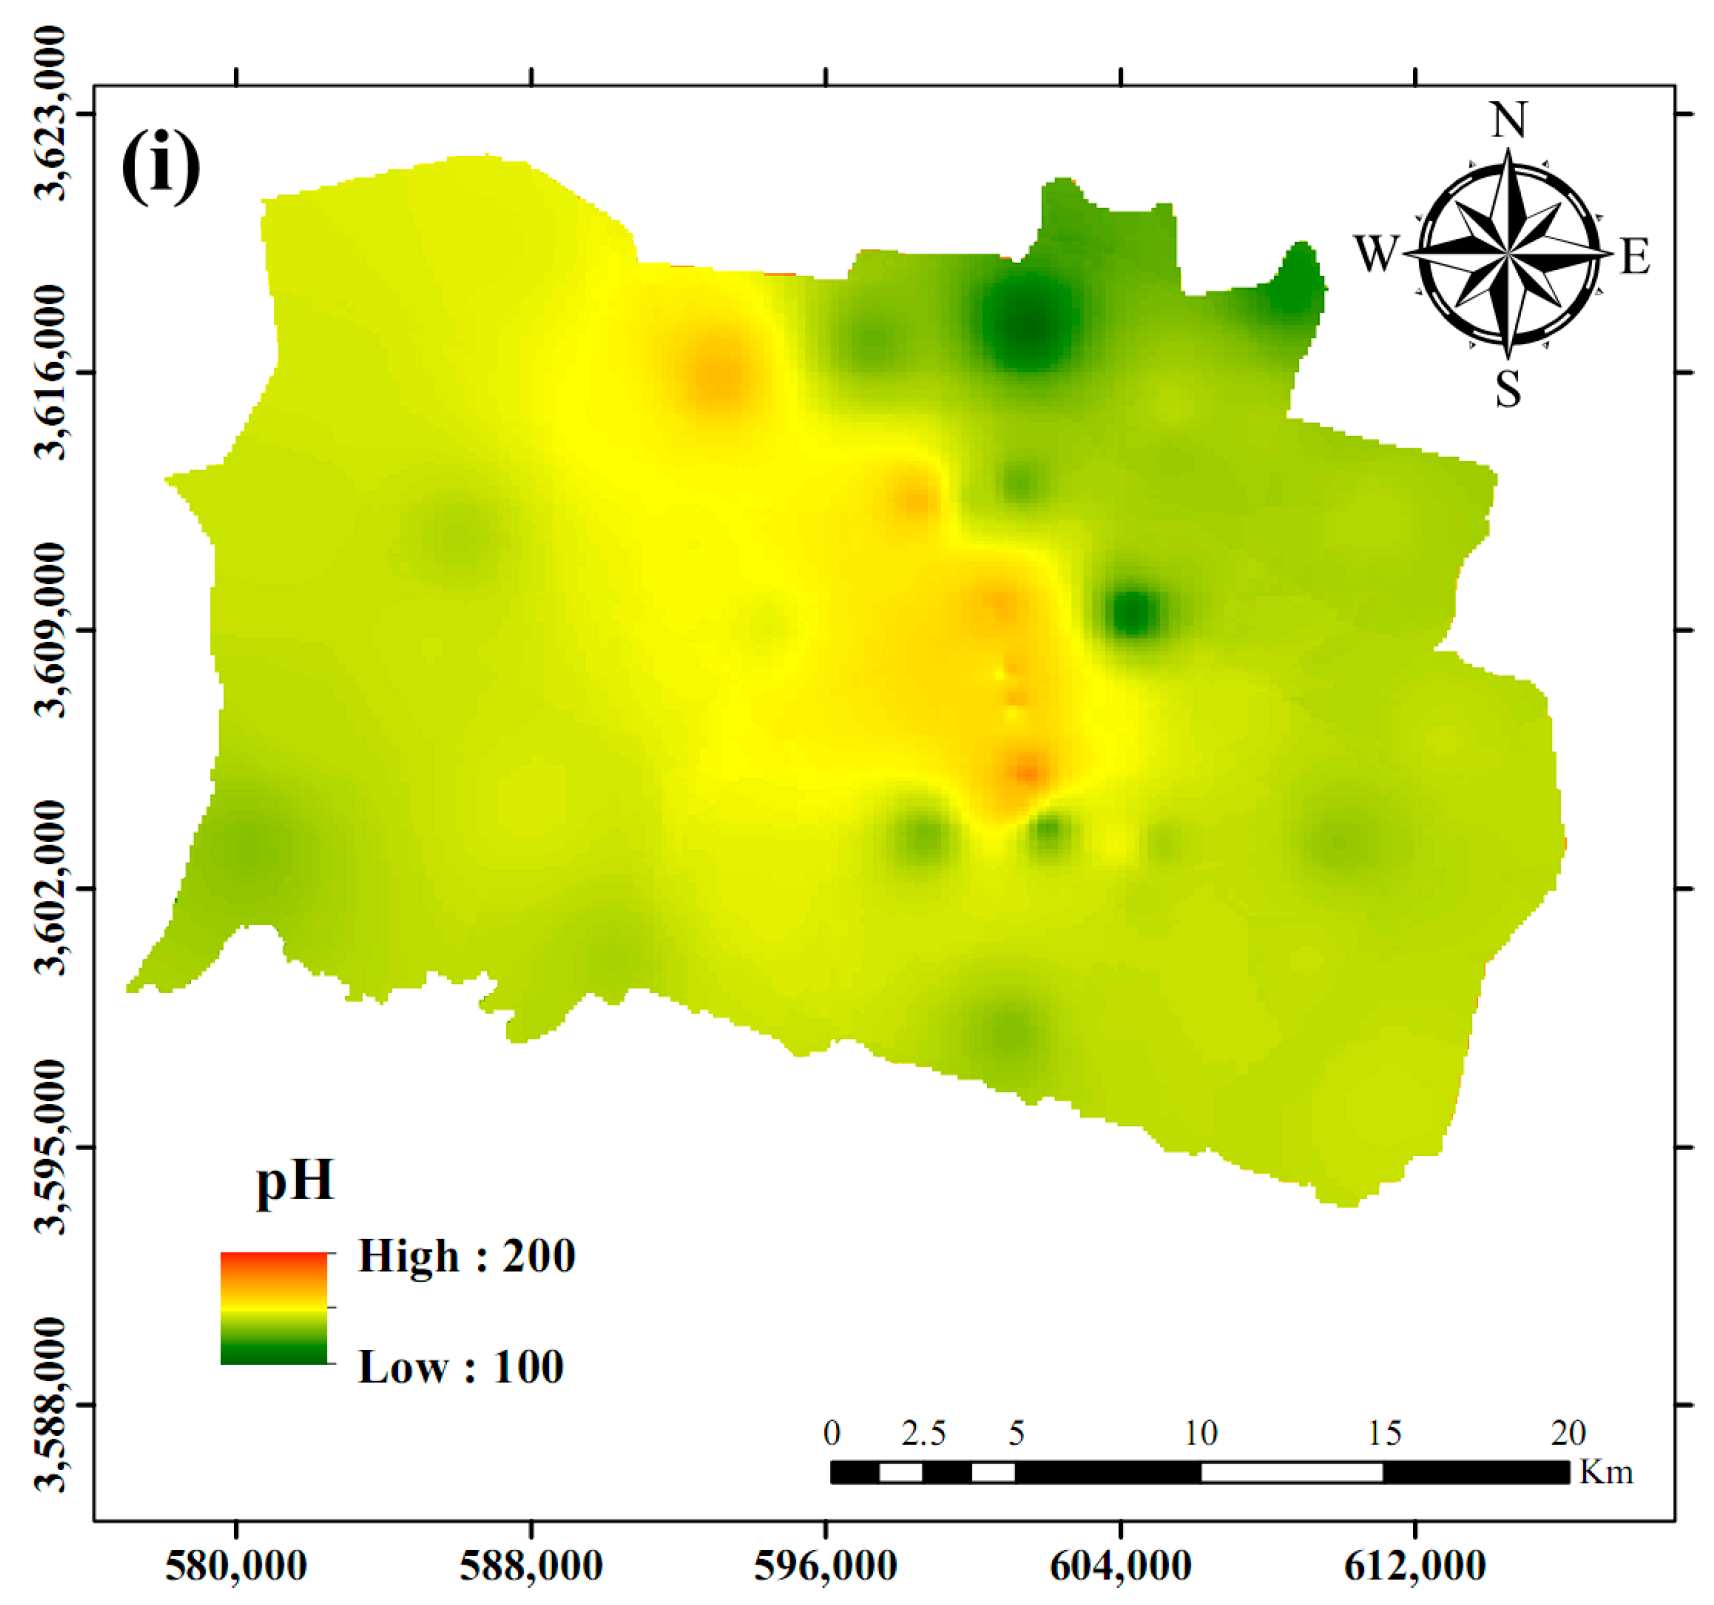
2.2.2. Soil Quality Index (SQI) and Indicators
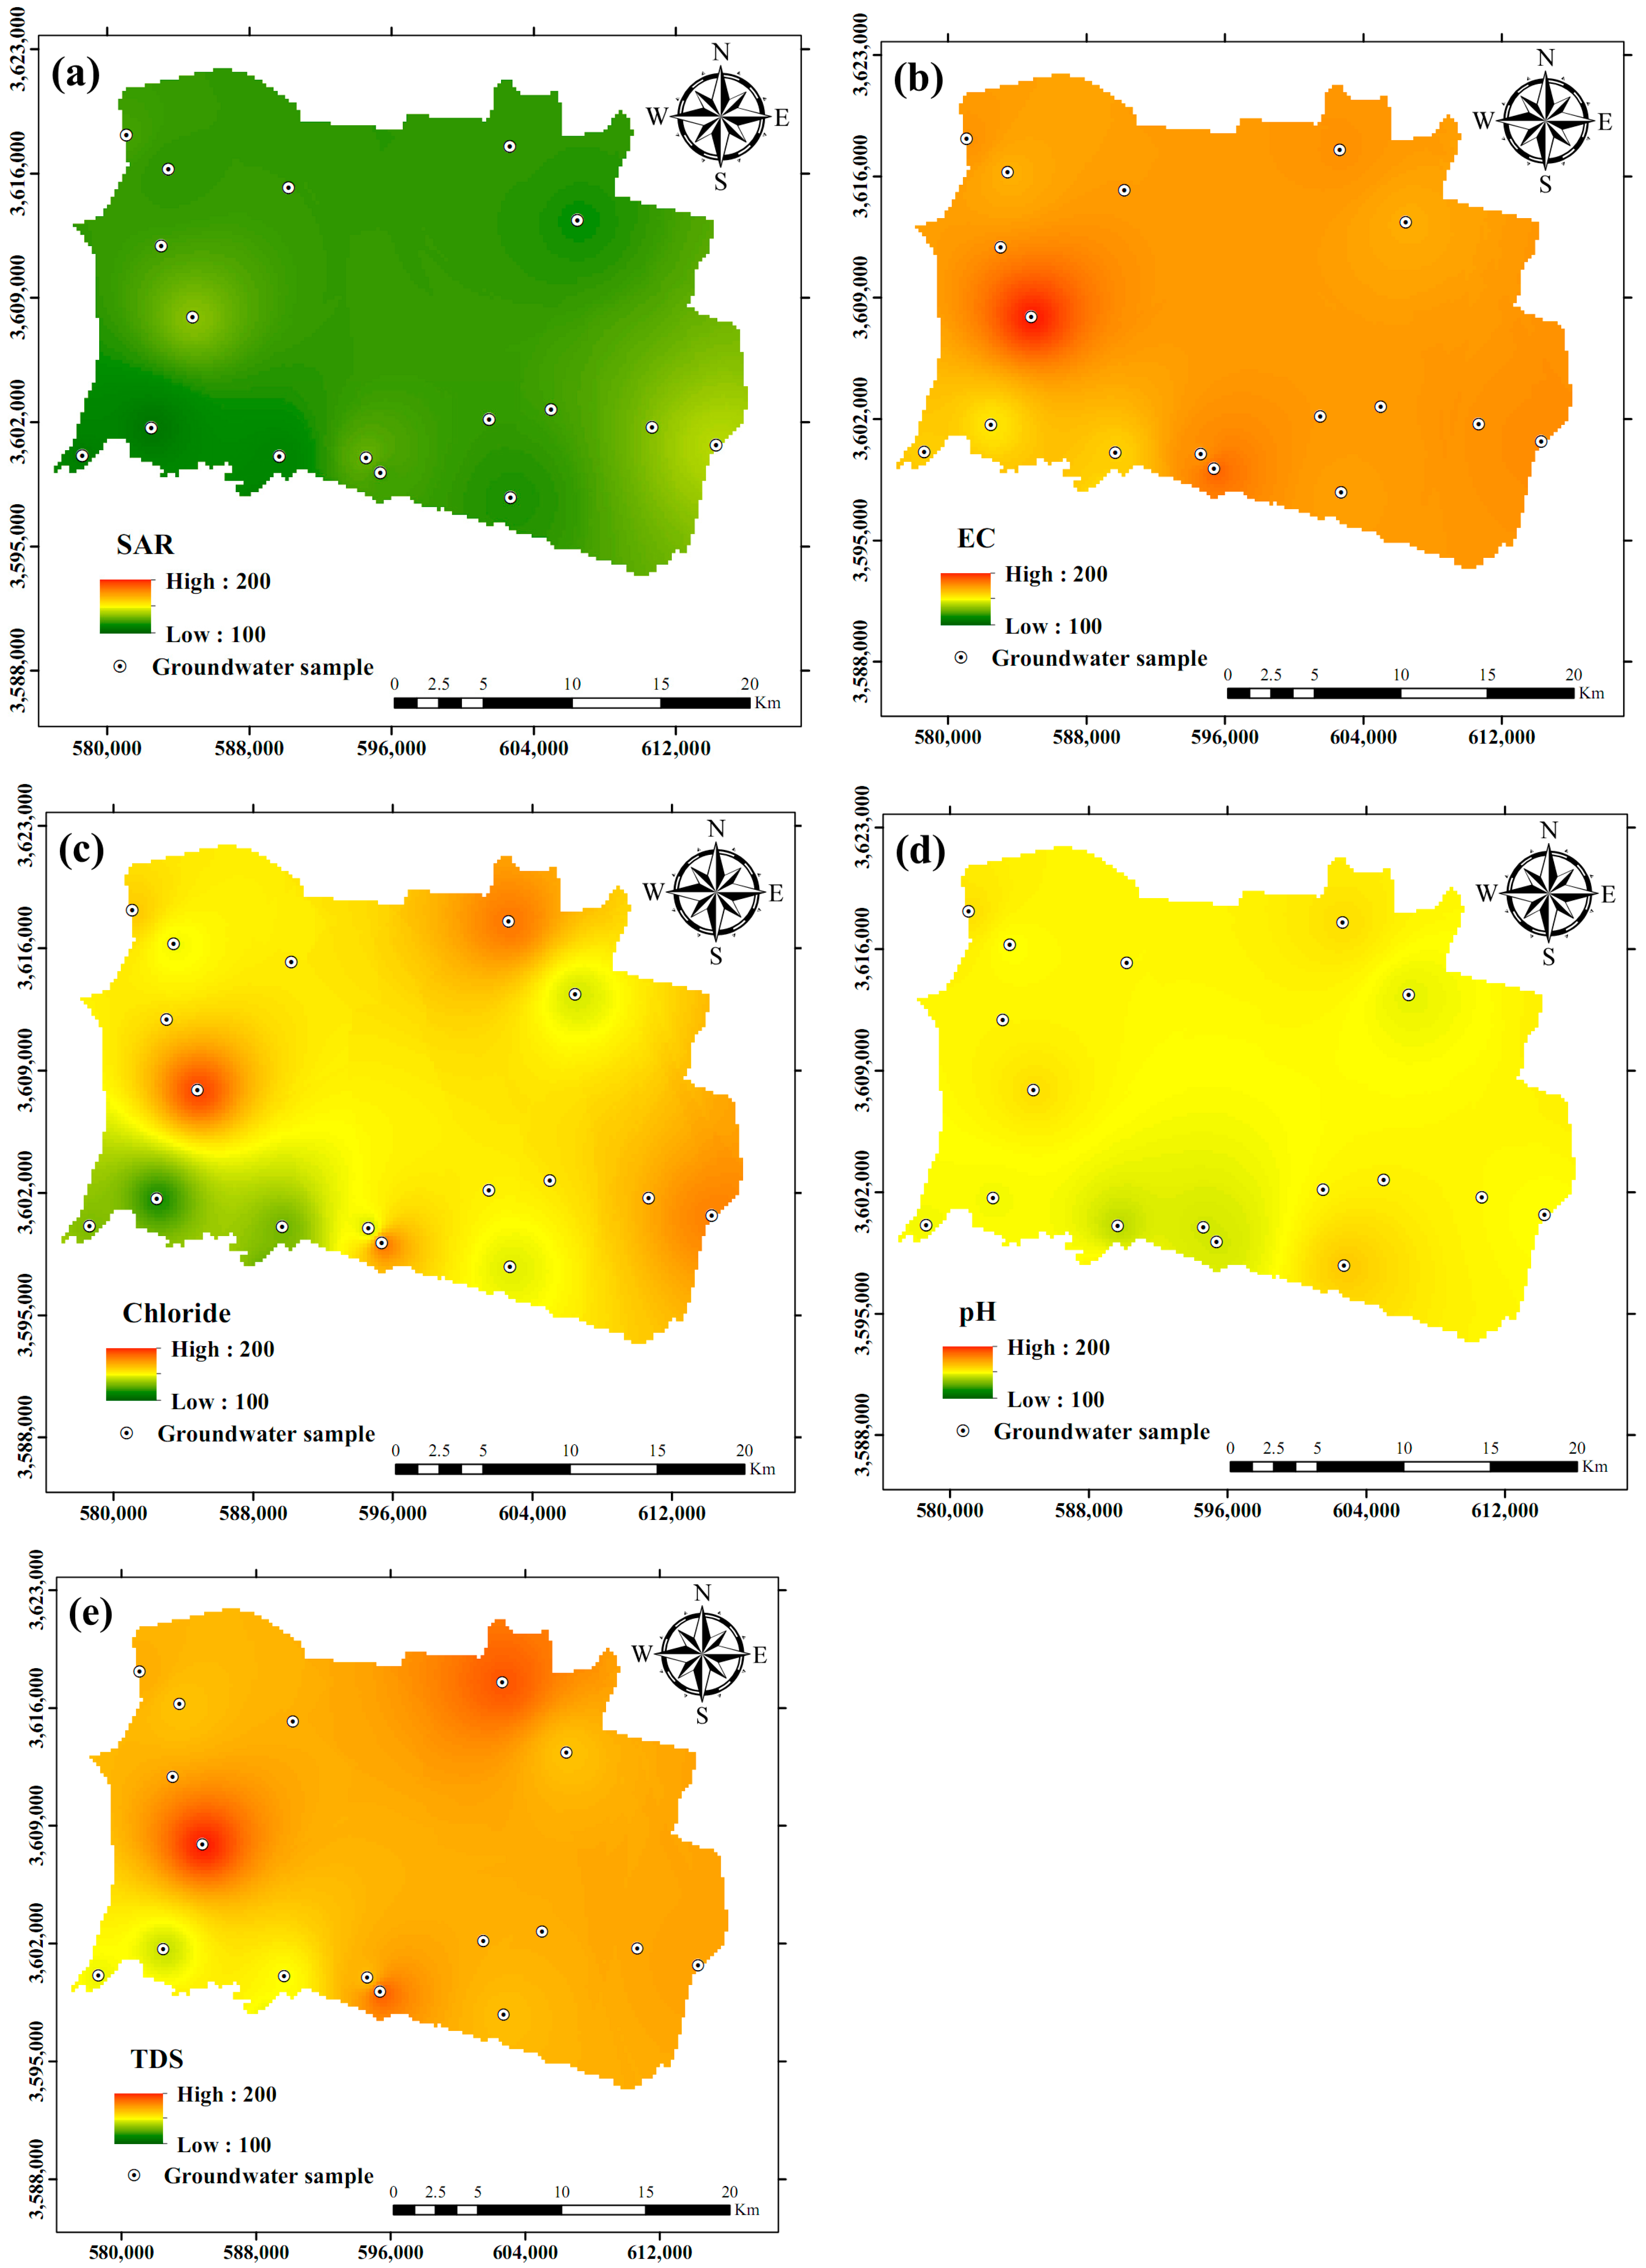
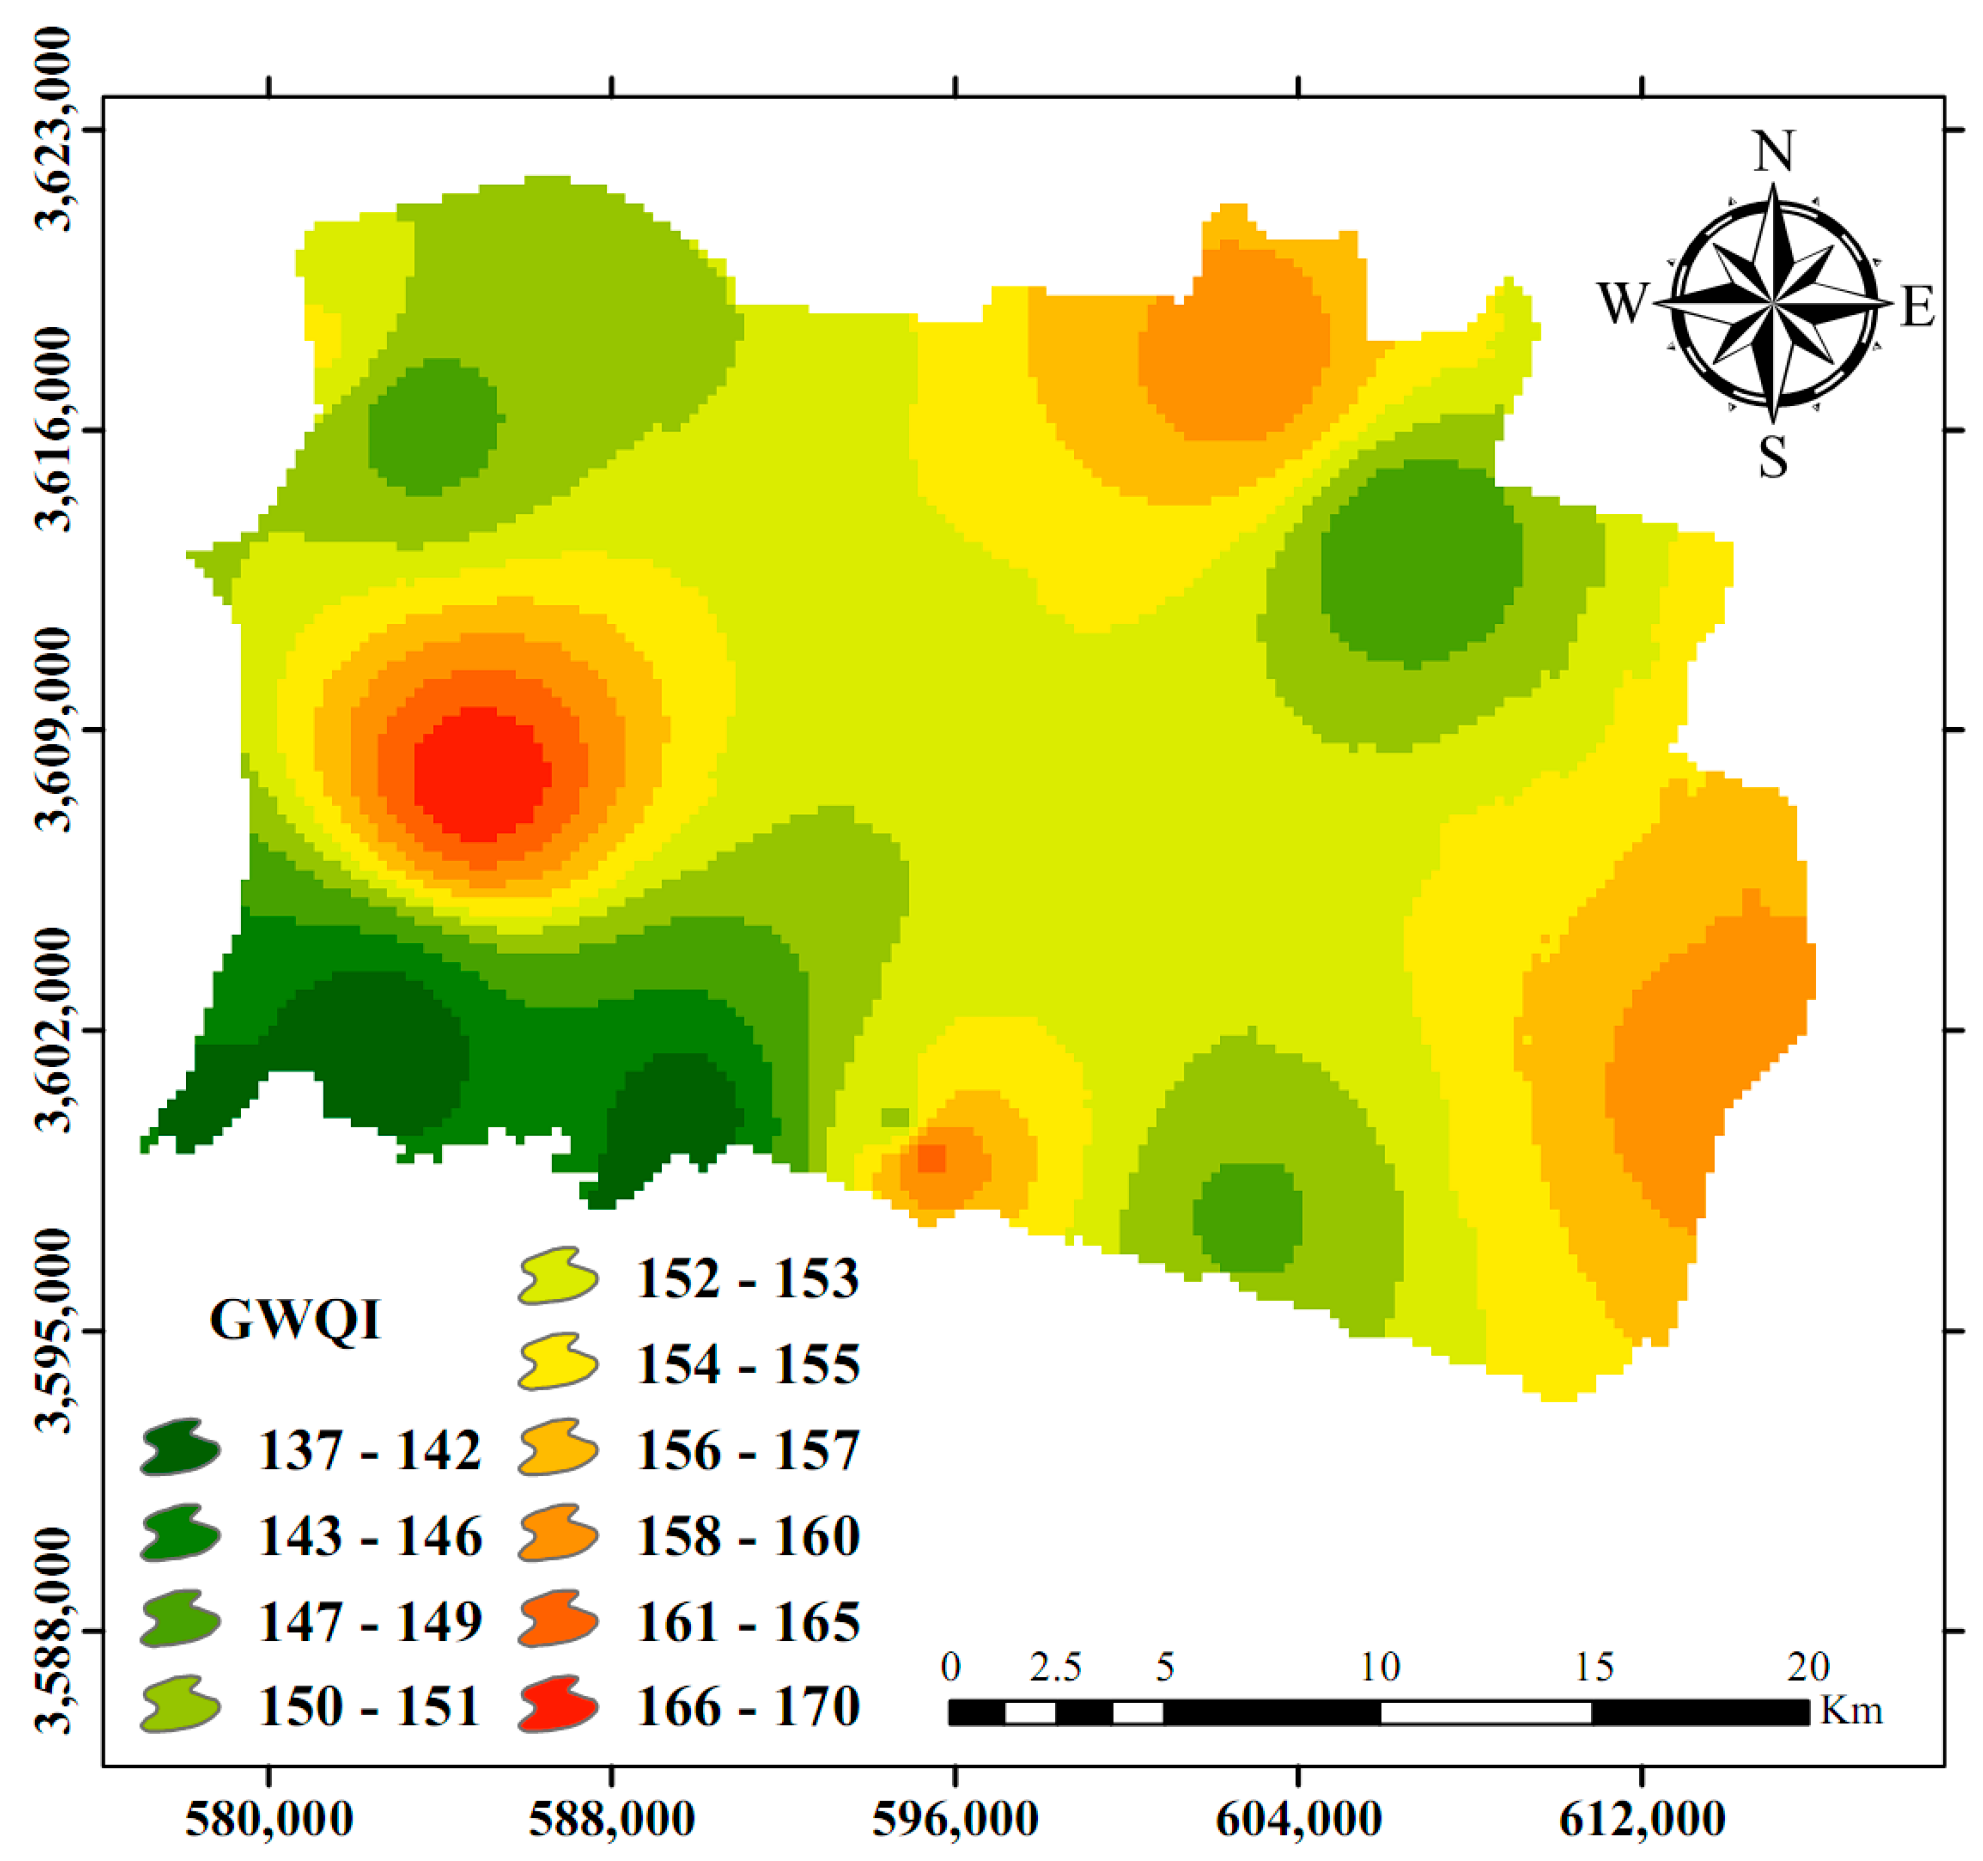
2.2.3. Groundwater Quality Index (GWQI) and Indicators
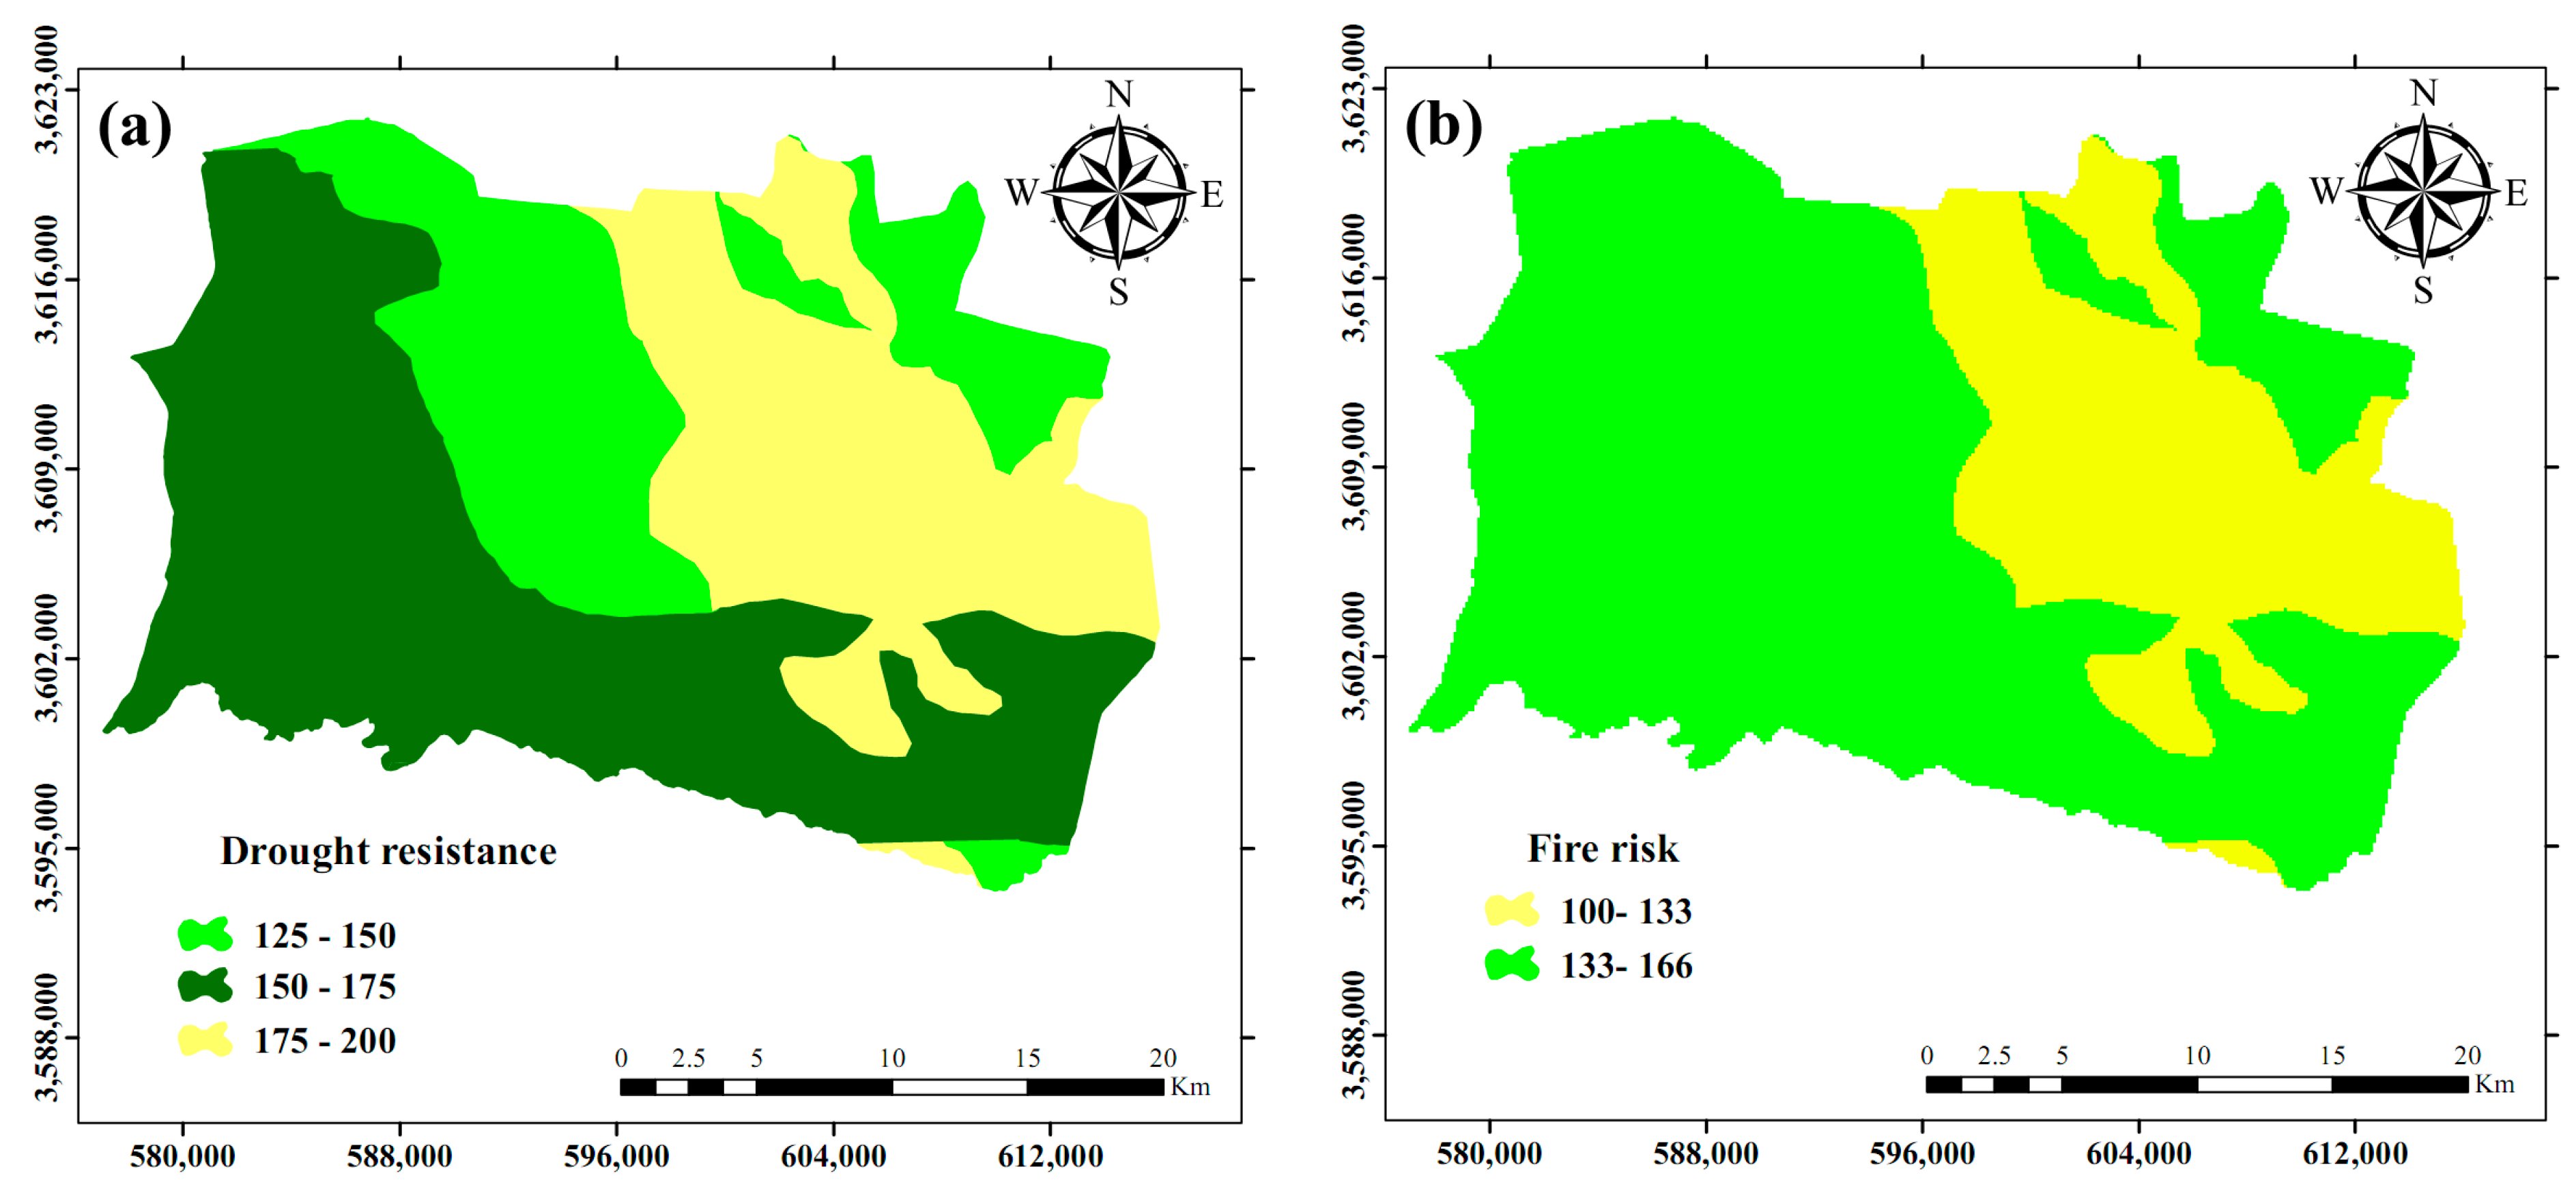
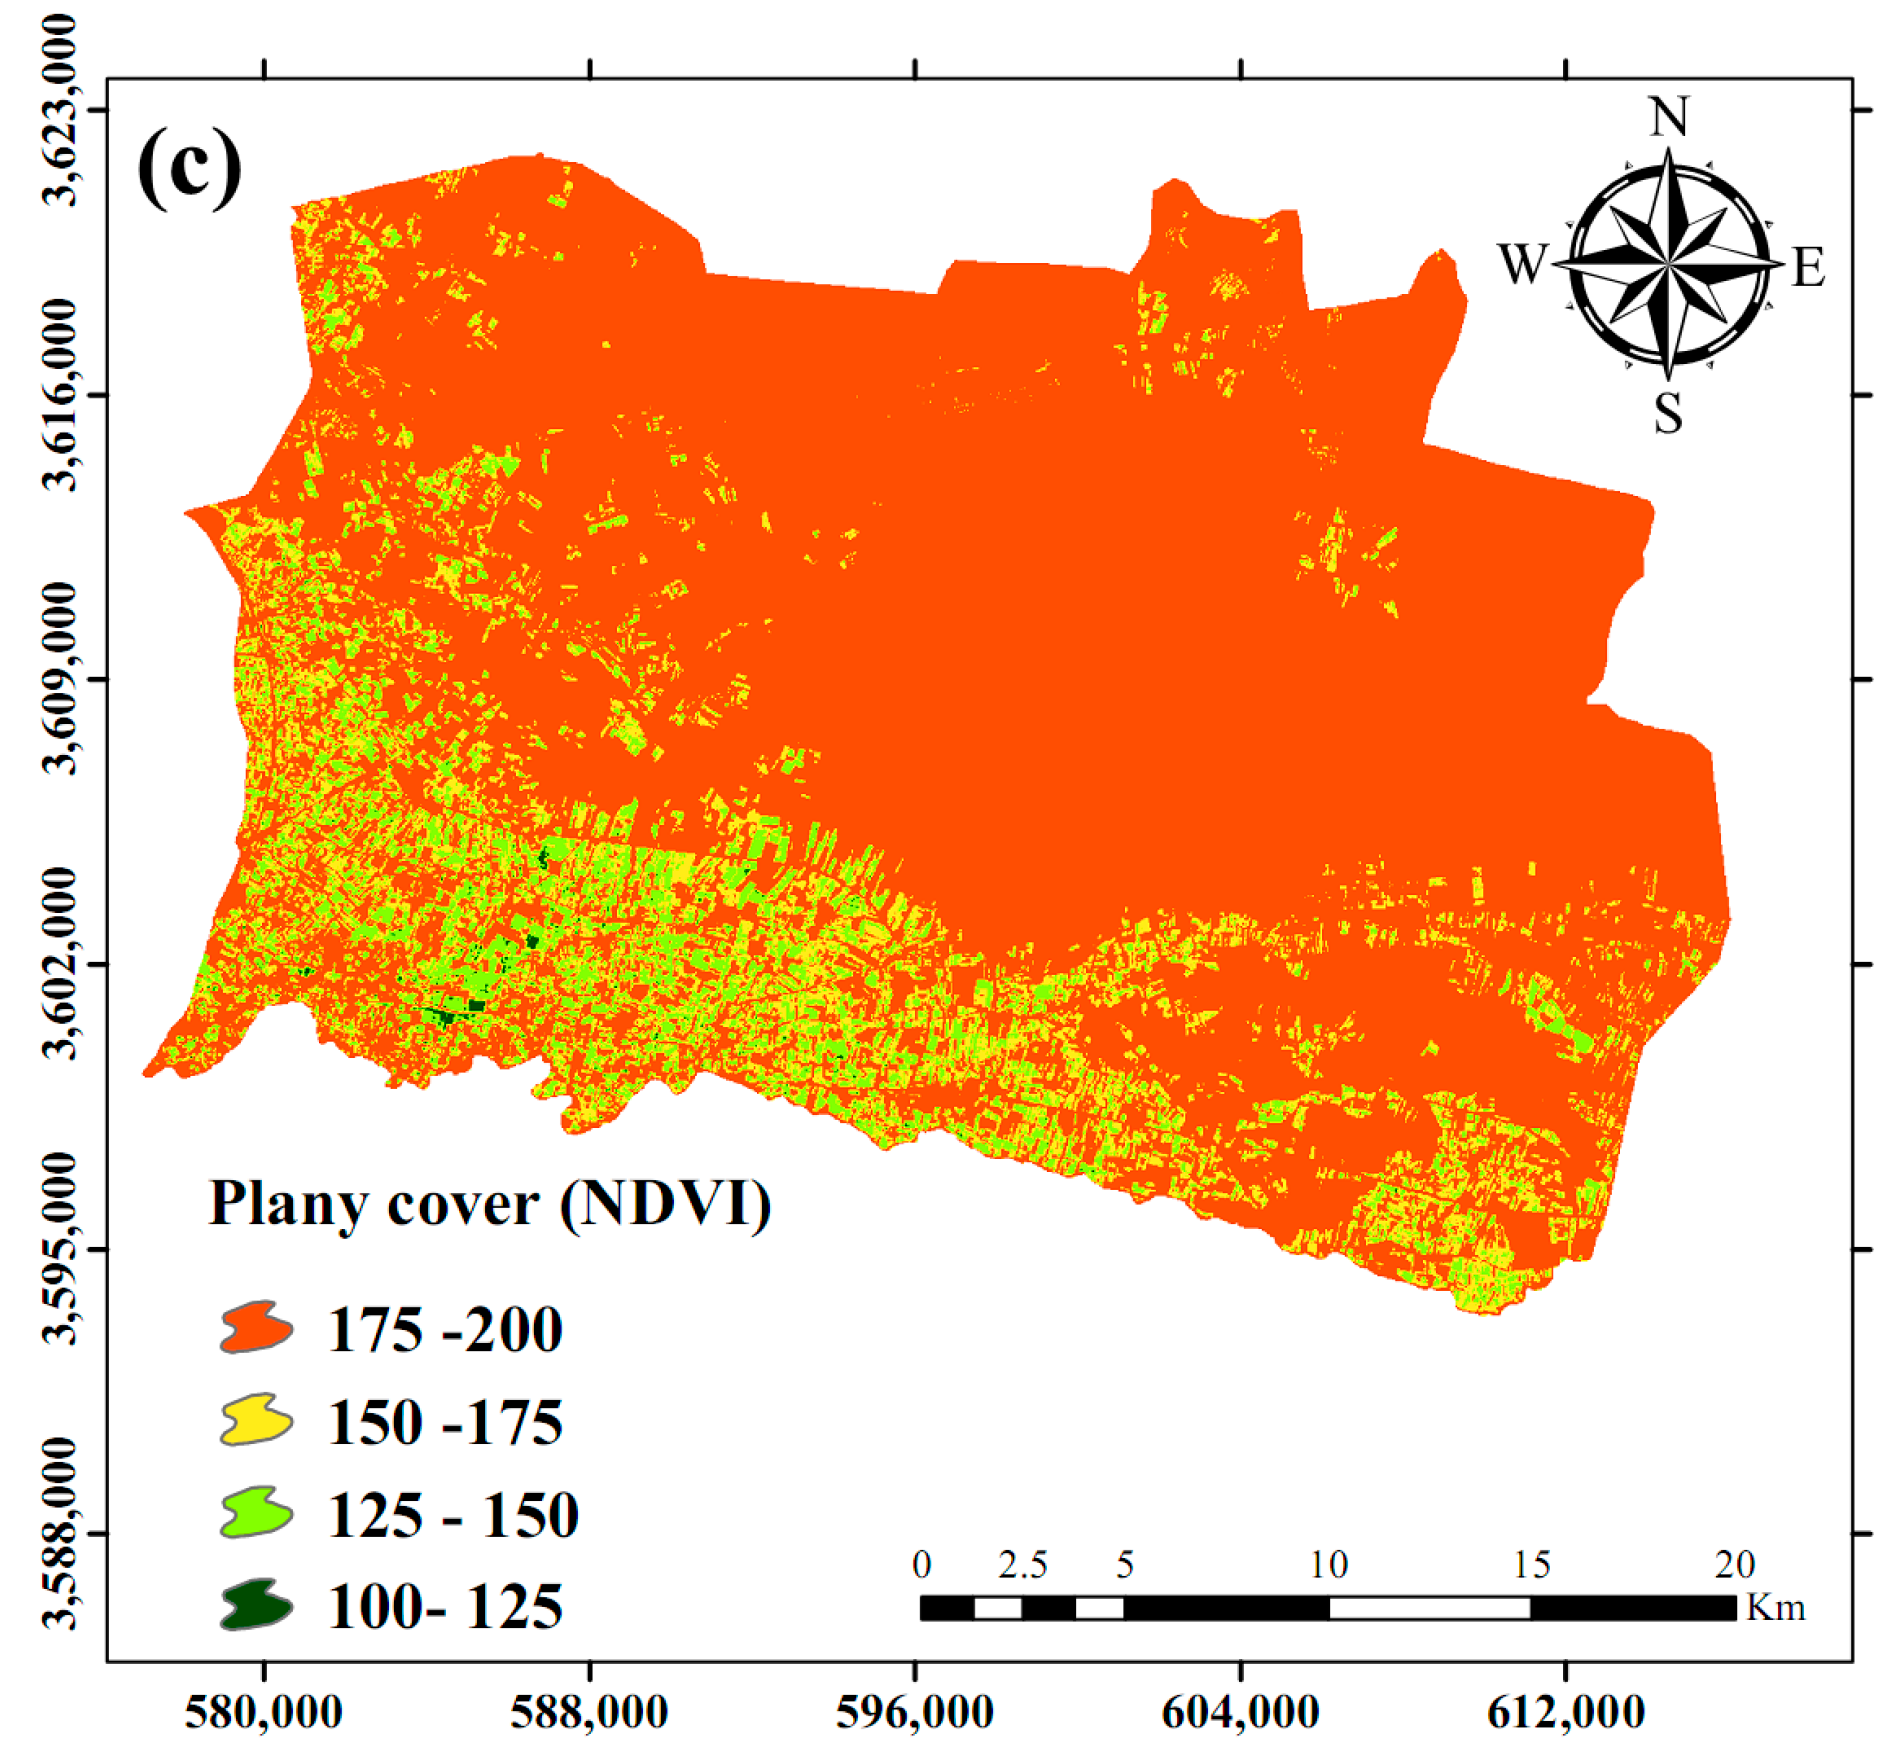
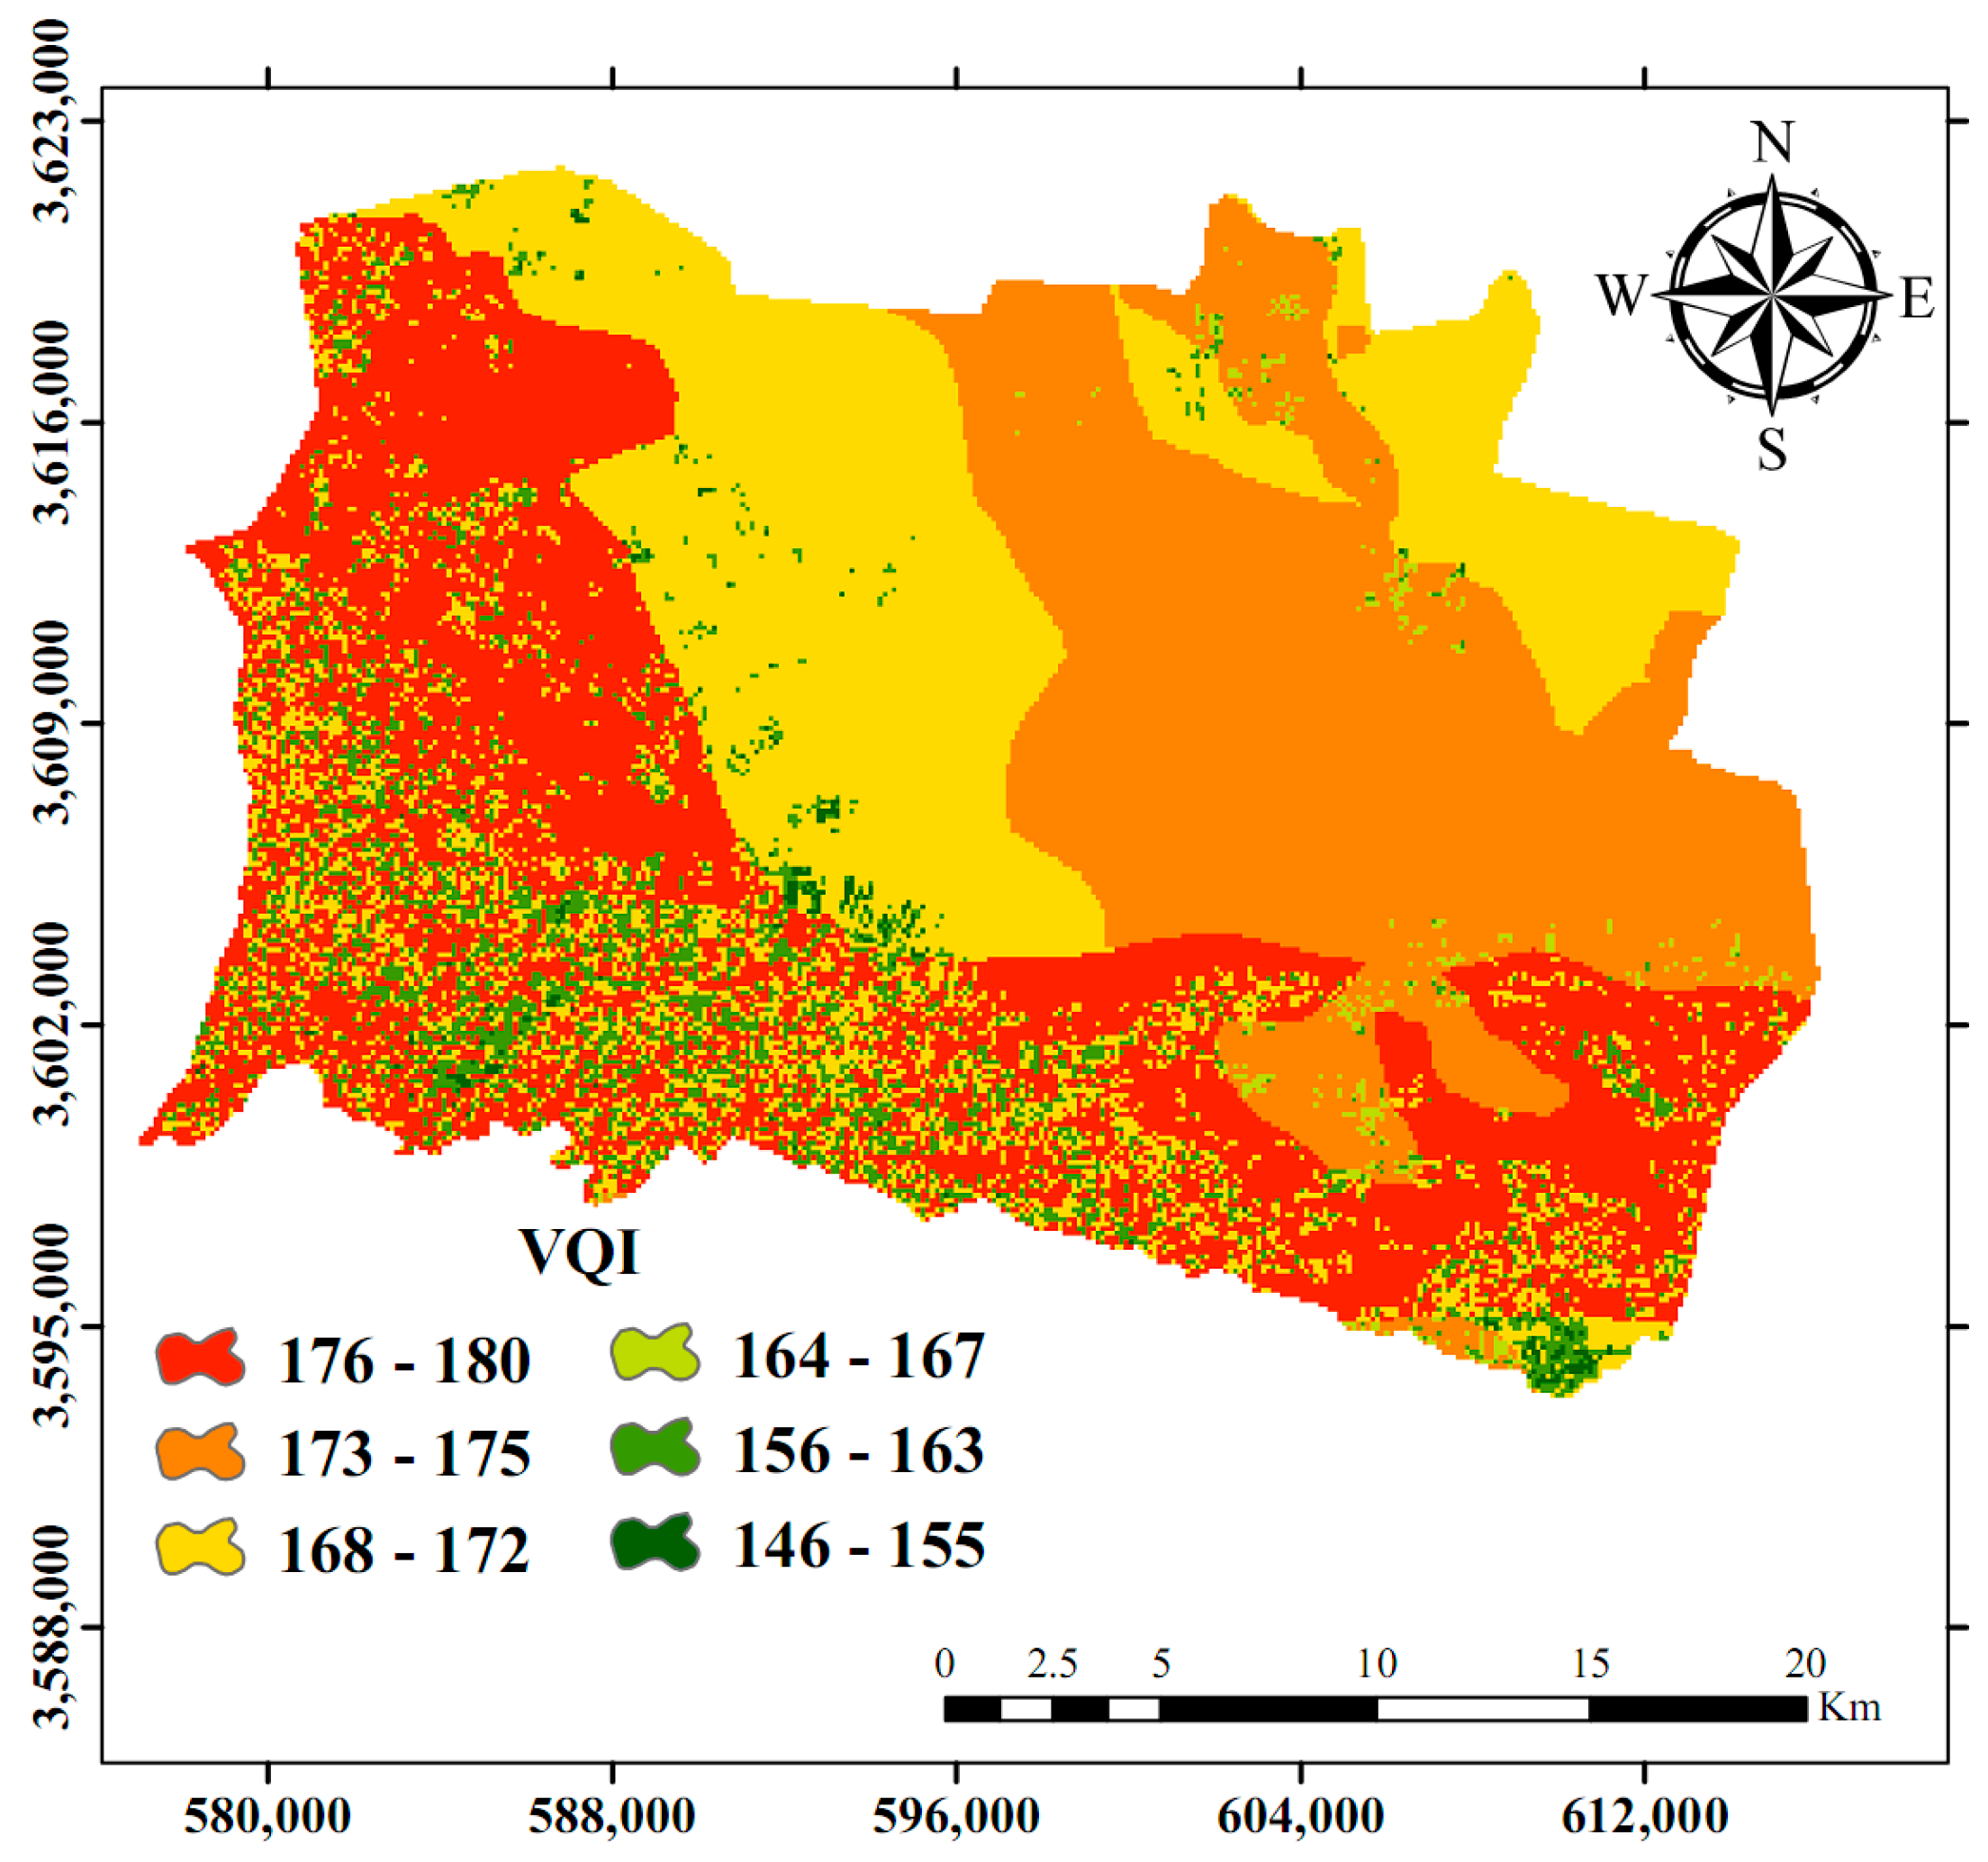
2.2.4. Vegetation Quality Index (VQI) and Indicators
2.2.5. Climate Quality Index (CQI) and Indicators
2.2.6. Erosion Quality Index (EQI) and Indicators
3. Results and Discussion
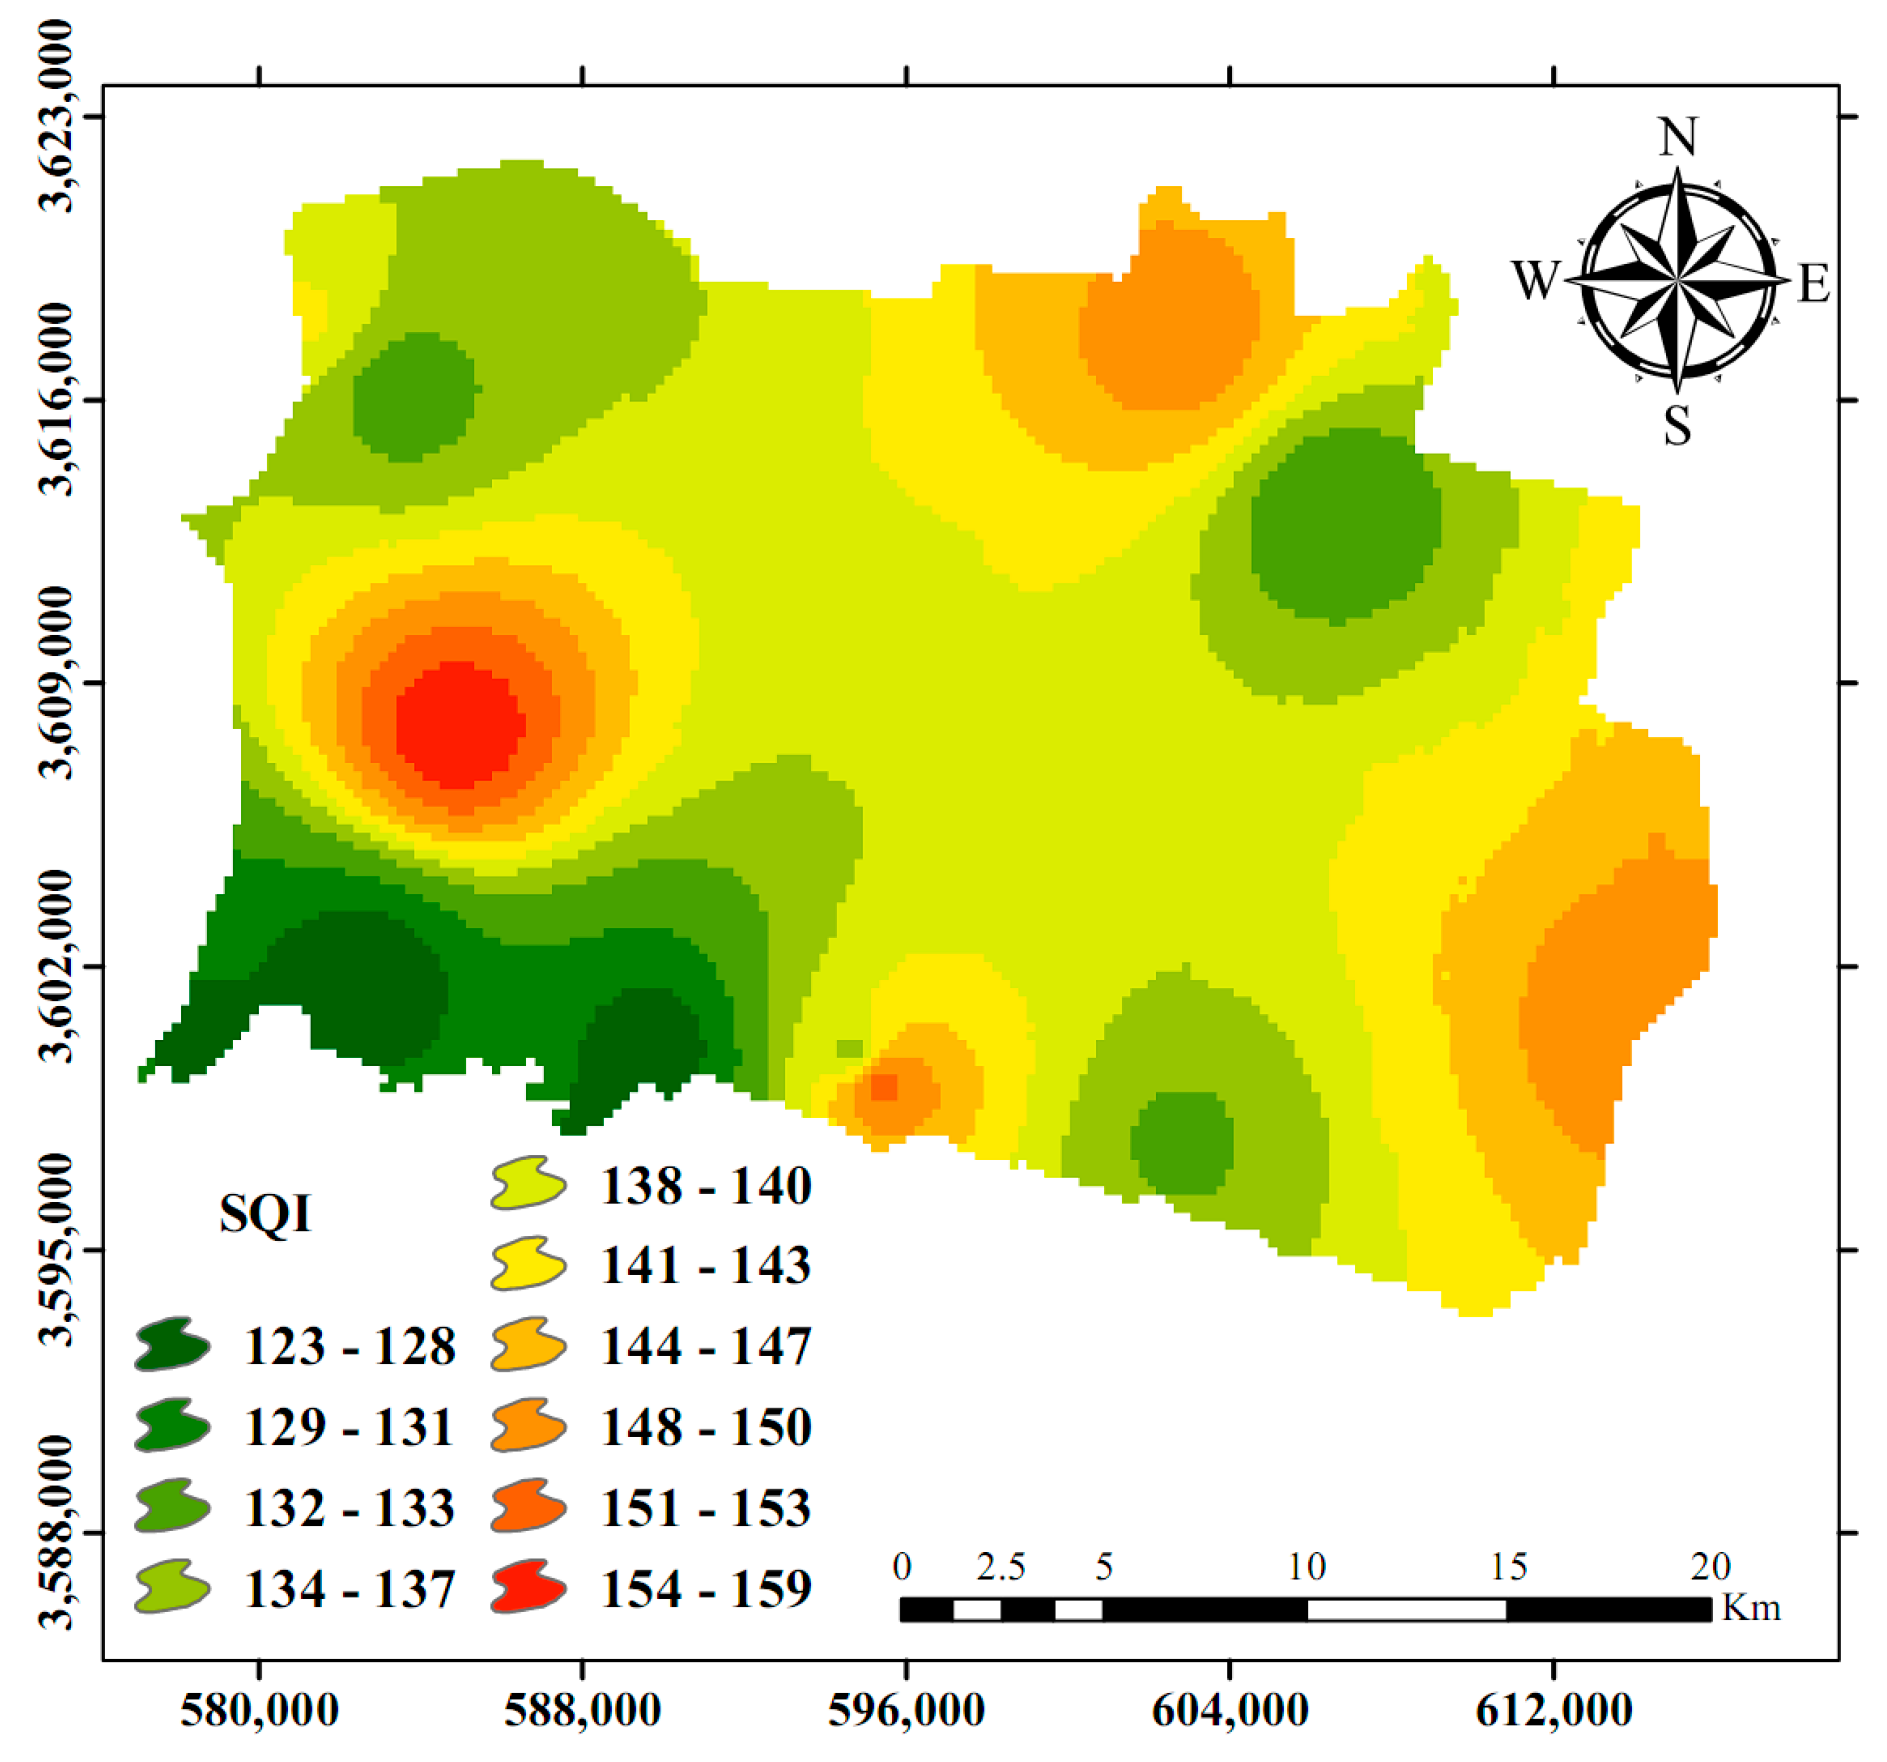
3.1. Soil Quality Index
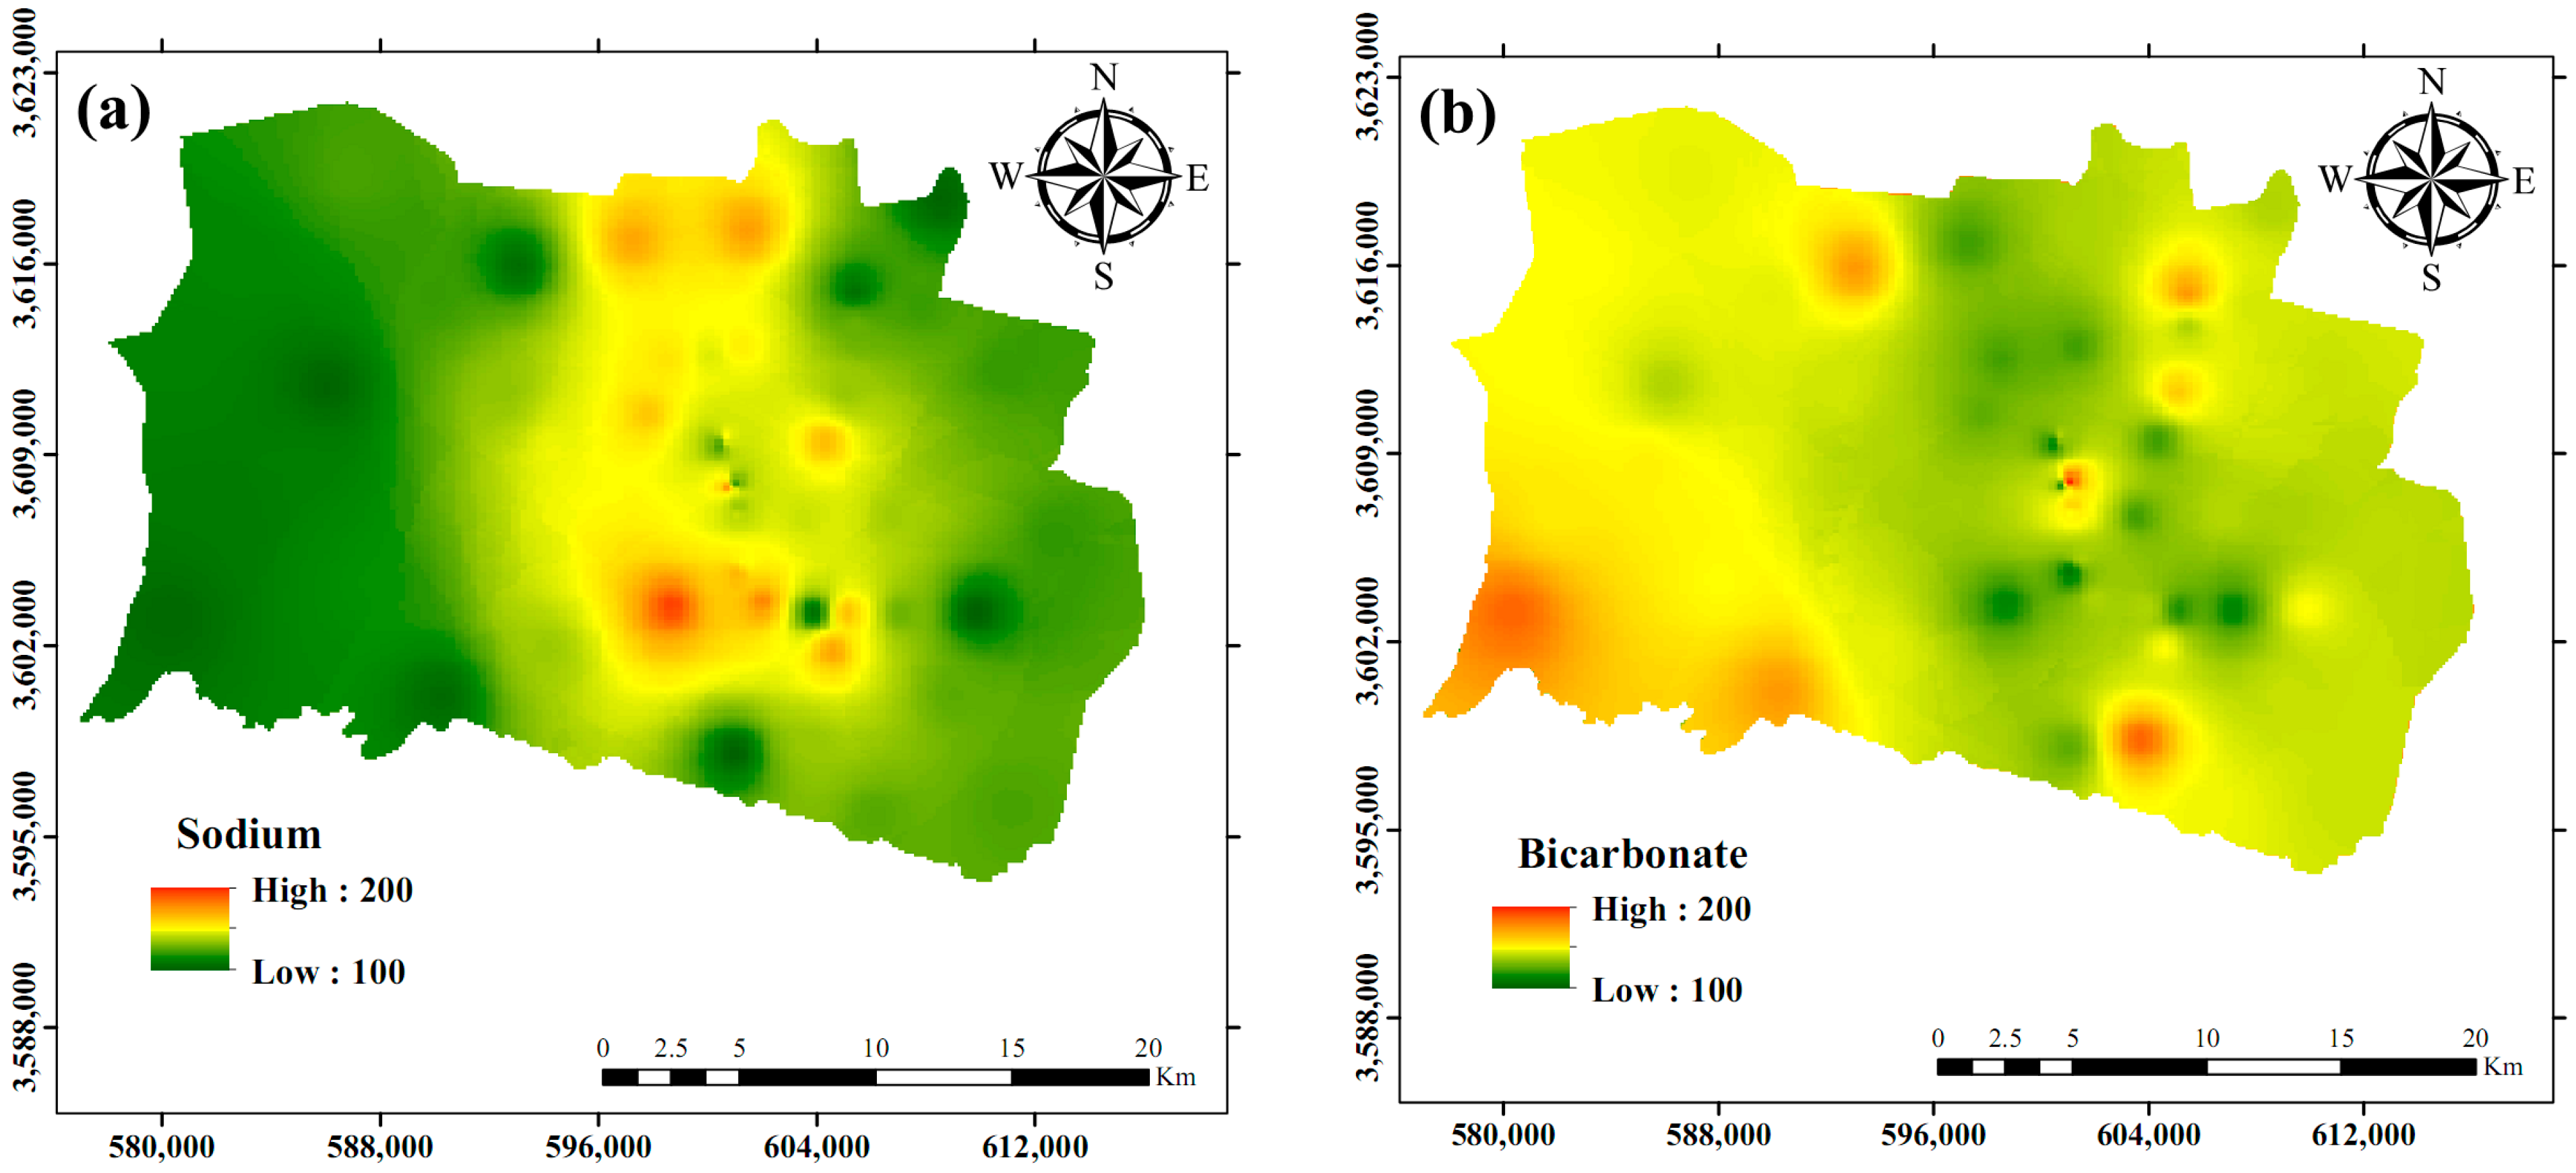
3.2. Groundwater Quality Index
3.3. Vegetation Quality Index
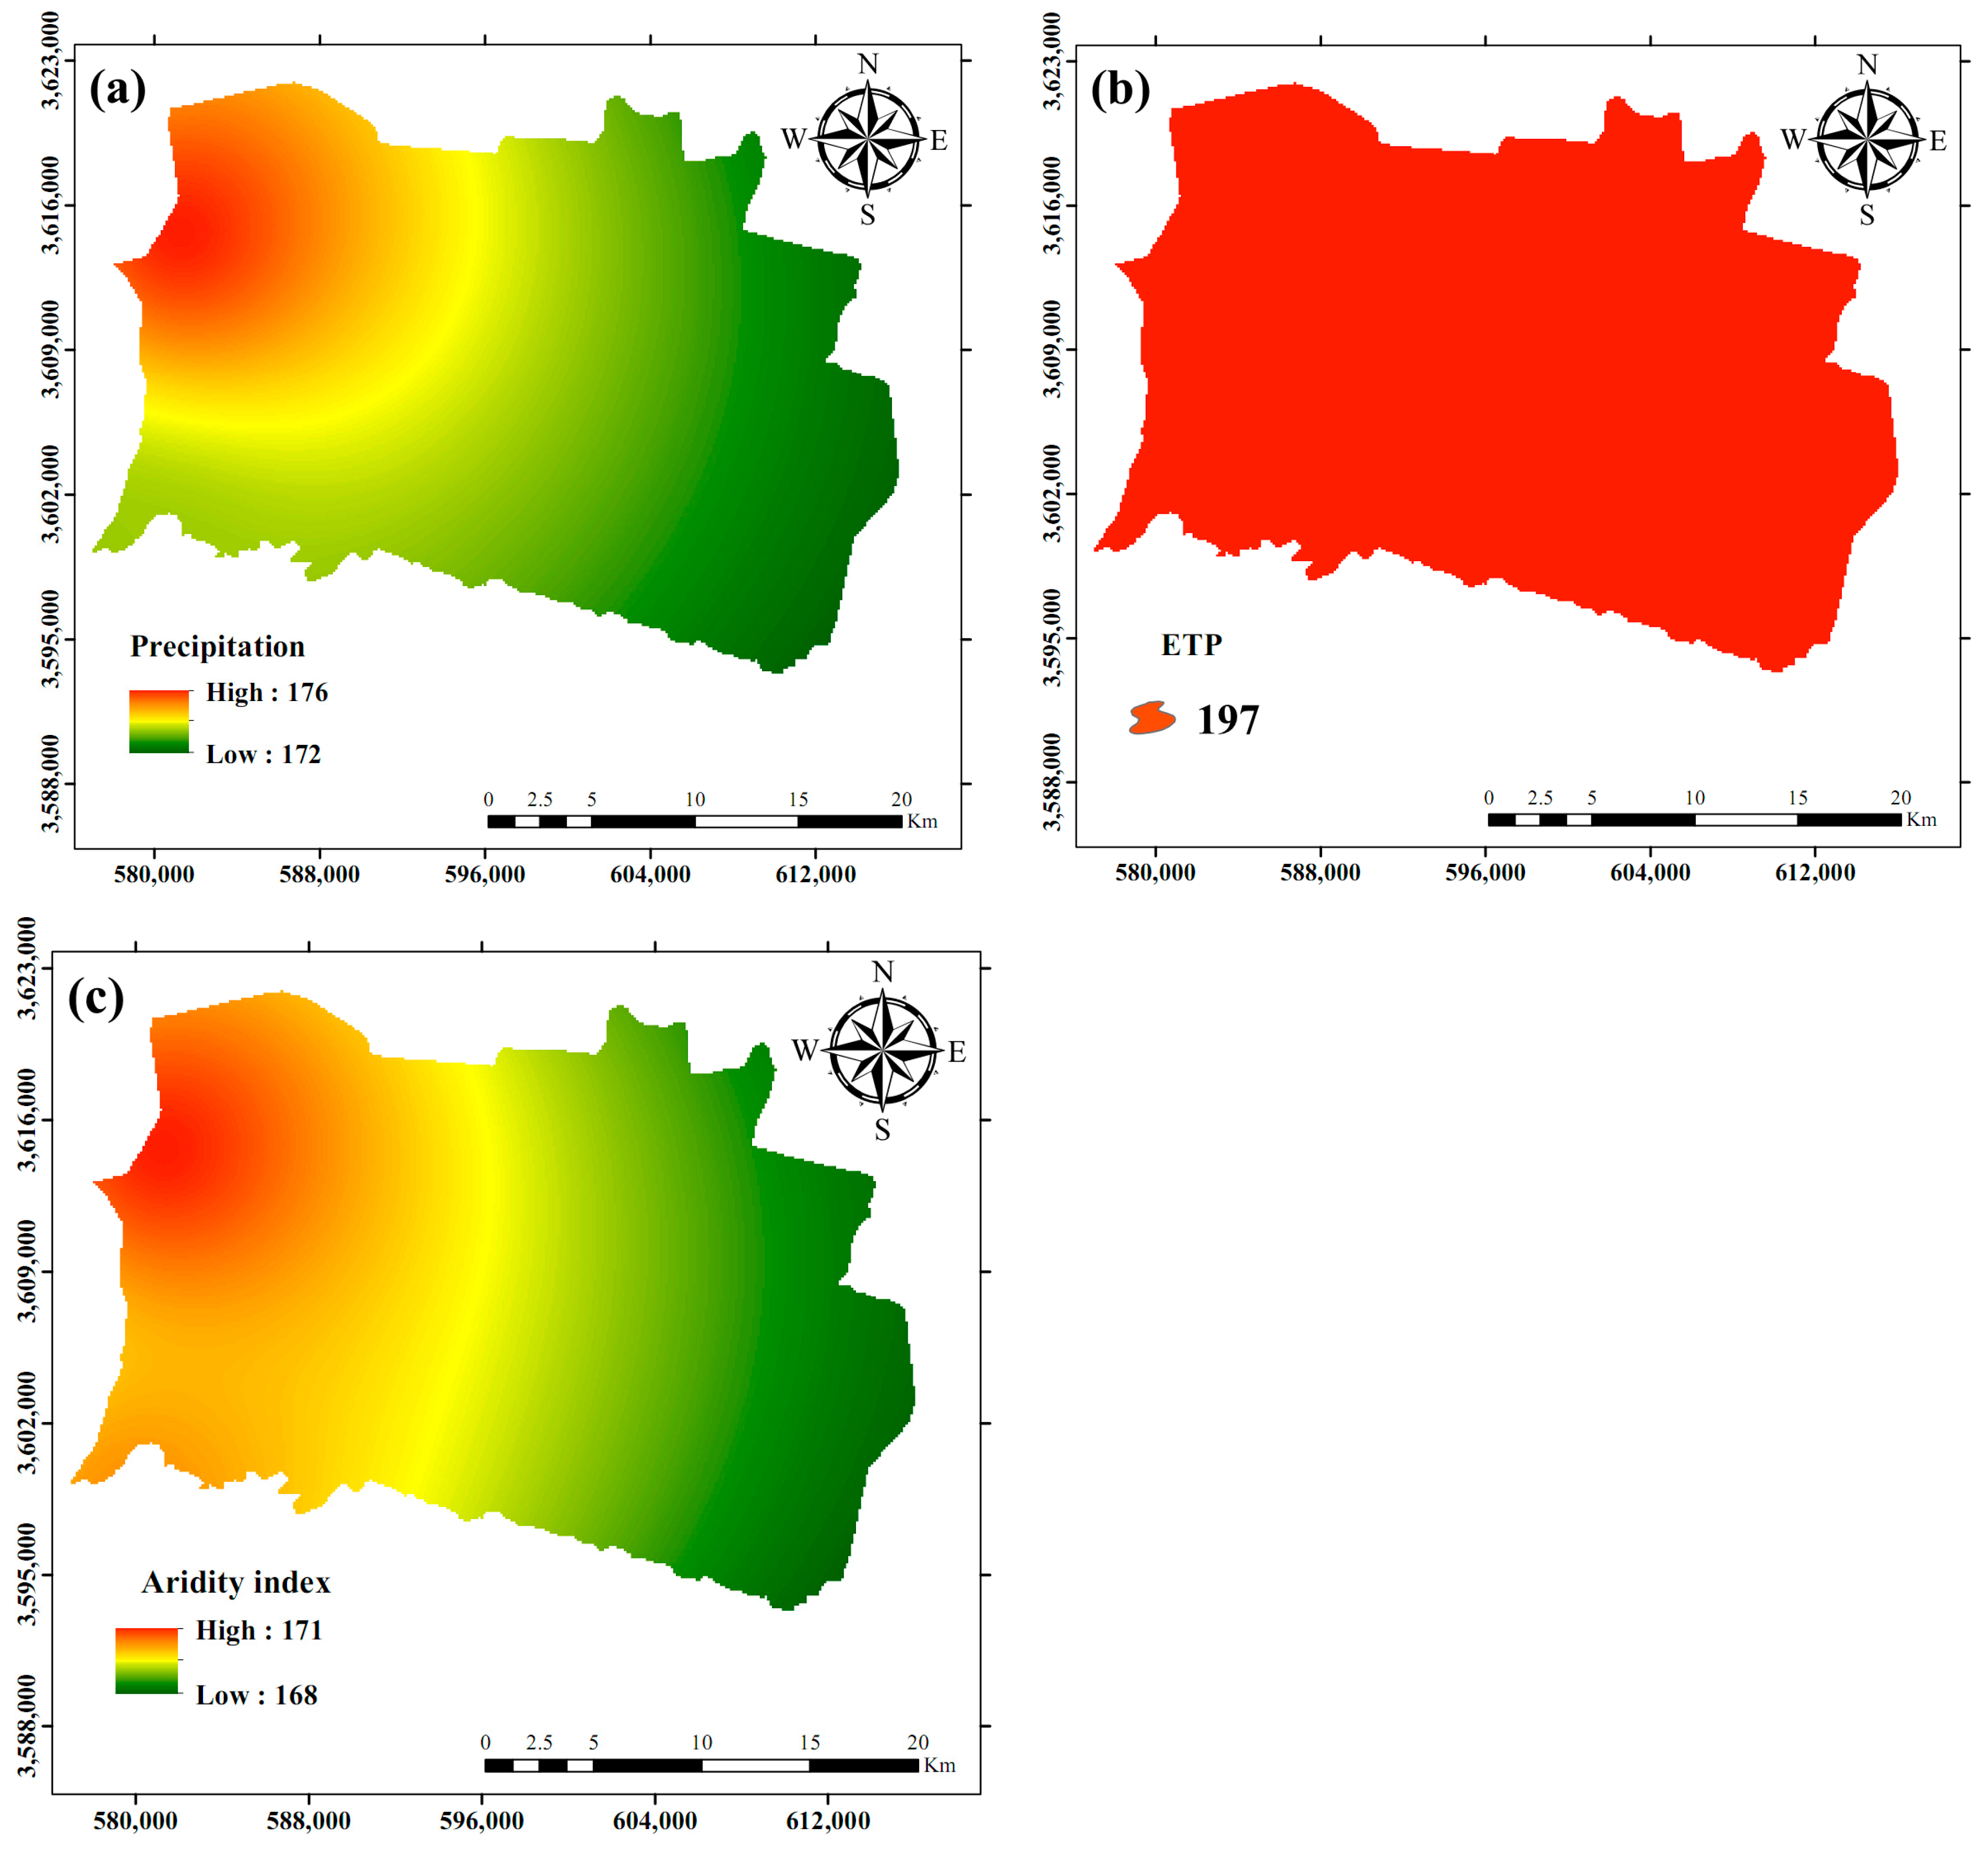
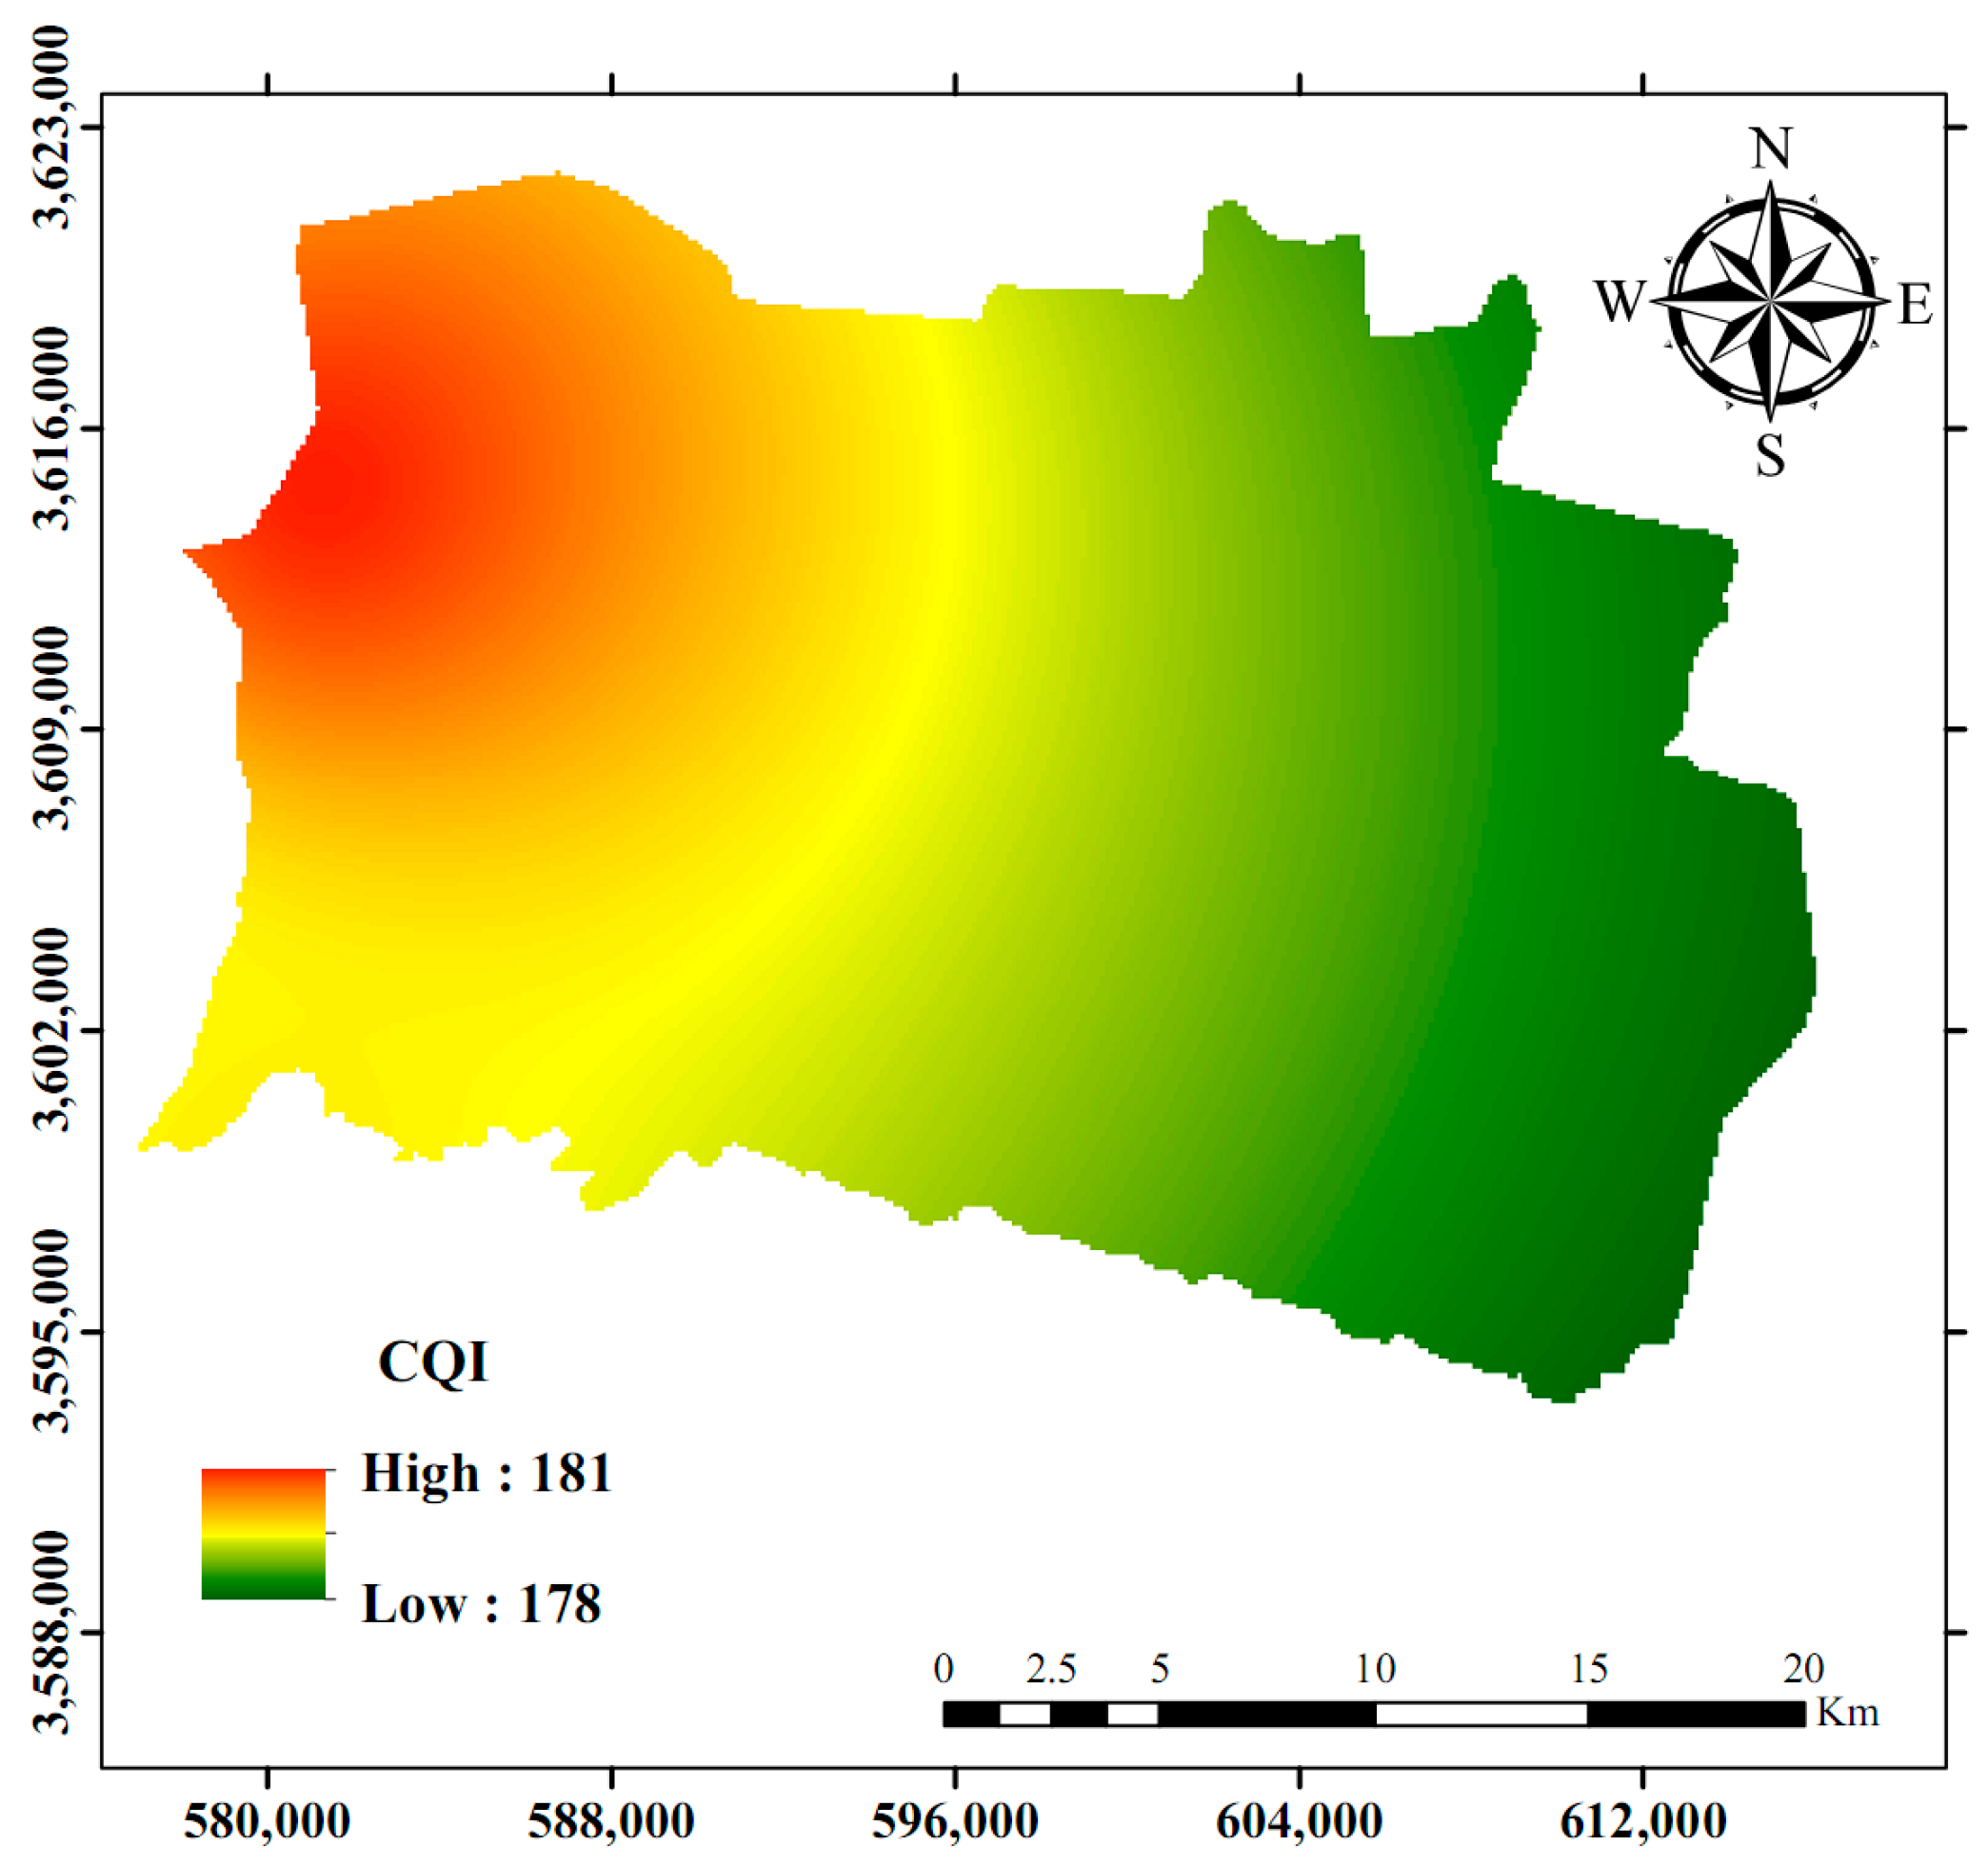
3.4. Climate Quality Index
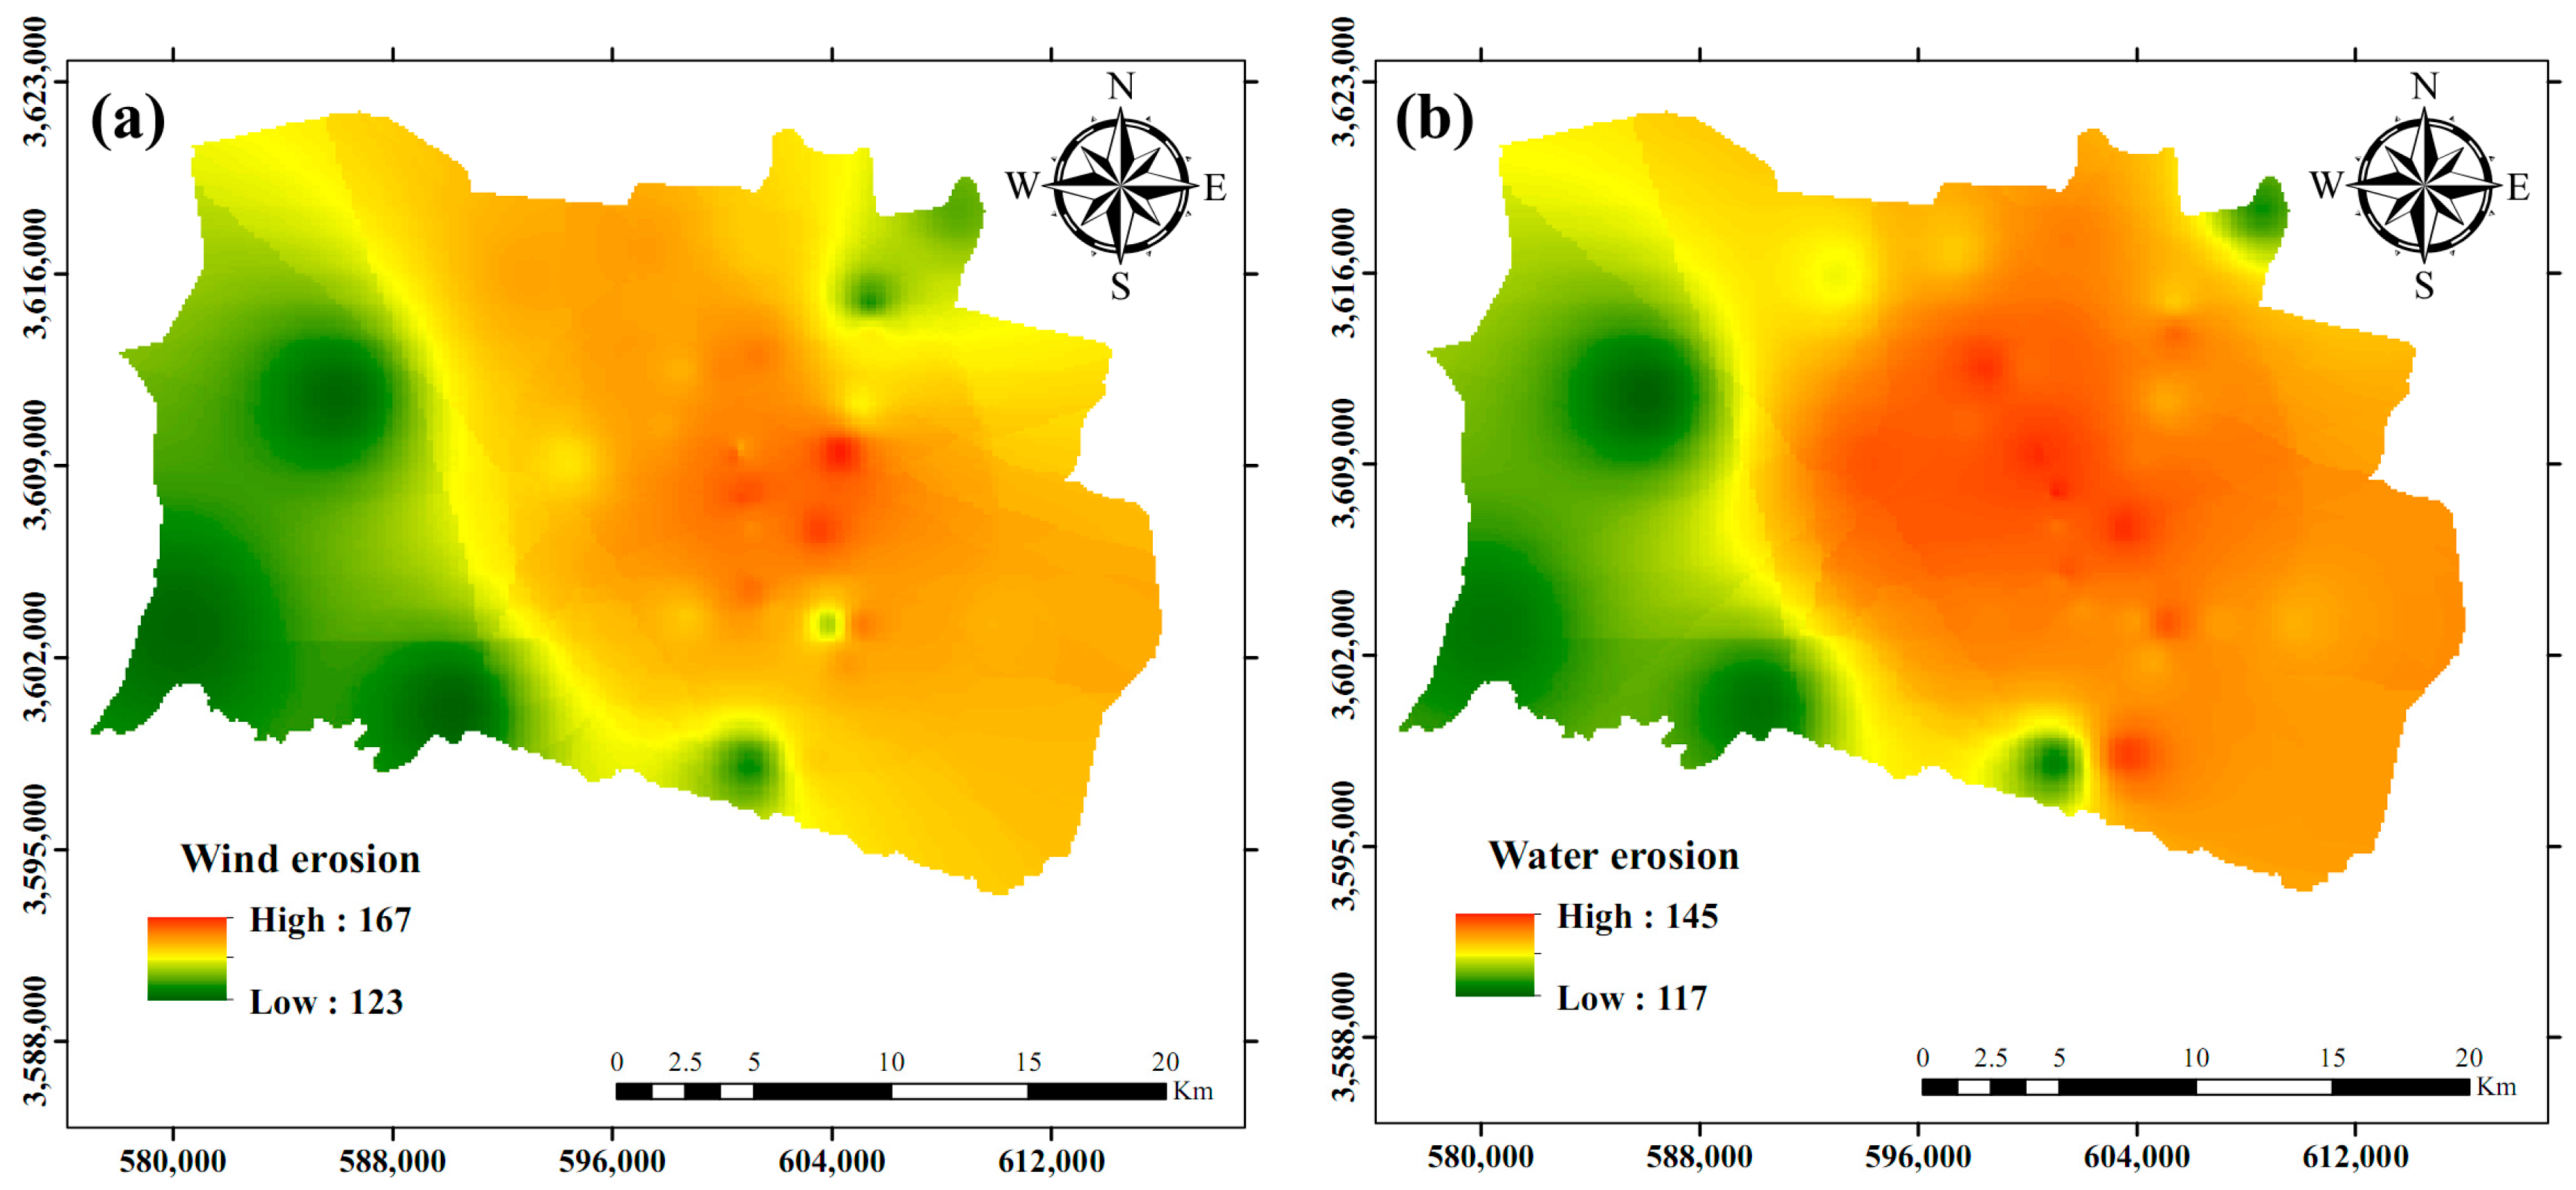
3.5. Erosion Quality Index
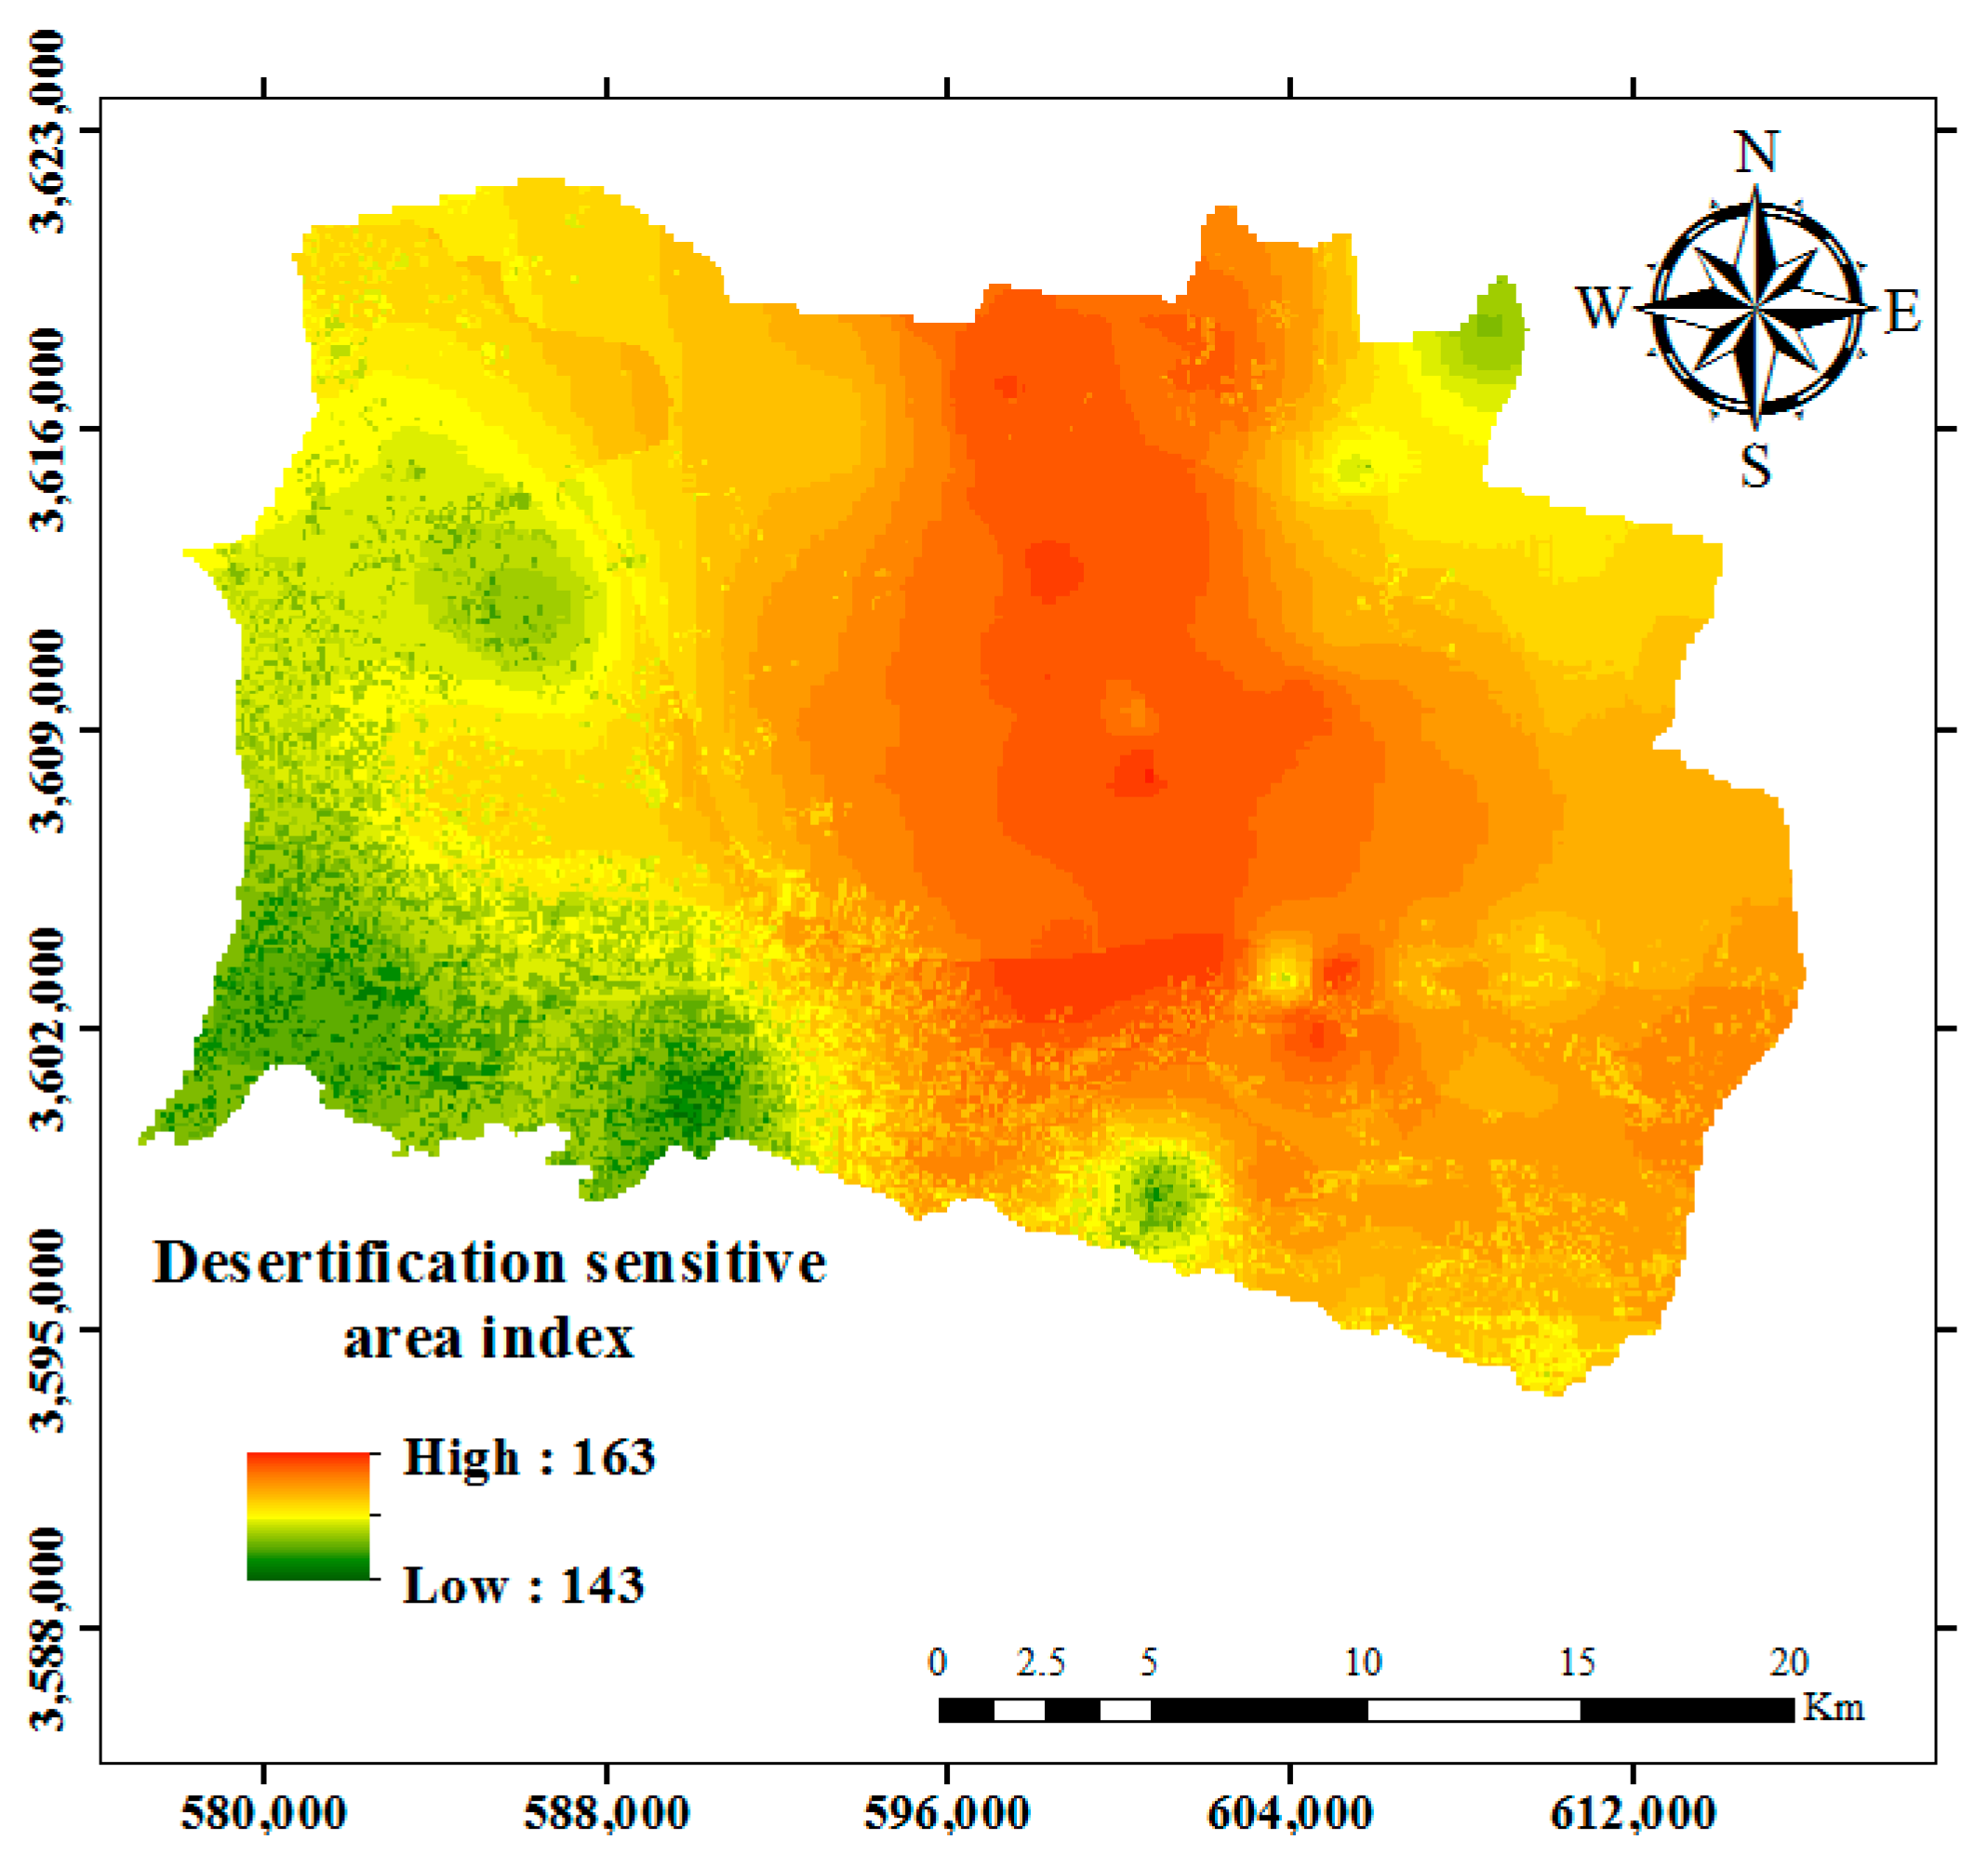
3.6. Environmentally Sensitive Areas to Desertification
4. Conclusions
Author Contributions
Funding
Institutional Review Board Statement
Informed Consent Statement
Data Availability Statement
Acknowledgments
Conflicts of Interest
References
- Uzuner, Ç.; Dengiz, O. Desertification risk assessment in Turkey based on environmentally sensitive areas. Ecol. Indic. 2020, 114, 106295. [Google Scholar] [CrossRef]
- Tlili, A.; Tarhouni, M.; Cerdà, A.; Louhaichi, M.; Neffati, M. Comparing yield and growth characteristics of four pastoral plant species under two salinity soil levels. Land Degrad. Dev. 2018, 29, 3104–3111. [Google Scholar] [CrossRef]
- Plaiklang, S.; Sutthivanich, I.; Sritarapipat, T.; Panurak, K.; Ogawa, S.; Charungthanakij, S.; Maneewan, U.; Thongrueang, N. Desertification assessment usinf MEDALUS model in upper Lamchiengkrai watershed, Thailand. ISPRS Int. Arch. Photogramm. Remote Sens. Spat. Inf. Sci. 2020, XLIII-B3-2020, 1257–1262. [Google Scholar] [CrossRef]
- Masoudi, M.; Jokar, P.; Pradhan, B. A new approach for land degradation and desertification assessment using geospatial techniques. Nat. Hazards Earth Syst. Sci. 2018, 18, 1133–1140. [Google Scholar] [CrossRef] [Green Version]
- De Pina Tavares, J.; Baptista, I.; Ferreira, A.J.D.; Amiotte-Suchet, P.; Coelho, C.; Gomes, S.; Amoros, R.; Dos Reis, E.A.; Mendes, A.F.; Costa, L.; et al. Assessment and mapping the sensitive areas to desertification in an insular Sahelian mountain region Case study of the Ribeira Seca Watershed, Santiago Island, Cabo Verde. Catena 2015, 128, 214–223. [Google Scholar] [CrossRef]
- Ranjbar, A.; Heydarnejad, S.; Mousavi, S.H.; Mirzaei, R. Mapping desertification potential using life cycle assessment method: A case study in Lorestan Province, Iran. J. Arid. Land 2019, 11, 652–663. [Google Scholar] [CrossRef] [Green Version]
- Akbari, M.; Shalamzari, M.J.; Memarian, H.; Gholami, A. Monitoring desertification processes using ecological indicators and providing management programs in arid regions of Iran. Ecol. Indic. 2020, 111, 106011. [Google Scholar] [CrossRef]
- Okin, G.S.; D’Odorico, P.; Liu, J. A mechanism of land degradation in Turf-Mantled slopes of the Tibetan plateau. Geophys. Res. Lett. 2018, 45, 4041–4048. [Google Scholar] [CrossRef] [Green Version]
- Nkonya, E.; Mirzabaev, A.; von Braun, J. Economics of land degradation and improvement: An introduction and overview. In Economics of Land Degradation and Improvement—A Global Assessment for Sustainable Development; Springer International Publishing: Cham, Switzerland, 2016; pp. 1–14. [Google Scholar]
- Lamqadem, A.A.; Pradhan, B.; Saber, H.; Rahimi, A. Desertification sensitivity analysis using MEDALUS Model and GIS: A case study of the oases of Middle Draa Valley, Morocco. Sensors 2018, 18, 2230. [Google Scholar] [CrossRef] [Green Version]
- Forest, Range, and Watershed Management Organization (FRW). National Action Program for Combating Desertification and Mitigation of Drought Impacts; FRW: Tehran, Iran, 2016.
- Prăvălie, R.; Patriche, C.; Săvulescu, I.; Sirodoev, I.; Bandoc, G.; Sfîcă, L. Spatial assessment of land sensitivity to degradation across Romania. A quantitative approach based on the modified MEDALUS methodology. Catena 2020, 187, 104407. [Google Scholar] [CrossRef]
- Liu, Q.; Liu, G.; Huang, C. Monitoring desertification processes in Mongolian Plateau using MODIS tasseled cap transformation and TGSI time series. J. Arid. Land 2018, 10, 12–26. [Google Scholar] [CrossRef] [Green Version]
- Kairis, O.; Karavitis, C.; Salvati, L.; Kounalaki, A.; Kosmas, K. Exploring the impact of overgrazing on soil erosion and land degradation in a dry mediterranean agro-forest landscape (Crete, Greece). Arid. Land Res. Manag. 2015, 29, 360–374. [Google Scholar] [CrossRef]
- Prăvălie, R.; Patriche, C.V.; Bandoc, G. Quantification of land degradation sensitivity areas in Southern and Central Southeastern Europe. New results based on improving DISMED methodology with new climate data. Catena 2017, 158, 309–320. [Google Scholar] [CrossRef]
- Kamali Maskooni, E.; Kamali, M.A.; Amiri, I.; Zare, M.; Saidi Goraghani, K. Study of desertification status using IMDPAModel with emphasis on water, soil and vegetation criteria (case study: Faryab-Kerman Province). J. Biol. Forum 2015, 7, 1149–1155. [Google Scholar]
- Castanho, R.A.; Gomez, J.N.; Vulevic, A.; Couto, G. The land-use change dynamics based on the CORINE Data in the period 1990–2018 in the European archipelagos of the Macaronesia Region: Azores, Canary Islands, and Madeira. ISPRS Int. J. Geo-Inf. 2021, 10, 342. [Google Scholar] [CrossRef]
- Christian, B.A.; Dhinwa, P.S.; Ajai, P. Long term monitoring and assessment of desertification processes using medium and high resolution satellite data. Appl. Geogr. 2018, 97, 10–24. [Google Scholar] [CrossRef]
- Li, Q.; Zhang, C.; Shen, Y.; Jia, W.; Li, J. Quantitative assessment of the relative roles of climate change and human activities in desertification processes on the Qinghai-Tibet Plateau based on net primary productivity. Catena 2016, 147, 789–796. [Google Scholar] [CrossRef]
- Zhou, W.; Gang, C.; Zhou, F.; Li, J.; Dong, X.; Zhao, C. Quantitative assessment of the individual contribution of climate and human factors to desertification in northwest China using net primary productivity as an indicator. Ecol. Indic. 2015, 48, 560–569. [Google Scholar] [CrossRef]
- Lamchin, M.; Lee, J.-Y.; Lee, W.-K.; Lee, E.J.; Kim, M.; Lim, C.-H.; Choi, H.-A.; Kim, S.-R. Assessment of land cover change and desertification using remote sensing technology in a local region of Mongolia. Adv. Space Res. 2016, 57, 64–77. [Google Scholar] [CrossRef]
- Santini, M.; Caccamo, G.; Laurenti, A.; Noce, S.; Valentini, R. A multi-component GIS framework for desertification risk assessment by an integrated index. Appl. Geogr. 2010, 30, 394–415. [Google Scholar] [CrossRef]
- Dutta, S.; Chaudhuri, G. Evaluating Environmental sensitivity of arid and semiarid regions in northeastern Rajasthan, India. Geogr. Rev. 2015, 105, 441–461. [Google Scholar] [CrossRef]
- Gad, A.; Lotfy, I. Use of remote sensing and GIS in mapping the environmental sensitivity areas for desertification of Egyptian territory. eEarth Discuss. 2008, 3, 41–85. [Google Scholar] [CrossRef] [Green Version]
- Hadeel, A.S.; Jabbar, M.T.; Chen, X. Application of remote sensing and GIS in the study of environmental sensitivity to desertification: A case study in Basrah Province, southern part of Iraq. Appl. Geomat. 2010, 2, 101–112. [Google Scholar] [CrossRef] [Green Version]
- Kosmas, C.; Ferrara, A.; Briassouli, H.; Imeson, A. The Medalus project Mediterranean desertification and land use. Manual on key indicators of desertification and mapping environmentally sensitive areas to desertification. In Desertification in the Mediterranean Region. A Security Issue; Kluwer Academic Publishers: Dordrecht, The Netherlands, 1999; pp. 525–547. [Google Scholar]
- Bedoui, C. Study of desertification sensitivity in Talh region (Central Tunisia) using remote sensing, G.I.S. and the M.E.D.A.L.U.S. approach. Geoenviron. Disasters 2020, 7, 16. [Google Scholar] [CrossRef]
- Ferrara, A.; Kosmas, C.; Salvati, L.; Padula, A.; Mancino, G.; Nolè, A. Updating the MEDALUS-ESA framework for worldwide land degradation and desertification assessment. Land Degrad. Dev. 2020, 31, 1593–1607. [Google Scholar] [CrossRef]
- Jiang, L.; Bao, A.; Jiapaer, G.; Guo, H.; Zheng, G.; Gafforov, K.; Kurban, A.; De Maeyer, P. Monitoring land sensitivity to desertification in Central Asia: Convergence or divergence? Sci. Total Environ. 2019, 658, 669–683. [Google Scholar] [CrossRef]
- Momirović, N.; Kadović, R.; Perović, V.; Marjanovic, M.; Baumgertel, A. Spatial assessment of the areas sensitive to degradation in the rural area of the municipality Čukarica. Int. Soil Water Conserv. Res. 2019, 7, 71–80. [Google Scholar] [CrossRef]
- Taghipour-Javi, S.; Fazeli, A.; Kazemi, B. A case study of desertification hazard mapping using the MEDALUS (ESAs) methodology in southwest Iran. J. Nat. Resour. Dev. 2016, 6, 1–8. [Google Scholar] [CrossRef]
- Capozzi, F.; Di Palma, A.; De Paola, F.; Giugni, M.; Iavazzo, P.; Topa, M.E.; Adamo, P.; Giordano, S. Assessing desertification in sub-Saharan peri-urban areas: Case study applications in Burkina Faso and Senegal. J. Geochem. Explor. 2018, 190, 281–291. [Google Scholar] [CrossRef]
- Sepehr, A.; Hassanli, A.M.; Ekhtesasi, M.R.; Jamali, J.B. Quantitative assessment of desertification in south of Iran using MEDALUS method. Environ. Monit. Assess. 2007, 134, 243–254. [Google Scholar] [CrossRef]
- Ladisa, G.; Todorovic, M.; Liuzzi, G.T. A GIS-based approach for desertification risk assessment in Apulia region, SE Italy. Phys. Chem. Earth Parts A/B/C 2012, 49, 103–113. [Google Scholar] [CrossRef]
- Vieira, R.M.S.P.; Tomasella, J.; Alvalá, R.C.S.; Sestini, M.F.; Affonso, A.G.; Rodriguez, D.A.; Barbosa, A.A.; Cunha, A.P.M.A.; Valles, G.F.; Crepani, E.; et al. Identifying areas susceptible to desertification in the Brazilian northeast. Solid Earth 2015, 6, 347–360. [Google Scholar] [CrossRef] [Green Version]
- Lahlaoi, H.; Rhinane, H.; Hilali, A.; Lahssini, S.; Moukrim, S. Desertification assessment using MEDALUS model in watershed Oued El Maleh, Morocco. Geosciences 2017, 7, 50. [Google Scholar] [CrossRef] [Green Version]
- Karamesouti, M.; Panagos, P.; Kosmas, C. Model-based spatio-temporal analysis of land desertification risk in Greece. Catena 2018, 167, 266–275. [Google Scholar] [CrossRef]
- Khanamani, A.; Fathizad, H.; Karimi, H.; Shojaei, S. Assessing desertification by using soil indices. Arab. J. Geosci. 2017, 10, 287. [Google Scholar] [CrossRef]
- Prăvălie, R.; Săvulescu, I.; Patriche, C.; Dumitraşcu, M.; Bandoc, G. Spatial assessment of land degradation sensitive areas in southwestern Romania using modified MEDALUS method. Catena 2017, 153, 114–130. [Google Scholar] [CrossRef]
- Shokr, M.S.; Abdellatif, M.A.; El Baroudy, A.A.; Elnashar, A.; Ali, E.F.; Belal, A.A.; Attia, W.; Ahmed, M.; Aldosari, A.A.; Szantoi, Z.; et al. Development of a spatial model for soil quality assessment under arid and semi-arid conditions. Sustainability 2021, 13, 2893. [Google Scholar] [CrossRef]
- Emam, A.R.; Kappas, M.; Akhavan, S.; Hosseini, S.Z.; Abbaspour, K.C. Estimation of groundwater recharge and its relation to land degradation: Case study of a semi-arid river basin in Iran. Environ. Earth Sci. 2015, 74, 6791–6803. [Google Scholar] [CrossRef]
- Nyssen, J.; Poesen, J.; Deckers, J. Land degradation and soil and water conservation in tropical highlands. Soil Tillage Res. 2009, 103, 197–202. [Google Scholar] [CrossRef]
- Lee, E.J.; Piao, D.; Song, C.; Kim, J.; Lim, C.-H.; Kim, E.; Moon, J.; Kafatos, M.; Lamchin, M.; Jeon, S.W.; et al. Assessing environmentally sensitive land to desertification using MEDALUS method in Mongolia. For. Sci. Technol. 2019, 15, 210–220. [Google Scholar] [CrossRef] [Green Version]
- Zhu, L.; Meng, J. Study on rainfall variations in the middle part of Inner Mongolia, China during the past 43 years. Environ. Earth Sci. 2010, 60, 1661–1671. [Google Scholar] [CrossRef]
- Saleh, A.; Belal, A.; Jalhoum, M. Quantitative assessment of environmental sensitivity to desertification in Sidi Abdel-Rahman area, Northern West Coast of Egypt. Egypt. J. Soil Sci. 2018, 58. [Google Scholar] [CrossRef] [Green Version]
- Sardo, I.K.; Besalatpour, A.; Bashari, H.; Shirani, H.; Broujeni, I.E. Assessment of IRIFR model capability in simulation of soil loss in different wind geomorphology landforms using wind erosion meter. Arid. Biome 2017, 7, 13–25. [Google Scholar] [CrossRef]
- PSIAC. Factors Affecting Sediment Yield in the Pacific Southwest Area and Selection and Evaluation of Measures for Reduction of Erosion and Sediment Yield; Report No. HY12; Water Management Subcommittee on ASCE: Washington, DC, USA, 1969. [Google Scholar]
- Wijitkosum, S. Factor influencing land degradation sensitivity and desertification in a drought prone watershed in Thailand. Int. Soil Water Conserv. Res. 2021, 9, 217–228. [Google Scholar] [CrossRef]
- Djeddaoui, F.; Chadli, M.; Gloaguen, R. Desertification susceptibility mapping using logistic regression analysis in the Djelfa Area, Algeria. Remote Sens. 2017, 9, 1031. [Google Scholar] [CrossRef] [Green Version]
- Jabbar, M.; Chen, X. Land degradation due to salinization in arid and semi-arid regions with the aid of geo-information techniques. Geo-Spat. Inf. Sci. 2008, 11, 112–120. [Google Scholar] [CrossRef]
- Kadović, R.; Bohajar, Y.A.M.; Perović, V.; Simić, S.B.; Todosijević, M.; Tošić, S.; Anđelić, M.; Mlađan, D.; Dovezenski, U. Land sensitivity analysis of degradation using MEDALUS model: Case study of Deliblato Sands, Serbia. Arch. Environ. Prot. 2016, 42, 114–124. [Google Scholar] [CrossRef]


| Indices | Class of Quality | Range |
|---|---|---|
| Quality indices (SQI, GWQI, VQI, CQI, and EQI) | Very low | 100–115 |
| Low | 115–130 | |
| Moderate | 130–145 | |
| High | 145–160 | |
| Very high | 160–200 |
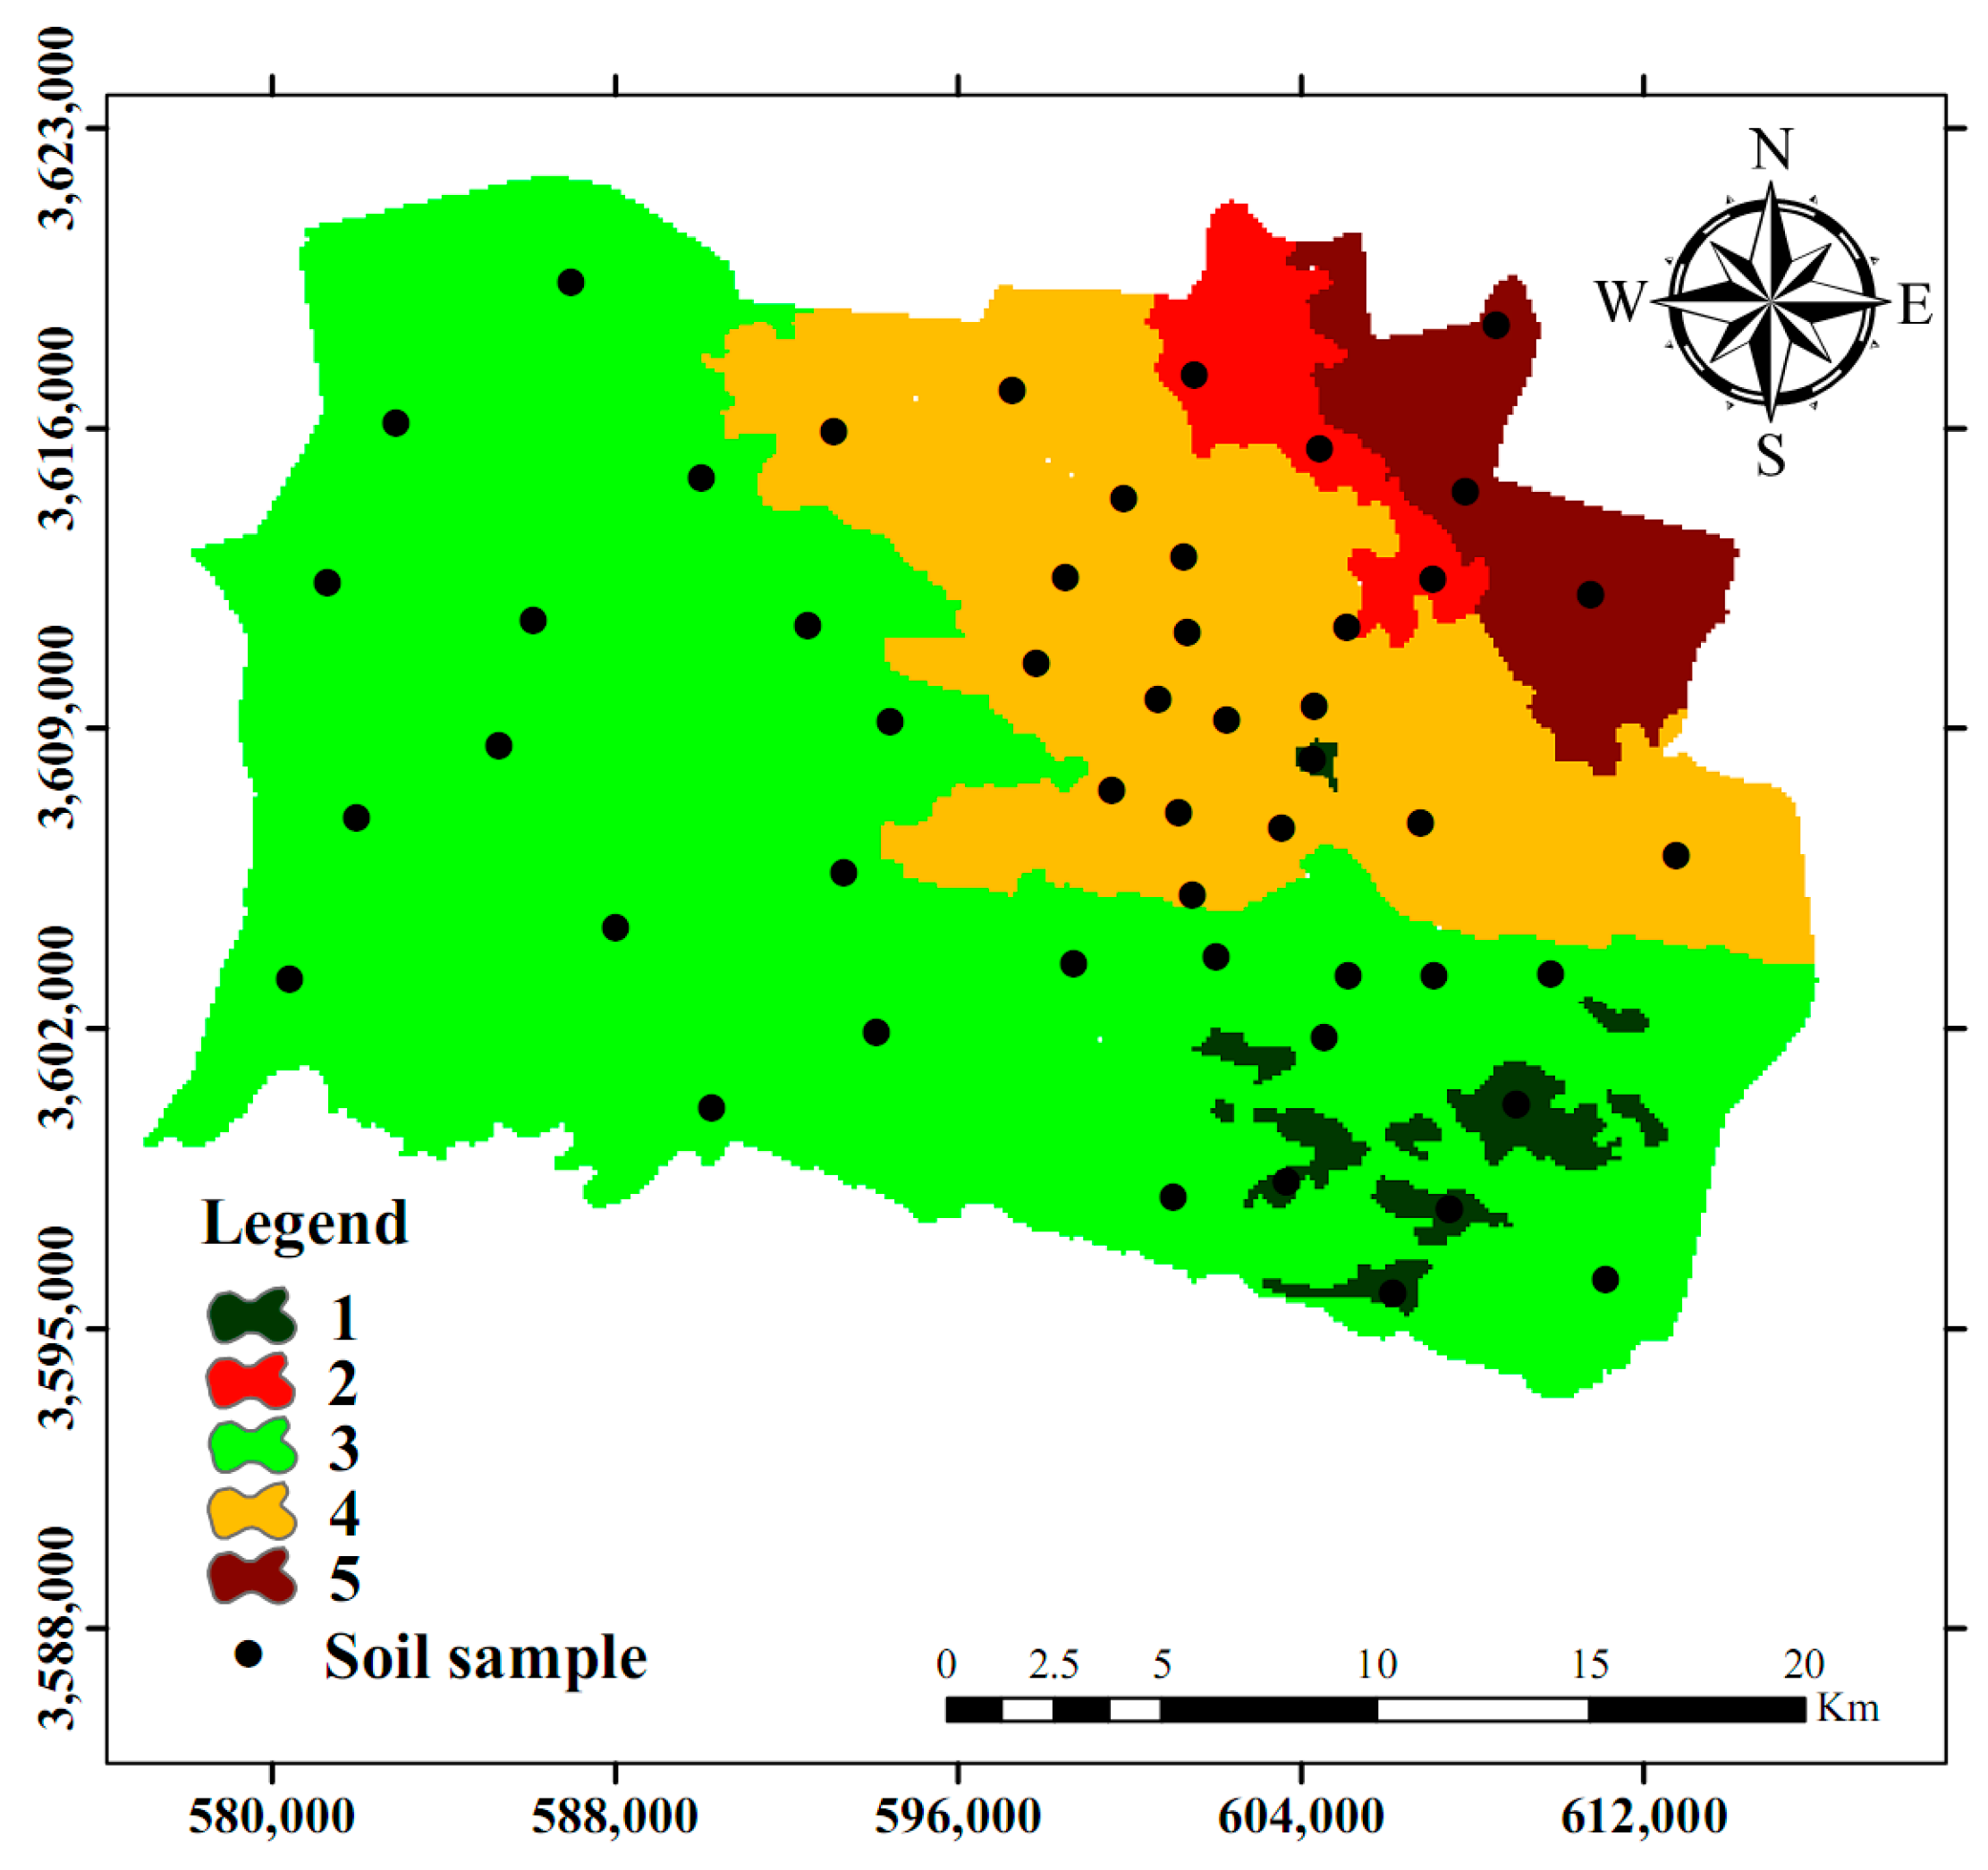
| Characteristics | Name | No. |
|---|---|---|
| Physiographical features are related to Quaternary Period. The process of water erosion has made them worn and their remains appear as complications. | High plateaus and terraces | 1 |
| Flat plains have been created due to accumulation of fine sediments transported from the foot of mountains. | Piedmont alluvial plains | 2 |
| The river creates this unit during overflows. | River alluvial plains | 3 |
| Low or concave slopes are located in the center of the intermountain plains. | Lowlands | 4 |
| Foothill slopes. Coarse and fine sediments are transferred to these lands by streams from the catchment area. | Gravelly alluvial fans | 5 |
| Index | Class | Explain | Weight | Index | Class | Range | Weight |
|---|---|---|---|---|---|---|---|
| Na+ (meq/L) | Low | <1000 | 100–125 | HCO3− (meq/L) | Low | <15 | 100–125 |
| Moderate | 1000–5000 | 125–150 | Moderate | 15–20 | 125–150 | ||
| High | 5000–8000 | 150–175 | High | 20–25 | 150–175 | ||
| Very high | >8000 | 175–200 | Very high | >25 | 175–200 | ||
| EC (ds/m) | Very low | <10 | 100–120 | Cl− (meq/L) | Very low | <100 | 100–120 |
| Low | 10–50 | 120–140 | Low | 100–1000 | 120–140 | ||
| Moderate | 50–100 | 140–160 | Moderate | 1000–2000 | 140–160 | ||
| High | 100–150 | 160–180 | High | 2000–2500 | 160–180 | ||
| Very high | >150 | 180–200 | Very high | >2500 | 180–200 | ||
| Texture | Low | Loam, silt | 100–125 | Gypsum (%) | Low | 0–5 | 100–125 |
| Moderate | Clay, fine sand | 125–150 | Moderate | 5–10 | 125–150 | ||
| High | Fine, coarse sand | 150–175 | High | 10–15 | 150–175 | ||
| Very high | Very coarse sand | 175–200 | Very high | >15 | 175–200 | ||
| SAR | Very low | <50 | 100–120 | Organic Matter (%) | Very high | 0.2 | 100–120 |
| Low | 50–500 | 120–140 | High | 0.2–0.5 | 120–140 | ||
| Moderate | 500–1000 | 140–160 | Moderate | 0.5–1 | 140–160 | ||
| High | 1000–1500 | 160–180 | Low | 1–1.5 | 160–180 | ||
| Very high | >1500 | 180–200 | Very low | 1.5–2 | 180–200 | ||
| pH | Low | <50 | 100–133 | ||||
| Moderate | 50–500 | 133–166 | |||||
| High | 500–1000 | 166–200 | |||||
| Index | Class | Range | Weight | Index | Class | Range | Weight |
|---|---|---|---|---|---|---|---|
| SAR | Low | <10 | 100–125 | EC (µs/cm) | Low | <250 | 100–125 |
| Moderate | 10–18 | 125–150 | Moderate | 250–750 | 125–150 | ||
| High | 18–26 | 150–175 | High | 750–2250 | 150–175 | ||
| Very high | >26 | 175–200 | Very high | >2250 | 175–200 | ||
| Cl− (meq/L) | Low | <4 | 100–133 | TDS (mg/L) | Low | <450 | 100–133 |
| Moderate | 4–10 | 133–166 | Moderate | 450–2000 | 133–166 | ||
| High | >10 | 166–200 | High | >2000 | 166–200 | ||
| pH | Low | <6.5 | 100–133 | ||||
| Moderate | 6.5–8.4 | 133–166 | |||||
| High | >8.4 | 166–200 | |||||
| Index | Class | Range | Weight |
|---|---|---|---|
| Drought resistance | Low | Gardens and evergreen areas | 100–125 |
| Moderate | Continual grasslands | 125–150 | |
| High | Annual agriculture | 150–175 | |
| Very high | Bare land | 175–200 | |
| Fire risk | Low | Bare land | 100–133 |
| Moderate | Annual agriculture and continual grassland | 133–166 | |
| High | Gardens and evergreen areas | 166–200 | |
| Plant cover (NDVI) | Low | >0.95 | 100–125 |
| Moderate | 0.95–0.65 | 125–150 | |
| High | 0.65–0.35 | 150–175 | |
| Very high | <0.35 | 175–200 |
| Index | Class | Range | Weight |
|---|---|---|---|
| Precipitation (mm/year) | Low | >300 | 100–133 |
| Moderate | 150–300 | 133–166 | |
| High | <150 | 166–200 | |
| Potential evapotranspiration (mm/year) | Low | <1500 | 100–133 |
| Moderate | 1500–2000 | 133–166 | |
| High | >2000 | 166–200 | |
| Aridity index (AI) | Low | >10 | 100–133 |
| Moderate | 5–10 | 133–166 | |
| High | <5 | 166–200 |
| Index | Class | Range | Weight |
|---|---|---|---|
| Wind erosion (ton/km2/year) | Very low | <250 | 100–120 |
| Low | 250–500 | 120–140 | |
| Moderate | 500–1500 | 140–160 | |
| High | 1500–6000 | 160–180 | |
| Very high | >6000 | 180–200 | |
| Water erosion (ton/km2/year) | Very low | <200 | 100–120 |
| Low | 200–500 | 120–140 | |
| Moderate | 500–1500 | 140–160 | |
| High | 1500–2500 | 160–180 | |
| Very high | >2500 | 180–200 |
| Indicator | Number | Minimum | Maximum | Mean | C.V. |
|---|---|---|---|---|---|
| pH | 50 | 7.4 | 8.9 | 8 | 0.3 |
| EC (ds/m) | 50 | 2.5 | 174.7 | 62.6 | 53.7 |
| Texture | 50 | 108 | 167 | 124.9 | 19.1 |
| Gypsum (%) | 50 | 1.2 | 16.5 | 9.9 | 4.4 |
| OM (%) | 50 | 0 | 14.6 | 0.5 | 0.4 |
| Cl− (meq/L) | 50 | 17.5 | 2766 | 956.2 | 877.9 |
| Na+ (meq/L) | 50 | 4 | 10,945.5 | 3017.5 | 3114.2 |
| HCO3− (meq/L) | 50 | 5 | 30 | 17.5 | 5.3 |
| SAR | 50 | 0.3 | 2688.2 | 652.8 | 783.6 |
| Indicator | Number | Minimum | Maximum | Mean | C.V. |
|---|---|---|---|---|---|
| pH | 17 | 7.1 | 8 | 7.5 | 0.3 |
| EC (µs/cm) | 17 | 1465 | 12,648 | 4752 | 2712 |
| Cl− (meq/L) | 17 | 4.9 | 84 | 32.6 | 21.5 |
| TDS (mg/L) | 17 | 1025 | 8853 | 3290 | 1903 |
| SAR | 17 | 3.46 | 17.77 | 8.33 | 3.9 |
| Class | DSI | Sensitivity Area to Desertification |
|---|---|---|
| 1 | 100–122 | Low |
| 2 | 123–137 | Moderate |
| 3 | 138–153 | High |
| 4 | 154–200 | Very high |
Publisher’s Note: MDPI stays neutral with regard to jurisdictional claims in published maps and institutional affiliations. |
© 2021 by the authors. Licensee MDPI, Basel, Switzerland. This article is an open access article distributed under the terms and conditions of the Creative Commons Attribution (CC BY) license (https://creativecommons.org/licenses/by/4.0/).
Share and Cite
Afzali, S.F.; Khanamani, A.; Maskooni, E.K.; Berndtsson, R. Quantitative Assessment of Environmental Sensitivity to Desertification Using the Modified MEDALUS Model in a Semiarid Area. Sustainability 2021, 13, 7817. https://0-doi-org.brum.beds.ac.uk/10.3390/su13147817
Afzali SF, Khanamani A, Maskooni EK, Berndtsson R. Quantitative Assessment of Environmental Sensitivity to Desertification Using the Modified MEDALUS Model in a Semiarid Area. Sustainability. 2021; 13(14):7817. https://0-doi-org.brum.beds.ac.uk/10.3390/su13147817
Chicago/Turabian StyleAfzali, Sayed Fakhreddin, Ali Khanamani, Ehsan Kamali Maskooni, and Ronny Berndtsson. 2021. "Quantitative Assessment of Environmental Sensitivity to Desertification Using the Modified MEDALUS Model in a Semiarid Area" Sustainability 13, no. 14: 7817. https://0-doi-org.brum.beds.ac.uk/10.3390/su13147817