
Digital Economy and Environmental Quality: Evidence from 217 Cities in China


1
Research Center of the Central China for Economic and Social Development, Nanchang University, Nanchang 330031, China
2
School of Economics and Management, Nanchang University, Nanchang 330031, China
*
Author to whom correspondence should be addressed.
Sustainability 2021, 13(14), 8058; https://0-doi-org.brum.beds.ac.uk/10.3390/su13148058
Submission received: 11 June 2021
/
Revised: 13 July 2021
/
Accepted: 15 July 2021
/
Published: 19 July 2021
(This article belongs to the Special Issue Digitalization, Innovation and Sustainability)
Abstract
:With the rapid development of the digital economy, understanding the relationship between the digital economy and the environment is increasingly important for sustainable development. This study mainly studies the nexus of digital economy development and environmental quality for 217 cities in China from 2003 to 2018. Specifically, this study first evaluates the degree of coupling coordination between the digital economy system and the environmental system. Results show that the coupling coordination degree between the digital economy system and the environmental system shows a fluctuating rise from 2003 to 2018. Furthermore, this study empirically investigates the impact of digital economy development on PM2.5, which represents environmental quality, and results show that digital economy development significantly reduces PM2.5. The above finding is still valid by using the quasi-natural experiment of broadband China for the robustness test. Urbanization, population density, and economic development have caused threshold effects. When the urbanization rate and population density exceed a certain threshold, the digital economy significantly inhibits PM2.5. In contrast, when the per capita GDP exceeds a certain threshold, the digital economy significantly promotes PM2.5. The digital economy mainly affects pollutant emissions through direct and technological effects.
1. Introduction
The global economy and society are in the accelerated digital transformation process, and digital technologies have shifted from the stage of knowledge popularization to the stage of cross-border integration. The digital economy has produced substantial economic benefits and has increasingly become a new driving force for economic growth. Similarly, the digital transformation of the economy and society has a profound impact on environmental sustainability. For example, industrial activities are the largest source of pollution generation and discharge, and industrial digitalization has gradually become a new way for the sustainable development of the industrial economy [1,2,3]. Furthermore, the digital economy may also lead to more energy consumption and potentially more pollution, adversely affecting the environment. Digital technologies have also been widely used in environmental governance, which helps to reduce pollution emissions. Therefore, clarifying the relationship between the digital economy and environmental quality, and understanding how the digital economy system improves the environmental system are necessary.
As the most active field in China’s economic development, the digital economy continues to expand in the breadth and depth of integration with various economic and social fields and plays a vital role in stimulating consumption, stimulating investment, and creating employment [4,5]. From a domestic perspective, relevant data from the China Academy of Information and Communications Technology show that the scale of the digital economy was 22.4 trillion CNY in 2016 and 35.8 trillion CNY in 2019, accounting for 36.2% of the GDP (Gross Domestic Product) in 2019. The nominal growth rate was 15.6%, much higher than the GDP growth rate. From an international perspective, the 2019 Digital Economy Report issued by the United Nations Conference on Trade and Development pointed out that the United States and China are becoming the main leaders in this field. They account for 90% of the market value of the 70 largest digital platforms in the world. The rapid development of China’s digital economy has also changed all aspects of the economy and society, including the environmental system.
Meanwhile, environmental pollution, such as haze and airborne particulates, remains one of China’s most widely discussed environmental topics [6,7]. According to the Communiqué on the State of China’s Ecological Environment in 2018, the percentage of air quality exceeding standards in major cities reached 64.2% in 2018. The 2018 Global Environmental Performance Index scores and rankings of 180 countries and regions show that China has a comprehensive score of 50.74, ranking 120th overall and ranking 177th in air quality. Environmental pollution caused by energy consumption is an important factor restricting the sustainable development of China’s economy and has brought huge economic losses to China [8]. Highlighted by the World Health Organization, haze pollution significantly reduces the per capita GDP, damages the quality of economic development, and directly causes a greater threat to physical health, traffic safety, and climate change [9,10]. In the era of the digital economy, how to use Internet platforms and digital technologies to promote green and sustainable development of the economy and society has become an important issue in environmental economics [11,12].
Pollutant discharge is a specific index to measure environmental quality. Regarding the relationship between the digital economy and environmental pollution, domestic and foreign research has three main viewpoints. First, the digital economy has an inhibitory effect on environmental pollution. That is, the digital economy can improve environmental quality to a certain extent. The openness, interaction, and real-time nature of the Internet provide the possibility and convenience for the public to participate in environmental governance. Furthermore, the Internet has made up for the lack of environmental governance in the past by improving the intelligence and accuracy of environmental supervision, governance, and services [13]. Low-energy data transmission and the paperless office use of the Internet provide opportunities to reduce environmental pollution caused by traffic [14]. Under the background of increasingly serious air pollution and the flourishing development of digital technologies, the digital economy for sustainable development is of great value for improving environmental quality and achieving sustainable economic development [15]. Second, the development of the digital economy has a deteriorating effect on the discharge of pollutants. The application of information and communications technology increases energy consumption and pollution [16,17]. Third, an inverted U-shaped curve is between the development of the digital economy and smog pollution. For example, Higón et al. [18] selected 116 developing countries and 26 developed countries as empirical research samples. Studies have found that the development of the Internet economy increases pollutant emissions in the early stage and reduces pollutant emissions in the later stage. In other words, a non-linear relationship is observed between the development of the digital economy and environmental pollution [19].
How does the digital economy affect environmental quality? The present study explores the impact of the digital economy on environmental quality and its internal impact mechanism. This study first builds an evaluation index system for the digital economy and environment. Based on coupling theory, this study investigates the coupling process and evolution trend of digital economy and environment in 217 prefecture-level cities in China and finds the coupling nexus of digital economy and environment. The degree of coordination shows an upward trend in fluctuations. Then we further empirically study the relationship between the development of the digital economy and pollutant discharge and find that the development of the digital economy has a significant promoting effect on pollutant discharge. At the same time, the urbanization rate, population density, and per capita GDP are introduced as threshold variables to explore whether there are threshold effects. Finally, the indirect effects of the digital economy on pollutant emissions are explored. The research results will help decision makers formulate targeted policies to achieve the coordinated development of the digital economy and the environment.
Compared with previous studies, the marginal contributions of the present study are in the following three aspects. First, this study reveals the relationship between the digital economy and environmental quality. In the context of the development of the digital economy, this study examines the coupling and coordination relationship between the digital economy and the ecological environment, and empirically tests that the digital economy can improve environmental quality. Second, in the empirical analysis, this study discovers the threshold effects of urbanization and population density. Urbanization and population concentration can enhance the efficiency of the digital economy and its dividend effect. These findings indicate that the formation mechanism of the digital economy’s environmental dividend and economic dividend should be similar. Third, this article discusses several mechanisms and finds that technology effect leads to significant pollution reduction.
The remainder of the paper is organized as follows. Section 2 provides a brief literature review and theoretical analysis. Section 3 briefly describes the research methods and data sources used in this study. Section 4 presents the empirical results and discussion. Section 5 reports some conclusions and provides further policy implications.
2. Literature Review and Theoretical Analysis
2.1. Literature Review
Existing studies generally believe that economic factors are closely related to environmental quality [20,21]. Yan et al. [22] used two-step quantile panel regression to test the heterogeneous relationship between PM2.5 level and economy, industrial structure, urbanization, FDI, and population density. Economic production activities produce environmental pollution, but the environmental Kuznets curve shows a U-shaped relationship between the level of economic development and environmental quality [23]. The environmental Kuznets curve shows that environmental pollution is aggravated with economic growth when the level of economic development is low and environmental pollution is alleviated with economic growth when the economic development reaches a certain level. Furthermore, the technical level is also closely related to environmental governance. Many studies have shown that the level of technology can inhibit environmental pollution [24,25], including clean technology, energy efficiency, production technology, and other action channels [12]. While technological development has brought many obvious benefits to environmental quality improvement, it has also had a complex impact on environmental quality, directly and indirectly [26].
Some studies have shown that the development of information technology and digital technology promotes the improvement of environmental quality. For example, advances in Internet technology have promoted the improvement of resource utilization efficiency and the wide application of new environmental protection technologies, and improved the prevention and treatment of environmental pollution, thereby reducing environmental pollution [27,28]. Other studies have shown that the development of digital technology increases energy demand, thereby exacerbating environmental pollution. Industrial digitalization causes more energy consumption and worse environmental performance than ever before [5]. Salahuddin and Alam [29] used panel data from Organisation for Economic Co-operation and Development (OCED) countries to find that, if Internet users increase by 1%, electricity consumption per capita will increase by 0.026%. Simultaneously, according to Zhou et al. [30], the energy consumption of the information technology industry and the intermediate input of energy-intensive products have led to a large amount of carbon emissions. Haseeb et al. [31] observed the one-way causality of information and communication technology on the energy consumption of Brazil, Russia, India, China, and South Africa (BRICS).
The digital economy includes the application of information technology and changes in economic and social activities. Specifically, the digital economy can influence economic scale, industrial structure, and people’s activities. With the improvement of the level of the digital economy, Internet technology progresses regional technological innovation and energy efficiency, promotes the rapid advancement of operating efficiency of various industries, and supports regional economic development [32]. With the rapid development of the regional economy driven by the digital economy and the improvement of people’s living standards, the number of motor vehicles has also shown a fast growth trend. Once considerable vehicle exhaust emissions surpass the self-purification ability of urban air, the degree of atmospheric pollution is aggravated.
Furthermore, the digital economy has brought a significant impact on the upgrading of industrial structures. With the development of the digital economy, new elements and new resources are allocated to more efficient technology-intensive industries, leading to an increase in the proportion of resource-saving technology-intensive industries [33]. The advantages of the Internet platform provide opportunities for companies to seek product innovation, develop clean production methods, realize corporate green and low-carbon development, and promote the economic structure of industries by accelerating the industrialization of environmental technology achievements adjustment.
2.2. Theoretical Analysis
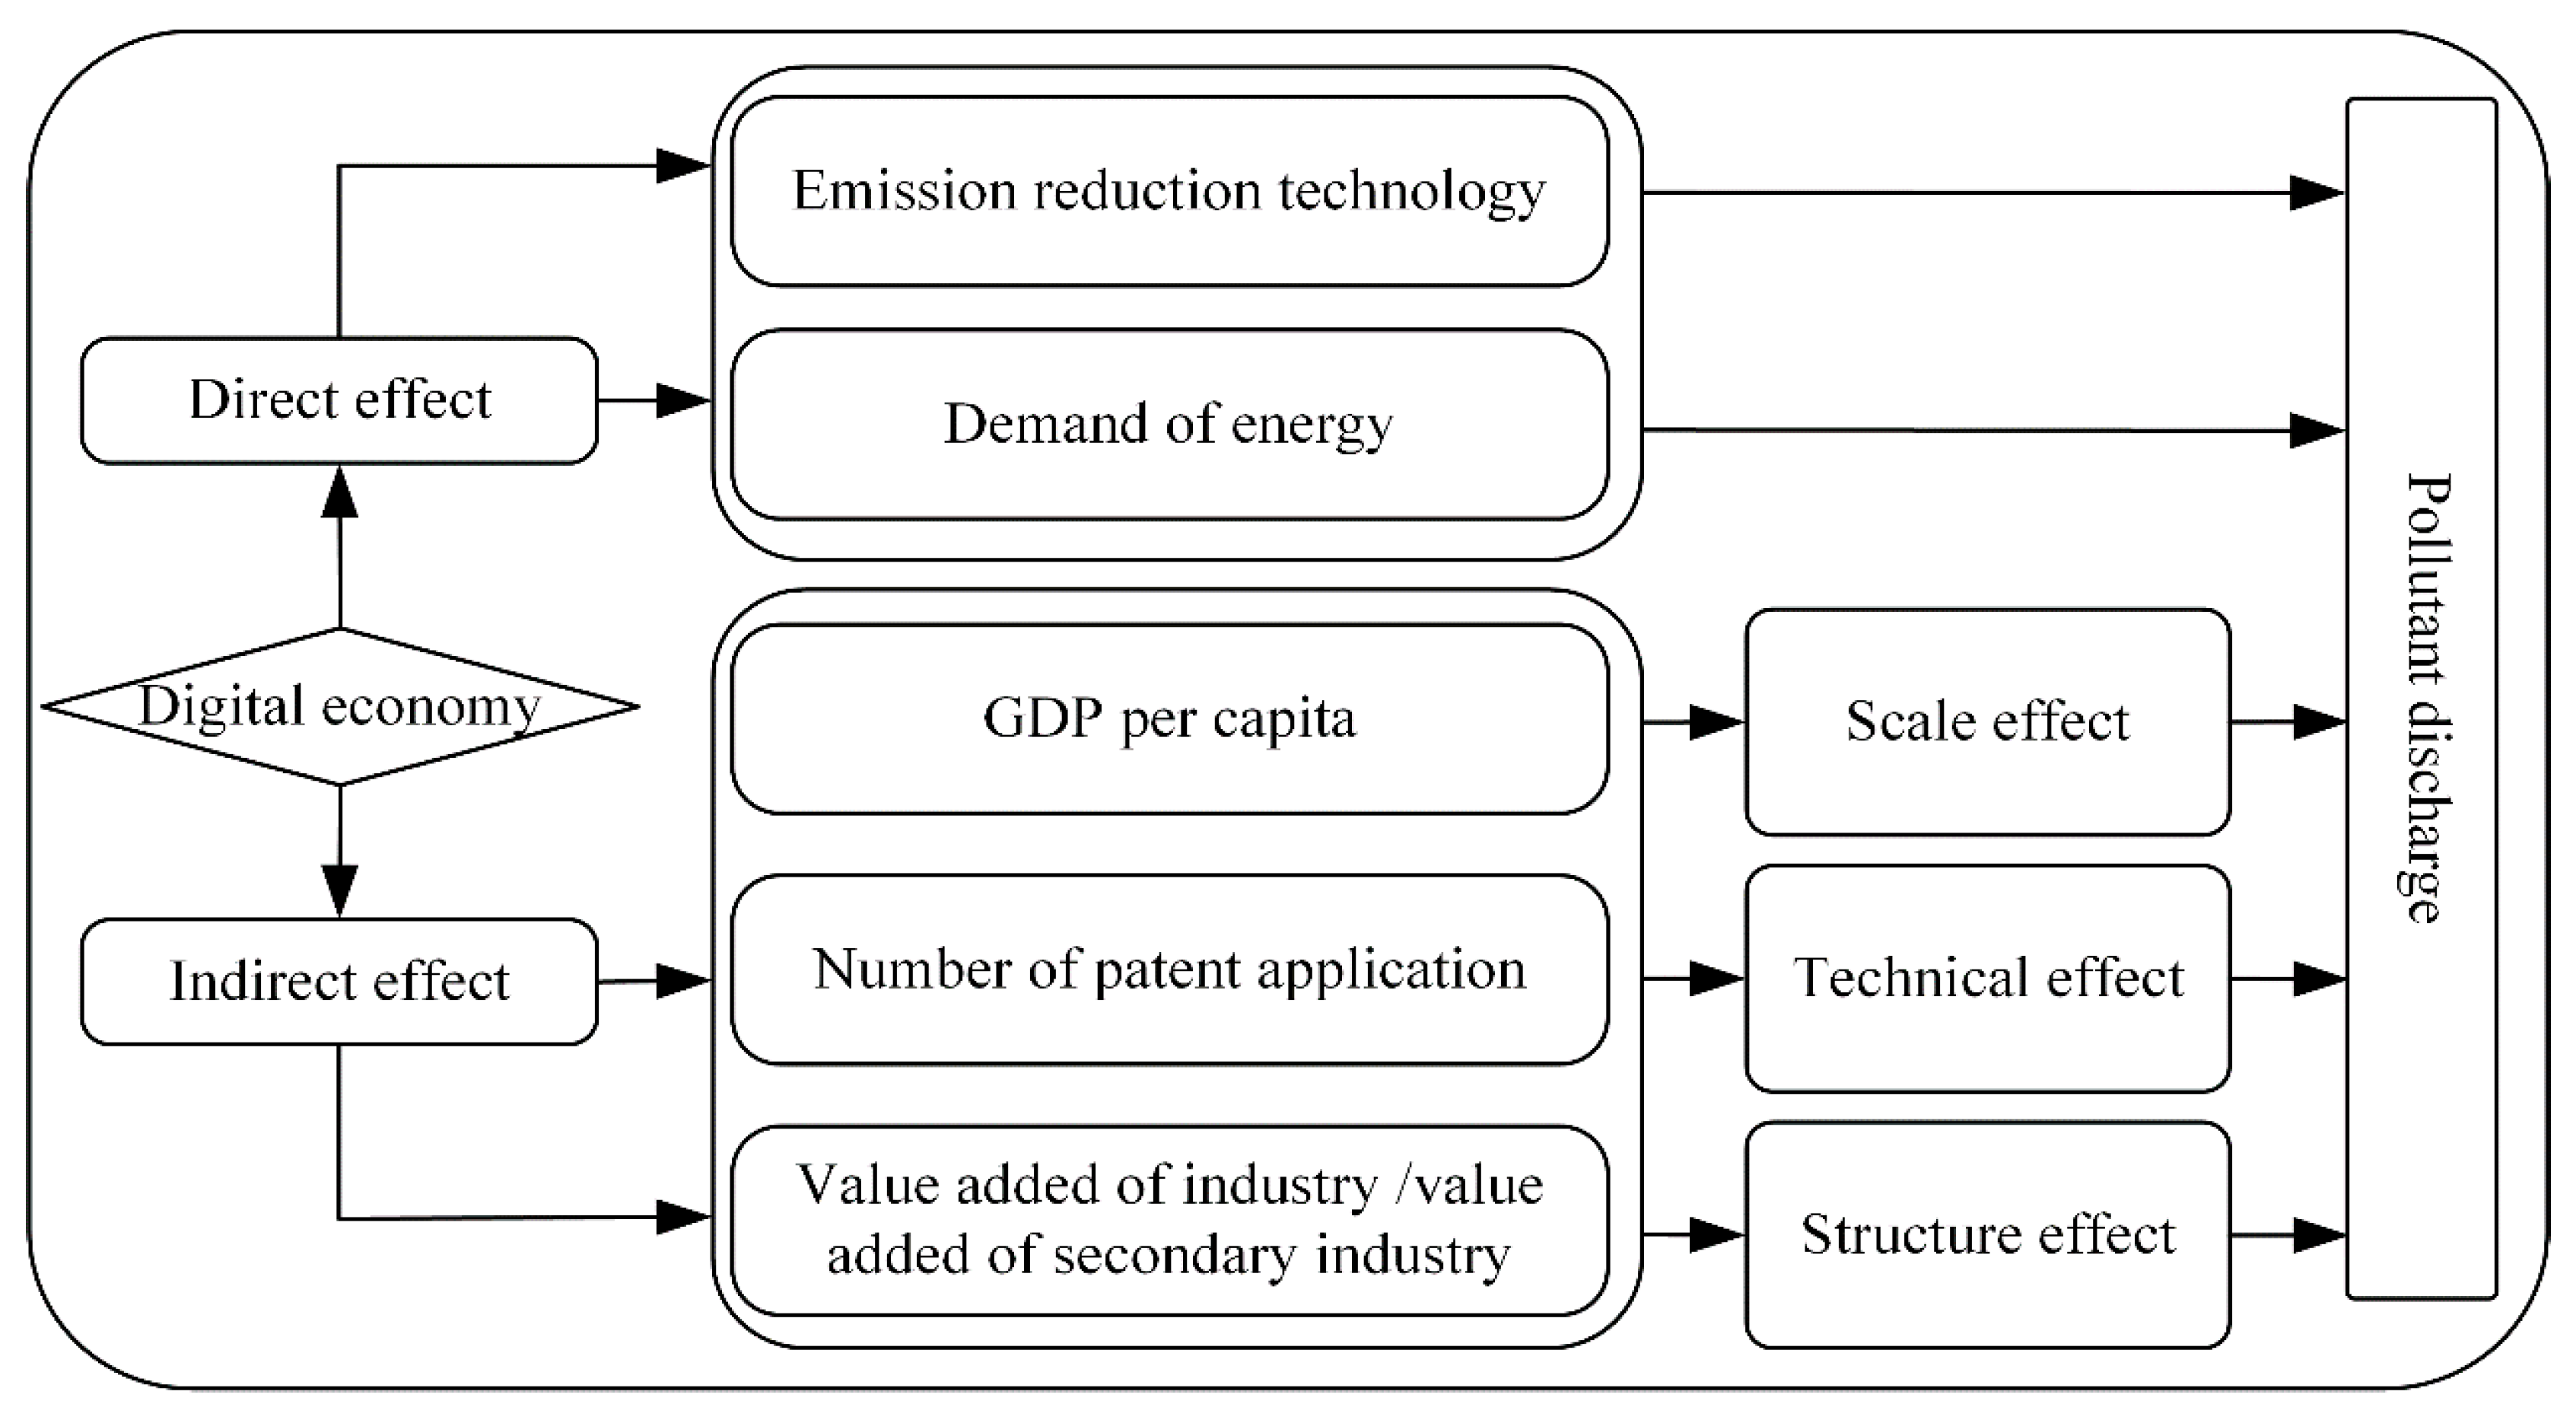
The impact mechanism of the digital economy on the environment can be decomposed into direct and indirect effects, as shown in Figure 1. With the rapid development of the digital economy, Internet technology is gradually being applied to environmental protection, promoting the progress and innovation of emission reduction technologies, which directly impact the reduction of the emission of pollutants in the production and life process [12,34]. The development of the digital economy brings large investment in infrastructure construction and the rapid growth of Internet penetration, increasing power consumption and energy consumption in Internet development [35].
The indirect effects of the digital economy on the environment can be divided into scale, structural, and technological effects [4,17,36]. These three effects have a positive or negative impact on the environment, and the combined effect of them is the net environmental effect of the digital economy.
Structural effect. The structural effect is that the economic structure has a two-stage trend: the early transformation of agriculture to energy-intensive heavy industries and the later transformation of heavy industry to low-polluting service industries and knowledge-intensive industries. Given the economic development mode’s transformation and the industrial structure’s optimization and upgrading, the proportion of high-energy consumption and high-polluting industries has fallen, and the proportion of the tertiary industry has risen. Compared with the primary and secondary industries, the tertiary industry consumes less resources and emits less pollution. Therefore, the higher the proportion of the tertiary industry, the better the environmental quality.
Technical effect. The improvement of pollution and the use of clean technology reduces the emission of pollutants. Specifically, the development of the digital economy increases the technical content and added value of products and promotes the transformation and upgrading of enterprises. Thus, energy consumption in the production process is reduced, and enterprise energy efficiency is improved [37,38], which is conducive to environmental energy conservation and emission reduction.
Scale effect. The scale effect of the digital economy on the environment is mainly reflected in two aspects. One is the expansion of production input. The development of the digital economy can form a new production capacity. The development of this part of production capacity requires increased input of production factors, including natural resources, which leads to the overexploitation and utilization of natural resources and a decline in environmental quality. The other aspect is the increase in pollution emissions. The expansion of factor input and production scale will increase pollution emissions, raising environmental pressure and adversely affecting environmental quality.
3. Data Sources and Research Methods
3.1. Index System
The construction of the index system is the key to measuring the coupling relationship between the growth of the digital economy and the environment. The indicators were selected according to the principles of science, integrity, hierarchy, and operability, and a comprehensive measurement indicator system was obtained by referring to a large amount of literature [12,39]. The data used come from the 2003–2018 China Statistical Yearbook, China Environment Statistical Yearbook, China City Statistical Yearbook, and China Energy Statistical Yearbook. This study used the interpolation method to extrapolate the missing data and obtained the estimated value for processing.
The highly relevant digital economy indicators released by China Information Communications Technology Institute, Ministry of Industry and Information Technology of China, Tencent Research Institute, and other domestic authorities were used as references. The principles of accuracy, reliability, and accessibility of index sources were followed to establish a digital economy indicator system. The digital economy is divided into three levels and nine indicators (Table 1): (1) Digital infrastructure. Digital facilities are the technical carrier of digital economy development. In this study, the number of users per 100, the number of computer services and software practitioners, the total number of telecommunications services per capita, and the number of mobile phone users per 100 are selected for measurement. (2) Digital talent. The digital economy is knowledge-based, and high-quality talents are the driving force of digital economy development. This study selects the proportion of education expenditure in general public budget expenditure and the proportion of undergraduate graduates in undergraduate students to measure digital talents. (3) Digital industry value. The added value of the primary industry, the secondary industry, and the tertiary industry is highly integrated with the digital industry but reflects the development of the last phase of the industry driven by the digital economy. Therefore, the proportion of these three indicators in the GDP is selected to reflect the industry value with digital lag.
In terms of resources and environmental systems, 13 indicators are selected from the three aspects of the ecological environment, resource consumption, and environmental conservation. When measuring the weight of each indicator of the two systems of digital economy and environment, to reduce subjective factors, this study adopts the relatively objective entropy weight method to obtain the weight of each indicator. The entropy method is aimed at the original factual information by analyzing the degree of correlation between the indicators and the amount of information supplied by each indicator. Calculating the weight of each subsystem and constituent element indicators, the specific calculation process of the weight is as follows.
- (1)
- Normalize the index data to get the normalized dataPositive index:Negative index:
- (2)
- Change the proportion of indicators:
- (3)
- Obtain the entropy value of index j: , where
- (4)
- Calculate the difference coefficient of the j index and obtain the weight
- (5)
- Define the coefficient of difference:
For the j-th index, the greater the difference in value, the greater the effect on program evaluation and the smaller the entropy value, where . Given that , .
Suppose U1 and U2 are the sequence parameters of the digital economy and environment subsystems, respectively, is the basic observation index inside the two subsystems. is the external development function of two subsystems composed of many indicators, among which is the index weight.
3.2. Coupling Model Establishment
Coupling refers to the phenomenon that two or more systems or motion modes influence one another and even unite through various interactions. It is a dynamic relationship that depends on, coordinates, and promotes the systems or modes under the benign interaction between the various subsystems relationship. According to the existing n-dimensional system interaction coupling degree model,
Given that this article discusses the coupling relationship of two systems, the two-dimensional coupling degree function is obtained after processing. The coupling degree function of the digital economy and environment system is given in this article as follows:
This study takes n = 2, where C is the coupling degree between the digital economy and the environment, and its value is between 0 and 1. When C tends to 0, the coupling system composed of the digital economy and environment is in a coupling detuned state. When C tends to 1, the coupling system composed of the digital economy and environment is in a high-quality coupling state.
The degree of coupling can effectively reflect the strength of action between the digital economy and the environment, but this function also has shortcomings. It cannot fully reflect the overall function and comprehensive coordinated development level of the digital economy and the environment. It cannot match the actual economic significance between U1 and U2. Therefore, this study establishes the coupling coordination degree function as follows:
where C is the degree of coupling, T is the comprehensive development level index of the digital economy and environment, and α and β are undetermined coefficients. Given the importance of digital economy and environment in regional economic development, after referring to relevant literature and listening to the opinions of relevant experts, this study takes α = β = 1/2. This study classifies the degree of the coordinated development of the coupling to measure the coordinated development of the digital economy and the environment better (Table 2).
3.3. Model Specification
This study investigates the impact of the development of the digital economy on environmental quality by mainly using the following regression models:
where PM2.5 is the dependent variable measured by PM2.5 concentration, which represents environmental quality. Digitalit is the explanatory variable in our study and refers to digital economy development level. Xit is a vector of control variables that include a set of city characteristics and δ is the column vector of coefficients This study also controls the year fixed effect () and the city fixed effect () in the model to control macroeconomic conditions. These unobserved regional characteristics may affect environmental quality. This study is interested in the coefficient of the binary variable Digitalit.
Furthermore, to investigate the threshold effect of the development of the digital economy on environmental quality, this study further constructs the following model:
where i represents the region, t represents the year, qit is the threshold variable, and γ is the unknown threshold.
Finally, to examine the mediating effect of the digital economy on environmental quality, a regression model is constructed to test the mediating effect. The specific model is set as follows:
This study regards the concentration of PM2.5 as an explanatory variable (PM2.5). is a vector of control variables that include a set of city characteristics and is the column vector of coefficients. As seen in Equations (4) and (5), economic growth (RGDP), technological progress (lnRD), and industrial structure upgrades (Structure) are regarded as intermediary variables to be tested, and the digital economy development level (Digital) is regarded as explanatory variable to construct the intermediary effect model.
3.4. Data and Variables
The sample used in our study included 217 prefecture-level cities across the country from 2003 to 2018. The dependent variable is the concentration of PM2.5 (PM2.5) in each city. We solve the problem of the lack of historical PM2.5 concentration data using the grid data of global PM2.5 concentration annual average value based on satellite monitoring published by Columbia University Socio-Economic Data and Application Center [40]. We also used ArcGIS software to analyze it into the specific value of China’s provinces’ annual average PM2.5 concentration from 2003 to 2018. As the benchmark for constructing global atmospheric chemistry simulation models and the basis for the compilation of air pollution inventories, satellite monitoring data belong to non-point source data, which can accurately reflect PM2.5 concentration and change the regional trend comprehensively.
The core explanatory variable is the digital economy. According to the digital economy index system constructed in this study, the comprehensive score of the digital economy of each city is calculated as a measure of the digital economy.
Combined with the existing studies, this study also controls a group of urban characteristic variables in the baseline regression model to mitigate the error of missing variables as much as possible. This group of variables includes the following: financial development, which is measured by the loan balance of financial institutions per capita; government R&D investment, which is measured by the logarithm of per capita government fiscal expenditure on science and technology; infrastructure, using per capita road area; population density, the number of people per unit area; the level of economic development, measured by per capita GDP; and the industrial structure, adopting the proportion of the added value of the secondary and tertiary industries. At the same time, given that a large amount of dust is generated in the process of urban construction, which aggravates the pressure on the urban air environment, we select the per capita construction land area as a control variable. In addition to the above variables, considering the impact on environmental quality analyzed in this article, we also controlled the variables that may affect environmental quality and the development of the digital economy, the total amount of coal consumption, to further reduce the bias omitted variables. The above explained variables, core explanatory variables, and a series of control variables data description and variable statistical description are shown in Table 3 and Table 4.
4. Empirical Result and Analysis
4.1. Result Analysis of Coupling Coordination Analysis
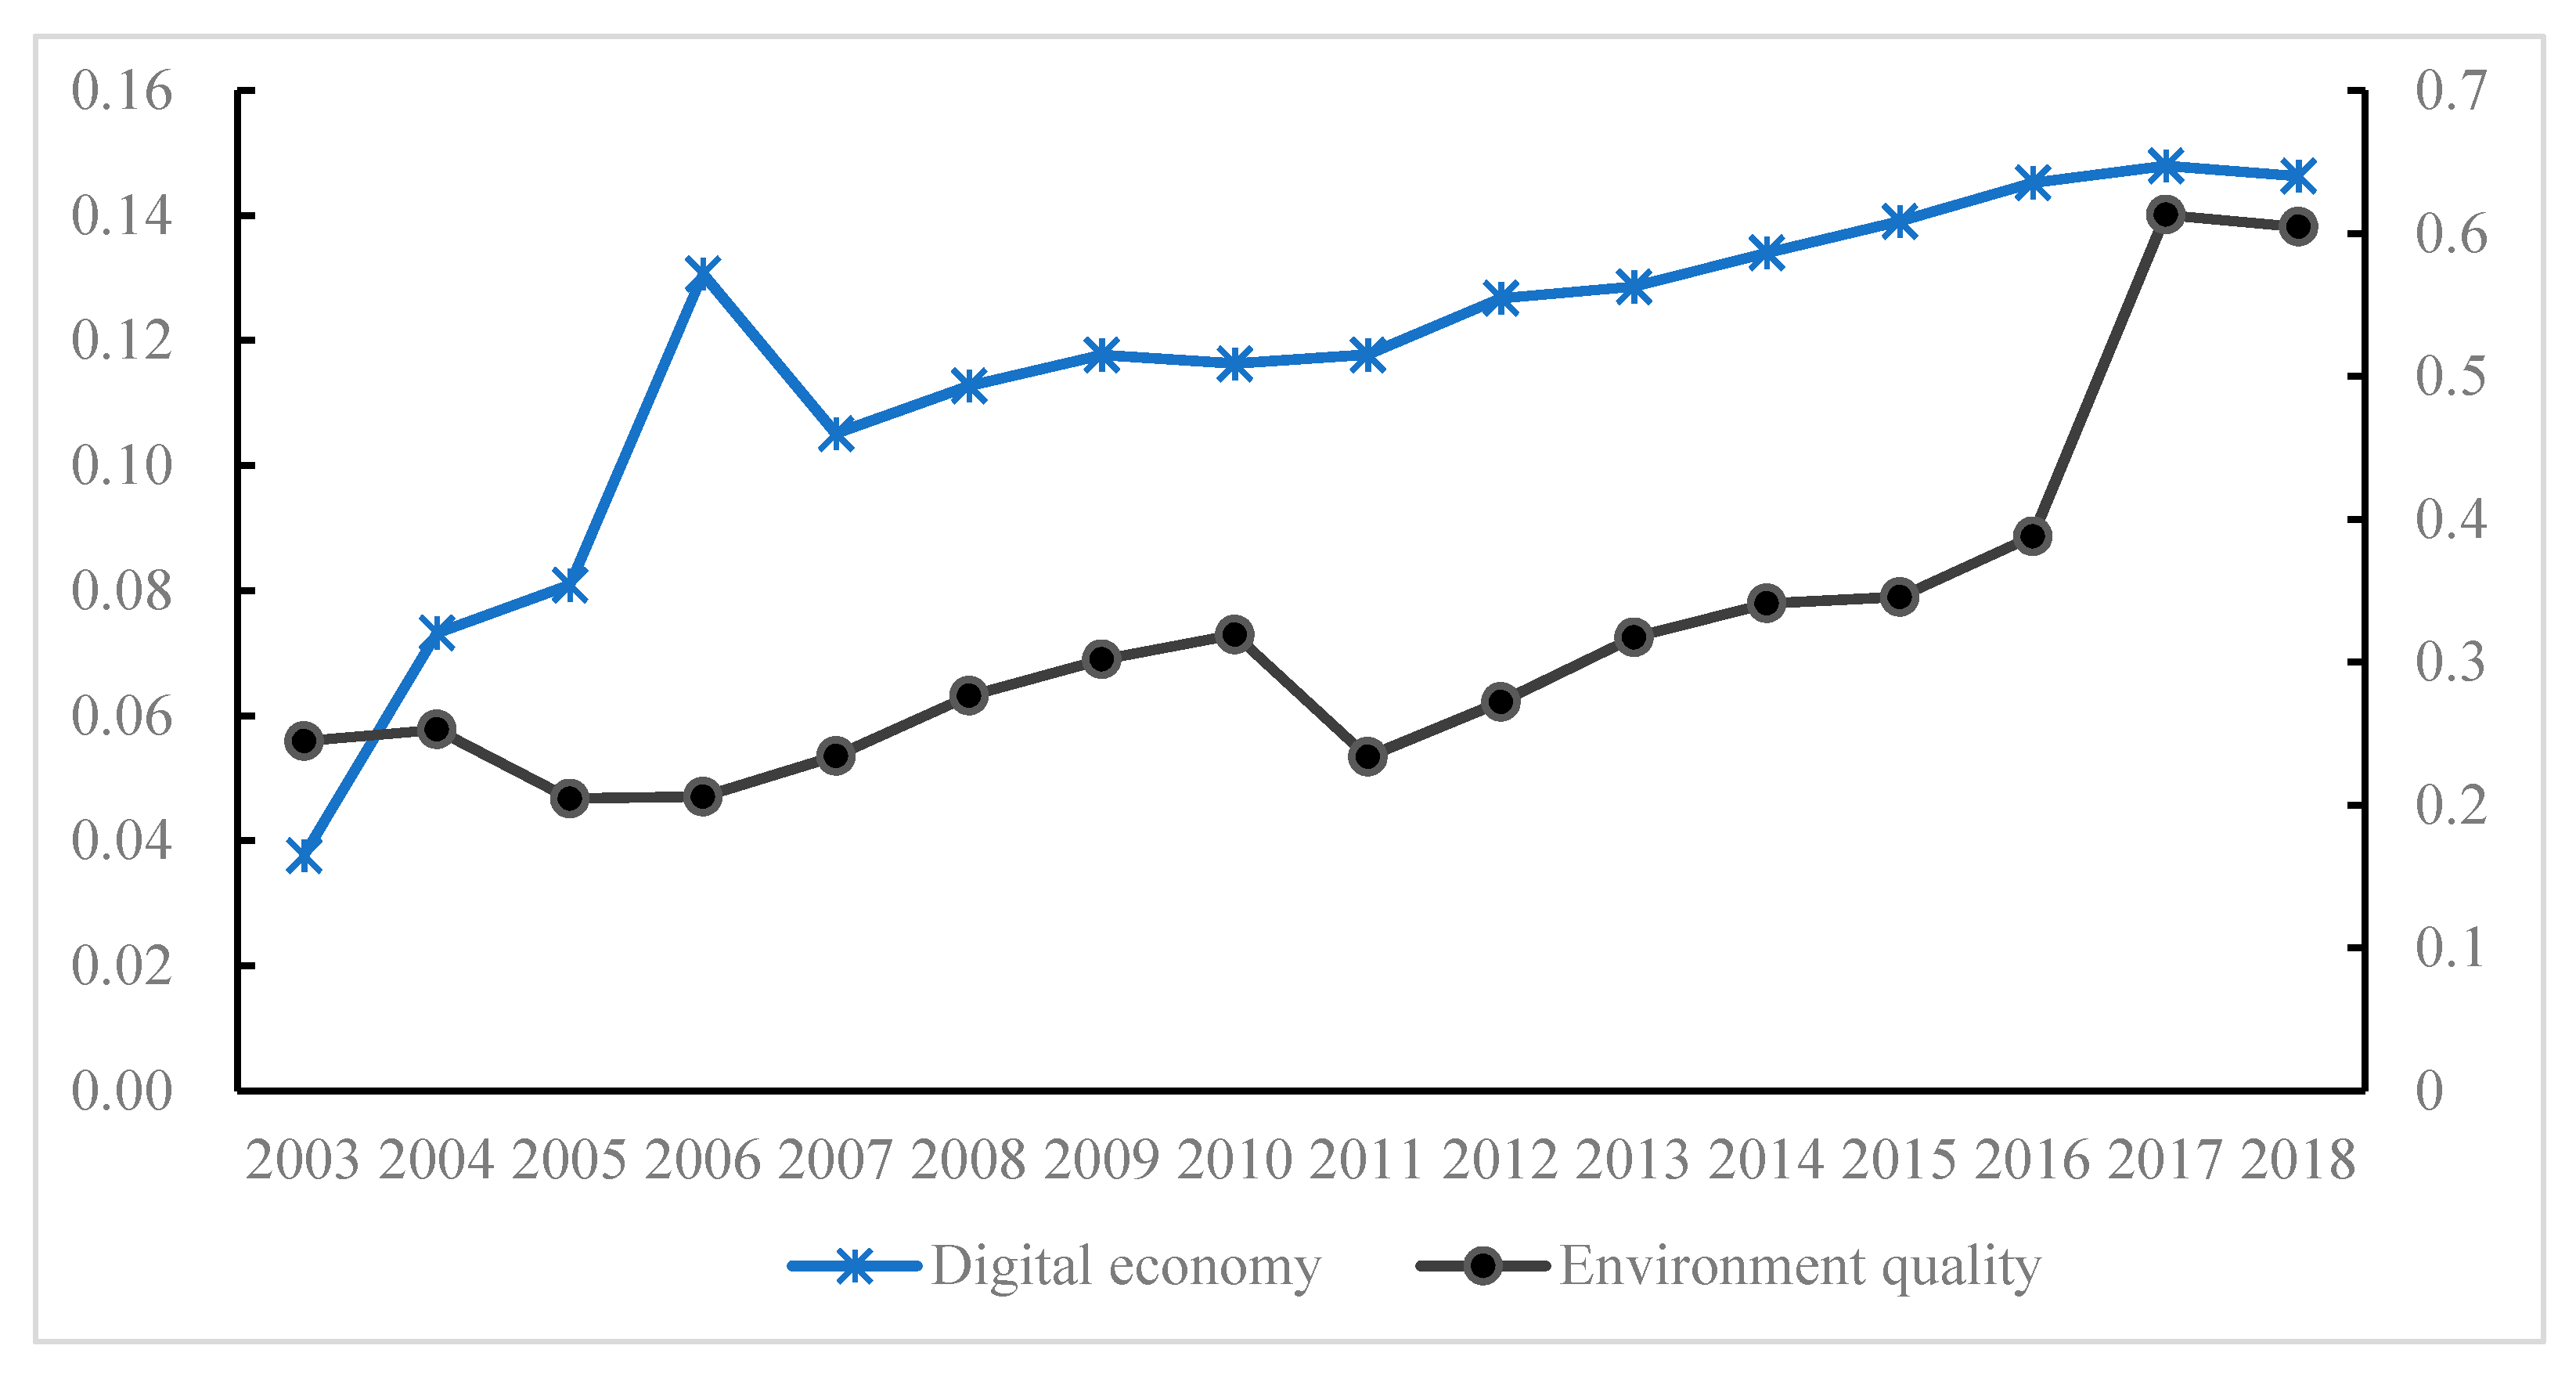
According to the above method, the comprehensive evaluation function values of digital economy system and environmental system are calculated. As shown in Figure 2, the digital economy and environment quality in Chinese cities show an overall upward trend from 2003 to 2018. Among them, environment quality shows a downward trend in 2011 due to the implementation of the smart city pilot project in 2011 in China. The use of various smart sensors increases energy consumption, which results in environmental deterioration in a short period. Given the gradual improvement of the smart city pilot policy and the application of emerging information technology in the field of environmental protection, the environment quality shows an upward trend in the later period. With the development of the Internet and other information technologies [41], the digital economy has been steadily rising from 2003 to 2018, which shows that the quality of digital economy development is gradually improving, and its role in improving environmental quality continues to increase.
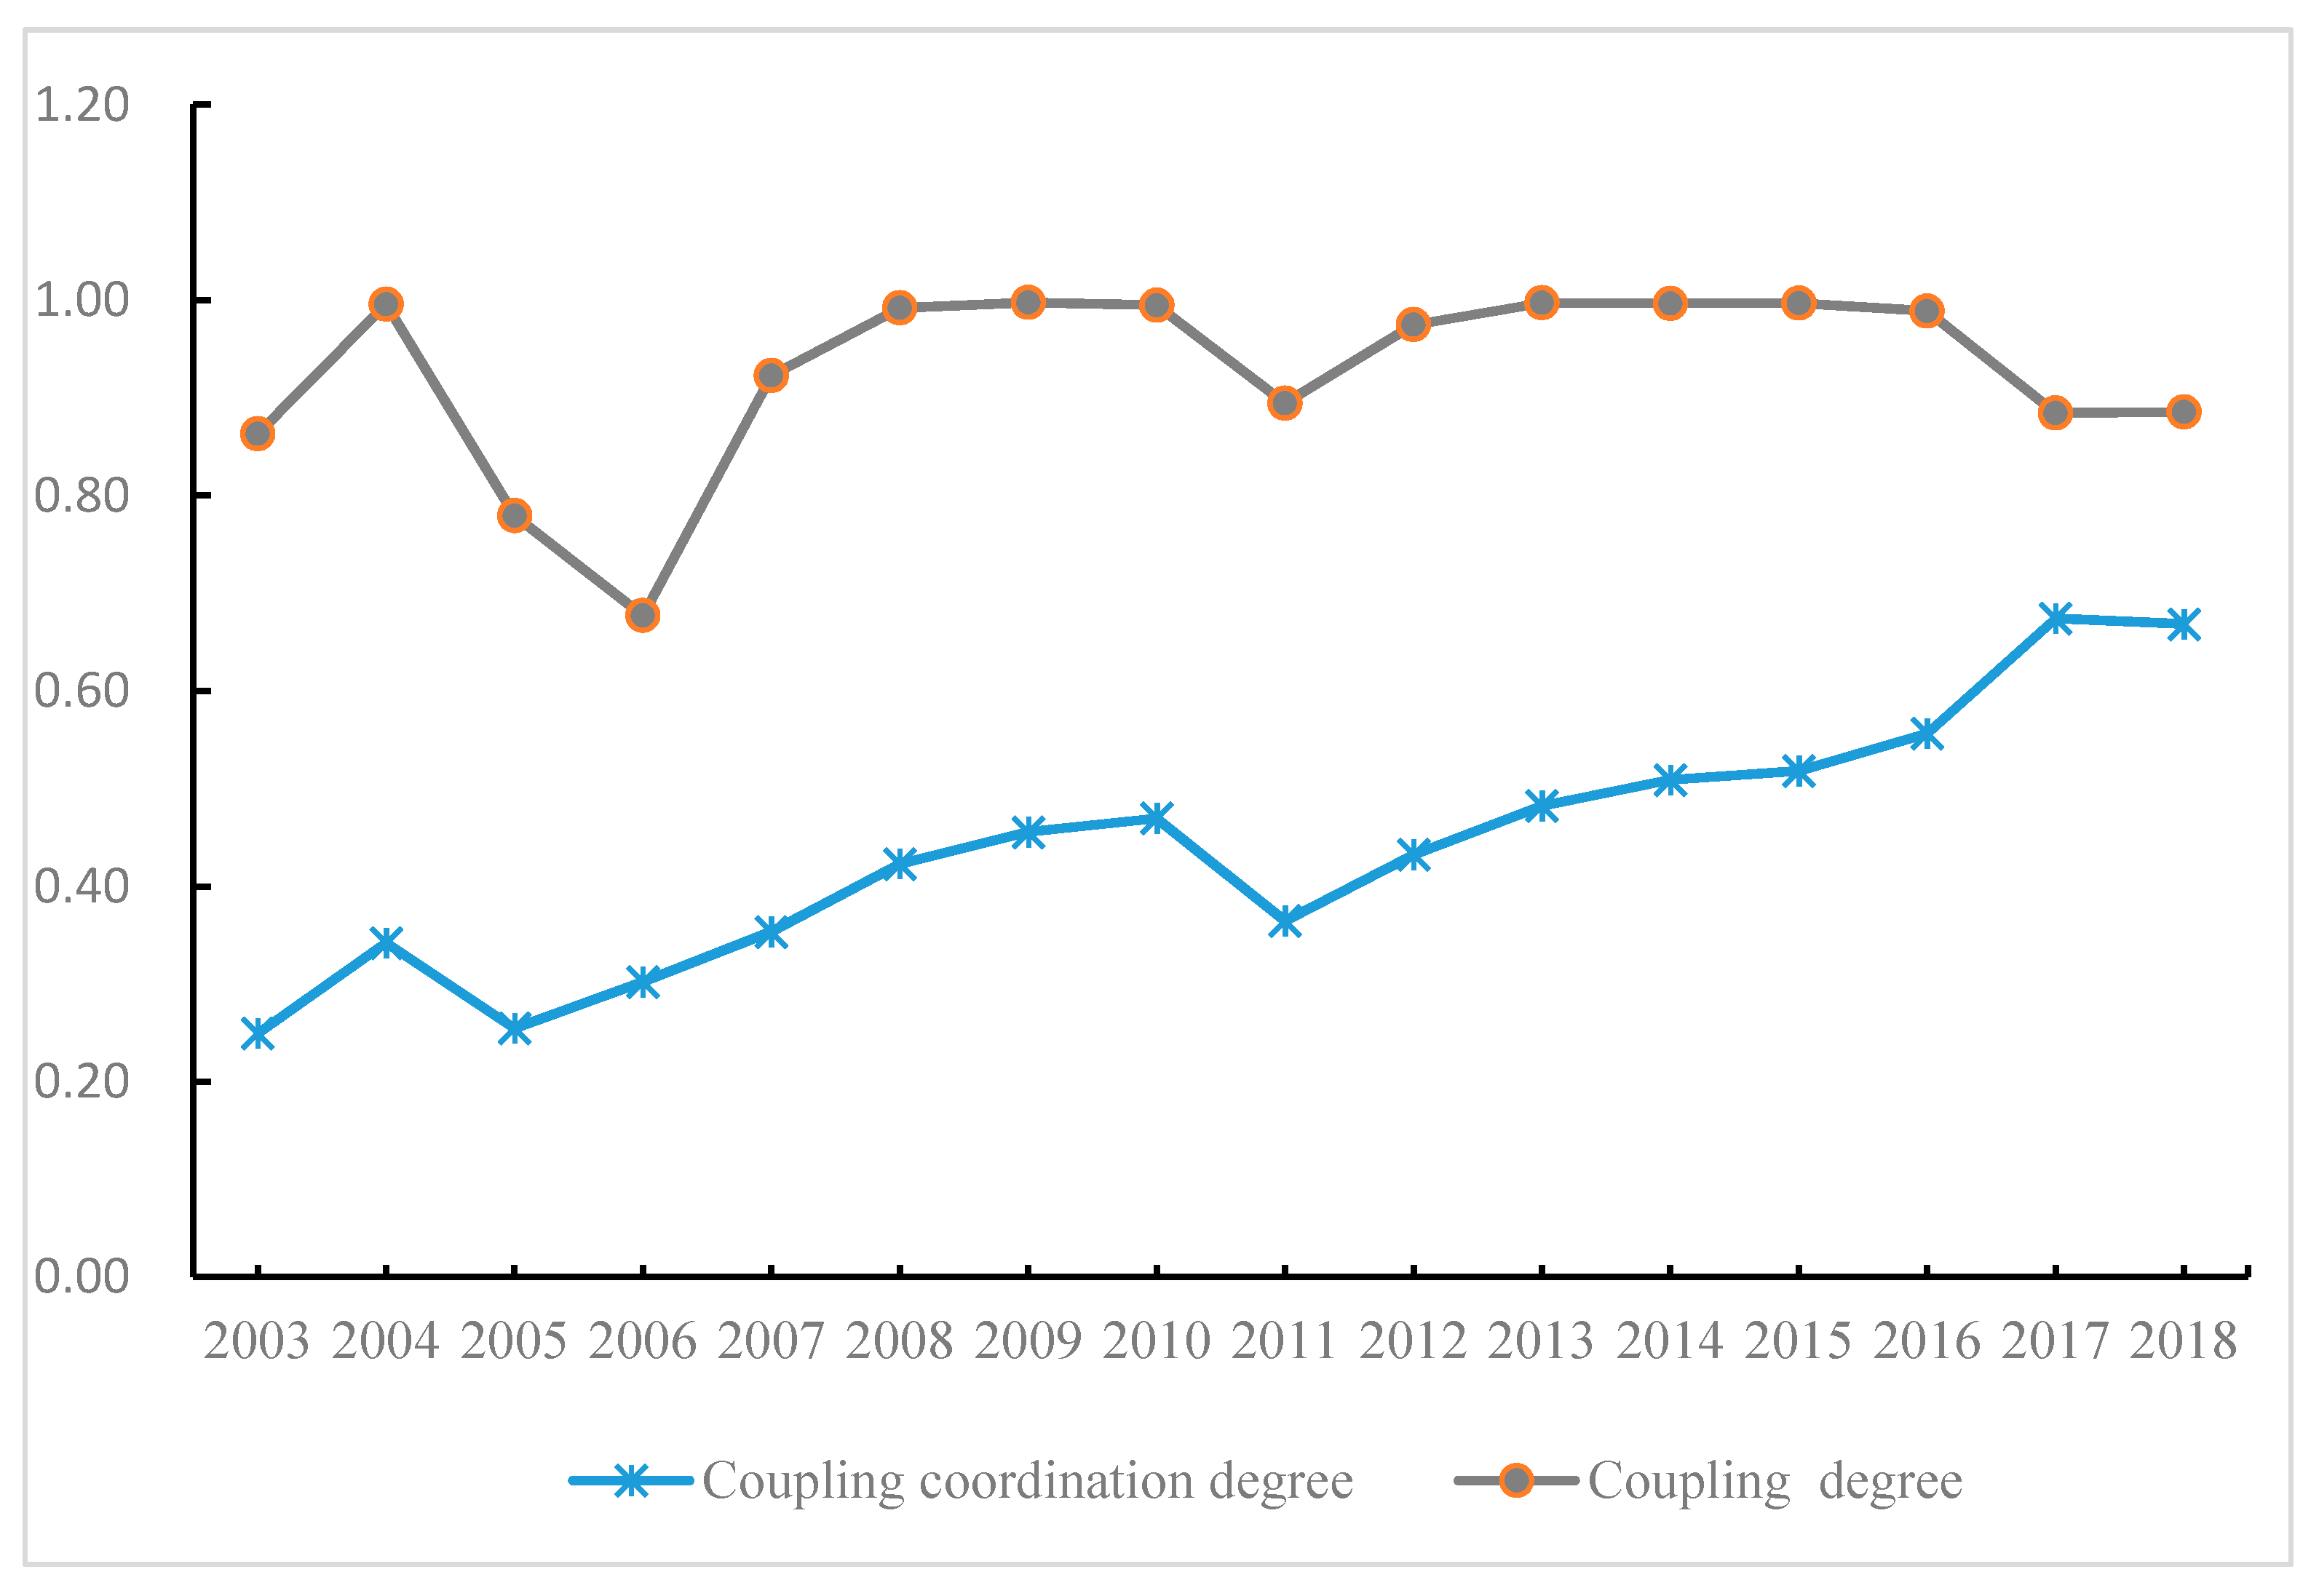
Using the numerical values of the coupling degree and coupling coordination degree between the development level of the digital economy and the environment development level, the overall coupling degree C and the coupling coordination degree D of the two are measured (see Figure 3). The higher the two values are, the better the coupling and coordination degree of the two systems. From the perspective of changing trends, the degree of coupling and coordination between the two systems has shown a fluctuating upward trend from 2003 to 2018. Although the coupling degree of the two systems has declined, they are maintained between 0.6 and 1.0. On the whole, the degree of coordination between the digital economy and environment is in a strengthened trend. The two are gradually evolving from a lower level of harmony to a higher level of harmony.
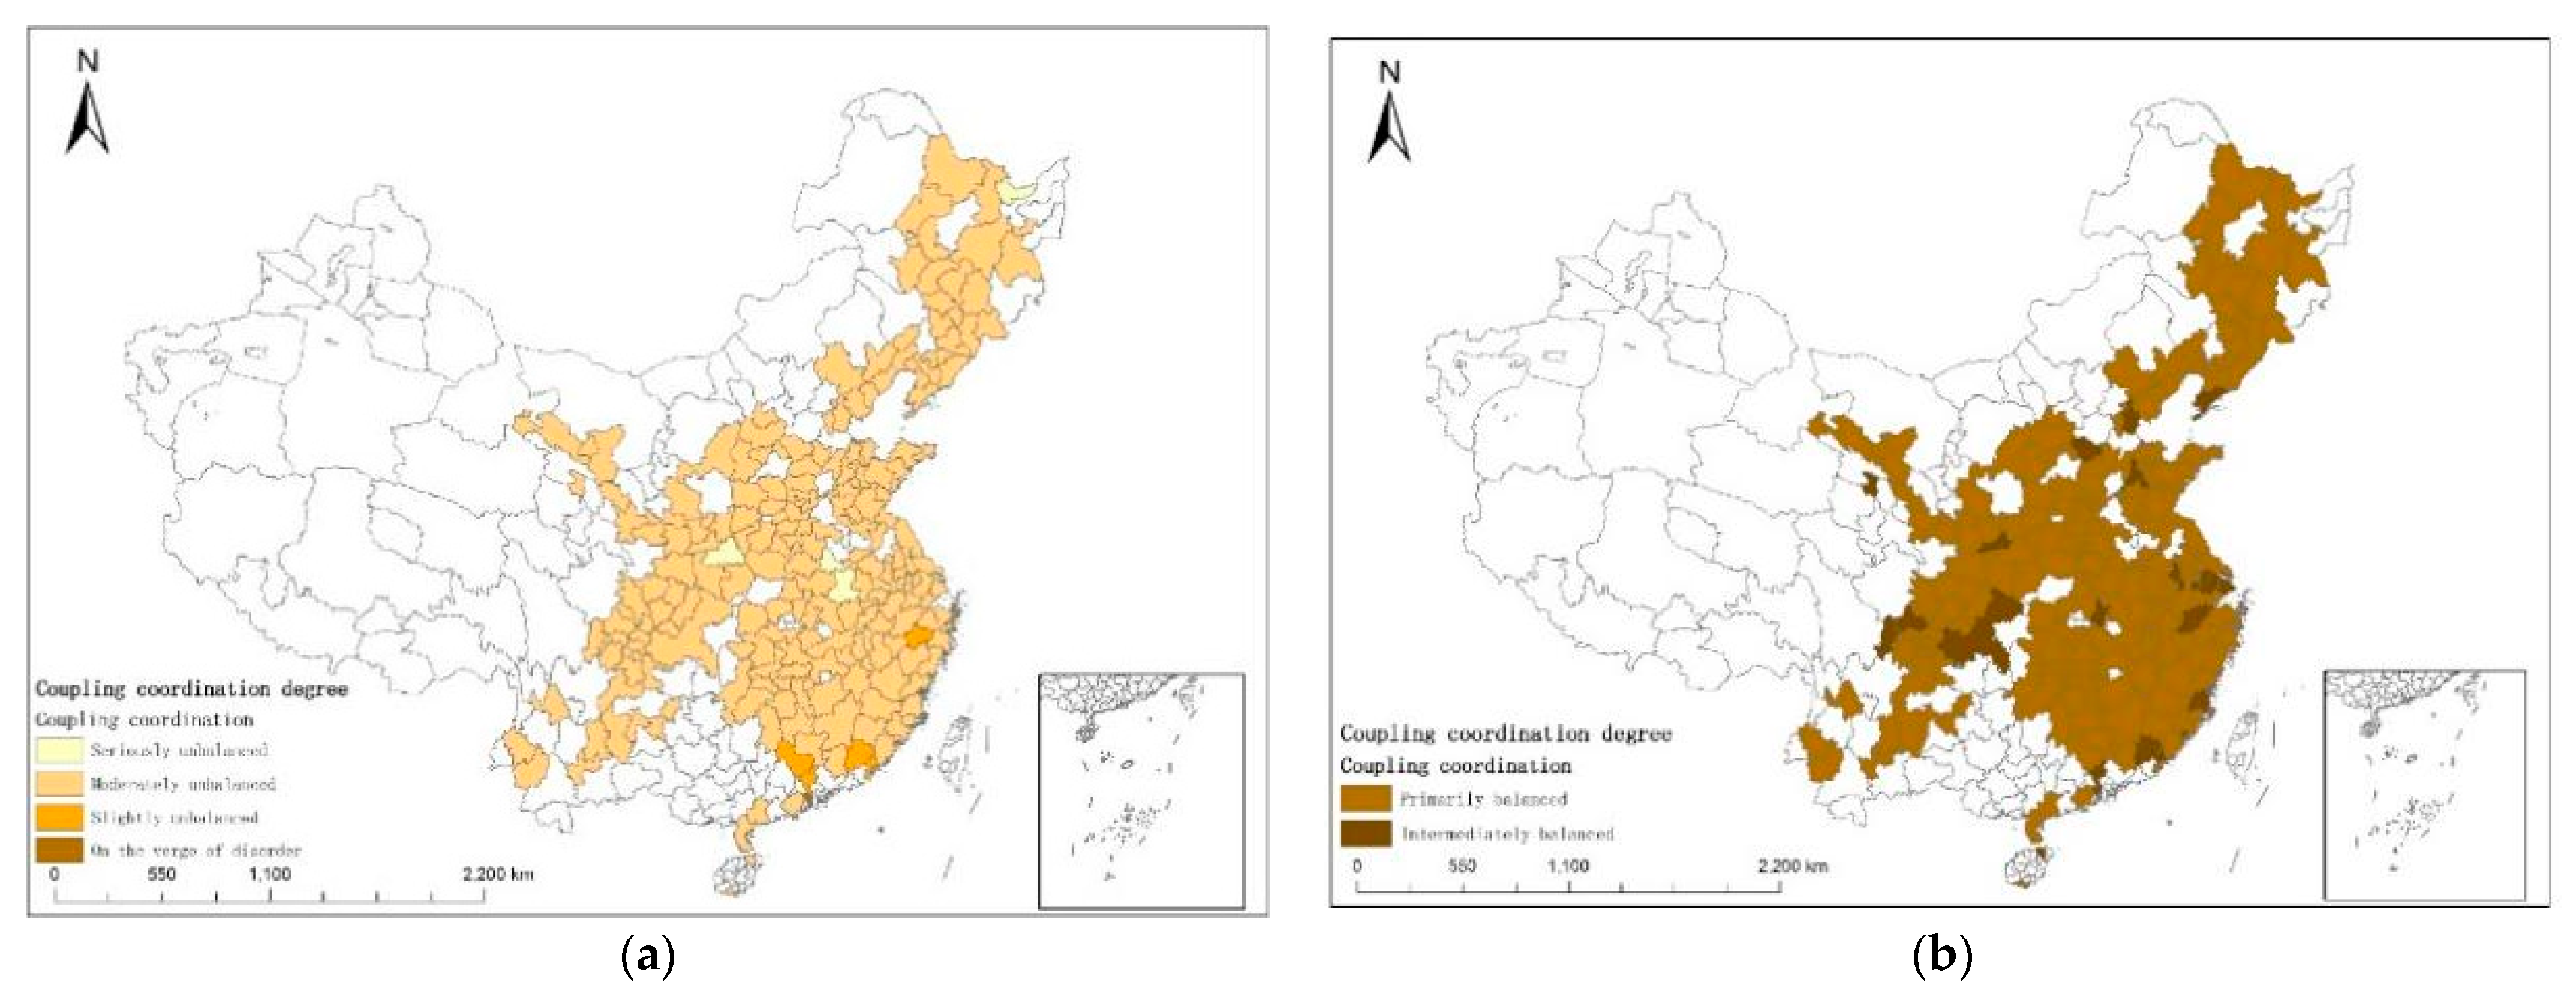
From 2003 to 2018, the degree of coupling and coordination between the digital economy and the environment of cities across the country has a clear upward trend (Figure 4). It shows that China’s sustainable development strategy and innovation-driven development have achieved good results, which should continue to be implemented to achieve a high level of coordination between the digital economy and the environment. Figure 4 shows that high coupling coordination degrees are mainly concentrated in the eastern coastal areas and municipalities. The eastern coastal areas and municipalities have higher education levels, better scientific and technological innovation, and better environmental quality than other regions.
Table 5 shows that the growth rate of the coupling coordination degree of the two systems in the first half of 2003 to 2018 was relatively slow, and the growth rate accelerated in the second half. From 2011 to 2012, China began to pilot “smart cities”. The development of a new generation of information technology represented by the Internet of Things, cloud computing, and mobile Internet promoted technological innovation and the innovation ecology of the city. In building smart cities, the Chinese government has implemented an innovation-driven development strategy to achieve configuration optimization, technological progress, and structural upgrades, thereby promoting significant results in urban environmental governance and accelerating the growth rate of coupling coordination from 2011 to 2018.
4.2. Benchmark Regression of the Environmental Effect of the Digital Economy
In the benchmark model, we focused on testing the direct impact of the development of the digital economy on environmental quality. In the static panel model, we use OLS regression to test Equation (1). The specific regression results are shown in Table 6. Under the premise of determining the year and regional effects, the OLS regression results show that the influence coefficient of the development of the digital economy on the PM2.5 concentration is significantly negative, indicating that the development of the digital economy has significantly promoted the improvement of environmental quality. Wu et al. [42] reached a similar conclusion that the development of the Internet has improved China’s Green Total Factor Energy Efficiency (GTFEE), which is of great significance to China’s energy conservation and emission reduction.
This study also conducted a regression analysis of regional heterogeneity. The results in Columns (5) and (6) of Table 6 show that the digital economy in the non-eastern regions has a significant negative effect on pollutant emissions. In contrast, the effect in the eastern regions is not significant. The possible reason for this result is that the development of the central and western regions is more extensive, whereas the pollutant emission problem in the eastern region is not as serious as that in the central and western regions. However, we still believe that the digital economy will have an inhibitory effect on pollutant emissions in the eastern region. This conclusion will be verified in the robustness test later.
4.3. Robustness Test of the Environmental Effect of the Digital Economy
In August 2013, the State Council issued the “Notice of the State Council on Printing and Distributing the ‘Broadband China’ Strategy and Implementation Plan” in accordance with the requirements of the “National Informatization Development Strategy 2006–2020” and other requirements. Accordingly, the Chinese government gradually advanced the construction of broadband and other network infrastructure in batches. The Ministry of Industry and Information Technology and the National Development and Reform Commission selected 120 cities (groups) as demonstration sites for “Broadband China” in three batches in 2014, 2015, and 2016. After being selected as a model city (group), the local area strived to increase the scale of broadband users, promote broadband network speed, increase network coverage, and serve economic and social development. After a certain period of construction (about three years), the selected cities needed to reach the national leading level regarding broadband access capability and broadband user penetration rate.
We introduced the dummy variable BIC, respectively referred to whether it was included in the pilot list of “Broadband China” in that year (1 if yes and 0 otherwise), to build a multi-phase DID model. Before the regression, this study verified the parallel trend hypothesis of this model according to the event test method, and the results showed that the important premise assumption of DID method was passed. The regression analysis results of the whole sample are shown in Table 7. All the regression results show that the “Broadband China” pilot has a significant negative impact on pollutant emissions. According to the regression analysis of regional heterogeneity, the results in columns (5) and (6) of Table 7 show that the “Broadband China” pilot has a significant positive impact on environmental quality in eastern and non-eastern regions. In general, the above tests indicate that the development of the digital economy has a significant promotion effect on environmental quality.
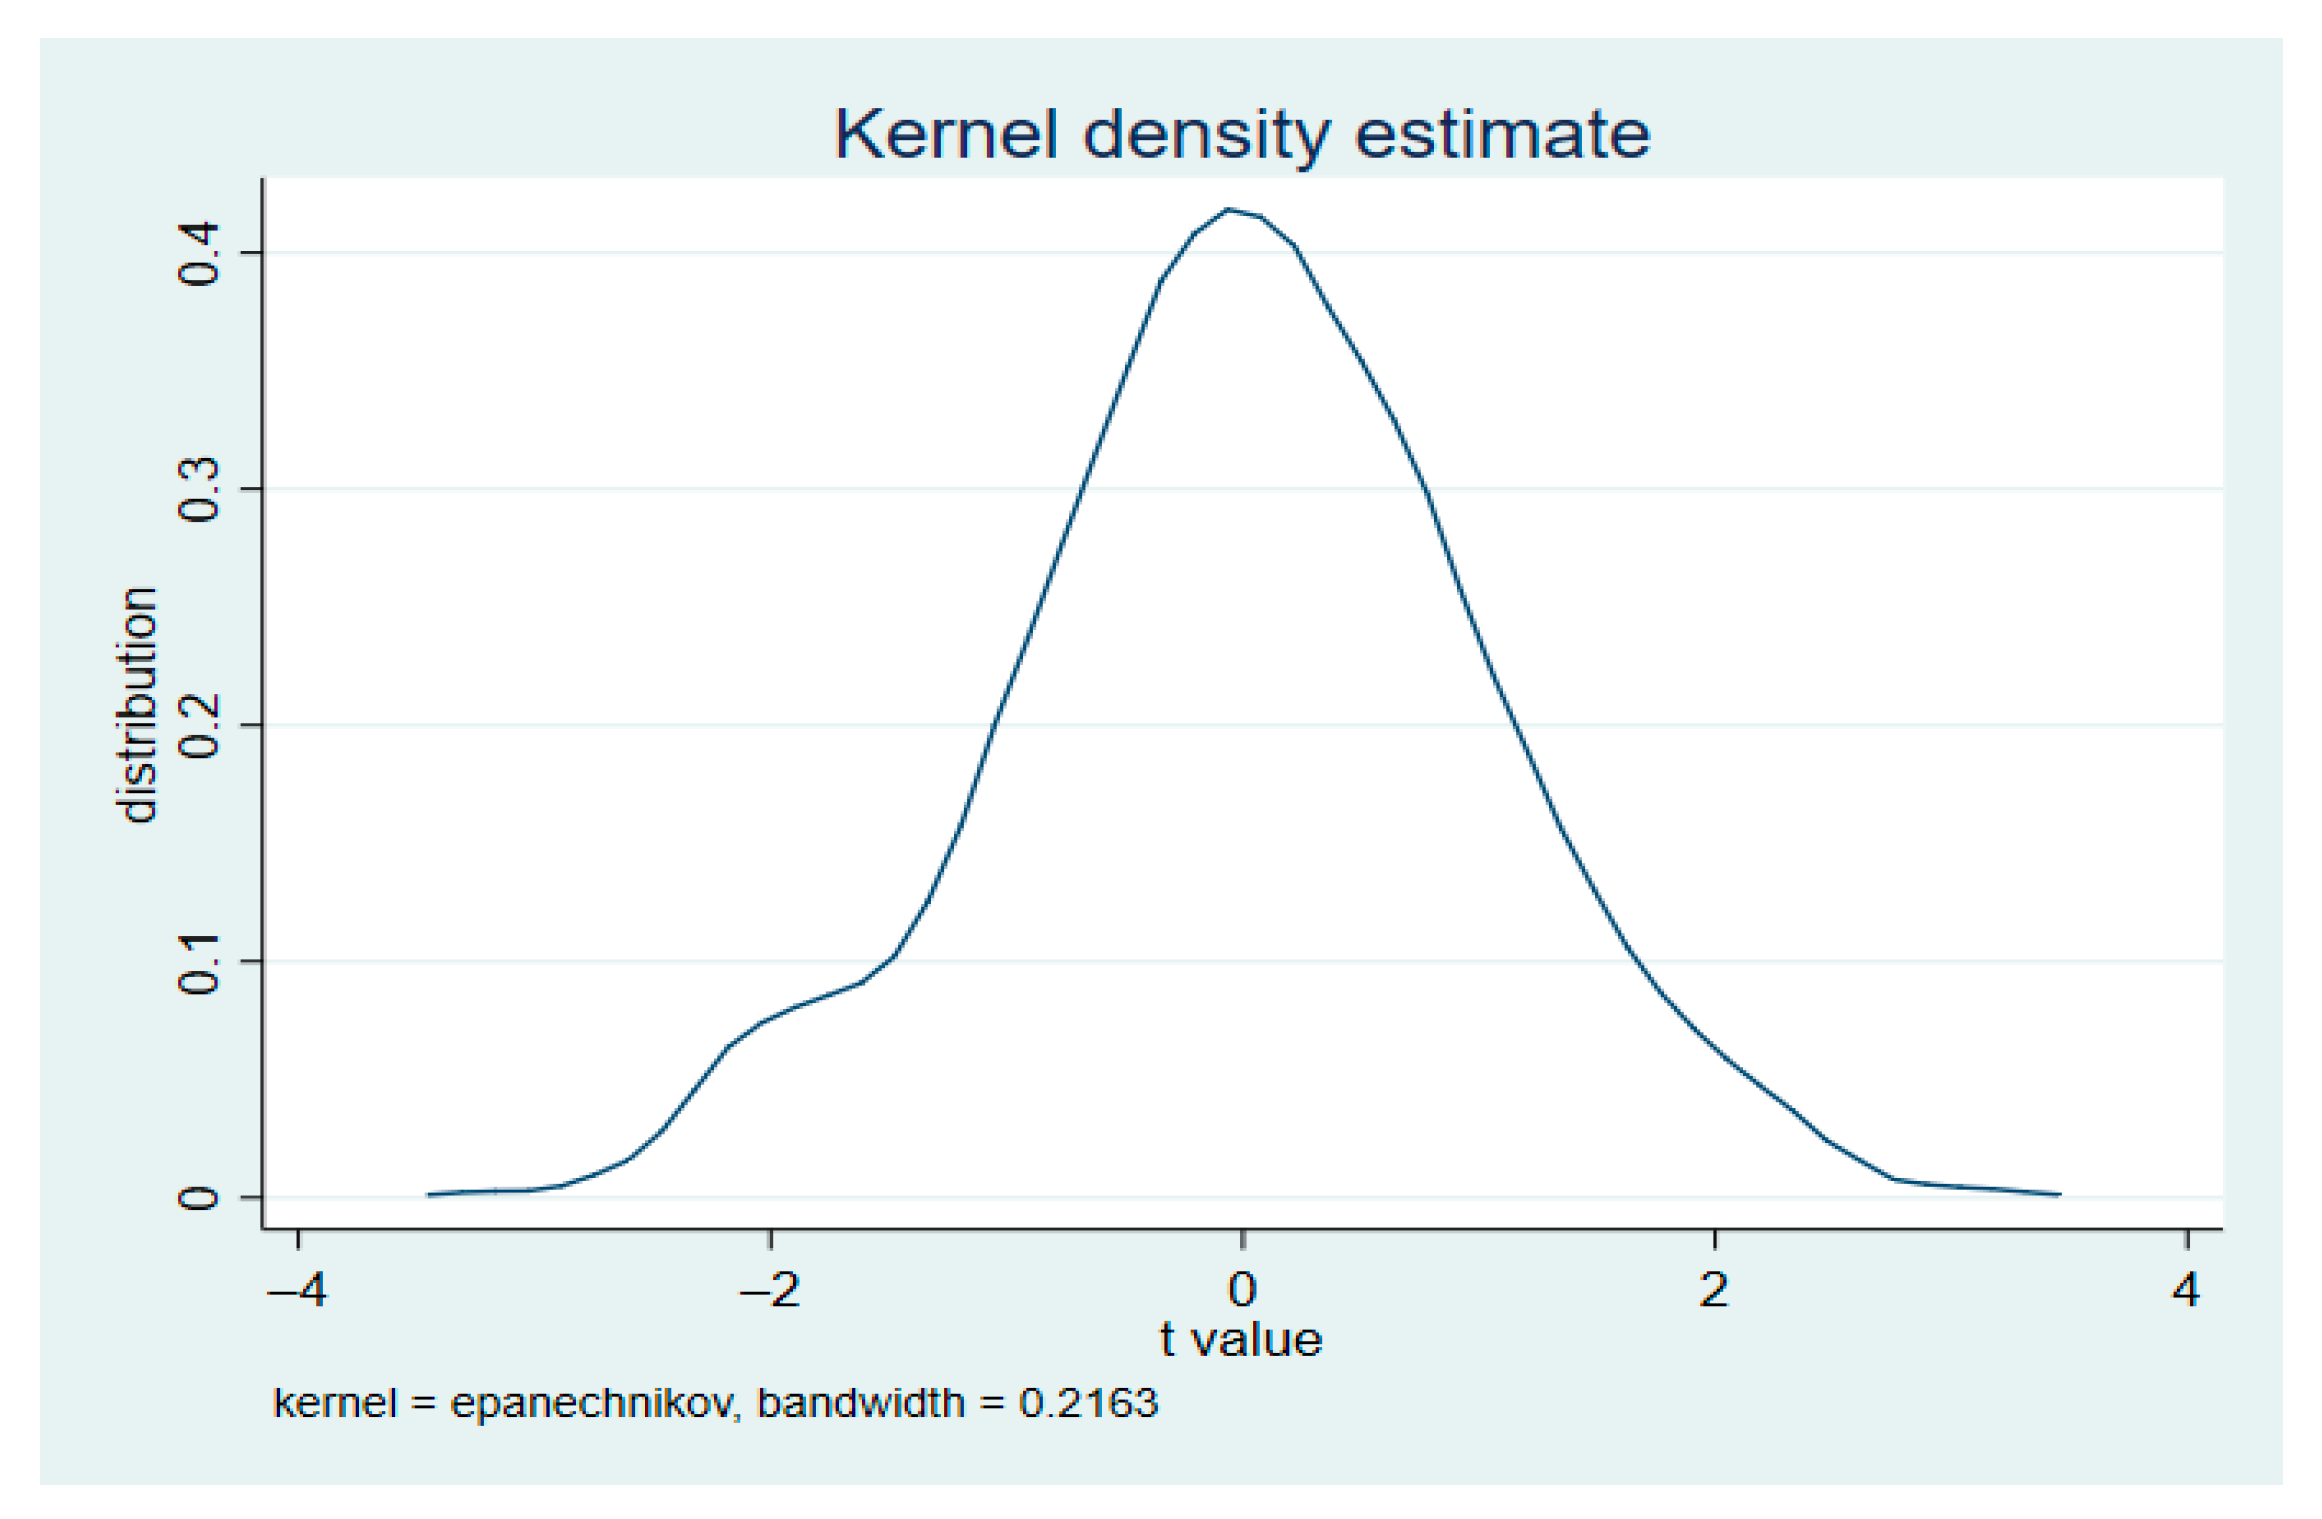
The interference of non-observational factors in regions that change over time is another concern for the recognition hypothesis of the DID method. Although the fixed effects of city and time have been controlled to the regression, other unobservable regional features may have different effects over time. This study uses an indirect placebo test for this purpose. False multiplicative coefficient estimates are generated by randomly generating a list of experimental groups for the Broadband China trial, repeated 1000 times, and then observed the distribution of the 1000 groups, as shown in Figure 5. Its distribution is approximately 0 and approximately normal distribution, indicating that other non-observable factors do not have a significant impact.
4.4. Threshold Regression of the Environmental Effect of the Digital Economy
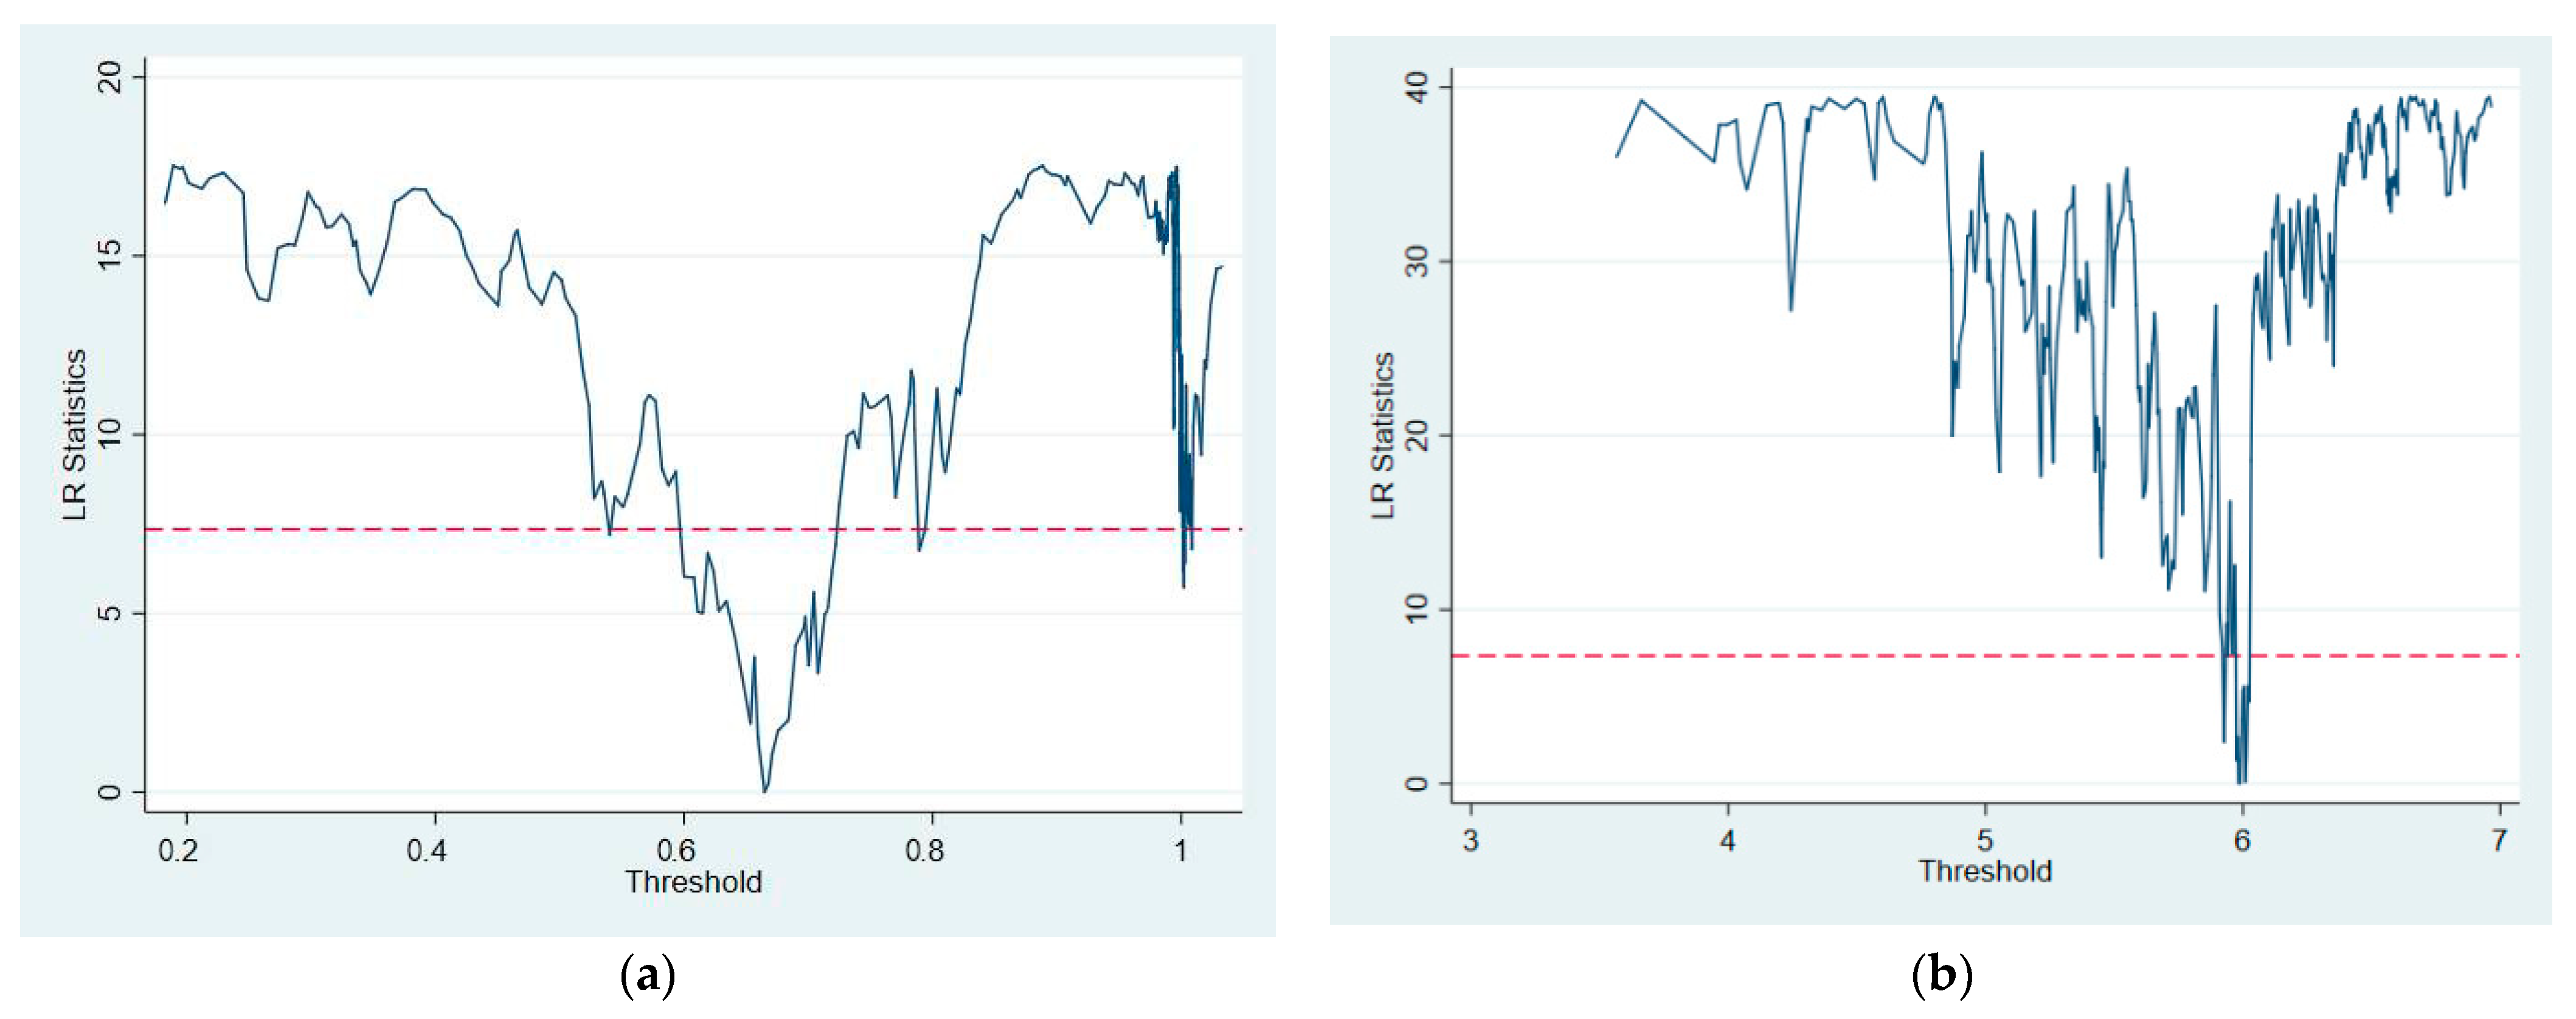
This study introduces a new variable Urban, which refers to the urbanization rate. Satterthwaite [43] studied urban environmental problems in developing countries in Asia, Africa, and Latin America, and found that environmental pollution alleviated with the expansion of city size, whereas environmental problems in small cities were the most serious. The results in Table 7 show that only when the urbanization rate and population density reach the first threshold value can the digital economy have a significant negative impact on pollutant emissions. As shown in Figure 6, the threshold point is the lowest point in the LR graph. That is, the threshold value of the urbanization rate is 5.9885%, and the threshold value of the population density is 0.6648. When the urbanization rate reaches 5.9885%, the digital economy will significantly promote environmental quality. Furthermore, when the population density reaches 0.6648, the negative impact of the digital economy on pollutant discharge can be exerted. Given the shareability of the digital economy [44], population concentration will make the shareability of digital economic activities play better, reducing the energy consumption of digital economic activities to a certain extent.
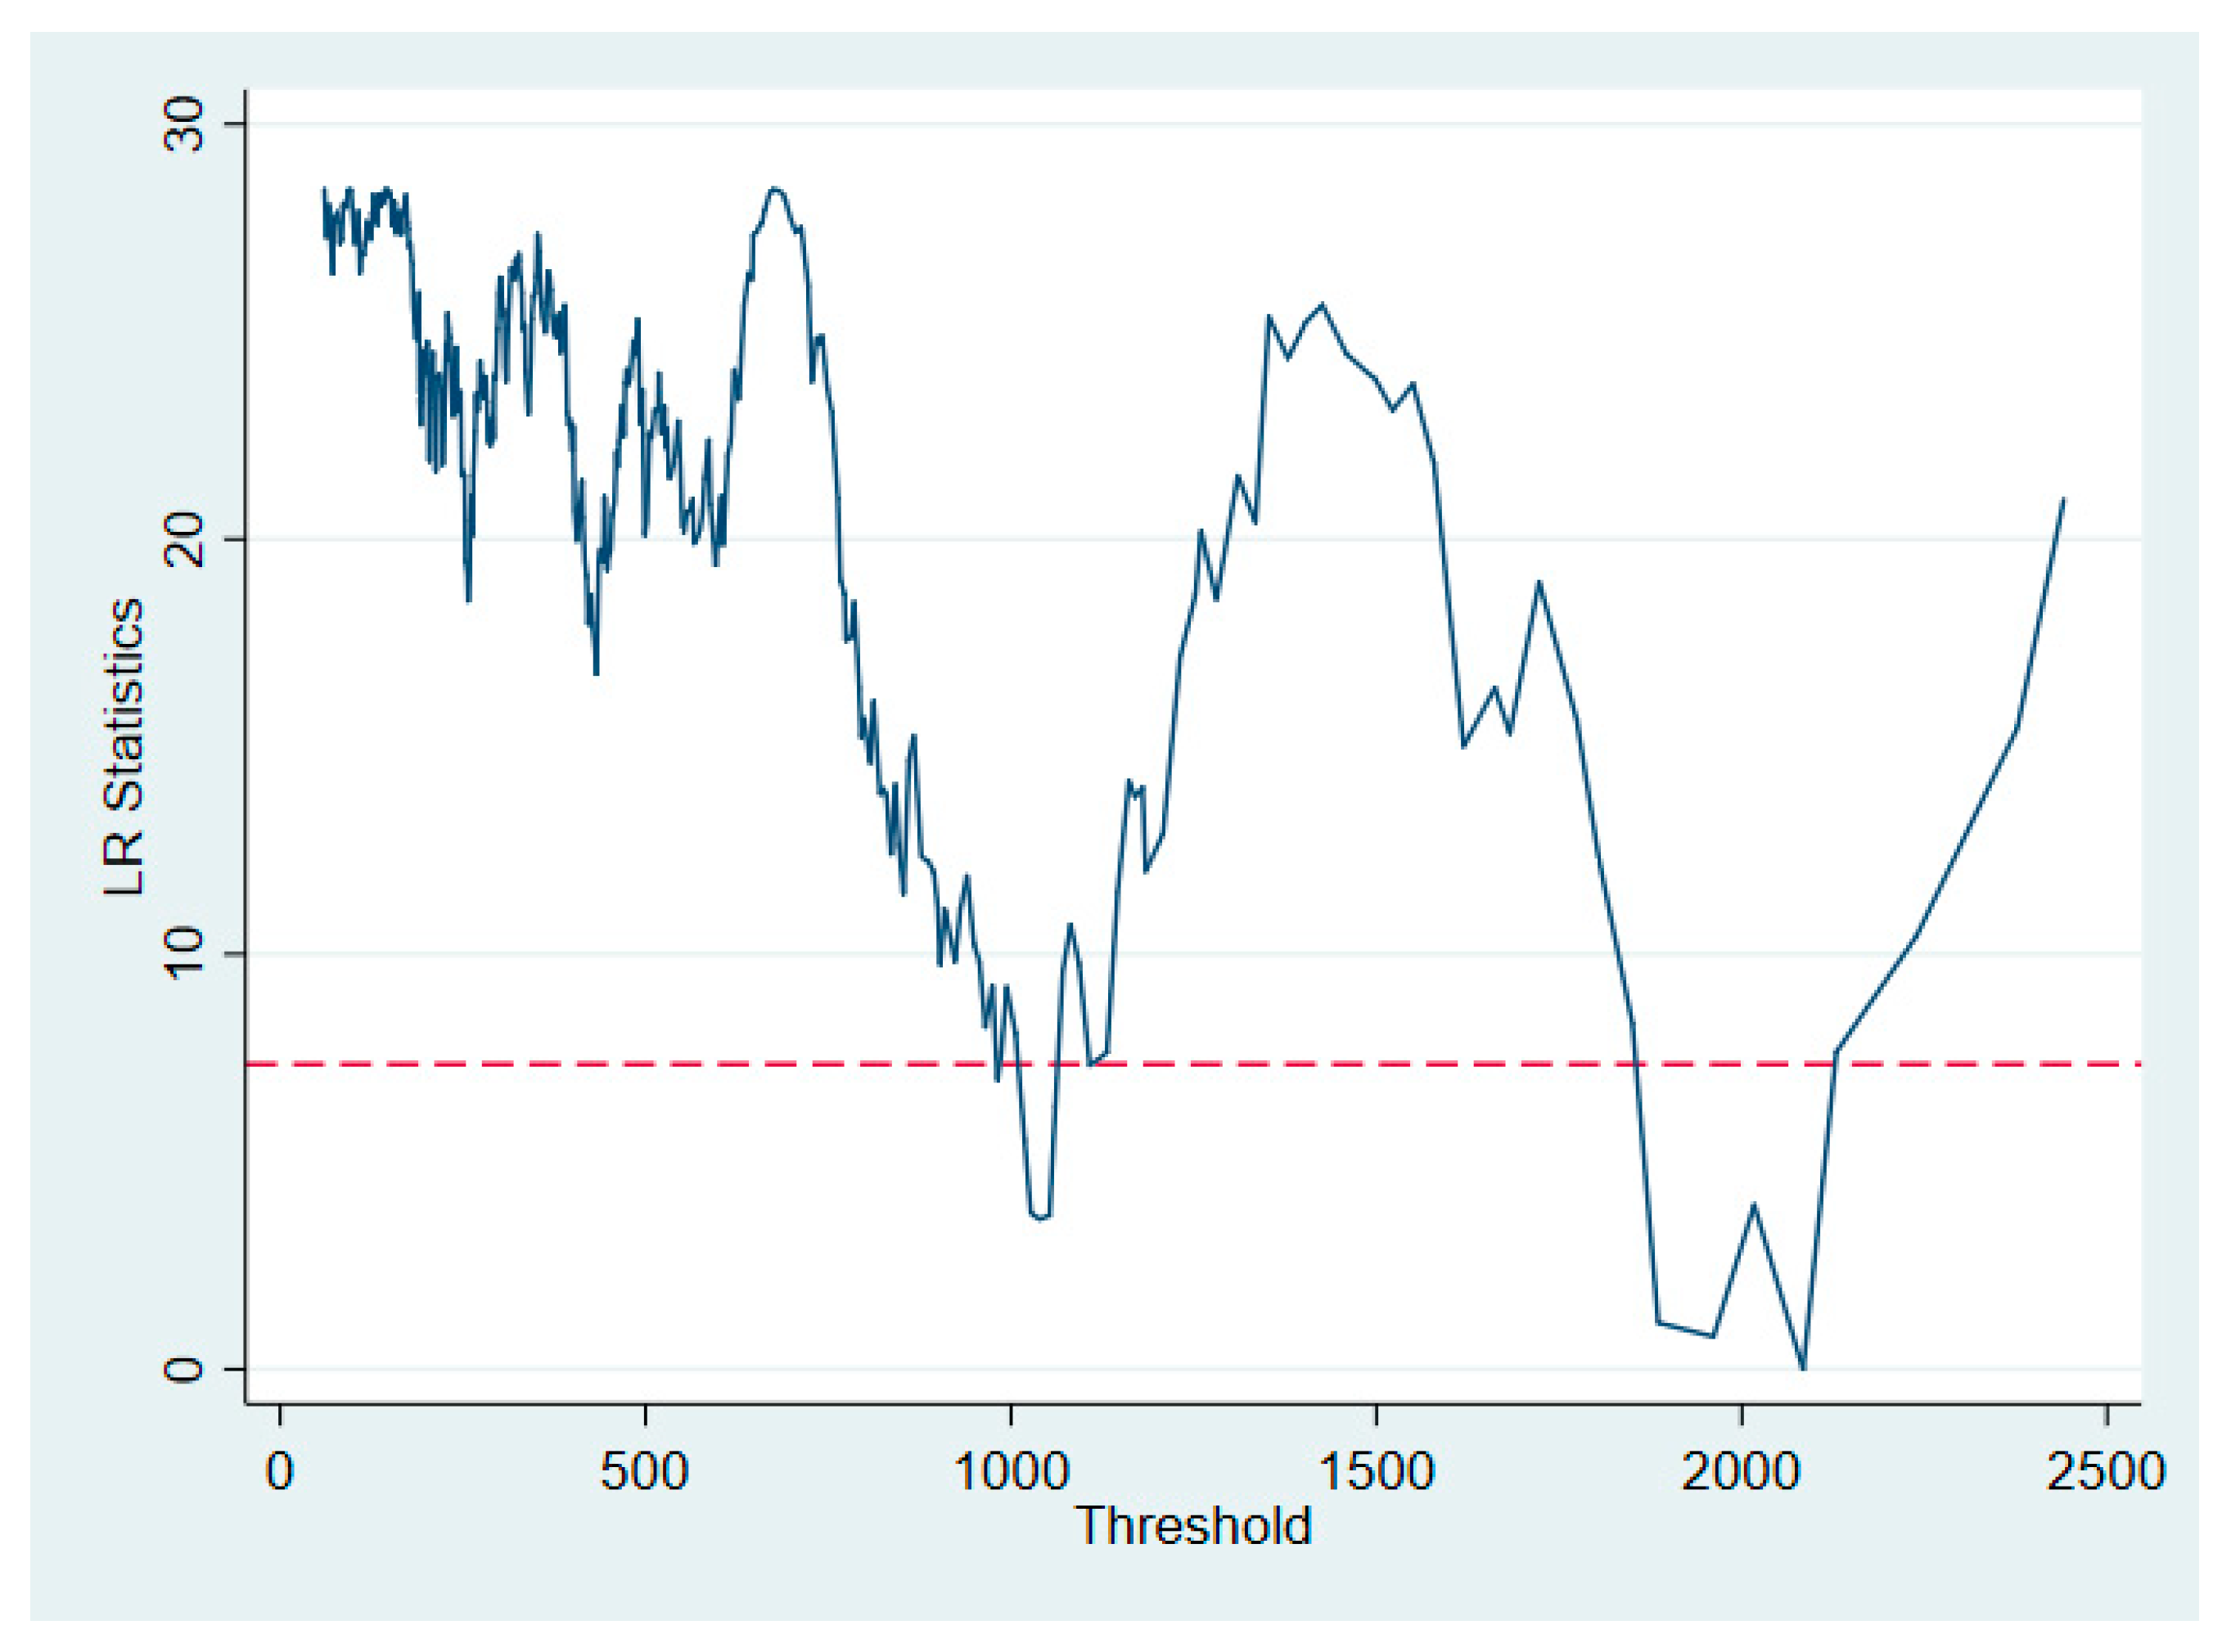
The level of economic development is an important factor affecting environmental pollution. With the improvement of the economic level, the emission of pollutants in the production process may continue to decrease, whereas pollutants may continue to increase [45]. As shown in Figure 7, the threshold point is the lowest in the LR graph; that is, the threshold value of the GDP per capita is more than 2000 hundred CNY. The results in Table 8 show that, when the per capita GDP level exceeds 2084.06 hundred CNY, the digital economy has a significant positive impact on pollutant emissions. That is, the digital economy will generate new pollution emissions and promote the increase of PM2.5 concentration. With the rise in per capita income, the personal possession of information technology has increased, and the shareability brought about by the digital economy has weakened. In the field of transportation, as the economy develops, people’s car ownership will increase, thereby exacerbating environmental pollution.
According to regional heterogeneity, this study takes cities in eastern and non-eastern regions as research samples to study the threshold characteristics when the development level of the digital economy is taken as the threshold variable. The results in Table 8 show that, in the eastern region, when the digital economy development level is less than 0.0700, the digital economy has a significant negative impact on pollutant emissions, whereas the digital economy development level does not have a threshold effect in the non-eastern region.
4.5. Influencing Mechanism of the Environmental Effect of the Digital Economy
Referring to the mediation analysis of Ren et al. [12], we are interested in the contribution of each channel based on the identification of structural effect, technological progress, and scale effect transmission channels. In this study, the logarithm of patent applications, industrial structure, and per capita GDP are used as intermediary variables to study the indirect impact of digital economy development on pollutant emission. The mediating effect estimation results are shown in Table 9.
When the logarithm of patent applications is taken as the explained variable, the coefficient of Digital is significantly positive, indicating that the development of the digital economy has a mediating effect on pollutant emission through technological progress. That is, the development of the digital economy can improve the emission of pollutants by promoting technological progress. This conclusion is consistent with Feng et al. [24], wherein the inhibitory effect of green technological innovation on haze pollution still exists. Meanwhile, technology plays a vital role in sustainable development [46]. Aldieri and Vinci [47] analyzed the role of knowledge spillovers in clean production, that is, the energy field. They concluded that the development of energy technology is conducive to improving environmental sustainability. However, the structure effect is not significant when the industrial structure is taken as the explained variable. When per capita GDP is used as the explained variable, the scale effect is also not significant because of the problem of digital economy GDP statistics, which often cannot be counted.
5. Conclusions and Policy Implications
What is the potential impact of the digital transformation of the global economy on environmental systems? This study first establishes the indicator systems of digital economy and environment. It then calculates the comprehensive indexes of digital economy and environment in China by using the entropy weight method. On this basis, the coupling coordination model is used to evaluate and compare the coupling relationship between the two systems. Second, this study takes PM2.5 concentration as the explained variable and uses the panel data model to investigate the impact of digital economy development on pollutant emission empirically. Finally, this study takes the number of patent applications, per capita GDP, and industrial structure as the intermediary variables to study the transmission mechanism of digital economy development on pollutant emission. The main research conclusions are as follows.
The development of the digital economy is closely related to the environment. On the whole, the development of the digital economy is beneficial to improving environmental quality, but it is not a simple linear relationship. First, the degree of coupling and coordination between digital economy development and environment shows a fluctuating upward trend from 2003 to 2018. Overall, the relationship between the digital economy and the environment is gradually becoming more coordinated. Second, digital economy has a significant negative impact on pollutant emissions, and this conclusion is still valid for eastern and non-eastern regions. Furthermore, the panel threshold regression shows that the digital economy has a significant negative impact on pollutant emissions only when urbanization and population density reach a certain threshold. However, the digital economy has a significant positive impact on pollutant emissions when the per capita GDP reaches a certain threshold. Finally, digital economy development affects pollutant emissions through technological and structural effects.
The following policy recommendations are put forward. First, the study should give play to the role of the digital economy in energy conservation and emission reduction. The digital economy can become a new driving force for high-quality economic development, increase investment on the Internet, and promote the construction of a digital China by accelerating the commercialization of 5G, the construction of big data models, and the application of artificial intelligence to consolidate information technology further. Second, the level of urbanization and the quality of economic development should be improved. The population of sprawl areas and the extensive economic growth is the main reason for the poor economic quality. Authorities should actively play positive externalities of population agglomeration, improve the level of population quality and environmental protection consciousness, transform the mode of economic development and rational utilization of foreign direct investment, promote transformation and upgrading of industry, and foster the development of clean energy for the environment friendly industrial subsidies and support. Finally, local governments should pay more attention to the role of digital technology in green innovation and industrial structure upgrading. On the basis of technological progress, the government should rely on smart industries to realize the transformation and upgrading of urban industrial structure and bring into play the pollution reduction effect of smart city structure. The government should also encourage enterprises to eliminate outdated production capacity and carry out industrial upgrades to achieve a win-win situation that promotes economic development and reduces environmental pollution.
Author Contributions
Conceptualization, Z.L. and H.W.; methodology N.L. and H.W.; data curation, N.L.; writing, Z.L. and N.L.; supervision, H.W. All authors have read and agreed to the published version of the manuscript.
Funding
This research was funded by the National Natural Science Foundation of China (71904074), and the Youth Program of National Social Science Foundation of China (20CJY031).
Institutional Review Board Statement
Not applicable.
Informed Consent Statement
Not applicable.
Data Availability Statement
The data presented in this study are available on request from the corresponding author.
Conflicts of Interest
The authors declare no conflict of interest.
References
- Ivanova, I.; Sceulovs, D. Identifying elements of the digital economy ecosystem. J. Bus. Mgmt. 2018, 16, 5–14. [Google Scholar]
- Kunkel, S.; Matthess, M. Digital transformation and environmental sustainability in industry: Put-ting expectations in Asian and African policies into perspective. Environ. Sci. Pol. 2020, 112, 318–329. [Google Scholar] [CrossRef]
- Wen, H.; Lee, C.C.; Song, Z. Digitalization and environment: How does ICT affect enterprise environmental performance? Environ. Sci. Pollut. Res. 2021, 1–6. [Google Scholar] [CrossRef]
- Tian, J.; Liu, Y. Research on Total Factor Productivity Measurement and Influencing Factors of Digital Economy Enterprises. Proced. Comput. Sci. 2021, 187, 390–395. [Google Scholar] [CrossRef]
- Li, K.; Dan, J.K.; Karl, R.L.; Robert, J.K.; Maurizio, N. How should we understand the digital economy in Asia? Critical assessment and research agenda. Electron. Commer. Res. Appl. 2020, 44, 101004. [Google Scholar] [CrossRef] [PubMed]
- Zhang, S.; Li, Y.; Hao, Y.; Zhang, Y. Does public opinion affect air quality? Evidence based on the monthly data of 109 prefecture-level cities in China. Energy Policy 2018, 116, 299–311. [Google Scholar] [CrossRef]
- Hou, Q. Analysis on the influence of media supervision on environmental pollution control. Caribb. J. Sci. 2019, 52, 378–380. [Google Scholar]
- Miao, C.L.; Meng, X.N.; Duan, M.M.; Wu, X.Y. Energy consumption, environmental pollution, and technological innovation efficiency: Taking industrial enterprises in China as empirical analy-sis object. Environ. Sci. Pollut. Res. 2020, 27, 34147–34157. [Google Scholar] [CrossRef]
- Peters, A. Particulate matter and heart disease: Evidence from epidemiological studies. Toxicol. Appl. Pharmacol. 2005, 207, 477–482. [Google Scholar] [CrossRef]
- Chang, T.; Graff Zivin, J.; Gross, T.; Neidell, M. Particulate pollution and the productivity of pear packers. Am. Econ. 2016, 8, 141–169. [Google Scholar] [CrossRef] [Green Version]
- Chen, J.; Huang, J.; Huang, X.; Sun, S.; Hao, Y.; Wu, H. How does new environmental law affect public environmental protection activities in China? Evidence from structural equation model analysis on legal cognition. Sci. Total Environ. 2020, 714, 136558. [Google Scholar] [CrossRef] [PubMed]
- Ren, S.; Hao, Y.; Xu, L.; Wu, H.; Ba, N. Digitalization and energy: How does internet development affect China’s energy consumption? Energy Econ. 2021, 98, 105220. [Google Scholar] [CrossRef]
- Granell, C.; Havlik, D.; Schade, S.; Sabeur, Z.; Delaney, C.; Pielorz, J.; Usländer, T.; Mazzetti, P.; Schleidt, K.; Kobernus, M.; et al. Future Internet technologies for environmental applications. Environ. Model. Softw. 2016, 78, 1–15. [Google Scholar] [CrossRef]
- Li, Y.; Lim, M.K.; Tan, Y.; Lee, Y.; Tseng, M.L. Sharing economy to improve routing for urban lo-gistics distribution using electric vehicles. Resour. Conserv. Recycl. 2020, 153, 104585. [Google Scholar] [CrossRef]
- Li, K.; Fang, L.; He, L. How urbanization affects China’s energy efficiency: A spatial econometric analysis. J. Clean. Prod. 2018, 200, 1130–1141. [Google Scholar] [CrossRef]
- Park, Y.; Meng, F.; Baloch, M.A. The effect of ICT, financial development, growth, and trade openness on CO2 emissions: An empirical analysis. Environ. Sci. Pollut. Res. 2018, 25, 30708–30719. [Google Scholar] [CrossRef] [PubMed]
- Avom, D.; Nkengfack, H.; Fotio, H.K.; Totouom, A. ICT and environmental quality in Sub-Saharan Africa: Effects and transmission channels. Technol. Forecast. Soc. Chang. 2020, 155, 120028. [Google Scholar] [CrossRef]
- Higón, D.A.; Gholami, R.; Shirazi, F. ICT and environmental sustainability: Aglobal perspective. Telemat. Inform. 2017, 34, 85–95. [Google Scholar] [CrossRef]
- Moyer, J.D.; Hughes, B.B. ICTs: Do they contribute to increased carbon emissions? Technol. Forecast. Soc. 2012, 79, 919–931. [Google Scholar] [CrossRef]
- Sueyoshi, T.; Yuan, Y. China’s regional sustainability and diversified resource allocation: DEA en-vironmental assessment on economic development and air pollution. Energy Econ. 2015, 49, 239–256. [Google Scholar] [CrossRef]
- Lu, Z.-N.; Chen, H.; Hao, Y.; Wang, J.; Song, X.; Mok, T.M. The dynamic relationship between environmental pollution, economic development and public health: Evidence from China. J. Clean. Prod. 2017, 166, 134–147. [Google Scholar] [CrossRef]
- Yan, D.; Ren, X.; Kong, Y.; Ye, B.; Liao, Z. The heterogeneous effects of socioeconomic determi-nants on PM2. 5 concentrations using a two-step panel quantile regression. Appl. Energy 2020, 272, 115246. [Google Scholar] [CrossRef]
- Yang, H.; Ma, J. Correlation analysis between regional economic differences and environmental pollution based on Kuznets curve model. Environ. Technol. Innov. 2021, 22, 101444. [Google Scholar] [CrossRef]
- Feng, Y.; Wang, X.; Liang, Z. How does environmental information disclosure affect economic development and haze pollution in Chinese cities? The mediating role of green technology innova-tion. Sci. Total Environ. 2021, 775, 145811. [Google Scholar] [CrossRef]
- Wen, H.; Lee, C.C.; Zhou, F. Green credit policy, credit allocation efficiency and upgrade of ener-gy-intensive enterprises. Energy Econ. 2021, 94, 105099. [Google Scholar] [CrossRef]
- Jiang, H.; Jiang, P.; Wang, D.; Wu, J. Can smart city construction facilitate green total factor productivity? A quasi-natural experiment based on China’s pilot smart city. Sustain. Cities Soc. 2021, 69, 102809. [Google Scholar] [CrossRef]
- Hampton, S.E.; Strasser, C.; Tewksbury, J.; Gram, W.K.; Budden, A.; Batcheller, A.L.; Duke, C.; Porter, J. Big data and the future of ecology. Front. Ecol. Environ. 2013, 11, 156–162. [Google Scholar] [CrossRef] [Green Version]
- Kwon, O.; Lee, N.; Shin, B. Data quality management, data usage experience and acquisition in-tention of big data analytics. Int. J. Inform. Manag. 2014, 34, 387–394. [Google Scholar] [CrossRef]
- Salahuddin, M.; Alam, K. Information and Communication Technology, electricity consumption and economic growth in OECD countries: A panel data analysis. Int. J. Electr. Power Energy Syst. 2016, 76, 185–193. [Google Scholar] [CrossRef] [Green Version]
- Zhou, X.; Zhou, D.; Wang, Q.; Su, B. How information and communication technology drives carbon emissions: A sector-level analysis for China. Energy Econ. 2019, 81, 380–392. [Google Scholar] [CrossRef]
- Haseeb, A.; Xia, E.; Saud, S.; Ahmad, A.; Khurshid, H. Does information and communication technologies improve environmental quality in the era of globalization? An empirical analysis. Environ. Sci. Pollut. Res. 2019, 26, 8594–8608. [Google Scholar] [CrossRef] [PubMed]
- Bolla, R.; Bruschi, R.; Davoli, F.; Cucchietti, F. Energy effificiency in the future internet: A survey of existing approaches and trends in energy-aware fifixed network infrastructures. IEEE Commun. Surv. Tutor. 2010, 13, 223–244. [Google Scholar] [CrossRef]
- Qin, J.; Liu, Y.; Grosvenor, R. Data analytics for energy consumption of digital manufacturing sys-tems using Internet of Things method. In Proceedings of the 13th IEEE Conference on Automation Science and Engi-neering (CASE), Xi’an, China, 20 August 2017; pp. 482–487. [Google Scholar]
- Lopez, L.J.R.; Aponte, G.P.; Garcia, A.R. Internet of Things Applied in Healthcare Based on Open Hardware with Low-Energy Consumption. Health Inform. Res. 2019, 25, 230–235. [Google Scholar] [CrossRef] [PubMed]
- Kenny, C. The internet and economic growth in less-developed countries: A case of managing ex-pectations? Oxf. Dev. Stud. 2003, 31, 99–113. [Google Scholar] [CrossRef] [Green Version]
- Hao, Y.; Guo, Y.; Guo, Y.; Wu, H.; Ren, S. Does outward foreign direct investment (OFDI) affect the home country’s environmental quality? The case of China. Struct. Chang. Econ. Dyn. 2020, 52, 109–119. [Google Scholar] [CrossRef]
- Li, G.-S.; Yan, J.-H.; Chen, L.; Wu, J.; Lin, Q.-Y.; Zhang, Y. Energy Consumption Optimization With a Delay Threshold in Cloud-Fog Cooperation Computing. IEEE Access 2019, 7, 159688–159697. [Google Scholar] [CrossRef]
- Li, Q.; Zhao, J.; Gong, Y.; Zhang, Q. Energy-efficient computation offloading and resource allocation in fog computing for internet of everything. China Commun. 2019, 16, 32–41. [Google Scholar]
- Yang, X.; Wu, H.; Ren, S.; Ran, Q.; Zhang, J. Does the development of the internet contribute to air pollution control in China? Mechanism discussion and empirical test. Struct. Chang. Econ. Dyn. 2021, 56, 207–224. [Google Scholar] [CrossRef]
- Van Donkelaar, A.; Martin, R.V.; Brauer, M.; Boys, B.L. Use of Satellite Observations for Long-Term Exposure Assessment of Global Concentrations of Fine Particulate Matter. Environ. Health Perspect. 2015, 123, 135–143. [Google Scholar] [CrossRef] [PubMed] [Green Version]
- Fourcade, M.; Kluttz, D.N. A Maussian bargain: Accumulation by gift in the digital economy. Big Data Soc. 2020, 7, 1–16. [Google Scholar] [CrossRef]
- Wu, H.; Hao, Y.; Ren, S.; Yang, X.; Xie, G. Does internet development improve green total factor energy efficiency? Evidence from China. Energy Policy 2021, 153, 112247. [Google Scholar] [CrossRef]
- Satterthwaite, D. Environmental Transformations in Cities as They Get Larger, Wealthier and Better Managed. Geogr. J. 1997, 163, 216–244. [Google Scholar] [CrossRef]
- Shaikh, A.A.; Sharma, R.; Karjaluoto, H. Digital innovation & enterprise in the sharing economy: An action research agenda. Digit. Bus. 2020, 1, 100002. [Google Scholar] [CrossRef]
- Baiocchi, G.; Minx, J. The impact of social factors and consumer behavior on carbon dioxide emis-sions in the United Kingdom. J. Ind. Ecol. 2010, 14, 50–72. [Google Scholar] [CrossRef]
- Wang, H.; Huang, J.; Zhou, H.; Deng, C.; Fang, C. Analysis of sustainable utilization of water resources based on the improved water resources ecological footprint model: A case study of Hubei Province, China. J. Environ. Manag. 2020, 262, 110331. [Google Scholar] [CrossRef] [PubMed]
- Aldieri, L.; Vinci, C.P. Climate change and knowledge spillovers for cleaner production: New in-sights. J. Clean Prod. 2020, 217, 122729. [Google Scholar] [CrossRef]
Figure 1.
Mechanism analysis of digital economy development and pollutant emission.

Figure 2.
Digital economy and ecological environment analysis diagram.

Figure 3.
Comparison chart of coupling degree and coupling coordination degree.

Figure 4.
Spatial differentiation of coupling coordination degree in 2003 (a) and 2018 (b).

Figure 5.
Placebo test of policy effects.

Figure 6.
Threshold estimates and confidence intervals of Urban (a) and lnPop (b).

Figure 7.
Threshold estimates and confidence intervals of RGDP.


Table 1.
Evaluation indexes of the digital economy system and environment system.
| Coupling System | Criterion Layer | Index Layer | Unit | Types | Weights |
|---|---|---|---|---|---|
| Digital Economy Subsystem (U1) | Digital infrastructure | Number of Internet users per 100 people | Household/100 person | + | 0.1645 |
| Proportion of Computer Service and Software Practitioners | % | + | 0.0909 | ||
| Total telecommunications business per capita | yuan/person | + | 0.0971 | ||
| Number of mobile phone users per 100 people | Department/100 person | + | 0.3928 | ||
| Digital talent | Education expenditure/General public budget expenditure | % | + | 0.0492 | |
| Number of undergraduate graduates/number of undergraduate students | % | + | 0.0752 | ||
| Digital industry value | Primary industry added value/GDP | % | + | 0.0703 | |
| Secondary industry added value/GDP | % | + | 0.0218 | ||
| Added value of tertiary industry/GDP | % | + | 0.0382 | ||
| Environment Subsystem (U2) | Ecological environment | Industrial wastewater discharge per capita | t/person | - | 0.2115 |
| Industrial SO2 emissions per capita | t/person | - | 0.1540 | ||
| Industrial smoke and dust emissions per capita | t/ person | - | 0.0568 | ||
| PM2.5 concentration | μg/m3 | - | 0.0183 | ||
| Per capita solid waste emissions | t/person | - | 0.0030 | ||
| Resource consumption | Energy consumption | 10 thousand t | - | 0.0811 | |
| Energy consumption per unit GDP | t standard coal/10,000 yuan | - | 0.0024 | ||
| GDP/ Construction land area | 100 million yuan /km2 | + | 0.1785 | ||
| Water consumption per unit GDP | m3/yuan | - | 0.0032 | ||
| Conservation of ecosystem | Comprehensive utilization rate of industrial solid waste | % | + | 0.0465 | |
| Centralized sewage treatment rate | % | + | 0.0523 | ||
| Harmless treatment rate of domestic garbage | % | + | 0.0446 | ||
| Urban green area per capita | ha/ person | + | 0.1478 |
Note: Department/100 person indicates the number of mobile phone users per 100 people. Household/100 person indicates the number of mobile Internet users per 100 people.
Table 2.
Standard for coupling coordination degree classification.
| Coupling Coordination Degree Interval | Coordination Level | Coupling Coordination Degree |
|---|---|---|
| (0.0~0.1) | 1 | Extremely unbalanced |
| [0.1~0.2) | 2 | Seriously unbalanced |
| [0.2~0.3) | 3 | Moderately unbalanced |
| [0.3~0.4) | 4 | Slightly unbalanced |
| [0.4~0.5) | 5 | On the verge of disorder |
| [0.5~0.6) | 6 | Barely balanced |
| [0.6~0.7) | 7 | Primarily balanced |
| [0.7~0.8) | 8 | Intermediately balanced |
| [0.8~0.9) | 9 | Favorably balanced |
| [0.9~1.0) | 10 | Superiorly balanced |
Note: Coupling coordination degree interval from high to low represents the process of gradual coordination.
Table 3.
Variable definition.
| Variables | Definition | |
|---|---|---|
| Dependent Variables | Digital | Comprehensive development level of digital economy |
| PM2.5 | PM2.5 concentration | |
| Independent Variables | Structure | Industrial structure, added value of tertiary industry/added value of secondary industry |
| RBuild | Construction land area per capita | |
| RRoad | Road area per capita | |
| Coal | Coal consumption/100 | |
| Finance | Per capita loans from financial institutions/100 | |
| lnExpen | Logarithm of per capita spending on technology | |
| RGDP | GDP per capita/100 | |
| lnPop | Logarithm of population density | |
| Other Variables | lnRD | Logarithm of patent applications |
| Urban | Non-agricultural permanent population/total population |
Table 4.
Statistical description of variables.
| Variable | Obs | Mean | Std. Dev. | Min | Max |
|---|---|---|---|---|---|
| Digital | 3472 | 0.116 | 0.0332 | 0.0243 | 0.480 |
| PM2.5 | 3472 | 45.20 | 19.02 | 4.882 | 110.1 |
| Structure | 3472 | 1.319 | 0.807 | 0.0714 | 10.50 |
| RBuild | 3472 | 0.435 | 0.532 | 0.0247 | 7.750 |
| RRoad | 3472 | 0.221 | 0.679 | 0.0030 | 10.95 |
| Coal | 3472 | 148.6 | 89.86 | 3.322 | 429.4 |
| Finance | 3472 | 552.8 | 809.6 | 14.48 | 16,411 |
| lnExpen | 3472 | 8.217 | 0.922 | 5.943 | 11.00 |
| RGDP | 3472 | 593.9 | 826.0 | 15.39 | 15,039 |
| lnPop | 3472 | 5.861 | 0.785 | 3.054 | 7.882 |
| lnRD | 3472 | 6.696 | 1.808 | 1.791 | 11.707 |
Table 5.
Provincial coupling coordination degree.
| 2003 | 2004 | 2011 | 2012 | 2017 | 2018 | |
|---|---|---|---|---|---|---|
| Anhui | 0.23609 | 0.33442 | 0.35523 | 0.42164 | 0.66701 | 0.66190 |
| Fujian | 0.26877 | 0.35978 | 0.38097 | 0.44279 | 0.68970 | 0.68313 |
| Gansu | 0.23975 | 0.33126 | 0.34562 | 0.41459 | 0.66710 | 0.66176 |
| Guangdong | 0.31432 | 0.39475 | 0.43590 | 0.48242 | 0.69832 | 0.69659 |
| Guizhou | 0.24454 | 0.33929 | 0.35324 | 0.41835 | 0.66563 | 0.66182 |
| Hainan | 0.25207 | 0.34020 | 0.41477 | 0.46359 | 0.69595 | 0.68692 |
| Hebei | 0.24378 | 0.34456 | 0.35239 | 0.42463 | 0.68061 | 0.66885 |
| Henan | 0.23277 | 0.32620 | 0.33209 | 0.40813 | 0.65829 | 0.65628 |
| Heilongjiang | 0.24308 | 0.34371 | 0.37980 | 0.43764 | 0.66268 | 0.65354 |
| Hubei | 0.22826 | 0.33128 | 0.33815 | 0.41511 | 0.66146 | 0.65977 |
| Hunan | 0.24032 | 0.32808 | 0.34466 | 0.41795 | 0.66158 | 0.65521 |
| Jilin | 0.23623 | 0.32948 | 0.36996 | 0.43197 | 0.66449 | 0.65662 |
| Jiangsu | 0.26403 | 0.35557 | 0.38442 | 0.44627 | 0.68827 | 0.68142 |
| Jiangxi | 0.24145 | 0.32876 | 0.35284 | 0.42217 | 0.66203 | 0.65533 |
| Liaoning | 0.26945 | 0.34489 | 0.37393 | 0.44043 | 0.67349 | 0.66393 |
| Qinghai | 0.29039 | 0.36601 | 0.42815 | 0.49185 | 0.71656 | 0.73527 |
| Shandong | 0.24737 | 0.34026 | 0.37084 | 0.43607 | 0.67810 | 0.67260 |
| Shanxi | 0.24130 | 0.33672 | 0.35015 | 0.42324 | 0.67019 | 0.66245 |
| Shaanxi | 0.22505 | 0.33772 | 0.36670 | 0.43737 | 0.67076 | 0.66884 |
| Shanghai | 0.29490 | 0.39473 | 0.33550 | 0.48663 | 0.76300 | 0.77396 |
| Sichuan | 0.23511 | 0.32704 | 0.34383 | 0.42472 | 0.67340 | 0.66791 |
| Tianjin | 0.26413 | 0.39750 | 0.49108 | 0.54200 | 0.73094 | 0.73573 |
| Yunnan | 0.23806 | 0.34364 | 0.35025 | 0.41786 | 0.66124 | 0.65566 |
| Zhejiang | 0.28748 | 0.36171 | 0.38794 | 0.44935 | 0.69310 | 0.68595 |
| Chongqing | 0.23682 | 0.37655 | 0.46728 | 0.50815 | 0.74964 | 0.70508 |
Note: The results only show the degree of coupling and coordination of the two systems in key years in each province.
Table 6.
Impact of digital economy development on PM2.5.
| Variables | Full Sample | East | Non-East | East | Non-East | |
|---|---|---|---|---|---|---|
| (1) | (2) | (3) | (4) | (5) | (6) | |
| Digital | −143.3729 *** | −11.8640 * | −41.4015 ** | −96.6434 *** | −5.3654 | −21.8883 ** |
| (−5.24) | (−1.66) | (−2.03) | (−5.96) | (−0.62) | (−2.08) | |
| Structure | 2.0440 *** | −0.0572 | 1.6686 *** | 0.7928 *** | −0.5621 | −0.4475 |
| (7.13) | (−0.25) | (2.75) | (3.12) | (−1.53) | (−1.56) | |
| RBuild | −7.2931 *** | 4.6003 *** | −14.3300 *** | −4.8096 *** | 4.5510 | 5.4284 *** |
| (−4.24) | (2.76) | (−2.75) | (−2.86) | (1.08) | (2.93) | |
| RRoad | 6.3070 *** | 3.4064 *** | 11.4432 | 6.4978 *** | 50.9160 *** | 3.3680 *** |
| (10.78) | (3.18) | (1.23) | (10.74) | (2.66) | (2.87) | |
| Coal | 0.0501 *** | 0.0554 *** | 0.1093 *** | 0.0342 *** | 0.0526 *** | 0.0747 *** |
| (18.30) | (15.04) | (26.38) | (11.49) | (10.97) | (13.43) | |
| Finance | 0.0119 *** | 0.0080 *** | 0.0167 * | 0.0117 *** | 0.0153 *** | 0.0072 *** |
| (4.67) | (5.11) | (1.82) | (4.19) | (4.31) | (4.14) | |
| lnExpen | −8.1810 *** | −2.0888 *** | 0.2199 | −8.0036 *** | 0.2936 | −3.2427 *** |
| (−13.06) | (−3.30) | (0.31) | (−12.67) | (0.29) | (−3.83) | |
| RGDP | −0.0091 *** | −0.0081 *** | −0.0121 | −0.0096 *** | −0.0149 *** | −0.0077 *** |
| (−3.04) | (−4.67) | (−1.17) | (−3.10) | (−3.77) | (−4.00) | |
| lnPop | 15.6899 *** | 1.6077 | 10.0100 *** | 19.3451 *** | −0.2698 | 1.0724 |
| (38.83) | (0.64) | (9.45) | (58.45) | (−0.07) | (0.33) | |
| City fixed effect | No | Yes | No | No | Yes | Yes |
| Year fixed effect | No | Yes | No | No | Yes | Yes |
| Observations | 3472 | 3472 | 1312 | 2160 | 1312 | 2160 |
| R-squared | 0.603 | 0.566 | 0.583 | 0.764 | 0.613 | 0.604 |
Note: The linear relationship was estimated by considering the coefficient of Digital as the dependent variable. The report in the parentheses in the table is the T value. ***, **, and * indicate that the regression results pass the significance test at the 1%, 5%, and 10% confidence levels, respectively.
Table 7.
Robustness test of the impact of the digital economy on environmental quality.
| Variables | Full Sample | East | Non-East | East | Non-East | |
|---|---|---|---|---|---|---|
| (1) | (2) | (3) | (4) | (5) | (6) | |
| BIC | −3.6370 *** | −0.9827 ** | −5.5323 *** | −5.2296 *** | −1.1685 ** | −1.0489 * |
| (−4.38) | (−2.44) | (−4.35) | (−5.87) | (−2.21) | (−1.95) | |
| Controls | Yes | Yes | Yes | Yes | Yes | Yes |
| City fixed effect | No | Yes | No | No | Yes | Yes |
| Year fixed effect | No | Yes | No | No | Yes | Yes |
| Observations | 3472 | 3472 | 1312 | 2160 | 1312 | 2160 |
| R-squared | 0.537 | 0.567 | 0.557 | 0.696 | 0.614 | 0.604 |
Note: The report in the parentheses in the table is the T value. ***, **, and * indicate that the regression results pass the significance test at the 1%, 5%, and 10% confidence levels, respectively.
Table 8.
Estimation results of the threshold panel model.
| Variables | q = Urban | q = lnPop | q = RGDP | q = Digital | |
|---|---|---|---|---|---|
| (1) Full Sample | (2) Full Sample | (3) Full Sample | (4) East | (5) Non-East | |
| Digital × (q ≤ γ) | 8.949 | −2.898 | −11.09 | −69.80 *** | 2.964 |
| (7.882) | (7.425) | (7.13) | (17.21) | (12.73) | |
| Digital × (q > γ) | −20.76 *** | −17.15 ** | 21.93 ** | −4.599 | −10.55 |
| (7.299) | (7.288) | (9.583) | (8.607) | (11.04) | |
| Controls | Yes | Yes | Yes | Yes | Yes |
| Time fixed effect | Yes | Yes | Yes | Yes | Yes |
| City fixed effect | Yes | Yes | Yes | Yes | Yes |
| Threshold value | 5.9885 | 0.6648 | 2084.0588 | 0.07 | 0.1309 |
| Observations | 3472 | 3472 | 3472 | 1312 | 2160 |
| R-squared | 0.57 | 0.572 | 0.568 | 0.619 | 0.608 |
Note: The report in the parentheses in the table is the standard error. *** and ** indicate that the regression results pass the significance test at the 1% and 5% confidence levels, respectively.
Table 9.
Mechanism test of the influence of digital economy on PM2.5 concentration.
| Variables | Technology Effect | Structure Effect | Scale Effect | (4) Total Effect |
|---|---|---|---|---|
| Digital | 0.9781 * | 2.1350 *** | −66.0835 | −12.6874 * |
| (1.80) | (3.93) | (−0.80) | (−1.78) | |
| Structure | 0.1208 | |||
| (0.52) | ||||
| lnRD | −1.2744 *** | |||
| (−6.92) | ||||
| RGDP | −0.0097 *** | |||
| (−6.02) | ||||
| Controls | Yes | Yes | Yes | Yes |
| City fixed effect | Yes | Yes | Yes | Yes |
| Year fixed effect | Yes | Yes | Yes | Yes |
| Observations | 3472 | 3472 | 3472 | 3472 |
| R-squared | 0.873 | 0.321 | 0.983 | 0.568 |
Note: The report in the parentheses in the table is the T value. *** and * indicate that the regression results pass the significance test at the 1% and 10% confidence levels, respectively.
Publisher’s Note: MDPI stays neutral with regard to jurisdictional claims in published maps and institutional affiliations. |
© 2021 by the authors. Licensee MDPI, Basel, Switzerland. This article is an open access article distributed under the terms and conditions of the Creative Commons Attribution (CC BY) license (https://creativecommons.org/licenses/by/4.0/).
Share and Cite
MDPI and ACS Style
Li, Z.; Li, N.; Wen, H. Digital Economy and Environmental Quality: Evidence from 217 Cities in China. Sustainability 2021, 13, 8058. https://0-doi-org.brum.beds.ac.uk/10.3390/su13148058
AMA Style
Li Z, Li N, Wen H. Digital Economy and Environmental Quality: Evidence from 217 Cities in China. Sustainability. 2021; 13(14):8058. https://0-doi-org.brum.beds.ac.uk/10.3390/su13148058
Chicago/Turabian StyleLi, Zihanxin, Nuoyan Li, and Huwei Wen. 2021. "Digital Economy and Environmental Quality: Evidence from 217 Cities in China" Sustainability 13, no. 14: 8058. https://0-doi-org.brum.beds.ac.uk/10.3390/su13148058
Note that from the first issue of 2016, this journal uses article numbers instead of page numbers. See further details here.