Article

Structural Equation Approach to Analyze Cyclists Risk Perception and Their Behavior Riding on Two-Lane Rural Roads in Spain

1
Highway Engineering Research Group, Universitat Politècnica de València, Camino de Vera, s/n, 46022 Valencia, Spain
2
Transport Department, School of Civil Engineering, Universitat Politècnica de València (UPV), Camino de Vera, s/n, 46022 Valencia, Spain
*
Author to whom correspondence should be addressed.
Sustainability 2021, 13(15), 8424; https://0-doi-org.brum.beds.ac.uk/10.3390/su13158424
Submission received: 10 June 2021 / Revised: 20 July 2021 / Accepted: 24 July 2021 / Published: 28 July 2021
(This article belongs to the Special Issue Behavior of Road Users and Sustainable Traffic Modes)

Abstract

:
The use of bicycles on two-lane rural roads in Spain has been increasing in recent years. However, these roads have no bicycle infrastructure, being cyclists forced to share the road and interact with motorized vehicles. In rural environments, the interaction between road users from the cyclist’s point of view is still not well understood. To analyze it, the relationships between risk perceptions and behavioral factors of rural cyclists according to their demographic characteristics, profile, and self-reported knowledge on traffic rules were obtained. An online survey was used, which collected the opinion of 523 cyclists. Data were analyzed by using structural equation models. The Thurstonian Item Response Theory approach was adopted to include raking responses. Different perceptions among demographic groups were found. Younger cyclists present the lowest risk perception while having a higher risk behavior. The knowledge about traffic rules was correlated with safety behavior, showing the importance of this factor. These results are in line with urban cycling. However important differences under risk elements for rural cyclists, mainly associated with potential hazards on the shoulder, have been drawn. These findings may help policy makers to integrate cycling with vehicular traffic on two-lane rural roads in a safe way.

1. Introduction

Cycling is becoming a popular method of mobility, recreation, exercise and sports worldwide. Many benefits are associated with the use of bicycles, such as the reduction of traffic congestion and environmental pollution, or the promotion of a healthy lifestyle for the public [1,2]. Despite these benefits, cycling is not without risks, particularly if it is practiced on the roads [3].
The number of cyclists on two-lane rural roads of Spain has been steadily rising in recent years, with a total number of 75,680 federated cyclists and 3878 federated clubs in 2019 [4]. Many of them are recreational cyclists who use these roads for the practice of sports and recreational activities. However, most two-lane rural roads in Spain have no bicycle infrastructure, with cyclists having to share the road with motorized vehicles [5]. These type of roads accounts for 90% of the Spanish road network [5]. From the safety point the view, the increase in the number of cyclists has implied an increase in the number of accidents. According to [5], in 2019 there were a total of 7837 accidents involving cyclists. Although most occurred on urban roads (71.7%), the severity on rural roads is higher (60% of deaths were recorded in this environment). It is of paramount importance to improve road safety to accomplish the Sustainable Development Goals and reduce global deaths and injuries from road traffic accidents. On the other hand, the promotion of cycling is a crucial factor for sustainable mobility. From a different perspective, cycling for sport and recreational purposes combines physical exercise with being outdoors and enjoying new views, which turns into multiple health benefits.
On rural roads, cyclists can ride alone or in groups, with different configurations (in a single file or in parallel). Spanish traffic regulations [6] state that cyclists must perform as a single vehicle when riding as a group through the rural road network. This is important for intersections and especially roundabouts, which are particularly frequent on Spanish roads.
Additionally, cyclists can ride in parallel to maximize visibility by drivers (unless low visibility or with high traffic conditions) and not to penalize traffic operation. However, from the safety point of view, it is necessary to investigate how to integrate cycling with vehicular traffic on two-lane rural roads. To achieve that, one key point is knowing the cyclist’s perception and behavior when sharing the infrastructure.
The objective and subjective safety of cyclists under mixed traffic has been widely studied in urban areas, highlighting the cycling infrastructure as one of the most important factors to reduce the risk associated with the interaction between driver and cyclists. On the other hand, in a rural environment, passing maneuvers are considered as one of the most dangerous interactions, because bicycles and motorized vehicles are different in terms of speed, volume, weight and level of protection for the users [7].
Although how cyclists must ride on two-lane rural roads is regulated, the number of traffic accidents is still very high. One challenge facing traffic safety in the rural environment is understanding the interaction with other road users from the bicyclist’s point of view. Knowing the behavior and perceptions of cyclists is a key point to achieve this. It is necessary to analyze the cyclist’s behavior when interacting with drivers to promote measures according to the new use of the infrastructures. The study of the behavioral issues of road users is a necessary task for road safety management and promote the use of the bicycle as a model of sustainable transport. This study explores the behavior and perception of rural cyclists to identify factors of influence and how to integrate cyclists on two-lane rural roads, in a successful, equitable, and efficient manner. These kinds of data can be mainly obtained from surveys. The analyzed dataset was provided by an online cyclists’ survey conducted in Spain by López at al. [8]. They explain the type of user profile, knowledge of the traffic regulations, perception of safety, and possible measures to improve roads with mixed traffic, according to the cyclists who participated in the survey. However, data were not analyzed in proof, using models to understand the relationship between multiple variables simultaneously.
The main aim of this study is applying SEM under the approach of IRT models to perform an in-depth study on cycling on two-lane rural roads in Spain. Results of these models can provide information to integrate cyclists on rural roads in a safe way. To the best of their knowledge, this is the first time that this approach is used in this field, and many rules and recommendations on how to integrate cycling in a rural environment can be obtained.

2. Literature Review

2.1. Cyclism and Health

Physical activity has been widely recognized as a relevant factor to improve public health. Some of the main benefits associated with regular practice of physical activity is a lower risk of early death, diabetes, heart disease, stroke, high level of blood pressure, adverse blood lipid profiles, metabolic syndrome, and colon and breast cancers. Additionally, exercise is recognized as a key factor to prevent weight gain, to improved cardiorespiratory and muscular fitness, or the prevention of falls. Last but not least, psychological well-being benefits from physical activity, which contributes to reducing depression and improving cognitive function in older adults [9].
In particular, cycling is a type of exercise that adequately targets metabolic and cardiorespiratory functions of the whole body in a wide range of intensities and thus lends itself to many potential health benefits Theoretically, cycling can result in most of the above-mentioned health benefits. Consequently, cycling has been recognized as a relevant potential means to promote public health [10,11].
The relationship between health and cycling has been widely studied [12,13]. It is also known that the growth of cycling rates results in an increase in health benefits of the population of the country as a whole, which turns into a reduction in the mortality rate of the cycling population [14]. Huge efforts are being made currently to increase cycling modal share for commuting purposes in cities, including transport policy measures or the construction of new infrastructure. However, less attention has been paid to the study of the influence of cycling regularly for pleasure and sport purposes.

2.2. Perception and Cyclists’ Behavior

The promotion of active transport, especially cycling, is a major concern nowadays. The effectiveness of programs and strategies to promote cycling have been widely studied from different perspectives. The role of the general public’s perceptions has been recognized as a key factor to understand bicycle use. For instance, the level of danger perceived by the cyclist has been found to be an important factor, which discourages the use of the bicycle [15,16]. Indeed, the perception of safety may have a higher influence than objective reality in the choice of using a bicycle [1] and could be more relevant than the existence of adequate cycling infrastructure [17]. Even though it may be affected by the statistics regarding crashes, it is a person’s own subjectivity in the perception of safety that really influences people when they choose a means of transportation [18].
The influence of risk perception on decision making and current behavior has been corroborated in previous studies (see for instance the works of Lam [19,20]). However, within the field of traffic safety research, studies on perceived risk have primarily focused on drivers. Therefore, the influence of risk perception on the behavior and accident involvement of cyclists is less well documented. In particular, knowledge about risk perception in specific situations is sparse.
The objective and subjective safety of cyclists under mixed traffic has been widely studied in urban areas. The infrastructure that separates cyclists from cars has been highlighted as one of the most effective ways of keeping cyclists safe [21]. In this line, the presence of cycle lanes is associated with a higher perceived safety of cyclists [22]. There are many factors related to traffic, which cyclists perceive as unsafe, like traffic volume, passing distance, vehicle speed, or cyclists’ perceptions of aggressive driver behavior [23,24]. The use of cycling gear such as brightly colored clothes [25] was correlated with lowers levels of risk perceptions. Regarding the use of helmet, Esmaeilikia et al. [26] conducted a systematic review and found that there was not enough evidence to associate helmet use with risk behaviors. Kaplan et al. [27] found that cyclists in Israel reject the sharing of the road when they have both emotional negative perceptions of the road sharing experience and physical negative experiences with near-misses and incidents.
Kummeneje et al. [28] explored attitudes, risk perception, and risk-taking behavior among regular cyclists in Norway and found a relevant influence between risk perception and risk-taking behavior in traffic.
The urban environment has also been widely investigated in the cyclist´s risk-taking behavior, such as the violation of traffic rules, notice failures, errors when cycling, distractions of cyclists, or conflicts with other users when cycling [28,29,30,31,32].
Useche et al. [33] stated that it is essential to understand and control the potential risk for cyclists. This fact is also necessary in a rural environment where the severity of the crashes is higher than in rural areas. On rural roads, where infrastructure is shared by cyclists and motorized drivers, the most frequent and dangerous interaction between them is the overtaking maneuver [34,35]. Theses maneuvers are considered as one of the most dangerous interactions, due to the higher speed of motor vehicles and the minimum lateral clearance necessary to perform the maneuver [7]. Previous studies developed in rural environments have analyzed the effect of different roads infrastructure variables on lateral clearance. In this line, roads with wider lanes have been correlated with higher lateral clearance on passing maneuvers [34,35,36,37,38]. The effect of the shoulder width on the lateral clearance was not significant in the studies of [39] and [38]; while the results of a study conducted on two-lane rural roads in Spain showed higher lateral clearances when wider shoulders were present [40].
Regarding the bicycle lanes, the literature shows contradictory results [34,37,38,41]. As indicated by Mackenzie et al. [42], in general, lateral clearance is higher when a bicycle lane was present; however, the effect was opposite on roads with high traffic volumes and higher speed limits. There are also other variables that influence this interaction studied by previous researchers. These variables are mainly based on traffic such as the opposing lane occupation [9,10], bicycle position and group configuration [11,12], and the presence of oncoming vehicles [13,14,15,16]. Knowing the risk perception of the cyclists is necessary to have a complete understanding of the overtaking maneuvers of cyclists. By collecting field data, García et al. [40] and Llorca et al. [35] obtained the cyclist risk perception for overtaking maneuvers on two-lane rural roads in Spain. They analyzed the relationship between the subjective risk perception of individual cyclists with respect to objective variables such as lateral clearance, vehicle speeds, and aerodynamic forces. Results showed that a combined factor of lateral clearance, vehicle type, and vehicle speed had a significant correlation with the perceived risk of the cyclist. Focusing on cyclists riding in groups, López et al. [41] carried out a similar study, showing that the subjective risk of cyclists is higher in a parallel configuration, and the subjective risk perception increases with higher overtaking speed and lower lateral clearance. With the aim to obtain data about the perception, behavior, and the rural cyclist’s performance, López at al. [8] administered a cyclists survey. Results showed different blocks of risky factors associated with cycling on a rural road. The shoulder width and pavement conditions, overtaking performed by heavy vehicles, or alcohol and drug consumption were the riskiest according to the cyclists surveyed.
As described above, most of the previous studies carried out in rural areas are focused on the study of passing maneuvers of motor vehicles and bicycles. Some studies have collected field data of subjective risk perception during the maneuvers [35,43]. However, risk perceptions and self-reported behavior of cyclists have not been explored in mixed traffic on two-lane rural roads. Analysis of these factors is necessary to integrate cyclist and motorized drivers in rural areas.

2.3. Structural Equation Modelling

Perception and self-reported behavioral data can be obtained from surveys. In the literature, a wide number of methods have been used to analyze the results of the survey; however, Structural Equation Modelling (SEM) has been one of the more widely used techniques. The main reason is that SEM allows to address large numbers of variables, both endogenous and exogenous, as well as latent variables (not observed variables) explained as a linear combination of observed variables [44]. Chiou and Chen [43] highlighted that SEM is one of the best integrated methods for measuring latent variables and assessing their structural relationships.
In this paper, the relation between the social cyclist ‘profile, the cyclist risk perceptions, and the self-reported behaviors will be investigated. The analysis was performed using SEM, because of its suitability for accommodating the latent nature of perceptions and the observed nature of the cyclists’ characteristics and behavior. However, the survey performed by López et al. [8] has a wide number of forced-choice question, particularly in a ranking format, in which participants are asked to order some items from the most favorable to least favorable. Questions were previously analyzed using the Analytic Hierarchic Process (AHP). This methodology was first proposed by Saaty [45] for multi-criteria analyses, providing simple steps to transform a multiple-choice decision into a set of pairwise comparisons (converging back to a single rank).
Forced-choice response formats can be designed to reduce such biases typically associated with direct responses (like Likert-type or Yes/No ratings), by forcing people to choose between similarly attractive options [46]. Nevertheless, several problems are found with the use of forced-choice data results with classical psychometric properties of scoring methods (such as sum scores, assessing the validity of the constructs or reliabilities) [47]. To overcome these problems, Brown and Maydeu-Olivares [46] introduced a model called Thurstonian Item Response Theory (IRT) for analyzing forced-choice data, suggesting that the use of a comparative or forced-choice format can help reduce the impact of response bias and social desirability.
The remainder of the paper is structured as follows: Section 2 presents the description of the survey and introduces the framework and the model formulation. Section 3 shows the details of the estimation models and explanations of the results. In Section 4, the results are presented. Finally, Section 5 proposes a discussion of the results and conclusions of the study.

3. Materials and Methods

3.1. Data

The dataset used in this research is part of the Bike2lane project “Improvement of safety and operation of two-lane rural roads with cyclists” funded by the Ministry of Economy, Industry, and Competitiveness of Spain. An online survey implemented in Google Forms was developed.
The survey was developed following the Delphi methodology. The research team created the first version, then two panels of experts performed the validation. Expert panels were convened in order to improve the surveys according to the project objectives and the needs of the users. The first panel was formed by 14 academics and road technicians from different administrations, experts in road safety and carrying out projects related to the world of cycling, both urban and interurban. After various modifications of the survey, made after the first panel, the second panel was called. It was made up of 9 cyclists, mostly belonging to cycling clubs. Each of the panels convened took into account the difference in age and origin of the experts, in order to maintain heterogeneity between them and thus obtain different points of view.
The final survey was organized in different sections. The first section included demographics information (i.e., gender, age), the profiles of drivers (i.e., type of bike, use the app to their activity, belonging to any cycling group), and cycling experience (i.e., cycling distance, cycling experience in years). In the second part, participants were asked about some traffic regulations that affect cycling on two-lane rural roads; finally, they were valued according to their perception and their specific knowledge of the current regulations. Next, the cyclist risk perception was evaluated using different blocks of ranking questions. The blocks were grouped in thematic sets according to road geometry, road equipment, road conditions, human factors related to drivers and cyclists, and type of overtaking vehicle. The items of each block were defined based on the literature review, the experience of the federated cyclists and clubs, and the technician of the road administration, following the Delhi methodology [8]. The items used in this study are shown in Table 1.
The online survey was massively disseminated by using social media and by contacting around 1500 cycling clubs. Respondents were recruited with the collaboration of the different administration as the General Directorate of Traffic of Spain and city councils. A further description of the survey and a preliminary analysis can be consulted in López et al. [8].
Before applying the SEM models, the survey variables needed to be transformed taking into account their characteristics: Continuous, categorical, and ordered variables (ranking data). Table 1 shows the items of the survey as they were collected. The six blocks regarding perceived risk elements were measured using ranking data; for this reason, the Thurstonian IRT model was implemented. These variables were used as latent variables (as can be checked on the theorical framework shown in Figure 1), by a previous transformation performed with the IRT Theory.
Additionally, indicators to measure Self-Reported Risk Behavior and Perceived Safety Equipment were built from the survey data. Categorical responses were transformed to continuous variables ranging from 1 to 3, representing riskier to more safe behaviors and use of the equipment.

3.2. Structural Equation Models

Structural Equation Modelling (SEM) is a very powerful technique to simultaneously explore different relations among several variables including latent factors and is widely used in behavioral sciences. This technique is especially useful when non-observed variables, for instance psychological variables (i.e., perceptions) are included. In SEM models, the relationships between theoretical constructs are represented by regression or path coefficients between variables [48]. SEM is represented by a path diagram where observed variables are drawn as rectangles while circles are used for latent factors. Arrows are used to define causal relationships in the model following the theoretical relations previously defined. Double-headed arrows show correlations or covariances, without a causal interpretation [48].
A fully specified SEM with latent variables consists of three sets of equations (even though most studies include only one or two of them): Structural equations, measurement equations for the endogenous variables, and measurements equations for the exogenous variables. The measurement part of the model consists of a set of latent variables that are obtained as linear functions of other observed exogenous or endogenous variables.
The formulation of the Structural Equation Model commonly consists of two parts: The structural part linking latent variables to each other via systems of simultaneous equation, and the measurement part, which links latent variables to observed variables assessed by a confirmatory factor model [49]. Hence, the structural part of the model can be represented as follows:
η = Bη + Γξ + ζ,
where each term represents the following concepts: η is the vector of endogenous (criterion) latent variables; ξ is the vector of exogenous (predictor) latent variables; B is the matrix of regression coefficients relating the latent endogenous variables to each other; Γ is the matrix of regression coefficients relating endogenous variables to exogenous variables; and ζ is the vector of disturbance terms.
The latent variables are linked to observable variables via measurement equations for the endogenous variables and exogenous variables. These equations are defined as:
y = Λyη + ε; x= Λxξ + δ,
where Λy and Λx are matrices of factor loadings, respectively, and ε and δ are vectors of uniqueness, respectively. In addition, the general model specifies variances and covariances for ξ, ζ, ε, and δ, denoted by Φ, Ψ, Θε, and Θδ, respectively.

Thurstonian Item Response Theory (IRT) Model

Based on Thurstone’s Law of Comparative Judgment [50,51], Brown and Maydeu-Olivares [46] introduced an item response theory (IRT) model, which is capable of modeling responses to any multidimensional forced choice questionnaire (Thurstonian IRT model).
One of the main characteristics of the forced-choice test is that items are presented in blocks, of two or more items. Then, participants can be asked to rank order all items, based on which is more favorable. Making this choice is referred to as the response process for the comparison item. Responses to these paired comparisons (and therefore also to rankings) can be coded in a binary pattern:
y i , k = { 1   i f   i t e m   i   i s   p r e f e r r e d   o v e r   i t e m   k 0   i f   i t e m   k   i s   p r e f e r r e d   o v e r   i t e m   i
In the case of a multidimensional forced choice questionnaire, respondents have to rank n items. According to Thurstone [51], any given rank ordering of n items is fully described by ñ = n(n − 1)/2 dummy variables, representing binary comparisons between all possible pairs of items. In the case of this study, respondents were forced to rank between 5 items, and then 10 binary comparisons were performed (see Table 2).
In a rank question, the evaluation of individual items cannot be observed (only the comparative judgments). In order to describe unobserved item evaluations, Thurstone’s notion of item utility has been widely used in the literature. According to Thurstone’s law of comparative judgment [50,51], when a respondent makes a judgment for the preferred choice, the choice reflects the item for which the participant has the greatest amount of preference. The amount of preference a participant has for an item is latent (cannot be measured) and is referred to as the latent utility of the item. If the utility of item i is denoted by ti, the judgments between two items can be expressed as follow:
y i , k = { 1 i f   t i t k 0 i f   t i < t k
Particularly, in multi-trait questionnaires, utilities of items are assumed to be governed by a set of d psychological attributes (or latent traits) according to a linear factor model expressed as:
t i = μ i + a = 1 d λ i a η a + ε i
where μ i is the intercept, or mean of the latent utility of item i; λ i is the factor loading of the latent utility of item i with regard to the underlying latent trait η ; ε i is the residual term for item i.
For computational reasons, it is convenient to express Thurstone’s model using differences of utilities. Let y i , k * denote the (unobserved) difference of utilities for the pair of items {i, k}, then the latent forced-choice response can be expressed as y i , k = t i t k , with y i , k = 1 if y i , k 0 . Then, the latent forced response can be expressed as:
y i , k * = t i t k = ( μ i μ k ) + a = 1 d ( λ i a λ k a ) η a + ( ε i ε k )
A further description of the method is provided by Maydeu-Olivares and Brown [52]. The estimation and scoring of the Thurstonian item response theory (IRT) model will be performed using Mplus.

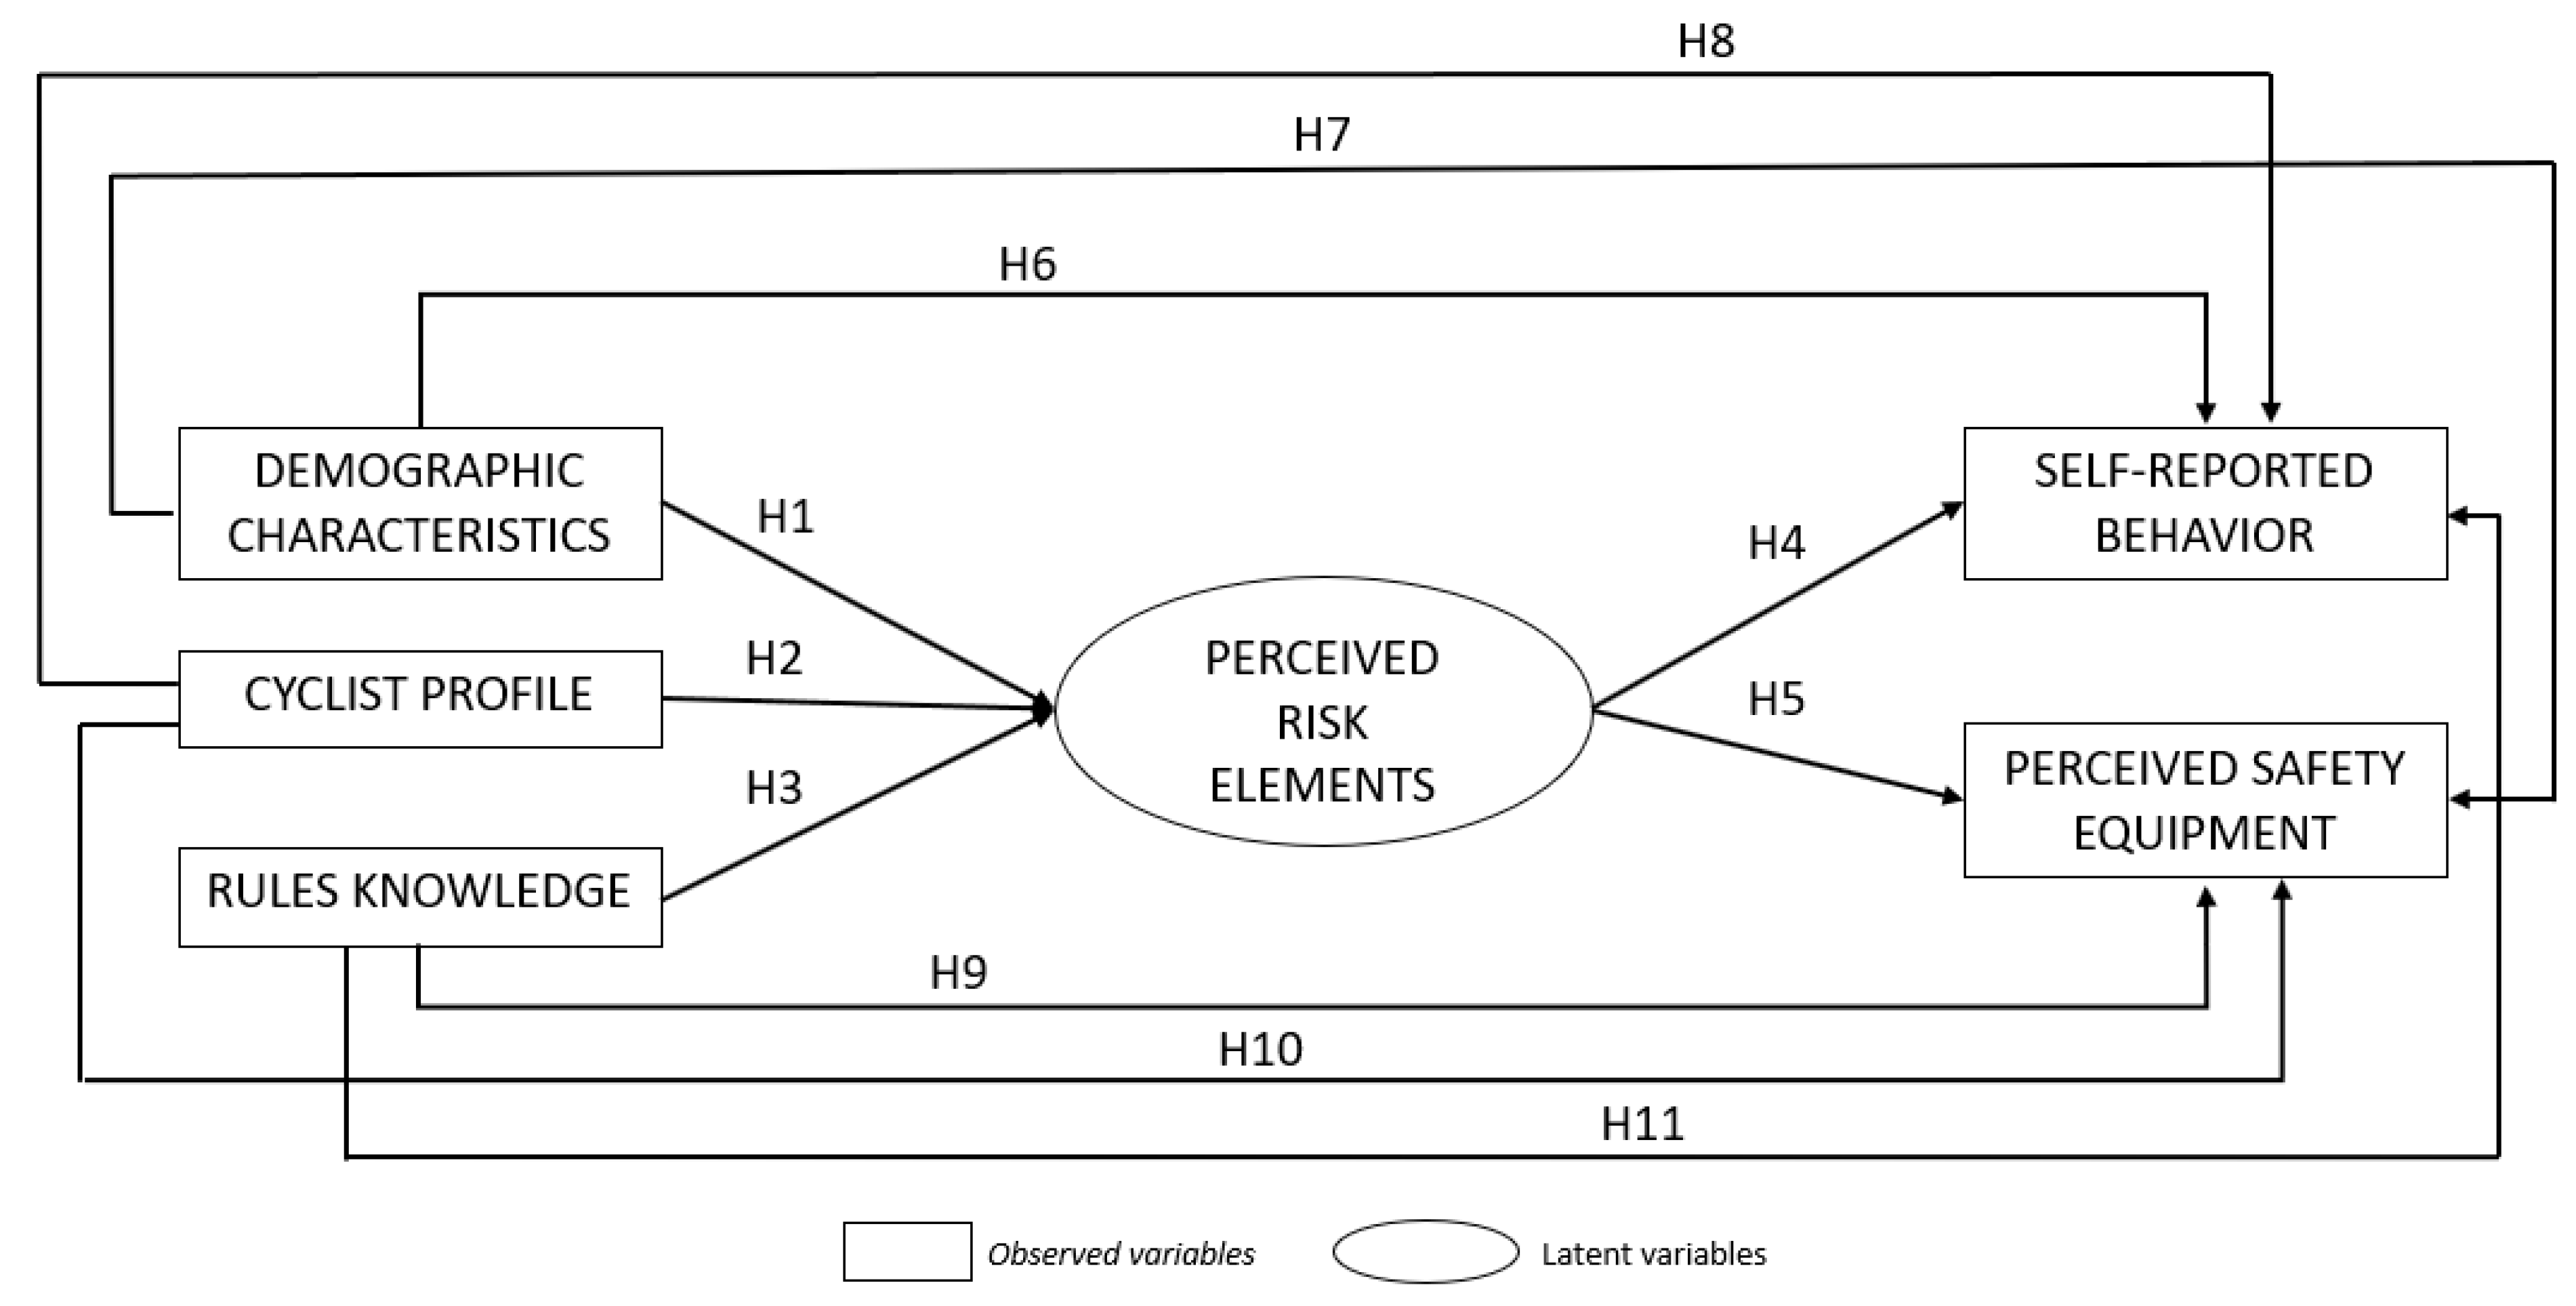
3.3. Theorical Framework

The hypothesized theoretical framework shown in Figure 1 has been investigated by formulating SEM, due to the necessity of simultaneously modeling endogenous latent constructs (risk perception), their relationship with the exogenous observed variables (demographics characteristics and cyclist profile), and their relationship with the perceived risk behavior and perceived use of the cyclist ‘s equipment.
The hypothesized relations between the variables of the study are presented in Figure 1.
Considering the theoretical framework (Figure 1), the following 11 hypotheses are established:
Hypothesis 1.
Demographic characteristics of the individual (age and gender) are associated with different risk perception.
Hypothesis 2.
Cyclist profile (type of bike, average distance covered per week, cycling experience, belonging to a group and use of Apps) influences risk perception.
Hypothesis 3.
Knowledge of current regulation is related to risk perception.
Hypothesis 4.
Risk perception of different elements (RG, SME, RC, MDF, CF, OVT) is associated to perceived risk behavior.
Hypothesis 5.
Risk perception of different elements (RG, SME, RC, MDF, CF, OVT) is related to perceived safety equipment.
Hypothesis 6.
Demographic characteristics of the individual (age and gender) influence self-reported behavior.
Hypothesis 7.
Demographic characteristics of the individual (age and gender) influence perceived safety equipment.
Hypothesis 8.
Cyclist profile (type of bike, average distance covered per week, cycling experience, belonging to a group, and use of Apps) influence self-reported behavior.
Hypothesis 9.
Knowledge of current regulation is related to perceived safety equipment.
Hypothesis 10.
Cyclist profile (type of bike, average distance covered per week, cycling experience, belonging to a group, and use of Apps) is associated with perceived safety equipment.
Hypothesis 11.
Knowledge of current regulation is associated with self-reported behavior.

4. Results

4.1. Sample Characteristics

The final sample was formed by 534 cyclists from all around Spain, of which 10% were women. This result is correlated with data from federated cyclists. In Spain, there are 74,768 federated cyclists, with women forming 6.5% [4]. The average age of the respondents is 41 years (S.D. 11.33). These results are in line with another cycling survey carried in Spain in which the majority of the respondents were identified as men ranging from 40 to 54 years of age [53].
Most of the respondents (75.9%) use racing bikes followed by mountain bikes (17.7%). The other types of bicycles represent only 6.4% because cyclists do not use city bicycles for rural use.
Regarding weekly traveled distance, 22.6% of the cyclists rode 50–100 km/week, 36.9% rode 100–200 km/week, and 22% rode 200–300 km/week. The distribution of the cycling experience of the respondents is: Under 10 years, 49.7%, 21.1% between 10 and 20 years, 21.6% between 20 and 30 years, and the remaining 8.6% over 30 years.
In Spain, the presence of cyclists riding in groups on two-lane rural roads is common [31], for this reason respondents were asked if they belonged to any cycling group, a total of 37.5% of the respondents belonged to a cycling group. In addition, about 30% use mobile phone applications to track their distances.
Authors hypothesize that one key question to promote and improve the coexistence between users on rural roads is knowledge and compliance with the traffic rules. For this reason, respondents were asked about their specific knowledge of current rules that affect cycling on two-lane rural roads. These results were evaluated, and 41% of respondents scored 10 or 11 correct answers (out of 11) and 70% scored 9 or higher; however, the remaining 30% of cyclists should improve their traffic knowledge.
In the previous analysis performed by López et al. [8] for each block, Road geometry (RG), Road signs, markings, and equipment (SME), Road conditions (RC), Motorized drivers factors (MDF), Cyclists factors (CF), and Overtaking vehicle type (OVT) were the riskiest factors reported by cyclists. According to RG, sudden narrowing shoulders were the riskiest factor, closely followed by insufficient shoulder width. From the SME block, shoulder or roadside elements were perceived as the riskiest factors. In the RC block, pavement and shoulder imperfections or dirt are almost seen as identical in terms of perceived risk. Alcohol and drug consumption were the riskiest in both MDF and CF blocks. Finally, with respect to OVT results, these indicated that the highest effect is caused by heavy vehicles. However, each block represents one latent variable where the relationship with the endogenous variables will be analyzed using SEM.
Intersections and especially roundabouts are road elements particularly frequent on the two-lane rural roads in Spain. On these road elements, it is important to analyze the cyclist’s behavior. Spanish regulations indicate that cyclists must ride in a single line when riding in groups. Thus, the first cyclist of a group (platoon) should yield at roundabouts to any vehicle, but after entering it, any incoming vehicle must wait until the whole peloton has accessed the roundabout. This fact is very well-known by cyclists (96.4% of respondents indicating that they yielded before accessing roundabouts). On the other hand, 88.3% of participants only used the outer roundabout lane.
The perception of the use of the cyclist’s equipment (such as cleats and helmet) was also a concern for researchers. The use of cleats can influence the cyclist’s behavior of avoiding yielding at intersections and roundabouts (since any stop would require cyclists to release their cleats). However, respondents indicated that cleats did not interfere with their behavior, and they could stop at enough distance if necessary (75.7%). Furthermore, 13.1% changed their speed slightly to avoid stopping (although 1.1% increased their speed).
The use of a helmet is mandatory for road cycling on two-lane rural roads. Respondents were asked if they took more risks when wearing a helmet; 87.8% of them considered that they did not compensate for wearing a helmet with riskier maneuvers.

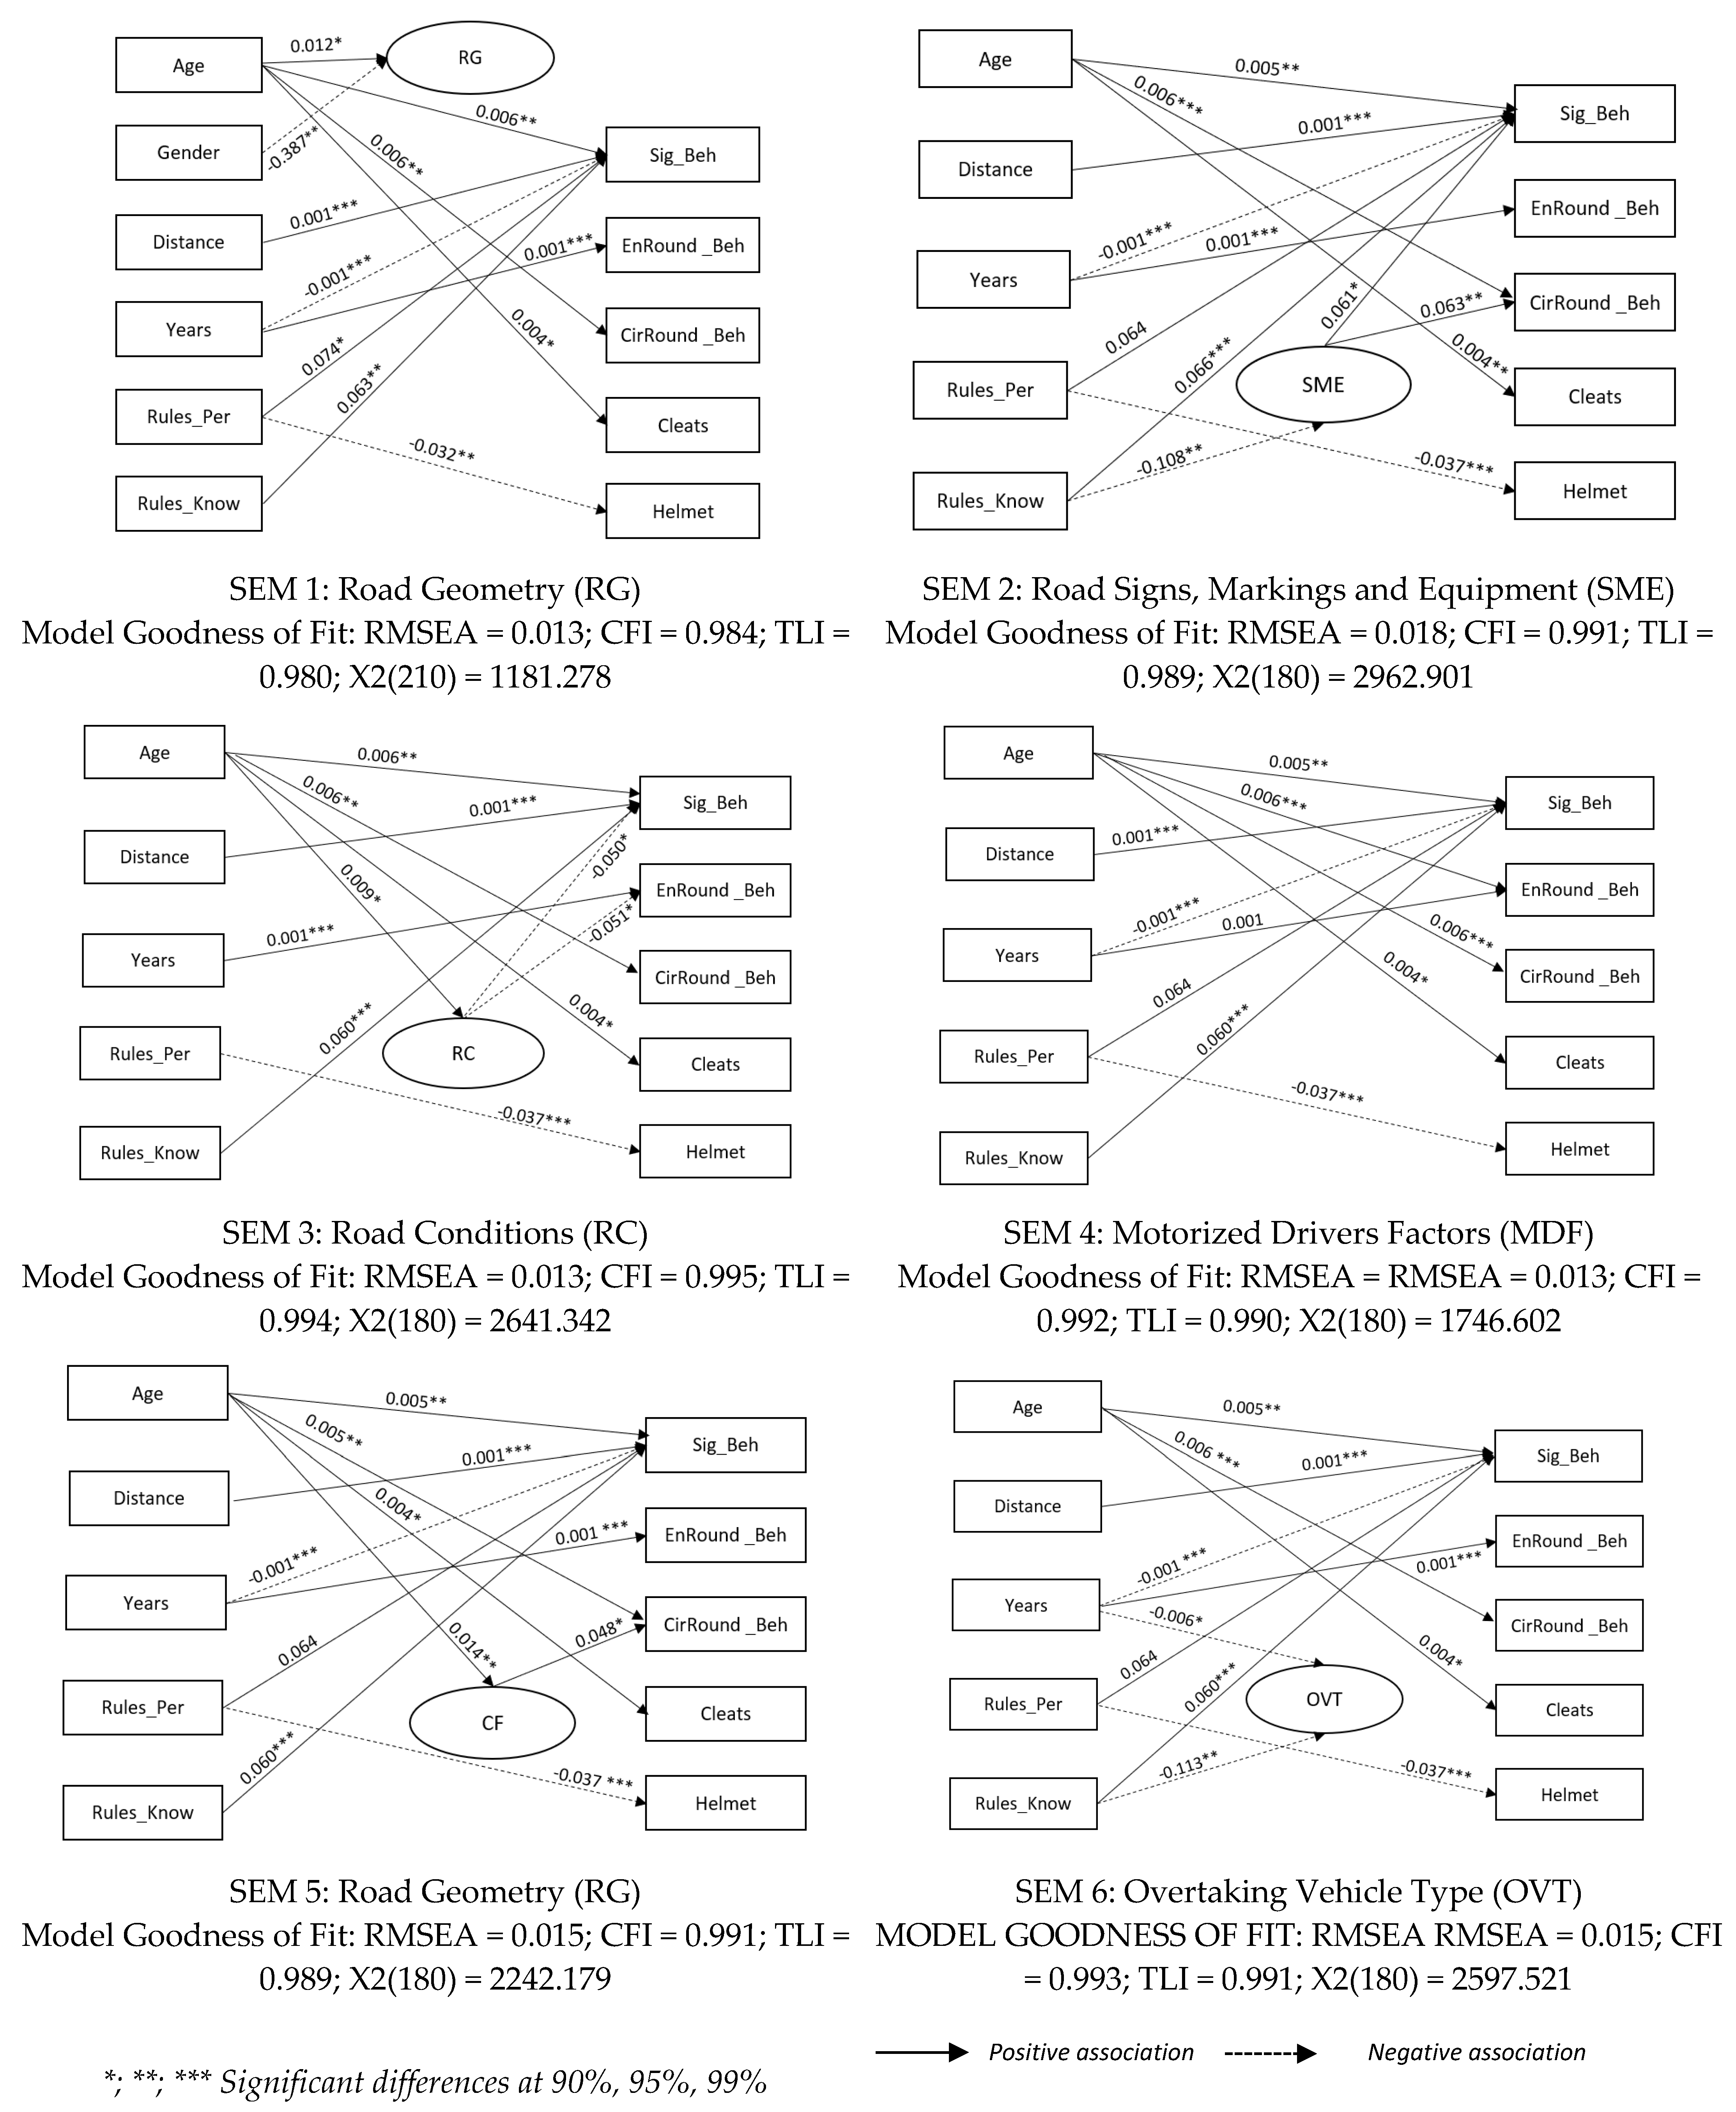
4.2. Results of Structural Equation Modeling

As was introduced in the theorical framework, the effect of the six latent factors related to the risk perception when cycling was explored. For this purpose, six SEM models were estimated to study the relationships between demographic factors, cyclist profile, and traffic rules knowledge with the perceived risk elements, risk perception, and self-reported behavior and their perception of safety equipment elements. Besides, direct relations between demographic factors and cyclist profiles with perceived risky behaviors and cyclist behavioral aspects are also considered. Each model includes a latent variable, which corresponds to one of the six perceived risk elements of the study: Road Geometry (RG), Road signs, markings, and equipment (SME), Road conditions (RC), Motorized driver factors (MDF), Cyclists factors (CF), and Overtaking vehicle type (OVT).
The measurement part of an SEM model consists of the construction of the latent variables mentioned before using the items collected in surveys (see Table 1). Next, the complete Structural Equation Models are assessed including the multiple relationships proposed conceptually.
The fit of the model was assessed using the following measures of goodness of fit. Maximum Likelihood with Huber–White covariance adjustment (MLR) has been used for parameter estimation. This estimator is based on White’s sandwich-based method to yield test statistics that are robust in the presence of non-normality and non-independence. While this robust estimator yields superior results (compared to standard maximum likelihood), the chi-square test of absolute model fit can still be sensitive to trivial misspecifications in the model’s structure [24]. Additionally, the following indexes are estimated to test model fit: The Standardized Root Mean Residual (SRMR), the Comparative Fit Index (CFI), and the Tucker–Lewis index (TLI). Model results showed adequate values for these parameters (see Figure 2). Thus, the validity of the models can be confirmed. The results of the models (SEM 1 to SEM 6) are presented in Figure 2, and only significant relationships are shown.
As it can be seen in the six models, all the posited relations provided relevant results, although not every variable was found to be significant (see Figure 2).
The results provide support for Hypothesis 1 (SEM 1, 3, and 5). As it can be seen in Model 1, demographic characteristics provide two significant relations with the Perceived Risk of Road Geometry Elements (RG). Age is positively associated with RG risk. Considering that the age variable was measured by a continuous variable, this finding points out that older individuals in the sample perceive the risk associated with elements of the road geometry as more important. Regarding gender, it was found that female cyclists have a negative association with risk perception of RG compared to men. No significant relation was found between RG and perceived risky behavior and perceived safety of the equipment.
Hypothesis 3 was also partially confirmed as it can be observed in models SEM 2 and SEM 6. The results of SEM 2 show that legislation knowledge is significantly and negatively related to Risk Perception of Road Signs, Markings, and Equipment (SME). Next, Hypothesis 4 also provided relevant results for two types of self-reported behavior. As it is shown in SEM 2, those individuals who confer more importance to Road Signs, Markings, and Equipment (SME) risks are positively related to safer signalization behavior (Sig_Beh) and safer roundabout circulation behavior (CirRound_Beh). However, the relation between SME and roundabout circulation behavior (EnRound_Beh) did not provide significant results. These results can be related to the current cyclist’s legislation, which does not include specific regulation on the items used to measure the perceived risk of this block (such as visibility of the signs, presence of elements invading shoulder, etc.).
As can be seen in Model 3, older individuals are associated with a higher Perceived Risk of Road Conditions (RC). Besides, RC risks provided a negative significant relation with safer signalization behavior (Sig_Beh), and this result corroborates Hypothesis H4. The block of road conditions includes items regarding the weather and the pavement condition, thus road circumstances in which the cyclists require so as to not lose control of the bike show a negative association with their movement. On the other hand, RC has a positive association with safer roundabout entrance behavior (EnRound_Beh).
The latent construct that measures the Perceived Risk of Motorized Driver Factors (MDF) did not provide any significant relationship in the SEM model as it can be seen in Model 4. Hence, no conclusion can be obtained for this relation in our sample.
Taking into account Model 5, it is found that older individuals are associated with a higher Risk Perception of Cyclist Factors (CF). Additionally, CF provided a significant relation with safer roundabout circulation.
Lastly, participants who reported higher knowledge about legislation and those with more years of cycling experience were found to be negatively related to Perceived Risk of Overtaking vehicle type (OVT), showing an opposite sign to that expected in Hypothesis 2.
In addition, all six models provided relevant results between demographics and cyclist profile factors and perceived risk behaviors and perceived safety equipment. Knowledge of traffic rules (Rules_Know) has a relationship in all models with the helmet variable, being opposite of what was previously stated in Hypothesis 9. Age provided three positive and significant relations: With safer signalization behavior (Sig_Beh), safer roundabout circulation behavior (CirRound_Beh), and perceived security of cleats, supporting the Hypotheses 6 and 7. Next, respondents who cycle longer distances are associated with a higher perception of signalization risks (Sig_Beh). This result corroborates Hypothesis 8; however, no results were found for Hypothesis 10. Considering the number of years cycling, those with a higher experience are negatively related to Sig_Beh and positively with EnRound_Beh. On the other hand, as was advanced by Hypothesis 11, those who perceive that their knowledge on regulation is higher are associated with safer signalization behavior (Sig_Beh). This relation shows the importance of road safety education and of road-users’ training. Finally, Hypothesis 5 was not corroborated and any relation between the different blocks of risk perception was not associated with the perceived equipment safety.

5. Discussion

This study is focused on the cyclist’s point of view, and the main aim is to apply a novel methodology using ITR models combined with SEM to perform an in-depth study on cycling on two-lane rural roads in Spain. Relationships between demographic factors, cyclist profile, and traffic rules knowledge with the perceived risk elements, the self-reported behavior, and their perception about some safety equipment were analyzed.
Results showed how demographic characteristics provide significant relations with cyclists’ risk perception of Road Geometry (RG) and Road Condition (RC), with age being positively associated, thus meaning that younger cyclists have a lower risk perception of these factors. The relation between the age of the cyclist and risk perception has been widely explored in urban areas. Useche et al. [33] found that younger cyclists have a positive association between cycling intensity and risky behavior. Lower risk perception was also found between different groups of young cyclists by Feenstra et al. [54,55]. In addition, younger cyclists perceived that the use of equipment (such as cleats or automatic pedals) make them increase speed to avoid having to stop at intersections. This fact can be related to their lack of experience riding in this environment.
Younger cyclists also have a lower risk perception of human factors related to cyclists (CF). Among the items used to measure this block, alcohol and drug consumption were the riskiest identified by López et al. [8]. Results obtained in this study can be correlated with the higher percentage of Spanish younger cyclists involved in accidents in which alcohol and drugs were present [53].
Risk perception of human factors related to the cyclist factor (CF) provided a significant relation to safer roundabout circulation. On two-lane rural roads, drivers and cyclists share the same infrastructure, with cyclists’ behavior signaling the movement in advance being safer. The results show that age was also correlated with safer behavior (higher signalization of the movement and safer roundabout circulation behavior). According to Johnson et al. [56], cyclists need to take responsibility for their safety, by riding safely and legally and maximizing their visibility.
A higher risk perception of road signs, markings, and equipment is related positively to safer signalization behavior (Sig_Beh) and safer roundabout circulation behavior (CirRound_Beh). These results are in line with Ngueutsa and Kouabenan [57], who stated that a lower perception of risk leads to negative behavioral outcomes. This fact is very important on roundabouts and intersections, which have consistently been identified as risk factors for cyclist crashes, and increased injury severity [58].
Cycling experience was found to be negatively related to perceived risk of overtaking vehicle type (OVT). Additionally, younger cyclists have shown a higher risk perception regarding this factor. In the rural environment, the riskiest situation for cyclist is the interaction with a motorized vehicle [7]. However, the cycling experience can provide higher perceived control over the bicycle, and this fact can lead to cyclists overestimating their own skills (i.e., more overconfidence) to deal with riskier traffic scenarios, such as interaction with other road users [59].
With respect to other aspects concerning behavior and road safety, respondents noted that the use of cleats does not interfere with their behavior, allowing them to stop at a sufficient distance if necessary. Regarding the use of a helmet, most of the cyclists considered that they act in the same way wearing the helmet; the helmet did not change their behavior. This result is different in urban areas, as indicated Esmaeilikia et al. [26], where there are mixed findings concerning the use of a helmet in relation to safe or risky cycling behavior in an urban environment.
It has been found that higher knowledge and perception of traffic rules was correlated with safer behavior. Higher traffic rules knowledge was also associated with higher-risk helmet use. Previous studies have indicated that some risky behaviors are a consequence of the lack of proper knowledge of traffic safety rules [60,61]. Hassen et al. [62] indicated that an increase of knowledge of traffic rules in younger cyclists can prevent risky traffic behavior. These results also show the importance of both road safety education and road’s user training. Numerous studies have remarked that these actions are a way to prevent both risk behavior and traffic crashes involving cyclists [63,64,65].

6. Conclusions

Based on the response provided by the 534 individuals who filled out an online survey for cyclists carried out in Spain, this paper investigated the relationship between demographic, social cyclists’ profiles, and traffic rules knowledge, with the perceived risk elements of the road, the self-reported behavior, and cyclists’ safety perceptions of the equipment. The analysis was conducted by means of a Structural Equations Model (SEM). First, the items were transformed, taking into account their characteristics: Continuous, categorical, and ordered variables. Ordered variables were used as latent variables by a previous transformation performed using the Thurstonian Item Response (ITR) theory. Then, six SEM were developed.
The results obtained show that this methodology is appropriate for this research. In the previous analysis performed by López et al. [8] using the Analytic Hierarchic Process (AHP), the riskiest factors in each block (RG, SME, RC, MDF, CF, OVT) were identified. However, with the analysis performed, combining the SEM and ITR models, significant relationships between studied variables can be obtained.
Although most previous research focused on the analysis of cycling activity in terms of urban mobility, some of the results obtained for rural cyclists are in the same line. As in the urban environment, the results of this study showed that younger cyclists are the most vulnerable users with the lowest risk perception and the riskiest behavior. The importance of the knowledge of the traffic rules to prevent risky behavior has also been highlighted. However, important differences under the urban and rural phenomenon exist: Cyclists who used to be semi-professional or amateur cyclists who practice cycling as a sport are used to riding in a group, in single file or two-abreast, and they have to share the infrastructure with motorized vehicles. For this reason, the risk elements for rural cyclists are different, mostly being associated with potential hazards related to sharing the roads. Spanish regulations force cyclists to ride on the shoulder or, if it is unusable, on the right side of the lane [6]. This fact means the risky factors related to road geometry and road condition are correlated with problems on the shoulder, such as sudden narrowing or shoulder imperfections.
Roundabouts and intersections, which have been identified as risk factors for cyclist crashes [22,66], are especially important in the Spanish rural road network. Spanish regulations indicate that cyclists must perform as a single vehicle when riding in groups. Then, the first cyclist of a peloton should yield at roundabouts to any vehicle, but after entering, any incoming vehicle must wait until all the peloton has cleared. In these road elements, it is important to analyze the cyclist’s behavior, and results showed that higher risk perception (of road condition, sign, marking, and equipment, and cyclists’ factors) is correlated with safer behavior, showing that cyclists take responsibility for their safety, by riding safely and legally.

6.1. Practical Implications

In this research, the application of the Structural Equation Model technique under the approach of the Thurstonian item response theory (IRT) has been validated to study cycling on two-lane rural roads in Spain. The measurement of risk perception using the survey developed for this study was validated as well. Thus, practical implications of this research include the replication of this experiment in larger samples to gather information to integrate cyclists on rural roads in a safe way.
Results of this research point out the importance of perceptions in risking-taking behavior. Thus, it is recommended to take into consideration the variables analyzed in this paper in actions to promote sustainable mobility and the use of bicycles for recreational purposes. Additionally, perceptions can be changed in order to improve safety on shared roads. Hence, it is recommended to target cognitive and behavioral processes related to perceptions in driving courses and educational purposes.
Our finding can help policy makers with some key factors to integrate cycling with vehicular traffic in two-lane rural roads in Spain, offering possible solutions in terms of general criteria such as planning, design, or maintenance of roads. Road administration can promote plans to solve problems with shoulders, such as, narrowing, cleaning, or encroachments. Regarding the improvement of a road segment, greater width of the shoulders or lanes can help to improve the coexistence of cyclists and vehicles.
In Spain, cyclists do not receive any guidance in the training course on how to circulate or interact with other road users. Our findings highlighted the importance of both road safety education and road user training, especially for younger cyclists who have a higher safety perception. This course can be implemented in collaboration with clubs and sport federations.

6.2. Limitations of the Study

The main limitation of this study concerns the sample size and its generalizability to the broader population. Some key factors that influence the number of responses that can be obtained in a survey are related to the length of the survey and the period of distribution. Additionally, surveys that target psychological variables, such as attitudes and perceptions, are often extensive and take much time to complete, which is reflected in the response rate. In addition, due to the limited funds available for data collection, survey distribution strategies were limited, as were incentives or promotions.
It can be highlighted that there are many ways in which the sample of this study may not be representative of the broader population (e.g., 10% were women), and by some standards it was not a large sample. However, it can be highlighted that the sample did reflect the general characteristics Spanish cyclists identified by the survey performed by Martí-Belda et al. [53].
Limitations related to sample size are also associated with model estimation. A bigger sample size would allow the inclusion of a greater number of variables. In addition, the survey was focused on rural roads from a general point of view, and the inclusion of variables related to the influence of cyclists’ risk perception such as traffic volume, traffic speed, or limit speed cannot be included. Speed could be an important variable in the perception of risk because on rural roads, the legal limits are higher than in urban areas. For these reasons, we propose for future research to consider different road sections considering objective data such as geometrical characteristics, the volume of traffic, accident rates, etc.
The results of this research have shown some key factors from the rural cyclists’ point of view. However, this information is not enough to change policy or implement specific plans. It is necessary to analyze and contrast the different point of view of the users who share the road. A similar study including drivers’ perceptions should be performed to propose specific countermeasures to successfully integrate cycling with vehicular traffic on two-lane rural roads in Spain. The authors have developed a motorized drivers survey and as further research the opinions of both populations will be contrasted.

Author Contributions

Conceptualization, G.L., R.A. and A.G.; methodology, G.L. and R.A.; formal analysis, G.L., R.A. and A.G.; data collecting and curation, G.L.; writing—original draft preparation, G.L., R.A. and A.G.; writing—review and editing G.L., R.A. and A.G. All authors have read and agreed to the published version of the manuscript.

Funding

This research was funded by the Ministry of Science, Innovation, and Universities, grant number TRA2016-80897-R and project titled: “Improvement of safety and operation of two-lane rural roads with cyclists (Bike2Lane)”; and by the Dirección General de Tráfico of Spain, grant number SPIP2017-02280 and project title: “Road safety countermeasures for two-lane rural roads with groups of cyclists (Safe4Bikes)”.

Institutional Review Board Statement

Not applicable.

Informed Consent Statement

Informed consent was obtained from all subjects involved in the study.

Data Availability Statement

The data presented in this study are available on request from the corresponding author.

Conflicts of Interest

The authors declare no conflict of interest.

References

  1. Heinen, E.; van Wee, B.; Maat, K. Commuting by Bicycle: An Overview of the Literature. Transp. Rev. 2010, 30, 59–96. [Google Scholar] [CrossRef]
  2. Heydari, S.; Fu, L.; Miranda-Moreno, L.F.; Joseph, L. Using a Flexible Multivariate Latent Class Approach to Model Correlated Outcomes: A Joint Analysis of Pedestrian and Cyclist Injuries. Anal. Methods Accid. Res. 2017, 13, 16–27. [Google Scholar] [CrossRef]
  3. Fruhen, L.S.; Rossen, I.; Kanse, L. Changes in Car Drivers’ Attitudes and Behaviours, and Cyclist Numbers Following the Introduction of a Cyclist Minimum Passing Distance Law. Accid. Anal. Prev. 2021, 156, 106108. [Google Scholar] [CrossRef] [PubMed]
  4. Ministerio de Cultura y Deporte. Anuario de Estadísticas Deportivas 2019. Div. Estadística y Estud. Secr. Gen. Técnica 2019. Available online: https://en.calameo.com/books/0000753350824f9eda03e (accessed on 27 July 2021).
  5. Las Principales Cifras de La Siniestralidad Vial. 2019. Available online: https://www.dgt.es/Galerias/seguridad-vial/estadisticas-e-indicadores/publicaciones/principales-cifras-siniestralidad/Las_principales_cifras_de_la_siniestralidad_vial_Espana_2019.pdf (accessed on 27 July 2021).
  6. Jefatura del Estado Real Decreto 1428/2003, de 21 de Noviembre, Por El Que Se Aprueba El Reglamento General de Circulación. Available online: https://noticias.juridicas.com/base_datos/Admin/rd1428-2003.t2.html (accessed on 27 July 2021).
  7. Moll, S.; López, G.; García, A. Analysis of the Influence of Sport Cyclists on Narrow Two-Lane Rural Roads Using Instrumented Bicycles and Microsimulation. Sustainability 2021, 13, 1235. [Google Scholar] [CrossRef]
  8. López, G.; Martínez, I.; Camacho-Torregrosa, F.J.; García, A. Analysis of Cyclist Perception and Behavior on Two-Lane Rural Roads through an Online Survey. In Proceedings of the 98th Annual Meeting of the Transportation Research Board, Washington, DC, USA, 13–17 January 2019; pp. 1–20. [Google Scholar]
  9. Oja, P.; Titze, S.; Bauman, A.; de Geus, B.; Krenn, P.; Reger-Nash, B.; Kohlberger, T. Health Benefits of Cycling: A Systematic Review. Scand. J. Med. Sci. Sport. 2011, 21, 496–509. [Google Scholar] [CrossRef]
  10. Bassett, D.R.; Pucher, J.; Buehler, R.; Thompson, D.L.; Crouter, S.E. Walking, Cycling, and Obesity Rates in Europe, North America and Australia. J. Phys. Act. Health 2008, 5, 795–814. [Google Scholar] [CrossRef]
  11. Bauman, A.E.; Rissel, C. Cycling and Health: An Opportunity for Positive Change? Med. J. Aust. 2009, 190, 347. [Google Scholar] [CrossRef]
  12. Rojas-Rueda, D.; de Nazelle, A.; Teixidó, O.; Nieuwenhuijsen, M.J. Health Impact Assessment of Increasing Public Transport and Cycling Use in Barcelona: A Morbidity and Burden of Disease Approach. Prev. Med. 2013, 57, 573–579. [Google Scholar] [CrossRef]
  13. Wang, G.; Macera, C.A.; Scudder-Soucie, B.; Schmid, T.; Pratt, M.; Buchner, D. A Cost-Benefit Analysis of Physical Activity Using Bike/Pedestrian Trails. Health Promot. Pract. 2005, 6, 174–179. [Google Scholar] [CrossRef]
  14. Deenihan, G.; Caulfield, B. Estimating the Health Economic Benefits of Cycling. J. Transp. Heal. 2014, 1, 141–149. [Google Scholar] [CrossRef]
  15. Tilahun, N.Y.; Levinson, D.M.; Krizek, K.J. Trails, Lanes, or Traffic: Valuing Bicycle Facilities with an Adaptive Stated Preference Survey. Transp. Res. Part A Policy Pract. 2007, 41, 287–301. [Google Scholar] [CrossRef] [Green Version]
  16. Wardman, M.; Tight, M.; Page, M. Factors Influencing the Propensity to Cycle to Work. Transp. Res. Part A Policy Pract. 2007, 41, 339–350. [Google Scholar] [CrossRef] [Green Version]
  17. Damant-Sirois, G.; El-Geneidy, A.M. Who Cycles More? Determining Cycling Frequency through a Segmentation Approach in Montreal, Canada. Transp. Res. Part A Policy Pract. 2015, 77, 113–125. [Google Scholar] [CrossRef]
  18. Sælensminde, K. Cost-Benefit Analyses of Walking and Cycling Track Networks Taking into Account Insecurity, Health Effects and External Costs of Motorized Traffic. Transp. Res. Part A Policy Pract. 2004, 38, 593–606. [Google Scholar] [CrossRef]
  19. Lam, L.T. Factors Associated with Parental Safe Road Behaviour as a Pedestrian with Young Children in Metropolitan New South Wales, Australia. Accid. Anal. Prev. 2001, 33, 203–210. [Google Scholar] [CrossRef]
  20. Lam, L.T. Parental Risk Perceptions of Childhood Pedestrian Road Safety: A Cross Cultural Comparison. J. Safety Res. 2005, 36, 181–187. [Google Scholar] [CrossRef]
  21. Wegman, F.; Zhang, F.; Dijkstra, A. How to Make More Cycling Good for Road Safety? Accid. Anal. Prev. 2012, 44, 19–29. [Google Scholar] [CrossRef] [PubMed]
  22. Kaplan, S.; Prato, C.G. Cyclist-Motorist Crash Patterns in Denmark: A Latent Class Clustering Approach. Traffic Inj. Prev. 2013, 14, 725–733. [Google Scholar] [CrossRef] [PubMed] [Green Version]
  23. Fishman, E.; Washington, S.; Haworth, N. Barriers and Facilitators to Public Bicycle Scheme Use: A Qualitative Approach. Transp. Res. Part F Traffic Psychol. Behav. 2012, 15, 686–698. [Google Scholar] [CrossRef] [Green Version]
  24. Møller, M.; Hels, T. Cyclists’ Perception of Risk in Roundabouts. Accid. Anal. Prev. 2008, 40, 1055–1062. [Google Scholar] [CrossRef]
  25. Lahrmann, H.; Madsen, T.K.O.; Olesen, A.V.; Madsen, J.C.O.; Hels, T. The Effect of a Yellow Bicycle Jacket on Cyclist Accidents. Saf. Sci. 2018, 108, 209–217. [Google Scholar] [CrossRef]
  26. Esmaeilikia, M.; Radun, I.; Grzebieta, R.; Olivier, J. Bicycle Helmets and Risky Behaviour: A Systematic Review. Transp. Res. Part F Traffic Psychol. Behav. 2019, 60, 299–310. [Google Scholar] [CrossRef]
  27. Kaplan, S.; Luria, R.; Prato, C.G. The Relation between Cyclists’ Perceptions of Drivers, Self-Concepts and Their Willingness to Cycle in Mixed Traffic. Transp. Res. Part F Traffic Psychol. Behav. 2019, 62, 45–57. [Google Scholar] [CrossRef]
  28. Kummeneje, A.M.; Rundmo, T. Attitudes, Risk Perception and Risk-Taking Behaviour among Regular Cyclists in Norway. Transp. Res. Part F Traffic Psychol. Behav. 2020, 69, 135–150. [Google Scholar] [CrossRef]
  29. Hezaveh, A.M.; Zavareh, M.F.; Cherry, C.R.; Nordfjærn, T. Errors and Violations in Relation to Bicyclists’ Crash Risks: Development of the Bicycle Rider Behavior Questionnaire (BRBQ). J. Transp. Health 2018, 8, 289–298. [Google Scholar] [CrossRef]
  30. Useche, S.A.; Montoro, L.; Tomas, J.M.; Cendales, B. Validation of the Cycling Behavior Questionnaire: A Tool for Measuring Cyclists’ Road Behaviors. Transp. Res. Part F Traffic Psychol. Behav. 2018, 58, 1021–1030. [Google Scholar] [CrossRef]
  31. Useche, S.A.; Montoro, L.; Sanmartin, J.; Alonso, F. Healthy but Risky: A Descriptive Study on Cyclists’ Encouraging and Discouraging Factors for Using Bicycles, Habits and Safety Outcomes. Transp. Res. Part F Traffic Psychol. Behav. 2019, 62, 587–598. [Google Scholar] [CrossRef]
  32. Useche, S.A.; Alonso, F.; Montoro, L.; Esteban, C. Distraction of Cyclists: How Does It Influence Their Risky Behaviors and Traffic Crashes? PeerJ 2018, 6, e5616. [Google Scholar] [CrossRef] [PubMed]
  33. Useche, S.A.; Alonso, F.; Montoro, L.; Esteban, C. Explaining Self-Reported Traffic Crashes of Cyclists: An Empirical Study Based on Age and Road Risky Behaviors. Saf. Sci. 2019, 113, 105–114. [Google Scholar] [CrossRef]
  34. Bella, F.; Silvestri, M. Interaction Driver–Bicyclist on Rural Roads: Effects of Cross-Sections and Road Geometric Elements. Accid. Anal. Prev. 2017, 102, 191–201. [Google Scholar] [CrossRef] [PubMed]
  35. Llorca, C.; Angel-Domenech, A.; Agustin-Gomez, F.; Garcia, A. Motor Vehicles Overtaking Cyclists on Two-Lane Rural Roads: Analysis on Speed and Lateral Clearance. Saf. Sci. 2017, 92, 302–310. [Google Scholar] [CrossRef]
  36. Debnath, A.K.; Haworth, N.; Schramm, A.; Heesch, K.C.; Somoray, K. Factors Influencing Noncompliance with Bicycle Passing Distance Laws. Accid. Anal. Prev. 2018, 115, 137–142. [Google Scholar] [CrossRef]
  37. Feng, F.; Bao, S.; Hampshire, R.C.; Delp, M. Drivers Overtaking Bicyclists—An Examination Using Naturalistic Driving Data. Accid. Anal. Prev. 2018, 115, 98–109. [Google Scholar] [CrossRef]
  38. Mecheri, S.; Rosey, F.; Lobjois, R. Manipulating Constraints on Driver-Cyclist Interactions in a Fixed Travel Space: Effects of Road Configuration on Drivers’ Overtaking Behavior. Saf. Sci. 2020, 123, 104570. [Google Scholar] [CrossRef]
  39. Dozza, M.; Schindler, R.; Bianchi-Piccinini, G.; Karlsson, J. How Do Drivers Overtake Cyclists? Accid. Anal. Prev. 2016, 88, 29–36. [Google Scholar] [CrossRef] [Green Version]
  40. García, A.; Angel-Domenech, A.; Llorca, C.; Agustín-Gómez, F.; Ferrer, V. Effects of Road Geometry on the Interaction between Bicyclists and Motor Vehicles on Two-Way Rural Highways. In Proceedings of the In Proceedings of 5th International Symposium on Highway Geometric Design, Vancouver, BC, Canada, 22–24 June 2015. [Google Scholar]
  41. López, G.; Pérez-Zuriaga, A.M.; Moll, S.; García, A. Analysis of Overtaking Maneuvers to Cycling Groups on Two-Lane Rural Roads Using Objective and Subjective Risk. Transp. Res. Rec. 2020, 2674, 148–160. [Google Scholar] [CrossRef]
  42. Mackenzie, J.R.R.; Dutschke, J.K.; Ponte, G. An Investigation of Cyclist Passing Distances in the Australian Capital Territory. Accid. Anal. Prev. 2021, 154, 106075. [Google Scholar] [CrossRef] [PubMed]
  43. Chiou, Y.C.; Chen, Y.H. Service Quality Effects on Air Passenger Intentions: A Service Chain Perspective. Transportmetrica 2012, 8, 406–426. [Google Scholar] [CrossRef]
  44. Golob, T.F. Structural Equation Modeling for Travel Behavior Research. Transp. Res. Part B Methodol. 2003, 37, 1–25. [Google Scholar] [CrossRef] [Green Version]
  45. Saaty, T.L. Applications of Analytical Hierarchies. Math. Comput. Simul. 1979, 21, 1–20. [Google Scholar] [CrossRef]
  46. Brown, A.; Maydeu-Olivares, A. Item Response Modeling of Forced-Choice Questionnaires. Educ. Psychol. Meas. 2011, 71, 460–502. [Google Scholar] [CrossRef] [Green Version]
  47. Meade, A.W. Psychometric Problems and Issues Involved with Creating and Using Ipsative Measures for Selection. J. Occup. Organ. Psychol. 2004, 77, 531–551. [Google Scholar] [CrossRef]
  48. Hox, J.J.; Bechger, T.M. Introduction Structural Equation Modeling an Introduction to Structural Equation Modeling. Fam. Sci. Rev. 1998, 11, 354–373. [Google Scholar]
  49. Kaplan, D. Structural Equation Modeling. In International Encyclopedia of the Social & Behavioral Sciences; Elsevier: Amsterdam, The Netherlands, 2001; pp. 15215–15222. [Google Scholar]
  50. Thurstone, L.L. A Law of Comparative Judgment. Psychol. Rev. 1927, 34, 273. [Google Scholar] [CrossRef]
  51. Thurstone, L.L. Rank Order as a Psycho-Physical Method. J. Exp. Psychol. 1931, 14, 187. [Google Scholar] [CrossRef]
  52. Maydeu-Olivares, A.; Brown, A. Item Response Modeling of Paired Comparison and Ranking Data. Multivariate Behav. Res. 2010, 45, 935–974. [Google Scholar] [CrossRef] [PubMed]
  53. Martí-Belda Bertolín, A.; Bosó Seguí, P.; López Osma, C.; Lijarcio Cárcel, J.I. Análisis de La Siniestralidad En Ciclistas 2008–2013. 2016. Available online: https://www.antena3.com/a3document/2016/04/25/DOCUMENTS/01109/01109.pdf (accessed on 27 July 2021).
  54. Feenstra, H.; Ruiter, R.A.; Kok, G. Social-Cognitive Correlates of Risky Adolescent Cycling Behavior. BMC Public Health 2010, 10, 1–7. [Google Scholar] [CrossRef] [Green Version]
  55. Feenstra, H.; Ruiter, R.A.C.; Schepers, J.; Peters, G.J.; Kok, G. Measuring Risky Adolescent Cycling Behaviour. Int. J. Inj. Contr. Saf. Promot. 2011, 18, 181–187. [Google Scholar] [CrossRef] [PubMed]
  56. Johnson, M.; Charlton, J.; Oxley, J.; Newstead, S. Naturalistic Cycling Study: Identifying Risk Factors for on-Road Commuter Cyclists. In Proceedings of the Annals of Advances in Automotive Medicine—54th Annual Scientific Conference, Baltimore, MD, USA, 5–7 October 2009. [Google Scholar]
  57. Ngueutsa, R.; Kouabenan, D.R. Accident History, Risk Perception and Traffic Safe Behaviour. Ergonomics 2017, 60, 1273–1282. [Google Scholar] [CrossRef]
  58. Chaurand, N.; Delhomme, P. Cyclists and Drivers in Road Interactions: A Comparison of Perceived Crash Risk. Accid. Anal. Prev. 2013, 50, 1176–1184. [Google Scholar] [CrossRef]
  59. Marín Puchades, V.; Fassina, F.; Fraboni, F.; De Angelis, M.; Prati, G.; de Waard, D.; Pietrantoni, L. The Role of Perceived Competence and Risk Perception in Cycling near Misses. Saf. Sci. 2018, 105, 167–177. [Google Scholar] [CrossRef] [Green Version]
  60. Berg, H.Y. Reducing Crashes and Injuries among Young Drivers: What Kind of Prevention Should We Be Focusing On? Inj. Prev. 2006, 12, i15–i18. [Google Scholar] [CrossRef] [PubMed]
  61. Useche, S.A.; Montoro, L.; Alonso, F.; Tortosa, F.M. Does Gender Really Matter? A Structural Equation Model to Explain Risky and Positive Cycling Behaviors. Accid. Anal. Prev. 2018, 118, 86–95. [Google Scholar] [CrossRef] [PubMed]
  62. Hassen, A.; Godesso, A.; Abebe, L.; Girma, E. Risky Driving Behaviors for Road Traffic Accident among Drivers in Mekele City, Northern Ethiopia. BMC Res. Notes 2011, 4, 1–6. [Google Scholar] [CrossRef] [PubMed] [Green Version]
  63. Bonham, J.; Johnson, M. Cyclist-Related Content in Novice Driver Education and Training. Accid. Anal. Prev. 2018, 111, 321–327. [Google Scholar] [CrossRef] [PubMed]
  64. Hatfield, J.; Prabhakharan, P. An Investigation of Behaviour and Attitudes Relevant to the User Safety of Pedestrian/Cyclist Shared Paths. Transp. Res. Part F Traffic Psychol. Behav. 2016, 40, 35–47. [Google Scholar] [CrossRef] [Green Version]
  65. Twisk, D.A.M.; Commandeur, J.J.F.; Vlakveld, W.P.; Shope, J.T.; Kok, G. Relationships amongst Psychological Determinants, Risk Behaviour, and Road Crashes of Young Adolescent Pedestrians and Cyclists: Implications for Road Safety Education Programmes. Transp. Res. Part F Traffic Psychol. Behav. 2015, 30, 45–56. [Google Scholar] [CrossRef] [Green Version]
  66. Kim, J.K.; Kim, S.; Ulfarsson, G.F.; Porrello, L.A. Bicyclist Injury Severities in Bicycle-Motor Vehicle Accidents. Accid. Anal. Prev. 2007, 39, 238–251. [Google Scholar] [CrossRef]
Figure 1. Theorical framework.
Sustainability 13 08424 g001
Figure 2. Structural equation models performed.
Sustainability 13 08424 g002
Table 1. Definition of studied variables.
VariableItems DescriptionScale
Sociodemographics
AgeAge of the respondentContinuous
Gender0 = male; 1 = femaleCategorical
Social Profile
Bike 1 = road; 2 = mountain; 3 = urban; 4 = E-bike; 5 = othersCategorical
DistanceDistance covered per week (km/week)Continuous
YearOverall cycling experience (years)Continuous
Group1 = belong to any cycling group; 2 = not belongCategorical
App1 = use of app to track their activity; 2 = not useCategorical
Traffic Rules
Rules knowledge (Rules_Know)Score of one true/false test about specific knowledge of current regulations (Cycling on the shoulder, Cycling on the bike lane, Cycling in pairs, Total occupation of the lane, Priority in roundabouts, Exceeding the central line if it is discontinuous, Minimum speed for cyclists, Vehicles yield within the roundabouts to cyclists, Minimum lateral distance to overtake, Overtake when there are vehicles in the opposite direction, Exceed the central line if there is double-continuous) Continuous
Rules perception (Rules_Per)How the user perceives their knowledge of the traffic regulations:
1 = very low; 2 = low; 3 = intermediate; 4 = high; 5 = very high
Categorical
Self-reported behavior
Signalization behavior (Sig_Beh)Do you usually signal the movement you are going to take in advanced?
1 = Never; 2 = Usually; 3 = Always
Categorical
Enter roundabout behavior
(EnRound_Beh)
How do you enter roundabouts when travelling in a group of cyclists?
1 = Enter directly without giving way to other vehicles; 2 = Give way to vehicles until there is enough space; 3 = Wait until there are no vehicles or other cyclists inside the roundabout to enter
Categorical
Circulation inside roundabout behavior (CirRound_Beh)How do you circulate inside the roundabouts when circulating with a group?
1 = Circulate inside to make the maneuver as straight as possible; 2 = Try to cut both lanes to have to reduce the speed less; 3 = Perform the maneuver close to the outside edge following the shape of the roundabout
Categorical
Perceived Safety Equipment
CleatsHow do you think the use of cleats or automatic pedals affects access to an intersection?
1 = If necessary, increase speed to avoid having to stop; 2 = Slow down speed to give way but without stopping; 3 = It does not interfere with my behavior and stop at a sufficient distance if necessary
Categorical
HelmetDo you assume more risks when wearing a helmet?
1 = Yes, it gives me more security; 2 = Yes, maybe unconsciously; 3 = No, consider that act in the same way
Categorical
Perceived Risk Elements
Road geometry (RG)A: Insufficient lane widthOrdered
B: Insufficient shoulder width
C: Sudden narrowing of the shoulder
D: Lack of visibility at intersections
E: Low radius curves and poor visibility
Road signs, markings and equipment (SME)A: Lack of adequate signsOrdered
B: Inappropriate vertical or horizontal signs
C: Lack of visibility due to poor signal placement
D: Elements invading shoulder: safety barriers, drainage grids, signs or vegetation, …
E: Presence of separating elements: fissures, ditches, …
Road conditions (RC)A: Adverse weather conditionsOrdered
B: Pavement or road markings sliding
C: Impassable shoulders (in poor condition or dirty)
D: Deficiencies in the pavement (potholes, fissures, ...)
E: Lack of cleanliness in lanes or margins of the road
Motorized drivers factors (MDF)A: Alcohol or drugsOrdered
B: Lack of civility
C: Neglect or overconfidence
D: Inadequate safety side distance
E: Inadequate vehicle speed
Cyclists factors (CF)A: Alcohol or drugsOrdered
B: Invasion of the roadway by cyclists
C: Neglect or overconfidence
D: Sudden changes in the position of cyclists in the group
E: Lack of civility
Overtaking vehicle type (OVT)A: MotorcycleOrdered
B: Car
C: SUV, 4x4, SUV, minivan
E: Van
D: Truck or coach
Table 2. Example of transformation rank variables into dummy variables.
Forced-Choice Block
Itemsrisk_Arisk_Brisk_Crisk_Drisk_E
Rank examplehighvery highlowmediumvery low
Dummy Variables
Binary comparision{risk_A, risk_B}{risk_A, risk_C}{risk_A, risk_D}{risk_A, risk_E}{risk_B, risk C}{risk_B, risk D}{risk_B, risk E}{risk C, risk_D}{risk C, risk_E}{risk D, risk_E}
Binary outcome0111111011
Publisher’s Note: MDPI stays neutral with regard to jurisdictional claims in published maps and institutional affiliations.

