
Water Use Behavior in a Multicultural Urban Area in Sweden


Department of Built Environment and Energy Technology, Linnaeus University, 35195 Växjö, Sweden
*
Author to whom correspondence should be addressed.
Sustainability 2021, 13(15), 8603; https://0-doi-org.brum.beds.ac.uk/10.3390/su13158603
Submission received: 25 June 2021
/
Revised: 28 July 2021
/
Accepted: 29 July 2021
/
Published: 2 August 2021
(This article belongs to the Special Issue Energy and Environment Management through Data-Driven Modelling, Optimization and Forecasting)
Abstract
:The increasing world population and climate change are major concerns for the supply of water needs. Understanding user behavior facilitates the development of effective strategies of domestic water management. This research applied a questionnaire survey and data analysis methods to analyze the water consumption behavior of tenants in a multicultural urban area, dominated by immigrants of different ethnic origins, in the city of Växjö in Sweden. Results showed that the majority of the studied participants perceived themselves to be environmentally friendly. They reported to be engaged in water conservation activities quite often, but analysis showed that they did not have accurate perceptions of their water consumption. Positive attitudes towards water conservation and self-reported water conservation activities significantly but negatively influenced respondents’ actual water consumption, i.e., water consumption was higher. Subjective norms did not have a significant influence. The results also revealed that individual measurement and debit positively influenced, i.e., reduced, actual water consumption. Therefore, water management systems should include an individual measurement and debit system combined with a visualization system to enable tenants to monitor the quantity and cost of their water consumption.
1. Introduction
Sustainable water management is one of humanity’s top ten challenges for the next 50 years [1], especially in the context of urban sustainability [2]. Climate change and increasing population are known as major causes of imbalances in the supply and demand in urban water systems [3]. Water demand increases with increases in temperature [4], while the water supply might decline because of climate change [3]. Additionally, the world population has increased from 2.5 billion in 1950 [5] to 7.68 billion in 2020 [6] and is predicted to reach 11 billion [7] by 2100. Increased population and increasing quality of life have increased water demand by six-fold over the past 100 years [8]. Hence, reduction of water demand has been considered an important section of water management programs [9,10].
The European Union (EU) has had a population increase of around 24% in recent decades, from 400 million in the 1960s to 497 million in 2007 [11], but water use has declined in many geographical regions. Eastern European countries such as Bulgaria, the Czech Republic, Hungary, Poland, Romania, Slovenia, and Slovakia have reduced water use by about 37% between the years 1990 and the period 2002–2005 [11]. Household water consumption in Western Europe shows a similar trend, but with a lower reduction. The reduction has taken place through water-saving measures, reduction of leakages, and better water management knowledge. Water consumption in Southern Europe and Turkey has increased due to increased tourism, as well as the increased population in Turkey [11].
About 87% of Sweden’s population is connected to the municipal water and sewer network. Individual wells are not included in the municipal drinking water network [12]. As is the case in most developed countries, drinking water in Sweden is not only used for drinking but is used for others purposes in the household, such as showering, toilet flushing, washing, and cooking [13]. The total water use in Sweden in 2015 was five percent lower compared to the consumption in 2010. The reduction was mainly in agriculture and the manufacturing industry, while the decrease was around two percent in the households [14]. The decrease in the household water consumption is due to increased environmental awareness and, especially, low-flush toilets and efficient dishwashers and washing machines [15].
Understanding user behavior can help in developing strategies to reduce the environmental impacts of resource use, e.g., water [16,17]. Most water-related behaviors in households are specific routines formed by multiple factors that are shared within certain groups of people [18]. Examples of such factors include sociodemographic and economic factors, dwelling types, attitudes and knowledge, and infrastructure [19]. Householders’ water-related decisions are impacted by preferences and habits that are rooted in the norms and beliefs of certain cultural contexts [20,21]. Thus, decision-making is based on “fundamentally cultural” values [20]. While water managers and researchers have understood that water demand is impacted by routines and internalized norms influenced by the sociocultural backgrounds of users [22], little is known about factors of water use patterns related to ethnic diversity. As multicultural urban areas, i.e., householders with different ethnic origins, are becoming more common in many urban areas [23], understanding the influence of ethnic origins on water use behavior can contribute to developing strategies to reduce water consumption. It is important to consider cultural diversity in sustainable water use and management programs in order to effectively translate management strategies into everyday practices with regard to social justice and equity [24].
In today’s world, public resource conservation strategies are mainly dominated by experts such as economists, ecologists, engineers, and so on, and the main outcome is usually an estimation of supply and demand of future resources reported in terms of global, regional, or national needs [25]. In such approaches, which Shove calls “environment-centered” inquiry, two models of humans are considered [25]. The first model assumes humans to be a whole population that consumes anonymous resources. The second model considers humans as individuals targeted by market research and advertising campaigns that push them toward decisions that lead to actions that are less damaging and more sustainable [25]. Major policies of domestic water demand management in many regions of the world are based on these two models of humans [26]. Examples of such policies to reduce water consumption include the imposition of laws or offering incentives to adopt water-saving technologies (e.g., low-flow shower heads and dual flush toilets) [26]. These water management policies are based on the “one-size-fits-all” model [27] and ignore the highly diverse, complex, and multiple characteristics of human interaction with natural resources [28].
The aim of this study was to analyze the water use behavior of tenants of rental buildings in a multicultural area in Växjö city, which is located in the south of Sweden. This research contributes to the existing body of knowledge by (a) comparing the actual behavior and self-reported behavior of the households in the studied area and (b) identifying underlying self-reported factors influencing the actual water consumption behavior. The studied area, “Alabastern”, is dominated by immigrants and refugees and has significant cultural and ethnic diversity. The residential buildings investigated in this study have gone through a deep energy renovation (during 2019–2020), with water-saving taps installed in each apartment and individual water meters also installed.
2. Theoretical Framework
In contrast to the “one-size-fits-all” models, described in the previous section, cultural water management approaches prioritize cultural studies that consider individuals’ actual habits and expectations [27]. The majority of water conservation policies assume water users to be ethically responsible for making appropriate decisions about resource conservation. Such policies usually fail to consider the social and cultural differences associated with different habits, expectations, values, and practices of water use [28]. Therefore, water management should go beyond simply holding the users responsible and pushing them to change. It should also aim to understand users as groups with values, habits, and expectations that have been formed, on the one hand, through interactions with water and water technologies and, on the other, by the different effects of the large-scale systems and infrastructures for water supply and associated governance arrangements [26].
Identifying motivations for water conservation is critical when designing urban water-saving strategies [29]. Water-saving procedures are considered to be under the complete control of individuals [30], but attitudes and beliefs directly impact water use behaviors [31]. The theory of reasoned action (TRA) posits that behavioral intention is a function of (a) attitudes toward behavior and (b) subjective norms [32] and is based on the assumption that human behavior depends on conscious personal choice rather than on external forces [33].
2.1. Attitude and Subjective Norm
Attitude refers to the degree of a person’s positive or negative evaluation of a behavior [32]. Individuals with a positive attitude toward a behavior are more likely to engage in such a behavior, while it is the opposite in the case of a negative attitude [34,35,36,37]. The subjective norm refers to the pressure on the individual to meet the expectations of people who are important to them [32], i.e., to undertake activities that are perceived to be normal for the surrounding society. Studies from the literature show that subjective norms have a positive impact on individual behavior [37,38,39]. Several studies have employed the TRA to examine the influence of attitudes and subjective norms on water-related behavior and the general conclusion is that attitudes and subjective norms have a considerable impact on individuals’ water-related behavior [40,41,42,43].
2.2. Environmental Concern
Environmental concern can change an individual’s behavior and make it more aligned with environmental protection [44]. Previous studies have established the relation between environmental concern and individuals’ decisions to choose environmentally friendly activities [45,46,47]. Environmental concern is often considered as a general attitude toward environmental protection [48,49,50] and such a concern affects behavioral intention via attitudes and subjective norms [49,50,51,52,53,54]. For instance, Chen and Tung [55] indicated that attitude and subjective norms significantly mediate the relation between environmental concern and intentions.
2.3. Water Conservation Activities
Water conservation activities are usually defined as those actions that decrease water consumption, improve the efficiency of water consumption, and reduce losses and waste [56]. Existing studies have demonstrated that conservation behaviors (such as water conservation) may become habitual when frequently performed [57,58]. On the other hand, according to goal-framing theory [59], people might not engage in water conservation behavior due to hedonic motives, which means that people engage in an activity based on the way they feel right at the time of action (e.g., enjoying a long, hot shower). If this is the case, then attitude and norms may not have a significant influence on water conservation activities.
2.4. Individual Measurement and Debit
The Energy Efficiency Directive of the EU mandates that individual meters for heating and hot water for domestic use must be installed in each building unit if the building has central systems for heating and domestic hot water or is supplied by district heating systems. Following this, in Sweden, individual measurement and debit (IMD) systems for space heating and hot water are increasingly being installed at the apartment level. In such circumstances tenants pay for the energy and water use separately from the rent. This is a regulatory requirement from 1 July 2021 for all apartment buildings undergoing major renovations or retrofitting the tap water system [60]. The reasoning behind the IMD system is that better information on actual quantity and cost will reduce energy need through reduced indoor temperature and reduced use of domestic hot water [59]. The assumption in this reasoning seems to be that cost consciousness will motivate people to reduce consumption to save money. Some companies claim that the IMD system reduces hot water consumption by up to 33% (see, e.g., [61]). The IMD system had been installed in the apartments studied here. However, a number of existing studies have shown that domestic water consumption tends to be price-inelastic, which means that a decrease in water consumption is less likely to occur with an increase in price [62,63,64]. Generally, for the more basic and essential use of water, the price elasticity of water demand is closer to zero. Consequently, price mechanisms will not greatly change the demand for those quantities of water [65].
2.5. Applied Conceptual Model
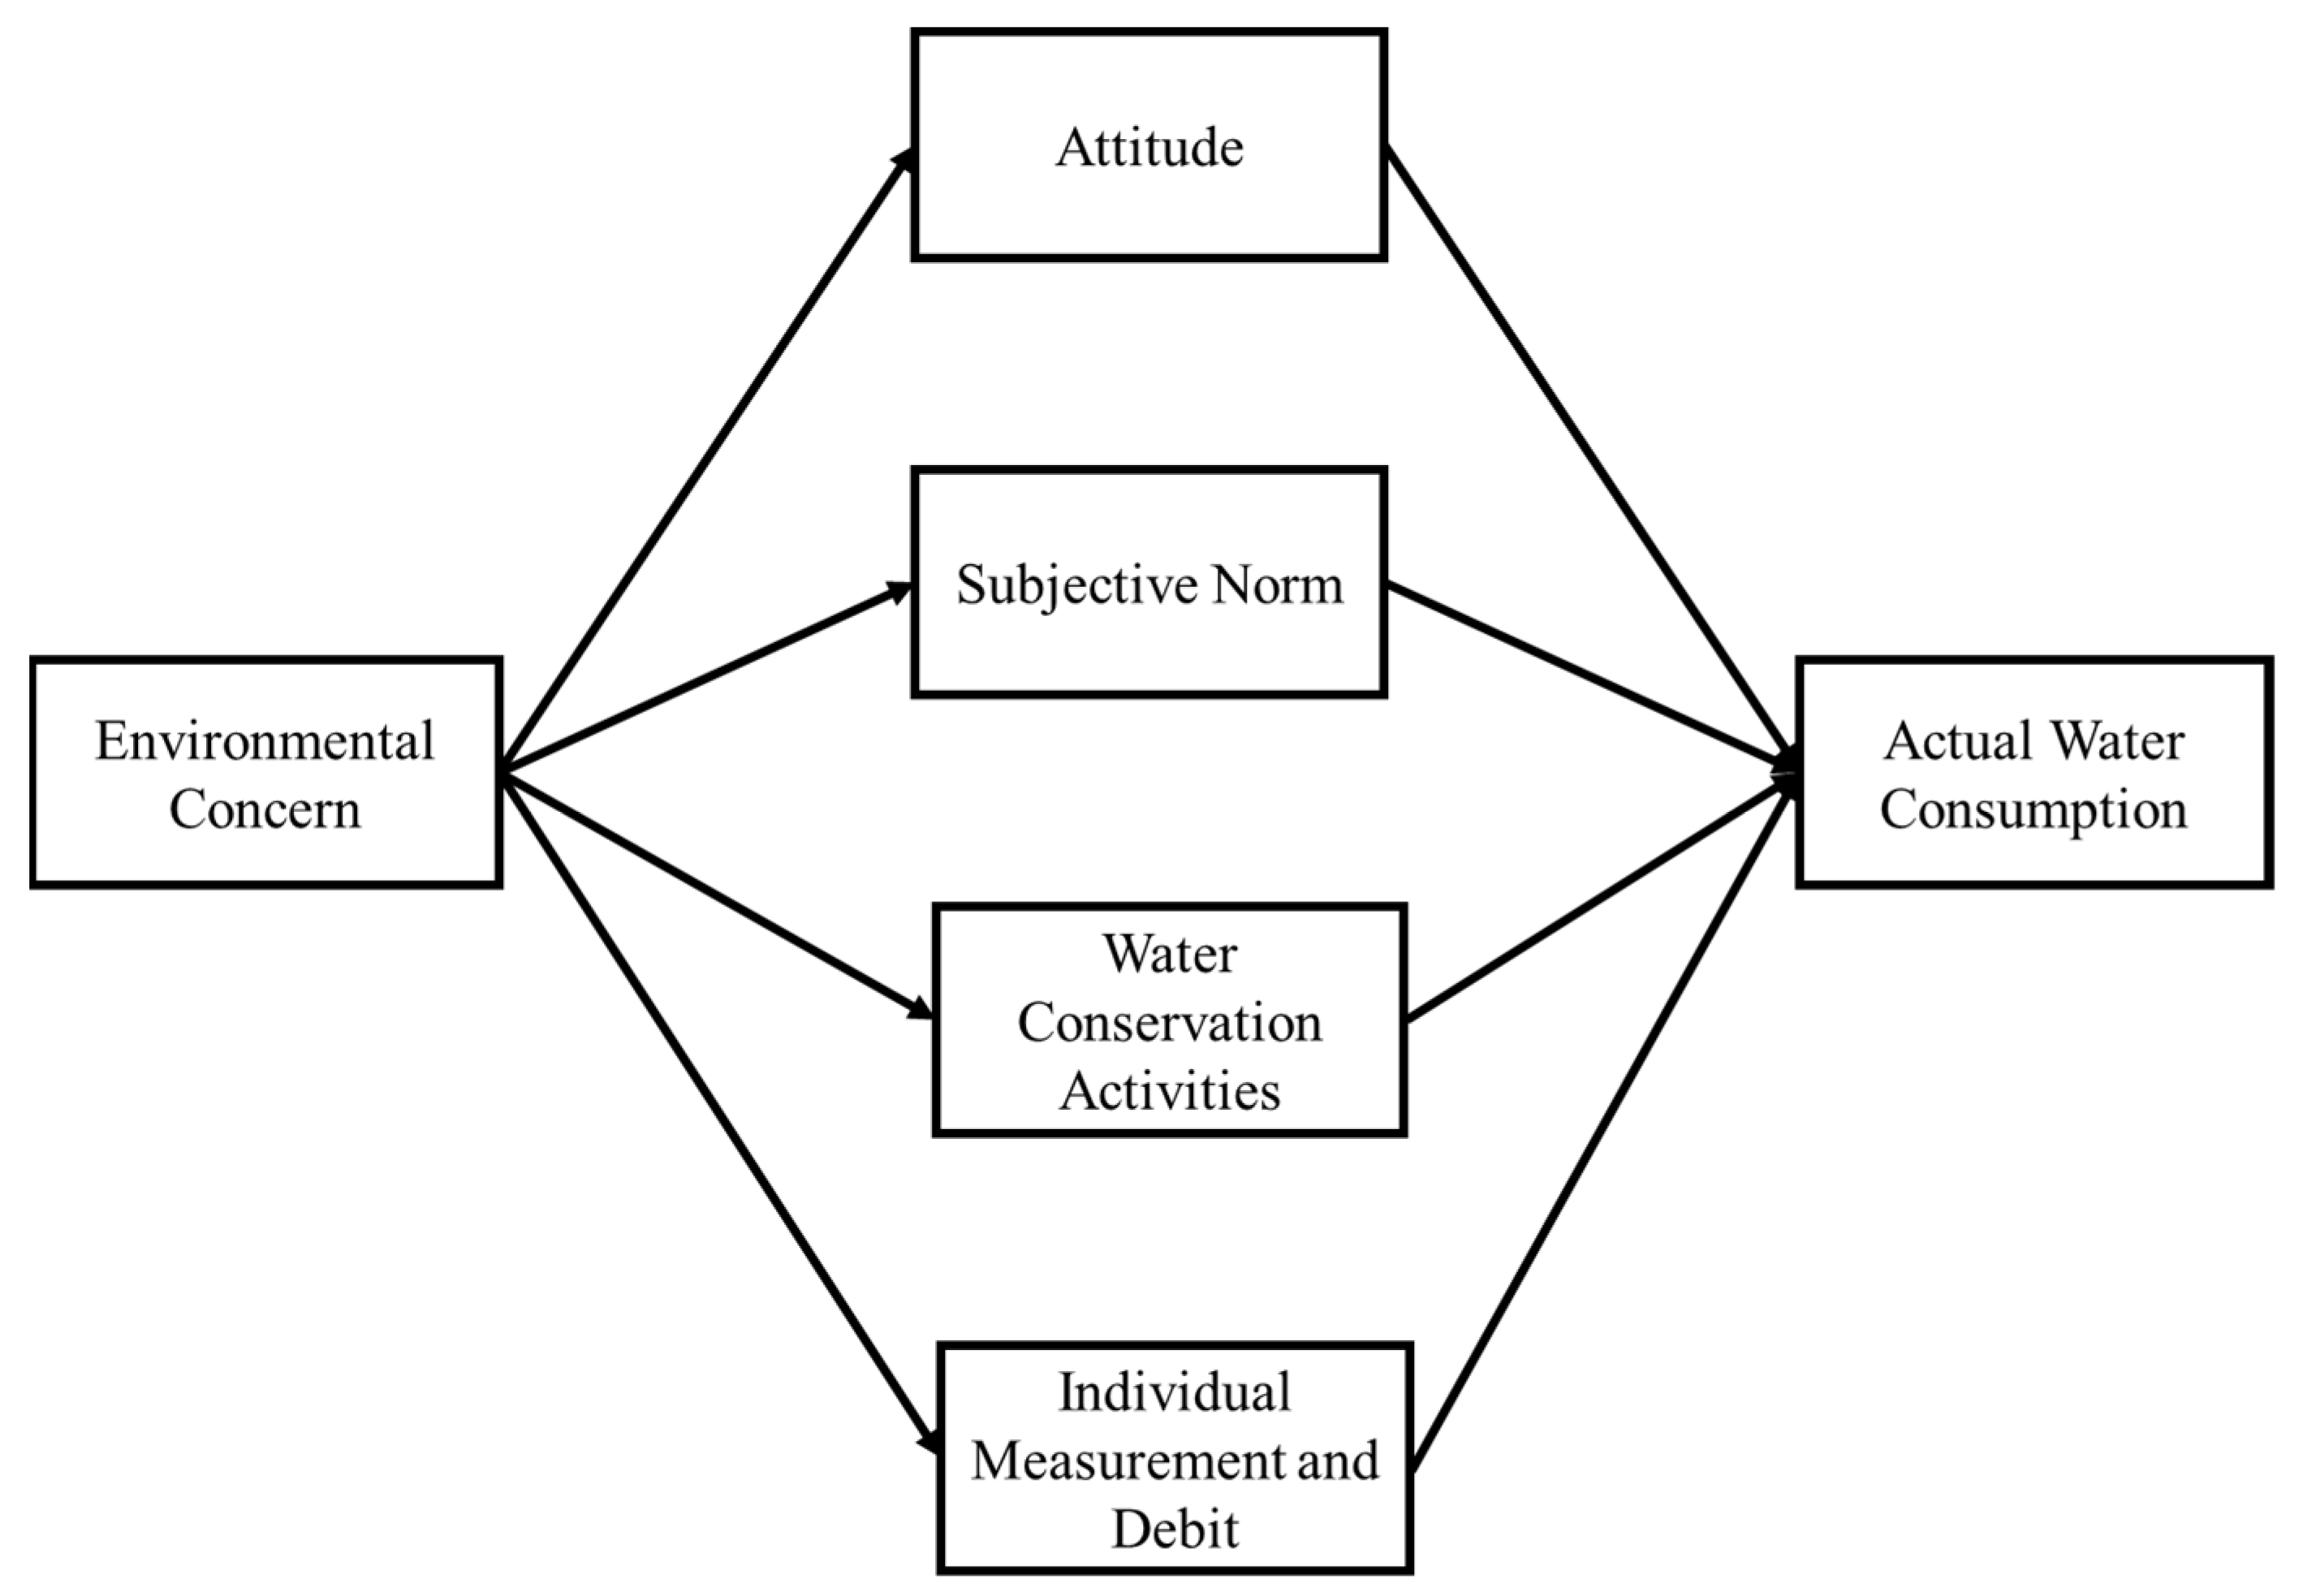
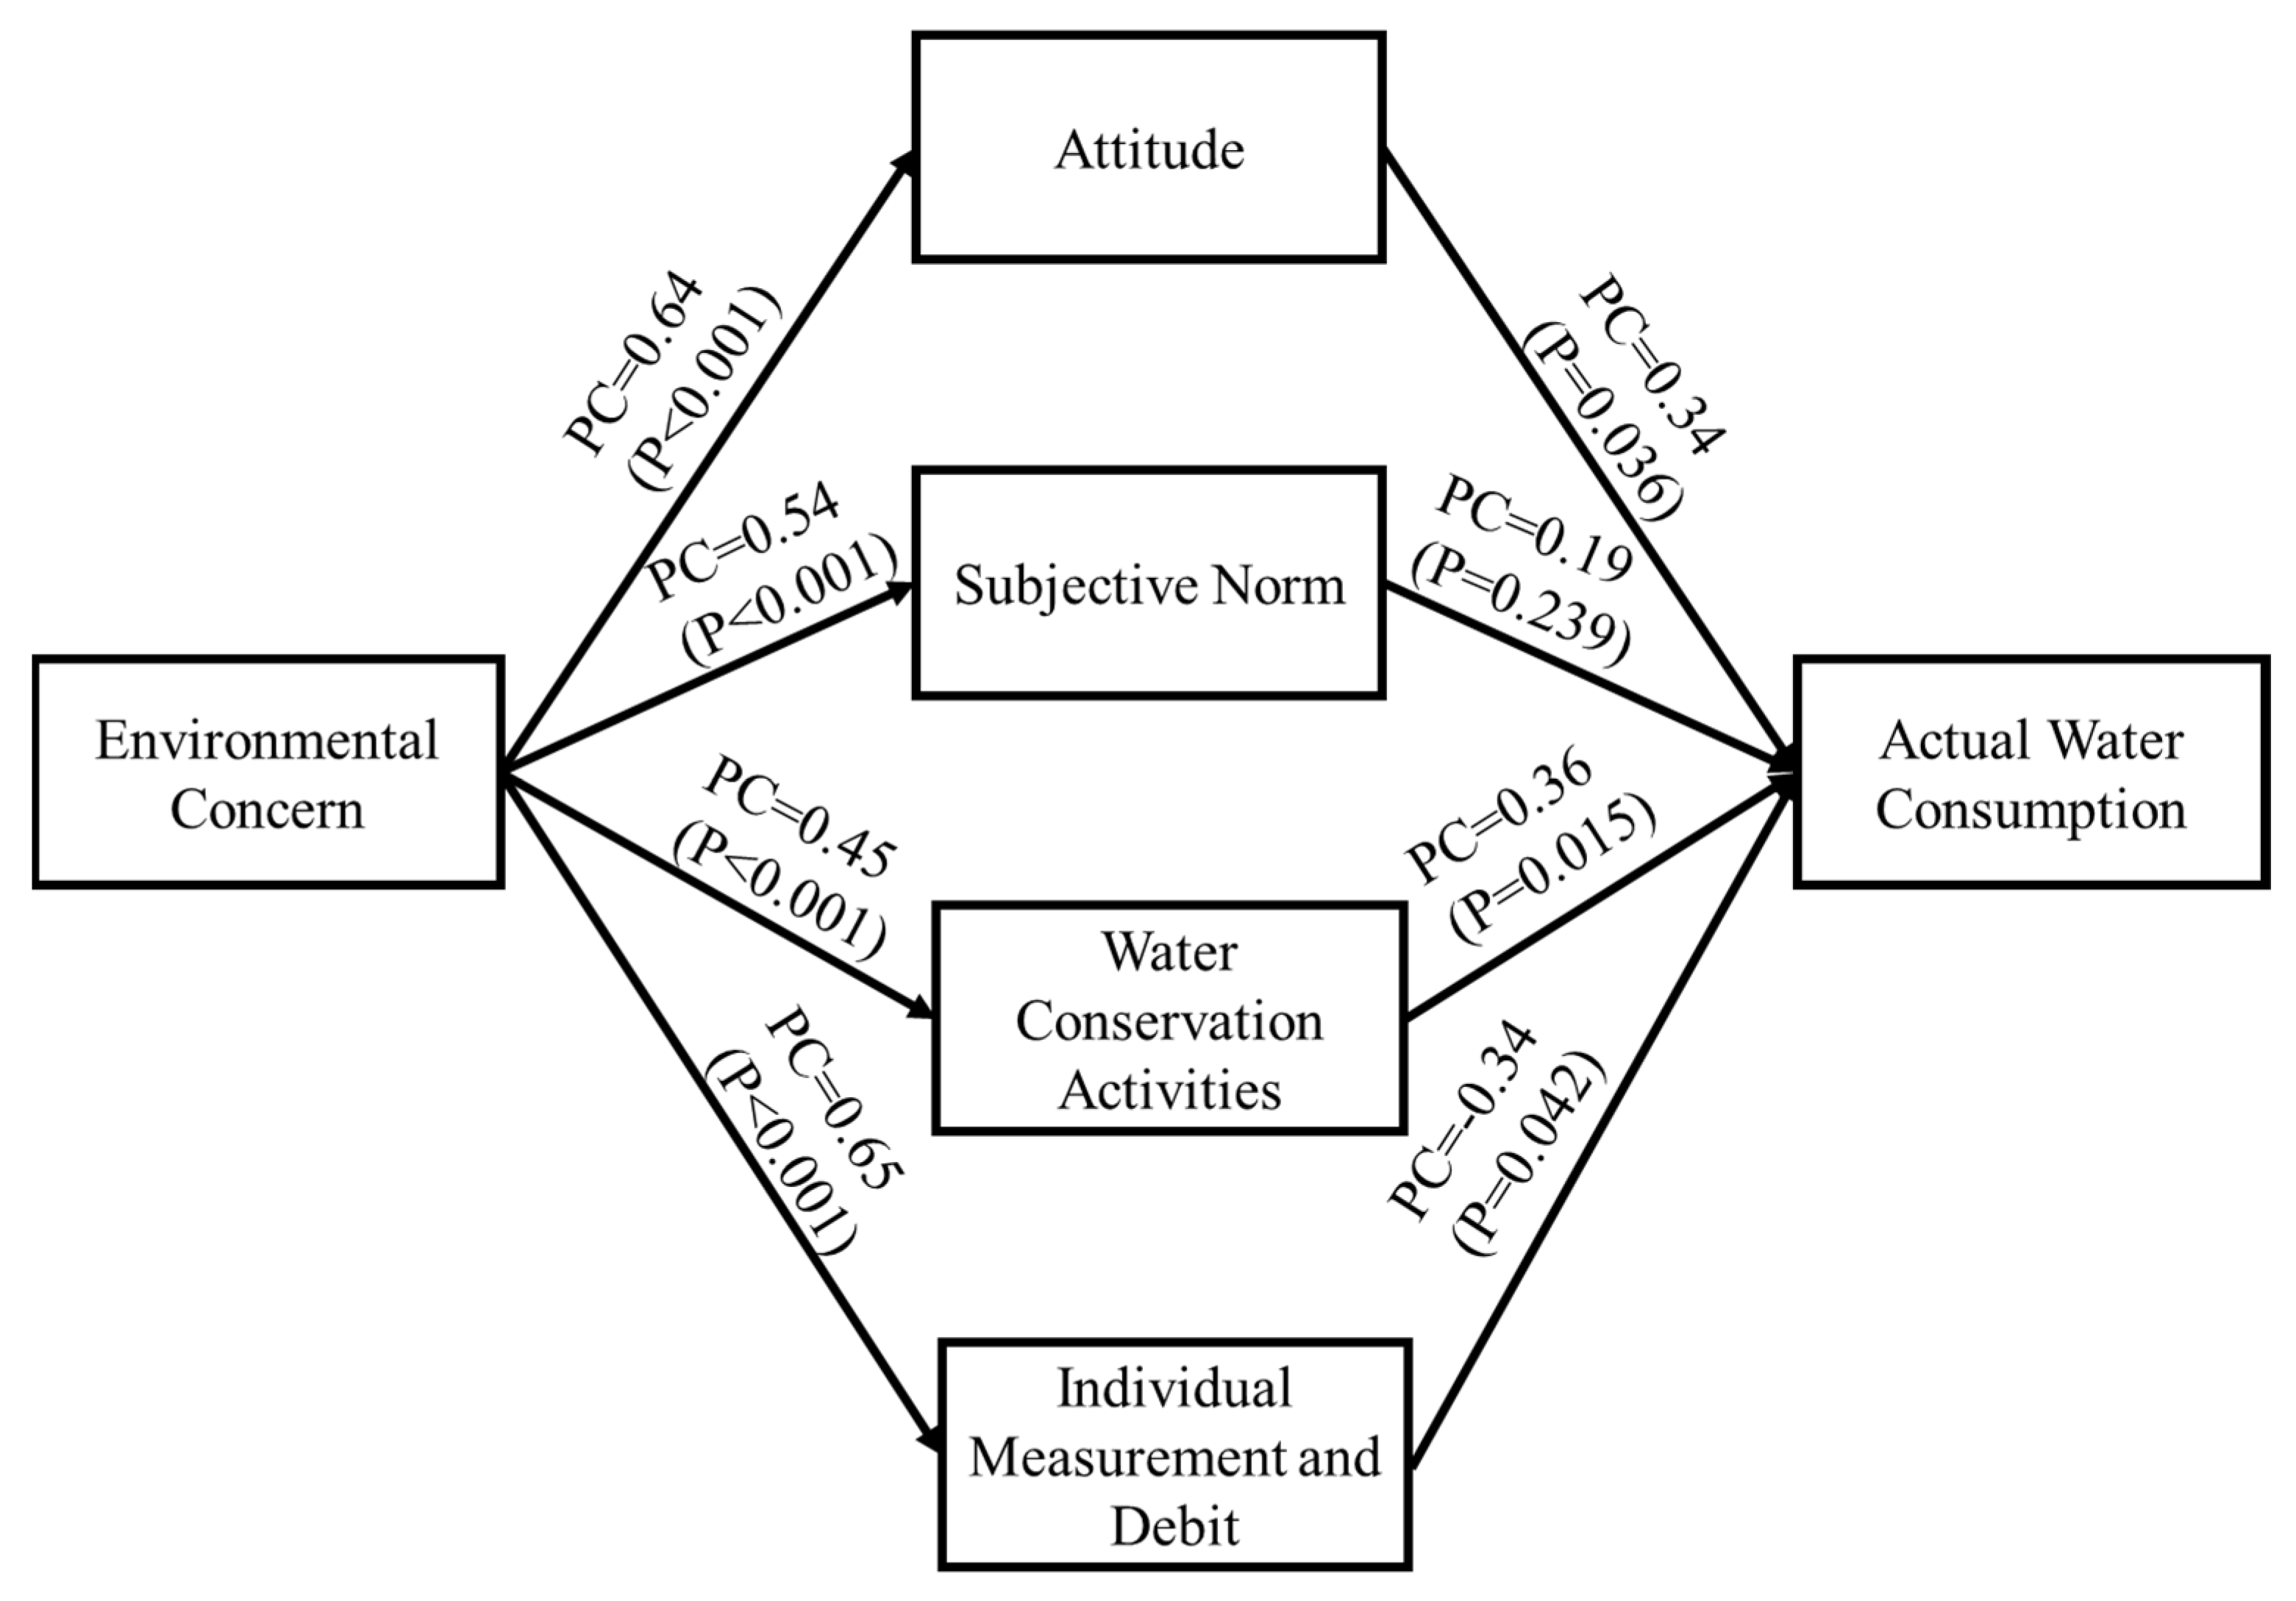
Figure 1 shows the conceptual model adapted from Untaru et al. [33] and applied in this paper to analyze water-related behavior. In this model, in addition to the original factors of the TRA framework, three variables—environmental concern, IMD, and water conservation activities—were also included. Attitudes toward water conservation behavior, subjective norms, IMD, and water conservation activities were the assumed causes of behavioral outcomes (actual water consumption) and were considered as mediators between environmental concern and behavioral outcomes. Untaru et al. [33] has applied this model to predict individuals’ intentions with regard to water conservation in a lodging context. This present study goes beyond the “intention” analysis by building a model on the data gathered from actual water consumption.
3. Method
3.1. Questionnaire Survey
Data for this research were obtained through a questionnaire survey, which was printed in multiple languages and distributed to 313 apartments in the studied area. Since it was culturally and linguistically challenging to reach the people living in the studied neighborhood, the concept of “para-professional aids” was applied in this regard. Para-professional aids are better-educated and communicative people from a community who are oriented by experts to facilitate communication with the community [66]. In March 2020, three para-professional aids (two women and one man) were recruited and oriented by one of the authors to visit each apartment and distribute the questionnaire survey. After one reminder, a total of 63 out of 313 respondents returned the questionnaire survey. This gave a response rate of nearly 20 percent. This might be considered a low rate but is in agreement with the work of Amedeo et al. [67], who stated that non-compulsory self-completion postal surveys usually have a low response rate of between 20% and 30%. This low response rate might also have been due to the special socio-economic and cultural situation of the studied area.
In addition to the low response rate, those who responded did not answer all questions. Hence, we report the number of observations (n) for each analyzed question. The low response rate means there might have been a non-response bias, i.e., a specific category of the population that did not respond. To check this, in Table 1, we compare the composition of the respondents with that of the population in the Araby district, where the Alabastern neighborhood is located, with regard to gender and country of origin. The Araby area encompassed all types of residential buildings, which included multifamily rented apartments, condominiums, and one- and two-family houses. The last two types of buildings are more likely to be owned by Swedish nationalities; therefore, their share was somewhat higher in the Araby population. Since, the composition of respondents to our survey was rather similar to that of Araby, with regard to gender and original nationality, it is likely that the respondents to our survey represented the population in Alabastern.
3.2. The Questionnaire
The list of questions (translated from Swedish to English) included in the analysis is presented in Table 2. The questions included were about the self-reported (perceived) level of water consumption and water costs (question 1), attitude (question 2), self-reported water conservation activities (question 3), subjective norms (question 4c,d), individual measurement and debit (question 4a), and environmental concern (question 4b). IMD is meant to reduce water consumption through increased awareness regarding the quantity and cost of water use; therefore, importance given to “save money” is an indicator of IMD. The respondents could answer all the questions in a five-point Likert scale (1 = not important, 5 = very important). In situations where the constructs of the theoretical model (Figure 1)—i.e., attitude, subjective norms, and water conservation activities—were determined by more than one question, the average value of the responses to each question was calculated. For instance, attitude was calculated from responses to question 2a,b in Table 2. If a respondent selected 3 for question 2a and 4 for question 2b, then the attitude for this respondent was calculated to be 3.5 (average of 3 and 4).
3.3. Actual Water Consumption
Individual water meters had been installed in all 313 apartments of the Alabastern study area. Therefore, it was possible to gather actual daily water consumption data for those apartments. However, the General Data Protection Regulation (GDPR) in the EU requires the consent of each household to collect such data. Only 46 households consented, and these formed the basis for this study. This low consent rate might have been due to privacy concerns.
Based on the questionnaire survey, on average, 3.5 persons were living in each apartment in the studied area. The average water consumption of the 46 apartments and of all 313 apartments in Alabastern was 125 L/capita/day and 110 L/capita/day, respectively. According to the SCB [14], the most recently recorded average water consumption value in Sweden is 140 L/capita/day. Since, on average, 1.9 persons live in each apartment of a multifamily building in Sweden, the average water consumption in multifamily households would be 0.266 m3/day.
3.4. Data Analysis
In this study SPSS and AMOS software were used to analyze the data. Structural equation modeling (SEM) was applied to examine the hypothesized relationships between the variables of the theoretical construct in Figure 1. According to Jöreskog and Sörbom [68], SEM estimates the coefficients of the causal relationship between latent variables and specifies how the hypothetical constructs are indicated by observed variables.
4. Results and Discussion
4.1. Actual Water Consumption Variation among Households
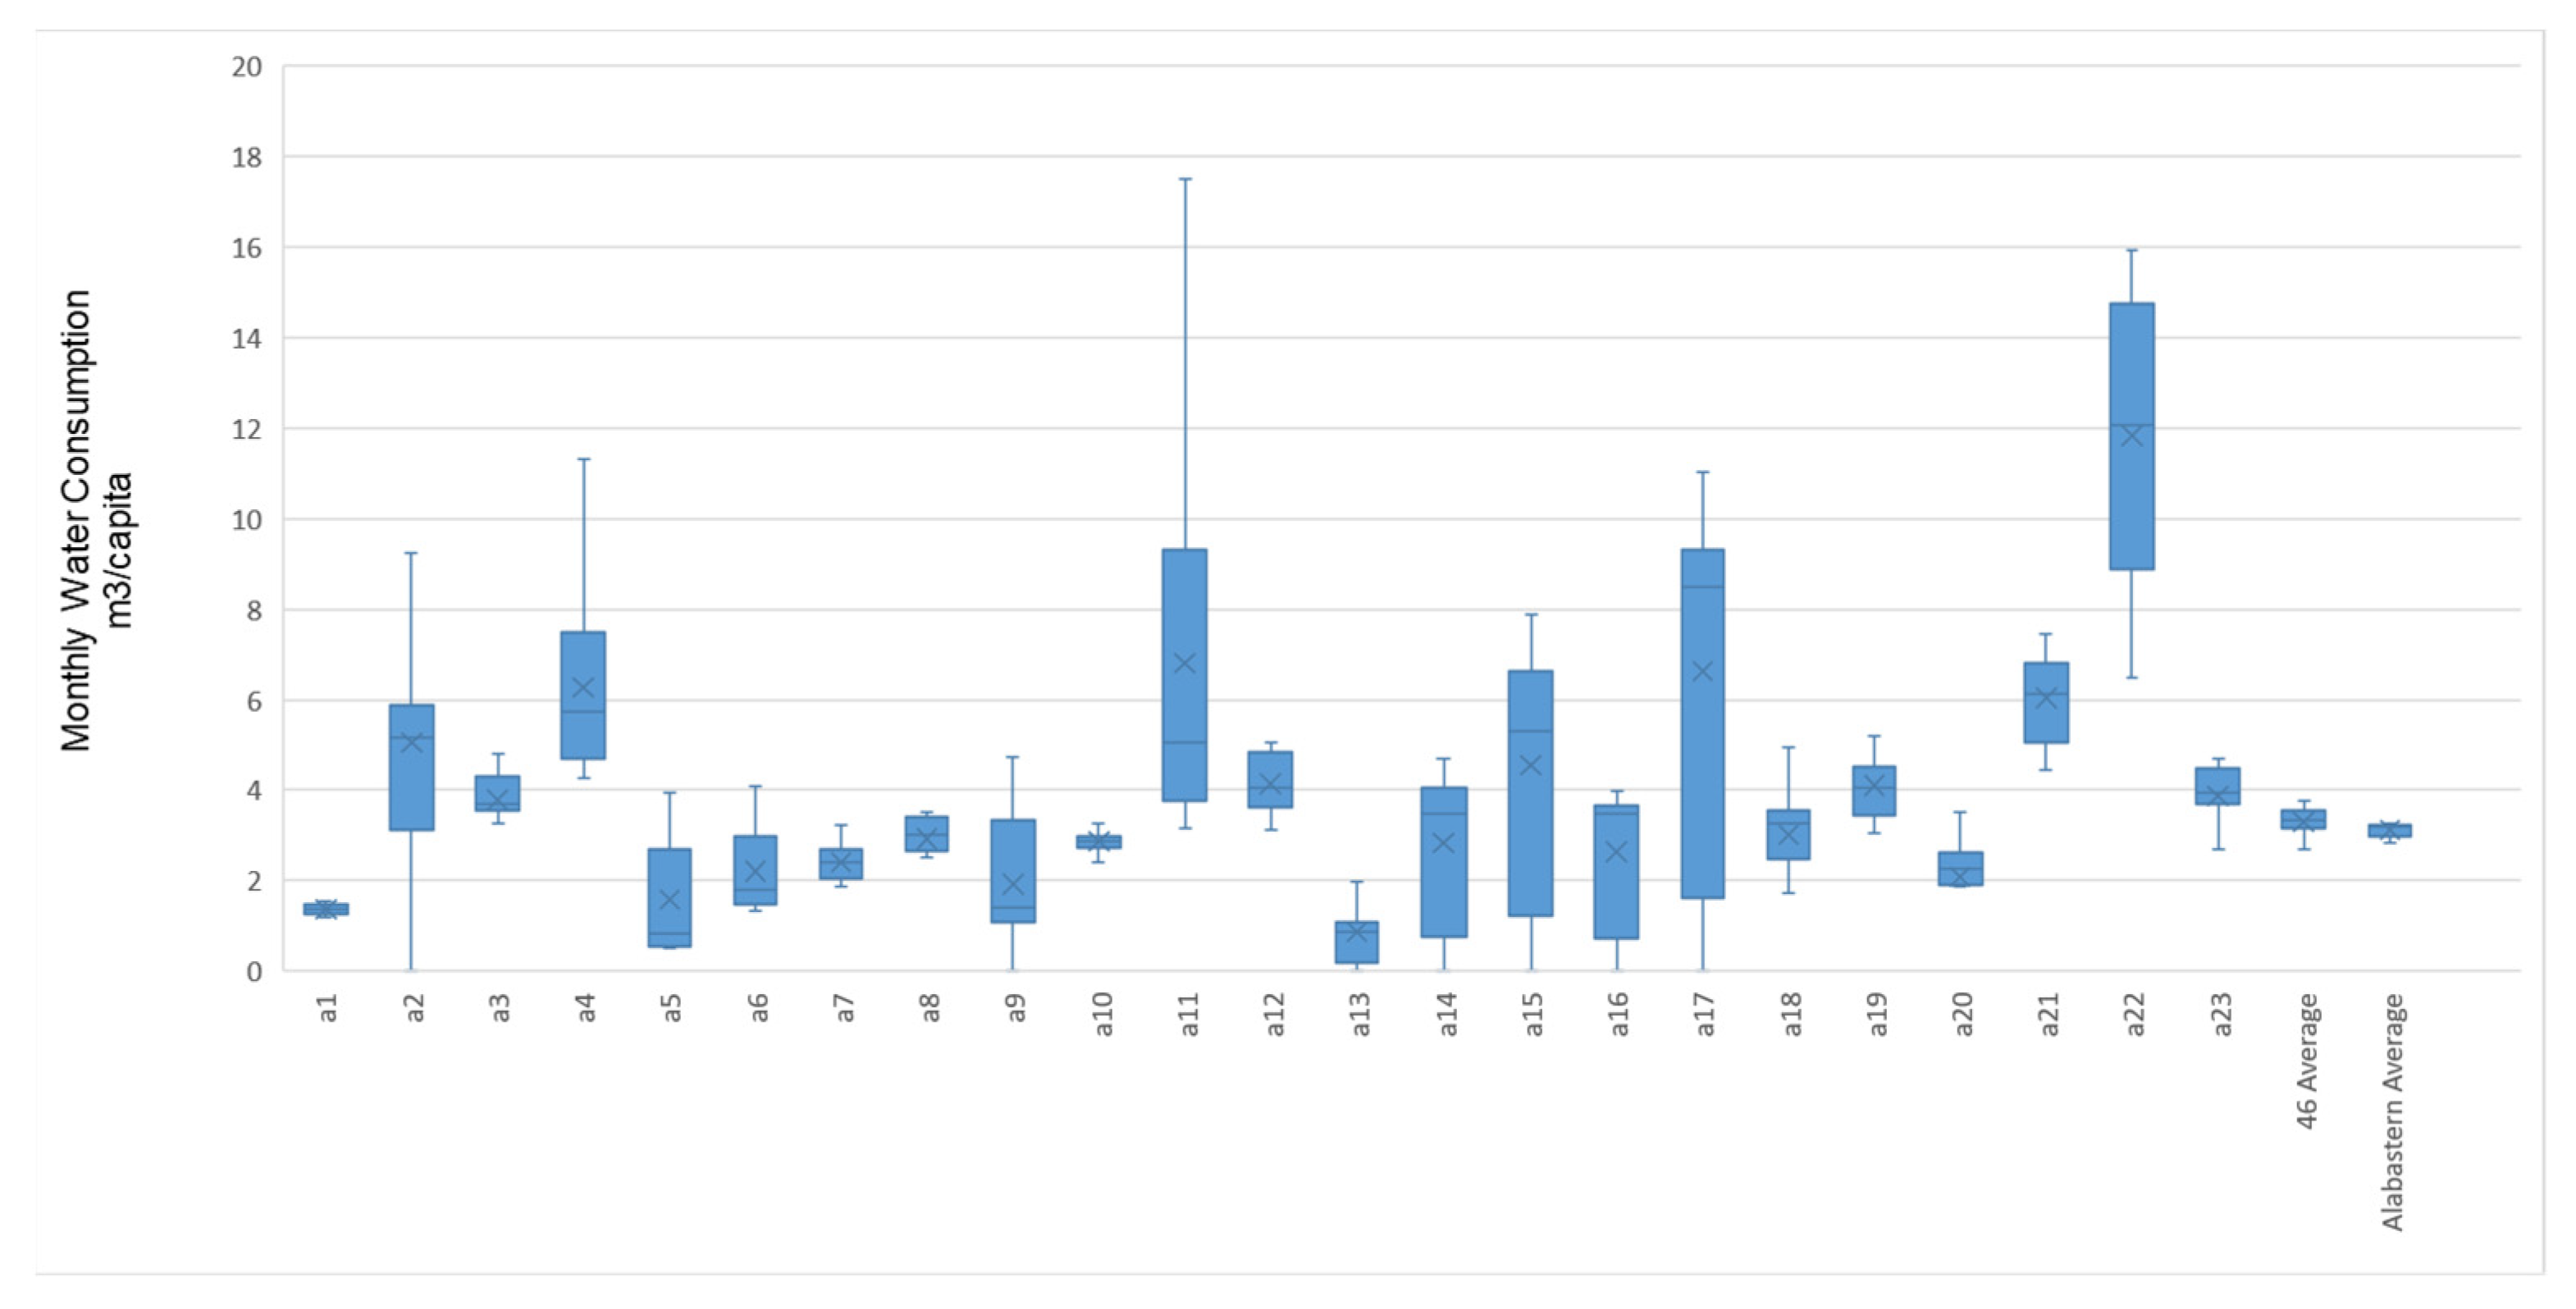
A total of 41 respondents provided information on the number of people living in the associated household, and 23 of those were among the 46 apartments who consented to the collection of daily water consumption data. Figure 2 illustrates the distribution of monthly water consumption (12 months, January 2019 to December 2019) per capita for each of the 23 apartments, the average of the 46 apartments (46 average), and the average of all 313 apartments in Alabastern (Alabastern average). Water use data are presented per capita using a boxplot. A boxplot is a standardized way of displaying the statistical distribution of data based on five numbers: The minimum value, first quartile (lower), median, third quartile (upper), and maximum value. Boxplots are useful as they show the signs of skewness and the dispersion of the dataset. The middle line of the box represents the median or the middle number of a dataset (e.g., monthly water use in different apartments), i.e., 50% of the observations lie below and above this point. The bottom line of the boxplot, also known as the first quartile, represents the middle number between the smallest number and the median of the dataset, i.e., 25% of the observations lie below this point. The top line of the boxplot, which is known as the third quartile, represents the median of the top half of the dataset, i.e., 75% of the observations lie below this point or 25% of the observations lie above this point (excluding the outliers). The whiskers (vertical lines) extend from the ends of the box to the smallest number excluding outliers and maximum value excluding outliers. Outliers are data points that fall outside a range of 1.5 times the interquartile range (IQR = quartile 3 − quartile 1), above the upper quartile and below the lower quartile (Q1 − 1.5 ∗ IQR or Q3 + 1.5 ∗ IQR). Outliers may indicate a problem with the measurement or the data recording and therefore it is justified to remove these values. Since such values are rare, their removal should not have a statistical impact on results. All outliers were removed in the analysis presented in this paper.
The results showed that the average water consumption of the 46 apartments varied from 2.67 m3/capita in January 2019 to 3.77 m3/capita in October 2019. In many apartments, water consumption varied significantly in different months of the year (e.g., in apartments a11, a17, and a22), while in some other apartments there was very little fluctuation (e.g., a1 and a10). Water consumption in apartments a21 and a22 was well above the average for all 46 apartments, while apartments a1, a13, and a20 consumed water less than the average. Finally, the average water consumption of the 46 households was higher than the average of the entire range of Alabastern households.
4.2. Self-Reported versus Actual Water Consumption
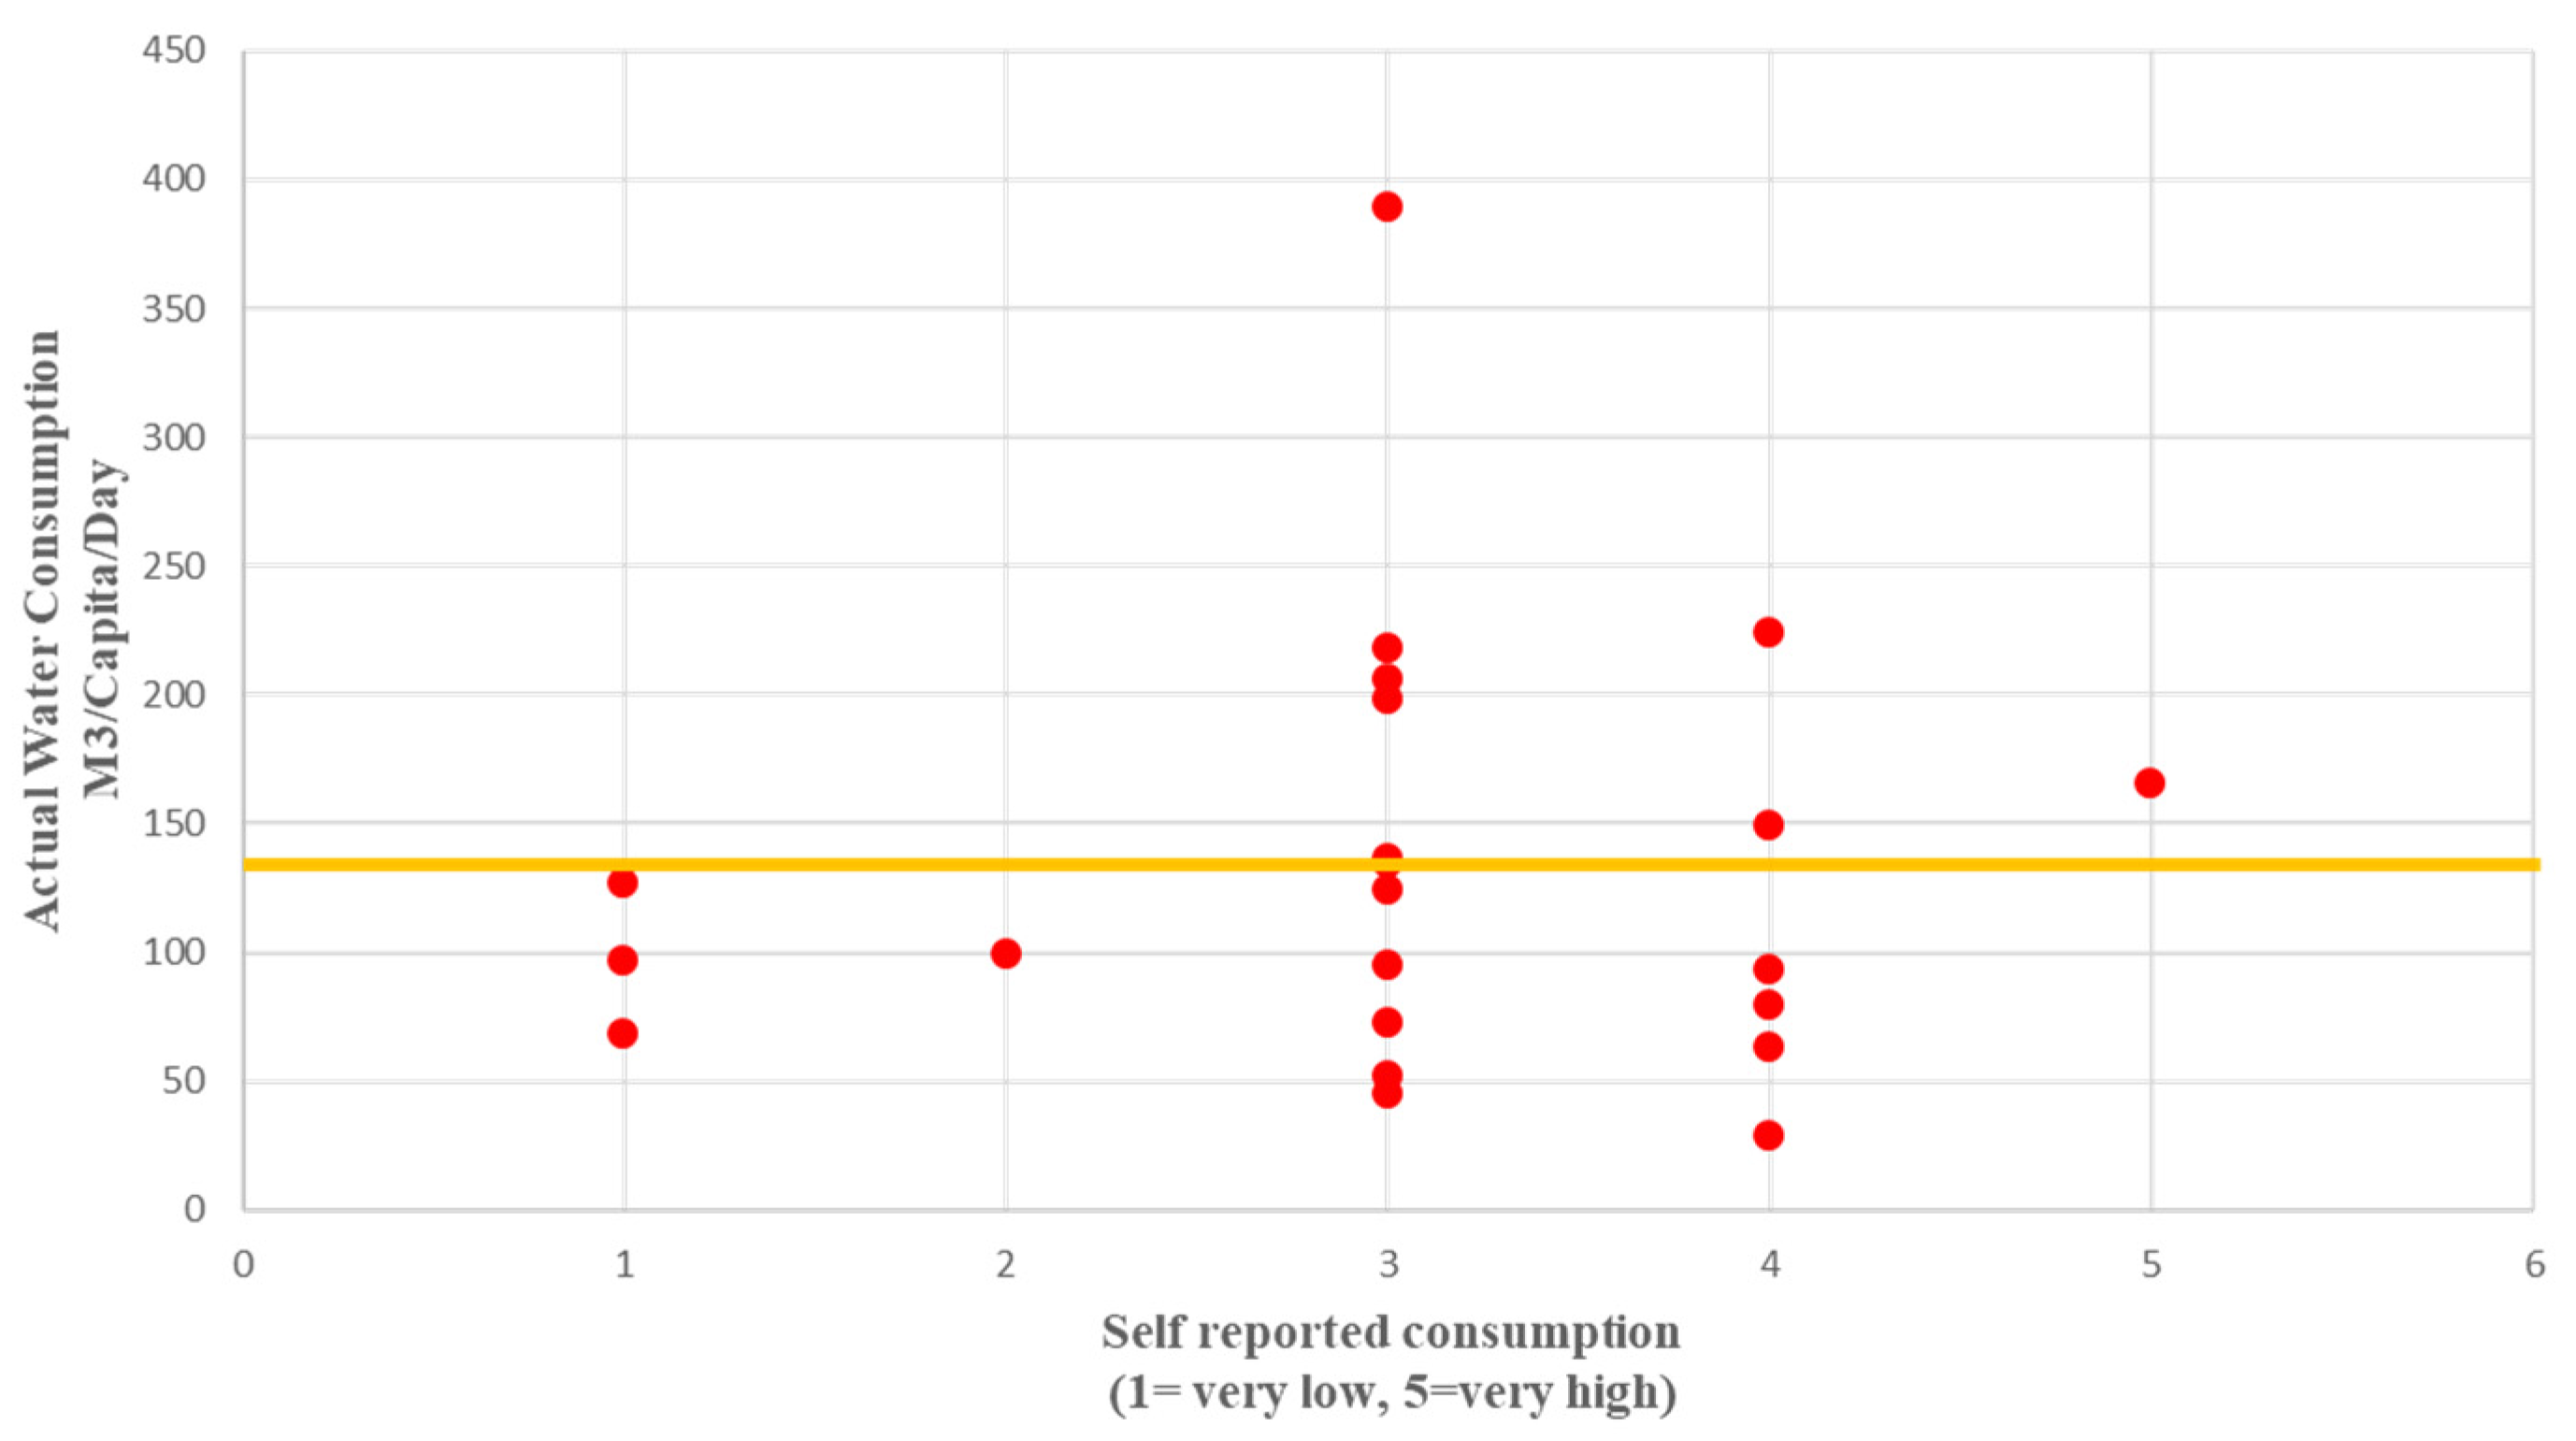
Comparing self-reported behavior to the actual water consumption made it possible to determine if households had a correct understanding of their own water consumption. Figure 3 compares the average daily actual water consumption per capita of each household (y-axis) to the self-reported water consumption (x-axis, five-point Likert scale of question 1 in Table 2) for each respondent who provided information on the number of people living in the household. The yellow line shows the average residential water consumption in Sweden as described in Section 3.3. As Figure 3 illustrates, there was a tendency for the majority of the respondents to consider themselves as average water consumers (value 3 on the x-axis), while their actual water consumption was either much higher or lower than the national average of 140 lit/capita/day. This is in agreement with Randolph and Troy [69], who suggested that most of the participants in their study were incorrect in estimating their own water consumption.
4.3. Questionnaire Survey
4.3.1. Attitude about Water Consumption
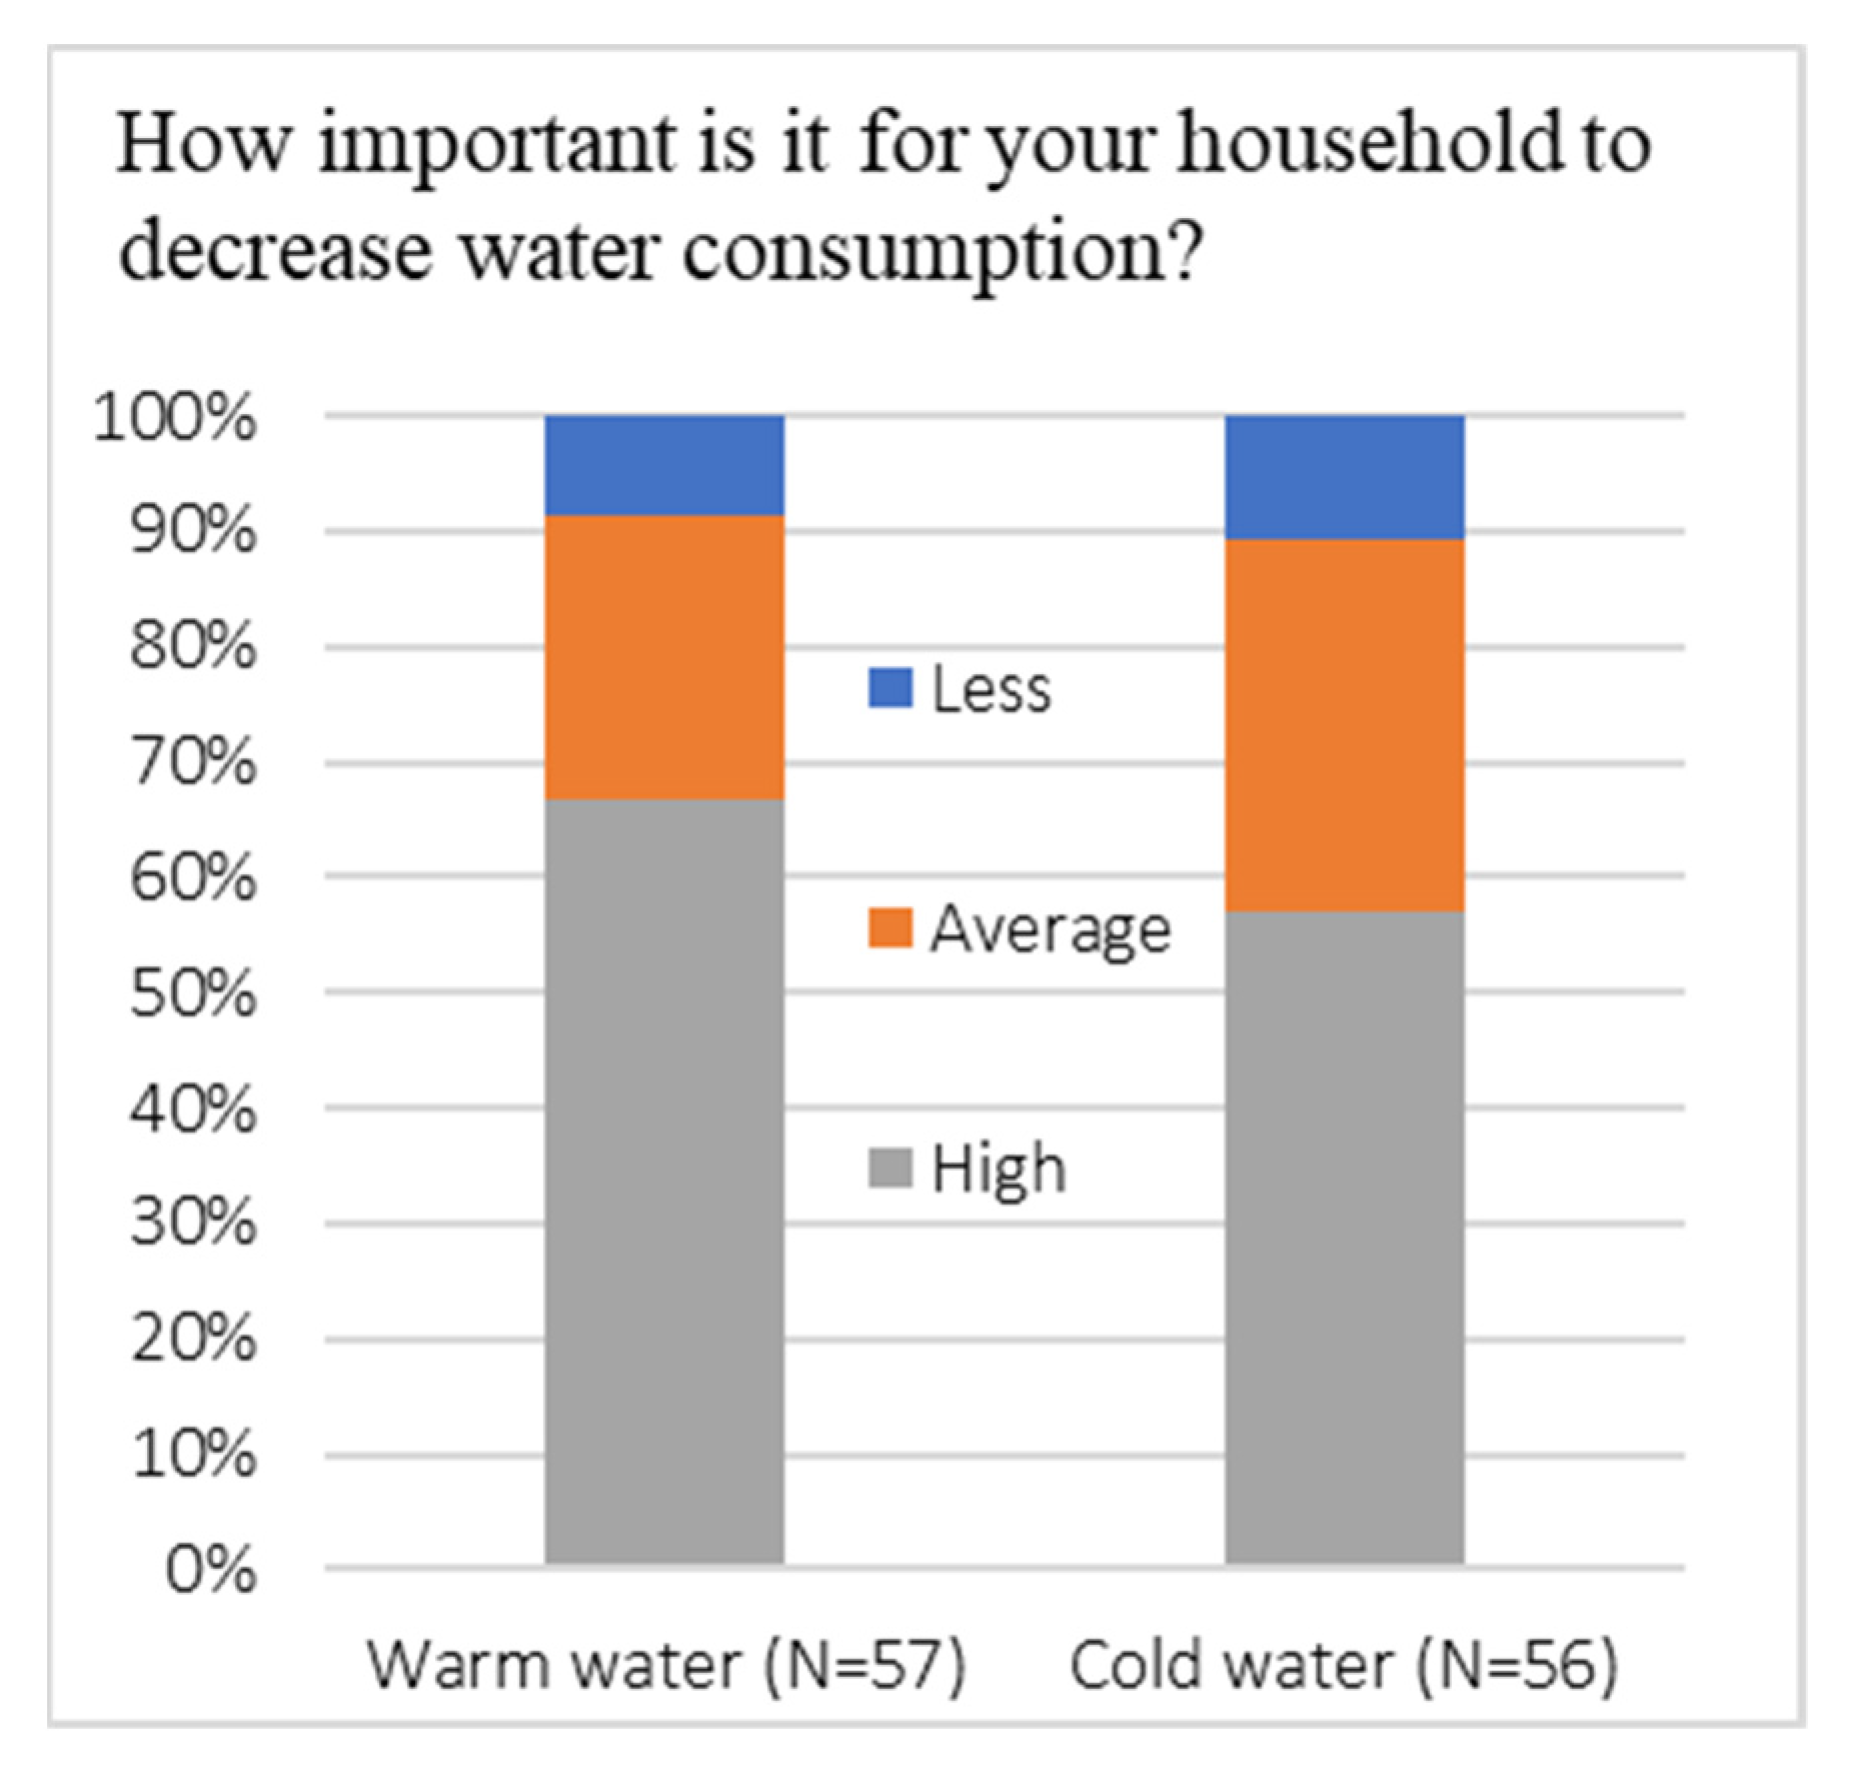
Figure 4 shows the distribution of responses to the question about how important it was for households to decrease water consumption. A large share of the respondents stated that water conservation was important to them.
4.3.2. Self-Reported Water-Saving Activities
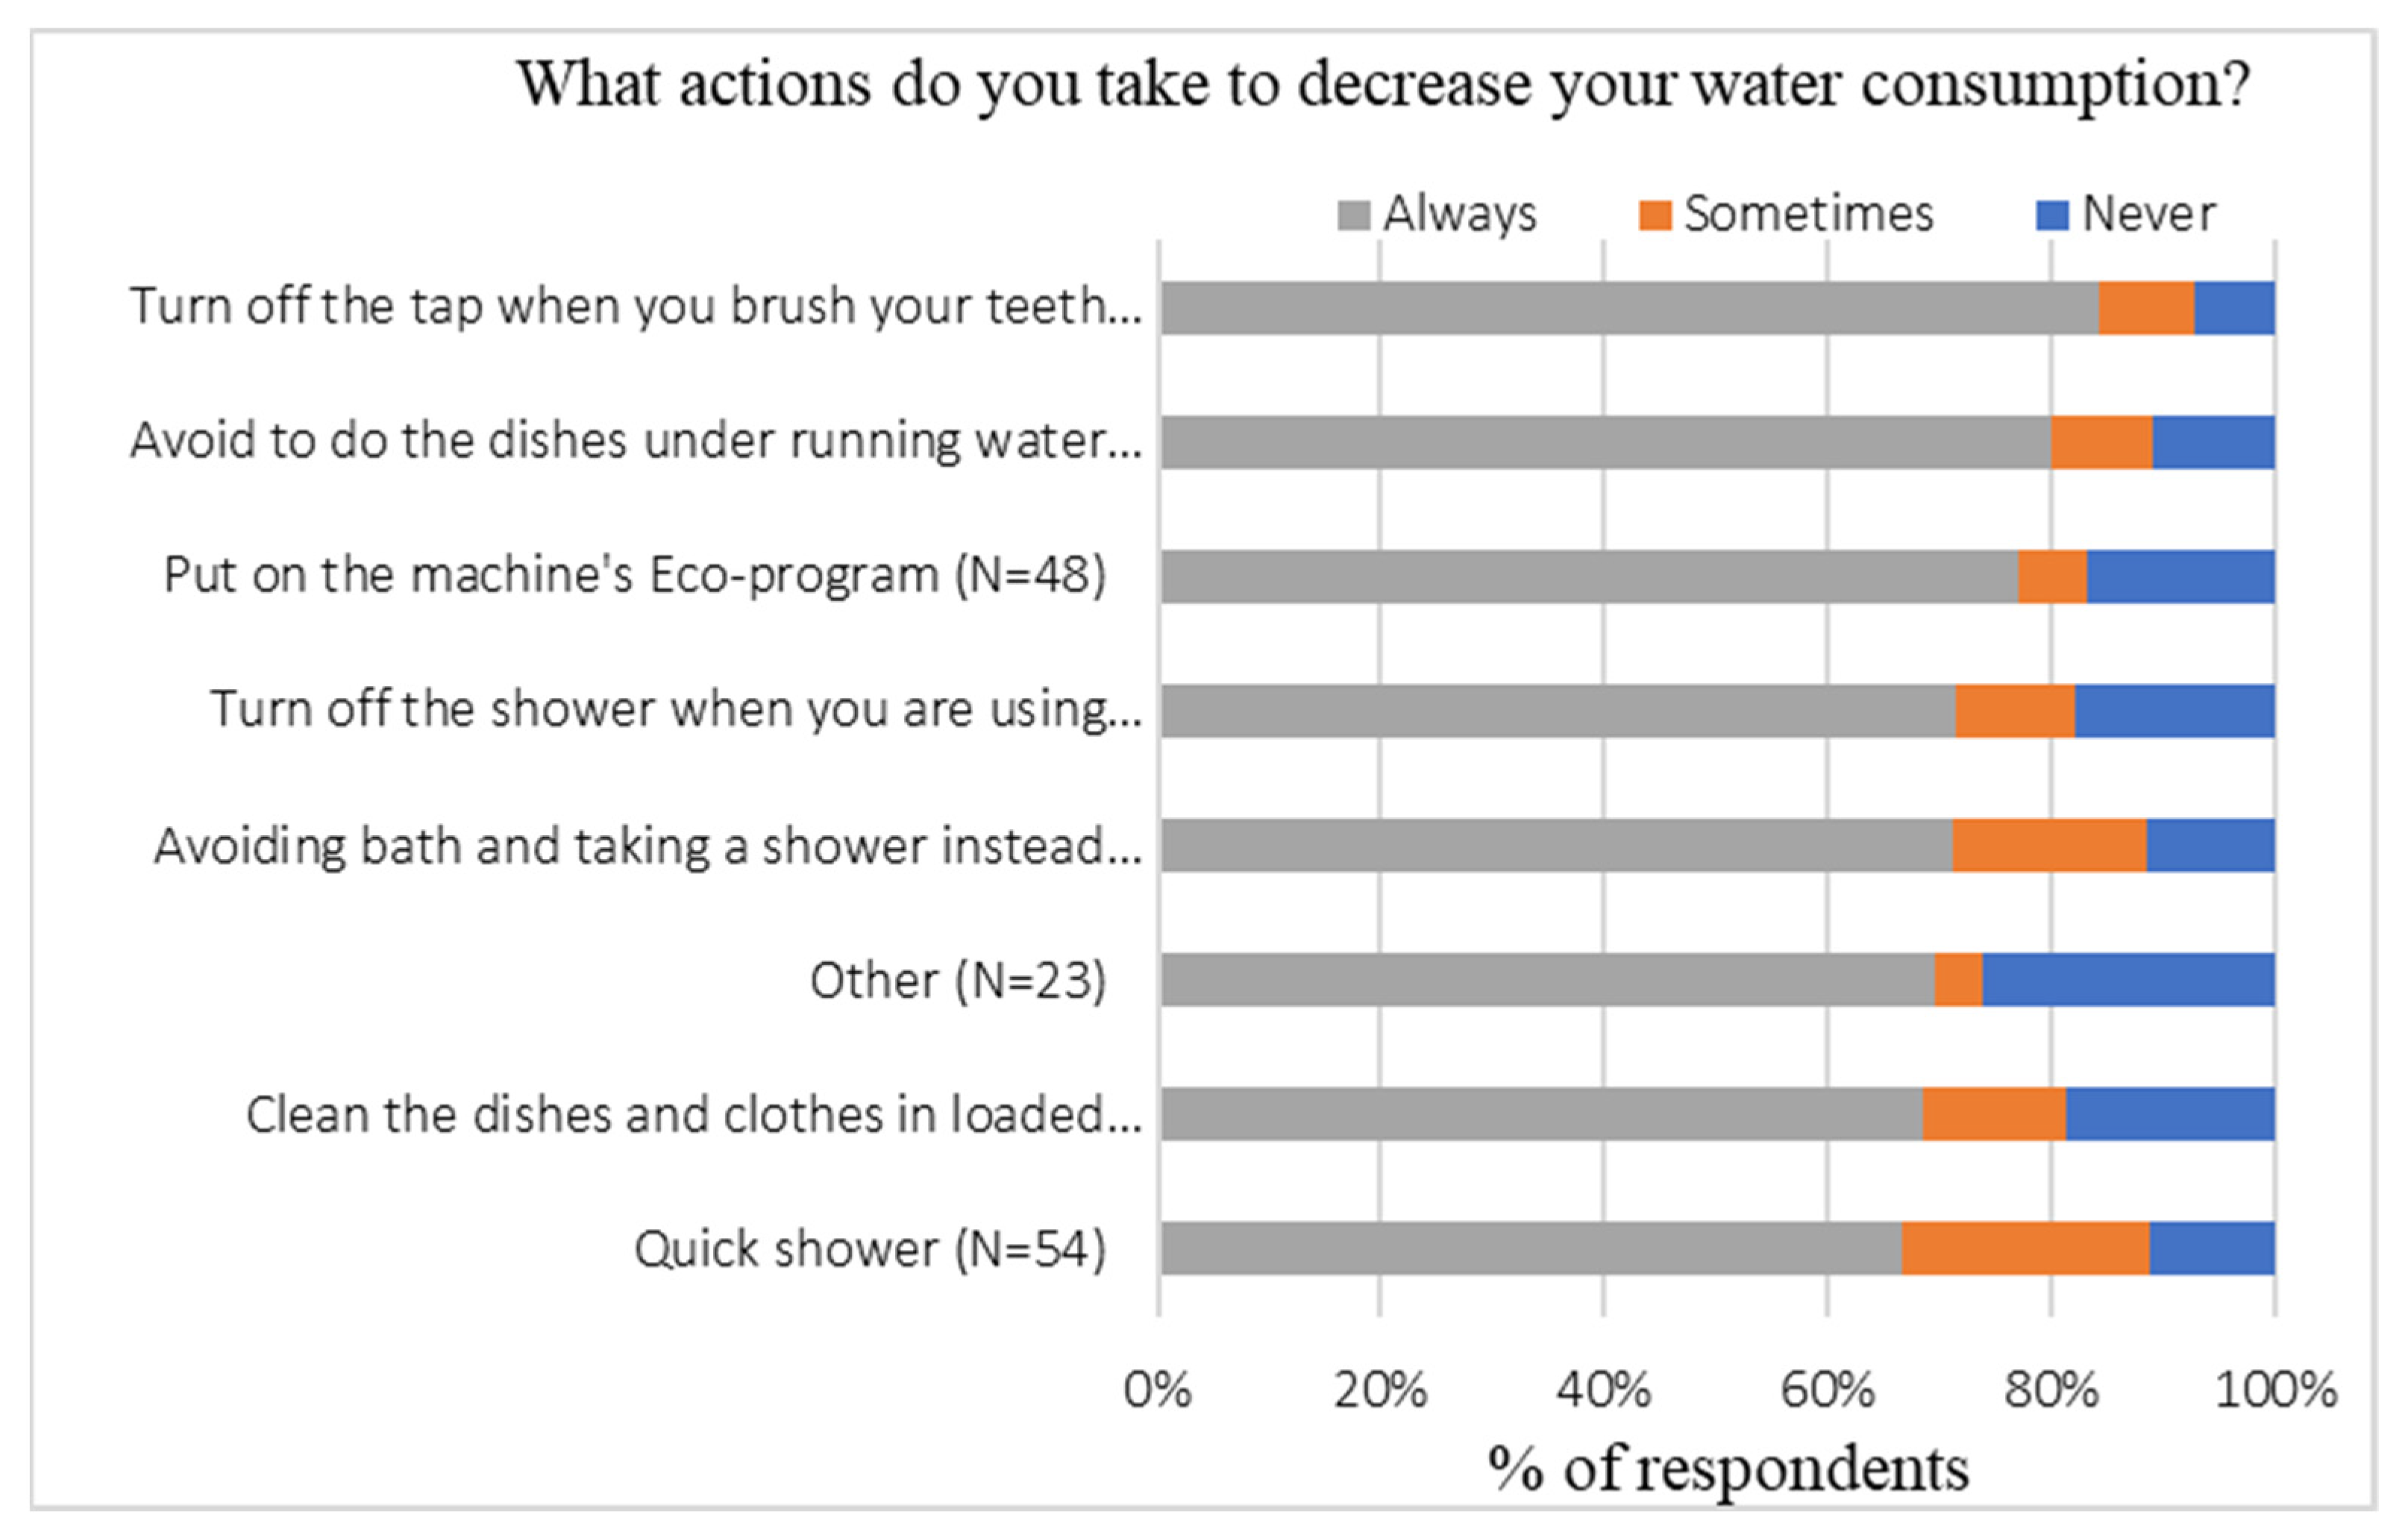
Most of the respondents stated that they take multiple actions to reduce water consumption (Figure 5), the most common being turning off the tap while brushing teeth (85% respondents) and avoiding doing dishes under running water (80% respondents). Almost 70% of respondents reported that they try to reduce water usage while taking showers (turning off the shower when they use shampoo/shower gel and taking a shower instead of bath).
4.3.3. Subjective Norm, Environmental Concern, and Individual Measurement and Debit
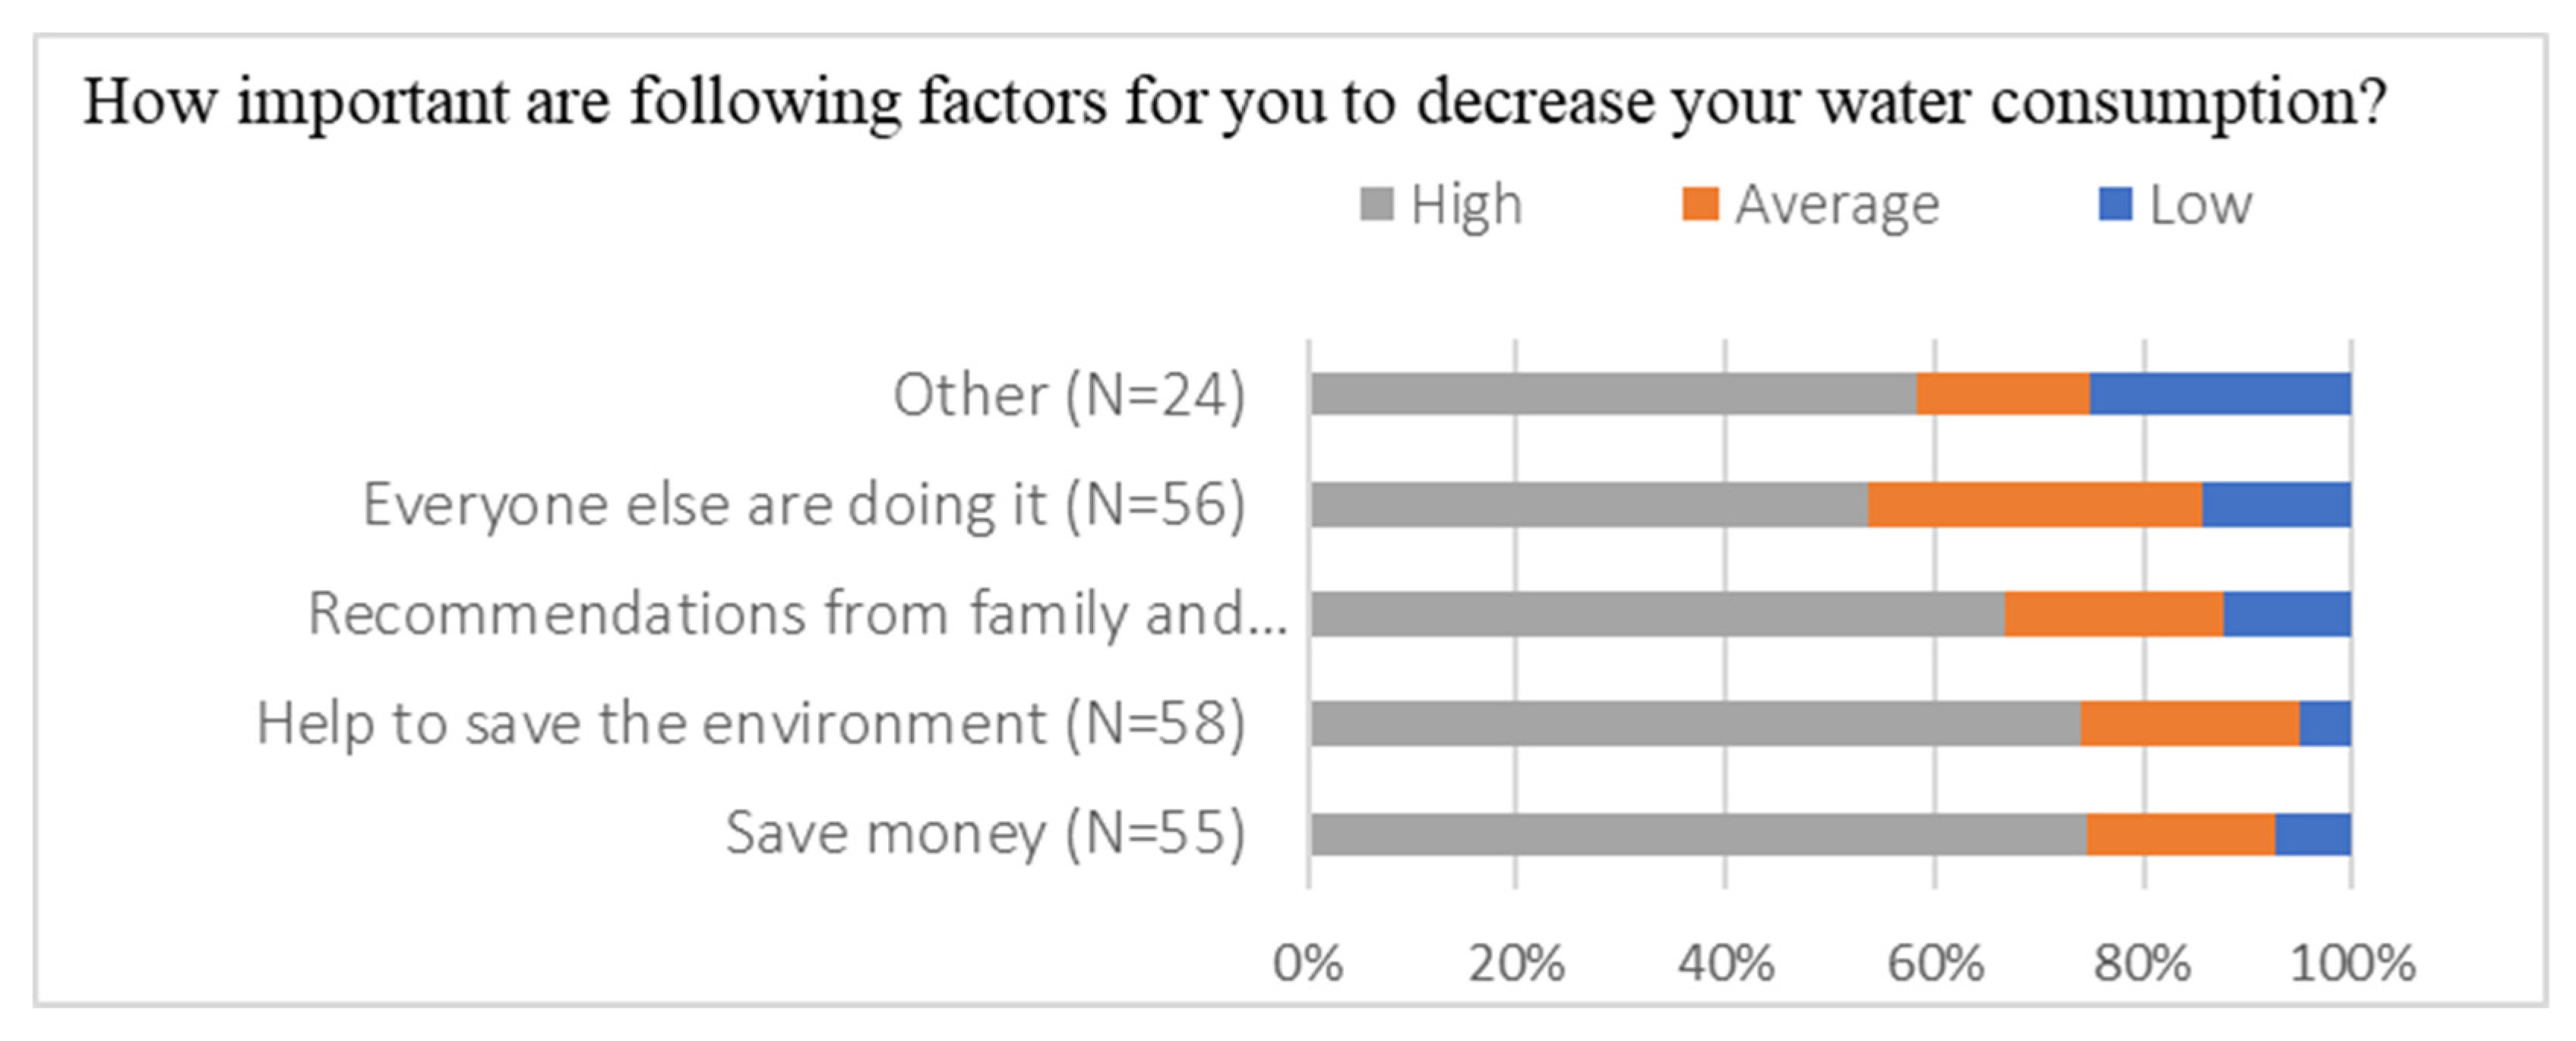
Figure 6 shows the levels of importance of different factors in influencing households to decrease their water consumption. Almost 75% indicated that helping to save the environment is an important determinant for them, which shows that they have a concern towards the environment problem and feel responsible. More than 65% pointed out that the recommendation from friends and family is an important factor, which shows that they experienced a subjective norm in favor of water consumption reduction. Almost 75% stated that saving money, which represents individual measurement and debit (IMD), is an important determinant in their water consumption behavior.
4.4. Structural Equation Modeling
As previously mentioned, a total of 41 apartments provided information on the number of people living in their household. The correlation between apartment area and the number of people living in each apartment was 0.663, a correlation that was significant at the 0.01 level. Thus, it was justified to carry out the analysis using water consumption per m2. In other words, the bigger the apartment, the more people were judged to live in it. This helped to increase the number of observations from 23 (consented to data collection and responded to the question about the number of people in the household) to 46 (consented to data collection). Figure 7 shows the results of path analysis on the sequential relationships between environmental concern, intermediary variables (i.e., attitude, subjective norm, water conservation activities, and IMD), and actual water consumption. The single-headed arrows show the direction of assumed causal influence and the numerical values next to the arrows are the standardized ”path coefficients” (PCs), i.e., regression coefficients. Indices such as χ2/df, CFI, TLI, IFI, and RMSEA were used to test the fitting situation of the overall model. According to Chin and Todd [70], the χ2/df value should be between 1 and 3; the CFI, IFI, and TLI should be greater than 0.9; and the RMSEA should be less than 0.08. The related model fit indices for the model proposed in this research were χ2/df = 1.41, CFI = 0.967, IFI = 0.971, TLI = 0.901, and RMSEA = 0.037. This shows that the fitting degree of this research model was acceptable.
Figure 7 presents the standardized PCs as well as the associated significance levels. The significance levels were used to determine whether or not the hypothetical relationship was supported by the data. Significance levels for seven out of eight paths were less than 0.05, which indicated that those hypothetical relationships were statistically supported. Only the path from subjective norm to actual water consumption was not statistically significant at the level of 0.05.
Environmental concern was found to significantly influence intermediary variables attitude, subjective norms, water conservation activities, and IMD. Similarly, attitude and water conservation activities significantly influenced actual water consumption, but the positive sign of the path coefficient (PC) indicated that a greater positive attitude and greater engagement with water conservation activities led to greater actual water consumption. This contradicts a number of existing studies. For instance, Oh, Lee, and Shin [71] observed that the relationship between attitude and water-saving behavior was significant and increased attitudes entailed decreased water consumption. Subjective norms were not found to significantly predict actual water consumption. This was in contrast with the results of Pino et al. [72], who concluded that subjective norms can affect farmers’ intentions to adopt water-saving measures with a marginal significant level. The PC for the path from IMD to actual water consumption was negative, which means that an increase in IMD (i.e., increased importance given to saving money) entailed a decrease in actual water consumption.
As Figure 7 shows, there were four indirect paths from environmental concern to actual water consumption. The indirect effect of each path was calculated as the products of the corresponding direct paths and the results were summed up to obtain the indirect effect of environmental concern on actual water consumption (0.26). The total effect of each variable was the sum of direct and indirect effects. As Figure 7 shows, there was no direct effect between environmental concern and actual water consumption. Thus, the total effect of environmental concern on actual water consumption was the same as its indirect effect (0.26).
Figure 7 also indicates that there no indirect effect between four of the constructs (i.e., attitude, subjective norm, water conservation activities, and individual measurement and debit) and actual water consumption. Therefore, their total effects were the same as their direct effects. Based on this, water conservation activities and attitude had the highest total effects on actual water consumption.
5. Discussion and Conclusions
The present study examined the actual water consumption in multifamily households in Växjö, Sweden, by employing the extended TRA framework developed by Untaru et al. [33]. While their framework used “behavioral intention” as the dependent variable, this paper added an extra parameter to the model, i.e., IMD, and applied the theoretical framework to examine the “actual” water consumption behavior of the respondents. The results of this study showed that the respondents gave a high level of importance to water conservation, which indicates their altruistic and biospheric value orientations.
The results showed that environmental concern significantly influenced attitude, subjective norm, water conservation activities, and IMD. This means that increased environmental concern leads to increased attitude, subjective norms, water conservation activities, and IMD. As for the actual water consumption, attitude and water conservation activities were found to be negatively influential, i.e., increasing attitude and self-reported water conservation activities increased actual water consumption. This is in agreement with previous studies that concluded that higher attitudes do not always translate into environmentally friendly behaviors [73]. An increase in IMD (i.e., increased importance given to saving money) was found to decrease the actual water consumption. This suggests that price-based methods and tips help reduce water consumption. Although around 65% of respondents reported subjective norms in favor of water consumption reduction, there was not a significant casual relation between subjective norms and actual water consumption. Water conservation is about connecting action to impact. Therefore, efforts to make clear that a behavior will have a direct impact on reducing household water use or more broadly help conserve water resources (protecting habitat, etc.) are needed.
The respondents showed a lack of awareness about their actual water consumption, but they showed positive attitudes and were interested in water-saving actions. However, ethnic origin and socioeconomic background may have impacted individuals’ attitudes and subjective norms, and hence water-saving actions in multicultural urban areas might differ from the (Swedish) norm. This might be the reason why the respondents considered themselves to have an average level of water consumption, when in reality they used a higher amount of water per household. The number of occupants in an apartment in the studied area (3.5 persons per household) was higher than the national average (1.9 persons per household) and, therefore, the average water consumption per household was higher. The average water consumption per capita in the surveyed area was lower than that of the average standard Swedish population. In essence, a number of households in the studied area were successful in saving water while a number of other households had high water consumption per capita compared to the national average value.
It can be argued that since we studied a particular multicultural area and compared their actual water consumption to the average Swedish household consumption, the cultures, norms, beliefs, and values of such multicultural urban areas might have impacted the respondents’ water consumption. Hence, water management systems should focus on measures that can help households convert positive attitudes and subjective norms into environmentally friendly behaviors. In other words, households do not need to be educated on the importance of water conservation; rather, they have to be given tips, methods, and tools to enable them to actually manage their water consumption.
Water management programs could provide feedback on consumption in order to help households monitor the impact of their water conservation activities and direct them to more effectively use water. Consideration should also be given to language constraints in the multicultural areas; otherwise, relevant information and resources may not be effectively disseminated to non-Swedish speaking communities and they may feel excluded from environmental communications and discussions.
Limitations and Future Research
Although we tried to provide robust and reliable results, the research had some limitations that might have influenced the results. First, due to the nature of the studied multicultural urban area, it was challenging to reach tenants and collect data. Although para-professional aids were hired to facilitate the process, a limited number of tenants responded to the survey and almost none responded to all questions. Second, only a small portion of the tenants in the studied area gave consent for the gathering of their actual water consumption data. Third, fewer observations meant that it was not possible to compare and contrast the water use behavior of different categories of respondents, e.g., of different ethnic origins. Future research could be replicated to other multicultural urban areas and be enriched by including more observations and socioeconomic variables, such as number of occupants per apartment and household income.
Author Contributions
Conceptualization, A.D. and K.M.; methodology, A.D. and K.M.; software, A.D.; formal analysis, A.D.; investigation, A.D. and K.M.; resources, K.M.; data curation, A.D.; writing—original draft preparation, A.D.; writing—review and editing, K.M. and J.F.; supervision, K.M.; funding acquisition, K.M. All authors have read and agreed to the published version of the manuscript.
Funding
This research was funded by the Viable Cities program of the Swedish Energy Agency, grant number 48776-1 and EC Support from the European Union’s Seventh Framework Programme for research, technological development and demonstration, grant number ENER/FP7/609127/READY. The APC was funded by Linnaeus University.
Institutional Review Board Statement
Not applicable.
Informed Consent Statement
Respondents of the survey gave their informed consent for inclusion before they participated in the study.
Data Availability Statement
The data are not publicly available due to privacy and ethical restrictions.
Acknowledgments
The authors would like to acknowledge funding organizations for supporting this research. This research work was partly financed by the Viable Cities program of the Swedish Energy Agency (project number 48776-1) and EC Support from the European Union’s Seventh Framework Programme for research, technological development and demonstration under grant agreement no. ENER/FP7/609127/READY.
Conflicts of Interest
The authors declare no conflict of interest.
References
- Smalley, R.E. Future Global Energy Prosperity: The Terawatt Challenge. MRS Bull. 2005, 30, 412–417. [Google Scholar] [CrossRef] [Green Version]
- Sanchez, M.J.; Lafuente, R. Defining and Measuring Environmental Consciousness; Spanish National Research Council: Madrid, Spain, 2010. [Google Scholar]
- Dawadi, S.; Ahmad, S. Evaluating the impact of demand-side management on water resources under changing climatic conditions and increasing population. J. Environ. Manag. 2013, 114, 261–275. [Google Scholar] [CrossRef] [PubMed]
- Arnell, N.W. Climate Change and Water Resources in Britain. Clim. Chang. 1998, 39, 83–110. [Google Scholar] [CrossRef]
- USCB. Historical Estimates of World Population. 2018. Available online: https://www.census.gov/data/tables/time-series/demo/international-programs/historical-est-worldpop.html (accessed on 21 September 2020).
- USCB. U.S. and World Population Clock. 2020. Available online: https://www.census.gov/popclock/world?intcmp=w_200x402 (accessed on 21 September 2020).
- UN. Department of Economic and Social Affairs Population Dynamics. 2019. Available online: https://population.un.org/wpp/Graphs/Probabilistic/POP/TOT/900 (accessed on 5 January 2021).
- Wada, Y.; Flörke, M.; Hanasaki, N.; Eisner, S.; Fischer, G.; Tramberend, S.; Satoh, Y.; van Vliet, M.T.H.; Yillia, P.; Ringler, C.; et al. Modeling global water use for the 21st century: The Water Futures and Solutions (WFaS) initiative and its approaches. Geosci. Model Dev. 2016, 9, 175–222. [Google Scholar] [CrossRef] [Green Version]
- Krutilla, J.V. Conservation reconsidered. Am. Econ. Rev. 1967, 57, 777–786. [Google Scholar]
- Postel, S. Conserving Water: The Untapped Alternative; Worldwatch Paper 67; ERIC: Washington, DC, USA, 1985. [Google Scholar]
- EEA. Water Resources across Europe—Confronting Water Scarcity and Drought; European Environment Agency: Copenhagen, Denmark, 2009. [Google Scholar]
- SCB. De Flesta har nu Kommunalt Vatten Och Avlopp. 2016. Available online: https://www.scb.se/hitta-statistik/statistik-efter-amne/miljo/vattenanvandning/vattenuttag-och-vattenanvandning-i-sverige/pong/statistiknyhet/vattenuttag-och-vattenanvandning-i-sverige/ (accessed on 27 April 2021).
- Barré, S. Dricksvattenfakta. 2018. Available online: https://www.svensktvatten.se/fakta-om-vatten/ (accessed on 25 April 2021).
- SCB. Water Withdrawal and Water Use in SWEDEN. 2020. Available online: http://www.scb.se/mi0902-en (accessed on 10 February 2021).
- Mahmoudi, N. Hushållens Vattenanvändning i Göteborg: Statistisk Studie Utifrån Utomhustemperatur, Byggår och Socioekonomisk Påverkan; Sveriges lantbruksuniversitet: Uppsala, Sweden, 2017. [Google Scholar]
- Lehman, P.K.; Geller, E.S. Behavior Analysis and Environmental Protection: Accomplishments and Potential for More. Behav. Soc. Issues 2004, 13, 13–33. [Google Scholar] [CrossRef]
- OECD. Household Behaviour and the Environment: Reviewing the Evidence; Organisation for Economic Co-Operation and Development: Paris, France, 2008. [Google Scholar]
- Elizondo, G.; Lofthouse, V. Patterns of con-servation and domestic water use in different cultures: A comparison between Mexico and the UK. In Proceedings of the 16th Annual International Sustainable Development Research Conference, Hong Kong, China, 30 May–1 June 2010; Kadoori Institute, The University of Hong Kong: Pok Fu Lam, Hong Kong. [Google Scholar]
- Yan, L.; McManus, P.; Duncan, E. Understanding ethnic differences in perceptions, attitudes, and behaviours: A study of domestic water use in Sydney. Geogr. Res. 2018, 56, 54–67. [Google Scholar] [CrossRef]
- Gibson, C.; Head, L.; Gill, N.; Waitt, G. Climate change and household dynamics: Beyond consumption, unbounding sustainability. Trans. Inst. Br. Geogr. 2011, 36, 3–8. [Google Scholar] [CrossRef]
- Medd, W.; Shove, E. Traces of Water Workshop Report 2: Water Practices and Everyday Life. In Workshop Report from the 2nd Workshop of the UKWIR Funded Series Traces of Water; Lancaster University: Lancaster, UK, 2005. [Google Scholar]
- Smith, A.; Ali, M. Understanding the impact of cultural and religious water use. Water Environ. J. 2006, 20, 203–209. [Google Scholar] [CrossRef]
- Benhabib, S. The Claims of Culture: Equality and Diversity in the Global Era; Princeton University Press: Princeton, NJ, USA, 2002. [Google Scholar]
- Medd, W.; Watson, M.; Hopkins, P.E.; Olson, E. Cultural Diversity and Sustainable Water Management in Greater London: The Research Agenda; Greater London Authority: London, UK, 2007. [Google Scholar]
- Shove, E. Comfort, Cleanliness and Convenience: The Social Organization of Normality; Lancaster University: Lancaster, UK, 2003. [Google Scholar]
- Allon, F.; Sofoulis, Z. Everyday Water: Cultures in transition. Aust. Geogr. 2006, 37, 45–55. [Google Scholar] [CrossRef]
- Allon, F. Big Water, Little Water and the ‘One-Size-Fits-All’Model of Demand Management’ Unpublished Paper Presented at the Everyday Water Seminar; Department of Gender Studies, University of Sydney: Sydney, Australia, 2004. [Google Scholar]
- Macnaghten, P.; Urry, J. Contested Natures; Sage: Thousand Oaks, CA, USA, 1998. [Google Scholar]
- Corral-Verdugo, V.; Bechtel, R.B.; Fraijo-Sing, B. Environmental beliefs and water conservation: An empirical study. J. Environ. Psychol. 2003, 23, 247–257. [Google Scholar] [CrossRef]
- Lam, S.-P. Predicting Intention to Save Water: Theory of Planned Behavior, Response Efficacy, Vulnerability, and Perceived Efficiency of Alternative Solutions. J. Appl. Soc. Psychol. 2006, 36, 2803–2824. [Google Scholar] [CrossRef]
- Hassell, T.; Cary, J. Promoting Behavioural Change in Household Water Consumption: Literature Review; Report prepared for Smart Water Fund; URS: Heatherton, Australia, 2007. [Google Scholar]
- Fishbein, M.; Ajzen, A. Understanding Attitudes and Predicting Social Behaviour; Preventive-Hall. Inc.: Englewood Cliffs, NJ, USA, 1980. [Google Scholar]
- Untaru, E.-N.; Ispas, A.; Candrea, A.N.; Luca, M.; Epuran, G. Predictors of individuals’ intention to conserve water in a lodging context: The application of an extended Theory of Reasoned Action. Int. J. Hosp. Manag. 2016, 59, 50–59. [Google Scholar] [CrossRef]
- Ajzen, I. The theory of planned behaviour. Organ. Behav. Hum. Decis. Process. 1991, 50, 179–211. [Google Scholar] [CrossRef]
- Baker, E.W.; Al-Gahtani, S.S.; Hubona, G.S. The Effects of Gender and Age on New Technology Implementation in a Developing Country. Inf. Technol. People 2007, 20, 352–375. [Google Scholar] [CrossRef]
- Cheng, S.; Lam, T.; Hsu, C. Negative Word-of-Mouth Communication Intention: An Application of the Theory of Planned Behavior. J. Hosp. Tour. Res. 2006, 30, 95–116. [Google Scholar] [CrossRef]
- Taylor, S.; Todd, P. Understanding Household Garbage Reduction Behavior: A Test of an Integrated Model. J. Public Policy Mark. 1995, 14, 192–204. [Google Scholar] [CrossRef]
- Han, H.; Hsu, L.-T.; Sheu, C. Application of the Theory of Planned Behavior to green hotel choice: Testing the effect of environmental friendly activities. Tour. Manag. 2010, 31, 325–334. [Google Scholar] [CrossRef]
- Lili, D.; Ying, Y.; Qiuhui, H.; Mengxi, L. Residents’ acceptance of using desalinated water in China based on the theory of planned behaviour (TPB). Mar. Policy 2021, 123, 104293. [Google Scholar] [CrossRef]
- Dolnicar, S.; Hurlimann, A.; Grün, B. Water conservation behavior in Australia. J. Environ. Manag. 2012, 105, 44–52. [Google Scholar] [CrossRef] [Green Version]
- Jorgensen, B.S.; Martin, J.F.; Pearce, M.; Willis, E. Some difficulties and inconsistencies when using habit strength and reasoned action variables in models of metered household water conservation. J. Environ. Manag. 2013, 115, 124–135. [Google Scholar] [CrossRef]
- Marandu, E.E.; Moeti, N.; Joseph, H. Predicting Residential Water Conservation Using the Theory of Reasoned Action. J. Commun. 2010, 1, 87–100. [Google Scholar] [CrossRef]
- Shahangian, S.A.; Tabesh, M.; Yazdanpanah, M. How can socio-psychological factors be related to water-efficiency intention and behaviors among Iranian residential water consumers? J. Environ. Manag. 2021, 288, 112466. [Google Scholar] [CrossRef]
- Hansla, A.; Gamble, A.; Juliusson, A.; Gärling, T. The relationships between awareness of consequences, environmental concern, and value orientations. J. Environ. Psychol. 2008, 28, 1–9. [Google Scholar] [CrossRef]
- Nooney, J.G. Environmental worldview and behavior: Consequences of dimensionality in a survey of North Carolinians. Environ. Behav. 2003, 35, 763–783. [Google Scholar] [CrossRef]
- Urban, J.; Ščasný, M. Exploring domestic energy-saving: The role of environmental concern and background variables. Energy Policy 2012, 47, 69–80. [Google Scholar] [CrossRef]
- Wolters, E.A. Attitude–behavior consistency in household water consumption. Soc. Sci. J. 2014, 51, 455–463. [Google Scholar] [CrossRef]
- Abdul-Muhmin, A.G. Explaining consumers? willingness to be environmentally friendly. Int. J. Consum. Stud. 2007, 31, 237–247. [Google Scholar] [CrossRef]
- Bamberg, S. How does environmental concern influence specific environmentally related behaviors? A new answer to an old question. J. Environ. Psychol. 2003, 23, 21–32. [Google Scholar] [CrossRef]
- Schultz, P.W.; Gouveia, V.V.; Cameron, L.D.; Tankha, G.; Schmuck, P.; Franěk, M. Values and their Relationship to Environmental Concern and Conservation Behavior. J. Cross-Cultural Psychol. 2005, 36, 457–475. [Google Scholar] [CrossRef]
- Carrus, G.; Bonaiuto, M.; Bonnes, M. Environmental Concern, Regional Identity, and Support for Protected Areas in Italy. Environ. Behav. 2005, 37, 237–257. [Google Scholar] [CrossRef]
- De Groot, J.; Steg, L. General Beliefs and the Theory of Planned Behavior: The Role of Environmental Concerns in the TPB. J. Appl. Soc. Psychol. 2007, 37, 1817–1836. [Google Scholar] [CrossRef] [Green Version]
- Hartmann, P.; Ibañez, V.A. Consumer attitude and purchase intention toward green energy brands: The roles of psychological benefits and environmental concern. J. Bus. Res. 2012, 65, 1254–1263. [Google Scholar] [CrossRef]
- Newton, J.D.; Tsarenko, Y.; Ferraro, C.; Sands, S. Environmental concern and environmental purchase intentions: The mediating role of learning strategy. J. Bus. Res. 2015, 68, 1974–1981. [Google Scholar] [CrossRef]
- Chen, M.-F.; Tung, P.-J. Developing an extended Theory of Planned Behavior model to predict consumers’ intention to visit green hotels. Int. J. Hosp. Manag. 2014, 36, 221–230. [Google Scholar] [CrossRef]
- Atkins, W. Conservation, Water. Water: Science and Issues; Encyclopedia: New York, NY, USA, 2003. [Google Scholar]
- Gregory, G.D.; Leo, M.D. Repeated behavior and environmental psychology: The role of personal involvement and habit formation in explaining water consumption 1. J. Appl. Soc. Psychol. 2003, 33, 1261–1296. [Google Scholar] [CrossRef]
- Han, H.; Hwang, J.; Kim, J.; Jung, H. Guests’ pro-environmental decision-making process: Broadening the norm activation framework in a lodging context. Int. J. Hosp. Manag. 2015, 47, 96–107. [Google Scholar] [CrossRef]
- Lindenberg, S.; Steg, L. Normative, Gain and Hedonic Goal Frames Guiding Environmental Behavior. J. Soc. Issues 2007, 63, 117–137. [Google Scholar] [CrossRef] [Green Version]
- Boverket. Individuell Mätning Och Debitering av Uppvärmning och Tappvarmvatten. 2020. Available online: https://www.boverket.se/sv/byggande/bygg-och-renovera-energieffektivt/IMD/ (accessed on 12 April 2021).
- Infometric. Individuell Mätning och Debitering (IMD). 2021. Available online: https://infometric.se/fastighetsbolag/inviduell-matning-och-debitering/ (accessed on 5 April 2021).
- Arbués, F.; García-Valiñas, M.; Martinez-Espiñeira, R. Estimation of residential water demand: A state-of-the-art review. J. Socio-Econ. 2003, 32, 81–102. [Google Scholar] [CrossRef]
- Hoffmann, M.; Worthington, A.; Higgs, H. Urban water demand with fixed volumetric charging in a large municipality: The case of Brisbane, Australia. Aust. J. Agric. Resour. Econ. 2006, 50, 347–359. [Google Scholar] [CrossRef]
- Renwick, M.E.; Green, R.D. Do Residential Water Demand Side Management Policies Measure Up? An Analysis of Eight California Water Agencies. J. Environ. Econ. Manag. 2000, 40, 37–55. [Google Scholar] [CrossRef] [Green Version]
- Dalhuisen, J.M.; Florax, R.J.G.M.; de Groot, H.L.; Nijkamp, P. Price and Income Elasticities of Residential Water Demand: A Meta-Analysis. Land Econ. 2003, 79, 292–308. [Google Scholar] [CrossRef]
- Rogers, E.M. Diffusion of Innovations; Simon and Schuster: New York, NY, USA, 2010. [Google Scholar]
- Amedeo, D.; Golledge, R.G.; Stimson, R.J. Person-Environment-Behavior Research: Investigating Activities and Experiences in Spaces and Environments; Guilford Press: New York, NY, USA, 2008. [Google Scholar]
- Jöreskog, K.G.; Sörbom, D. LISREL 7: A Guide to the Program and Applications; Spss: Chicago, IL, USA, 1989. [Google Scholar]
- Randolph, B.; Troy, P. Attitudes to conservation and water consumption. Environ. Sci. Policy 2008, 11, 441–455. [Google Scholar] [CrossRef]
- Chin, W.W.; Todd, P.A. On the use, usefulness, and ease of use of structural equation modeling in MIS research: A note of caution. MIS Q. 1995, 19, 237–246. [Google Scholar] [CrossRef]
- Oh, E.; Lee, J.; Shin, M.M. Determinants of Household Water Conservation: The Role of Consumers’ Water Value Perception and Reasoned Action. J. Korean Soc. Qual. Manag. 2021, 49, 171–181. [Google Scholar]
- Pino, G.; Toma, P.; Rizzo, C.; Miglietta, P.P.; Peluso, A.M.; Guido, G. Determinants of Farmers’ Intention to Adopt Water Saving Measures: Evidence from Italy. Sustainability 2017, 9, 77. [Google Scholar] [CrossRef] [Green Version]
- Juvan, E.; Dolnicar, S. The attitude–behaviour gap in sustainable tourism. Ann. Tour. Res. 2014, 48, 76–95. [Google Scholar] [CrossRef]
Figure 1.
Applied conceptual model (adapted from Untaru et al. [33]).
Figure 1.
Applied conceptual model (adapted from Untaru et al. [33]).

Figure 2.
Distribution of monthly (12 months) water consumption for 23 apartments, the average of the 46 households that consented to water data collection, and the average of all 313 apartments in Alabastern.
Figure 2.
Distribution of monthly (12 months) water consumption for 23 apartments, the average of the 46 households that consented to water data collection, and the average of all 313 apartments in Alabastern.

Figure 3.
Comparison of self-reported to actual water consumption for each studied household.

Figure 4.
Attitudes about water consumption.

Figure 5.
Water-saving activities.

Figure 6.
Important factors influencing respondents to decrease their water consumption.

Figure 7.
Path analysis results. PC = path coefficient, P = level of significance.


Table 1.
Description of the socio-demographic characteristics of respondents.
| Variable | Alabastern (Gender and National Origin, n = 54; Years Living in Sweden, n = 34) | Araby (Neighborhood Where Alabastern is Located) | |
|---|---|---|---|
| Gender | Man | 52% | 51% |
| Woman | 46% | 49% | |
| Other | 2% | Not available | |
| National origin | Swedish | 37% | 45% |
| Somalia | 17% | 15% | |
| Middle East (Iraq, Syria, Yemen) | 33% | 30% (Iraq and Syria) | |
| Others | 13% | 10% | |
| Years living in Sweden | 1–5 year | 12% | Not available |
| 5–10 year | 18% | Not available | |
| >10 year | 71% | Not available | |
Table 2.
List of questions included in the questionnaire.
| 1. What is your opinion about your water consumption in the household? | Very high | Very low | ||||
| 1 | 2 | 3 | 4 | 5 | ||
| a) The quantity | ☐ | ☐ | ☐ | ☐ | ☐ | |
| b) Cost | ☐ | ☐ | ☐ | ☐ | ☐ | |
| 2. How important is it for your household to decrease your water consumption? | Not important | Very important | ||||
| 1 | 2 | 3 | 4 | 5 | ||
| a) Warm water | ☐ | ☐ | ☐ | ☐ | ☐ | |
| b) Cold water | ☐ | ☐ | ☐ | ☐ | ☐ | |
| 3. What actions do you take to decrease your water consumption? | Never | Always | Don’t know | |||
| a) Turn off the tap when you brush your teeth | 1 | 2 | 3 | 4 | 5 | 6 |
| b) Turn off the shower when you are using shampoo/shower gel | ☐ | ☐ | ☐ | ☐ | ☐ | ☐ |
| c) Showering fast | ☐ | ☐ | ☐ | ☐ | ☐ | ☐ |
| d) Avoiding bath and taking a shower instead | ☐ | ☐ | ☐ | ☐ | ☐ | ☐ |
| e) Avoiding to do the dishes under purling water | ☐ | ☐ | ☐ | ☐ | ☐ | ☐ |
| f) Clean the dishes and clothes in loaded machines | ☐ | ☐ | ☐ | ☐ | ☐ | ☐ |
| g) Put on the machine’s Eco-program | ☐ | ☐ | ☐ | ☐ | ☐ | ☐ |
| h) Other | ☐ | ☐ | ☐ | ☐ | ☐ | ☐ |
| 4. How important are the following factors for you to deacrease your water and energy consumption? | Not important | Very important | ||||
| 1 | 2 | 3 | 4 | 5 | ||
| a) Save money | ☐ | ☐ | ☐ | ☐ | ☐ | |
| b) Help to save the environment | ☐ | ☐ | ☐ | ☐ | ☐ | |
| c) Recommendations from family and friends | ☐ | ☐ | ☐ | ☐ | ☐ | |
| d) Everyone else are doing it | ☐ | ☐ | ☐ | ☐ | ☐ |
Publisher’s Note: MDPI stays neutral with regard to jurisdictional claims in published maps and institutional affiliations. |
© 2021 by the authors. Licensee MDPI, Basel, Switzerland. This article is an open access article distributed under the terms and conditions of the Creative Commons Attribution (CC BY) license (https://creativecommons.org/licenses/by/4.0/).
Share and Cite
MDPI and ACS Style
Dadvar, A.; Mahapatra, K.; Forss, J. Water Use Behavior in a Multicultural Urban Area in Sweden. Sustainability 2021, 13, 8603. https://0-doi-org.brum.beds.ac.uk/10.3390/su13158603
AMA Style
Dadvar A, Mahapatra K, Forss J. Water Use Behavior in a Multicultural Urban Area in Sweden. Sustainability. 2021; 13(15):8603. https://0-doi-org.brum.beds.ac.uk/10.3390/su13158603
Chicago/Turabian StyleDadvar, Atefeh, Krushna Mahapatra, and Jörgen Forss. 2021. "Water Use Behavior in a Multicultural Urban Area in Sweden" Sustainability 13, no. 15: 8603. https://0-doi-org.brum.beds.ac.uk/10.3390/su13158603
Note that from the first issue of 2016, this journal uses article numbers instead of page numbers. See further details here.