
Coastal Land-Use and Land-Cover Change Trajectories: Are They Sustainable?


Interdisciplinary Centre of Social Sciences (CICS.NOVA), Faculty of Social Sciences and Humanities (NOVA FCSH), Universidade NOVA de Lisboa, Avenida de Berna, 26-C, 1069-061 Lisbon, Portugal
*
Author to whom correspondence should be addressed.
Sustainability 2021, 13(16), 8840; https://0-doi-org.brum.beds.ac.uk/10.3390/su13168840
Submission received: 30 June 2021
/
Revised: 30 July 2021
/
Accepted: 2 August 2021
/
Published: 7 August 2021
(This article belongs to the Special Issue Modelling Smart and Sustainable Cities as Complex Systems)
Abstract
:In this study, past and current land-use and land-cover (LULC) change trajectories between 1947 and 2018 were analysed in terms of sustainability using a unique set of nine detailed, high-precision LULC thematic maps for the municipality of Portimão (Algarve region), Portugal. Several Geographic Information System (GIS)-based spatial analysis techniques were used to process LULC data and assess the spatiotemporal dynamics of LULC change processes. The dynamics of LULC change were explored by analysing LULC change trajectories. In addition, spatial pattern metrics were introduced to further investigate and quantify the spatial patterns of such LULC change trajectories. The findings show that Portimão has been experiencing complex LULC changes. Nearly 52% of the study area has undergone an LULC change at least once during the 71-year period. The analysis of spatial pattern metrics on LULC change trajectories confirmed the emergence of more complex, dispersed, and fragmented shapes when patches of land were converted from non-built categories into artificial surface categories from 1947 to 2018. The combined analysis of long-term LULC sequences by means of LULC change trajectories and spatial pattern metrics provided useful, actionable, and robust empirical information that can support sustainable spatial planning and smart growth, which is much needed since the results of this study have shown that the pattern of LULC change trajectories in Portimão municipality has been heading towards unsustainability.
1. Introduction
Changes in LULC have been extensively studied worldwide over recent decades, especially in the fields of urban studies and landscape ecology. Indeed, it has been widely recognised that LULC change plays a major role in global change phenomena [1,2,3,4]. Urban growth by means of LULC change has been similarly put in the spotlight by the Portuguese government and planning agencies as evidenced by the several strategic and policy documents (namely, the Portuguese Legal Framework for Spatial Management Tools). This concern may be due to the fact that LULC change and subsequent urban growth are recognised as taking place at an accelerated pace and spatial dimension [5,6], imposed by both population pressure and tourism demand, particularly in metropolitan and coastal areas, causing adverse effects on the environment, ecosystems and their services.
Simultaneously, advanced geospatial technology and methods (e.g., remote sensing, geographic information systems (GIS), 3D web-GIS, spatial analysis and modelling) together with free high-quality satellite imagery sources (such as Copernicus Sentinel data) or high-resolution orthoimagery that has become cheaper and more accessible enable the analysis and visualisation of the spatiotemporal dynamic of LULC change [7,8,9], expand our knowledge of complex urban systems [10,11], reduce uncertainty [12] and improve data-driven decisions. Hence, such geospatial technology and methods are becoming more important for future committed decision-making [13,14].
Additional empirical research has corroborated the use of remote sensing data and spatial pattern metrics in quantifying and interpreting the spatial pattern of urban growth and LULC change [15,16,17,18,19,20]. Spatial pattern metrics are powerful quantitative indicators that describe and measure the spatial pattern of individual patches, classes, or the entire landscape, at a certain spatial resolution [7]. Assessing the landscape dynamic, composition, and configuration using spatial pattern metrics highly depends on the accuracy of thematic LULC data [21]. Currently, there is a broad range of spatial pattern metrics (see review by [22]). There is a growing interest in exploring quantitatively the connection between spatial patterns of urban land change and ecological and environmental processes [23,24,25], as urban land changes may have significant adverse effects on ecosystems [26]. The protection of both biodiversity and ecosystem services is a crucial dimension of sustainability. The spatial pattern metrics that may be used to produce spatial temporal data on existing landscape conditions—and thus be considered for sustainability analysis—comprise fragmentation, heterogeneity, diversity, and connectivity [27]. Human-induced landscape changes can modify the spatial pattern and function of natural landscapes. Generally, they lead to habitat destruction, degradation, and fragmentation, and as a result to the loss of both biodiversity and ecosystem services [28]. Evaluating the spatial pattern and the amount of these specific LULC changes on the landscape via spatial pattern metrics contributes towards sustainable ecosystem planning [27]. Moreover, as spatial pattern metrics can be linked to landscape function, they have been progressively developed, enhanced, and applied as indicators of urban sustainability (see overviews on spatial pattern metrics in urban sustainability by [29,30,31]). Hence, the connection between spatial pattern metrics and attaining urban sustainability has become a major research topic in attempts to plan future urban areas following sustainable and smart urban design principles (such as compact and greener cities, mixed land-uses, and proper urban block size) [32].
The analysis of the spatial patterns of LULC change is also recognised as a crucial aspect for research on LULC change and urban growth detection as such spatial patterns often reveal the underlying historical anthropogenic and natural processes that shape landscape [33,34]. The analysis of the spatial patterns of LULC change has attracted renewed interest due to the development of the multitemporal profile method [35,36] that allows us to perform spatial pattern metric analysis based on categorical trajectory analysis [37,38,39,40]. Such a method is an alternative to the bi-temporal profile method (traditional ‘from-to’ post-classification change detection) [41]. When applied to spatial LULC pattern change analysis, the latter measures changes in LULC based on ‘two-epoch’ timescale (pair-wise LULC change comparison). The spatial LULC change patterns are subsequently assessed by comparing spatial pattern metric results between two observation years [38]. However, when analysing long-term LULC change, this method involves time-consuming, demanding work and generally leads to the propagation of errors and inconsistencies [42]. Moreover, results from previous studies revealed that the bi-temporal profile method is usually not sufficient to infer landscape processes [40]. Spatial pattern metric analysis on classified temporal categorical trajectories, on the other hand, has emerged as the most effective method for interpreting long-term dynamic and complex LULC conversions [43]. The basic assumption of this method is that the evolution of LULC change processes may be better interpreted by means of LULC change trajectory patterns that focus on the temporal sequence of LULC categories over more than two time periods, rather than on the basis of a ‘two-epoch’ timescale [44].
Although previous studies [27,45,46,47,48] have been successful in assessing and measuring large-scale LULC change and urban growth using a broad LULC categorisation, research on the production of high-precision long-term LULC datasets, along with detailed LULC categorisation to measure the dynamic patterns of LULC change, is still quite limited. Therefore, this study proposes an approach grounded on previous work conducted by Faria de Deus [49] and seeks to assess the spatial pattern of LULC change trajectories in terms of sustainability on a coastal urban area facing current and future challenges due to increasing urbanisation, based on a multiple epoch timescale (a time span of about 71 years) and spatial pattern metrics. The analysis of long-term LULC change trajectory patterns using a detailed land classification scheme (including low-density residential land-use categories) is expected to produce robust and trustworthy results that may be used to improve and sustain public policies and decisions aiming at guiding the system towards a more sustainable future.
2. Study Area
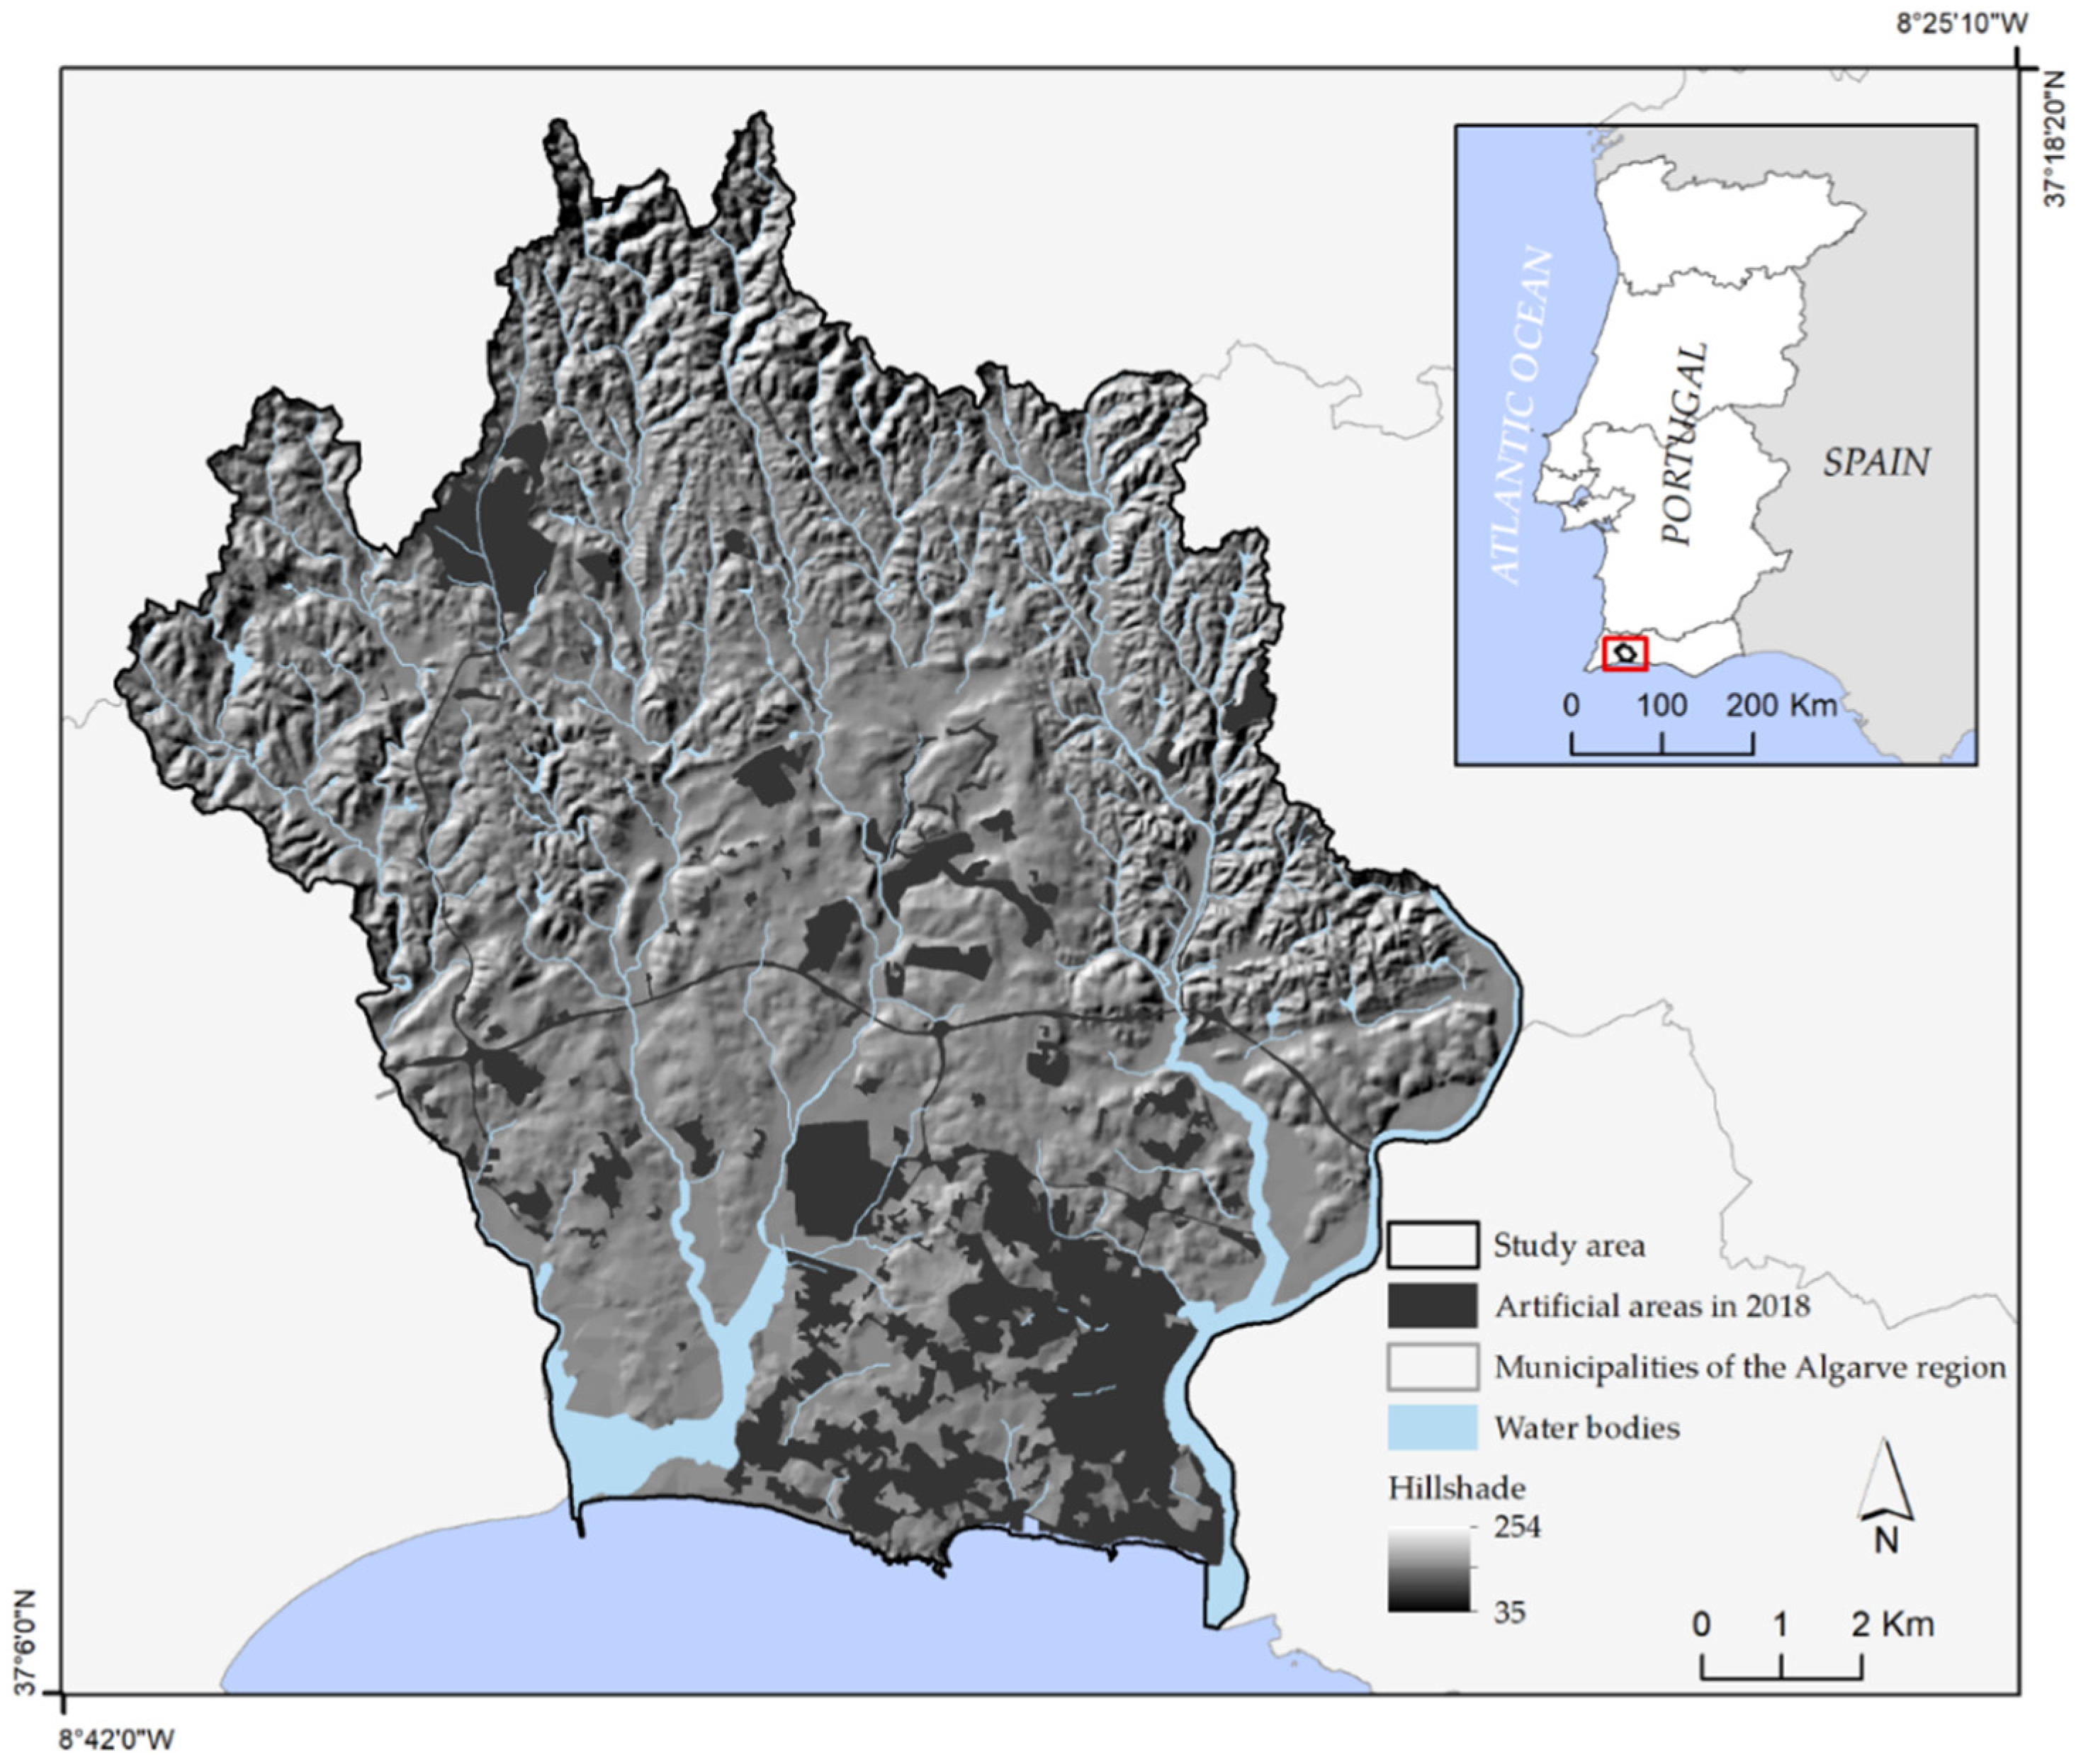
Portimão is a municipality located in the district of Faro (Algarve), the southernmost region of mainland Portugal (Figure 1). The Algarve region is a major tourist destination in Portugal and Europe. The main European countries that have the Algarve as their vacation destination are the United Kingdom, Germany, Ireland, the Netherlands, France, Spain, Belgium, and Poland [50]. The Algarve’s economic activities are primarily grounded on the tertiary sector, especially on tourism. The tertiary sector accounts for almost 90% of the regional gross value added (GVA) [51]. Tourism demand expressed in number of overnight stays and guests has decreased in the last year, but it still reached quite high values in 2019: the number of guests totalled 5.1 million (almost 19% share of the total demand in Portugal) and overnight stays were 20.9 million (almost 30% share of the total demand in Portugal). In economic terms, total revenues reached EUR 1225.7 million and the revenue from accommodation totalled EUR 909.6 million, contributing decisively to the economic, social, and territorial development of the region [50]. The municipality of Portimão is one of the fastest-growing municipalities in Portugal: the population of Portimão grew by 24.5% between 2001 and 2011, far above the national growth rate of 0.29% [52], even if this trend has largely slowed down since the global financial crisis. Since 2001, the number of buildings has increased to 25.5% in this municipality. This figure is particularly significant when compared to the Algarve region’s growth of 18.1%, which was already significantly high, higher than the national growth of 12.1%. The number of dwellings and households has also grown considerably over this period: 54.6% and 35%, respectively. Second homes and seasonal residences represent a significant part of housing in Portimão. According to Statistics Portugal, second homes and seasonal residences in Portimão accounted for 50% of the total dwellings in 2011 [52]. The importance of second homes and seasonal residences is compounded by the fact that dwelling dynamics have far outweighed household dynamics in the past two decades [53], which clearly shows how both the territorial and the socioeconomic model of the municipality of Portimão is supported by real estate and tourism. Considering that the municipality of Portimão faces current and future challenges due to increasing urbanisation [5], this study area offers an opportunity to analyse the effectiveness of spatial pattern metrics for LULC change trajectory analysis based on high-precision detailed LULC maps.
3. Materials and Methods
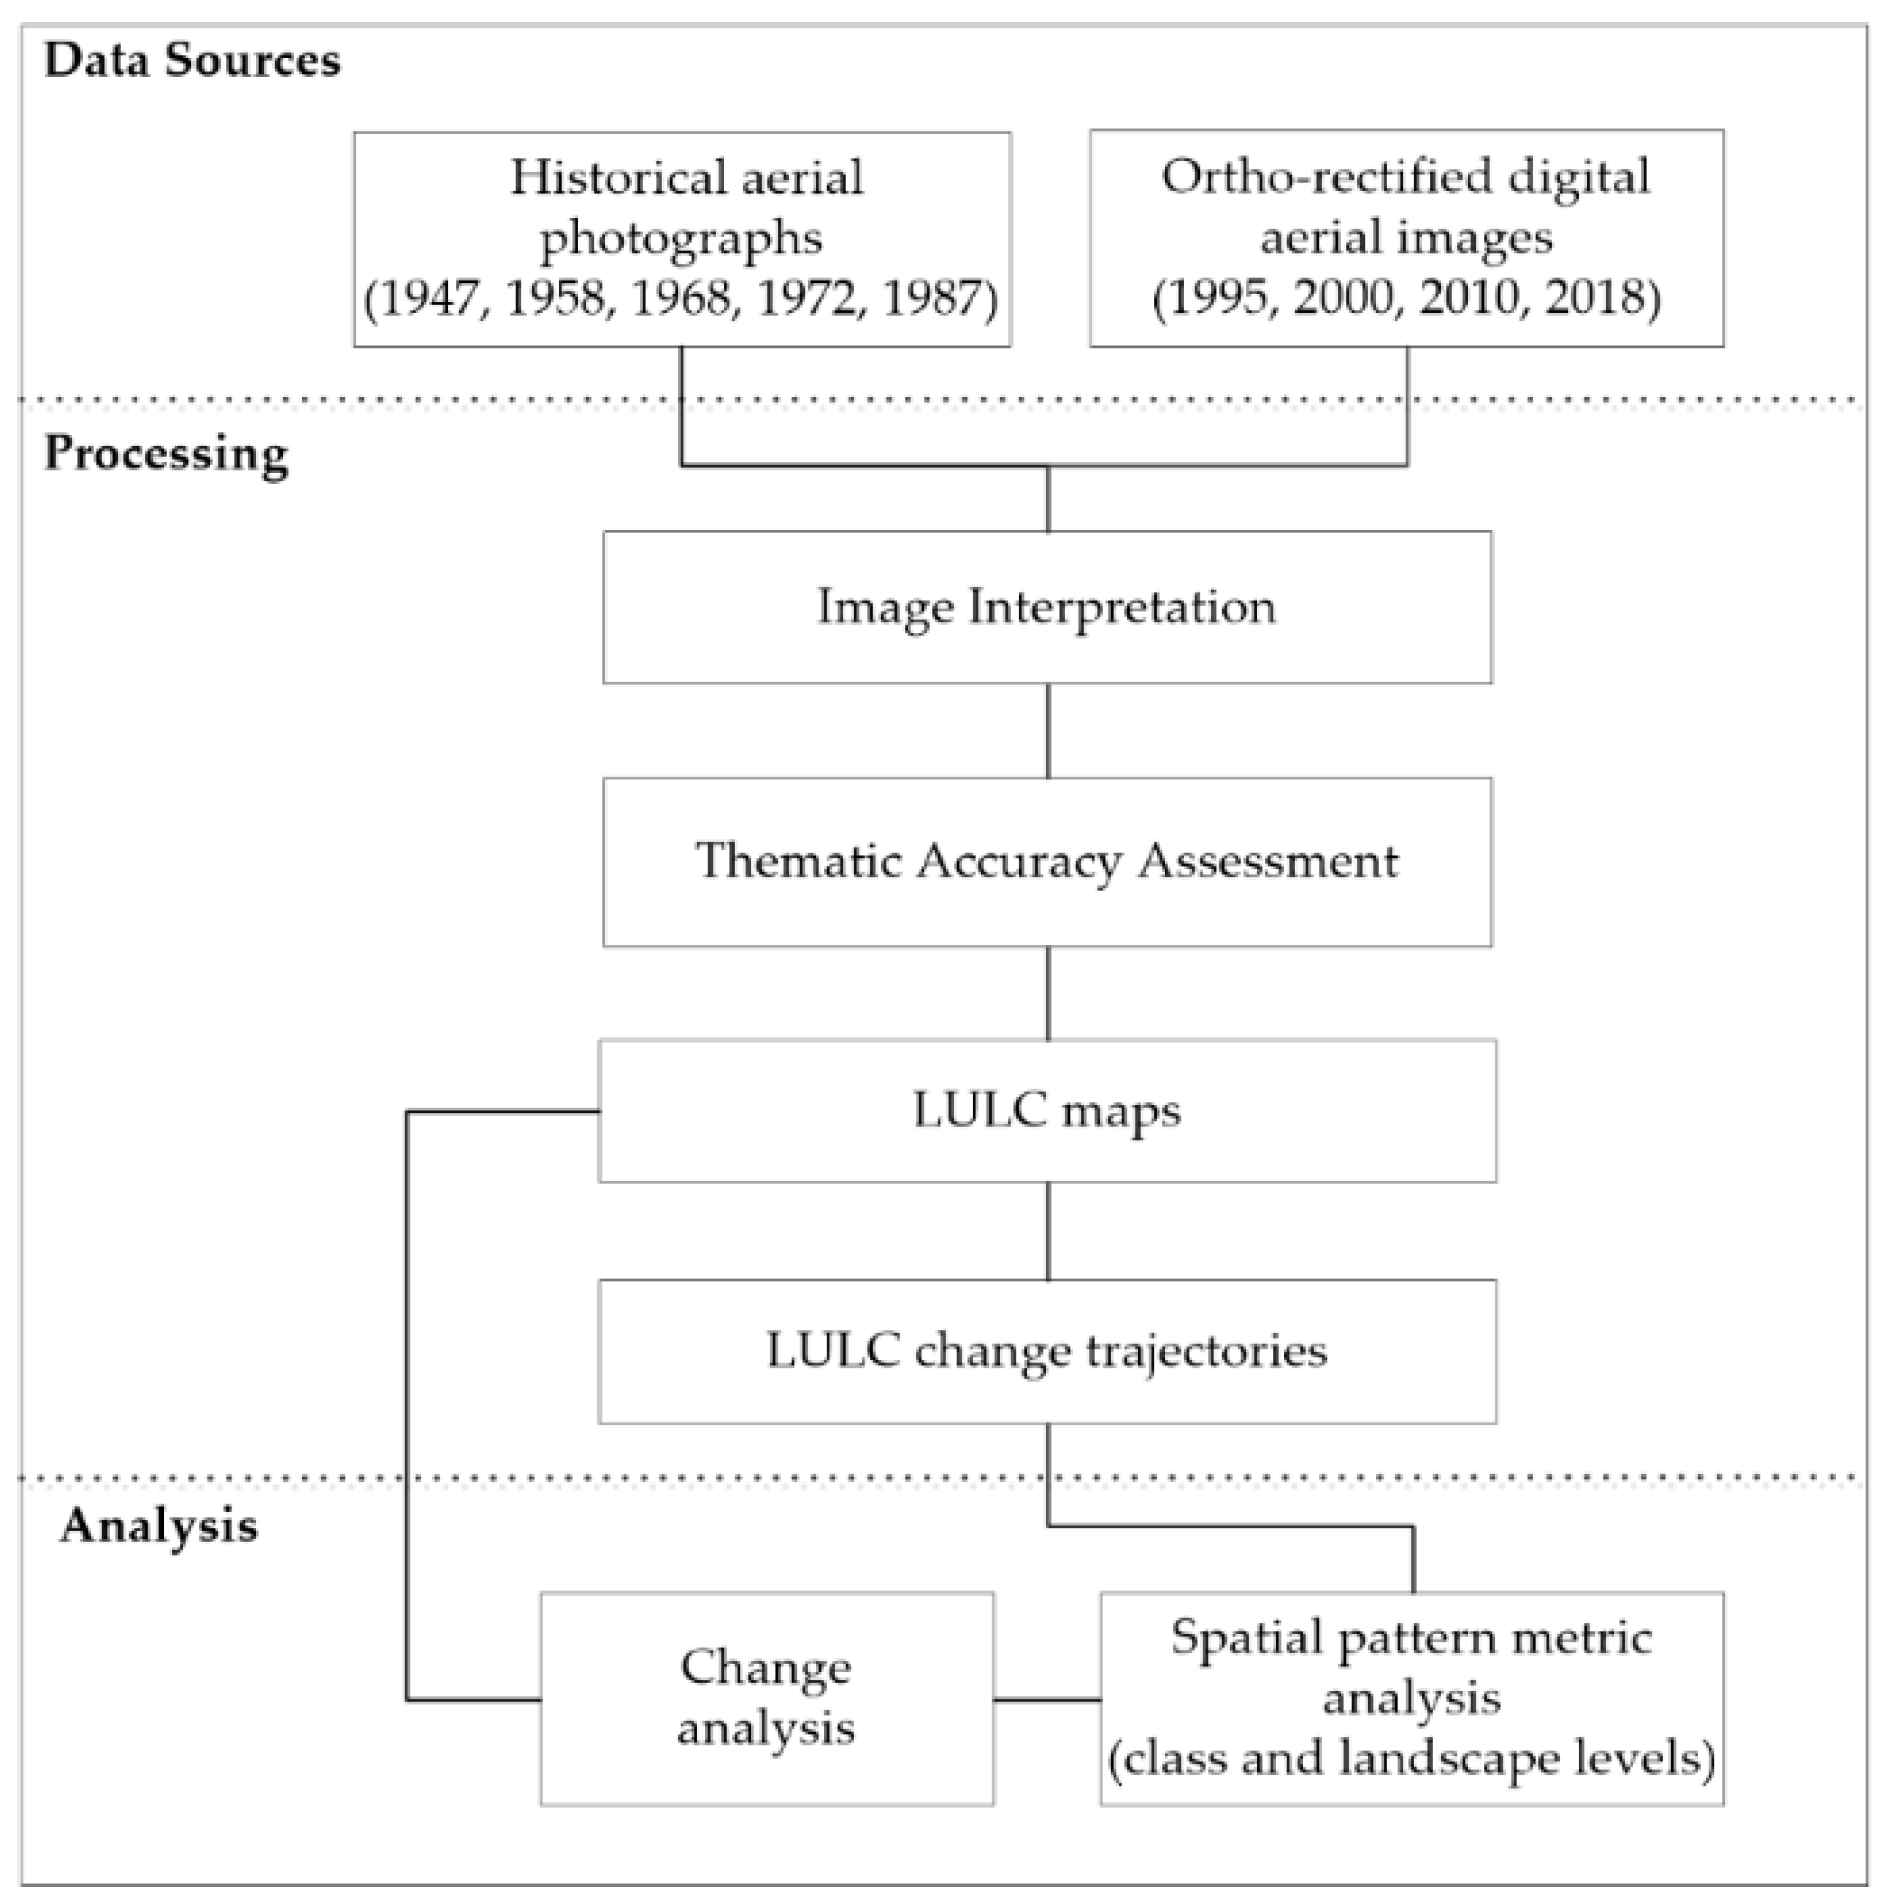
The research methodology included the acquisition and organisation of aerial photographs and ortho-rectified digital aerial images for a long period of time (1947–2018), data processing, and analysis of both LULC change and LULC change trajectories (Figure 2). This research methodology is presented in the following four subsections.
3.1. Data Description
The data on the LULC of this growing municipality were collected from research carried out by [49]. A unique set of detailed high-precision LULC thematic maps were produced for 1947, 1958, 1968, 1972, 1987, 1995, 2000, 2010, and 2018 to advance our knowledge of the LULC change that occurred in the municipality of Portimão over the past 71 years. Though acquiring near-anniversary images would have been desirable, this proved difficult to achieve. The analysis intervals were determined by the availability of aerial photographs and ortho-rectified digital aerial images for the study area. Moreover, the choice of these dates stems from the fact that the main LULC changes in the municipality of Portimão occurred within these periods. The LULC vector maps were derived by visual image interpretation of historical aerial photographs and ortho-rectified digital aerial images, and have a scale of 1:10,000, and a minimum mapping unit (MMU) of 1000 m2. Land classification is organised into five levels of thematic detail, with 33 urban land-use categories at the highest level of detail (Table A1, Appendix A). The thematic accuracy assessment carried out for the 2010 and 2018 LULC maps has produced an overall accuracy of 96.9% and 96.3%, and a Khat statistic (which is an estimate of Kappa) of 96.8% and 96.2%, respectively. In this study, no validation procedure was conducted for the remaining LULC maps due to the lack of higher resolution ground-truthing data with time intervals similar to those of historical images in Portimão. To overcome this limitation, ancillary data were used for an adequate visual interpretation of the historical images. A comprehensive presentation of the methodology used to produce the LULC maps and their specifications is given in [6].
Population data were supplied by Statistics Portugal for the period 1940–2019. The data were obtained from the Portuguese 1940, 1950, 1960, 1970, 1981, 1991, 2001, and 2011 Census. The population data from 2019 were obtained from the annual provisional resident population estimates. Since we did not have Census data for the same years as the LULC data we possessed, the former were only used to get some insight into the population trends in the study area.
3.2. Change Analysis
The analysis of the spatial and temporal dynamics of LULC change and urban growth was carried out based on the nine LULC digital vector maps of the study area. All LULC categories were analysed and detailed, with a third level for forestland and seminatural areas and a fifth level for artificial surfaces (see Table A1, Appendix A). LULC areas (ha), LULC area percentages, and LULC area growth rates of the study area over the 1947–2018 period were computed. In our study, the LULC area growth rate (LUCAGR) was computed using the following Formula (1):
where LUCAGR is the (continuously compounded) annual growth rate of an LULC area during a given period, LUCAt1 and LUCAt2 are the LULC area sizes (ha) in year t1 and year t2, respectively, n is the elapsed number of years, and ln represents the natural logarithm.
Furthermore, a combined analysis of LULC changes with population trends was conducted to provide an adequate basis for the understanding of urban sprawl processes over time and space. Population densities and annual population growth rates for the municipality were computed from population data. Finally, a common GIS-based LULC change detection technique was used to create a spatiotemporal difference map. This procedure was carried out by overlaying the two consecutive LULC maps over the period from 1947 to 2018 to evaluate the physical expansion of artificial surfaces in Portimão over the study period. The spatiotemporal LULC change analysis of 41 LULC categories is presented in this study.
3.3. Definition of LULC Change Trajectories
This study focuses on the analysis of LULC change trajectories in the study area to provide an adequate basis for the understanding of the LULC change process over time and space. Thus, for the definition of LULC change trajectories, LULC categories disaggregated at the most detailed level for the nine temporal periods were used. The analysis of temporal LULC change trajectories from this perspective allows us to benefit from the rich, highly detailed temporal information contained in the LULC maps. In this study, the LULC change trajectory is understood as the sequence of transitions between LULC categories during the nine temporal periods. For example, a trajectory defined as ‘A-A-A-A-SD-SD-SD-SD-SD’ denotes that land was cultivated from 1947 to 1972, converted to discontinuous urban fabric in 1987 and persisted as discontinuous urban fabric until 2018. A categorical LULC change map containing the LULC trajectories at the object-level (polygon) was derived using a vector GIS. Firstly, the two successive LULC maps were overlaid so that changes in LULC were identified, and every object had a category attributed to it for the years 1947, 1958, 1968, 1972, 1987, 1995, 2000, 2010, and 2018. Secondly, by means of concatenation, each LULC polygon was computed as a numeric pattern trajectory based on the LULC IDs associated with it. The concatenation outcomes represent the trajectory of LULC change on a polygon over nine time periods. A total of 5495 LULC change trajectories were identified, and then 24 main LULC change trajectories were retained based on their proportion (ha) in the landscape. Furthermore, each main LULC change trajectory was interpreted for its categorical nature regarding the theorised processes at work on Portimão’s landscape. The theorised processes of LULC change identified in this study are described in Table 1.
Finally, these LULC trajectories were grouped into four main classes based on the LULC categories involved in each change trajectory, including changes from non-built to artificial surfaces (1), changes within artificial surfaces (2), changes within non-built surfaces (3), and unchanged surfaces (4). The changes from non-built to artificial surfaces basically refer to the situations of changes from non-built categories and remained as artificial surface categories. Changes within the artificial surface class include sequences that predominantly involved changes between artificial surface categories in the study period. However, situations where patches of land changed periodically between artificial surfaces (in the earliest year), non-built surfaces (at least in one intermediate year), and artificial surfaces (in the latest year) were assigned to this class as well. They were then included in ‘Other’ sequences since individually these sequences only represent a minor proportion of the landscape. Changes within the non-built class refer to the sequences that predominantly involved changes between non-built categories during the study period. Situations where patches of land changed periodically between non-built surfaces (in the earliest year), artificial surfaces (at least in one intermediate year), and non-built surfaces (in the latest year) were also assigned to this class. They were included in ‘Other’ sequences for the same above-mentioned reason. The unchanged class refers to situations where patches of land remained in the same LULC category during the nine temporal periods.
3.4. Spatial Pattern Metric Computation Based on a Multitemporal Profile
To better understand both long-term LULC change trajectory patterns related to distinct historical human and natural processes and their effects on sustainability, the spatial arrangement of the patches of LULC change trajectories were interpreted via spatial pattern metrics. In this study, a set of class-level spatial pattern metrics was pre-selected based on their intuitiveness [9] and ability to describe landscape change patterns [38,40]. These spatial metrics were computed by means of FRAGSTAT 4.2 [55] running at 10 m spatial resolution with an 8-cell patch neighbour for each LULC change trajectory and main group. To retain uncorrelated spatial metrics, the Pearson correlation coefficient or Pearson’s r was computed. Redundancy among spatial metrics was prevented by choosing a single spatial metric from strongly correlated pairs, i.e., r > 0.85 or r < −0.85 [56]. Additionally, three landscape-level spatial pattern metrics were computed using a circular-moving window (500-m radius) for the geo-visualisation and interpretation of LULC change trajectories. The description of the selected spatial pattern metrics is shown in Table 2. See [55] for a complete description of spatial pattern metrics and more details on both the characteristics of each spatial metric and the corresponding equations.
4. Results and Discussion
Using high-level thematic high-precision LULC maps produced from remote sensing imagery for a 71-year period to analyse LULC change provided robust results. Those results allowed us to measure and monitor LULC change in Portimão in a detailed manner as well as to address the effects of both LULC change and LULC change trajectories on sustainability.
4.1. Change Trend Analysis of Agricultural Areas, Forest and Seminatural Areas, Water Bodies, and Wetlands (1947–2018)
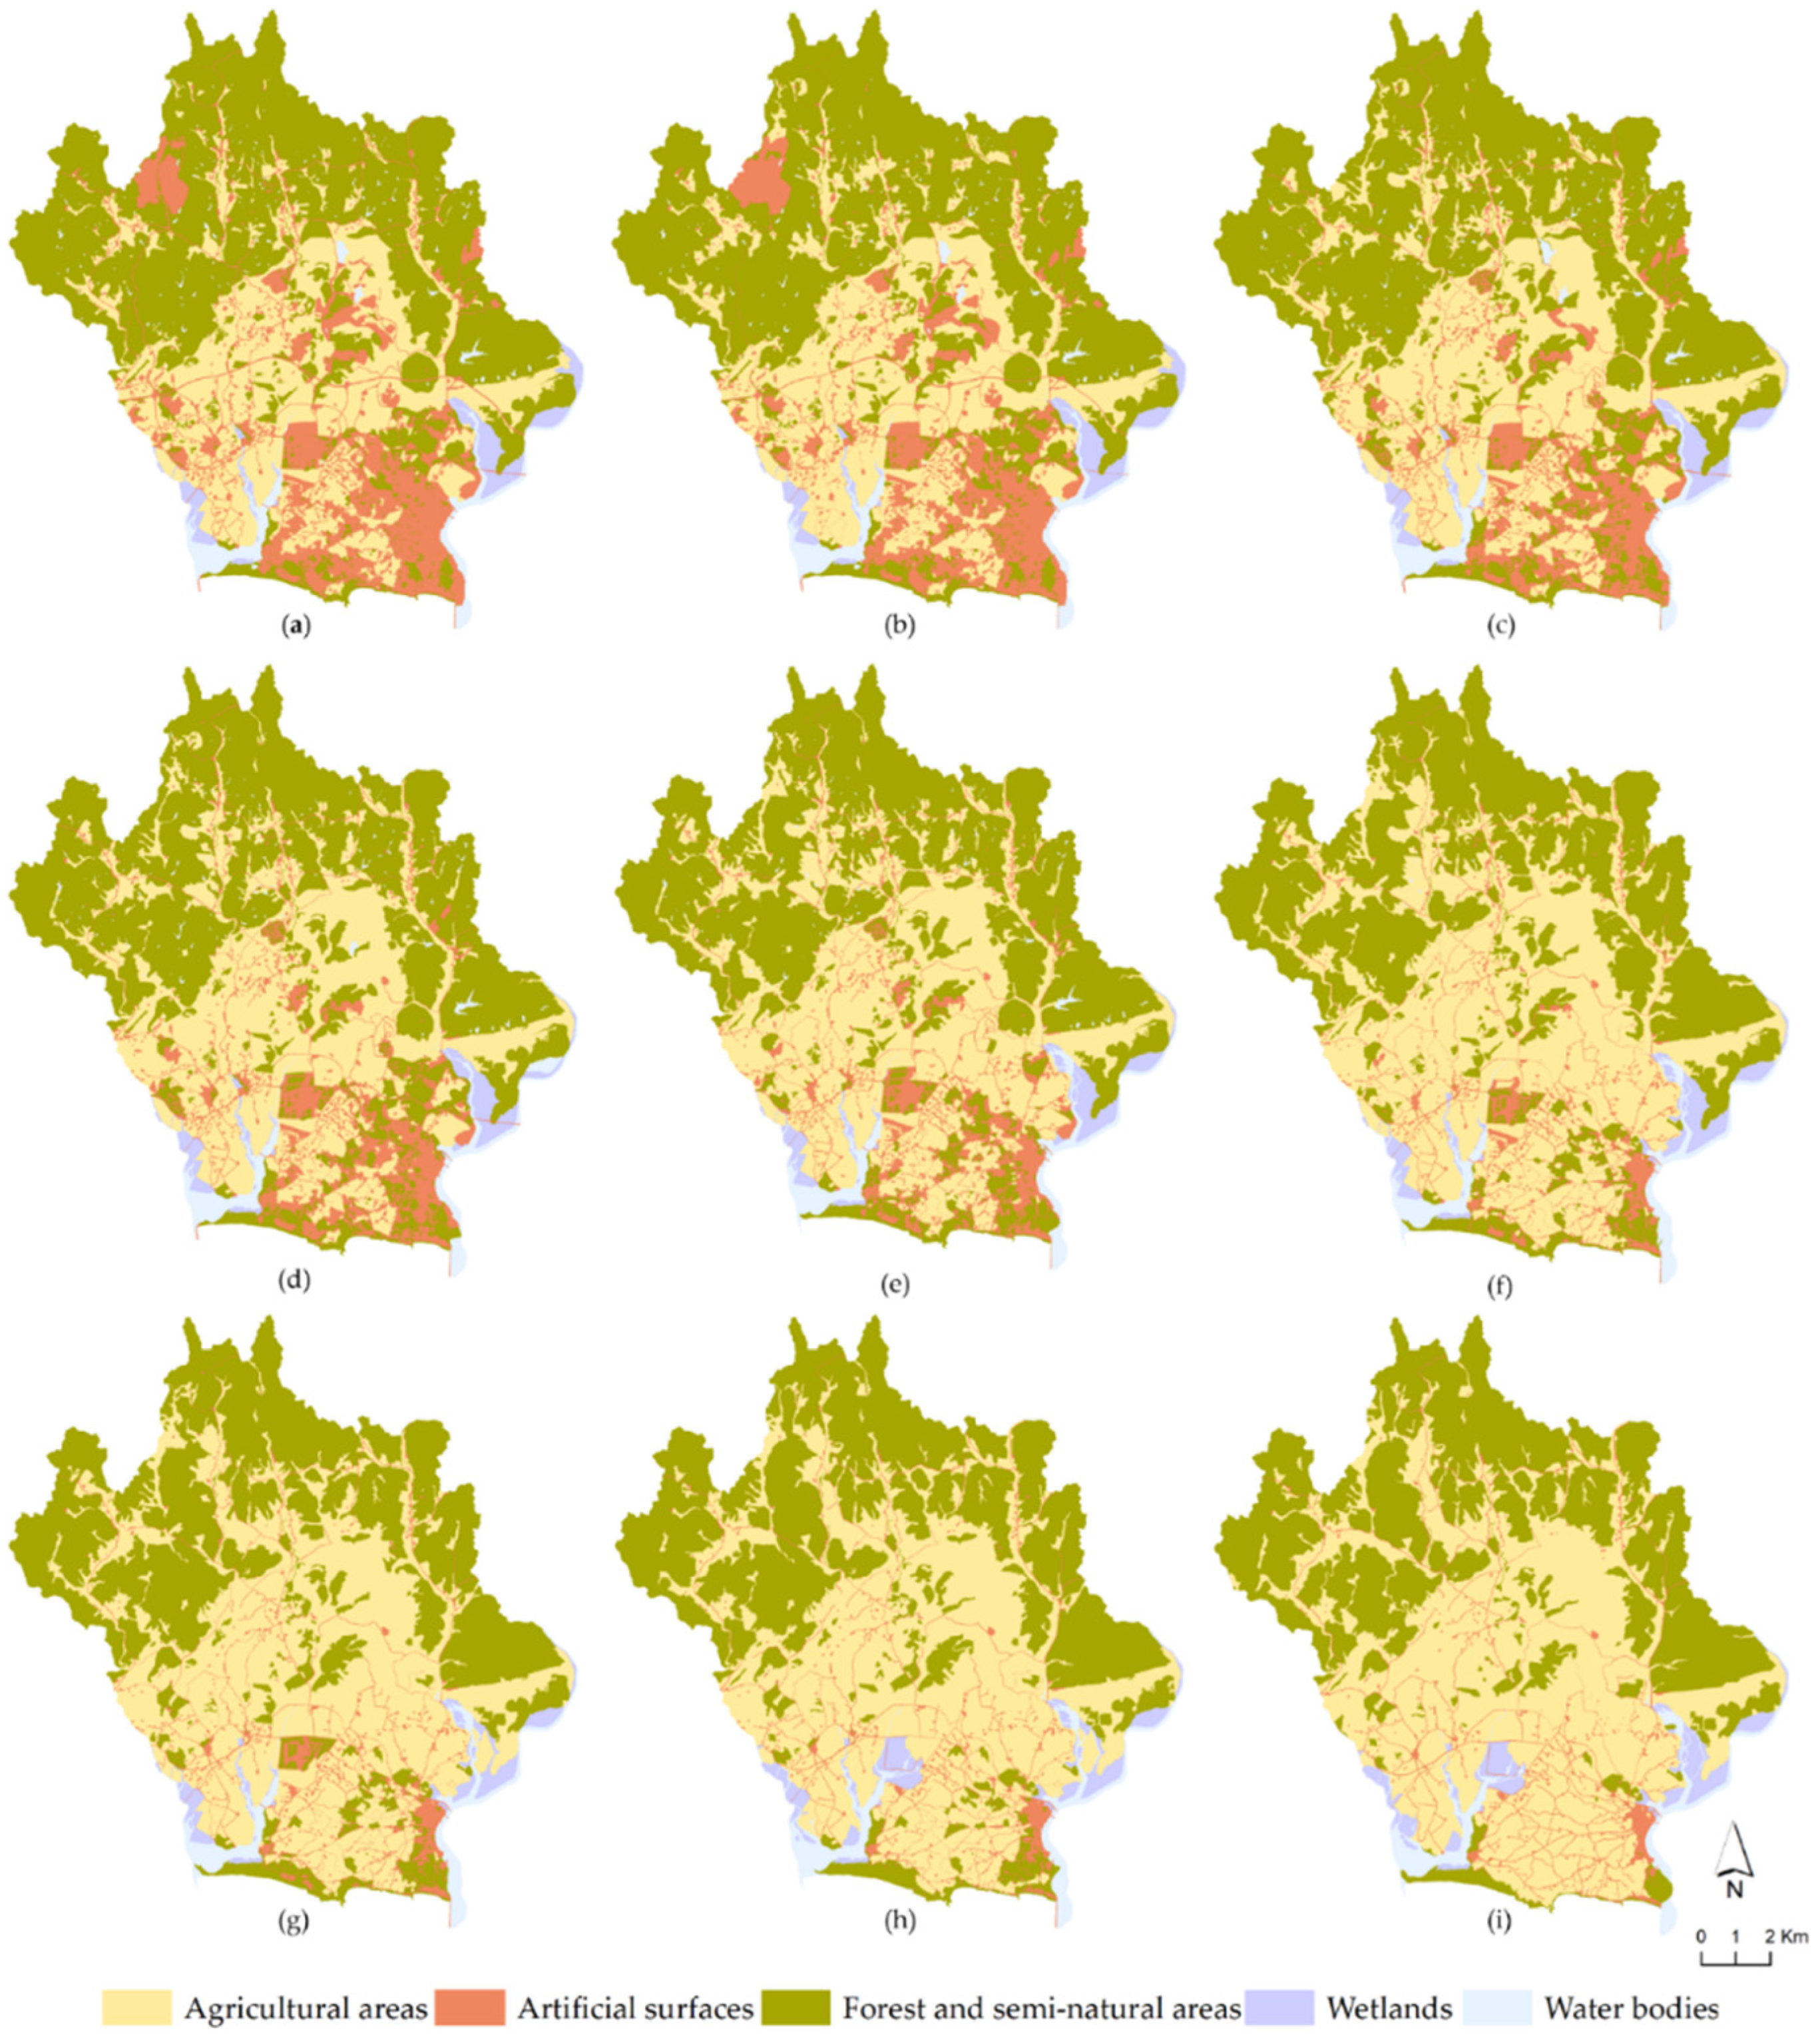
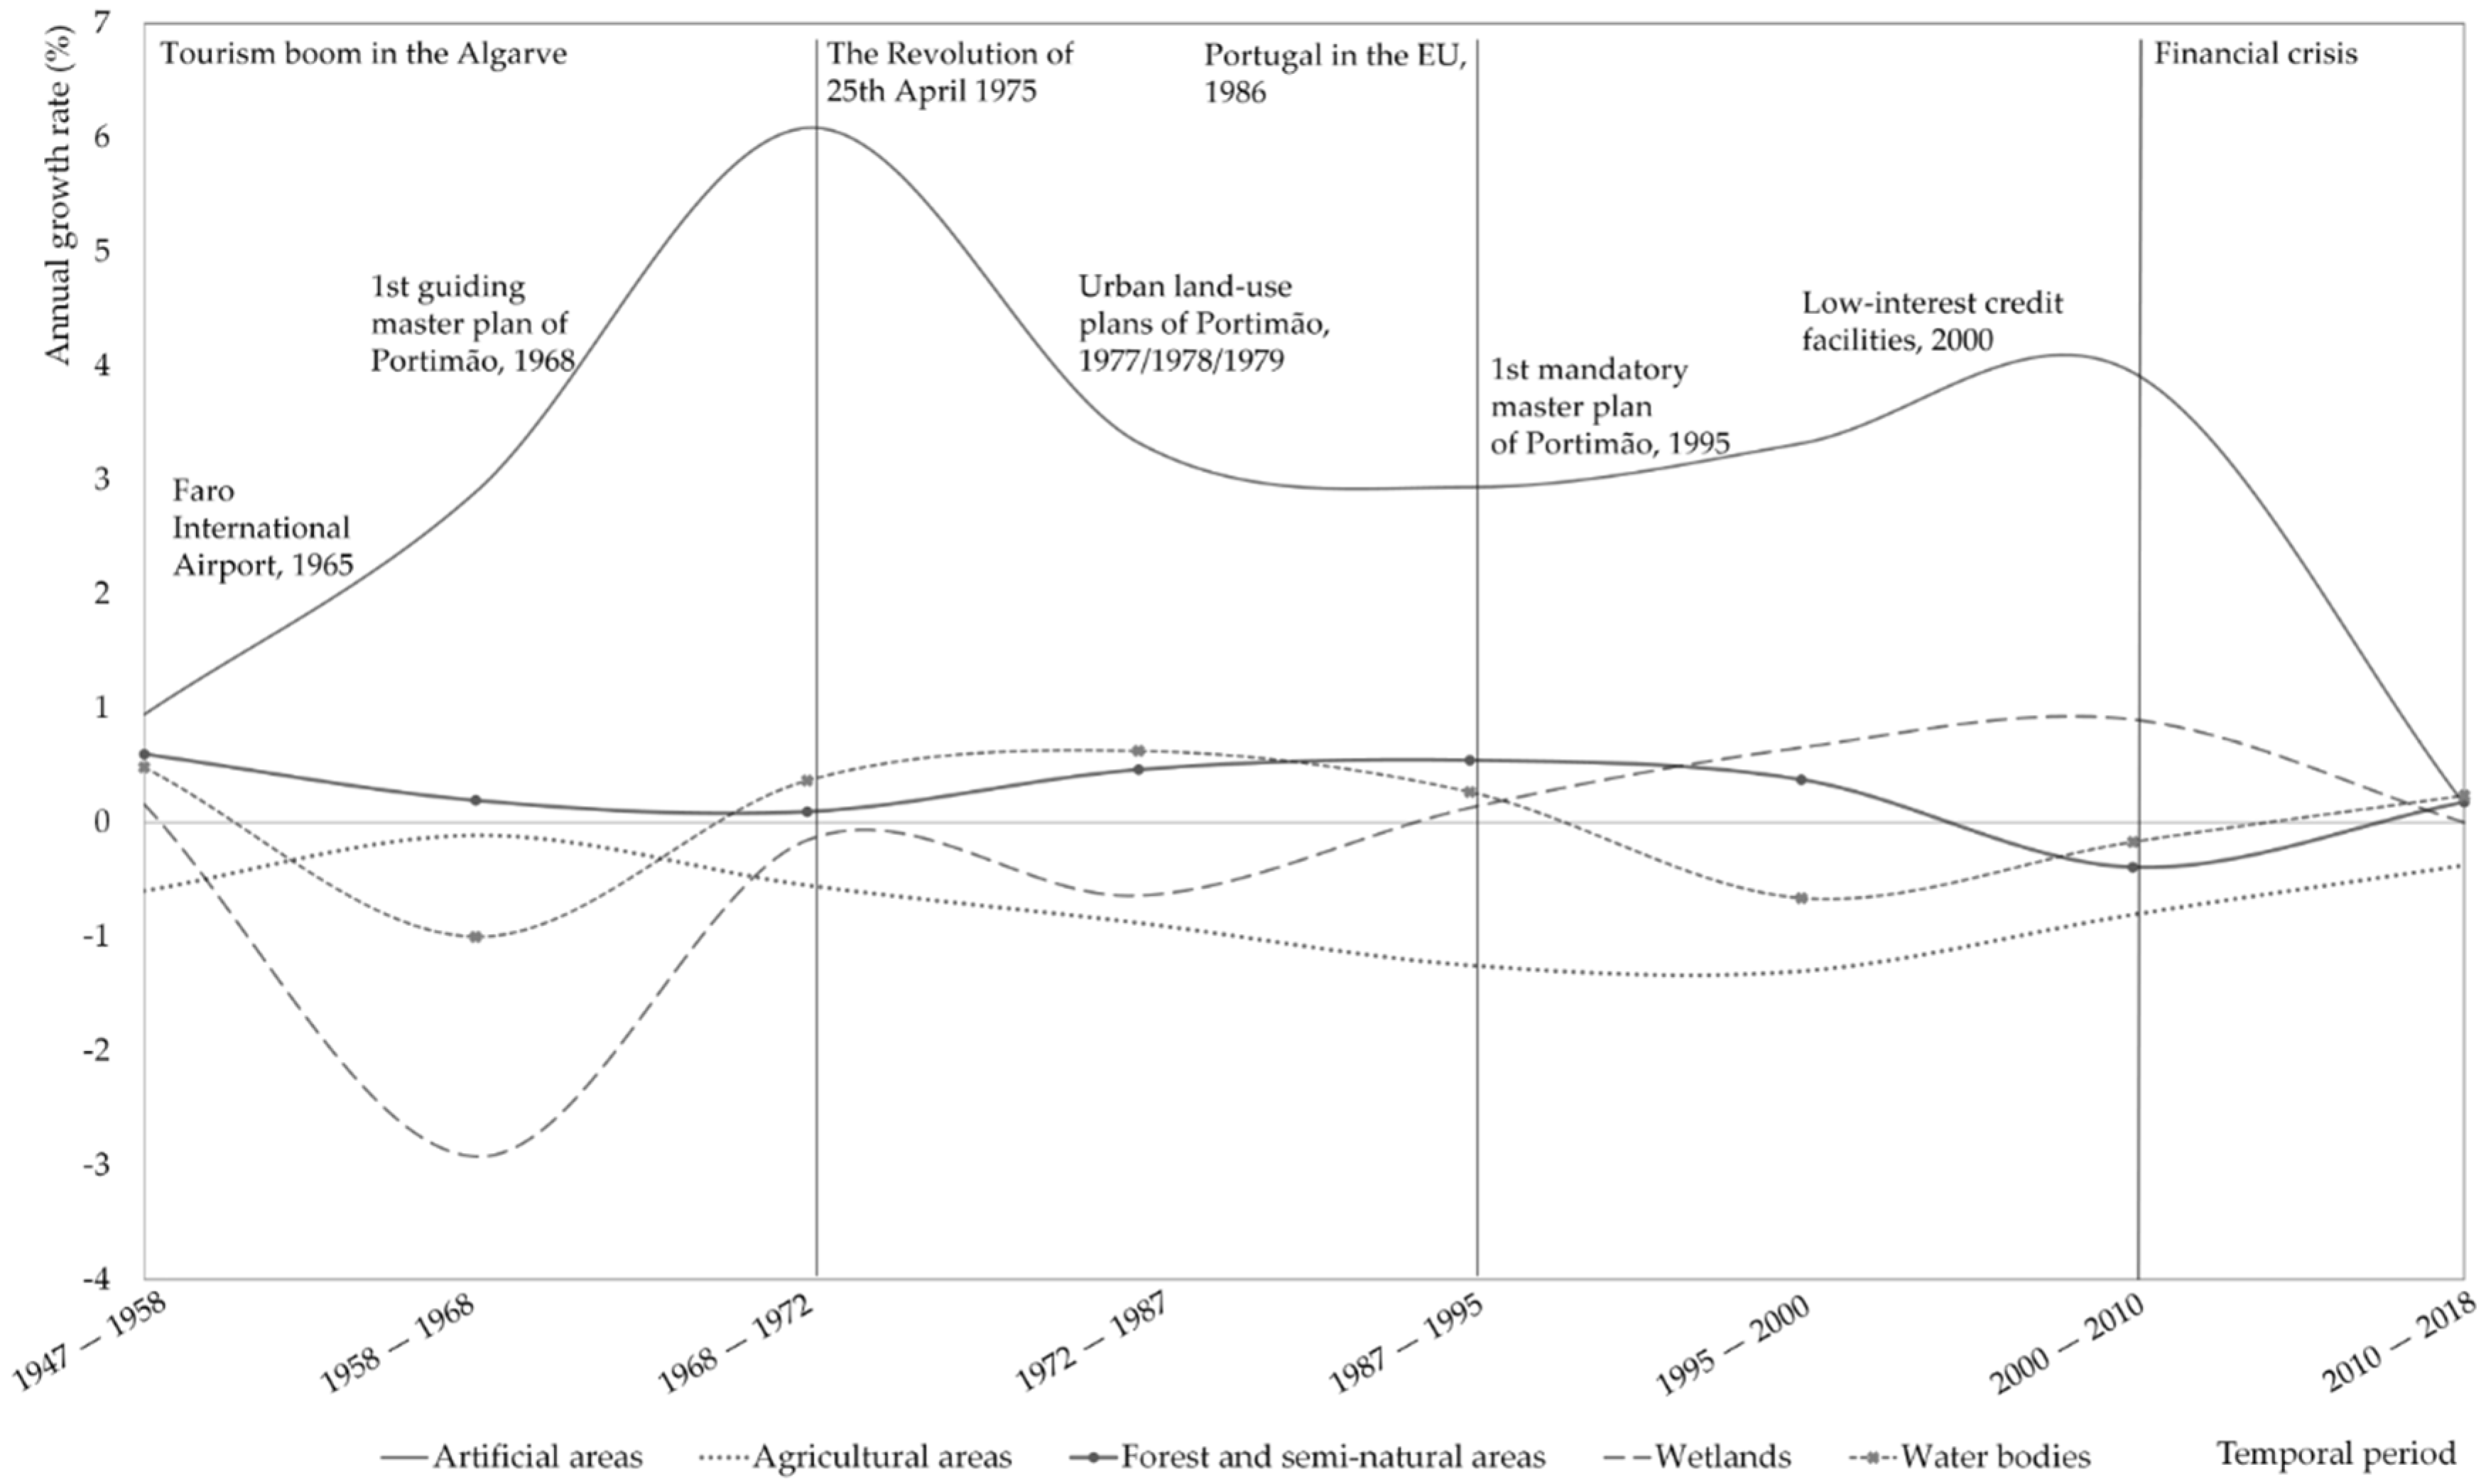
Figure 3 illustrates the nine LULC maps created for the study area, classified at the most generic thematic level. Figure 4 depicts overall land-cover dynamics that occurred throughout the study period. Annual growth rates of LULC areas by period are listed in Table 3. A complete table with LULC areas (ha) and percentage of LULC areas is provided in Table A2 (Appendix A).
As Figure 3 and Figure 4 show, the land-cover dynamic revealed by the annual growth rates of LULC area is very similar at the beginning and at the end of the study period. However, between those two specific time periods, there is a significant divergence in the behaviour of artificial surfaces regarding the other land-cover categories. In the late 1940s, Portimão was composed basically of both agricultural land (nearly 51%) and forest/seminatural land (nearly 41%). Although there was a clear dominance of these land categories over the study period, Table 3 and Figure 4 also reveal that agricultural and forest/seminatural land exhibited different change trends. Agricultural areas decreased at moderate negative growth rates—especially in the periods of 1987–1995 and 1995–2000 (with annual growth rates of −1.25% and −1.30%, respectively)—although the rhythm of change slowed down at the end of the study period (Table 3). Conversely, forest and seminatural land increased during the eight decades analysed (Figure 4), except for the 2000–2010 period, and showed relatively low growth rates (ranging from 0.09% to 0.60%). This demonstrates that the several national financial-incentive programmes to encourage forestry that have been implemented mainly since the mid-20th century and recent local land-use policies that aim for nature and forest areas protection have played an important role on the trends of forest land-cover change.
During the overall time span, forest and seminatural areas were mainly composed of shrubland and forestland (Table A2, Appendix A). Since 1947, the ‘forest’ land-cover category has nearly tripled, rising from 945 hectares to 2647 in 2018 (from 5% to 15% of the total area of the study area) showing a rapid rhythm of change, particularly for the 1968–1972 and 1987–1995 periods (with annual growth rates of 5.48% and 4.20%, respectively), apart from the 2010–2018 period.
Conversely, shrubland showed a shrinking trend towards the end of the study period. The fact that forestland and seminatural areas have mainly been comprised of shrubland, along with this shrinking trend over the time span, may point towards a critical hidden LULC change process. That is, the natural and rural land-cover change to transitional land-cover categories, such as shrublands. After being left uncultivated for a long period of time, shrubland often becomes a highly desirable area for urban development, which can lead to a permanent change into urban land cover [57] (p. 13).
Water bodies have always played important roles on both the natural environment and the socioeconomic activity of the municipality. In 1947, the total area of wetland and water bodies was 563 hectares and 569 hectares, respectively, whereas in 2018, the total wetland area dropped to 444 and the total area of water bodies increased to 596. Thus, wetland decreased by 22% during the 1947–2018 period. This changing trend of wetland (Figure 4), mainly attributable to human-induced activities (such as urban encroachment), has been triggering flooding problems and their consequences.
4.2. Analysis of Waves of Urbanisation, Urban Growth, and Population Trends (1947–2018)
From the analysis of Figure 4, two main waves of urbanisation and urban growth are identified. The first phase of urbanisation occurred in the late 1960s, reflecting the tourism boom in the Algarve, which was triggered by the favourable economic situation in Europe, with the consequent increase in accommodation capacity and the construction of Faro International Airport (1965). The spurt in the increase of artificial surfaces that occurred in this first phase was also prompted by the population growth and economic activity expansion since the independence movements in Portugal’s African colonies in 1975. Although the rhythm of change has decreased after that period, urban growth continued at high annual growth rates between 1972 and 2000. The second phase of urbanisation took place in the 2000s and is represented by the fast urban growth supported by low-interest credit facilities, mainly along the coast and the construction of public and sport infrastructures (e.g., road network, the Algarve International Circuit) towards the north of the study area. Due to the socioeconomic and political development of Portugal and the Algarve region, Portimão has a complex spatial organisation and its artificial surfaces have increased greatly during the overall time span and are changing very quickly. In 1947, the total area of artificial surfaces was 384 hectares, while in 2018, the total area of that same land category had risen to 2524 hectares, so that artificial surfaces increased by 557% between 1947 and 2018. Moreover, the decreasing trend in agricultural areas, vegetation cover, and wetlands reveals the unbalanced spatiotemporal pattern of land-cover change in Portimão and, therefore, indicates that the study area has been moving towards an unsustainable path.
The increase in artificial areas was mostly due to the growth of residential areas including the four urban fabric categories (see Table A1, Appendix A) (remarkably in the first three temporal periods), public and private facilities, road network and associated land, and golf courses (Table 3). Table 3 also shows that higher annual growth rates during the study period were more frequent in artificial surface categories. During the first three periods, the annual growth rate of residential areas noticeably surpassed the development of commerce, the transport network, and industry. However, this trend has shifted since the 1972–1987 period. In the last four periods, the growth rhythm of residential areas weakened slightly and was outpaced by the development of commerce, the transport network, and industry. This may indicate that the municipality has shifted to an industrial and service-oriented economy towards the end of the study period. Parks and gardens, car parks, other sport facilities, construction sites, and other leisure facilities have grown considerably in the 1958–1968 and 1968–1972 periods and have expanded regularly since then (Table 3).
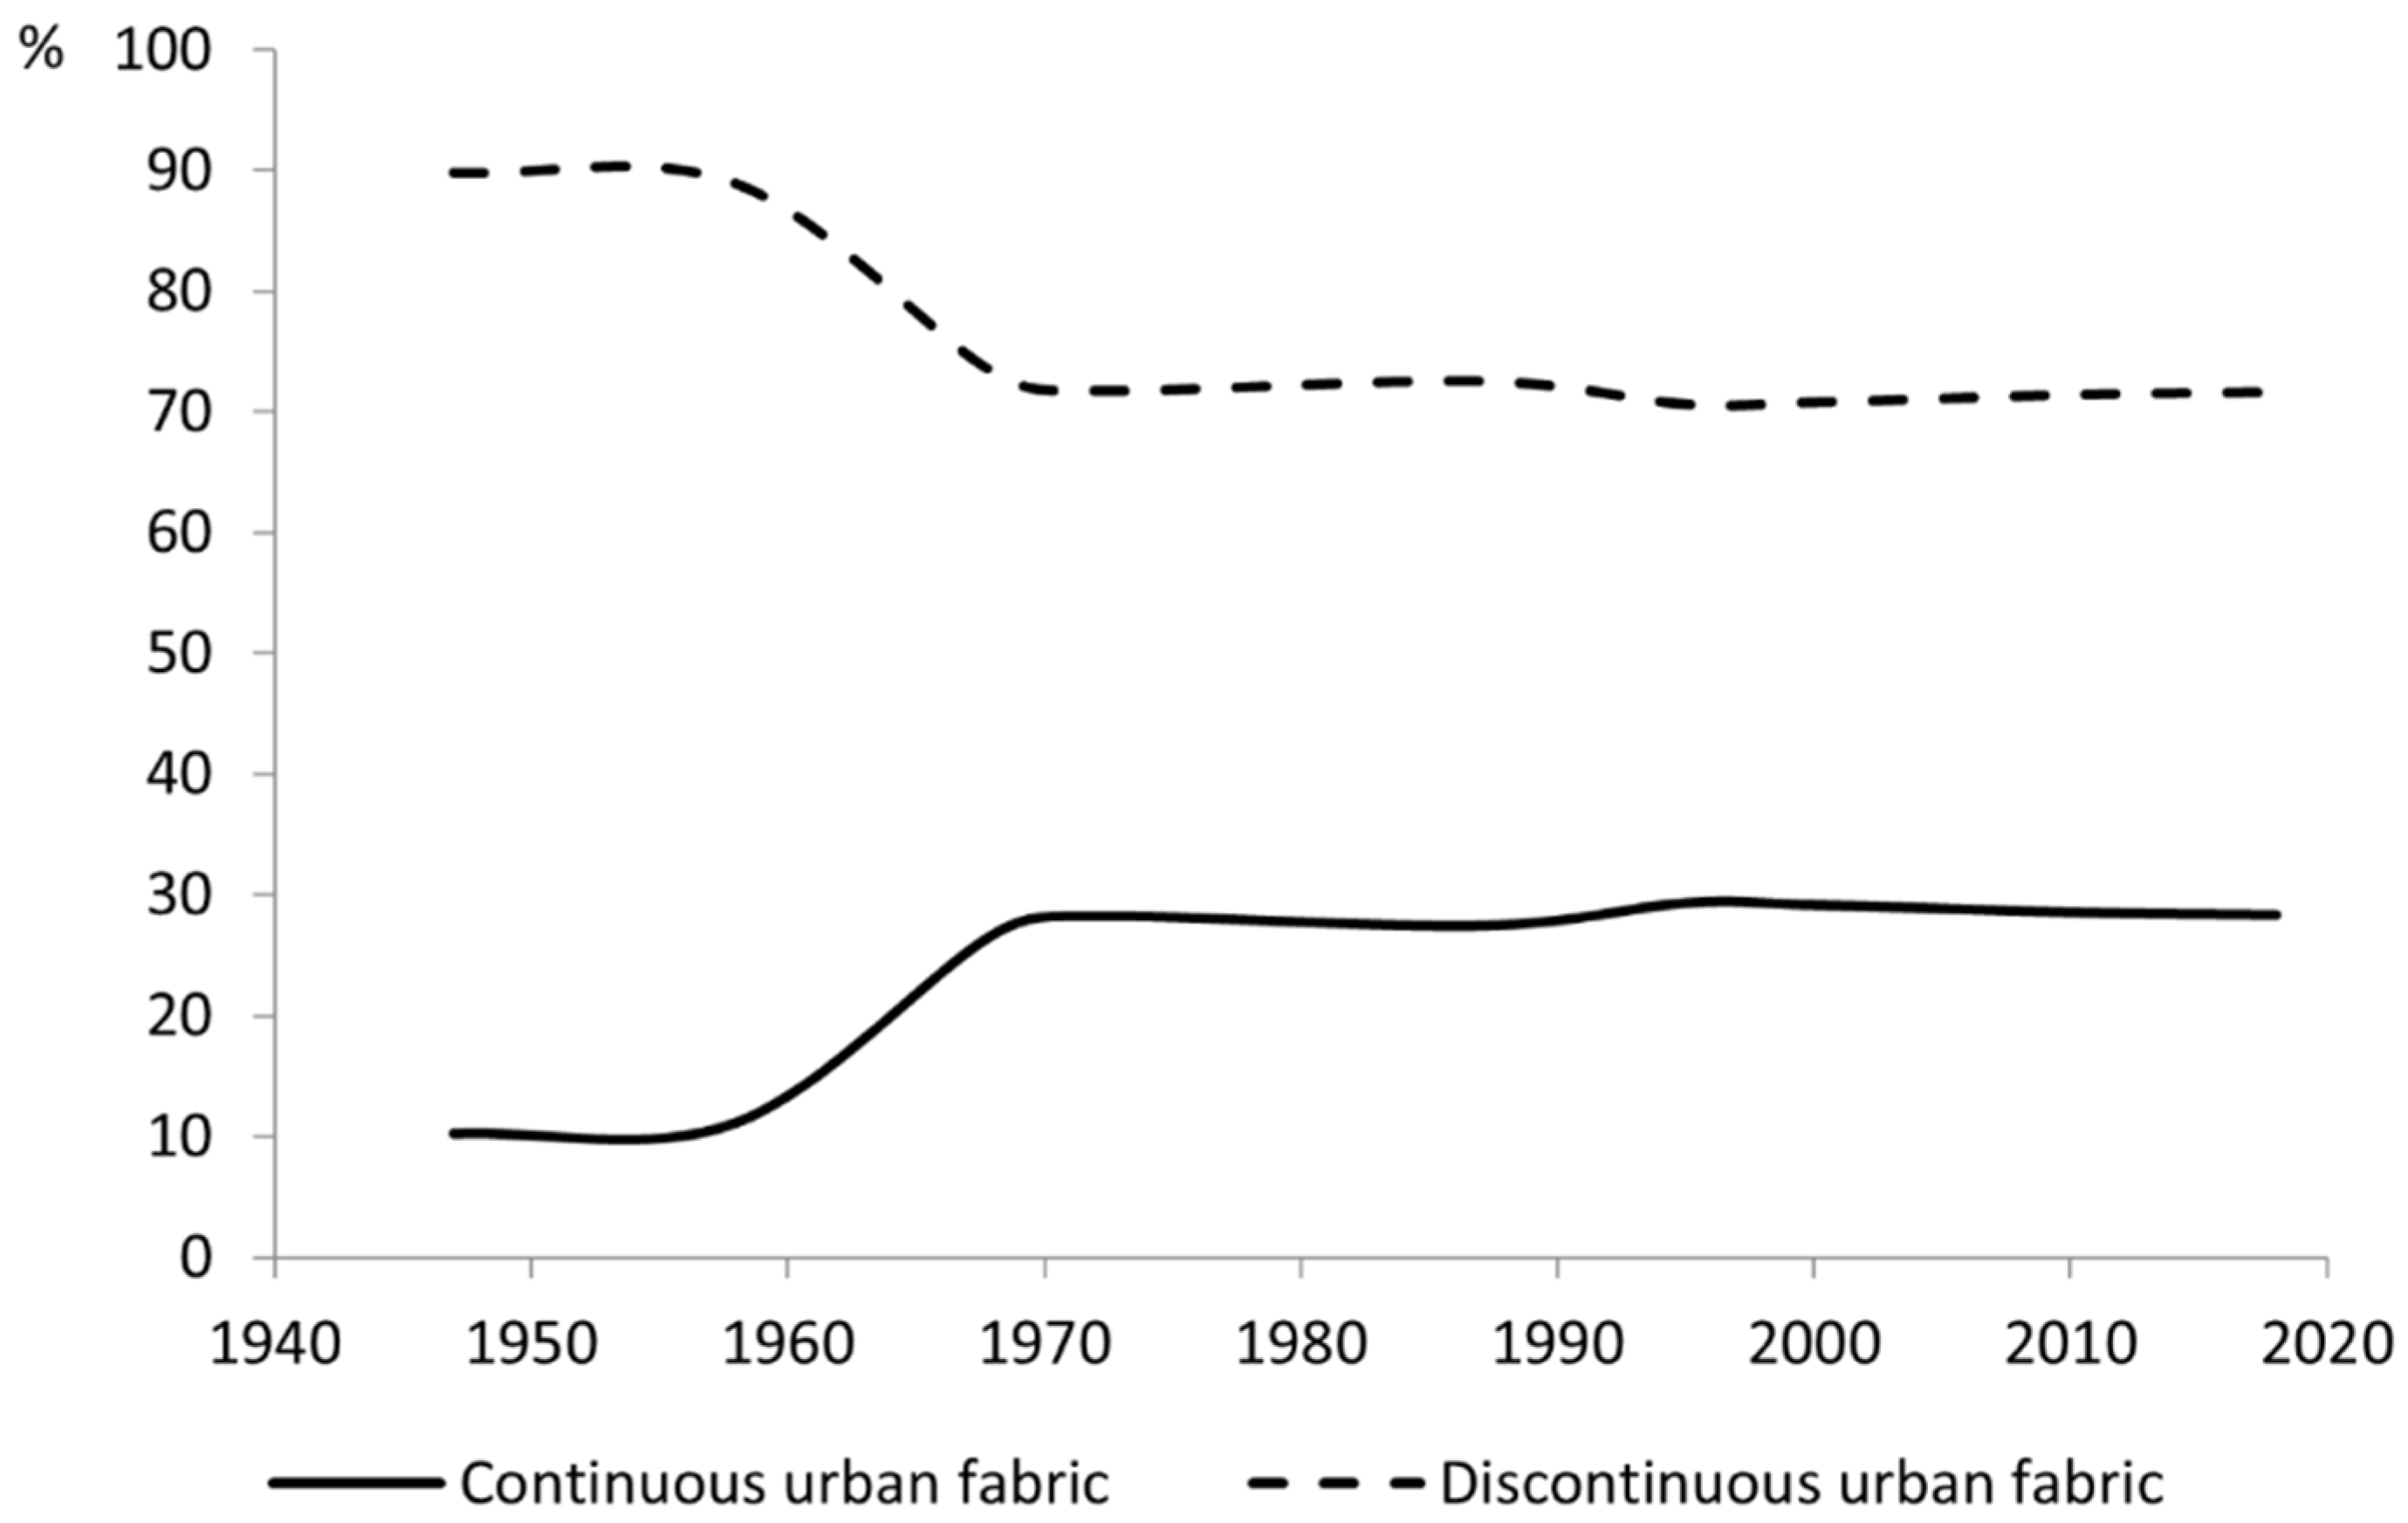
We can see from Figure 5 and Table A2 (Appendix A) that discontinuous urban fabric was dominant over the 71-year study period. Between the late 1940s and 2018, on average, 76% of all new residential areas were discontinuous. The dynamic of residential areas during the study period reveals two key characteristics of these areas. On the one hand, it shows a trend towards the growth of less intensive residential areas, and on the other hand, the rapid growth rhythm of discontinuous urban fabric is a clear evidence of urban sprawl. This observation can be supported by analysing and combining population data with the previously explored land-use data.
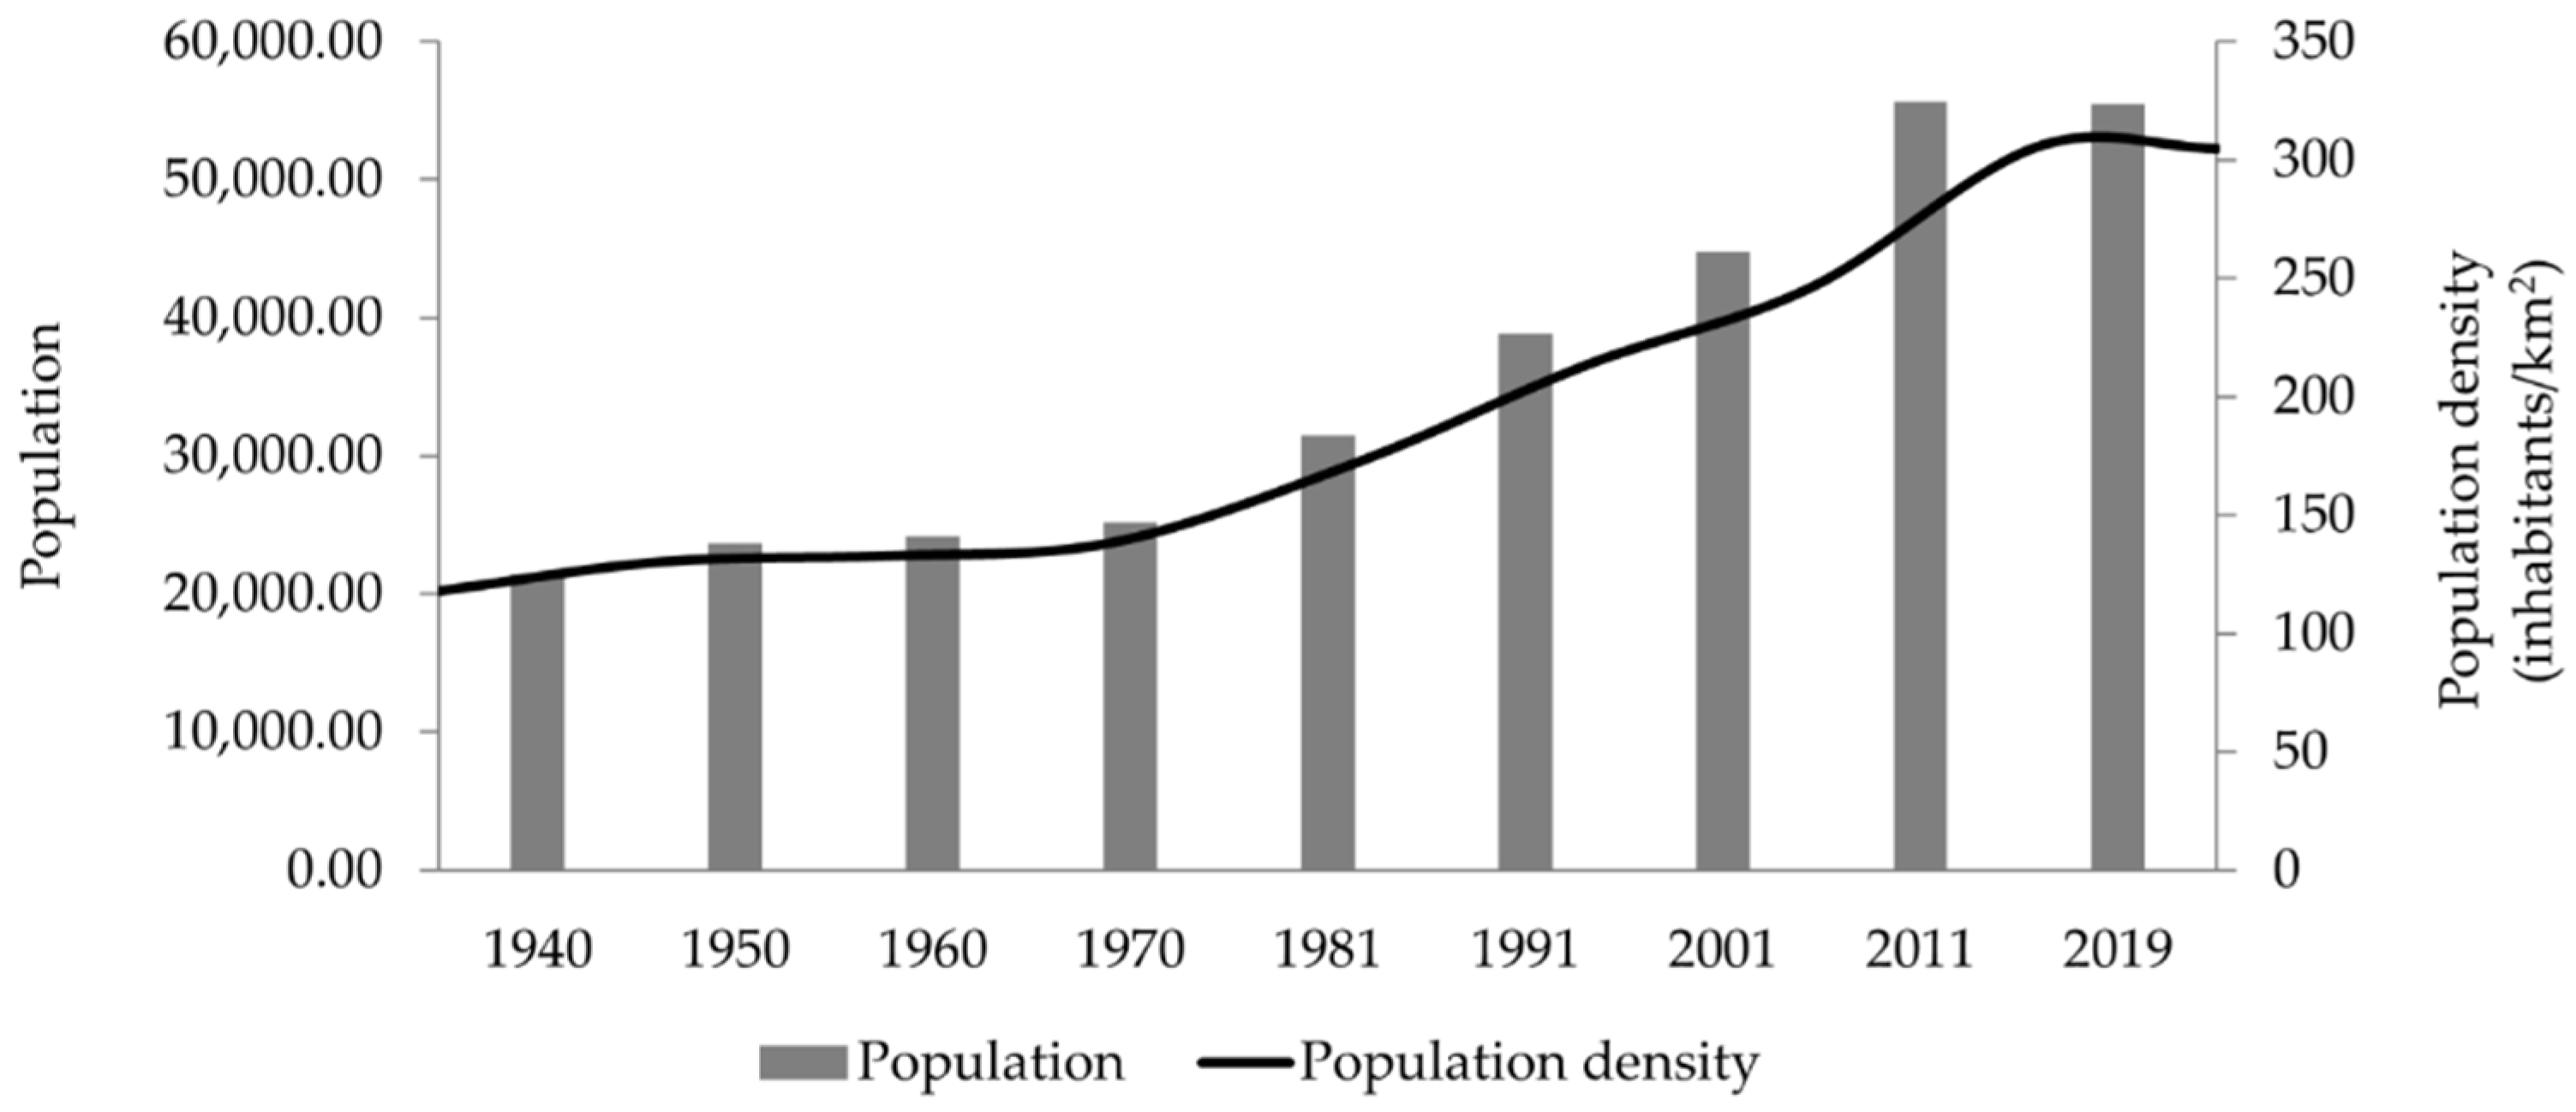
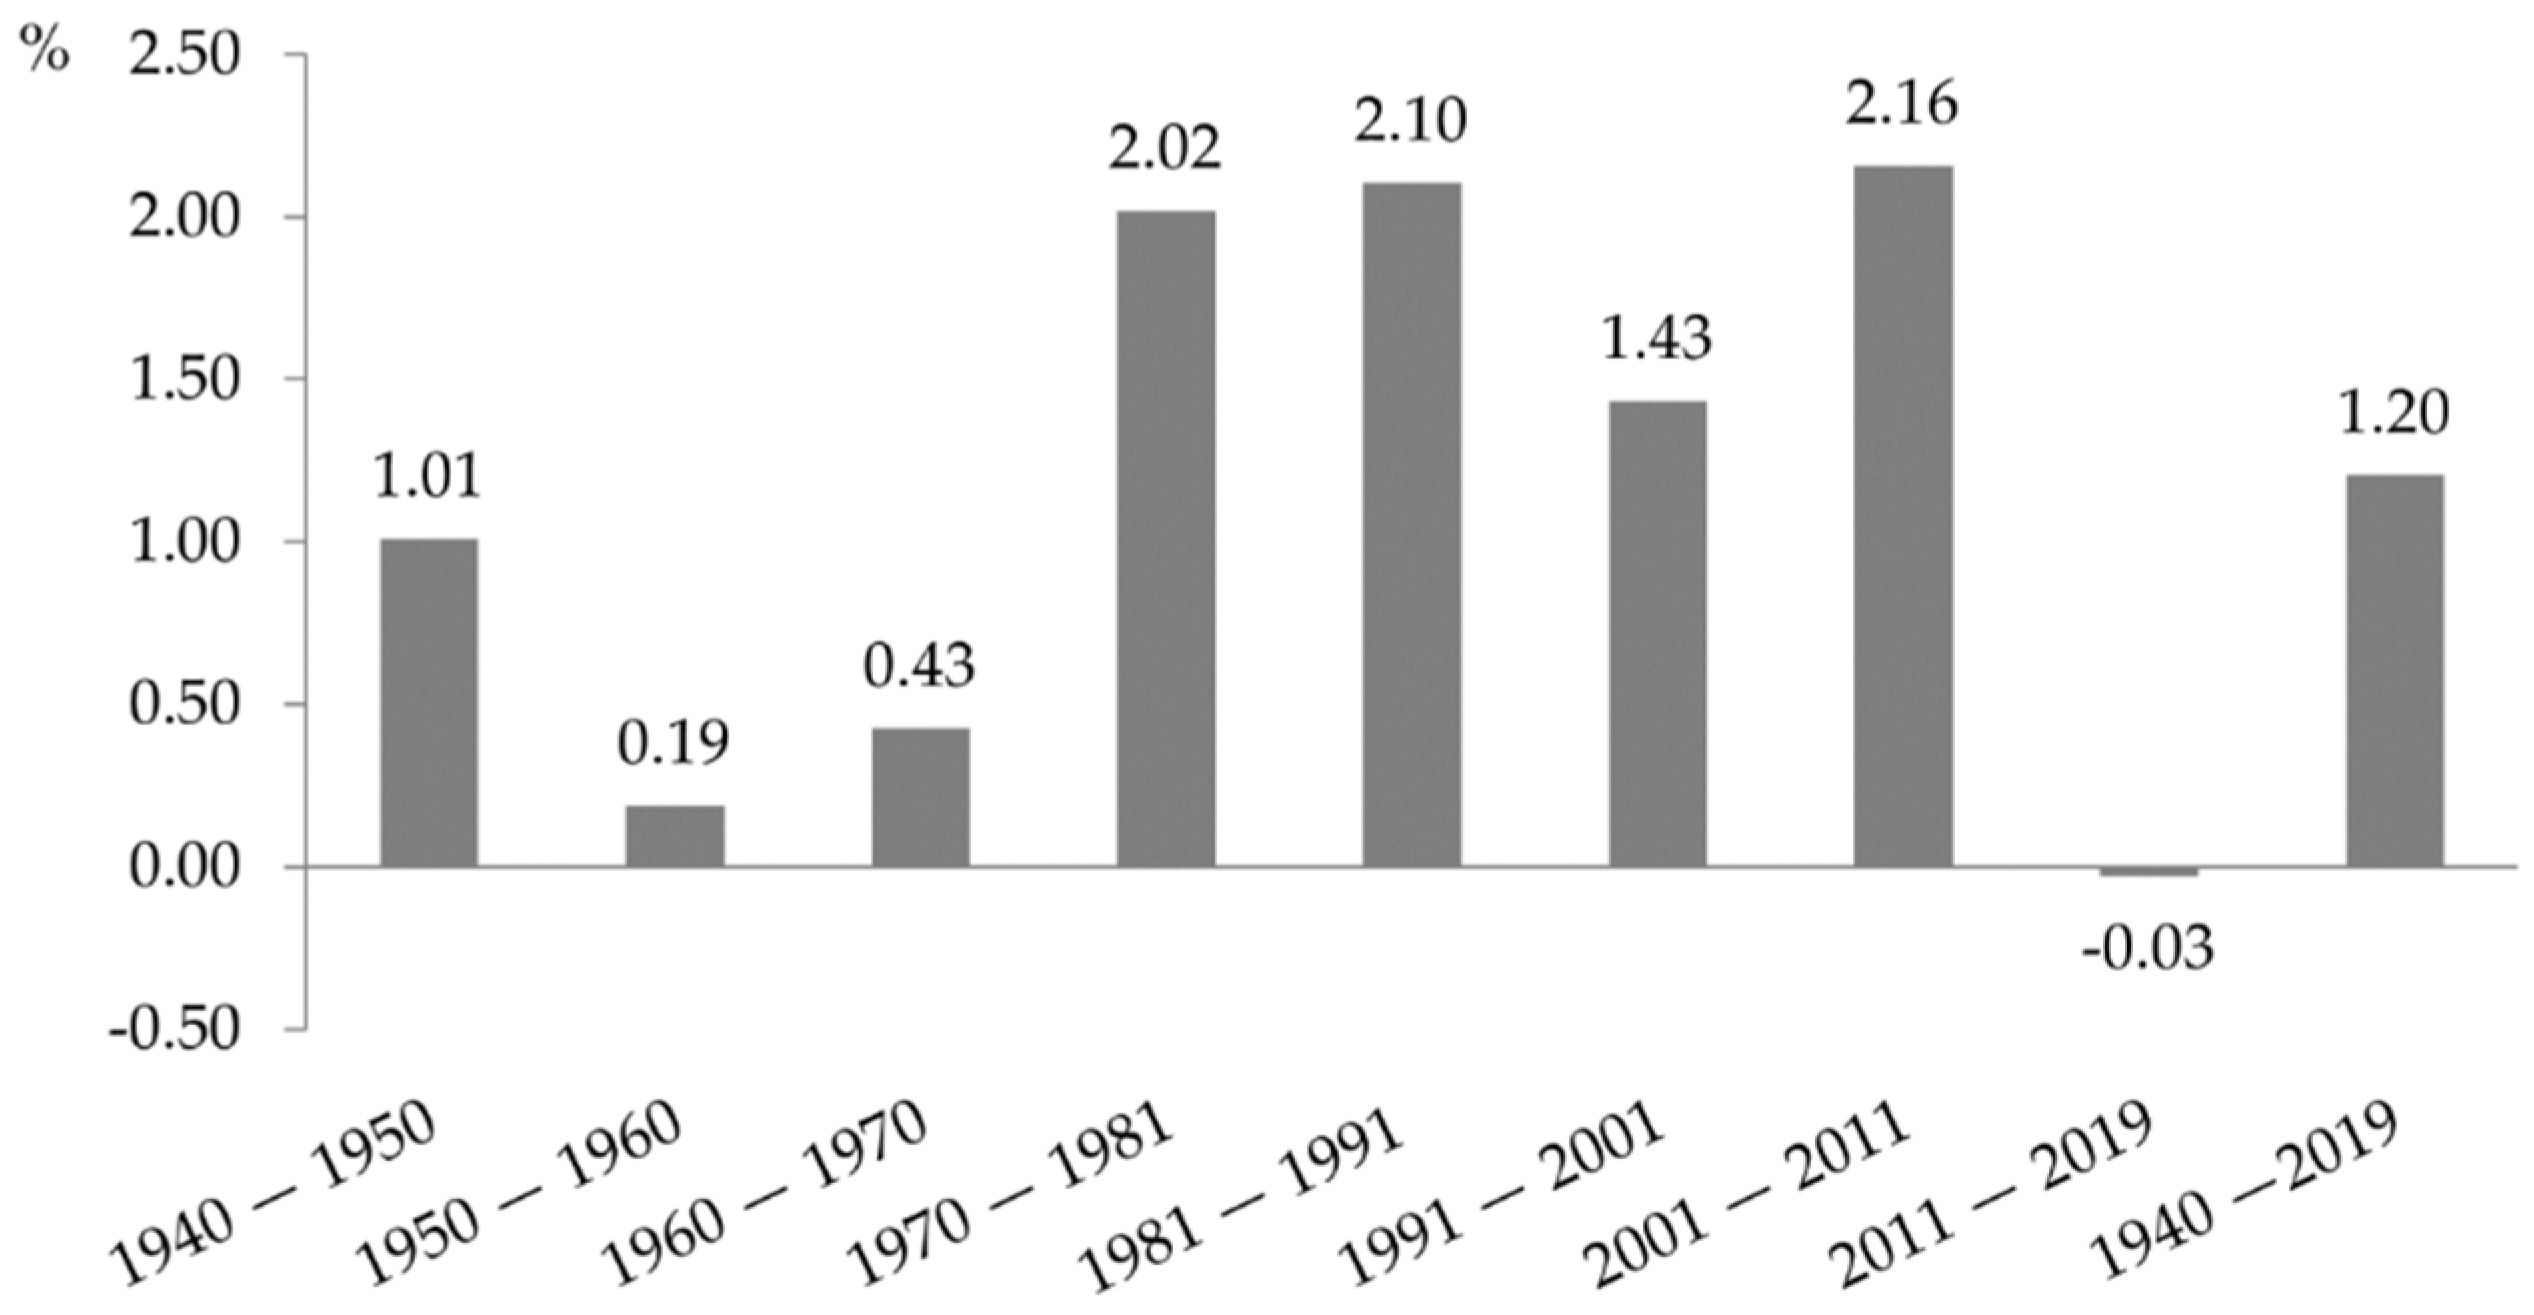
As shown in Figure 6, both population and population density in Portimão increased until the 2001–2011 period. However, the financial crisis led to a downward trend in both the population and the LULC area growth rates, and population density in the last temporal period under analysis and, thus, to a decline in land consumption. Since the 1970s, the population has grown considerably, and the population density has tripled during the study period. A careful analysis of Figure 7 and Table 3 shows that the growth rate of artificial surfaces has outstripped the rate of population growth during the study period. This suggests that consumption of land per inhabitant has increased remarkably, which may confirm that the study area has been facing early and intensive fragmented urban land-cover dynamics [6,58].
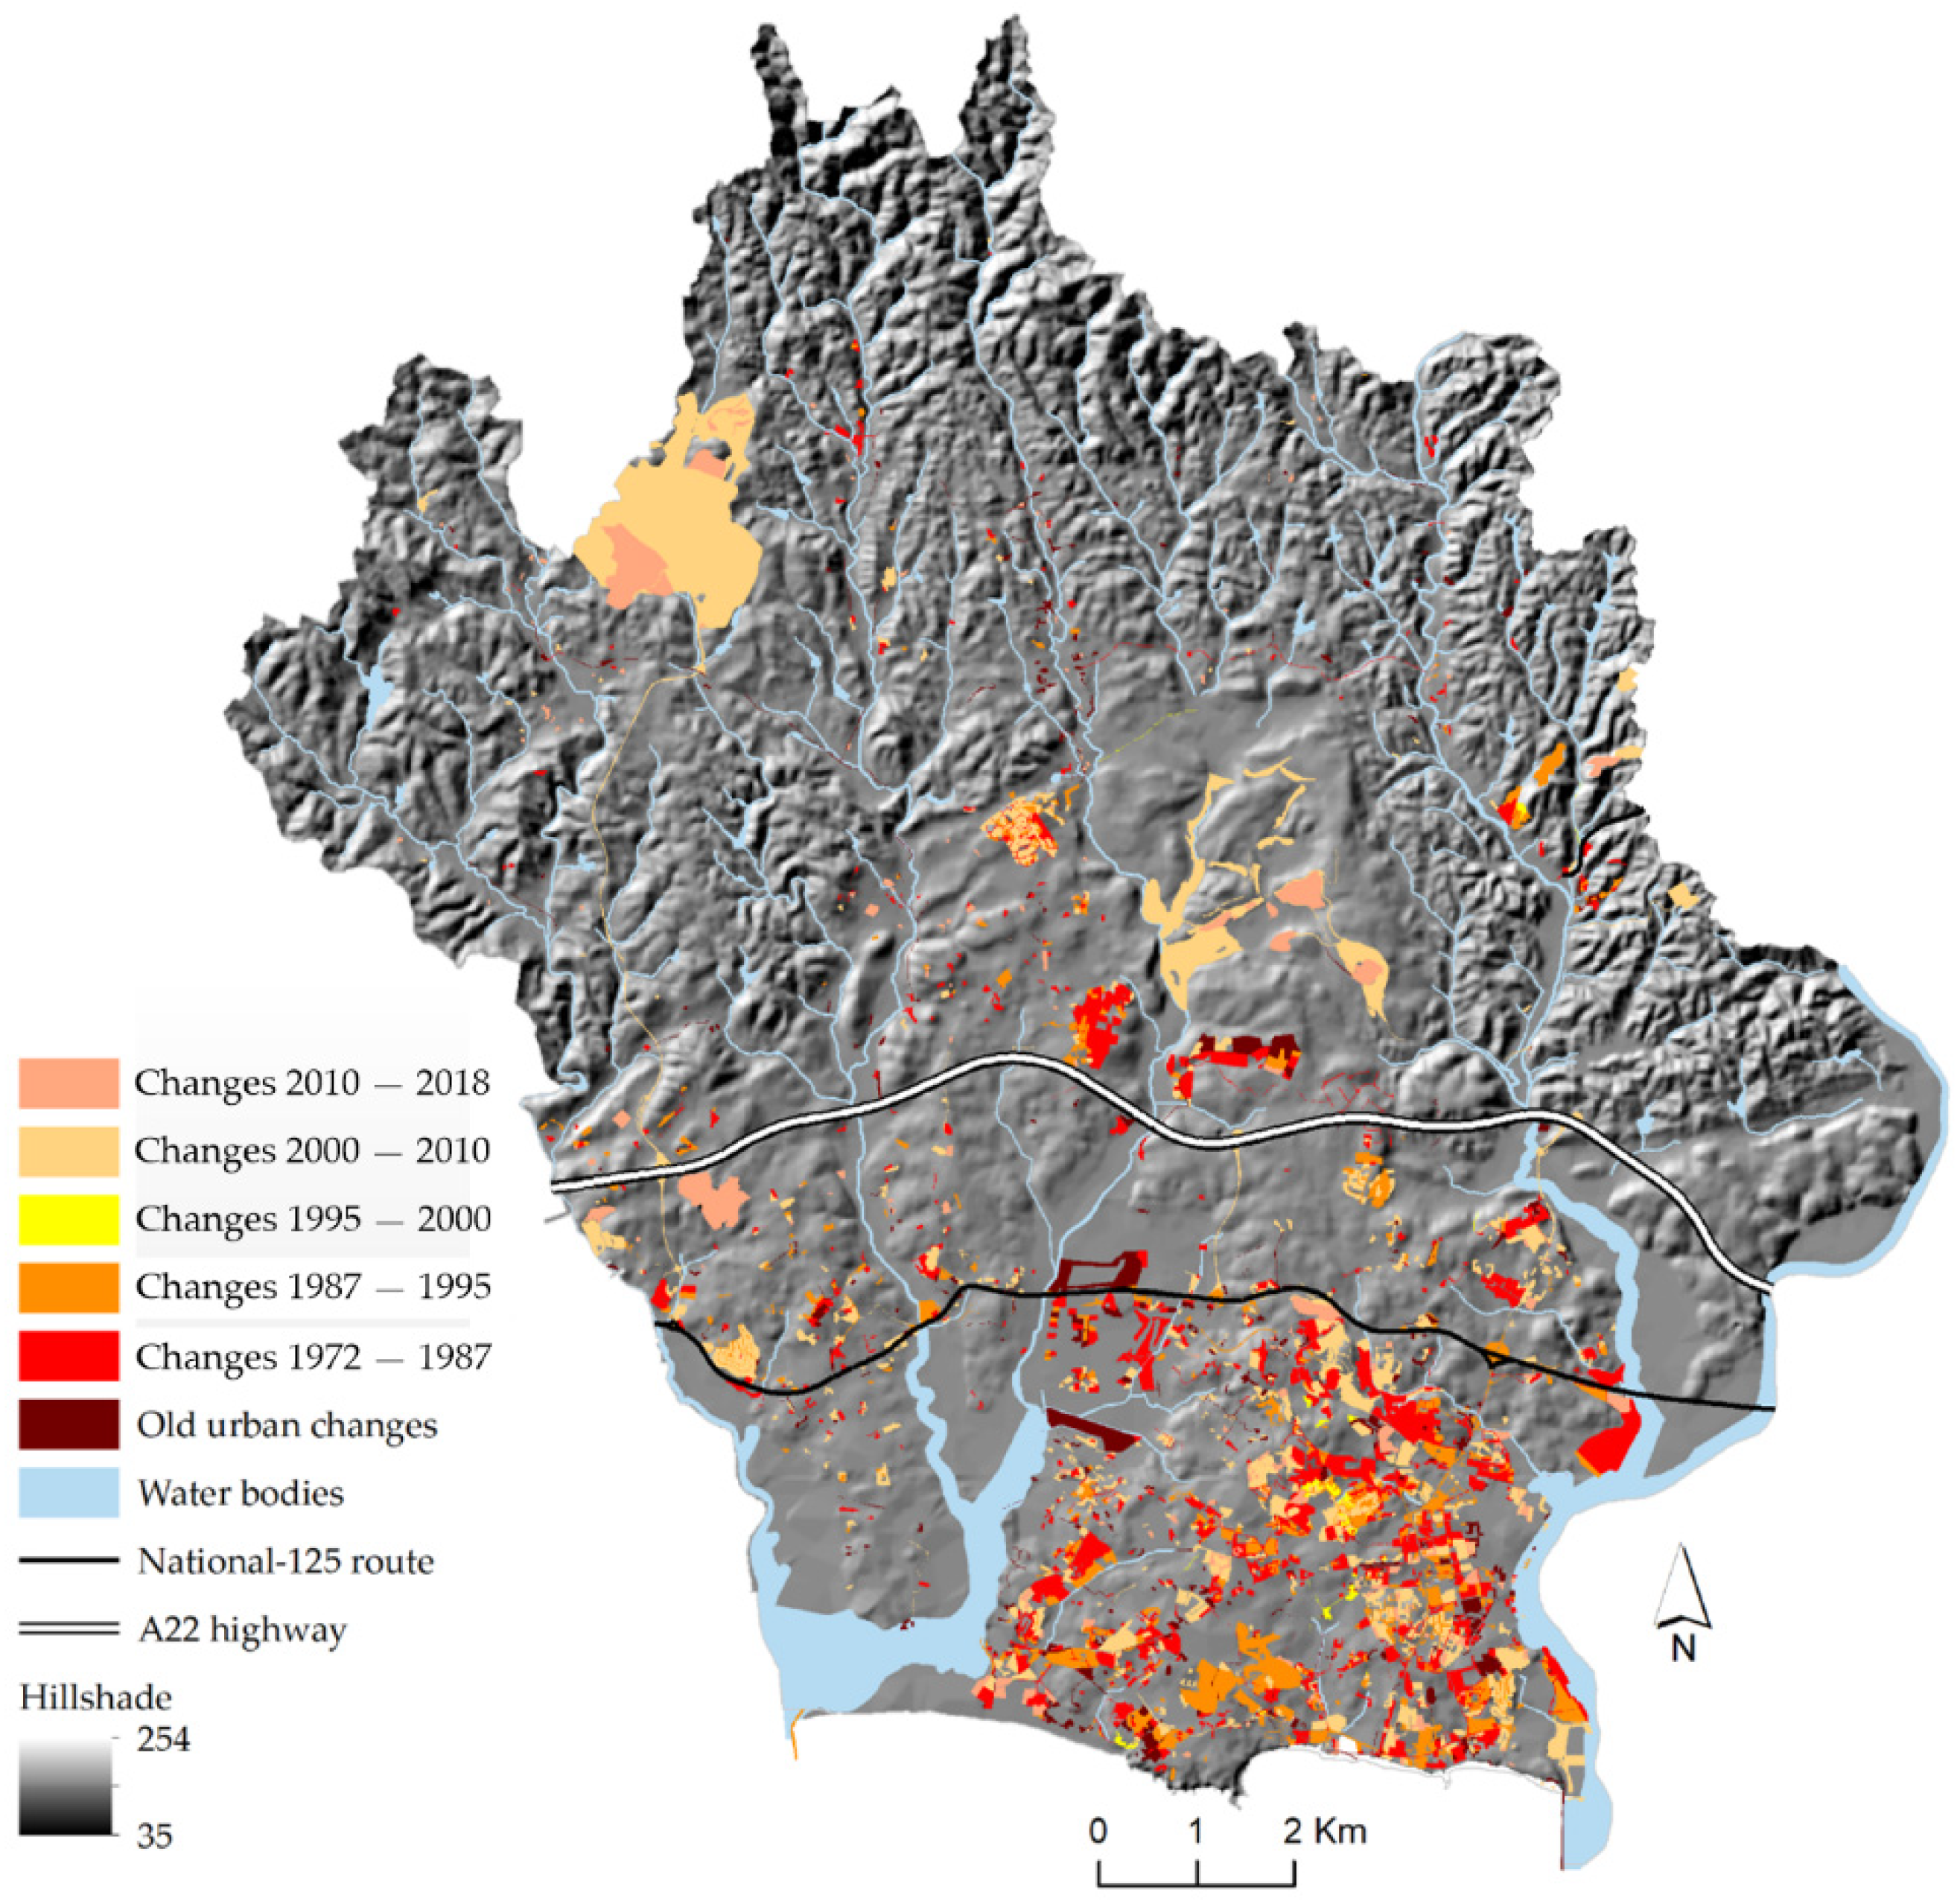
The urban land-cover difference map that illustrates urban change in Portimão spatially by temporal period is presented in Figure 8. The analysis of this map confirms a massive growth in artificial surfaces near the main urban settlements and along the coastal area, but most importantly it reveals the dispersed urban growth over time beyond the national-125 route, which had functioned as Portimão’s northern city boundary for a long time, and the A22 highway network built in 2001. In the early study periods, this urban development did not occur beyond those physical barriers, which is quite different from what is taking place currently. Figure 8 also reveals that urban dynamics occurred along the road network towards both the northwest and northeast parts of the municipality.
4.3. Analysis Based on the LULC Change Trajectory Pattern (1947–2018)
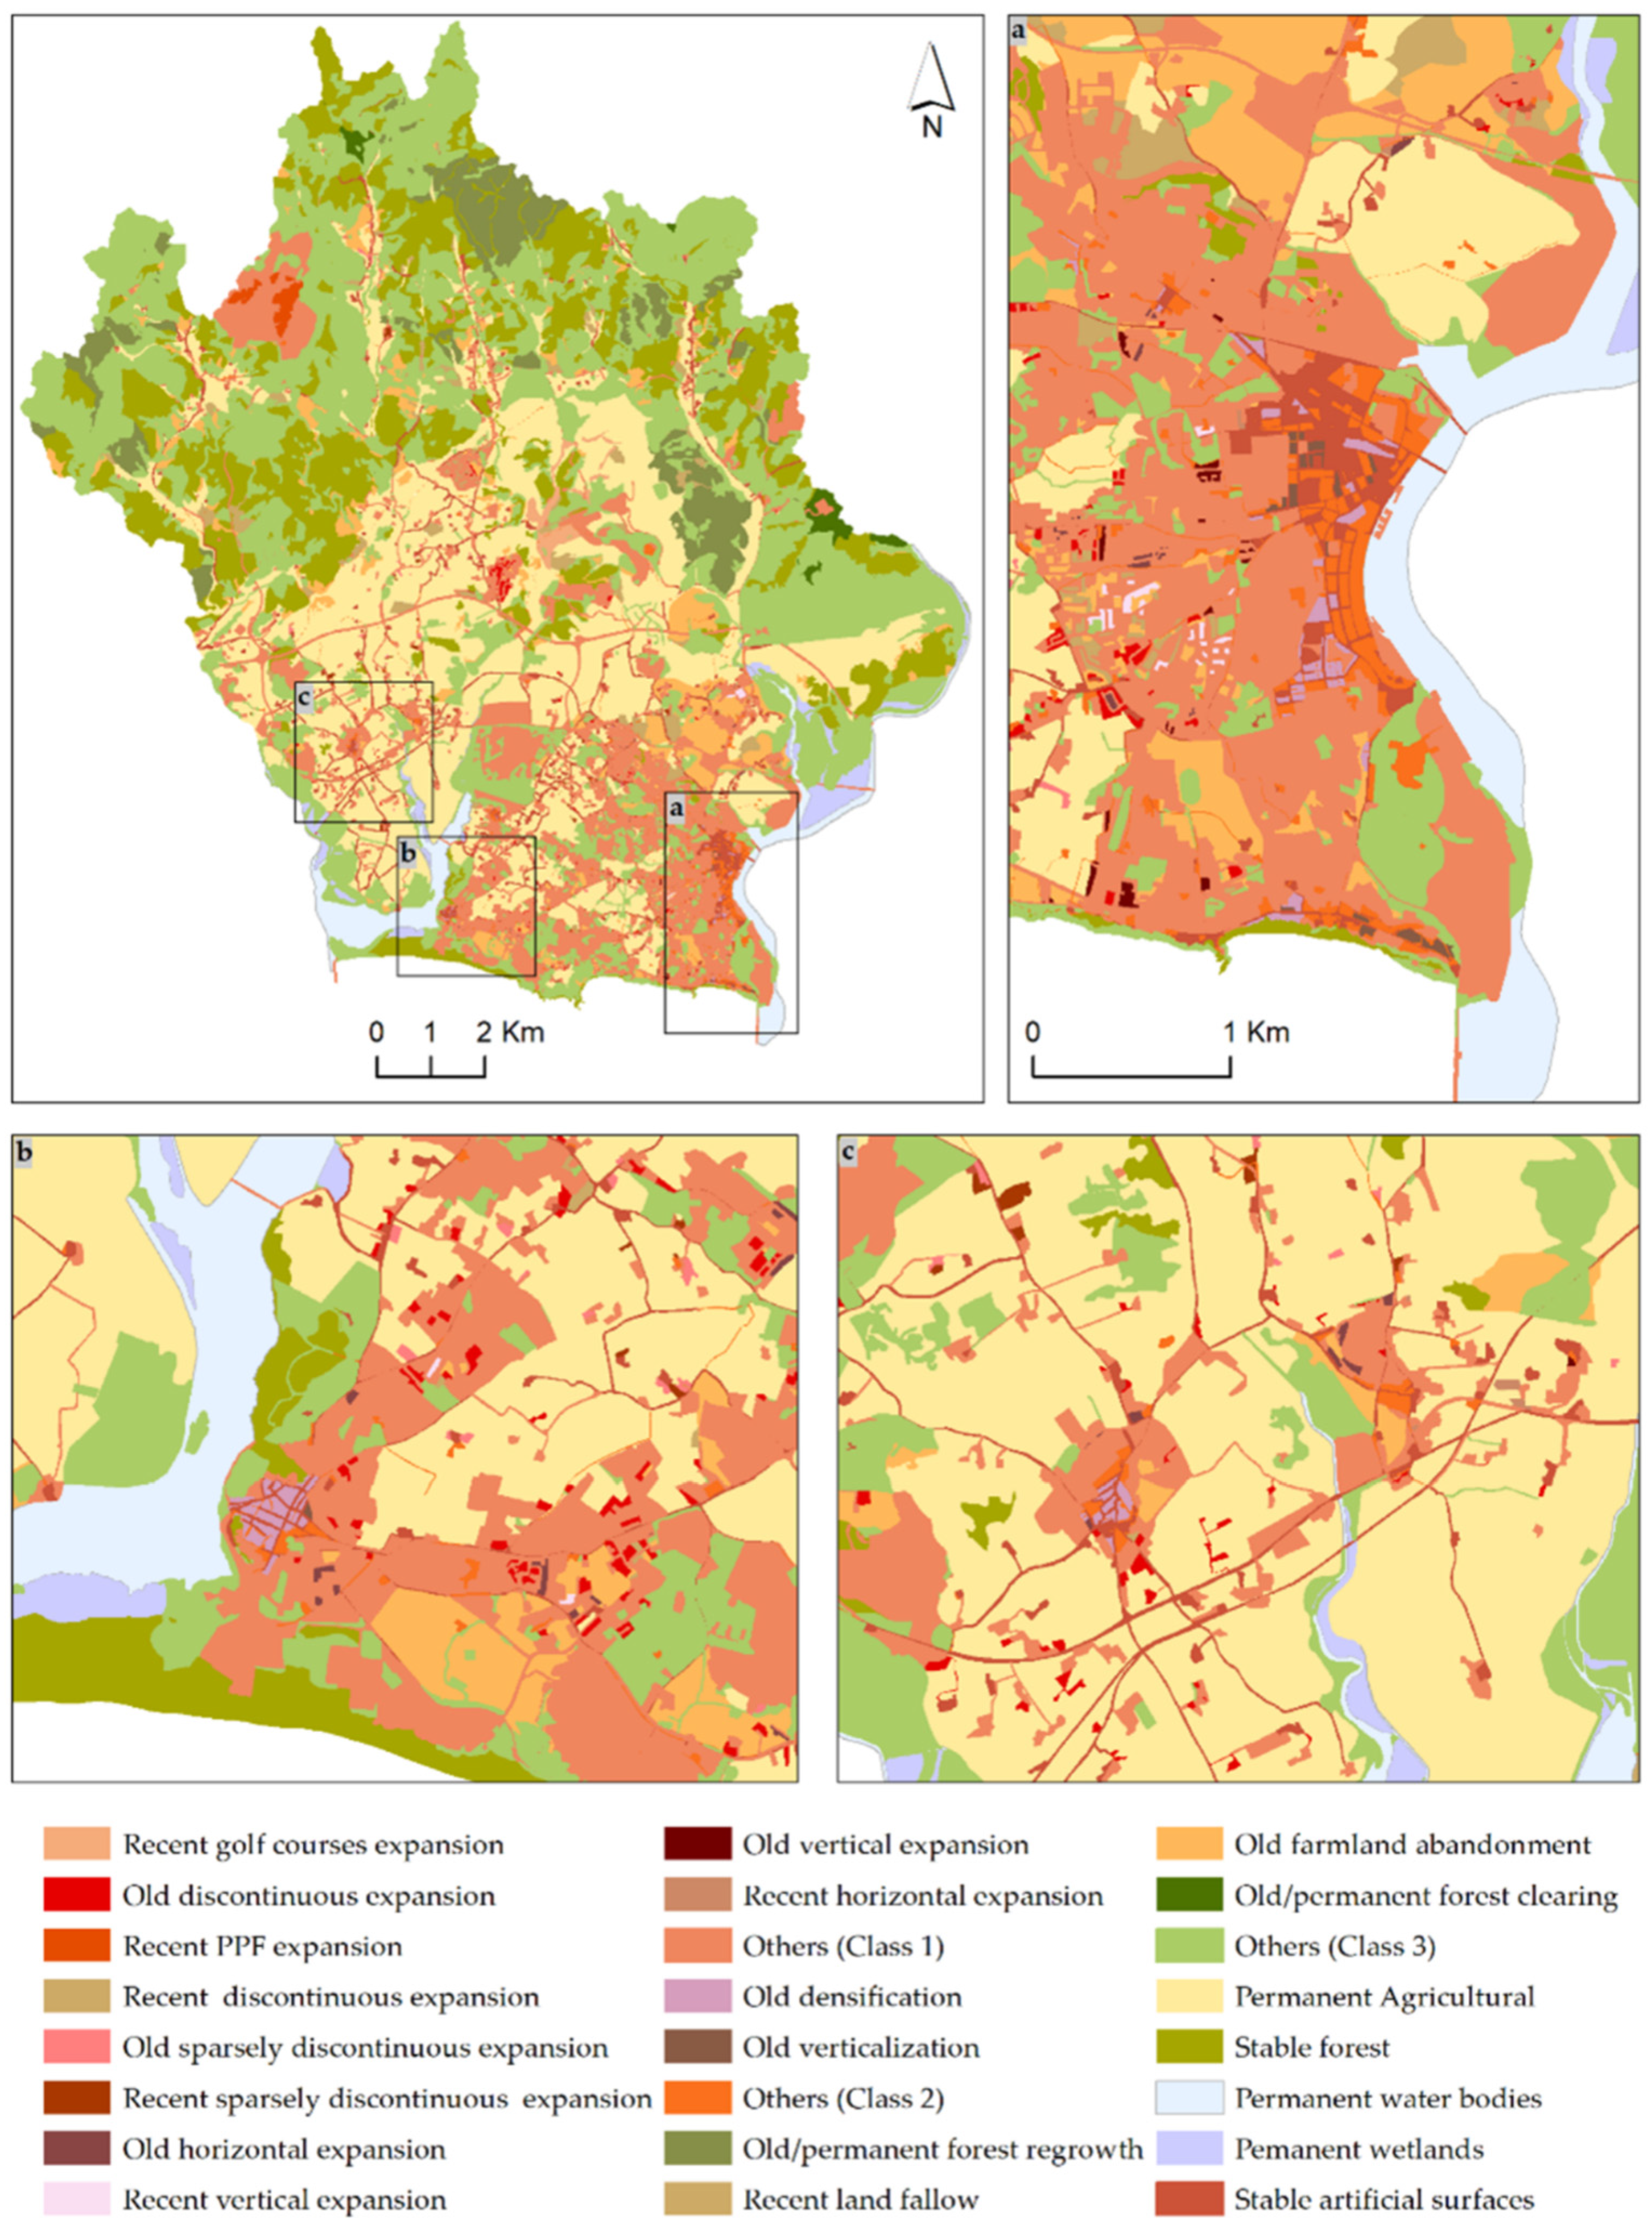
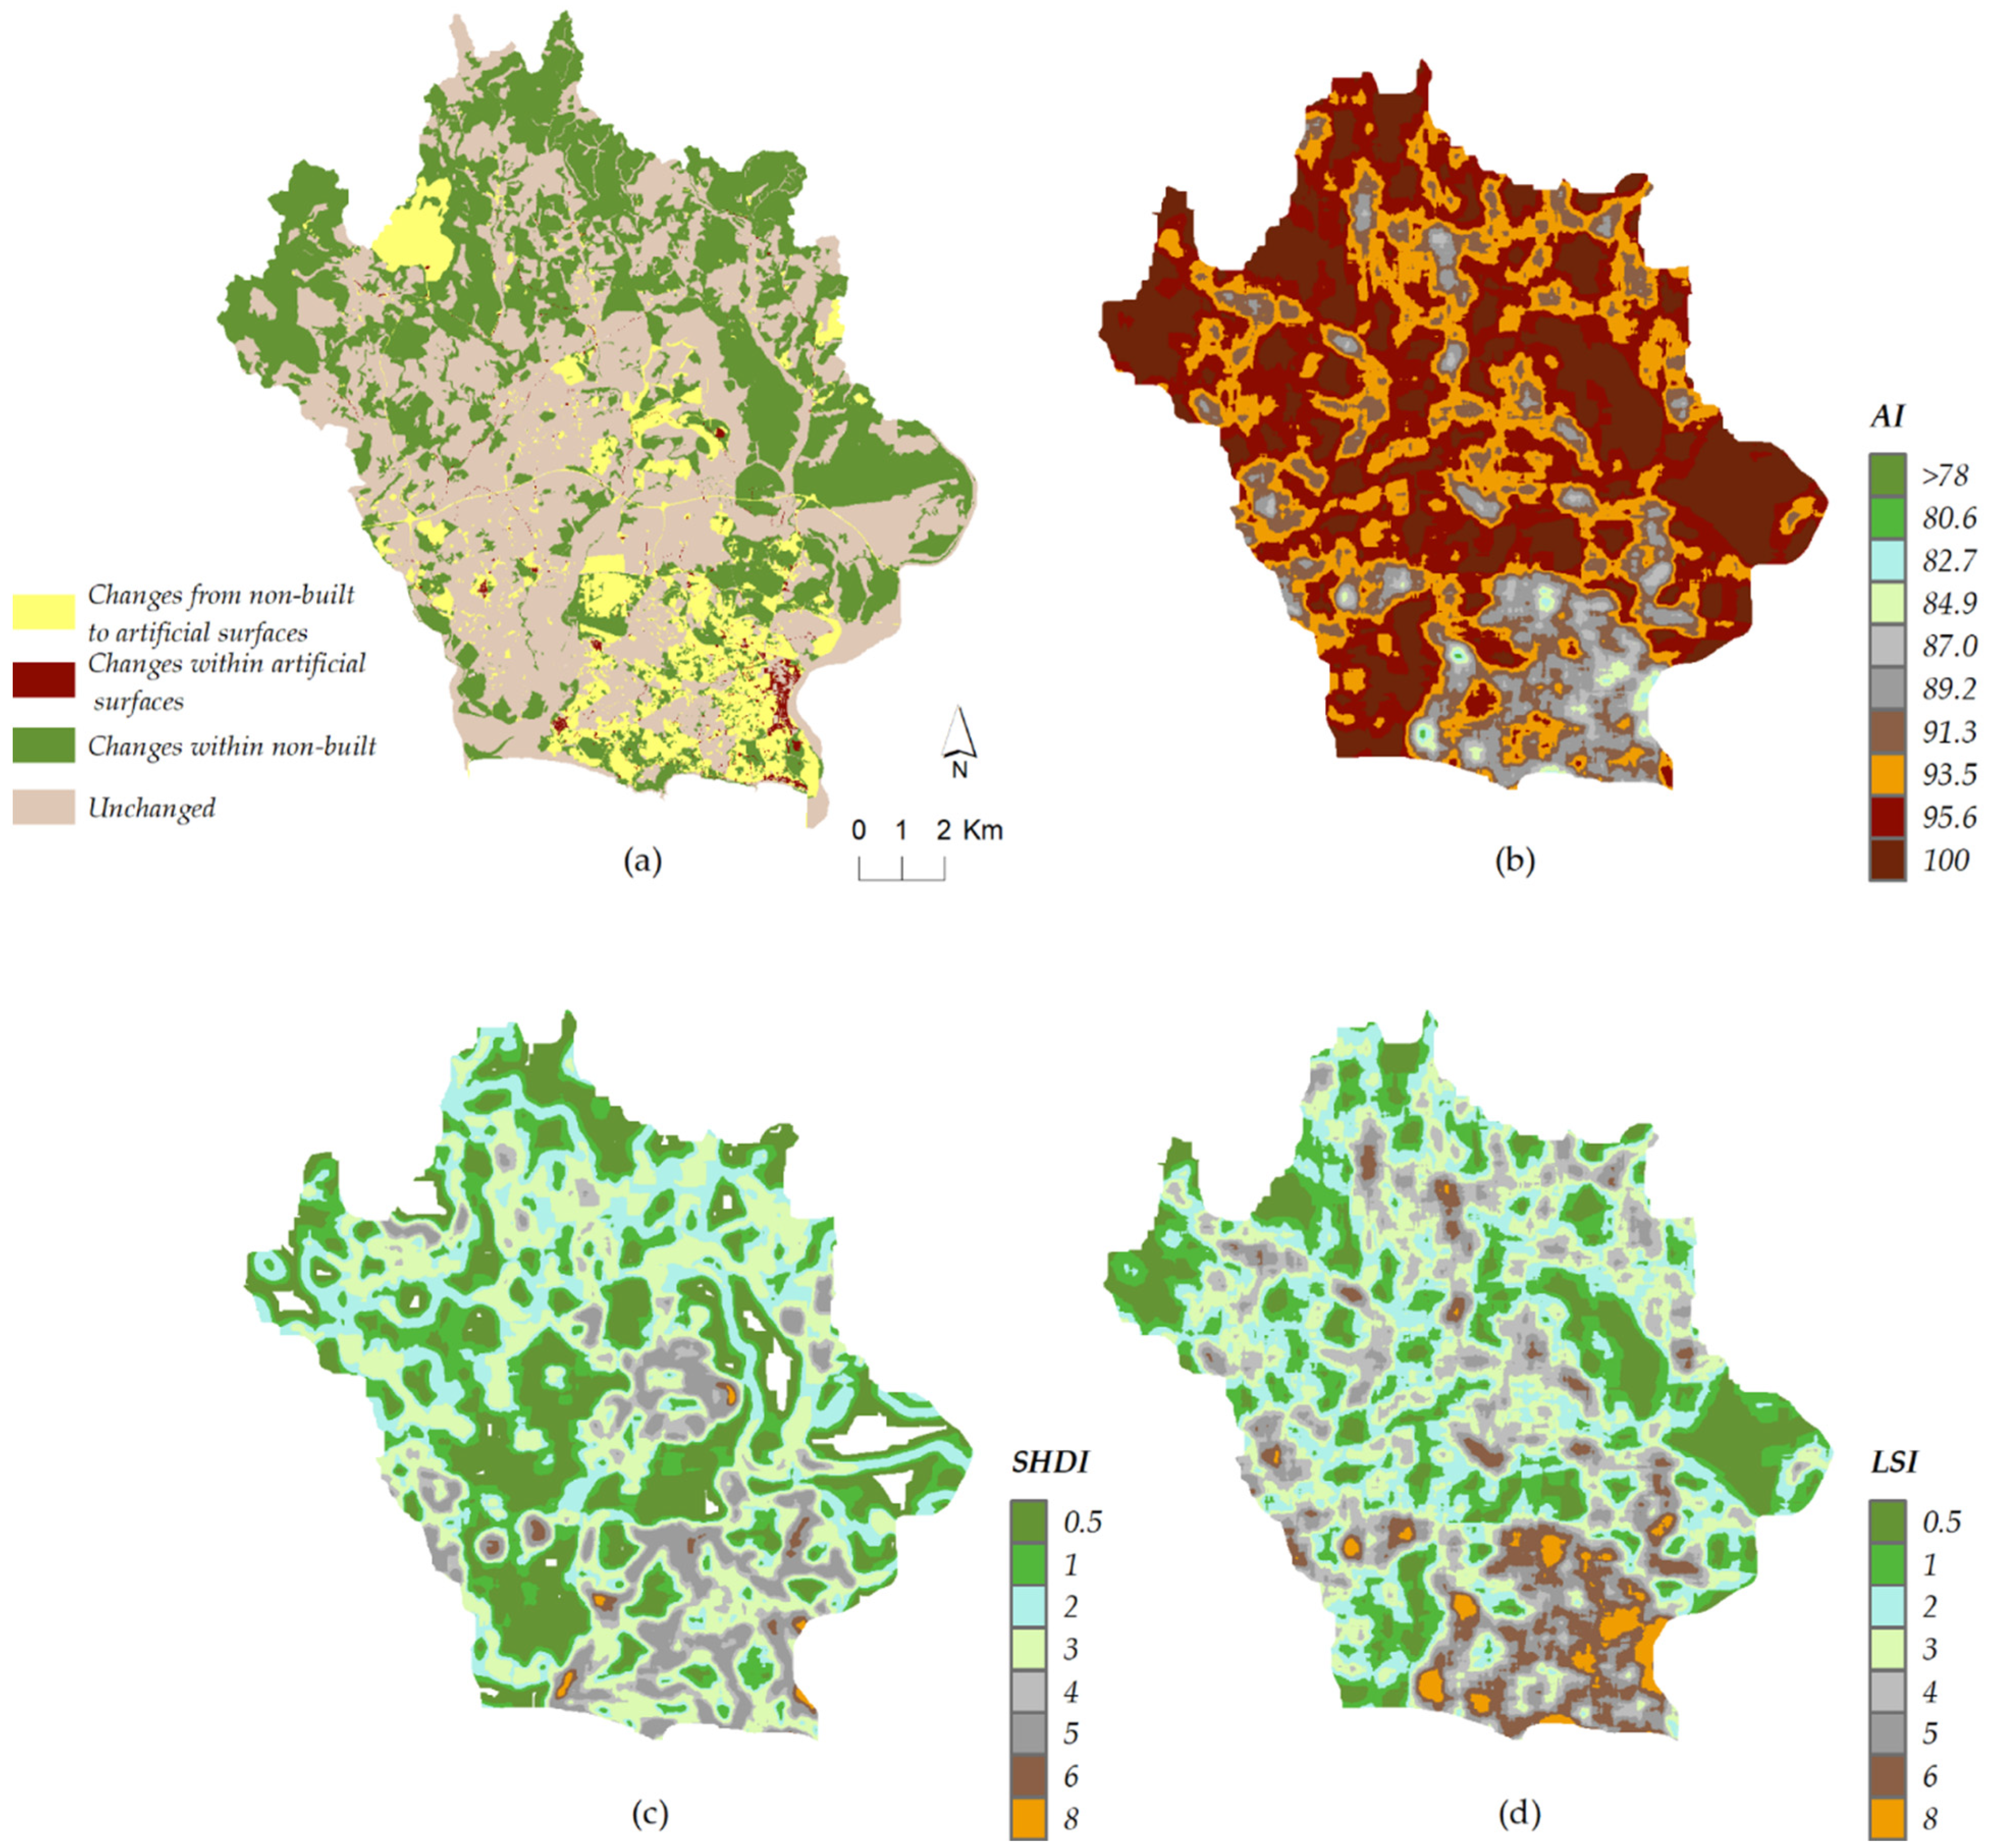
The dominant LULC change trajectories in Portimão are presented in Table 4 with area (ha), area percentages, and their interpretation. Figure 9 shows the emergent spatial patterns of those LULC change trajectories. Results of the LULC change trajectories aggregated at the class level are presented in Figure 10a.
The analysis of Table 4 shows that unchanged trajectories (class 4) represented 48.5% of Portimão’s landscape during the study period. Therefore, nearly 52% of the study area has undergone an LULC change at least once over the 71-year study period. This reveals that changes in LULC were quite meaningful and highlights the highly dynamic nature of LULC changes in the coastal area of Portimão.
The analysis of LULC change trajectories between non-built categories (class 3) shows that they prevailed in the landscape over the study period (with 38.65% of the total area). In this class, the primary LULC sequences were from shrubland to forestland and have remained in the forest category since 1995 (with 3.2% of the total area), representing the old and permanent forest regrowth. Changes between agricultural land and shrubland accounted for 6.26% of the study area (both rapid and progressive changes from agricultural land to shrubland), which reveals the recent conversion into fallow and old farmland abandonment. Such results provide further evidence that Portimão is gearing towards more critical and unbalanced LULC change trajectories. Earlier changes (1968) from forestland to shrubland have transformed only 0.51% of the study area in the study period, corresponding to the old and permanent forest clearing. Figure 9 shows that changes between non-built categories have spatially developed predominantly further away from the main urban settlements. However, these LULC change trajectories are also found near the coastal area and at the edge of converted non-built areas to artificial surfaces (class 1). This suggests that such locations may be converted to artificial surfaces in the near future.
The analysis of Table 4 also indicates that non-built areas changed into artificial surfaces in a proportion of 12% of the total area between 1947 and 2018. In this class, the most significant trajectories of change involved (1) the decrease in agricultural land cover, with recent urban expansion based on golf courses (with 0.38% of the total area); (2) the decrease in agricultural land cover, with both old and recent urban expansion based on discontinuous urban fabric (with 0.36% and 0.21% of the total area, respectively); (3) the decrease in shrubland and forestland covers, with recent urban expansion based on public and private facilities (with 0.24% of the total area); and (4) the decrease in agricultural land cover, with old urban expansion based on sparse discontinuous urban fabric (with 0.17% of the total area). These results clearly indicate a relevant influence of tourism in the LULC change process of Portimão. Additionally, these LULC change trajectories from non-built areas to artificial surfaces are most often irreversible, which is detrimental to sustainability. Figure 9 displays the spatial pattern of LULC change trajectories from non-built areas to artificial surfaces, which significantly shows a pattern of expansion diffusion in the fringes of existing urban areas.
LULC change trajectories between artificial surface categories (class 2) represented about 0.84% of the total study area during the study period. Changes from discontinuous urban fabric to both horizontal urban fabric (with 0.12% of the total area) and vertical urban fabric (with 0.03% of the total area) are dominant in this class. These trajectories correspond to both progressive urban densification and high-rise building increase in previously discontinuous urban areas. The analysis of their spatial pattern (Figure 9) shows that changes between artificial surfaces are generally located near the main urban settlements and along the coastal area.
Table 5 lists the results of the computed class-level spatial pattern metrics on LULC change trajectories. Measured by FRAC_AM and ED, both ‘all changes from non-built to artificial surfaces’ and ‘all changes between artificial surface categories’ with 1.347 and 1.255, respectively, showed more complex shaped patches in all four classes. This might indicate that more complex and fragmented shapes emerged when patches of land were converted from non-built categories to artificial surface categories (e.g., recent discontinuous expansion trajectory) and within artificial surface categories (e.g., old densification trajectory). Yet, the high values of ED for ‘all changes within non-built’, particularly for the old farmland abandonment trajectory (with a value of 10.032), also reveal the growing spatial complexity of these trajectories over the study period. Therefore, such results provide further indication of the past and current unsustainable direction of LULC change and urban growth in Portimão.
Results for LPI clearly corroborate the process of urban landscape fragmentation of the study area as indicated by the SPLIT metric. The analysis of LPI values of the LULC change trajectories individually shows that ‘Permanent agricultural land’ had the highest value of LPI (at 4.844). From 1947 to 2018, the lower LPI values and the higher SPLIT values are associated with LULC trajectories of both class 1 (particularly, the ‘Recent horizontal expansion’ at 0.001 and 995,567,796.829, respectively) and class 2. This shows that patches that are smaller, isolated, and less aggregated to the existing largest patch occurred when lands were converted from non-built categories to artificial surface categories and within artificial surface categories over the 1947–2018 period.
Table 5 shows that the highest value of ENN_MN during the study period concerns the ‘recent horizontal expansion’ trajectory (at 811.381). This implies that from 2010 to 2018, artificial surfaces based on continuous horizontal urban fabric category were developed far from existing locations of the same LULC category. Figure 9 confirms that these artificial surfaces were developed in municipality-planned areas located in the northern part of Portimão.
The results of nLSI reveal that LULC change trajectories present quite different levels of spatial aggregation. In general, when contiguous patches of both LULC change trajectories from ‘all changes between non-built categories’ and unchanged trajectories are merged they have higher levels of aggregation. A careful analysis of the nLSI values of the LULC change trajectories individually shows that permanent agricultural land, stable forestland, permanent water bodies, and permanent wetland trajectories have minimum nLSI values and considerably less than the LULC change trajectories that involved conversions between non-built surfaces and artificial surfaces or within artificial surfaces. The high values of nLSI of ‘old horizontal urban fabric expansion’ and ‘old sparse discontinuous urban fabric expansion’ confirm their highly dispersed and disaggregated spatial pattern over the study period. Also interesting is the fact that the nLSI of ‘recent public and private facilities expansion’ and ‘recent golf courses expansion’ is 0.037 and 0.065, respectively, which are the smallest values among the main LULC change trajectories of class 1. This suggests that these trajectories exhibited a relatively more concentrated spatial pattern.
The stable trajectories presented the lower value of IJI among all four classes (with a value of 78.859). This means that these trajectories tended to spatially associate with each other and thus are less contiguous to other trajectory types. LULC change trajectories between non-built categories and LULC change trajectories between non-built and artificial surface categories generally exhibited higher IJI when compared to ‘old verticalization’ (with a value of 37.774) and ‘old densification’ (with a value of 40.032). This is so because LULC change trajectories between non-built categories and artificial surface categories and LULC change trajectories between non-built categories (particularly, ‘recent land fallow’ and ‘old farmland abandonment’) typically represent the intermixed areas [40] between natural and rural land-cover categories and urban land-cover categories.
The spatial distribution of landscape-level spatial pattern metrics is displayed in Figure 10b–d. AI, LSI, and SHDI were applied to interpret the general spatial patterns of all LULC change trajectories aggregated at the class level (Figure 10a). We can see from Figure 10 that the values of AI (>93.5) for the northern and western Portimão were higher than those of LSI (<1) and SHDI (<1) over the study period. Both LSI and SHDI show very similar spatial patterns contrary to that of AI. For ‘all changes within non-built surfaces’ and stable trajectories, the high values of AI and low values of LSI and SHDI show that the landscape of this area of Portimão became more homogeneous during the study period as most of the patches plugged into larger existing units. The high LSI and SHDI and low AI of most LULC change trajectories between artificial surface categories and LULC change trajectories between non-built surfaces and artificial surface categories reveal the increase of small, dispersed patches, when agricultural land and forestland were converted into artificial surfaces. It also indicates the fragmentation of urban landscape as the prevalent land cover (agricultural land and forestland) regularly declined during the study period. The high LSI and SHDI of these LULC change trajectories might be important evidence of anthropogenic disturbance on landscape structure, corroborating their trend towards unsustainability. The increase of the urban sprawl phenomenon tends to promote the vulnerability of social-environmental systems [5], as well as the demand for energy and road transport, which in turn have substantial negative effects, particularly on air quality, as confirmed by [45]. Nevertheless, the high SHDI may also suggest that there was an underlining of the relative balance of the different landscape patches [45]. However, the urban area of south-eastern Portimão has quite a high AI and low LSI and SHDI, along the time series. This indicates that these urban areas tended to aggregate, and the area of the dominant land cover (artificial surfaces) increased with basic geometric forms.
5. Conclusions
Knowing the past and current spatial dimension, pattern, and location of LULC change trajectories is crucial to understand territorial sustainability and anticipate possible futures. This study provided a comprehensive analysis applying GIS-based spatial analysis techniques, an LULC change trajectory analysis and spatial pattern metrics to address LULC change trajectories and their effects on sustainability at the local level (municipality of Portimão, Algarve). Several researchers have extensively explored the effectiveness of LULC change trajectory analysis and spatial metrics in relating spatial patterns of LULC trajectories and LULC change processes, as well as the usefulness of spatial metrics as indicators of landscape sustainability. The major original contribution of the proposed approach is in the confirmation of the effectiveness of these methods, using high-precision LULC maps for a long time period (71 years). This study extended research reported by [39,40] based on the multitemporal profile method. Spatial pattern metric analysis on classified temporal categorical trajectories has been introduced to interpret long-term dynamic and complex LULC conversions, now based on a much smaller scale view on LULC change. By taking this approach, the LULC change trend for each location in the study area across time was tracked and spatial patterns of LULC trajectories were analysed quantitatively, thus providing important insights into both the dynamics and the culmination of long LULC change processes.
Ultimately, the analysis of the spatial dynamics of LULC change trajectories over the past 71 years using a fine spatial resolution and highly detailed LULC thematic maps could provide a basis for understanding urban local-spatial resilience, and thus foster data-driven decisions. Furthermore, it provides robust, actionable, and adequate empirical information to support smart and sustainable future spatial planning. This study presents an approach that is relatively simple to implement and yet it is quite powerful for addressing past, current, and future LULC changes trajectories, which may be replicated in other urban areas worldwide.
Future research on this approach that combines LULC change trajectory analysis and spatial pattern metrics needs to focus on analysing to what extent the quantitative and analytical results of LULC change detection are affected using multitemporal and multi-resolution imagery as data sources. It should also focus on enriching this approach with the creation of new spatial pattern metrics based on 3D data [59] that may improve our understanding of LULC changes that occur in very dynamic areas [60,61].
Author Contributions
Conceptualisation, R.F.d.D. and J.A.T.; methodology, R.F.d.D. and J.A.T.; formal analysis, R.F.d.D. and J.A.T.; research, R.F.d.D.; writing—original draft preparation, R.F.d.D.; writing—review and editing, R.F.d.D. and J.A.T.; supervision, J.A.T.; funding acquisition, R.F.d.D. and J.A.T. Both authors have read and agreed to the published version of the manuscript.
Funding
This research was funded by national funds through FCT—Fundação para a Ciência e a Tecnologia, I.P., within the scope of the project ‘UIDB/04647/2020′ of CICS.NOVA—Centro Interdisciplinar de Ciências Sociais da Universidade Nova de Lisboa. This research was also partially funded by the SIARL Methodology project, contract 000011-DFIN-DCP, in progress at Associação para a Inovação e Desenvolvimento da FCT (NOVA.ID.FCT). The first author was financed by the FCT, under the Norma Transitória—DL 57/2016/CP1453/CT0105 and by a grant number SFRH/BD/61544/2009.
Conflicts of Interest
The authors declare no conflict of interest. The funders had no role in the design of the study; in the collection, analyses, or interpretation of data; in the writing of the manuscript, or in the decision to publish the results.
Appendix A

Table A1.
LULC classification scheme used in this study (adapted from [6]).
Table A1.
LULC classification scheme used in this study (adapted from [6]).
| I Level | II Level | III Level | VI Level | V Level |
|---|---|---|---|---|
| Artificial surfaces | Urban fabric | Continuous urban fabric | Vertical urban fabric | |
| Horizontal urban fabric | ||||
| Car parks | ||||
| Discontinuous urban fabric | Discontinuous urban fabric | |||
| Sparse discontinuous | ||||
| urban fabric | ||||
| Industrial, commercial and transport unitstransport units | Facilities, industrial or commercial units | Industry | ||
| Commerce | ||||
| Public and private facilities | ||||
| Agricultural facilities | ||||
| Power supply | Renewable energy (RE) | |||
| Non-RE | ||||
| Water supply | ||||
| Sewage and waste disposal | ||||
| Road and rail networks, and associated land | Road | |||
| Rail | ||||
| Port areas | Port terminal | |||
| Shipyards and docks | ||||
| Yachting marina | ||||
| Airports | Airport | |||
| Aerodrome | ||||
| Mine, dump, and construction sites | Mineral extraction sites | Mining | ||
| Quarry | ||||
| Dump sites | Landfill | |||
| Scrap | ||||
| Construction sites | Construction sites | |||
| Abandoned areas | ||||
| Artificial, non-agricultural vegetated areas | Green urban areas | Cemeteries | ||
| Parks, gardens | ||||
| Sport and leisure facilities | Sport facilities | Golf courses | ||
| Other | ||||
| Cultural facilities, historical sites | ||||
| Leisure facilities | Camping | |||
| Other | ||||
| Forest and seminatural areas | Forests | |||
| Open forests, shrub, and herbaceous vegetation | Natural grasslands | |||
| Shrubs | ||||
| Open forests, cuts, and new plantationsplantations | ||||
| Open spaces with little or no vegetation | Bare rocks | |||
| Sparsely vegetated areas | ||||
| Beaches, dunes, sands | ||||
| Burnt areas | ||||
| Agricultural areas | ||||
| Wetlands | ||||
| Water bodies |
Table A2.
Land-use and land-cover areas (ha) and percentage of LULC areas in the study area over the 1947–2018 period.
Table A2.
Land-use and land-cover areas (ha) and percentage of LULC areas in the study area over the 1947–2018 period.
| Level V Categories | 1947 | 1958 | 1968 | 1972 | 1987 | 1995 | 2000 | 2010 | 2018 | |||||||||
|---|---|---|---|---|---|---|---|---|---|---|---|---|---|---|---|---|---|---|
| Area (ha) | % | Area (ha) | % | Area (ha) | % | Area (ha) | % | Area (ha) | % | Area (ha) | % | Area (ha) | % | Area (ha) | % | Area (ha) | % | |
| Continuous vertical urban fabric | 1 | 0 | 1 | 0 | 12 | 0 | 23 | 0 | 50 | 0 | 73 | 0 | 90 | 0 | 128 | 1 | 135 | 1 |
| Continuous horizontal urban fabric | 18 | 0 | 23 | 0 | 57 | 0 | 66 | 0 | 98 | 1 | 122 | 1 | 126 | 1 | 145 | 1 | 146 | 1 |
| Car parks | 0 | 0 | 1 | 0 | 2 | 0 | 4 | 0 | 7 | 0 | 12 | 0 | 19 | 0 | 31 | 0 | 42 | 0 |
| Discontinuous urban fabric | 95 | 1 | 117 | 1 | 103 | 1 | 112 | 1 | 253 | 1 | 328 | 2 | 368 | 2 | 490 | 3 | 502 | 3 |
| Sparse discontinuous urban fabric | 67 | 0 | 71 | 0 | 88 | 0 | 112 | 1 | 139 | 1 | 140 | 1 | 157 | 1 | 191 | 1 | 208 | 1 |
| Industry | 11 | 0 | 9 | 0 | 11 | 0 | 17 | 0 | 36 | 0 | 56 | 0 | 59 | 0 | 73 | 0 | 41 | 0 |
| Commerce | 0 | 0 | 0 | 0 | 1 | 0 | 1 | 0 | 3 | 0 | 8 | 0 | 11 | 0 | 41 | 0 | 37 | 0 |
| Agricultural facilities | 3 | 0 | 3 | 0 | 3 | 0 | 3 | 0 | 6 | 0 | 7 | 0 | 9 | 0 | 11 | 0 | 16 | 0 |
| Public and private facilities | 1 | 0 | 1 | 0 | 6 | 0 | 7 | 0 | 20 | 0 | 38 | 0 | 52 | 0 | 211 | 1 | 248 | 1 |
| RE | 0 | 0 | 0 | 0 | 0 | 0 | 0 | 0 | 0 | 0 | 0 | 0 | 0 | 0 | 0 | 0 | 8 | 0 |
| Non-RE | 0 | 0 | 0 | 0 | 0 | 0 | 0 | 0 | 0 | 0 | 0 | 0 | 0 | 0 | 5 | 0 | 5 | 0 |
| Water supply | 0 | 0 | 0 | 0 | 0 | 0 | 1 | 0 | 3 | 0 | 4 | 0 | 4 | 0 | 5 | 0 | 4 | 0 |
| Sewage and waste disposal | 0 | 0 | 0 | 0 | 0 | 0 | 0 | 0 | 27 | 0 | 28 | 0 | 31 | 0 | 31 | 0 | 35 | 0 |
| Road network and associated land | 173 | 1 | 180 | 1 | 204 | 1 | 217 | 1 | 293 | 2 | 334 | 2 | 357 | 2 | 474 | 3 | 477 | 3 |
| Rail network and associated land | 8 | 0 | 8 | 0 | 8 | 0 | 8 | 0 | 8 | 0 | 8 | 0 | 8 | 0 | 8 | 0 | 8 | 0 |
| Port terminal | 0 | 0 | 1 | 0 | 1 | 0 | 1 | 0 | 1 | 0 | 8 | 0 | 8 | 0 | 8 | 0 | 8 | 0 |
| Shipyards and docks | 2 | 0 | 2 | 0 | 2 | 0 | 1 | 0 | 2 | 0 | 2 | 0 | 17 | 0 | 16 | 0 | 16 | 0 |
| Aerodrome | 0 | 0 | 0 | 0 | 0 | 0 | 14 | 0 | 15 | 0 | 15 | 0 | 15 | 0 | 15 | 0 | 15 | 0 |
| Mining | 0 | 0 | 0 | 0 | 0 | 0 | 0 | 0 | 0 | 0 | 0 | 0 | 0 | 0 | 0 | 0 | 25 | 0 |
| Landfill | 0 | 0 | 0 | 0 | 0 | 0 | 0 | 0 | 0 | 0 | 0 | 0 | 24 | 0 | 31 | 0 | 34 | 0 |
| Scrap | 0 | 0 | 1 | 0 | 1 | 0 | 0 | 0 | 1 | 0 | 6 | 0 | 3 | 0 | 2 | 0 | 3 | 0 |
| Construction sites | 0 | 0 | 0 | 0 | 4 | 0 | 4 | 0 | 30 | 0 | 35 | 0 | 90 | 0 | 207 | 1 | 109 | 1 |
| Abandoned areas | 0 | 0 | 0 | 0 | 0 | 0 | 0 | 0 | 1 | 0 | 7 | 0 | 7 | 0 | 6 | 0 | 26 | 0 |
| Parks, gardens | 2 | 0 | 2 | 0 | 7 | 0 | 12 | 0 | 21 | 0 | 35 | 0 | 40 | 0 | 58 | 0 | 61 | 0 |
| Cemeteries | 2 | 0 | 2 | 0 | 2 | 0 | 2 | 0 | 3 | 0 | 3 | 0 | 3 | 0 | 3 | 0 | 3 | 0 |
| Golf courses | 0 | 0 | 0 | 0 | 48 | 0 | 65 | 0 | 80 | 0 | 117 | 1 | 143 | 1 | 251 | 1 | 253 | 1 |
| Other sport facilities | 0 | 0 | 0 | 0 | 4 | 0 | 5 | 0 | 11 | 0 | 18 | 0 | 17 | 0 | 20 | 0 | 23 | 0 |
| Camping | 0 | 0 | 0 | 0 | 0 | 0 | 0 | 0 | 7 | 0 | 8 | 0 | 8 | 0 | 8 | 0 | 8 | 0 |
| Other leisure facilities | 0 | 0 | 0 | 0 | 2 | 0 | 4 | 0 | 6 | 0 | 7 | 0 | 7 | 0 | 18 | 0 | 21 | 0 |
| Cultural facilities, historical sites | 2 | 0 | 2 | 0 | 4 | 0 | 4 | 0 | 6 | 0 | 6 | 0 | 7 | 0 | 7 | 0 | 7 | 0 |
| Total | 384 | 2 | 426 | 2 | 569 | 3 | 683 | 4 | 1125 | 6 | 1423 | 8 | 1680 | 9 | 2492 | 14 | 2524 | 14 |
| Agricultural areas | 9257 | 51 | 8668 | 48 | 8571 | 47 | 8431 | 46 | 7391 | 41 | 6689 | 37 | 6268 | 34 | 5767 | 32 | 5612 | 31 |
| Forest | 945 | 5 | 923 | 5 | 1142 | 6 | 1346 | 7 | 1660 | 9 | 2323 | 13 | 2658 | 15 | 2844 | 16 | 2647 | 15 |
| Natural grasslands | 52 | 0 | 67 | 0 | 71 | 0 | 74 | 0 | 74 | 0 | 80 | 0 | 120 | 1 | 111 | 1 | 109 | 1 |
| Shrubs | 6180 | 34 | 6719 | 37 | 6604 | 36 | 6352 | 35 | 6597 | 36 | 6275 | 34 | 5973 | 33 | 5763 | 32 | 6083 | 33 |
| Open forests/cuts/new plantations | 48 | 0 | 86 | 0 | 136 | 1 | 202 | 1 | 153 | 1 | 193 | 1 | 319 | 2 | 50 | 0 | 52 | 0 |
| Beaches, dunes and sands | 173 | 1 | 123 | 1 | 110 | 1 | 103 | 1 | 104 | 1 | 93 | 1 | 85 | 0 | 84 | 0 | 84 | 0 |
| Bare rocks | 34 | 0 | 16 | 0 | 17 | 0 | 18 | 0 | 20 | 0 | 23 | 0 | 20 | 0 | 23 | 0 | 17 | 0 |
| Sparsely vegetated areas | 2 | 0 | 6 | 0 | 15 | 0 | 23 | 0 | 91 | 1 | 63 | 0 | 86 | 0 | 46 | 0 | 42 | 0 |
| Burnt areas | 0 | 0 | 0 | 0 | 0 | 0 | 0 | 0 | 2 | 0 | 39 | 0 | 0 | 0 | 1 | 0 | 1 | 0 |
| Total | 7434 | 41 | 7940 | 44 | 8095 | 44 | 8118 | 45 | 8701 | 48 | 9088 | 50 | 9260 | 51 | 8905 | 49 | 9034 | 50 |
| Wetlands | 563 | 3 | 573 | 3 | 428 | 2 | 426 | 2 | 387 | 2 | 391 | 2 | 403 | 2 | 441 | 2 | 441 | 2 |
| Water bodies | 568 | 3 | 599 | 3 | 543 | 3 | 548 | 3 | 603 | 3 | 616 | 3 | 595 | 3 | 586 | 3 | 596 | 3 |
References
- Turner, B.L.; Kasperson, R.E.; Meyer, W.B.; Dow, K.M.; Golding, D.; Kasperson, J.X.; Mitchell, R.C.; Ratick, S.J. Two Types of Global Environmental Change: Definitional and Spatial-Scale Issues in Their Human Dimensions. Glob. Environ. Chang. 1990, 1, 14–22. [Google Scholar] [CrossRef]
- Antrop, M. Landscape Change and the Urbanization Process in Europe. Dev. Eur. Landsc. 2004, 67, 9–26. [Google Scholar] [CrossRef]
- Kuemmerle, T.; Levers, C.; Erb, K.; Estel, S.; Jepsen, M.R.; Müller, D.; Plutzar, C.; Stürck, J.; Verkerk, P.J.; Verburg, P.H.; et al. Hotspots of Land Use Change in Europe. Environ. Res. Lett. 2016, 11, 064020. [Google Scholar] [CrossRef]
- MohanRajan, S.N.; Loganathan, A.; Manoharan, P. Survey on Land Use/Land Cover (LU/LC) Change Analysis in Remote Sensing and GIS Environment: Techniques and Challenges. Environ. Sci. Pollut. Res. 2020, 27, 29900–29926. [Google Scholar] [CrossRef]
- Faria de Deus, R.; Tenedório, J.A.; Moix Montserrat, B. Urban Sprawl in Portugal Based on Urban Systems Spatial Boundaries. ACE Archit. City Environ. 2012, 7, 131–148. [Google Scholar]
- Faria de Deus, R.; Tenedório, J.A.; Rocha, J. Modelling land-use and land-cover changes: A hybrid approach to a coastal area. In Methods and Applications of Geospatial Technology in Sustainable Urbanism; Tenedório, J.A., Estanqueiro, R., Henriques, C.D., Eds.; IGI Global: Hershey, PA, USA, 2021; pp. 57–102. ISBN 978-1-79982-249-3. [Google Scholar]
- Herold, M.; Hemphill, J.; Dietzel, C.; Clarke, K.; Land, E.G.-G. Remote Sensing Derived Mapping to Support Urban Growth Theory. 2005. Available online: https://www.isprs.org/proceedings/xxxvi/8-w27/herold_hemphill_etal.pdf (accessed on 6 August 2021).
- Bhatta, B. Analysis of Urban. Growth and Sprawl from Remote Sensing Data; Advances in Geographic Information Science; Springer: Berlin/Heidelberg, Germany, 2010; ISBN 978-3-642-05299-6. [Google Scholar]
- Pham, H.M.; Yamaguchi, Y.; Bui, T.Q. A Case Study on the Relation between City Planning and Urban Growth Using Remote Sensing and Spatial Metrics. Landsc. Urban Plan. 2011, 100, 223–230. [Google Scholar] [CrossRef]
- D’Acci, L. (Ed.) The Mathematics of Urban. Morphology; Modeling and Simulation in Science, Engineering and Technology; Springer: Cham, Switzerland, 2019; ISBN 978-3-030-12381-9. [Google Scholar]
- Brown, C.; Holman, I.; Rounsevell, M. How Modelling Paradigms Affect Simulated Future Land Use Change. Earth Syst. Dyn. 2021, 12, 211–231. [Google Scholar] [CrossRef]
- Benders, R. Models and Modelling. Interactive Simulation of Electricity Demand and Production; University Groningen: Groningen, The Netherlands, 1996. [Google Scholar]
- Cheng, I. Modelling Spatial and Temporal Urban Growth; ITC: Enschede, The Netherlands, 2003. [Google Scholar]
- Wellmann, T.; Lausch, A.; Andersson, E.; Knapp, S.; Cortinovis, C.; Jache, J.; Scheuer, S.; Kremer, P.; Mascarenhas, A.; Kraemer, R.; et al. Remote Sensing in Urban Planning: Contributions towards Ecologically Sound Policies? Landsc. Urban Plan. 2020, 204, 103921. [Google Scholar] [CrossRef]
- Tamba, V.; Kabba, V.; Li, J. Analysis of Land Use and Land Cover Changes, and Their Ecological Implications in Wuhan, China. J. Geogr. Geol. 2011, 3. [Google Scholar] [CrossRef]
- Fichera, C.R.; Modica, G.; Pollino, M. Land Cover Classification and Change-Detection Analysis Using Multi-Temporal Remote Sensed Imagery and Landscape Metrics. Eur. J. Remote Sens. 2012, 45, 1–18. [Google Scholar] [CrossRef]
- Mirzaei, M.; Shayesteh, K. Land Use Changes Analysis Using GIS, Remote Sensing and Landscape Metrics: A Case Study of Golpayegan City, Iran. Int. J. Ecol. Environ. Sci. 2015, 41, 133–140. [Google Scholar]
- Sinha, S.; Sinha, K. Application of Geospatial Techniques in the Study of Urban Growth/ Sprawl. Int. J. Multidiscip. 2018, 3, 148. [Google Scholar]
- Zambon, I.; Serra, P.; Pili, S.; Bernardini, V.; Ferrara, C.; Salvati, L. A New Approach to Land-Use Structure: Patch Perimeter Metrics as a Spatial Analysis Tool. Sustainability 2018, 10. [Google Scholar] [CrossRef] [Green Version]
- Duong, N.; Lepczyk, C.; Miura, T.; Fox, J. Quantifying Urban Growth Patterns in Hanoi Using Landscape Expansion Modes and Time Series Spatial Metrics. PLoS ONE 2018, 13, e0196940. [Google Scholar] [CrossRef] [Green Version]
- Mohanty, S.; Panda, L.; Rath, S.S. Geospatial Technology in Urban Sprawl Assessment: A Review. In Methods and Applications of Geospatial Technology in Sustainable Urbanism; Tenedório, J.A., Estanqueiro, R., Henriques, C.D., Eds.; IGI Global: Hershey, PA, USA, 2021; pp. 1–33. ISBN 978-1-79982-249-3. [Google Scholar]
- Uuemaa, E.; Mander, Ü.; Marja, R. Trends in the Use of Landscape Spatial Metrics as Landscape Indicators: A Review. Ecol. Indic. 2013, 28, 100–106. [Google Scholar] [CrossRef]
- Dramstad, W.E. Spatial Metrics–Useful Indicators for Society or Mainly Fun Tools for Landscape Ecologists? Nor. Geogr. Tidsskr. Nor. J. Geogr. 2009, 63, 246–254. [Google Scholar] [CrossRef]
- Botequilha Leitão, A.; Ahern, J. Applying Landscape Ecological Concepts and Metrics in Sustainable Landscape Planning. Landsc. Urban Plan. 2002, 59, 65–93. [Google Scholar] [CrossRef]
- Hao, R.; Su, W.; Yu, D. Quantifying the Type of Urban Sprawl and Dynamic Changes in Shenzhen. In Computer and Computing Technologies in Agriculture VI; Li, D., Chen, Y., Eds.; Springer: Berlin/Heidelberg, Germany, 2013; pp. 407–415. [Google Scholar]
- Radwan, T.M.; Blackburn, G.A.; Whyatt, J.D.; Atkinson, P.M. Global Land Cover Trajectories and Transitions. Sci. Rep. 2021, 11, 12814. [Google Scholar] [CrossRef]
- Obeidat, M.; Awawdeh, M.; Lababneh, A. Assessment of Land Use/Land Cover Change and Its Environmental Impacts Using Remote Sensing and GIS Techniques, Yarmouk River Basin, North Jordan. Arab. J. Geosci. 2019, 12, 685. [Google Scholar] [CrossRef]
- Cabral, A.I.R.; Costa, F.L. Land Cover Changes and Landscape Pattern Dynamics in Senegal and Guinea Bissau Borderland. Appl. Geogr. 2017, 82, 115–128. [Google Scholar] [CrossRef]
- Silva, E.; Reis, J.; Pinho, P. 2014 Measuring space: A review of spatial metrics for urban growth and shrinkage. In The Routledge Handbook of Planning Research Methods; Routledge: London, UK, 2015; ISBN 978-0-415-72795-2. [Google Scholar]
- Sapena, M.; Wurm, M.; Taubenböck, H.; Tuia, D.; Ruiz, L.A. Estimating Quality of Life Dimensions from Urban Spatial Pattern Metrics. Comput. Environ. Urban Syst. 2021, 85, 101549. [Google Scholar] [CrossRef]
- Botequilha-Leitão, A.; Diaz-Varela, E. An Alternative Planning Paradigm for Coastal Landscapes and Tourism. Spatial Metrics as Indicators for Planning Coastal Tourism Landscapes. Tour. Manag. Stud. 2018, 14. [Google Scholar] [CrossRef] [Green Version]
- Tenedório, J.A.; Estanqueiro, R.; Henriques, C.D. (Eds.) Methods and Applications of Geospatial Technology in Sustainable Urbanism; IGI Global: Hershey, PA, USA, 2021; p. 684. ISBN 978-1-79982-249-3. [Google Scholar]
- Crews-Meyer, K.A. Assessing Landscape Change and Population-Environment Interactions via Panel Analysis. Geocarto Int. 2001, 16, 71–82. [Google Scholar] [CrossRef]
- Gyenizse, P.; Bognár, Z.; Czigány, S.; Elekes, T. Landscape Shape Index, as a PotentiaL Indicator of Urban DeveLopment in Hungary. Acta Debrecina Landsc. Environ. 2014, 8, 78–88. [Google Scholar]
- Coppin, P.; Jonckheere, I.; Nackaerts, K.; Muys, B.; Lambin, E. Review ArticleDigital Change Detection Methods in Ecosystem Monitoring: A Review. Int. J. Remote Sens. 2004, 25, 1565–1596. [Google Scholar] [CrossRef]
- Boori, M.; Voženílek, V. Remote Sensing and Land Use/Land Cover Trajectories. J. Geophys. Remote Sens. 2014, 3, 0107. [Google Scholar] [CrossRef]
- Zhou, Q.; LI, B.; Sun, B. Modelling Spatio-Temporal Pattern of Land Use Change Using Multi-Temporal Remotely Sensed Imagery. Int. Arch. Photogramm. Remote Sens. Spat. Inf. Sci. 2008, 37, 729–734. [Google Scholar]
- Mena, C. Trajectories of Land-Use and Land-Cover in the Northern Ecuadorian Amazon: Temporal Composition, Spatial Configuration, and Probability of Change. Photogramm. Eng. Remote Sens. 2008, 74, 737–751. [Google Scholar] [CrossRef]
- Xue, X.; Liu, H.; Mu, X.; Liu, J. Trajectory-Based Detection of Urban Expansion Using Landsat Time Series. Int. J. Remote Sens. 2014, 35, 1450–1465. [Google Scholar] [CrossRef]
- Zhou, Q.; Li, B.; Kurban, A. Spatial Pattern Analysis of Land Cover Change Trajectories in Tarim Basin, Northwest China. Int. J. Remote Sens. 2008, 29, 5495–5509. [Google Scholar] [CrossRef]
- Lhermitte, S.; Verbesselt, J.; Verstraeten, W.W.; Coppin, P. A Comparison of Time Series Similarity Measures for Classification and Change Detection of Ecosystem Dynamics. Remote Sens. Environ. 2011, 115, 3129–3152. [Google Scholar] [CrossRef]
- Yuan, F.; Bauer, M.E.; Heinert, N.J.; Holden, G.R. Multi-level Land Cover Mapping of the Twin Cities (Minnesota) Metropolitan Area with Multi-seasonal Landsat TM/ETM+ Data. Geocarto Int. 2005, 20, 5–13. [Google Scholar] [CrossRef]
- Badjana, H.M.; Helmschrot, J.; Wala, K.; Selsam, P.; Flügel, W.-A.; Afouda, A.; Akpagana, A. Land Cover Changes Assessment Using Object-Based Image Analysis in the Binah River Watershed (Togo and Benin). Earth Space Sci. 2015, 2, 403–416. [Google Scholar] [CrossRef] [Green Version]
- Lambin, E.; Linderman, M. Time Series of Remote Sensing Data for Land Change Science. Geosci. Remote Sens. 2006, 44, 1926–1928. [Google Scholar] [CrossRef]
- Zou, B.; Xu, S.; Sternberg, T.; Fang, X. Effect of Land Use and Cover Change on Air Quality in Urban Sprawl. Sustainability 2016, 8. [Google Scholar] [CrossRef] [Green Version]
- Hasan, S.; Shi, W.; Zhu, X.; Abbas, S.; Khan, H.U. Future Simulation of Land Use Changes in Rapidly Urbanizing South China Based on Land Change Modeler and Remote Sensing Data. Sustainability 2020, 12, 4350. [Google Scholar] [CrossRef]
- Hassan, M.M.; Southworth, J. Analyzing Land Cover Change and Urban Growth Trajectories of the Mega-Urban Region of Dhaka Using Remotely Sensed Data and an Ensemble Classifier. Sustainability 2018, 10, 10. [Google Scholar] [CrossRef] [Green Version]
- Stürck, J.; Levers, C.; van der Zanden, E.H.; Schulp, C.J.E.; Verkerk, P.J.; Kuemmerle, T.; Helming, J.; Lotze-Campen, H.; Tabeau, A.; Popp, A.; et al. Simulating and Delineating Future Land Change Trajectories across Europe. Reg. Environ. Chang. 2018, 18, 733–749. [Google Scholar] [CrossRef] [Green Version]
- Faria de Deus, R. GIS-Based Measurement, Analysis and Modelling of Land-Use and Land-Cover Change in Coastal Areas. The Case of the Algarve–Portugal. Ph.D. Thesis, Universidade Nova de Lisboa, Lisbon, Portugal, 2015. [Google Scholar]
- INE. Estatísticas Do Turismo; INE: Lisbon, Portugal, 2019. [Google Scholar]
- European Commission. Regional Innovation Monitor (RIM) Plus, Internal Market, Industry, Entrepreneurship and SMEs; European Commission: Brussels, Belgium, 2020. [Google Scholar]
- INE. Censos 2011–Resultados Definitivos; INE: Lisbon, Portugal, 2011. [Google Scholar]
- INE. Statistics Portugal, Annual Estimates of Resident Population; INE: Lisbon, Portugal, 2019. [Google Scholar]
- Gonçalves, J. DEM SRTM. Available online: http://www.fc.up.pt/pessoas/jagoncal/srtm (accessed on 2 July 2019).
- McGarigal, K.; Cushman, S.; Neel, M.; Ene, E.; McGarigal, K.; Cushman, S.A.; Neel, M.C.; Ene, E. FRAGSTATS: Spatial Pattern Analysis Program for Categorical Maps. Computer Software Program Produced by the Authors at the University of Massachusetts, Amherst. 2002. Available online: www.Umass.Edu/Landeco/Research/Fragstats/Fragstats.Html (accessed on 3 December 2020).
- Berry, W.; Feldman, S. Multiple Regression in Practice; Sage University Paper: Thousand Oaks, CA, USA, 2021. [Google Scholar]
- Dutta, V. Land Use Dynamics and Peri-Urban Growth Characteristics Reflections on Master Plan and Urban Suitability from a Sprawling North Indian City. Environ. Urban Asia 2012, 3, 277–301. [Google Scholar] [CrossRef]
- Kasango, M.; Barredo, J.; Lavalle, C.; McCormick, N.; Demicheli, L.; Sagris, V.; Brezger, A. Are European Cities Becoming Dispersed? A Comparative Analysis of Fifteen European Urban. Areas. Landsc. Urban Plan. 2006, 77, 111–130. [Google Scholar] [CrossRef]
- Kedron, P.; Zhao, Y.; Frazier, A.E. Three Dimensional (3D) Spatial Metrics for Objects. Landsc. Ecol. 2019, 34, 2123–2132. [Google Scholar] [CrossRef]
- Magarotto, M.; Costa, M.; Tenedório, J.; Silva, C. Vertical Growth in a Coastal City: An Analysis of Boa Viagem (Recife, Brazil). J. Coast. Conserv. 2016, 20. [Google Scholar] [CrossRef]
- Magarotto, M.; Costa, M.; Tenedório, J.; Silva, C.; Pontes, T. Methodology for the Development of 3D GIS Models in the Coastal Zone. J. Coast. Res. 2014, 70, 479–484. [Google Scholar] [CrossRef]
Figure 1.
Location of the municipality of Portimão, Algarve region (Portugal). Geographical data source: © EuroGeographics for the administrative boundaries (Original product is available for free at www.eurogeographics.org (accessed on 6 August 2021). Terms of licence available at https://eurogeographics.org/maps-for-europe/open-data/topographic-data/ (accessed on 6 August 2021). Digital elevation data are available in [54].

Figure 2.
Research methodology flowchart.

Figure 3.
LULC maps of Portimão for (a) 2018, (b) 2010, (c) 2000, (d) 1995, (e) 1987, (f) 1972, (g) 1968, (h) 1958, and (i) 1947, classified according to level I category.
Figure 3.
LULC maps of Portimão for (a) 2018, (b) 2010, (c) 2000, (d) 1995, (e) 1987, (f) 1972, (g) 1968, (h) 1958, and (i) 1947, classified according to level I category.

Figure 4.
Land-cover dynamics occurred over the study period (1947–2018).

Figure 5.
Share of continuous urban fabric and discontinuous urban fabric of the total residential areas over the study period.
Figure 5.
Share of continuous urban fabric and discontinuous urban fabric of the total residential areas over the study period.

Figure 6.
Population and population density in the study area (1940–2019).

Figure 7.
Population growth rates in the study area (1940–2019).

Figure 8.
Temporal physical expansion of artificial surfaces in Portimão over the study period.

Figure 9.
Spatiotemporal LULC change trajectories in Portimão between 1947 and 2010.

Figure 10.
Description of images from left to right, top to bottom: (a) spatial patterns of LULC change trajectories, aggregated at the class level; (b) spatial patterns of AI; (c) spatial patterns of SHDI; and (d) spatial patterns of LSI.
Figure 10.
Description of images from left to right, top to bottom: (a) spatial patterns of LULC change trajectories, aggregated at the class level; (b) spatial patterns of AI; (c) spatial patterns of SHDI; and (d) spatial patterns of LSI.

Table 1.
Description of the theorised processes of LULC change.
| Processes | Description |
|---|---|
| Urban expansion | Describes changes from agricultural land or shrubland to urban developed land. |
| Golf course expansion | Describes changes from agricultural land to the golf course land-use category. |
| Public and private facilities expansion | Describes changes from shrubland or forestland to the public and private facility land-use category. |
| Densification | Describes specifically the process of change from discontinuous urban fabric land-use categories to the continuous horizontal urban fabric land-use category. |
| Verticalization | Describes changes from existing urban land to the vertical urban fabric land-use category, resulting in the development of high-rise buildings in specific locations of the municipality. |
| Forest regrowth | Describes forest regeneration, generally since 1995, in areas previously occupied by shrubland. |
| Land fallow | Describes recent changes from agricultural land to shrubland, which may suggest land left uncultivated after successive crops. |
| Farmland abandonment | Describes the cessation of agricultural activities (Pointereau et al., 2008) on a given location thereafter converted into shrubland. |
| Deforestation | Describes old changes from forestland to non-forest uses. |
| LULC stability | Describes situations where the LULC of a given surface remained unchanged during the entire study period. |
Table 2.
Selected spatial metrics for LULC change trajectory pattern analysis (adapted from [55]).
Table 2.
Selected spatial metrics for LULC change trajectory pattern analysis (adapted from [55]).
| Spatial Metric (Acronym) | Description | Units | Range |
|---|---|---|---|
| Class-Level | |||
| Edge Density (ED) | ED is defined as the sum of the lengths (m) of all edge segments in the landscape per hectare. | Meters per ha | ED ≥ 0, no limit. ED = 0 if there is no class edge in the landscape. |
| Largest Patch Index (LPI) | LPI quantifies the percentage of total landscape area comprised by the largest patch. | Percent | 0 < LPI ≤ 100 |
| Area-weighted mean patch fractal dimension (FRAC_AM) | FRAC_AM is defined as the area weighted mean value of the fractal dimension values of all similar patch types. | None | 1 ≤ FRAC_AM ≤ 2 |
| Euclidean mean nearest neighbour distance (ENN_MN) | ENN_MN is the average distance (m) of all patch types to the nearest neighbouring similar patch type. | Meters | ENN_MN > 0, no limit. ENN_MN → 0 as distance to the nearest neighbour decreases. |
| Interspersion and Juxtaposition index (IJI) | IJI provides the observed interspersion over the maximum possible interspersion for the given number of patch types. | Percent | 0 < IJI ≤ 100 |
| Splitting index (SPLIT) | SPLIT quantifies the total landscape area squared (m2) divided by the sum of patch area squared (m2), summed across all patches of each patch type. | None | 1 ≤ SPLIT ≤ number of cells in the landscape area squared. SPLIT = 1 if there is a single patch in the landscape. |
| normalised Landscape Shape Index (nLSI) | nLSI measures the degree of class aggregation or clumpiness. | None | 0 ≤ nLSI ≤ 1 |
| Landscape-Level | |||
| Aggregation Index (AI) | AI quantifies the maximum possible number of similar adjacencies considering any landscape composition. | Percent | 0 ≤ AI ≤ 100 |
| Landscape Shape Index (LSI) | LSH is defined as the ratio between the real landscape edge and the theoretical lowest edge length. | None | LSI ≥ 1, no limit. LSI = 1 if there is a single square patch in the landscape. |
| Shannon’s Diversity Index (SHDI) | SHDI quantifies relative patch diversity in a given landscape. | Information | SHDI ≥ 0, no limit. SHDI = 0 if there is a single patch in the landscape. |
Table 3.
Annual growth rate of LULC areas in Portimão for each temporal period.
| Level V Categories | 1947–1958 | 1958–1968 | 1968–1972 | 1972–1987 | 1987–1995 | 1995–2000 | 2000–2010 | 2010–2018 | 1947–2018 |
|---|---|---|---|---|---|---|---|---|---|
| Artificial surfaces | |||||||||
| Continuous vertical urban fabric | 5.48 | 25.91 | 19.89 | 5.36 | 4.56 | 4.33 | 3.50 | 0.68 | 7.86 |
| Continuous horizontal urban fabric | 2.14 | 9.23 | 4.61 | 2.68 | 2.75 | 0.71 | 1.35 | 0.14 | 2.96 |
| Car parks | 0.00 | 5.44 | 31.89 | 3.65 | 6.88 | 9.63 | 4.92 | 3.75 | 0.00 |
| Discontinuous urban fabric | 1.91 | −1.34 | 2.90 | 5.43 | 3.25 | 2.31 | 2.86 | 0.32 | 2.35 |
| Sparse discontinuous urban fabric | 0.60 | 2.09 | 7.96 | 1.45 | 0.14 | 2.24 | 1.96 | 1.06 | 1.60 |
| Industry | −1.49 | 1.91 | 13.46 | 5.01 | 5.69 | 1.14 | 2.01 | −7.11 | 1.87 |
| Commerce | 0.00 | 20.42 | 0.00 | 8.28 | 12.32 | 6.72 | 13.37 | −1.28 | 0.00 |
| Agricultural facilities | 0.00 | 0.00 | −0.33 | 4.67 | 1.80 | 5.21 | 1.61 | 5.05 | 2.34 |
| Public and private facilities | 8.04 | 14.88 | 2.57 | 6.95 | 8.38 | 5.96 | 14.04 | 2.04 | 8.49 |
| Power supply—RE | 0.00 | 0.00 | 0.00 | 0.00 | 0.00 | 0.00 | 0.00 | 0.00 | 0.00 |
| Power supply—non-RE | 0.00 | 0.00 | 0.00 | 0.00 | 0.00 | 0.00 | 0.00 | 0.00 | 0.00 |
| Water supply | 0.00 | 0.00 | 0.00 | 5.29 | 3.46 | −0.13 | 2.40 | −0.87 | 0.00 |
| Sewage and waste disposal | 0.00 | 0.00 | 0.00 | 0.00 | 0.76 | 2.04 | 0.00 | 1.27 | 0.00 |
| Road network and associated land | 0.36 | 1.24 | 2.08 | 2.01 | 1.63 | 1.33 | 2.83 | 0.08 | 1.43 |
| Rail network and associated land | 0.00 | 0.11 | 0.62 | 0.00 | −0.01 | 0.00 | −0.01 | 0.00 | 0.04 |
| Port terminal | 0.00 | −0.88 | 0.00 | 0.00 | 22.81 | 0.78 | 0.00 | 0.00 | 0.00 |
| Shipyards and docks | 0.25 | 0.00 | −15.94 | 0.20 | 2.17 | 44.36 | −0.68 | 0.00 | 2.68 |
| Aerodrome | 0.00 | 0.00 | 0.00 | 0.15 | 0.00 | 0.00 | 0.00 | 0.00 | 0.00 |
| Mining | 0.00 | 0.00 | 0.00 | 0.15 | 0.00 | 0.00 | 0.00 | 0.00 | 0.00 |
| Landfill | 0.00 | 0.00 | 0.00 | 0.00 | 0.00 | 0.00 | 2.40 | 1.47 | 0.00 |
| Scrap | 0.00 | 0.00 | −17.28 | 7.70 | 18.83 | −11.90 | −6.43 | 6.10 | 0.00 |
| Construction sites | 0.00 | 0.00 | −2.31 | 13.97 | 1.72 | 19.03 | 8.34 | −8.07 | 0.00 |
| Abandoned areas | 0.00 | 0.00 | 0.00 | 0.00 | 29.40 | 0.00 | −1.19 | 17.84 | 0.00 |
| Parks. gardens | 2.65 | 11.75 | 19.02 | 3.94 | 6.29 | 2.86 | 3.78 | 0.49 | 5.20 |
| Cemeteries | −0.05 | 0.00 | −0.13 | 2.96 | 0.00 | 0.00 | 0.00 | 0.00 | 0.61 |
| Golf courses | 0.00 | 0.00 | 10.42 | 1.35 | 4.79 | 4.00 | 5.63 | 0.11 | 0.00 |
| Other sport facilities | 0.00 | 0.00 | 12.39 | 4.72 | 6.06 | −0.67 | 1.72 | 1.85 | 0.00 |
| Camping | 0.00 | 0.00 | 0.00 | 0.00 | 1.73 | 0.00 | 0.00 | 0.00 | 0.00 |
| Other leisure facilities | 0.00 | 0.00 | 19.25 | 2.35 | 2.30 | 1.56 | 8.68 | 1.97 | 0.00 |
| Cultural facilities, historical sites | 0.05 | 4.41 | 1.14 | 2.92 | 0.27 | 2.14 | 0.50 | −0.19 | 1.52 |
| All artificial surfaces | 0.94 | 2.89 | 6.09 | 3.33 | 2.94 | 3.32 | 3.94 | 0.16 | 2.65 |
| Agricultural areas | −0.60 | −0.11 | −0.55 | −0.88 | −1.25 | −1.30 | −0.81 | −0.34 | −0.70 |
| Forest and seminatural areas | |||||||||
| Forest | −0.22 | 2.13 | 5.48 | 1.40 | 4.20 | 2.70 | 0.67 | −0.90 | 1.45 |
| Natural grasslands | 2.18 | 0.65 | 1.23 | 0.00 | 1.00 | 8.10 | −0.79 | −0.27 | 1.02 |
| Shrubs | 0.76 | −0.17 | −1.29 | 0.25 | −0.63 | −0.99 | −0.36 | 0.67 | −0.02 |
| Open forests, cuts, and new plantations | 5.31 | 4.62 | 13.06 | −1.85 | 2.93 | 9.98 | −18.55 | 0.44 | 0.10 |
| Beaches, dunes and sands | −3.07 | −1.12 | −2.23 | 0.05 | −1.46 | −1.82 | −0.12 | 0.01 | −1.02 |
| Bare rocks | −6.50 | 0.43 | 2.19 | 0.65 | 1.53 | −2.57 | 1.31 | −3.61 | −0.95 |
| Sparsely vegetated areas | 12.28 | 9.20 | 14.18 | 9.25 | −4.71 | 6.24 | −6.28 | −0.97 | 4.67 |
| Burnt areas | 0.00 | 0.00 | 0.00 | 0.00 | 40.36 | 0.00 | 0.00 | 0.00 | 0.00 |
| All forest and seminatural areas | 0.60 | 0.19 | 0.09 | 0.46 | 0.54 | 0.37 | −0.39 | 0.16 | 0.27 |
| Wetlands | 0.16 | −2.92 | −0.16 | −0.64 | 0.13 | 0.66 | 0.90 | 0.00 | −0.34 |
| Water bodies | 0.48 | −1.00 | 0.37 | 0.63 | 0.27 | −0.66 | −0.17 | 0.22 | 0.07 |
Table 4.
Main LULC change trajectories in the study area (1947–2018).
| Class | Description | LULC Change Trajectories | Area | |||||||||
|---|---|---|---|---|---|---|---|---|---|---|---|---|
| 1947 | 1958 | 1968 | 1972 | 1987 | 1995 | 2000 | 2010 | 2018 | (ha) | (%) 1 | ||
| 1 | Recent golf course expansion | A | A | A | A | A | A | A | G | G | 68.95 | 0.38 |
| Old discontinuous expansion | A | A | A | A | D | D | D | D | D | 66.30 | 0.36 | |
| Recent PPF expansion | S | S | F | F | F | F | F | PPF | PPF | 43.26 | 0.24 | |
| Recent discontinuous expansion | A | A | A | A | S | S | S | D | D | 37.50 | 0.21 | |
| Old sparsely discontinuous expansion | A | A | A | A | SD | SD | SD | SD | SD | 31.69 | 0.17 | |
| Recent sparsely discontinuous expansion | A | A | A | A | A | A | A | SD | SD | 20.28 | 0.11 | |
| Old horizontal expansion | A | A | A | A | H | H | H | H | H | 13.51 | 0.07 | |
| Recent vertical expansion | A | A | A | A | S | S | S | V | V | 9.97 | 0.05 | |
| Old vertical expansion | A | A | A | A | V | V | V | V | V | 6.09 | 0.03 | |
| Recent horizontal expansion | A | A | A | A | A | A | A | H | H | 2.20 | 0.01 | |
| Other | 1884.94 | 10.35 | ||||||||||
| Total | 2184.69 | 12.00 | ||||||||||
| 2 | Old densification | D | D | H | H | H | H | H | H | H | 21.94 | 0.12 |
| Old verticalization | D | D | V | V | V | V | V | V | V | 4.77 | 0.03 | |
| Other | 126.67 | 0.70 | ||||||||||
| Total | 153.38 | 0.84 | ||||||||||
| 3 | Old/permanent forest regrowth | S | S | S | S | S | F | F | F | F | 568.81 | 3.12 |
| S | S | S | F | F | F | F | F | F | 206.13 | 1.13 | ||
| A | A | A | F | F | F | F | F | F | 105.30 | 0.58 | ||
| Recent land fallow | A | A | A | A | A | A | A | S | S | 274.41 | 1.51 | |
| Old farmland abandonment | A | A | A | A | A | S | S | S | S | 331.59 | 1.82 | |
| A | A | A | A | S | S | S | S | S | 290.83 | 1.60 | ||
| A | S | S | S | S | S | S | S | S | 242.72 | 1.33 | ||
| Old/permanent forest clearing | F | F | S | S | S | S | S | S | S | 93.42 | 0.51 | |
| Other | 4923.57 | 27.04 | ||||||||||
| Total | 7036.78 | 38.65 | ||||||||||
| 4 | Permanent agricultural land | 4911.68 | 26.98 | |||||||||
| Stable forest | 3063.84 | 16.83 | ||||||||||
| Permanent water bodies | 432.20 | 2.37 | ||||||||||
| Stable artificial surfaces | 231.19 | 1.27 | ||||||||||
| Permanent wetland | 192.04 | 1.05 | ||||||||||
| Total | 8830.95 | 48.50 | ||||||||||
1 1% of the study area corresponds to nearly 182 ha. (A: Agricultural, D: Discontinuous urban fabric, F: Forest, G: Golf courses, H: Continuous horizontal urban fabric, PPF: Public and private facilities, S: Shrubs, SD: Sparse discontinuous urban fabric, V: Continuous vertical urban fabric).
Table 5.
Spatial pattern metrics of LULC change trajectories (1947–2018).
| Class | Description | Spatial Pattern Metrics | ||||||
|---|---|---|---|---|---|---|---|---|
| LPI | ED | FRAC_AM | ENN_MN | IJI | SPLIT | nLSI | ||
| 1 | Recent golf courses expansion | 0.162 | 0.622 | 1.209 | 245.195 | 41.601 | 378,225.960 | 0.065 |
| Old discontinuous expansion | 0.052 | 1.978 | 1.166 | 131.373 | 44.047 | 3,394,317.522 | 0.240 | |
| Recent PPF expansion | 0.084 | 0.265 | 1.117 | 96.433 | 0.274 | 1,208,831.185 | 0.037 | |
| Recent discontinuous expansion | 0.049 | 0.972 | 1.234 | 215.403 | 32.666 | 3,800,556.119 | 0.204 | |
| Old sparsely discontinuous expansion | 0.009 | 1.025 | 1.111 | 238.950 | 42.965 | 56,878,109.698 | 0.259 | |
| Recent sparsely discontinuous expansion | 0.007 | 0.549 | 1.104 | 388.682 | 40.700 | 63,670,633.588 | 0.212 | |
| Old horizontal expansion | 0.006 | 0.488 | 1.157 | 144.220 | 39.091 | 121,380,048.023 | 0.288 | |
| Recent vertical expansion | 0.012 | 0.240 | 1.107 | 217.146 | 26.796 | 59,888,820.803 | 0.175 | |
| Old vertical expansion | 0.003 | 0.183 | 1.108 | 379.186 | 30.641 | 310,071,331.491 | 0.220 | |
| Recent horizontal expansion | 0.001 | 0.076 | 1.082 | 811.381 | 45.354 | 995,567,796.829 | 0.255 | |
| All changes from non-built to artificial surfaces | 3.273 | 45.284 | 1.347 | 44.123 | 81.593 | 658.123 | 0.093 | |
| 2 | Old densification | 0.016 | 0.653 | 1.207 | 275.597 | 40.032 | 19,169,051.682 | 0.219 |
| Old verticalization | 0.005 | 0.161 | 1.151 | 579.445 | 37.774 | 163,466,702.582 | 0.185 | |
| All changes between artificial surfaces categories | 0.148 | 18.166 | 1.255 | 40.644 | 93.439 | 314,369.841 | 0.355 | |
| 3 | Old/permanent forest regrowth | 0.817 | 4.373 | 1.173 | 288.776 | 40.351 | 9357.543 | 0.039 |
| Recent land fallow | 0.043 | 3.514 | 1.130 | 226.143 | 62.918 | 634,174.129 | 0.103 | |
| Old farmland abandonment | 0.439 | 10.032 | 1.159 | 98.212 | 59.250 | 36,177.471 | 0.095 | |
| Old/permanent forest clearing | 0.138 | 0.534 | 1.130 | 692.603 | 38.902 | 392,944.770 | 0.038 | |
| All changes between non-built categories | 17.761 | 67.717 | 1.251 | 43.793 | 95.561 | 29.415 | 0.044 | |
| 4 | Permanent agricultural | 4.844 | 0.310 | 1.287 | 84.036 | 65.075 | 262.123 | 0.044 |
| Stable forest | 0.712 | 0.353 | 1.166 | 66.343 | 51.964 | 3737.601 | 0.046 | |
| Permanent water bodies | 0.671 | 1.762 | 1.230 | 52.692 | 52.174 | 17,317.435 | 0.049 | |
| Permanent wetlands | 0.143 | 1.662 | 1.128 | 110.192 | 39.890 | 285,008.051 | 0.066 | |
| Stable artificial surfaces | 0.083 | 6.180 | 1.198 | 32.467 | 57.946 | 1,272,299.354 | 0.479 | |
| All unchanged | 37.387 | 12.162 | 1.232 | 32.243 | 78.859 | 7.103 | 0.041 | |
Publisher’s Note: MDPI stays neutral with regard to jurisdictional claims in published maps and institutional affiliations. |
© 2021 by the authors. Licensee MDPI, Basel, Switzerland. This article is an open access article distributed under the terms and conditions of the Creative Commons Attribution (CC BY) license (https://creativecommons.org/licenses/by/4.0/).
Share and Cite
MDPI and ACS Style
Faria de Deus, R.; Tenedório, J.A. Coastal Land-Use and Land-Cover Change Trajectories: Are They Sustainable? Sustainability 2021, 13, 8840. https://0-doi-org.brum.beds.ac.uk/10.3390/su13168840
AMA Style
Faria de Deus R, Tenedório JA. Coastal Land-Use and Land-Cover Change Trajectories: Are They Sustainable? Sustainability. 2021; 13(16):8840. https://0-doi-org.brum.beds.ac.uk/10.3390/su13168840
Chicago/Turabian StyleFaria de Deus, Raquel, and José António Tenedório. 2021. "Coastal Land-Use and Land-Cover Change Trajectories: Are They Sustainable?" Sustainability 13, no. 16: 8840. https://0-doi-org.brum.beds.ac.uk/10.3390/su13168840
Note that from the first issue of 2016, this journal uses article numbers instead of page numbers. See further details here.