
Climate Change and Thermal Comfort in Top Tourist Destinations—The Case of Santorini (Greece)


Institute for Environmental Research & Sustainable Development (IERSD), National Observatory of Athens, GR-15236 Athens, Greece
*
Author to whom correspondence should be addressed.
Sustainability 2021, 13(16), 9107; https://0-doi-org.brum.beds.ac.uk/10.3390/su13169107
Submission received: 25 June 2021
/
Revised: 10 August 2021
/
Accepted: 11 August 2021
/
Published: 14 August 2021
(This article belongs to the Special Issue Assessing Vulnerability and Resilience to Climate Change Impacts in the Mediterranean Region)
Abstract
:The Mediterranean area is one of the most visited tourist destinations of the world, but it has also been recognized as one of the most vulnerable to climate change areas worldwide with respect to increased thermal risk. The study focuses on a top worldwide tourist destination of the Mediterranean, Santorini Island in Greece, and aims to assess the past, present and future thermal environment in the island based on the advanced Universal Thermal Climate Index (UTCI). The study utilizes historical observations capturing past (late 19th to early 20th century) and more recent (1982–2019) time periods, while future projections are realized based on four regional climate models (RCMs) under the weak mitigation scenario (RCP4.5) and the non-mitigation scenario with high emissions (RCP8.5). The frequency of cold stress conditions at midday decreases during winter and early spring months by up to 19.8% (January) in the recent period compared to the historical one, while heat stress conditions increase in summer by up to 22.4% (August). Future projections suggest progressive shifts of the UTCI towards higher values in the future and an increase in the exposure time under heat stress depending on the RCM and adopted scenario. The increase in moderate and strong heat stress conditions is mainly expected during the summer months (June, July, August); nevertheless, a noticeable increase is also foreseen in September and May. The highest occurrences of favorable (no thermal stress) conditions are also projected to shift by one month, from June to May and from September to October, in the future.
1. Introduction
Climate is one of the key factors determining tourists’ destination choice. In this respect, all destinations are climate-sensitive and vulnerable to possible impacts of climate change. Although the association between climate change and all aspects of tourism is complicated, global warming is already affecting the tourism industry and will continue to pose a risk to this sector of economy [1,2]. Several studies in the literature investigate the implications of climate change on thermal comfort and how these may affect the presence of tourists in different destinations around the world such as Australia [3], China [4], Cuba [5] and Palma (Spain) [6].
The Mediterranean area is one of the most visited tourist destinations of the world especially during summer, mainly due to favorable climatic conditions including warm and sunny weather. At the same time, the area has been recognized as one of the most vulnerable areas to climate change worldwide with respect to observed and future thermal risk [7,8,9,10,11].
Recent studies point to a noticeable deterioration of the optimal summer climatic conditions across most of the Mediterranean coasts by the end of the 21st century and possible shifts of optimal conditions for beach-based tourism into spring (March, April, May) and autumn (September, October, November) [12,13,14]. By applying future climate scenarios in Portugal, Casimiro and Calheiros [15] report that thermal comfort based on the Physiologically Equivalent Temperature (PET) index may decrease in summer (June, July, August) but increase in spring, autumn and winter (January, February, December) months, possibly resulting in new opportunities for the tourism industry from the lengthening of the tourist period. Observed and projected seasonal shifts of hot extremes occurrence and elongation of the warm and hot season of the year have been also reported in different sites of the eastern Mediterranean [16]. According to the study of Giannakopoulos et al. [17], the number of days with great discomfort is expected to increase in most coastal regions and islands in Greece over the period 2021–2050 under the A1B scenario, with the highest increases in the island of Rhodes and the lowest in the Cyclades group of islands. In the Cycladic island of Milos, heat stress assessed by PET is projected to increase by 21 days in the near future period (2021–2050) under the RCP4.5 stabilization scenario and by 24 days under the high emissions RCP8.5 scenario [18]. Based on the Tourism Climate Index (TCI), an empirical indicator consisting of sub-indices that describe thermal comfort, precipitation, sunshine and wind speed, Lemesios et al. [19] found that the good and very good conditions (according to the index scale) for general tourism activities during summer in the present climate in Cyprus are expected to change to just acceptable conditions in the distant future under the A1B greenhouse gas (GHG) emissions scenario.
Along the same line, investigating the implications of a 2 °C global warming in European summer tourism through the TCI, Grillakis et al. [13] found more favorable conditions in central and northern Europe for the future period 2031–2060, with Mediterranean countries likely losing the privileges during the hot summer months, whereas it becomes more favorable in the early and late summer seasons. The study of Rosselló-Nadal [20] also reports a gradual shift of tourists towards higher latitudes due to climate change. On the other hand, according to the study of Rutty and Scott [21], the range of air temperature perceived by tourists as ideal or unacceptably hot/cold vary by tourism segment and beach tourists seem to prefer warmer environment than urban sightseeing tourists. According to a recent study [14], the number of beach tourists visiting Antalya (Turkey) in the summer months of the years 2007–2015 showed a growing trend from year to year despite the great discomfort conditions that were observed during those months. An additional factor, besides air temperature, that seems to affect the selection of a tourist destination is rain. The absence of rain has often been rated as a more important factor than comfortable temperatures among tourists, influencing the choice of travel destination [22,23].
Implications of climate change on thermal environment and well-being are mainly inspected on the basis of air temperature or simple thermal climate indices which incompletely describe the potential impacts on humans [24,25,26]. On the contrary, advanced indices which take into account the heat exchange theory and have thermo-physiological basis describe in a more comprehensive and rational way the impact of thermal environment on humans [25,27]. In addition, the potential effects of climate change should be based on the outputs of more than one regional climate models in order the range of the projected changes to be more representative.
The present study focuses on the island of Santorini (Greece) and aims to investigate the frequency of thermal stress levels as well as the multiannual variability and trends in heat stress for the historical period from the late 19th to the early 20th century (1898–1927) and for the recent period 1982–2019. By employing four regional climate models under two emissions scenarios, the study further aims to explore and compare the projected heat stress and thermal comfort levels in the future climate. Changes in the seasonality of heat stress and thermal comfort conditions are also investigated. The analysis is based on 3-hourly observational and model data employing the advanced Universal Thermal Climate Index. The study holds some interesting and new input, like the application of a variety of regional climate models, the use of a rational bioclimatic index like the UTCI and the temporal coverage of a variety of periods, namely, a historical period (dating since the late 19th century), a more recent and two future periods.
2. Materials and Methods
2.1. Study Area
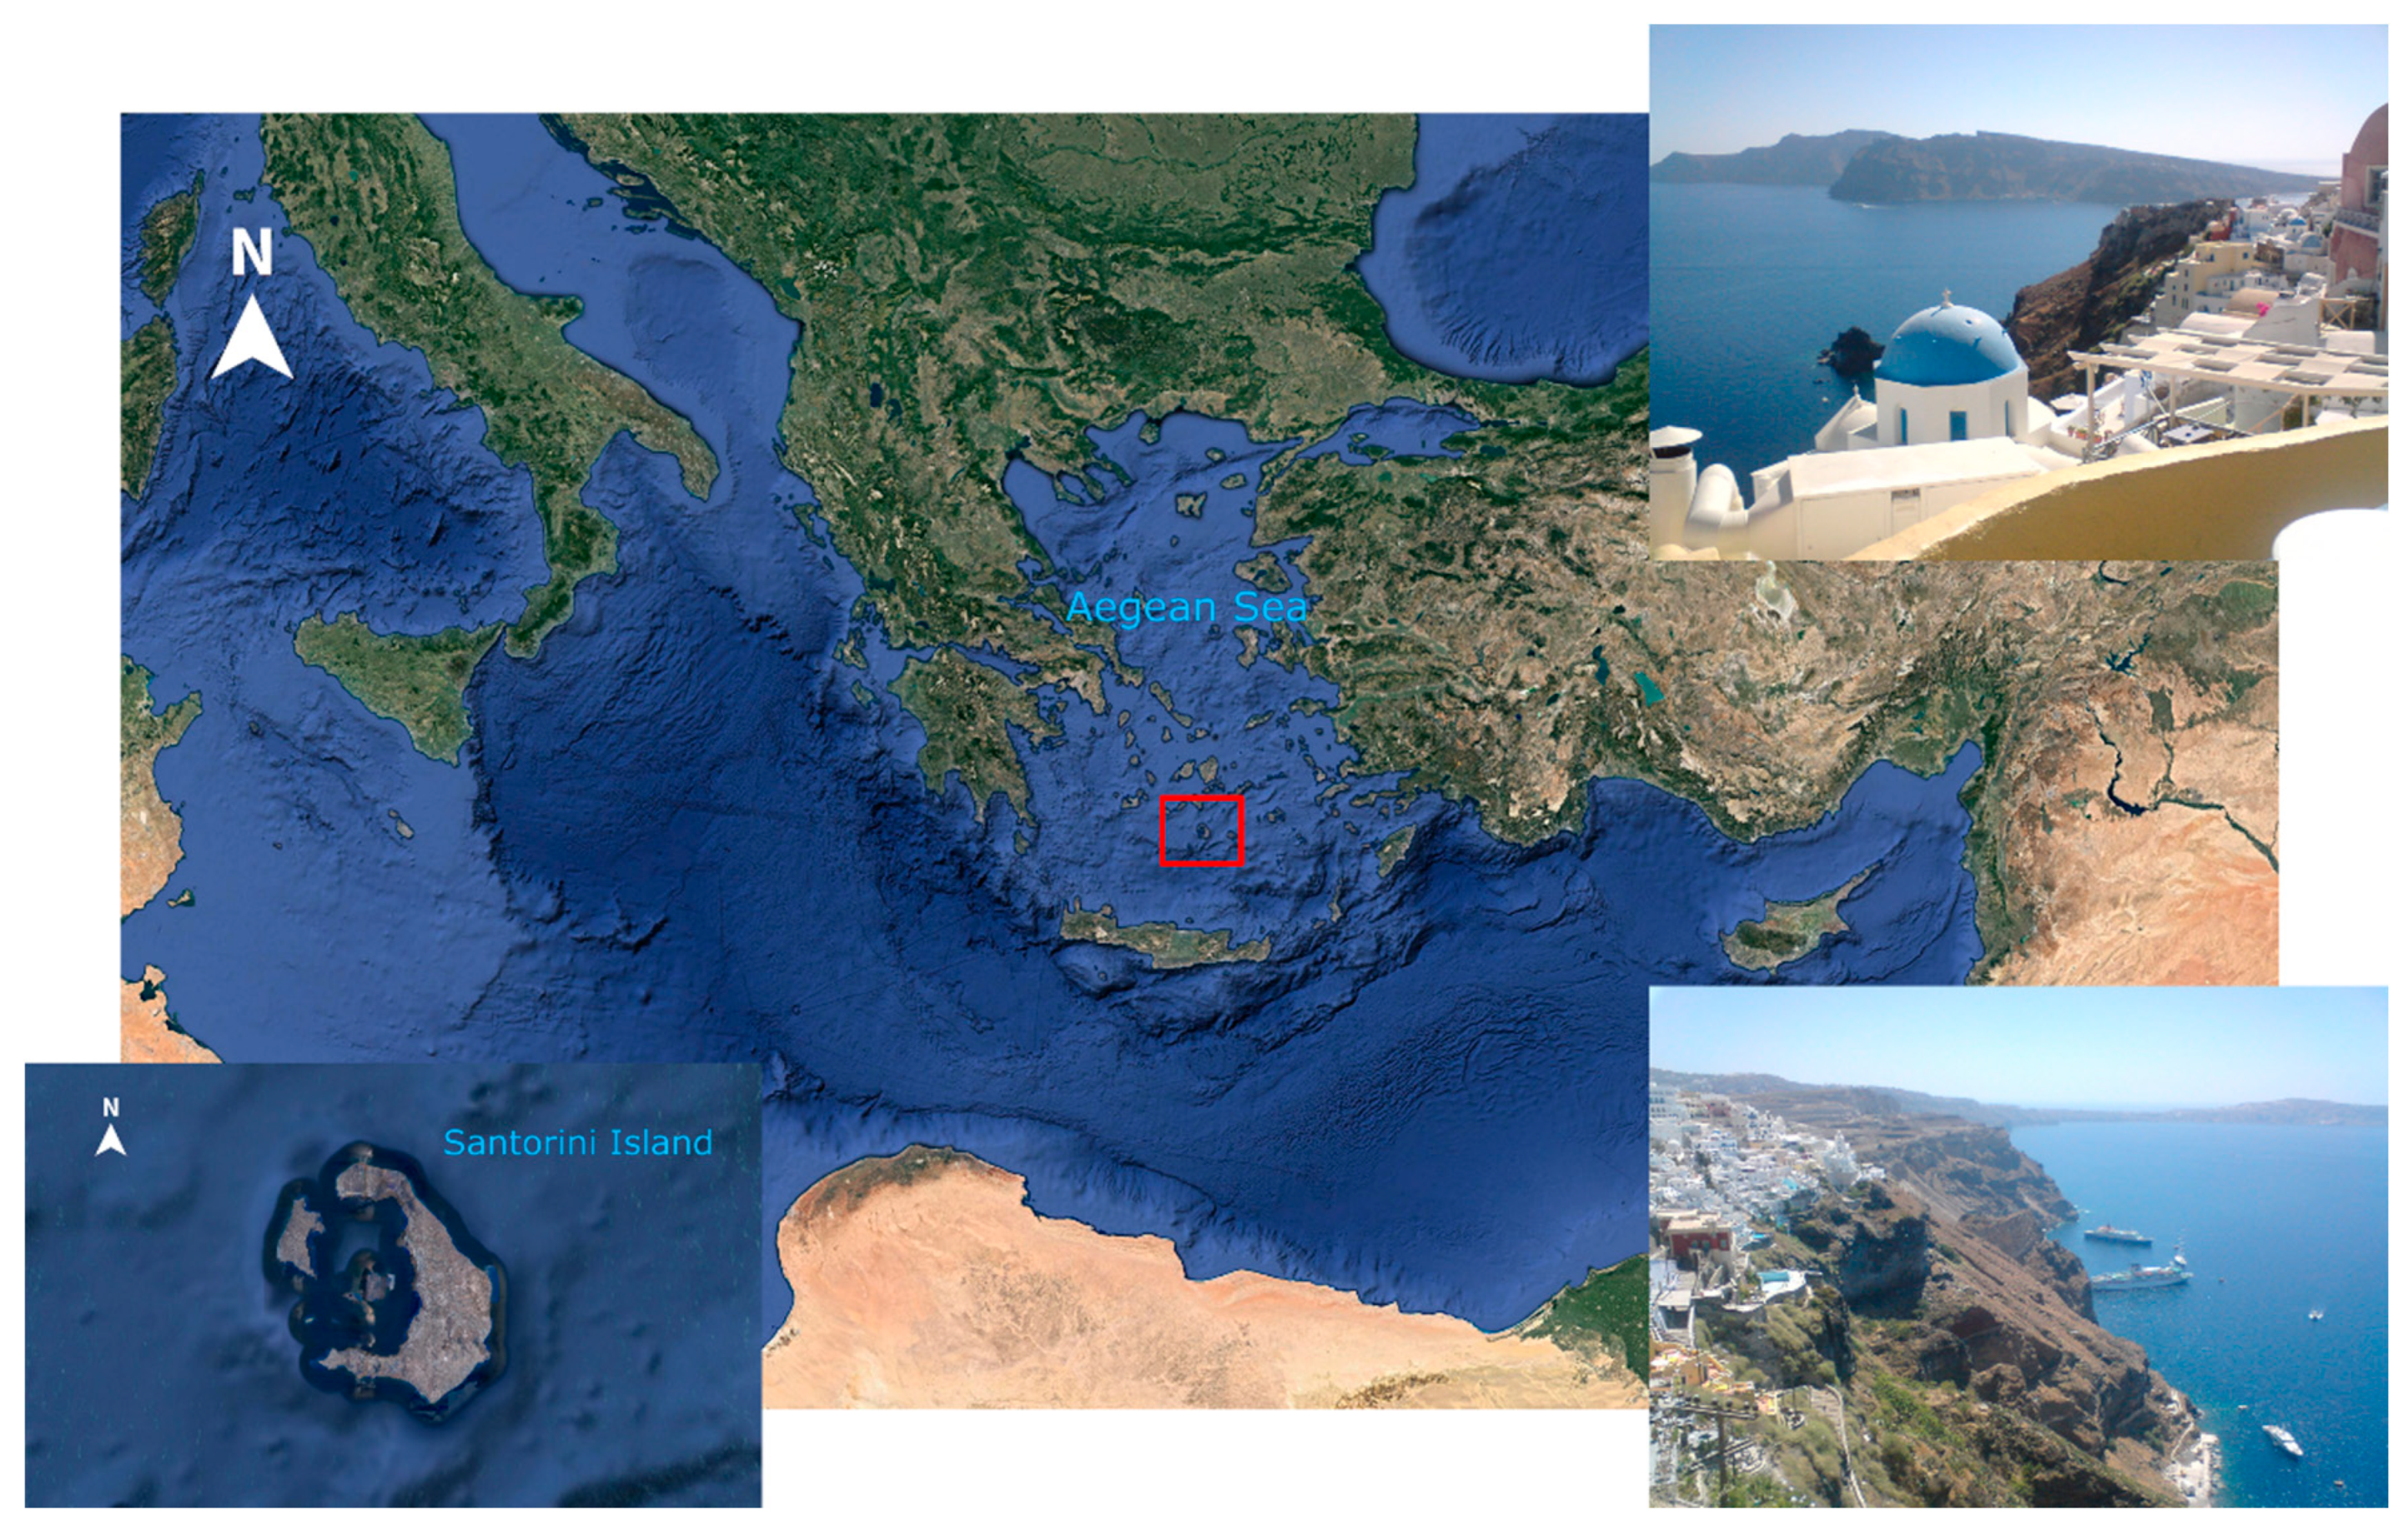
Santorini, officially known as Thira or Thera, forms the southernmost member of the Cyclades group of islands, which numbers 220 islands in south Aegean Sea, Greece (Figure 1). The island, which covers a total surface area of about 76.2 km2, is the remnant of the original round volcanic island after the devastating volcanic eruption at the late Bronze Age. Although the island has a permanent resident population of 15,550 people [28], a large number of tourists from all over the world are attracted from its unique landscape, its good climate and its cultural heritage. Santorini hosted more than 1,100,000 visitors in 2015 [29]. The total number of tourist arrivals by international and domestic flights, by passenger ships and cruise ships is continuously growing, not only during the summer season but all year round, making this small island one of the most popular tourist destinations in the world [30].
The island of Santorini is located in the Mediterranean climate zone, with warm and dry summers and cool winters. In summer season, dry winds of north-northeast direction known as “Etesians” prevail over the Aegean Sea diminishing the formation of clouds and precipitation and resulting in high sunshine duration. On the basis of meteorological observations for the period 1982–2019, the mean monthly air temperature ranges from 12.2 °C in February to 26.2 °C in July and the mean annual value is 18.9 °C. The mean annual relative humidity is 67.4% and the mean monthly values vary between 60.4% in June and 72.1% in November. The mean monthly wind speed ranges from 5.3 m/s in May to 7.4 m/s in February and the mean monthly cloud cover varies from 0.3 oktas in July and August to 4.6 oktas in December.
2.2. Data Based on Observations
The analysis was based on 3-hourly time series of air temperature, relative humidity, dew point, wind speed and cloud cover, spanning a period of 38 years (1982–2019). The climatic records were obtained by the Hellenic National Meteorological Service (HNMS), which operates the homonymous meteorological station (WMO id 16744) on the island. The station is located at the international airport of Santorini at the position 25°28′ E longitude and 36°24′ N latitude, at an elevation of 40 m above msl.
In addition, the study benefits from the rare historical climatic observations conducted in the island from the late 19th to the early 20th century. Specifically, the historical station of Santorini belonged to the first national network of meteorological stations established and operated from 1894 to 1931 in Greece under the Direction and supervision of the National Observatory of Athens (NOA). The historical observations of the network have been evaluated and used for the creation of the first climatic maps of Greece [31,32]. The 30-year period from 1898 to 1927 was selected for the analysis, based on data completeness (98.4%). The historical record includes, among others, subdaily observations (08:00, 14:00 and 21:00 LST, LST = UTC + 2 h) of air temperature, relative humidity, wind speed and cloud cover. Only the historical observations at 14:00 LST were used in the analysis, due to coincidence with the observational time of the more recent climatic records (1982–2019).
2.3. Data Based on Regional Climate Models’ Simulations
Simulations of air temperature, relative humidity, wind speed and downwelling shortwave radiation at 3-hourly step were retrieved for the closest land model grid point to the HNMS station’s location on Santorini Island from a set of four state-of-the-art Regional Climate Models (RCMs) in the framework of EURO-CORDEX (Coordinated Regional Climate Downscaling Experiment) modeling experiment (http://www.euro-cordex.net (accessed on 12 June 2020)) with a horizontal resolution of about 12 km (0.11°). Specifically, these four RCMs are the RCA4 regional climate model of the Swedish Meteorological and Hydrological Institute (SMHI) [33] driven by four different global climate models: (1) the HadGEM-ES (hereafter MOHC) of the Met Office Hadley Centre [34,35], (2) the MPI-ESM-LR (hereafter MPI) of the Max Planck Institute for Meteorology [36], (3) the CNRM-CM5 (hereafter CNRM) of the Météo France Institute [37] and (4) the IPSL-CM5A-MR (hereafter IPSL) of the Institut Pierre Simon Laplace [38]. These four simulations are basically the RCA4 SMHI regional climate model with boundary conditions from four different global models (MPI, MOHC, CNRM and IPSL), which makes the combined modeling systems substantially diverse so as to be considered as different models. The simulated data cover three periods the 1982–2005 reference period, the near future period 2035–2058 and the distant future period 2075–2098. Two new IPCC emissions scenarios [39] are implemented in the future simulations, the weak climate change mitigation scenario (RCP4.5) and the non-mitigation business as usual scenario with high emissions (RCP8.5). The RCP4.5 is a stabilization scenario in which total radiative forcing is stabilized shortly after 2100, suggesting that various climate policies are implemented [40]. The RCP8.5 is characterized by increasing GHG emissions over time, representative of scenarios in the literature that lead to high GHG concentration levels [41], representing a future state where no climate policies aiming at the reduction of GHG emissions are implemented [42].
2.4. UTCI Model and Data Configuration
A large number of human thermal climate indices have hitherto been presented in the world literature [43]. In the present analysis, the Universal Thermal Climate Index (UTCI) was selected for the assessment of human thermal comfort. This selection was elicited from the rationale of the index and its completed energetic and thermo-physiological basis. In addition, UTCI scores higher than other indices in validity, comprehensiveness and sophistication criteria [27]. Recent research focusing on Europe confirms the importance and validity of UTCI to capture the thermal bioclimatic variability and its effects on human health [44]. Another advantage of UTCI is its ability to describe all climates, quantifying thermal sensations from extreme heat stress to extreme cold stress [45,46]. The thermal sensation scale of other advanced thermal indices, such as the Physiologically Equivalent Temperature (PET) or the Standard Effective Temperature for Outdoors (OUT_SET*), are less detailed for extreme hot or extreme cold conditions [46]. In addition, the thermal scale of PET can vary depending on the climate region [46].
The UTCI originates from a multi-node thermo-physiological model [47], extensively validated across a wide range of conditions [48]. This thermo-physiological model simulates the heat exchange between the human body and its environment by sensible heat fluxes (convection, respiration), latent heat fluxes (evaporation, respiration) and radiation (longwave and shortwave) [45]. An adaptive clothing model is also integrated for the estimation of clothing worn by the general population depending on air temperature [49]. The thermo-physiological model represents an average person walking at a speed of 1.1 m/s on level ground. This activity corresponds to a metabolic rate of 135 W/m2 [45]. The outcome is an equivalent temperature, the so called UTCI, which can be classified in ten thermal stress categories in order to reflect the physiological response of the human body in the environment under consideration (Table 1) [50]. According to this classification, UTCI values above or below a certain threshold are associated with corresponding thermal stress conditions. For example, a UTCI value above 26 °C suggest “at least moderate heat stress conditions” and a UTCI value above 32 °C suggests “at least strong heat stress conditions”. The exceedances (number of cases) of UTCI above certain thresholds are then linked with the cases of corresponding thermal stress conditions.
The simulations of UTCI were carried out according to the program code presented in the official site of UTCI project (http://www.utci.org/ (accessed on 14 September 2020)), using the variables of air temperature, water vapor pressure, wind speed and mean radiant temperature. The mean radiant temperature was quantified employing the micro-scale RayMan model [51,52]. The simulation of mean radiant temperature was performed based on the meteorological parameters (air temperature, humidity, wind speed and cloud cover or downwelling shortwave radiation), the location specific details (longitude, latitude and elevation) and the time details (time zone, local time and day of year). According to field experiments conducted in simple and complex environments, the simulated mean radiant temperature by the RayMan model presents a good agreement with the measured mean radiant temperature [51,52]. However, the RayMan model seems to underestimate the mean radiant temperature at low solar elevations due to its inability to consider the reflected radiation from vertical surfaces [52,53].
The performance of regional climate models was assessed by means of the cumulative frequency distribution and the two-sample t-test. The cumulative frequency distribution displays the running total of all the preceding frequencies in the frequency distribution. Compared to other frequency distributions is more straightforward and is extremely helpful to determine the frequency up to a certain threshold as well as to compare sets of data. In order to produce the cumulative frequency curves of UTCI time series, a number of narrow bins was applied across the whole range of UTCI values and the corresponding frequencies were extracted. The area enclosed between the cumulative frequency curves is an indicator of the magnitude of the discrepancies between the UTCI values based on observations and those based on simulations. Along with this, the two-sample t-test was applied to analyze the difference between the means of the UTCI values based on observations and the UTCI values based on simulations for each one of the used RCMs separately, in the reference period, at the 0.05 significance level.
In order to estimate the long-term linear trends of UTCI, the least square regression analysis was applied. The non-parametric Mann–Kendall test was adopted to test the statistical significance of trends as well as the year when the trends become statistically significant (95% confidence level).
The analysis of observational and simulated data of UTCI concerns either all months of the year or the period of high tourist activity on the island (April to October).
3. Results
3.1. Thermal Comfort and Heat Stress in Present and Past Climate
The frequency distribution of UTCI thermal stress categories per month for the present climate (1982–2019) is given in Figure 2a. The two extreme categories of the UTCI scale, namely, extreme heat stress and extreme cold stress, are not observed throughout the day for the study period in Santorini. Cold stress conditions (UTCI < 9 °C) dominate from December to March, with percentages up to 81.9% in January, 79.7% in February, 72.6% in December and 66.9% in March. Nevertheless, these cold stress conditions are mainly slight and moderate. The frequencies of strong and very strong cold stress do not cumulatively exceed 10% per month from December to March. The conditions of no thermal stress dominate between April and November, reaching the maximum frequencies in September (76.4%), in May (73.5%) and in October (72.8%). The onset and cessation months of conditions leading to heat stress (UTCI > 26 °C) are March and November, respectively. These conditions, however, are present in extremely low frequencies in these months. Higher frequencies of heat stress conditions are observed between June and September, reaching a maximum of 36.7% in July, followed by 36.0% in August, 25.6% in June and 19.4% in September. The frequencies of strong and very strong heat stress (UTCI > 32 °C) cumulatively exceed 4.4% during the summer months, showing a maximum of 7.6% in July.
Figure 2b,c present the frequency distribution of UTCI thermal stress categories per month focusing exclusively on 14:00 LST for a 30-year period in the historical (1898–1927) and recent climate (1982–2011), respectively. A clear reduction in the frequencies of cold stress conditions (UTCI < 9 °C) is mainly evident from November to April for the present period compared to the historical one. In particular, the frequency of cold stress has decreased by 16.8% in December, 19.8% in January and 12.9% in February, whereas the frequency of no thermal stress has increased during these months. In the recent period (1982–2011), the frequency of heat stress (UTCI > 26 °C), has increased by 20.0% in June, 18.5% in July, 22.4% in August and 16.1% in September as compared to the historical period (1898–1927). The frequency of moderate heat stress holds a considerable portion of the total increase in heat stress. Nevertheless, the frequencies of strong and very strong heat stress (UTCI > 32 °C) have cumulatively increased by 8.0% in July and 6.6% in August in the recent period.
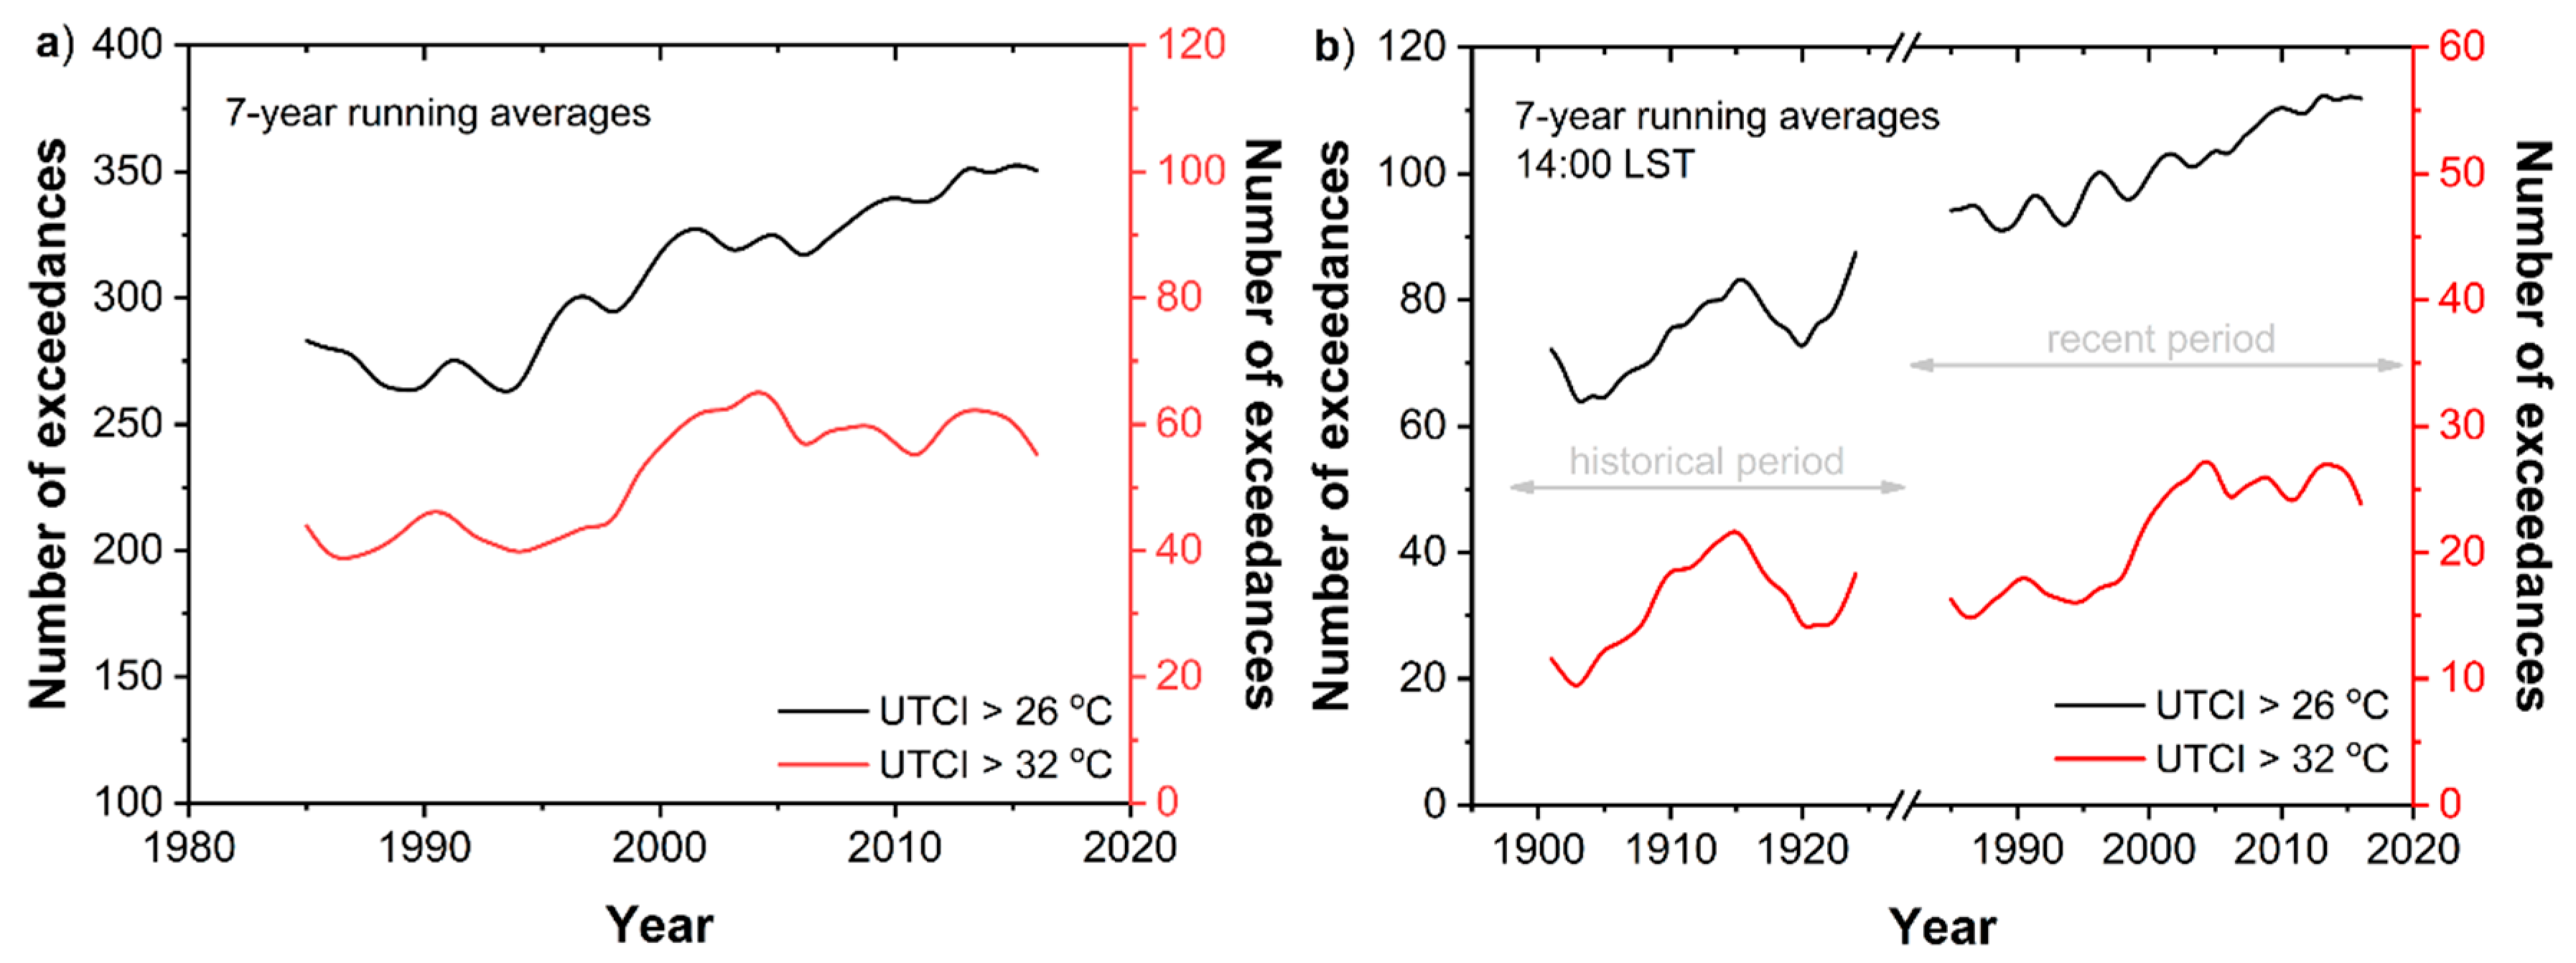
Figure 3a shows the annual number of UTCI exceedances above the thresholds of UTCI > 26 °C (at least moderate heat stress) and UTCI > 32 °C (at least strong heat stress) for the recent period (1982–2019). For the UTCI > 26 °C threshold (at least moderate heat stress), a continuous upward tendency in the number of exceedances is observed from the mid-1990s onwards. The corresponding pattern for the UTCI > 32 °C threshold (at least strong heat stress) exhibits an upward tendency from the end-1990s, whereas a stabilization is noted from the mid-2000s onwards. The number of exceedances for the UTCI > 26 °C threshold exhibits a statistically significant increasing trend at the rate of 28.2 (±7.1) h/decade during 1982–2019. This trend becomes statistically significant (p-value 5.99 × 10⁻⁴) in the year 2010. The rate of increase for the UTCI > 32 °C threshold is 6.0 (±3.0) h/decade, but this trend is not yet statistically significant (p-value 6.46 × 10⁻²).
Figure 3b illustrates the frequency of exceedances at 14:00 LST for both, the historical and recent period. In the recent period, 1982–2019, the number of exceedances at 14:00 LST exhibits similar temporal characteristics as in the exceedance patterns concerning all observational hours (Figure 3a). For the number of exceedances under at least moderate and strong heat stress, the Mann–Kendall trend analysis demonstrates a statistically significant increasing trend at the rates of 7.0 (±2.0) h/decade and 3.5 (±1.1) h/decade, respectively. The observed positive trends become statistically significant in the years 2012 (p-value 1.35 × 10⁻³) and 2005 (p-value 9.96 × 10⁻³), respectively. In the historical period, 1898–1927, the number of exceedances for the UTCI > 26 °C threshold at 14:00 LST is lower compared to the recent period, exhibiting at the same time large fluctuations. For the UTCI > 32 °C threshold at 14:00 LST, the number of exceedances in the recent period is much higher compared to the historical one from the mid-2000s and onwards.
3.2. Models Performance Evaluation
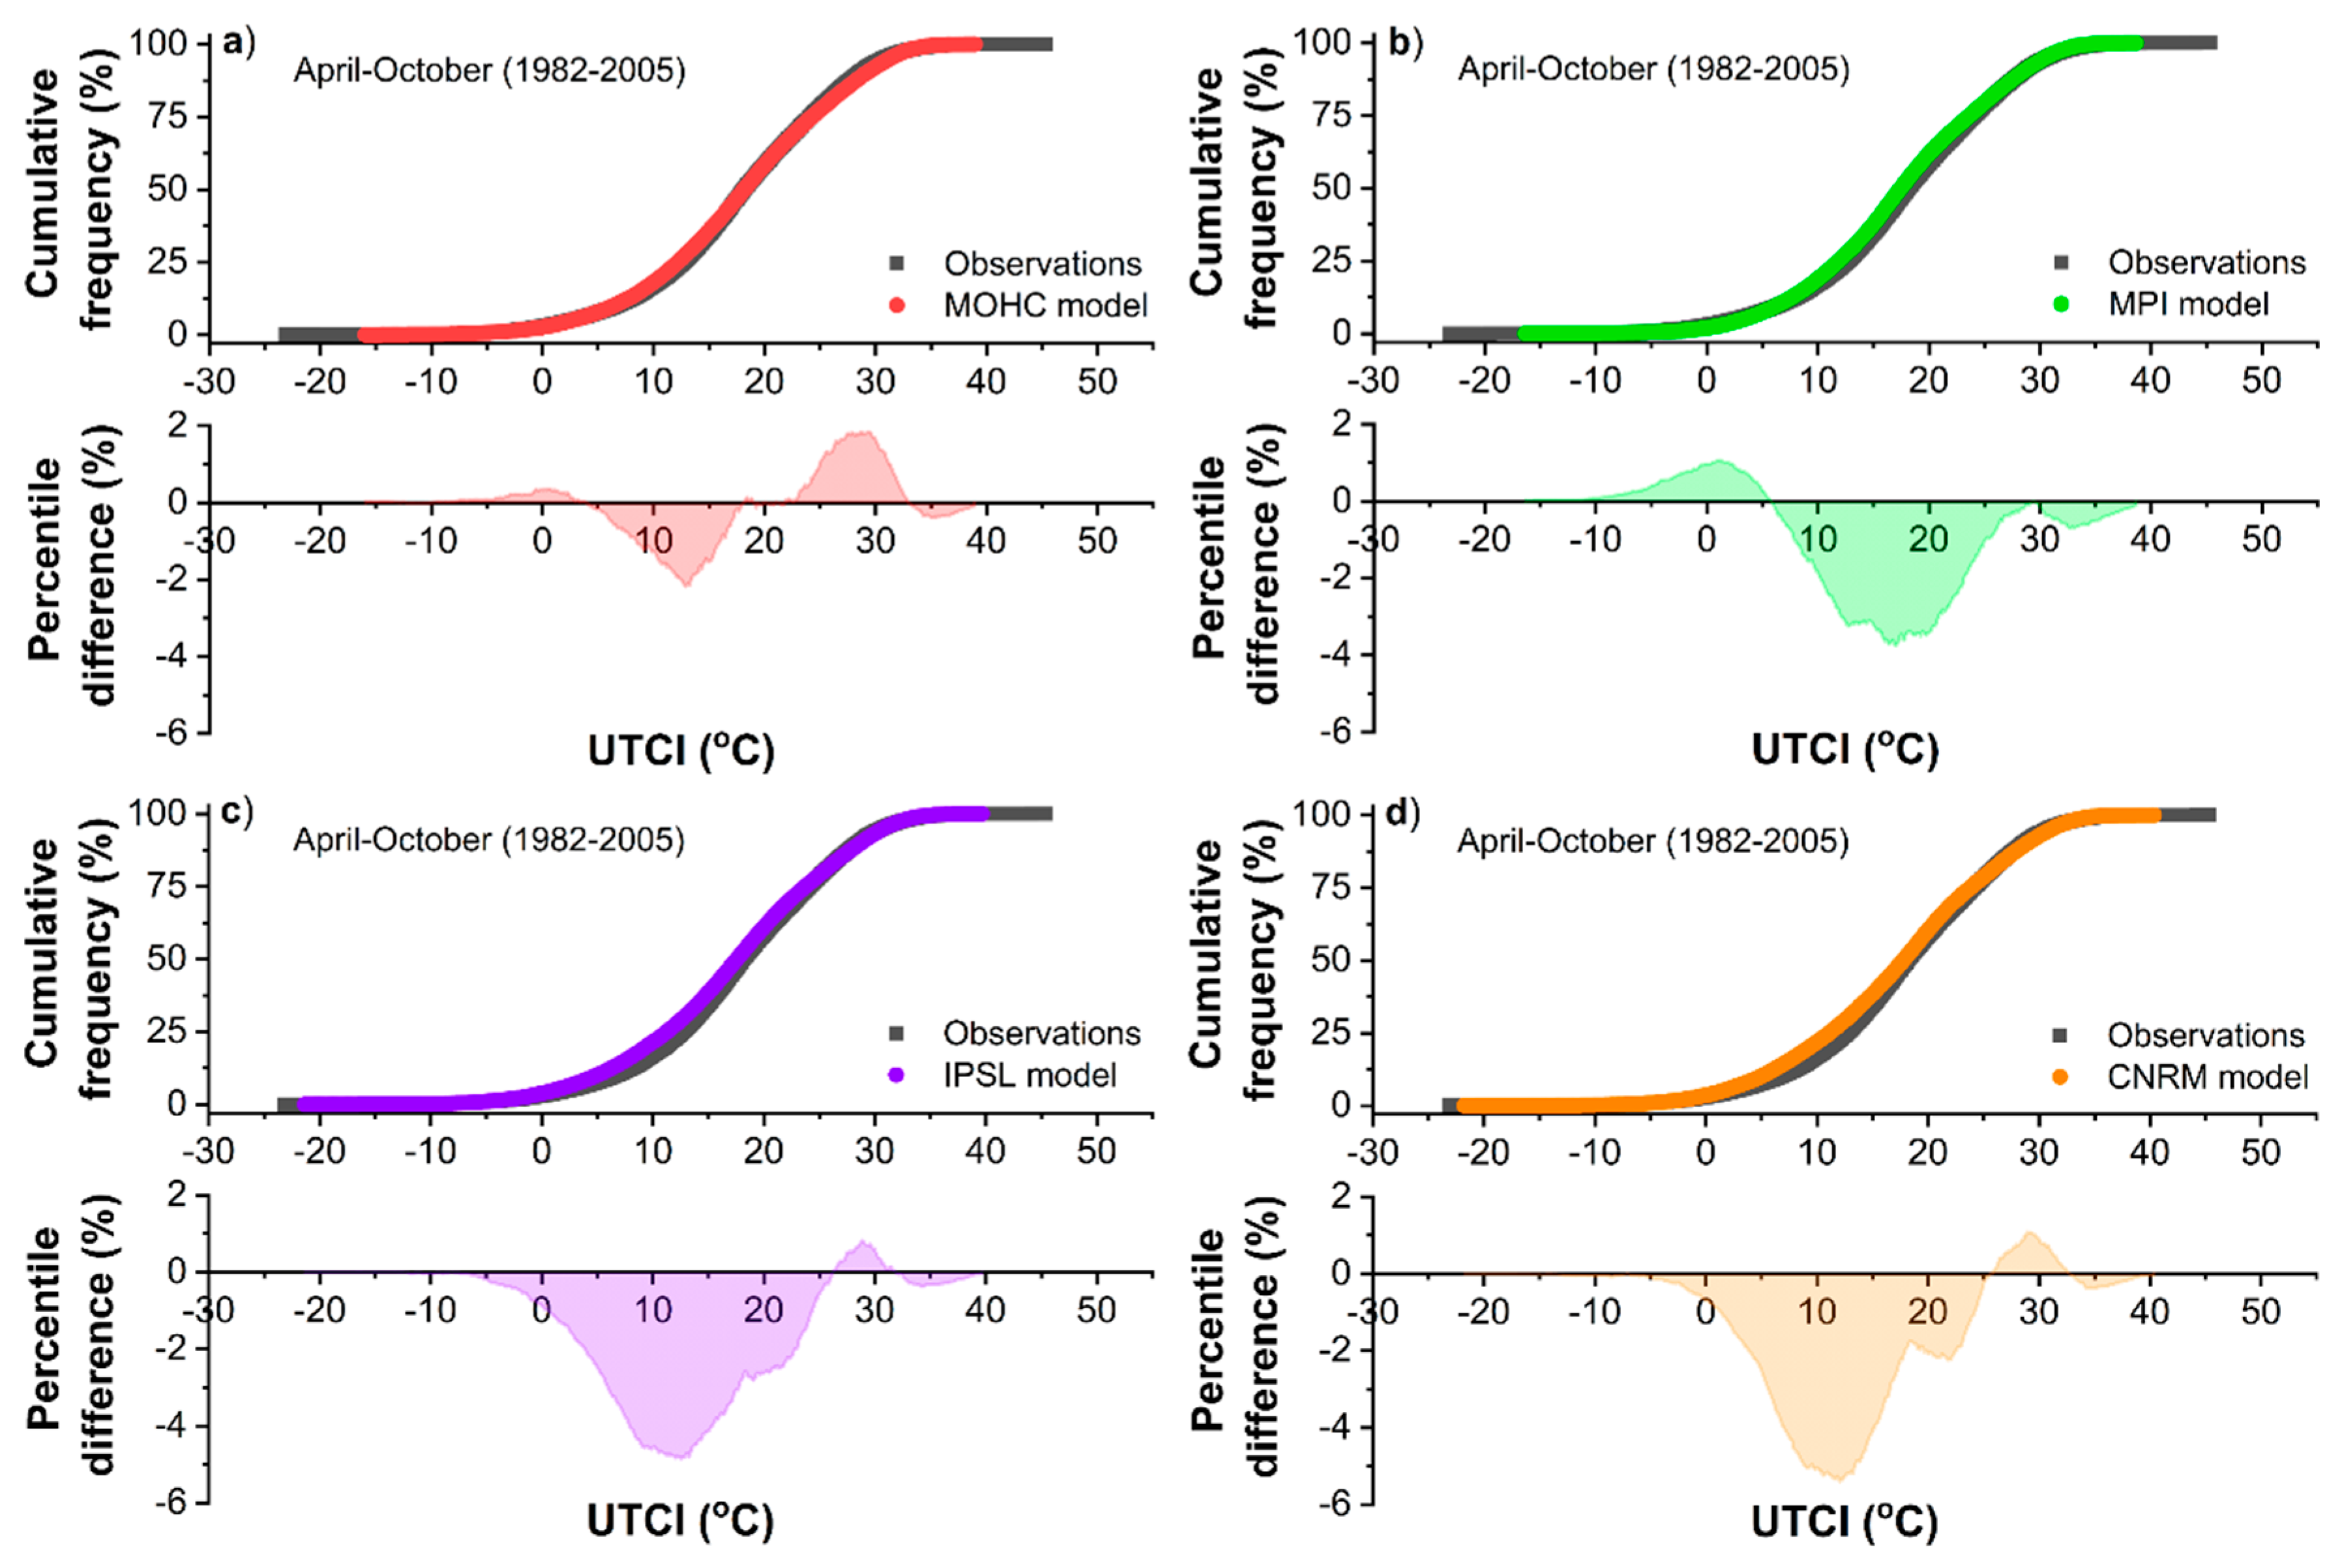
Figure 4 demonstrates the cumulative frequency curves of UTCI from observations and simulations based on the MOHC, MPI, IPSL and CNRM models, from April to October, over the reference period 1982–2005. The cumulative frequency curves between observations and simulations present relatively high overlap across almost the entire range of UTCI values in all RCMs. However, the range of UTCI values based on observations is slightly greater compared to the corresponding range of UTCI values based on simulations. This outcome is attributed to some extent to the slightly lower air temperature values predicted by the RCMs. In MOHC model, the percentile (Pct) differences between observations and simulations are less than 2.0 percentage points, presenting the maximum negative and positive differences at around 13 °C and 29 °C of the UTCI, respectively (Figure 4a). In the MPI model, the positive differences are less than 1.0 percentage point, while the maximum negative difference reaches up to −3.7 percentage points at around 17 °C (Figure 4b). In the IPSL and CNRM models, negative percentile differences up to −5.0 percentage points are mainly observed, with the maximum difference spotted at around 12 °C (Figure 4c,d). Similar results are also obtained when all months of the year are chosen over the reference period.
To further analyze the differences between observations and simulations, the two-sample t-test of the means of UTCI values was applied over the reference period (1982–2005) for all the months of the studied years and for the months from April to October (Table 2). The results presented in Table 2 are all statistically significant at level 0.05. The mean UTCI differences range from 0 °C in the MOHC model to 1.10 °C in the CNRM model when all months of the year are considered. The mean differences are smaller for the period from April to October and range between 0 °C in the MOHC model and 0.70 °C in the IPSL and CNRM models.
3.3. Future Projections of Thermal Comfort and Heat Stress Levels
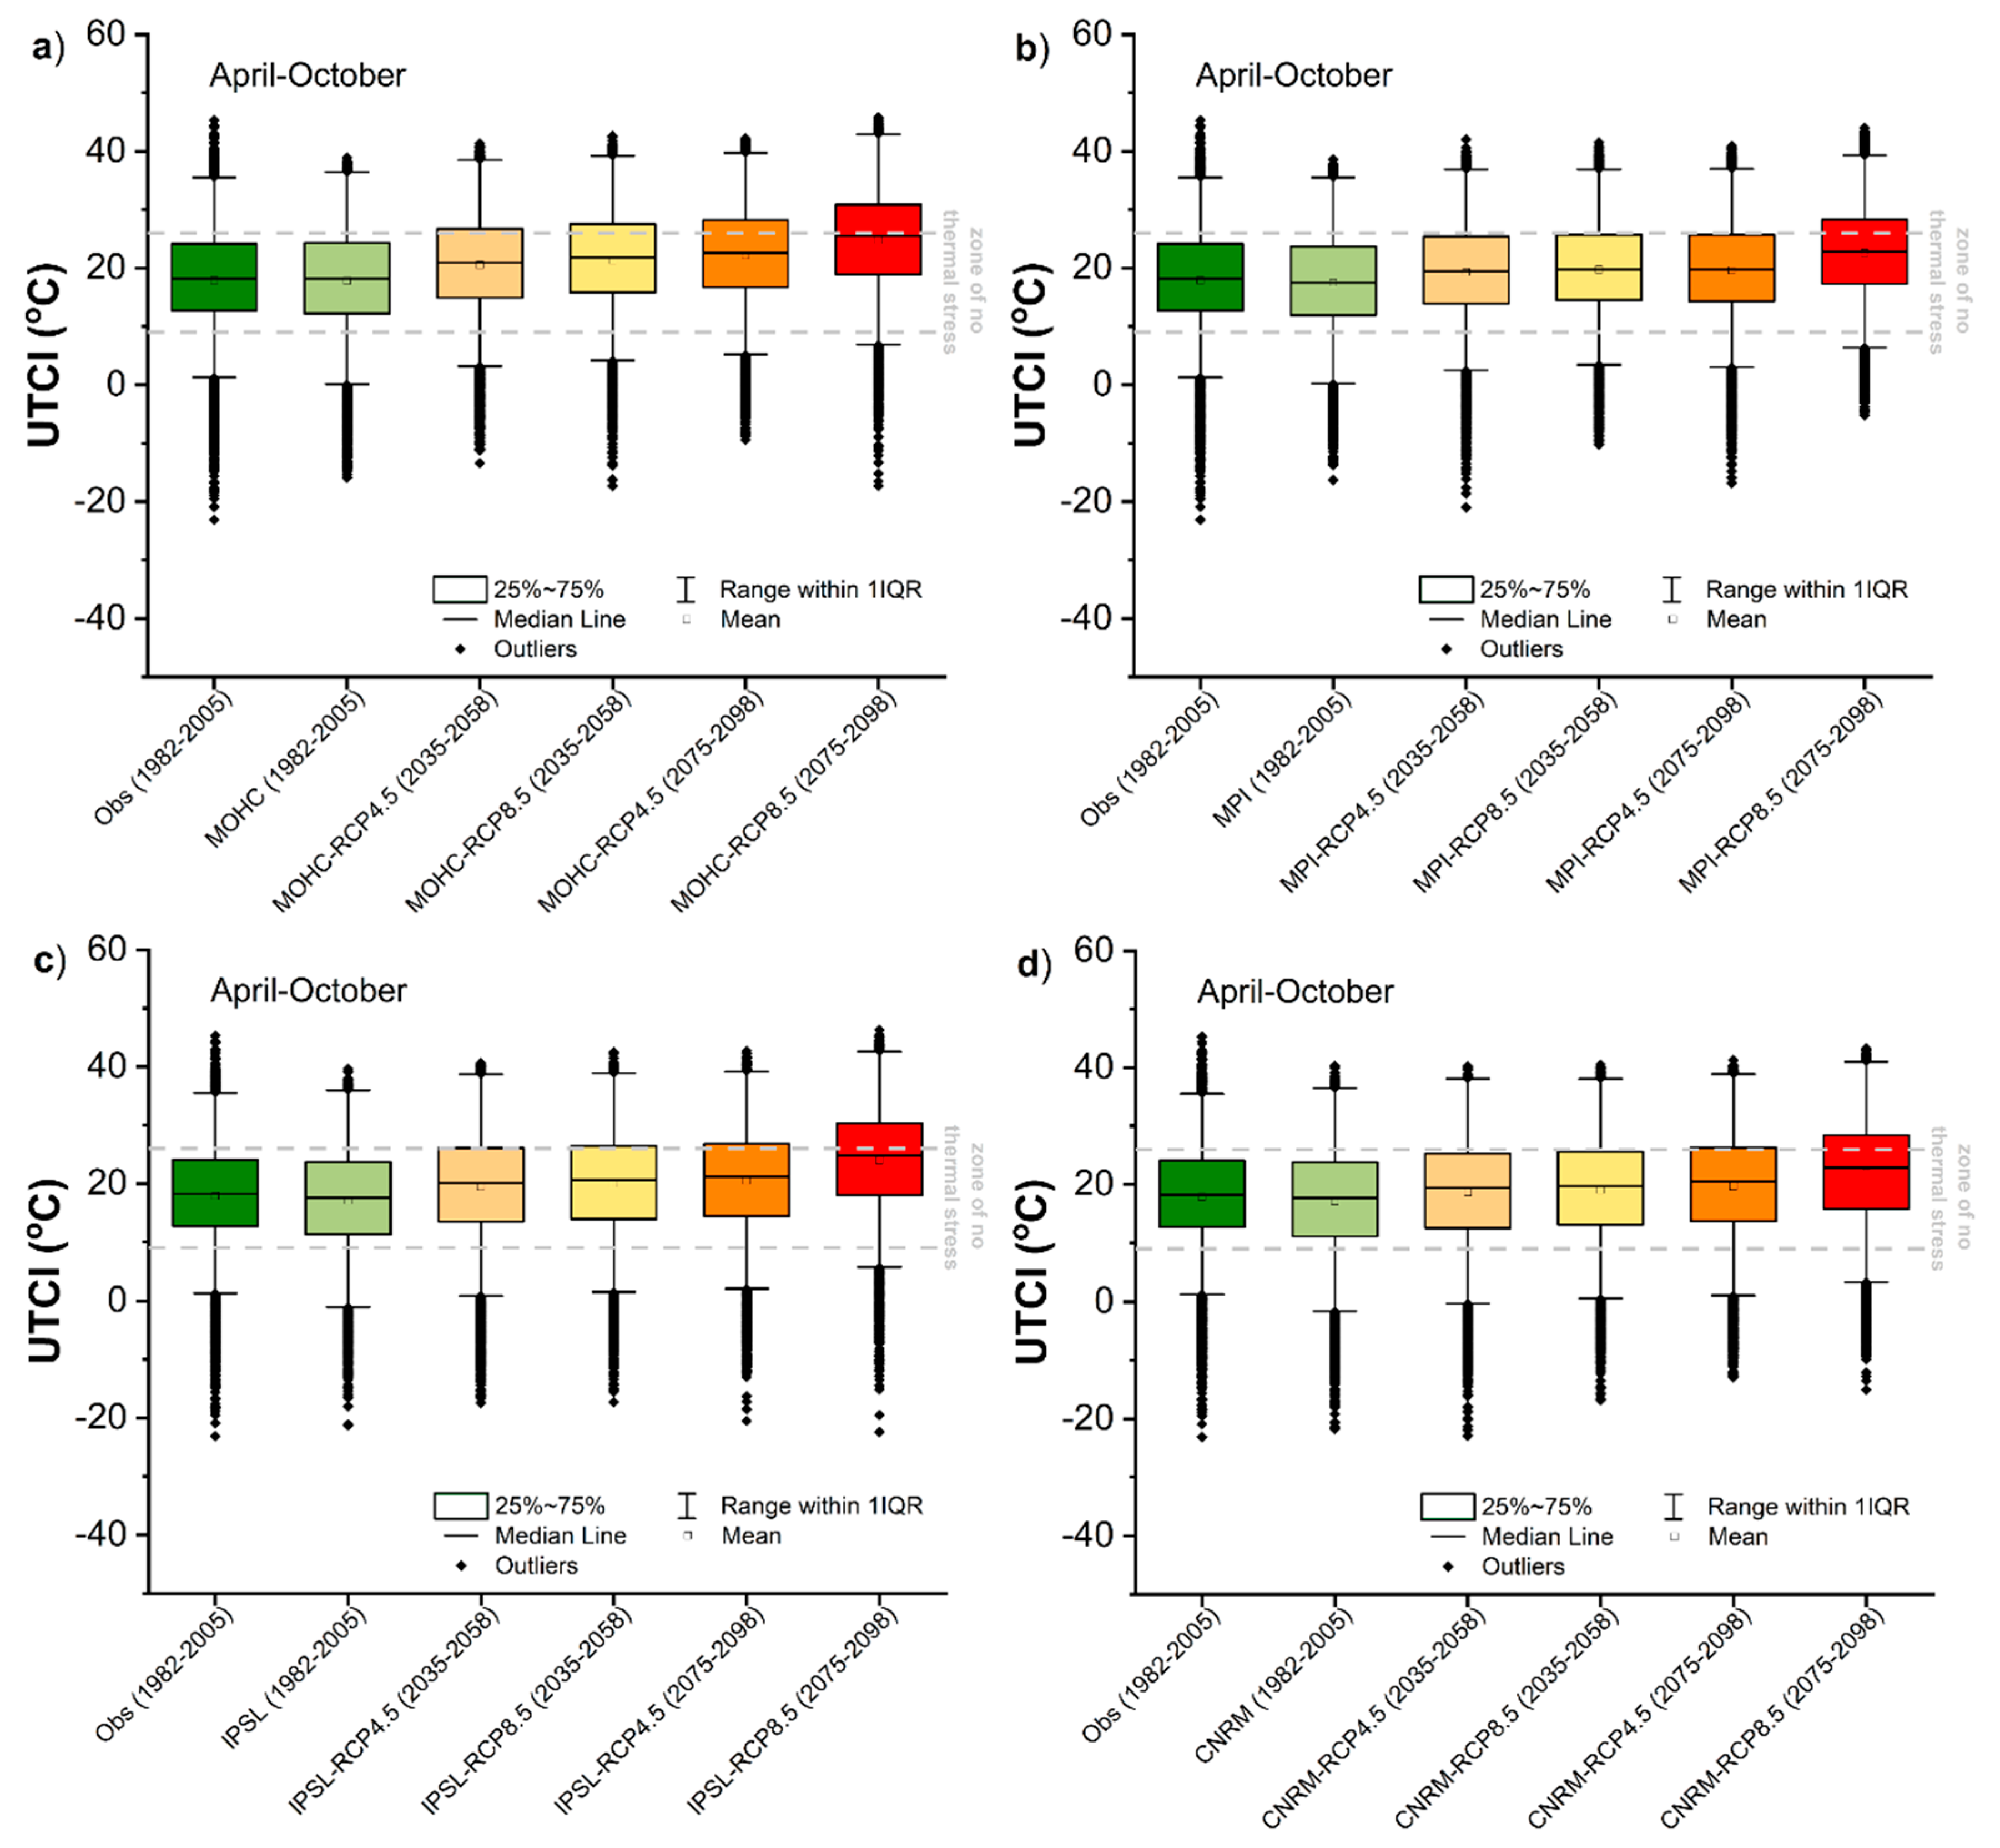
Figure 5 illustrates the Box and Whisker plots of observed and simulated UTCI (reference period), as well as simulations for near and distant future from all RCMs under both scenarios for the period of the year from April to October. The interquartile range of UTCI over the reference period lies in the zone of no thermal stress based on both observations and simulations for all four RCMs. Progressive shifts in the interquartile range of UTCI to higher values in the future periods compared to the reference period are observed. The range of these shifts, however, are not the same among the models. The most apparent shifts are noted in the MOHC model (Figure 5a), followed by the IPSL model (Figure 5c). This is probably due to the fact that these two models predict higher increase of the air temperature in the future periods than the MPI and CNRM models do. In particular, the increase of the mean air temperature in the future ranges from 2.0 °C to 5.1 °C for the MOHC, from 1.8 °C to 5.1 °C for the IPSL, from 1.4 °C to 4.0 °C for the MPI and from 1.2 °C to 3.7 °C for the CNRM model, depending on the scenario and the future period. UTCI has been reported to have a stronger correlation with air temperature than with other environmental parameters like wind speed and humidity [54]. The results based on the MOHC and IPSL models reveal that the upper quartile (75% Pct) of the interquartile range is expected to exceed the upper limit of comfort zone under both emission scenarios and for both future periods. According to the CNRM model, however, this result will be observed only in the distant future (Figure 5d), while according to the MPI model only under the RCP8.5 scenario in the distant future (Figure 5b). In particular, the 75th percentile of UTCI in the reference period is 24.1 °C (observations) and 24.3 °C (MOHC), suggesting conditions of no thermal stress. The corresponding percentile is expected to exceed 26.7 °C, reaching up to 30.9 °C, depending on the scenario and the future period, indicating conditions of moderate heat stress.
The shifts of UTCI towards higher values are also apparent at the upper percentiles for all RCMs, whereas the most considerable shifts are noted for the RCP8.5 scenario in the distant future. For example, the 95th percentile of UTCI in the reference period is 30.7 °C (observations) and 30.8 °C (IPSL), suggesting conditions of moderate heat stress. This percentile is expected to increase above 33.3 °C, reaching up to 37.7 °C, depending on the scenario and future period, indicating conditions of strong heat stress. Similar shifts are also noted at the lower percentiles, even though their range is slightly smaller than those observed at the higher ones. For instance, the 10th percentile of UTCI in the reference period is 6.7 °C (observations) and 6.5 °C (MPI), suggesting conditions of slight cold stress. Although this percentile is expected to increase in the near future, there will still be slight cold stress. In the distant future, the corresponding percentile is expected to be 8.6 °C under the RCP4.5 scenario, while under the RCP8.5 scenario is expected to further increase to 11.8 °C, suggesting conditions of no thermal stress. It is worth mentioning that in all the four models, a statistically significant difference was found between the means of the UTCI values for the RCP4.5 scenario and the UTCI values for the RCP8.5 scenario in the near future as well as in the distant future (0.05 significance level).
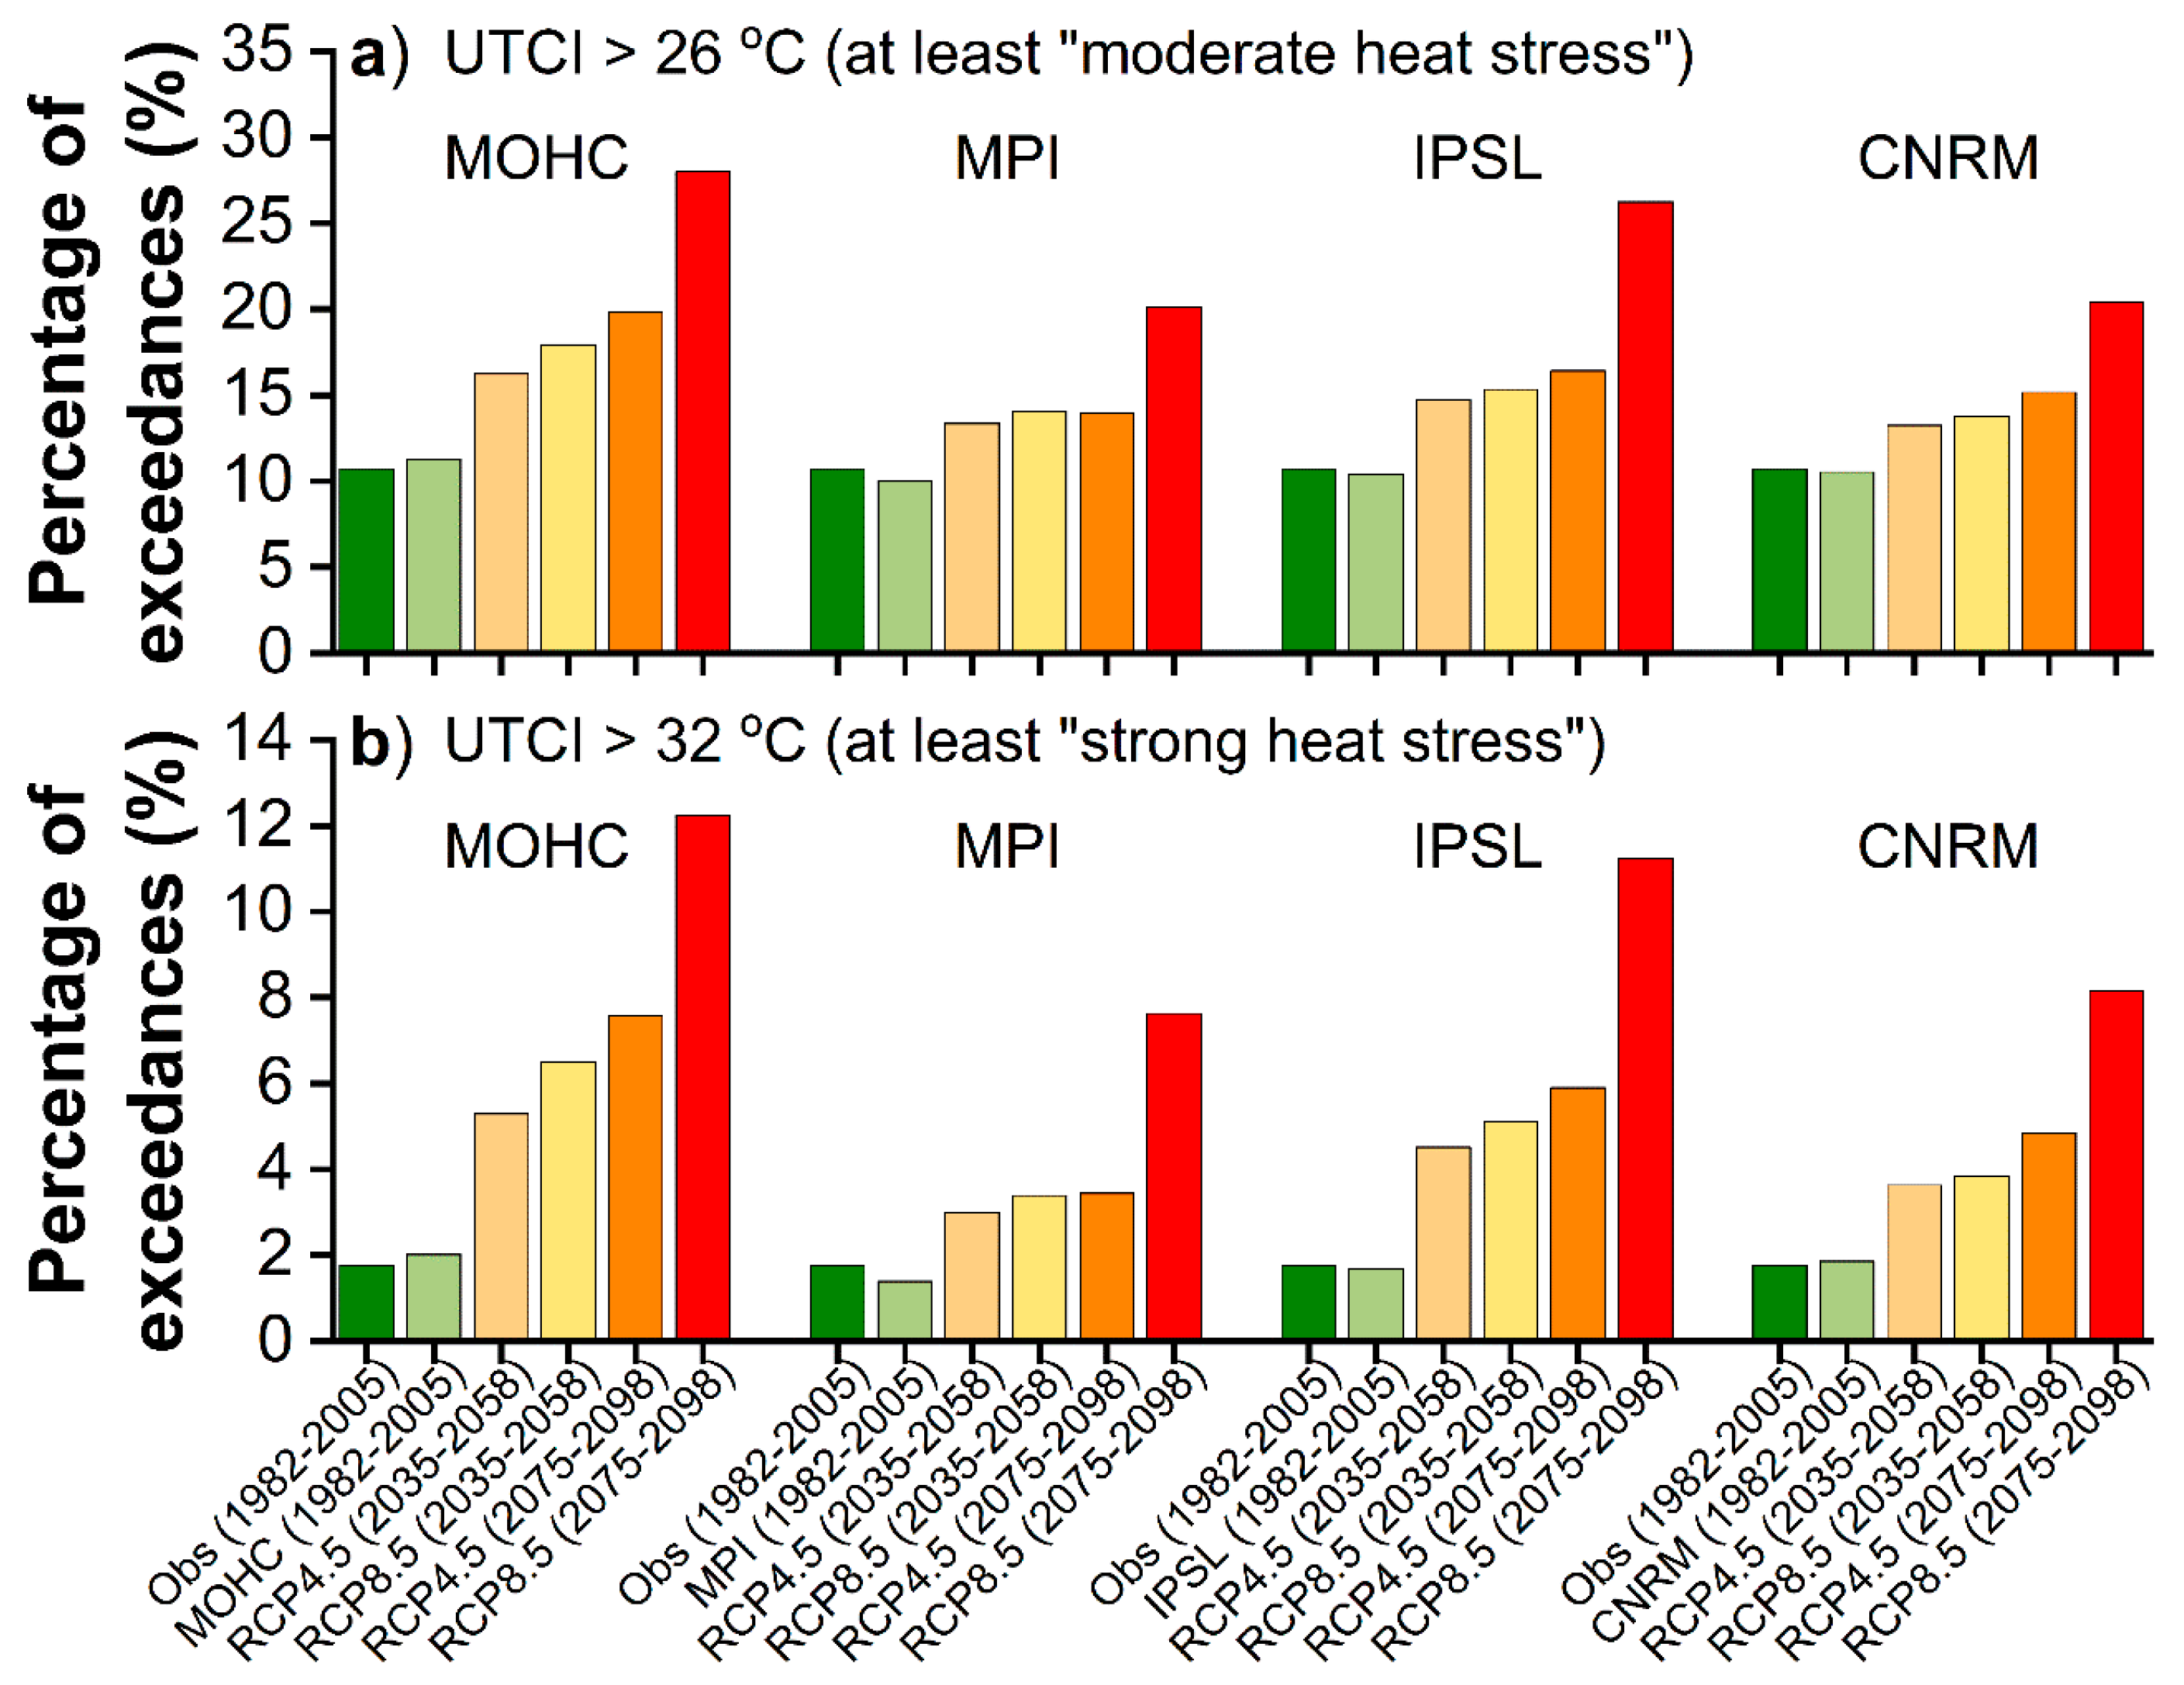
Figure 6a presents the percentage of exceedances under at least moderate heat stress (UTCI > 26 °C) for the reference period (1982–2005) and the two future periods 2035–2058 and 2075–2098 for the selected RCMs under both emissions scenarios. The percentage of exceedances reaches 10.7% in the reference period based on observations. The corresponding percentage based on simulations is slightly lower by 0.2% for the CNRM model, by 0.3% for the IPSL model and by 0.6% for the MPI model, while is slightly higher by 0.5% for the MOHC model. The extremely small difference in the percentage between observations and simulations could be construed as an additional indication that models successfully capture the exceedances above certain thresholds. The thermal conditions that cause at least moderate heat stress are expected to increase in Santorini, with the rise varying according to the emissions scenario, the future period and the RCM selected. The most pronounced increase is observed for the MOHC and IPSL models. According to the MOHC (IPSL) model, the percentages of at least moderate heat stress are expected to be higher by 5.5% (4.0%) under the RCP4.5 and by 7.2% (4.6%) under the RCP8.5 in the near future, while in the distant future the corresponding percentages increase by 9.1% (5.7%) under the RCP4.5 and by 17.3% (15.5%) under the RCP8.5 scenario compared to the reference period. Simulations based on CNRM and MPI present a more modest increase which ranges from about 2.5% (under the RCP4.5 in the near future) to about 9.5% (under the RCP8.5 in the distant future).
For at least strong heat stress conditions (UTCI > 32 °C), the percentage of exceedances from observations reaches 1.7% during the reference period in Santorini (Figure 6b). The simulated percentage for the reference period is slightly lower by 0.1% for the IPSL model and by 0.3% for the MPI model, while is slightly higher by 0.1% for the CNRM model and by 0.2% for the MOHC model. For this threshold, the simulated increase in the exceedances’ frequency until the end of the century is more striking in the MOHC and IPSL models. Based on the MOHC (IPSL) model, the exposure time under at least strong heat stress is expected to be higher by 3.5% (2.8%) under the RCP4.5 and by 4.7% (3.4%) under the RCP8.5 in the near future, while in the distant future this percentage is projected to increase by 5.8% (4.1%) under the RCP4.5 and by 10.5% (9.5%) under the RCP8.5 scenario compared to the reference period. These increments are almost two times higher than those found in CNRM and MPI simulations.
3.4. Seasonal Changes in Thermal Comfort and Heat Stress Levels
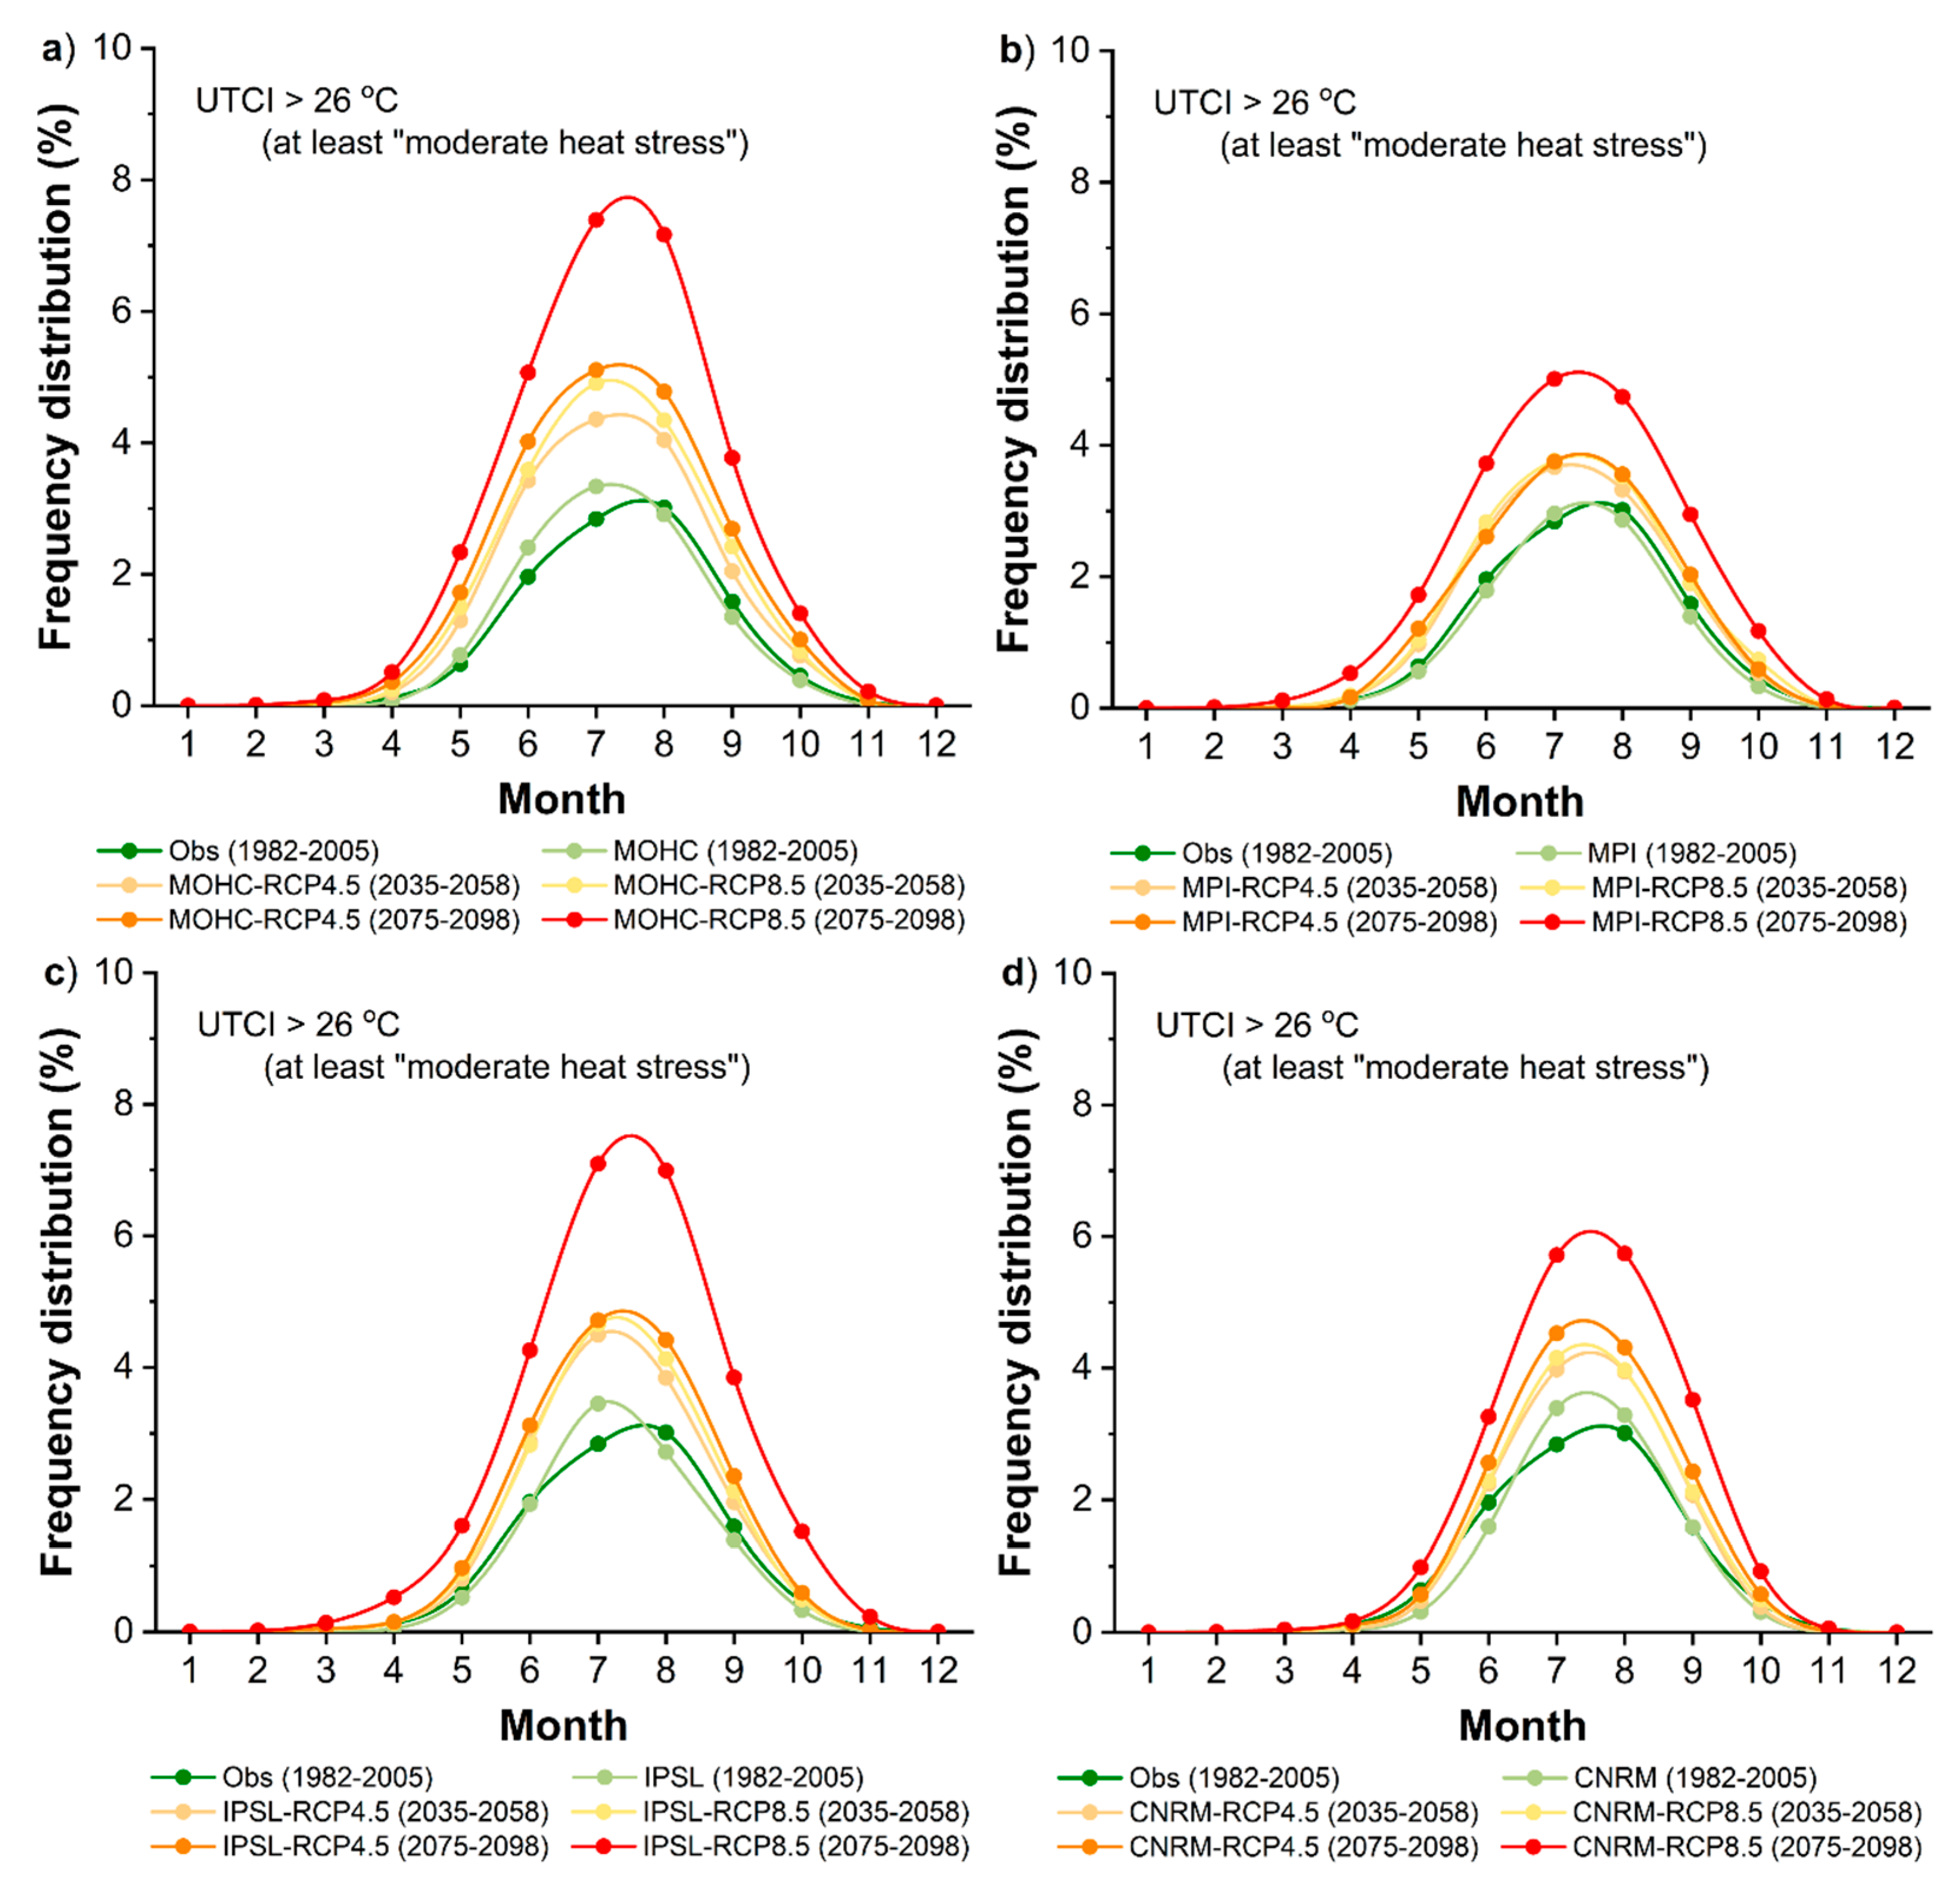
Figure 7 demonstrates the monthly distribution of heat stress frequency (UTCI > 26 °C, at least moderate heat stress) in Santorini from observations and simulations based on all selected RCMs and scenarios. In the reference period, July and August present the highest frequencies, followed by June and September. This pattern is consistent also during the future periods under both scenarios. Although all models predict higher increases in the frequency of at least moderate heat stress in the future during the summer months, the predicted increase in early autumn (September) is also prominent, approaching the corresponding increase in June. Noticeable increase is also foreseen in late spring (May) but also in October. Similar results are found for the category of at least strong heat stress (UTCI > 32 °C), with higher increases in summer months and also significant increase in September and May (not shown).
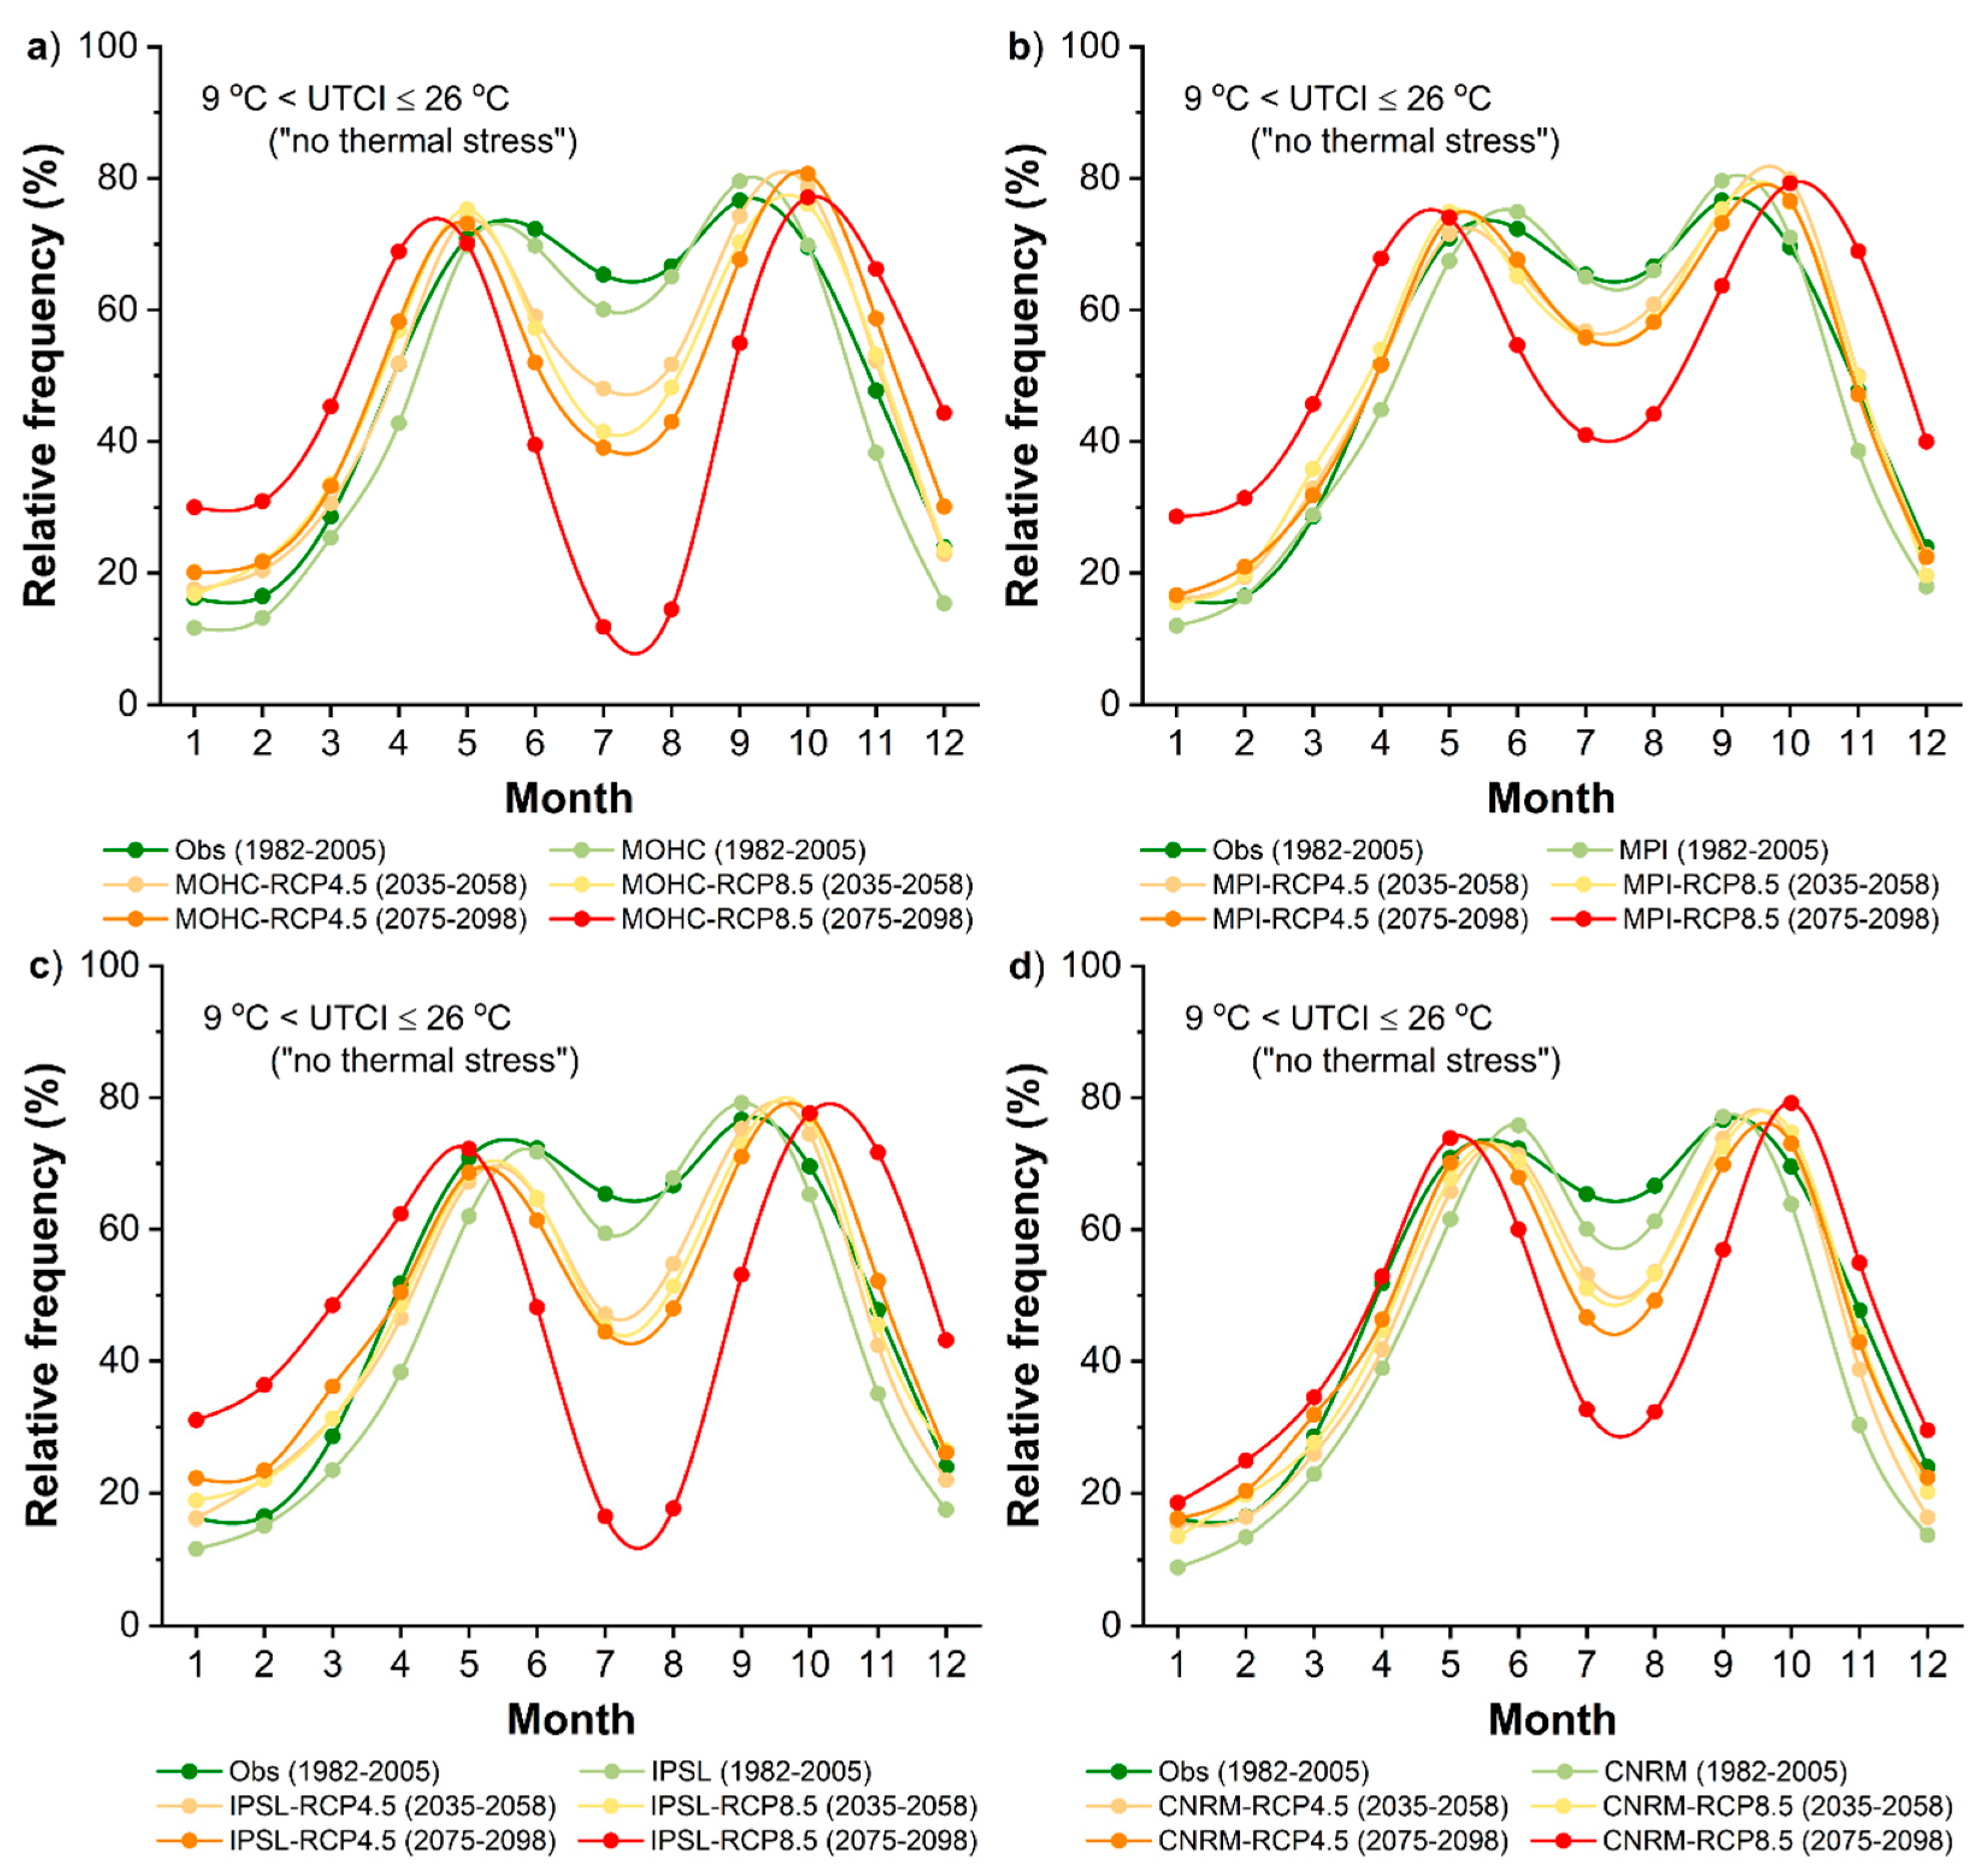
The previous analysis focused on the past and future changes in thermal stress for different thresholds in Santorini. The frequency of optimal climate conditions, or conditions of “no thermal stress” are important for tourist visits and activities all year round. Figure 8 presents the relative monthly frequency of no thermal stress conditions (9 °C < UTCI ≤ 26 °C) for the reference and the two future periods for all selected RCMs and scenarios. According to observations and simulations in the reference period, optimal conditions prevail at a relative frequency of >50% from April to October with maxima (>70%) in June and September. A shallow U-shaped pattern forms from June to September due to lower frequencies of no thermal stress conditions in July and August. In the future periods, this pattern is considerably deepening due to the large reduction of no thermal stress conditions from June to September, resulting to a V like shape which is particularly sharp in the distant future under the RCP8.5 scenario. May and October are projected to represent the months with the highest relative frequencies of no thermal stress conditions (between 65% and 79%) in the future, indicating a shift by one month compared to the reference period. The shift is also observed from the analysis of the entire period of observations (1982–2019) (Figure 2a). Apart from May and October, April and November also show an increase in the percentage of no thermal stress conditions in the future, especially in the distant future and under the RCP8.5 scenario. The latter is also evident during the winter months, when the percentage of no thermal stress conditions is expected to be twice as high in the distant future under the RCP8.5 scenario than that observed in the reference period.
4. Discussion and Conclusions
The present analysis revealed some very important features for a top tourist destination worldwide, Santorini Island in Greece, in regard to the human thermal environment (assessed through the UTCI based on 3-hourly data) during a historical (1898–1927), a recent (1982–2019) and two future periods (2035–2058 and 2075–2098). The analysis was conducted considering four models of the EURO-CORDEX experiment in order to be able to assess uncertainty in future projections. To estimate the reliability of the models, a comparison of the RCMs with respect to observations from Santorini, in terms of the UTCI, was performed. Future UTCI was estimated under 2 emission scenarios, providing different aspects of the future climate. The RCPs (Representative Concentration Pathways) describe different climate futures, all of which are considered possible depending on the volume of GHGs emitted in the years to come.
In the recent period, no thermal stress conditions prevail between May and October, which is the period of the year with the highest tourist arrivals [30]. The onset and cessation months with climate conditions leading to moderate heat stress are March and November, respectively, although such conditions appear at extremely low frequencies. Strong and very strong heat stress are mainly observed in summer (cumulatively at frequencies between 4.4% and 7.6%). The absence of extreme heat stress and the low occurrence of very strong heat stress are probably attributed to the persistent northerly-northeasterly winds, known as “Etesians”, which prevail over the Aegean Sea during the summer, lowering air temperature. The frequency of cold stress conditions at midday decreased during winter and early spring months by up to 19.8% (January) in the recent period compared to the historical one, while heat stress conditions increased in summer by up to 22.4% (August). In addition, the conditions of at least moderate heat stress exhibit a statistically significant increasing trend at the rate of 28.2 h/decade during 1982–2019. The observed increase in heat stress levels during the recent years in Santorini is in accordance with the ongoing global and regional warming [55,56] and the fact that the Mediterranean area has been recognized as one of the most sensitive to climate change areas worldwide, with respect to increased thermal risk [7,8,10]. Other studies that focused on Milos Island (Greece) [18] and the coastal city of Heraklion in Crete Island (Greece) [57], report higher frequencies of heat stress conditions and lower frequencies of no thermal stress conditions during the summer months, than those found in the present study for Santorini. This differentiation could be associated with the fact that in the cases of Milos Island and Heraklion, daily meteorological data and the PET index were used, whereas in the analysis for Santorini, 3-hourly data and the UTCI index were employed.
UTCI simulations of the reference period could not capture the extreme values seen in UTCI based on observations, neither in cold stress nor in heat stress. Still, the cumulative distribution function of UTCI demonstrates relatively high overlap across almost the entire range of UTCI values between observations and simulations. The average UTCI differences between observations and simulations range from 0 °C in the MOHC model to 1.10 °C in the CNRM model when all months of the year are considered, and from 0 °C in the MOHC to 0.70 °C in the IPSL and CNRM models for the period from April to October. The differences in UTCI are associated with the slight underestimation of air temperature (greater in CNRM and IPSL, smaller in MOHC and MPI) and wind speed by all RCMs in the reference period. The relative humidity derived from all RCMs shows slightly greater variability than that seen in observations. Furthermore, the mean radiant temperature based on simulations is slightly lower than that based on observations, and also shows smaller variability during the warm period of the year. Since the above atmospheric environmental parameters affect the UTCI, any deviations in the parameters between observations and simulations may have more or less effect on the index depending on their combination.
Projections suggest progressive shifts of the UTCI towards higher values in the future periods compared to the reference period. However, the range of these shifts is not the same between the RCMs. The most prominent shifts are noted in the MOHC model, followed by the shifts of the IPSL model, and under the RCP8.5 scenario in the distant future. The increase spotted in future UTCI results is associated with the air temperature increase projected in the future climate. This increase contributes to some extent to the increase in mean radiant temperature, which is also observed in the future climate, leading in turn to higher UTCI values. The wind speed contributes to thermal stress [50]. However, the projected wind speed does not show a clear trend towards higher or lower values in the future periods compared to the reference one, especially during summer. The thermal conditions that cause at least moderate or strong heat stress are expected to increase in Santorini, with the rise varying according to the emission scenario, the future period and the RCM selected. For instance, based on the MOHC (IPSL) model, the exposure time under at least strong heat stress is expected to increase by 3.5% (2.8%) under the RCP4.5 and by 4.7% (3.4%) under the RCP8.5 in the near future and by 5.8% (4.1%) under the RCP4.5 and by 10.5% (9.5%) under the RCP8.5 in the distant future compared to the reference period. These findings provide further insight into the future thermal environment and heat stress levels in Santorini and they are quite consistent with the results reported in other islands and tourist destinations of the Mediterranean, using different indices. Specifically, recent studies focusing on Mediterranean areas like Palma (Spain) [6], Portugal [15], Milos Island (Greece) [18], Cyprus [19], Greece [17] and Athens (Greece) [58] report projected degradation of optimal thermal conditions during the peak of the tourist period and improvement of conditions in spring and autumn.
The increase in heat stress conditions in the future is mainly expected during the summer months in Santorini. However, a noticeable increase is also foreseen in September and May. At the same time, the occurrence of conditions with no thermal stress is expected to decrease between June and September in the future. Hence, the highest occurrences of conditions with no thermal stress are shifted by one month, from June and September in the recent years to May and October in the future. Even during the winter months, especially under the RCP8.5 scenario, the conditions of no thermal stress are foreseen to increase due to the shift of cold stress levels towards the thermal comfort category. Due to the deterioration of the thermal conditions in summer, a significant redistribution in tourism traffic might be observed [12,59], resulting in new opportunities for the tourism industry from the lengthening of the summer tourist period [13,14,15,18,59]. Observed and projected seasonal shifts of hot extremes and elongation of the warm and hot season of the year have been also reported in different sites of the eastern Mediterranean [16]. Therefore, the long-term planning for the tourism industry in Santorini or elsewhere in the Mediterranean might be more focused on the potential expansion of the tourist season in the shoulder seasons, taking advantage of the improvement of thermal conditions during these periods in the future.
In the present analysis, the future UTCI values were based on the projected climate data of four RCMs. Although all simulated results are consistent among models, the magnitude of these changes varies according to the RCM. One such case among others is the difference in the frequency of no thermal stress in July which amounts to almost 30% between MOHC and MPI simulations for the distant future under the RCP8.5. Therefore, the employment of more than one RCM also provides a measure of the range and uncertainty of the potential impacts on human thermal comfort in the future.
Although the study revealed some interesting findings for the past, present and future thermal environment in a top tourist destination, the findings are subject to a number of limitations. The Universal Thermal Climate Index (UTCI) used in this study is based on contemporary science in thermo-physiology and heat exchange theory [45]. However, even such an advanced index does not take into account expectation and psychological factors, which seem to affect the actual thermal responses of individuals [60] and especially of beach tourists [61,62]. Numerous surveys have evaluated the performance of UTCI based on the subjective thermal sensation of individuals and report a very good agreement between the predictions of the index and the actual thermal sensation that was indicated by the respondents [63,64,65,66]. In addition, UTCI has been calibrated on a typical moderate activity level, assuming an individual walking at 1.1 m/s on the level corresponding to a metabolic rate of 135 W/m2. Activities with higher or lower intensity than the originally one used in this study will increase or decrease the stress levels, respectively [67], and hence the presented results do not refer to activities where the metabolic rate considerably deviates from that applied. Yet, the results presented in this study concern an open site. Tourists are in general exposed in different microclimates and thermal environments which may differ from that of an open space. However, Santorini is unlikely to present a strong diversity in local/micro scale thermal environments, due to relatively homogeneous terrain, characterized by low traditional buildings and low vegetation. Future research could be focused on the realization of on-site environmental measurements along with structured questionnaires and interviews on tourists participating in different leisure activities. In such a research the tourists’ responses could be compared with the local micro-climatic conditions as well as with their activity level.
Finally, an emerging question is whether projected changes will be beneficial or not on tourism industry in Santorini. Keeping in mind that Santorini is, among others, a destination attracting different types of tourism (sightseeing, archaeological, cultural, culinary), the extension of optimal thermal conditions in autumn and spring, but also the decrease of cold-related stress during winter months, will very likely provide opportunities for a longer tourism period in the island. Moreover, the deterioration of thermal condition in summer months related to increased heat-related stress, might have a minor effect on beach tourists, who seem to be more tolerant to warm environments [14,21].
The presented results, focused on a top world tourist destination, Santorini Island in Greece, highlight the deterioration of optimal thermal comfort conditions in the recent years compared to the early 20th century and the increase in heat stress levels depending on the emission scenario and the considered regional climate model during the summer months in the future climate. However, new opportunities in the tourism industry could arise from the expected improvement of thermal conditions in shoulder seasons and even in winter. Synthesis of the results that derived from more than one regional climate models, provides a measure of the range of the potential impacts of climate change on human thermal comfort in the future and hence more targeted actions and adaptation measures could be undertaken by the tourism industry. The assessment of thermal comfort as well as the impacts of climate change on the tourism sector, which is particularly critical for the country’s economy, should be taken into account in planning adaptation strategies policies. The results of this study could provide a valuable decision-making aid to policy makers since they describe how climate and thermal environment can affect comfort conditions for tourism, based on simulations of regional climate models, not only for the present but also for the expected future climate change conditions. In the case of Santorini, the increase in heat stress levels is clearly highlighted in this study depending on the emission scenario and the considered regional climate model during the summer months in the future climate. Such an increase requires special attention for long-term strategic planning related to the development of the future tourism capabilities, such as the extension of the tourist season in autumn and spring. In the recent years, the impacts of climate change in Greece are evident through strong warming rates, increased frequency of hot weather, expansion of the hot extremes’ season and deterioration of thermal comfort conditions, e.g., [10,16], a fact that makes the existence of a carefully planned tourism policy imperative.
Author Contributions
Conceptualization, G.K. (George Katavoutas), D.F. and C.G.; methodology, G.K. (George Katavoutas) D.F and C.G.; formal analysis, G.K. (George Katavoutas) investigation, G.K. (George Katavoutas) and G.K. (Gianna Kitsara); data curation, G.K. (George Katavoutas) and G.K. (Gianna Kitsara); writing—original draft preparation, G.K. (George Katavoutas); writing—review and editing, D.F., G.K. (Gianna Kitsara) and C.G.; visualization, G.K. (George Katavoutas). All authors have read and agreed to the published version of the manuscript.
Funding
This research was funded by the project “National Network for Climate Change and its Impacts–CLIMPACT”, which is implemented under the action “National Research Networks Infrastructures in the Fields of Medical Precision, Quantum Technologies and Climate Change” (code no. 2018ΣΕ01300001) financed by the Public Investments Program of Greece.
Institutional Review Board Statement
Not applicable.
Informed Consent Statement
Not applicable.
Data Availability Statement
Not applicable.
Acknowledgments
The authors would like to thank the Hellenic National Meteorological Service for providing the meteorological data for Santorini station.
Conflicts of Interest
The authors declare no conflict of interest.
References
- Scott, D. Sustainable tourism and the grand challenge of climate change. Sustainability 2021, 13, 1966. [Google Scholar] [CrossRef]
- Scott, D.; Hall, C.M.; Gössling, S. Global tourism vulnerability to climate change. Ann. Tour. Res. 2019, 77, 49–61. [Google Scholar] [CrossRef]
- Amelung, B.; Nicholls, S. Implications of climate change for tourism in Australia. Tour. Manag. 2014, 41, 228–244. [Google Scholar] [CrossRef] [Green Version]
- Kong, Q.; Zheng, J.; Fowler, H.J.; Ge, Q.; Xi, J. Climate change and summer thermal comfort in China. Appl. Clim. 2019, 137, 1077–1088. [Google Scholar] [CrossRef] [Green Version]
- Gómez-Martín, M.B.; Matos-Pupo, F.; Bada-Díaz, R.; Escalante-Pérez, D. Assessing present and future climate conditions for beach tourism in Jardines del Rey (Cuba). Atmosphere 2020, 11, 1295. [Google Scholar] [CrossRef]
- Bafaluy, D.; Amengual, A.; Romero, R.; Homar, V. Present and future climate resources for various types of tourism in the Bay of Palma, Spain. Reg. Environ. Chang. 2014, 14, 1995–2006. [Google Scholar] [CrossRef]
- Coumou, D.; Robinson, A. Historic and future increase in the global land area affected by monthly heat extremes. Environ. Res. Lett. 2013, 8, 034018. [Google Scholar] [CrossRef]
- Perkins-Kirkpatrick, S.E.; Gibson, P.B. Changes in regional heat wave characteristics as a function of increasing global temperature. Sci. Rep. 2017, 7, 12256. [Google Scholar] [CrossRef]
- Founda, D.; Pierros, F.; Katavoutas, G.; Keramitsoglou, I. Observed trends in thermal stress at European cities with different background climates. Atmosphere 2019, 10, 436. [Google Scholar] [CrossRef] [Green Version]
- Katavoutas, G.; Founda, D. Intensification of thermal risk in Mediterranean climates: Evidence from the comparison of rational and simple indices. Int. J. Biometeorol. 2019, 63, 1251–1264. [Google Scholar] [CrossRef]
- Katavoutas, G.; Founda, D. Response of urban heat stress to heat waves in Athens (1960–2017). Atmosphere 2019, 10, 483. [Google Scholar] [CrossRef] [Green Version]
- Amengual, A.; Homar, V.; Romero, R.; Ramis, C.; Alonso, S. Projections for the 21st century of the climate potential for beach-based tourism in the Mediterranean. Int. J. Clim. 2014, 34, 3481–3498. [Google Scholar] [CrossRef] [Green Version]
- Grillakis, M.G.; Koutroulis, A.G.; Seiradakis, K.D.; Tsanis, I.K. Implications of 2 °C global warming in European summer tourism. Clim. Serv. 2016, 1, 30–38. [Google Scholar] [CrossRef] [Green Version]
- Demiroglu, O.C.; Saygili-Araci, F.S.; Pacal, A.; Hall, C.M.; Kurnaz, M.L. Future Holiday Climate Index (HCI) performance of urban and beach destinations in the Mediterranean. Atmosphere 2020, 11, 911. [Google Scholar] [CrossRef]
- Casimiro, E.; Calheiros, J. Climate change in Portugal: Potential impacts on tourist health. In Climate Change and Tourism Assessment and Coping Strategies; Amelung, B., Błażejczyk, K., Matzarakis, A., Eds.; Polish Academy of Sciences: Maastricht, The Netherlands; Warsaw, Poland; Freiburg, Germany, 2007; pp. 91–104. [Google Scholar]
- Founda, D.; Varotsos, K.V.; Pierros, F.; Giannakopoulos, C. Observed and projected shifts in hot extremes’ season in the Eastern Mediterranean. Glob. Planet. Chang. 2019, 175, 190–200. [Google Scholar] [CrossRef]
- Giannakopoulos, C.; Kostopoulou, E.; Varotsos, K.V.; Tziotziou, K.; Plitharas, A. An integrated assessment of climate change impacts for Greece in the near future. Reg. Environ. Chang. 2011, 11, 829–843. [Google Scholar] [CrossRef] [Green Version]
- Nastos, P.T.; Matzarakis, A. Present and future climate—Tourism conditions in milos island, Greece. Atmosphere 2019, 10, 145. [Google Scholar] [CrossRef] [Green Version]
- Lemesios, G.; Giannakopoulos, C.; Papadaskalopoulou, C.; Karali, A.; Varotsos, K.V.; Moustakas, K.; Malamis, D.; Zachariou-Dodou, M.; Petrakis, M.; Loizidou, M. Future heat-related climate change impacts on tourism industry in Cyprus. Reg. Environ. Chang. 2016, 16, 1915–1927. [Google Scholar] [CrossRef]
- Rosselló-Nadal, J. How to evaluate the effects of climate change on tourism. Tour. Manag. 2014, 42, 334–340. [Google Scholar] [CrossRef]
- Rutty, M.; Scott, D. Will the Mediterranean become “too hot” for tourism? A reassessment. Tour. Hosp. Plann Dev. 2010, 7, 267–281. [Google Scholar] [CrossRef]
- Moreno, A. Mediterranean tourism and climate (change): A survey-based study. Tour. Hosp. Plann Dev. 2010, 7, 253–265. [Google Scholar] [CrossRef]
- Georgopoulou, E.; Mirasgedis, S.; Sarafidis, Y.; Hontou, V.; Gakis, N.; Lalas, D.P. Climatic preferences for beach tourism: An empirical study on Greek islands. Appl. Clim. 2019, 137, 667–691. [Google Scholar] [CrossRef]
- Matzarakis, A.; Amelung, B. Physiological equivalent temperature as indicator for impacts of climate change on thermal comfort of humans. In Seasonal Forecasts, Climatic Change and Human Health. Advances in Global Change Research; Thomson, M.C., Garcia-Herrera, R., Beniston, M., Eds.; Springer: Berlin/Heidelberg, Germany, 2008; pp. 161–172. [Google Scholar] [CrossRef]
- Jendritzky, G.; Tinz, B. The thermal environment of the human being on the global scale. Glob. Health Action 2009, 2, 2005. [Google Scholar] [CrossRef]
- Matthews, T. Humid heat and climate change. Prog. Phys. Geogr. 2018, 42, 391–405. [Google Scholar] [CrossRef] [Green Version]
- De Freitas, C.R.; Grigorieva, E.A. A comparison and appraisal of a comprehensive range of human thermal climate indices. Int. J. Biometeorol. 2017, 61, 487–512. [Google Scholar] [CrossRef]
- HSA. Population and Housing Census of 2011. Hellenic Statistical Authority. Available online: http://www.statistics.gr/en/2011-census-pop-hous (accessed on 4 November 2020).
- GTC. Statistical Bulletin; INSETE Intelligence; Greek Tourism Confederation: Athens, Greece, 2016; Available online: https://sete.gr/en/statistical-data-library/statistics-repository/?c=&cat=&key=&dates=2016&thematics= (accessed on 10 November 2020).
- GTC. Statistical Bulletin; INSETE Intelligence; Greek Tourism Confederation: Athens, Greece, 2019; No. 60; Available online: https://sete.gr/en/statistical-data-library/statistics-repository/ (accessed on 10 November 2020).
- Mariolopoulos, E.G. The Climate of Greece; Tatsi, A.A., Zouboulis, A.I., Eds.; Papaspyrou Press: Athens, Greece, 1938. [Google Scholar]
- Mariolopoulos, E.G. Climatic Data of the Greek Network (Period 1901–1930); National Observatory of Athens: Athens, Greece, 1960. [Google Scholar]
- Strandberg, G.; Bärring, A.; Hansson, U.; Jansson, C.; Jones, C.; Kjellström, E. Cordex Scenarios for Europe from the Rossby Centre Regional Climate Model Rca4 Reports Meteorology and Climatology; SMHI: Norrköping, Sverige, 2014; No. 116. [Google Scholar]
- Collins, W.J.; Bellouin, N.; Doutriaux-Boucher, M.; Gedney, N.; Halloran, P.; Hinton, T.; Hughes, J.; Jones, C.D.; Joshi, M.; Liddicoat, S.; et al. Development and evaluation of an Earth-System model-HadGEM2. Geosci. Model. Dev. 2011, 4, 1051–1075. [Google Scholar] [CrossRef] [Green Version]
- Martin, G.M.; Bellouin, N.; Collins, W.J.; Culverwell, I.D.; Halloran, P.R.; Hardiman, S.C.; Hinton, T.J.; Hinton, C.D.; Jones, R.E.; McDonald, A.J.; et al. The HadGEM2 family of met office unified model climate configurations. Geosci. Model. Dev. 2011, 4, 723–757. [Google Scholar] [CrossRef] [Green Version]
- Popke, D.; Stevens, B.; Voigt, A. Climate and climate change in a radiative-convective equilibrium version of ECHAM6. J. Adv. Model. Earth Syst. 2013, 5, 1–14. [Google Scholar] [CrossRef]
- Voldoire, A.; Sanchez-Gomez, E.; y Mélia, D.S.; Decharme, B.; Cassou, C.; Sénési, S.; Beau, I.; Chevallier, M.; Déqué, M.; Douville, H.; et al. The CNRM-CM5.1 global climate model: Description and basic evaluation. Clim. Dyn. 2013, 40, 2091–2121. [Google Scholar] [CrossRef] [Green Version]
- Dufresne, J.L.; Foujols, M.A.; Denvil, S.; Caubel, A.; Marti, O.; Aumont, O.; Bony, S.; Cheruy, F.; Codron, F.; Duvel, J.-P.; et al. Climate change projections using the IPSL-CM5 Earth System Model: From CMIP3 to CMIP5. Clim. Dyn. 2013, 40, 2123–2165. [Google Scholar] [CrossRef]
- IPCC. Climate Change 2013: The Physical Science Basis. Contribution of Working Group I to the Fifth Assessment Report of the Intergovernmental Panel on Climate Change; Cambridge University Press: Cambridge, UK; New York, NY, USA, 2013. [Google Scholar]
- Thomson, A.M.; Calvin, K.; Smith, S.J.; Kyle, G.P.; Volke, A.; Patel, P.; Delgado-Arias, S.; Bond-Lamberty, B.; Wise, M.A.; Clarke, L.E.; et al. RCP4.5: A pathway for stabilization of radiative forcing by 2100. Clim. Chang. 2011, 109, 77. [Google Scholar] [CrossRef] [Green Version]
- Riahi, K.; Grübler, A.; Nakicenovic, N. Scenarios of long-term socio-economic and environmental development under climate stabilization. Technol. Soc. Chang. 2007, 74, 887–935. [Google Scholar] [CrossRef]
- Van Vuuren, D.P.; Edmonds, J.; Kainuma, M.; Riahi, K.; Thomson, A.; Hibbard, K.; Hurtt, G.C.; Kram, T.; Krey, V.; Lamarque, J.F.; et al. The representative concentration pathways: An overview. Clim. Chang. 2011, 109, 5–31. [Google Scholar] [CrossRef]
- De Freitas, C.R.; Grigorieva, E.A. A comprehensive catalogue and classification of human thermal climate indices. Int. J. Biometeorol. 2015, 59, 109–120. [Google Scholar] [CrossRef] [PubMed]
- Di Napoli, C.; Pappenberger, F.; Cloke, H.L. Assessing heat-related health risk in Europe via the Universal Thermal Climate Index (UTCI). Int. J. Biometeorol. 2018, 62, 1155–1165. [Google Scholar] [CrossRef] [PubMed] [Green Version]
- Jendritzky, G.; de Dear, R.; Havenith, G. UTCI-why another thermal index? Int. J. Biometeorol. 2012, 56, 421–428. [Google Scholar] [CrossRef] [PubMed] [Green Version]
- Coccolo, S.; Kämpf, J.; Scartezzini, J.L.; Pearlmutter, D. Outdoor human comfort and thermal stress: A comprehensive review on models and standards. Urban. Clim. 2016, 18, 33–57. [Google Scholar] [CrossRef]
- Fiala, D.; Havenith, G.; Bröde, P.; Kampmann, B.; Jendritzky, G. UTCI-Fiala multi-node model of human heat transfer and temperature regulation. Int. J. Biometeorol. 2012, 56, 429–441. [Google Scholar] [CrossRef] [Green Version]
- Psikuta, A.; Fiala, D.; Laschewski, G.; Jendritzky, G.; Richards, M.; Błażejczyk, K.; Mekjavič, I.; Rintamäki, H.; deDear, R.; Havenith, G. Validation of the Fiala multi-node thermophysiological model for UTCI application. Int. J. Biometeorol. 2012, 56, 443–460. [Google Scholar] [CrossRef] [PubMed] [Green Version]
- Havenith, G.; Fiala, D.; Błażejczyk, K.; Richards, M.; Bröde, P.; Holmér, I.; Rintamaki, H.; Benshabat, Y.; Jendritzky, G. The UTCI-clothing model. Int. J. Biometeorol. 2012, 56, 461–470. [Google Scholar] [CrossRef] [Green Version]
- Bröde, P.; Fiala, D.; Błażejczyk, K.; Holmér, I.; Jendritzky, G.; Kampmann, B.; Tinz, B.; Havenith, G. Deriving the operational procedure for the Universal Thermal Climate Index (UTCI). Int. J. Biometeorol. 2012, 56, 481–494. [Google Scholar] [CrossRef] [Green Version]
- Matzarakis, A.; Rutz, F.; Mayer, H. Modelling radiation fluxes in simple and complex environments—application of the RayMan model. Int. J. Biometeorol. 2007, 51, 323–334. [Google Scholar] [CrossRef]
- Matzarakis, A.; Rutz, F.; Mayer, H. Modelling radiation fluxes in simple and complex environments: Basics of the RayMan model. Int. J. Biometeorol. 2010, 54, 131–139. [Google Scholar] [CrossRef] [Green Version]
- Thorsson, S.; Lindberg, F.; Eliasson, I.; Holmer, B. Different methods for estimating the mean radiant temperature in an outdoor urban setting. Int. J. Clim. 2007, 27, 1983–1993. [Google Scholar] [CrossRef]
- Zare, S.; Hasheminejad, N.; Shirvan, H.E.; Hemmatjo, R.; Sarebanzadeh, K.; Ahmadi, S. Comparing Universal Thermal Climate Index (UTCI) with selected thermal indices/environmental parameters during 12 months of the year. Weather. Clim. Extrem. 2018, 19, 49–57. [Google Scholar] [CrossRef]
- IPCC. Climate Change 2014: Synthesis Report. Contribution of Working Groups I, II and III to the Fifth Assessment Report of the Intergovernmental Panel on Climate Change; Core Writing Team, Pachauri, R.K., Meyer, L.A., Eds.; IPCC: Geneva, Switzerland, 2014. [Google Scholar]
- EEA. Climate Change, Impacts and Vulnerability in Europe 2016: An Indicator-Based Report; European Environment Agency (EEA): Copenhagen, Denmark, 2017; Report No 1/2017. [Google Scholar]
- Matzarakis, A.; Nastos, P. Analysis of tourism potential for Crete Island, Greece. Glob. Nest J. 2011, 13, 142–150. [Google Scholar]
- Matzarakis, A.; Endler, C.; Nastos, P.T. Quantification of climate-tourism potential for Athens, Greece–recent and future climate simulations. Glob. Nest J. 2014, 16, 43–51. [Google Scholar]
- Wolf, F.; Singh, P.; Scherle, N.; Reiser, D.; Telesford, J.; Miljković, I.B.; Havea, P.H.; Li, C.; Surroop, D.; Kovaleva, M. Influences of climate change on tourism development in small pacific island states. Sustainability 2021, 13, 4223. [Google Scholar] [CrossRef]
- Lam, C.K.C.; Gallant, A.J.; Tapper, N.J. Perceptions of thermal comfort in heatwave and non-heatwave conditions in Melbourne, Australia. Urban. Clim. 2018, 23, 204–218. [Google Scholar] [CrossRef]
- Rutty, M.; Scott, D. Bioclimatic comfort and the thermal perceptions and preferences of beach tourists. Int. J. Biometeorol. 2015, 59, 37–45. [Google Scholar] [CrossRef] [PubMed]
- Yu, D.D.; Rutty, M.; Scott, D.; Li, S. A comparison of the holiday climate index:beach and the tourism climate index across coastal destinations in China. Int. J. Biometeorol. 2021, 65, 741–748. [Google Scholar] [CrossRef] [PubMed]
- Bröde, P.; Krüger, E.L.; Rossi, F.A.; Fiala, D. Predicting urban outdoor thermal comfort by the Universal Thermal Climate Index UTCI—A case study in Southern Brazil. Int. J. Biometeorol. 2012, 56, 471–480. [Google Scholar] [CrossRef] [PubMed]
- Pantavou, K.; Theoharatos, G.; Santamouris, M.; Asimakopoulos, D. Outdoor thermal sensation of pedestrians in a Mediterranean climate and a comparison with UTCI. Build. Environ. 2013, 66, 82–95. [Google Scholar] [CrossRef]
- Lai, D.; Guo, D.; Hou, Y.; Lin, C.; Chen, Q. Studies of outdoor thermal comfort in northern China. Build. Environ. 2014, 77, 110–118. [Google Scholar] [CrossRef]
- Huang, T.; Li, J.; Xie, Y.; Niu, J.; Mak, C.M. Simultaneous environmental parameter monitoring and human subject survey regarding outdoor thermal comfort and its modelling. Build. Environ. 2017, 125, 502–514. [Google Scholar] [CrossRef]
- Bröde, P.; Kampmann, B.; Fiala, D. Extending the Universal Thermal Climate Index UTCI towards varying activity levels and exposure times. In Making Comfort Relevant. Network for Comfort and Energy Use in Buildings; Brotas, L., Roaf, S., Nicol, F., Humphreys, M.A., Eds.; NCEUB—Network for Comfort and Energy Use in Buildings: Windsor, ON, Canada, 2016; pp. 73–79. [Google Scholar]
Figure 1.
Map of the eastern Mediterranean depicting the island of Santorini in the southern Aegean Sea (the map was created using Google Earth Pro; Map data SIO, NOAA, US Navy, NGA, GEBCO; Image Landsat).
Figure 1.
Map of the eastern Mediterranean depicting the island of Santorini in the southern Aegean Sea (the map was created using Google Earth Pro; Map data SIO, NOAA, US Navy, NGA, GEBCO; Image Landsat).

Figure 2.
Relative frequency of UTCI thermal stress categories per month (a) based on all 3-hourly data over the 1982–2019 period; (b) at 14:00 LST over the 1898–1927 historical period; (c) at 14:00 LST over the 1982–2011 recent period.
Figure 2.
Relative frequency of UTCI thermal stress categories per month (a) based on all 3-hourly data over the 1982–2019 period; (b) at 14:00 LST over the 1898–1927 historical period; (c) at 14:00 LST over the 1982–2011 recent period.

Figure 3.
Running 7-year mean of number of exceedances for UTCI > 26 °C (at least “moderate heat stress”) and UTCI > 32 °C (at least “strong heat stress”) (a) over the 1982–2019 period; (b) at 14:00 LST over the 1898–1927 and 1982–2019 periods.
Figure 3.
Running 7-year mean of number of exceedances for UTCI > 26 °C (at least “moderate heat stress”) and UTCI > 32 °C (at least “strong heat stress”) (a) over the 1982–2019 period; (b) at 14:00 LST over the 1898–1927 and 1982–2019 periods.

Figure 4.
Cumulative frequency distribution of UTCI from observations and simulations based on the (a) MOHC model; (b) MPI model; (c) IPSL model; (d) CNRM model from April to October over the 1982–2005 period. The percentile difference between observations and simulations across the whole range of UTCI values is also illustrated.

Figure 5.
Box and whisker plots of the UTCI from April to October over the reference period (1982–2005) and the future periods of near future (2035–2058) and distant future (2075–2098) according to the (a) MOHC model; (b) MPI model; (c) IPSL model; (d) CNRM model under the RCP4.5 and RCP8.5 future emissions scenarios. The gray dashed lines indicate the zone of no thermal stress.

Figure 6.
Percentage of exceedances for (a) UTCI > 26 °C (at least “moderate heat stress”); (b) UTCI > 32 °C (at least “strong heat stress”) for the reference period (1982–2005) and the future periods of near future (2035–2058) and distant future (2075–2098) according to the MOHC model, the MPI model, the IPSL model and the CNRM model under the RCP4.5 and RCP8.5 future emissions scenarios.

Figure 7.
Monthly frequency distribution for UTCI > 26 °C (at least “moderate heat stress”) for the reference period (1982–2005) and the future periods of near future (2035–2058) and distant future (2075–2098) according to the (a) MOHC model; (b) MPI model; (c) IPSL model; (d) CNRM model under the RCP4.5 and RCP8.5 future emissions scenarios.

Figure 8.
Monthly relative frequency for 9 °C < UTCI ≤ 26 °C (no thermal stress) for the reference period (1982–2005) and the future periods of near future (2035–2058) and distant future (2075–2098) according to the (a) MOHC model; (b) MPI model; (c) IPSL model; (d) CNRM model under the RCP4.5 and RCP8.5 future emissions scenarios.


Table 1.
The 10-categories scale of thermal stress according to UTCI. Source [50].
Table 1.
The 10-categories scale of thermal stress according to UTCI. Source [50].
| UTCI (°C) | Stress Category |
|---|---|
| >46 | Extreme heat stress |
| 38–46 | Very strong heat stress |
| 32–38 | Strong heat stress |
| 26–32 | Moderate heat stress |
| 9–26 | No thermal stress |
| 0–9 | Slight cold stress |
| −13–0 | Moderate cold stress |
| −27–−13 | Strong cold stress |
| −40–−27 | Very strong cold stress |
| <−40 | Extreme cold stress |
Table 2.
The t-test analysis of the difference of the means of UTCI values between observations and simulations over the reference period (1982–2005) at significance level 0.05. The test statistic t, the degrees of freedom and the associated p-value are presented.
Table 2.
The t-test analysis of the difference of the means of UTCI values between observations and simulations over the reference period (1982–2005) at significance level 0.05. The test statistic t, the degrees of freedom and the associated p-value are presented.
| Period | Statistic | Obs-MOHC | Obs-MPI | Obs-IPSL | Obs-CNRM |
|---|---|---|---|---|---|
| All months | μobs–μmodel | 0.00 | 0.30 | 0.90 | 1.10 |
| t-statistic | 1.36 | 0.55 | 0.62 | 1.63 | |
| DF | 1.33 × 10⁵ | 1.32 × 10⁵ | 1.34 × 10⁵ | 1.34 × 10⁵ | |
| Prob > │t│ | 0.17 | 0.58 | 0.53 | 0.10 | |
| April–October | μobs–μmodel | 0.00 | 0.40 | 0.70 | 0.70 |
| t-statistic | 0.43 | 0.69 | 1.24 | 0.67 | |
| DF | 7.88 × 10⁴ | 7.90 × 10⁴ | 7.96 × 10⁴ | 7.96 × 10⁴ | |
| Prob > │t│ | 0.67 | 0.49 | 0.22 | 0.50 |
Publisher’s Note: MDPI stays neutral with regard to jurisdictional claims in published maps and institutional affiliations. |
© 2021 by the authors. Licensee MDPI, Basel, Switzerland. This article is an open access article distributed under the terms and conditions of the Creative Commons Attribution (CC BY) license (https://creativecommons.org/licenses/by/4.0/).
Share and Cite
MDPI and ACS Style
Katavoutas, G.; Founda, D.; Kitsara, G.; Giannakopoulos, C. Climate Change and Thermal Comfort in Top Tourist Destinations—The Case of Santorini (Greece). Sustainability 2021, 13, 9107. https://0-doi-org.brum.beds.ac.uk/10.3390/su13169107
AMA Style
Katavoutas G, Founda D, Kitsara G, Giannakopoulos C. Climate Change and Thermal Comfort in Top Tourist Destinations—The Case of Santorini (Greece). Sustainability. 2021; 13(16):9107. https://0-doi-org.brum.beds.ac.uk/10.3390/su13169107
Chicago/Turabian StyleKatavoutas, George, Dimitra Founda, Gianna Kitsara, and Christos Giannakopoulos. 2021. "Climate Change and Thermal Comfort in Top Tourist Destinations—The Case of Santorini (Greece)" Sustainability 13, no. 16: 9107. https://0-doi-org.brum.beds.ac.uk/10.3390/su13169107
Note that from the first issue of 2016, this journal uses article numbers instead of page numbers. See further details here.