
Spatial Diversity of Organic Farming in Poland


Department of Theory of Economics, Faculty of Economic Science, University of Warmia and Mazury in Olsztyn, Prawocheńskiego 19, 10-719 Olsztyn, Poland
Sustainability 2021, 13(16), 9335; https://0-doi-org.brum.beds.ac.uk/10.3390/su13169335
Submission received: 21 May 2021
/
Revised: 18 July 2021
/
Accepted: 5 August 2021
/
Published: 19 August 2021
(This article belongs to the Special Issue Micro and Macroeconomic Determinants of Productivity Growth and Long-Term Sustainable Development in Central European Economies)
Abstract
:Economic development requires following the principles of sustainable development for the socio-economic progress of a country. The organic farming sector is important in ensuring sustainable development. The advancement of organic farming is an important issue which combines the environment, human health and socio-economic development. It is a management method that facilitates supplying high-quality food products and aims at eliminating the use of artificial fertilisers and pesticides. Organic farming has a beneficial impact on natural environmental protection, biodiversity conservation and food safety and quality improvement. The natural conditions in a region have a decisive impact on organic farming development. The purpose of this study is to assess the spatial diversity of organic farming and selected organic crop production in Poland by voivodship in 2013 and 2018. The statistical analysis of organic farming spatial diversity was conducted in a one- and two-dimensional approach. The analysis conducted made it possible to identify four clusters of voivodships based on the production volume of selected organic crops using the k-means algorithm. Graphs of observation depth contours in a sample were used to visualise and to analyse the two-dimensional data. STATISTICA software and selected packages of the R environment, available under the GPL licence, were used in the analysis. The analysis shows that the organic farm number and acreage in Poland is characterised by considerable variability between voivodships, with their noticeable concentration in several country regions. In the analysed years, organic farming was the most widespread in the Warmińsko-Mazurskie Voivodship and the Zachodniopomorskie Voivodship.
1. Introduction
Organic farming is the object of interest of many scientific disciplines. The development of the farming sector has a direct impact on the natural environment condition. Organic farming products provide a guarantee of safe food, which satisfies the needs of society and the environment. Organic farming is the main element of sustainable development of rural areas, aimed mainly at nature protection against pollution and the production of food with quality parameters desired by customers.
Organic farming is characterised by crop production without using pesticides or artificial fertilisers. The increase in demand for organic food is caused mainly by consumers’ fears of fertilisers and the negative impact of pesticides on human health. According to the popular view, organic food is much safer for human health than that produced by conventional farms [1] (pp. 6–10).
Organic farming development and increased production have been observed in recent years. According to the latest data, global retail sales of organic food and the acreage of organic food production is increasing. An increase of 2.00 million ha was observed in 2018 (https://www.fibl.org/en/info-centre/news/global-organic-area-continues-to-grow-over-71-5-million-hectares-of-farmland-are-organic.html, last access: 10 April 2021). Organic farming occupies a considerable portion of the total agricultural land. Crop cultivation is supervised by numerous organisations whose aim is to verify whether crop production meets organic farming requirements. They only approve the use of environmentally-friendly production methods, i.e., management methods in which fertilisers and pesticides are no longer used in the food production process [2] (p. 187).
The development of organic farming contributes to the protection of the soil structure and increases its fertility. It provides additional employment opportunities in agriculture and organic food processing. It is much less energy-intensive owing to low fertiliser and plant protection product consumption. The availability of funds and the increasing EU market contribute to farms switching to production by organic methods. It can benefit the economy of a region in many ways [3] (pp. 6–7).
Because of the use of chemical agents in crop cultivation, conventional farming has a negative impact on human health. The organic produce market in the EU is continuously developing due to a growing number of organic farms. The total acreage of organic farmland amounted to 13.4 million ha in 2018, which accounted for 7.5% of total agricultural land. The acreage increased by 33.7% compared with 2012 (https://www.europarl.europa.eu/news/pl/headlines/society/20180404STO00909/, last access: 10 April 2021). This shows that organic farming is developing rapidly and consumers increasingly often prefer high-quality food which provides numerous health benefits.
The Regulation of the European Parliament and of the Council concerning organic food production and labelling of organic products lays down the rules concerning organic food production, including the observance of organic product manufacture standards and the European Union goals regarding this production (https://eur-lex.europa.eu/legal-content/PL/TXT/PDF/?uri=CELEX:32018R0848&from=MT, last access: 10 May 2021).
Changes can be noticed taking place recently in Polish agriculture and crop cultivation techniques. Owing to crop production in the organic system, farmers can receive higher direct farming subsidies or sell food at higher prices. Organic farming started to develop in Poland in 2004 when EU farm subsidies were introduced. Since then, farmers running organic farms and those during the conversion period have been able to benefit from agri-environmental programs which allow them to apply for organic farming subsidies. According to the IJHARS (Agricultural and Food Quality Inspection) report on organic farming in Poland, there were 3760 certified organic farms and those during the conversion period in 2004, with a total acreage of 104.2 thousand ha (https://www.gov.pl/attachment/95df9fff-316d-41f9-a665-d9a168d80198, last access: 20 April 2021).
Poland provides favourable natural conditions for the development of organic farming. The favourable environmental dispositions of a region significantly affect its agricultural development. Consumers are increasingly turning to organically produced food. The main purpose of this study is to assess the spatial diversity of organic farming and selected organic crop production in Poland by voivodship in 2013 and 2018. Therefore, the structure of organic farms and organic land in the voivodships has been demonstrated. The production volume of selected organic crops was assessed and the share of the area covered by these crops in the voivodships was determined. To achieve the research objective, an analysis was performed using data originating from the Statistics Poland and the Agricultural and Food Quality Inspection Reports for 2013 and 2018. The study addressed the following research questions:
- -
- Does a regional variation in the number and in the area of organic farms exist in Poland?
- -
- Is it possible to identify groups of voivodships characterised by a similar production level of selected organic crops in Poland?
The organic farming data analysis was performed in a one- and two-dimensional approach, using graphs of observation depth contours in a sample.
The voivodships were classified according to the production volume of selected organic crops in the years under investigation using the k-means method.
2. Literature Review
Organic farming is defined by IFOAM as “a production system that sustains the health of soils, ecosystems and people”. Its aims include making a beneficial impact on the environment and popularising a good quality of life in society (https://www.ifoam.bio/why-organic/organic-landmarks/definition-organic, last access 25 April 2021).
The advancement of organic farming is an important issue, which combines the environment, human health and socio-economic development. At a time of climate change and environmental degradation, it can contribute to making agriculture sustainable. Organic farming is increasingly important in the production of high-quality organic food and numerous studies have shown its positive impact on socio-economic development. Moreover, it is more environmentally friendly than agriculture which employs traditional cultivation methods. Conventional agriculture provides growing food stocks on a global scale, but it is a major source of greenhouse gas emissions and environmental pollution. Organic farming development can contribute to more sustainable agriculture in times of climate changes, environmental degradation and population increase [4] (pp. 7611–7614).
With the introduction of legislation to protect the environment, its biodiversity and food safety, farm owners have been faced with the challenge of achieving an income to ensure an adequate standard of living while respecting ecological standards [5].
Organic farming is one of the areas of sustainable development. Climate change and deteriorating environmental conditions have caused considerable changes in the lifestyle of people, who buy organic agricultural products increasingly often. A study conducted in Poland in 2019 among individual organic farms and distributors of organic food showed that customers’ opinions are of the greatest importance in introducing organic products on the market, followed by product quality, experience in product sales and the company image. High food quality and consumer education concerning such food were important factors affecting the process of introducing it on the market [6].
Traditional agriculture has had a negative impact on the environment, which makes it necessary to seek new solutions to alleviate it. Producers who have introduced innovations in organic food production have also contributed to improving the environment. Innovations in organic food production have helped to reduce production costs, improved its productivity, reduced waste and stimulated business development and diversification [7].
The negative impact of humans on natural ecosystems has been an important socio-economic issue in recent years. Economic development, increasing global population and a rapid pace of urbanization—all this contributes to the degradation of the natural environment. Sustainable development, including the use of green infrastructure, should be a response to all of these adverse processes. An important role in natural environmental protection is played by the development of organic farms, which is greatly affected by the increasing demand for organic products. Since such farms produce organic products, they contribute to popularising a healthy lifestyle. The development of organic farming has a positive impact on society, the environment and the economic development of the country [8].
Organic food production can lead to agricultural produce quality improvement by making it richer in nutrients with a beneficial impact on human health [9]. The concentration of nutrients in crops is significantly affected by the climate in a specific area. Crops grown on organic farms are more tolerant to diseases [10]. Organic agritourism, which has a beneficial impact on the socio-economic development of regions, is very popular among tourists. Tourists increasingly often choose places with natural landscape values, where they can consume organic food [11]. Organic farming significantly improves the physical and chemical soil properties. It increases microorganism count, water content and the macro-nutrient content in soil [12].
Organic farming may also become an alternative to conventional agriculture on a global scale. In the literature, this is often assessed from the perspective of food production yield, environmental impact and organic food prices. Analyses show that organic farming produce yield can be 25% lower compared with that achieved in conventional farms. Organic farms achieve higher yields of fodder crops compared with cereals. Organic farming also has a beneficial impact on plant and animal biodiversity and water quality because of low nitrogen and phosphorus loss [13].
In Poland, financial support was launched in 1998 from the state budget to subsidise the costs of inspecting organic farms (https://www.gov.pl/web/rolnictwo/wsparcie-rolnictwa-ekologicznego, last access 25 April 2021). Poland’s accession to the European Union was an important stage in the development of organic farming in Poland. An important role was played by direct payments to support organic production financed from pillar II of the EU Common Agricultural Policy as part of the implementation of the Rural Development Programme 2004–2006 (RDP 2004–2006) [14]. An increase in subsidy rates for organic farming took place under RDP 2007–2013, ranging from 23% for agricultural crops to 38% for vegetable crops [15]. Measures related to the development of organic farming for 2014–2020 are set out in the Regulation of the European Parliament and of the Council of the EU on support for rural development [16]. Improving the natural environment and reducing the negative impact of agricultural production on the environment are among the main objectives of agri-environmental programmes [17].
The European Union establishes regulations governing the production, distribution and marketing of organic products (https://ec.europa.eu/info/food-farming-fisheries/farming/organic-farming/legislation_pl, last access 25 April 2021). The Regulation concerning organic production rules and labelling of organic products was adopted by the EU Council in 2007. Currently, financial support for organic farming in Poland comes from the EU and the national budget (https://eur-lex.europa.eu/legal-content/EN/TXT/?uri=celex%3A32007R0834, last access 25 April 2021).
An increased interest in organic farming can be observed in recent years in Poland and in the European Union countries. Significant growth in the percentage of the area allocated to organic production was particularly noticeable in the countries that joined the EU after 2003. The largest share of this area in 2012 in total farmland was recorded in Austria (18.6%), the Czech Republic (13.1%), Estonia (14.9%) and Sweden (15.8%). Between 2004 and 2013, the number of organic agricultural producers in Poland increased more than seven-fold. In Poland, the share of the area allocated to organic production in total agricultural land increased from 0.5% in 2004 to 4.6% in 2012. It is worth highlighting that in 2005, the number of organic farmers in Poland increased by 94% as compared to 2004, from 3705 in 2004 to 7183 in 2005. The reason why this figure almost doubled was the introduction of subsidies for organic farming. In 2013, fodder crops, grassland and pasture and cereals accounted for the largest share, totalling around 84% [18]. The average area of an organic farm in 2013 in the EU was 34 ha, while in Poland it was 25 ha. The largest average organic farm areas in 2013 were reported in Slovakia (453 ha) and the Czech Republic (169 ha), while this value was the lowest in Greece (8 ha) and Malta (3 ha) [19]. The largest area of organically grown cereals in 2013 was recorded in Germany and Italy, around 0.2 million ha. Poland ranked fifth, with an area of over 123,000 ha [20].
The year 2018 was a significant year for organic farming. According to FIBL data, there were 71.5 million ha of organic farmland around the world (which accounted for 1.5% of the total agricultural land), with the largest acreage in Oceania (36 million ha). Organic farmland accounted for 22% of the total agricultural land in Europe. Land occupied by organic farming accounted for 7.7% of the total agricultural land in the European Union. The largest portions of agricultural land were occupied by organic farming in Spain (2.2 million ha), France (2.0 million ha) and Italy (2.0 million ha). Financial support has contributed to the development of organic farming in the EU. Austria was characterised by the highest share of the area under organic production in the total agricultural area of 24.7%, whereas this proportion for Poland amounted to 3.4% [21].
Data concerning the area under organic cultivation and the sales of organic food indicate a noticeable development of organic farming in Poland after joining the European Union [24,25]. On organic farms, the volume of agricultural production is lower in comparison with conventional farms. The economic situation of organic farms has been substantially affected by subsidies, which represented a significant part of the income obtained from agricultural production in Poland [26]. After 2004, changes could be observed as regards the impact of agriculture on the environment in Poland, with particular emphasis on natural resources such as water, soil and biodiversity [27]. The development of organic farming is significantly supported by local authorities in rural areas. Cooperation between farmers and organic food processing companies may become an important factor for local development [28].
A key factor in the development of the organic food market in Poland is to improve the general public’s knowledge on the subject. Consumers aware of the health properties of organic food and its labelling are prepared to pay a higher price for these products. The education of buyers in this respect constitutes an important factor for the development of the organic food market in Poland [29]. Research carried out among organic food producers, processing companies and intermediaries shows that better communication and cooperation between the above-mentioned groups can contribute to the development of the organic food market in Poland [30].
A considerable variation in retail sales of organic food can be noted across European Union countries. Its volume is significantly affected by a country’s population and GDP. In 2016, the highest sales and consumption of organic food were recorded, among others, in Germany, France, Italy and Switzerland [31].
Consumers started to buy safe organic food because of health issues which might be caused by food grown by conventional methods. Consuming vegetables grown by conventional methods results in delivering potentially carcinogenic substances to the body [32] (p. 2761).
In recent years, consumers have been increasingly opting for organic food. They are willing to pay a higher price for food that is both safe for health and friendly to the environment [33]. A survey conducted among owners of conventional and organic farms in Poland shows that the major factors affecting the decision to start organic farming include the will to care for their own and their families’ health and for the natural environment [34].
Switching from conventional to organic crop production entails an increase in production costs. Availability of financial support is the most important factor which motivates farmers to switch to organic crop production. An increase in the income of organic farms, supported by subsidies, is the main benefit gained from organic farming according to farmers. A low crop yield is among the main barriers to organic farming development [35].
Organic farming in Poland and around the world has been discussed in numerous papers reviewing many analyses of the subject and presenting prospects of organic farming development in EU countries and worldwide [36,37]. A review of results concerning the impact of organic farming on public health is provided in a paper by Johansson et al. [38]. An assessment of the impact of environmental awareness on the intention to purchase organic food was presented by Wang et al. [39]
3. Materials and Methods
The study used secondary data from Statistics Poland [42,43] and reports of the Agricultural and Food Quality Inspection (IJHARS) [44,45] The analysis covered selected statistical data concerning organic farming in 2013 and 2018 with respect to the organic farm number and acreage and selected organic crops in voivodships. The IJHARS report also provides information on the inspection system in organic farming and the legal regulations applicable to organic farming in the years under study.
The purpose of this study is to assess the spatial diversity of organic farming and selected organic crop production in Poland by voivodship in 2013 and 2018.
A statistical analysis of organic farming spatial diversity was conducted in a one- and two-dimensional approach.
The literature of the subject describes the use of multivariate statistical analysis in the assessment of socio-economic development diversity in voivodships of Poland. Selected methods of comparative analysis were applied to rank the voivodships by development level and to identify regions with similar indices for demographics, labour market, regional entrepreneurship and the local economy structure [46].
Box plots were drawn up to present the analysed quantity distributions. They were introduced by Tukey [47], and have become popular tools for one-dimension data visualisation. They can be used to present information on the position, skewness or diversity of an attribute under study or to compare the attribute distributions in various groups [48] (pp. 5186–5187).
The literature of the subject describes various types of box plots, depending on the numerical characteristics used to draw them. STATISTICA software was used to draw them for this paper, based on such characteristics as the mean, standard deviation and the maximum and minimum values.
Cluster analysis is a set of multivariate statistical analysis methods used to divide a set of objects into clusters to ensure that elements belonging to the same cluster are as similar to each other as possible and, at the same time, different from elements that belong to other groups [49]. In this paper, the analysis uses the k-means clustering algorithm, which belongs to non-hierarchical clustering methods. This method consists of dividing the set of objects into a certain number of classes to minimise the variability within a given cluster and to maximise the variability between different clusters [50].
In the paper, in order to ensure comparability of characteristics concerning the production volume of selected organic crops in the voivodships, variables were standardised according to the following formula
where —empirical value of j-th variable in the i-th voivodship, —arithmetic mean of j-th variable, —standard deviation of j-th variable. After standardisation, the arithmetic means of the characteristics equal zero and the variance values equal one.
In order to assess whether the investigated diagnostic variables played a significant role in the clustering process, an analysis of variance can be used. The value of the F-statistic, which is determined as the quotient of inter-group variation to intra-group variation, enables the establishment of a hierarchy of variables that played a significant role in the division into clusters [51].
The concept of the half-space depth with respect to a multidimensional dataset was introduced by Tukey [52], in order to construct depth contours, among others. Depth contours graphs for this paper were drawn for the respective two-dimensional sets. They can be used to visualise the analysed datasets, to determine the direction of the relationship between variables or to order observations with respect to the distance from the central dataset cluster. The issues related to observation depth in a multidimensional set and construction of depth contours have been discussed in many papers on this subject. The following definitions will be presented in a two-dimensional approach in this paper.
Let there be a two-dimensional set , with the size of n. Tukey’s half-space depth for point , with respect to set is defined as the minimum number of points k of the set, contained in a closed half-plane, whose borderline runs through point [53] (pp. 516–517). The contour of the k-th degree of depth is defined as a set
where is the integer part of n/2.
The depth contour is determined as the intersection of all half-planes with the depth equal to k. The contour vertices are determined by the straight lines—the edges of half-planes with a specific value of Tukey’s depth. Tukey’s depth for points of a two-dimensional set is greater than k if they lie within a contour with the degree of depth equal to k. If the points belong to the edge , Tukey’s depth is equal to k. Notably, a point belongs to a contour of the k-th degree of depth if it belongs to the contour edge. Depth contours are shown as convex and ascending polygons, where . Other properties of Tukey’s half-space depth and depth contours were discussed in papers by Liu et al. [54] and Donoho and Gasko [55]. The algorithm that describes the determination of depth contours for a two-dimensional set is presented in a paper by and Ruts and Rousseeuw [56].
Depth contours can be used to visualise two-dimensional datasets in order to determine their position, correlation, diversity or symmetry. Notably, the lowest values of Tukey’s depth and very low or very high values of the attributes under study correspond to observations belonging to the outermost depth contour (the convex coat) [55] (pp. 1805–1807).
Construction of depth contours for two-dimensional sets was described by Kobylińska and Wagner [57] and application examples for methods based on observation depth in a sample are presented, among others, in papers by Kobylińska and Wagner [58] and Kobylińska [59].
Graphs for contours of observation depth in two-dimensional sets were drawn in this paper with the “depth” package in the R environment (https://cran.r-project.org/web/packages/depth/index.html, last access 2 May 2021).
4. Results
Based on the obtained data, it can be stated that the number of organic farms and the area of agricultural land used by these farms is highly differentiated in individual voivodships (Table 1). The fewest farms were in five voivodships (Łódzkie, Kujawsko-Pomorskie, Opolskie, Pomorskie, Śląskie). They accounted for less than 3.5% of the total number of such farms in Poland in the analysed years. The Warmińsko-Mazurskie Voivodship had the most organic farms. It was the only voivodship with more than 4000 organic farms in 2013. This number decreased by 842 farms (by 19.88%) in 2018. There were fewer than 100 organic farms in the Opolskie Voivodship, where they accounted for approximately 2.00% of those in the Warmińsko-Mazurskie and 0.30% of the total number of such farms in Poland. The number of organic farms decreased in each voivodship in 2018. The largest decrease was observed in the Małopolskie Voivodship (by 1068 farms, i.e., by 58.11%) and the smallest was in the Kujawsko-Pomorskie Voivodship (by 20 farms, i.e., by 4.82%). The number of organic farms in this voivodship did not exceed 500.
The lowest organic farmland acreage was noted in the Opolskie and Śląskie Voivodships (Table 1). It changed very slightly in the former (it increased by only 11 ha), whereas it decreased by 4296 ha, i.e., by 59.13%, in the latter. In 2013, the largest acreage was occupied by organic farmland in the Zachodniopomorskie Voivodship, where it was more than 12 times higher than in the voivodships mentioned above. Notably, the largest organic farmland acreage was recorded in the Warmińsko-Mazurskie and Zachodniopomorskie Voivodships in the studied years. In each of them, it accounted for approximately 1/5 of the total organic farmland acreage in Poland. The data presented in Table 1 show that the organic farmland acreage decreased in 2018. The largest decrease was observed in the Podkarpackie and Śląskie Voivodships (by 53.81% and 59.13%, respectively). The organic farmland acreage decreased by 185,295 ha in 2018 (i.e., by 27.66%). The largest organic farm number and acreage was recorded in the north-east of Poland and the Zachodniopomorskie Voivodship.
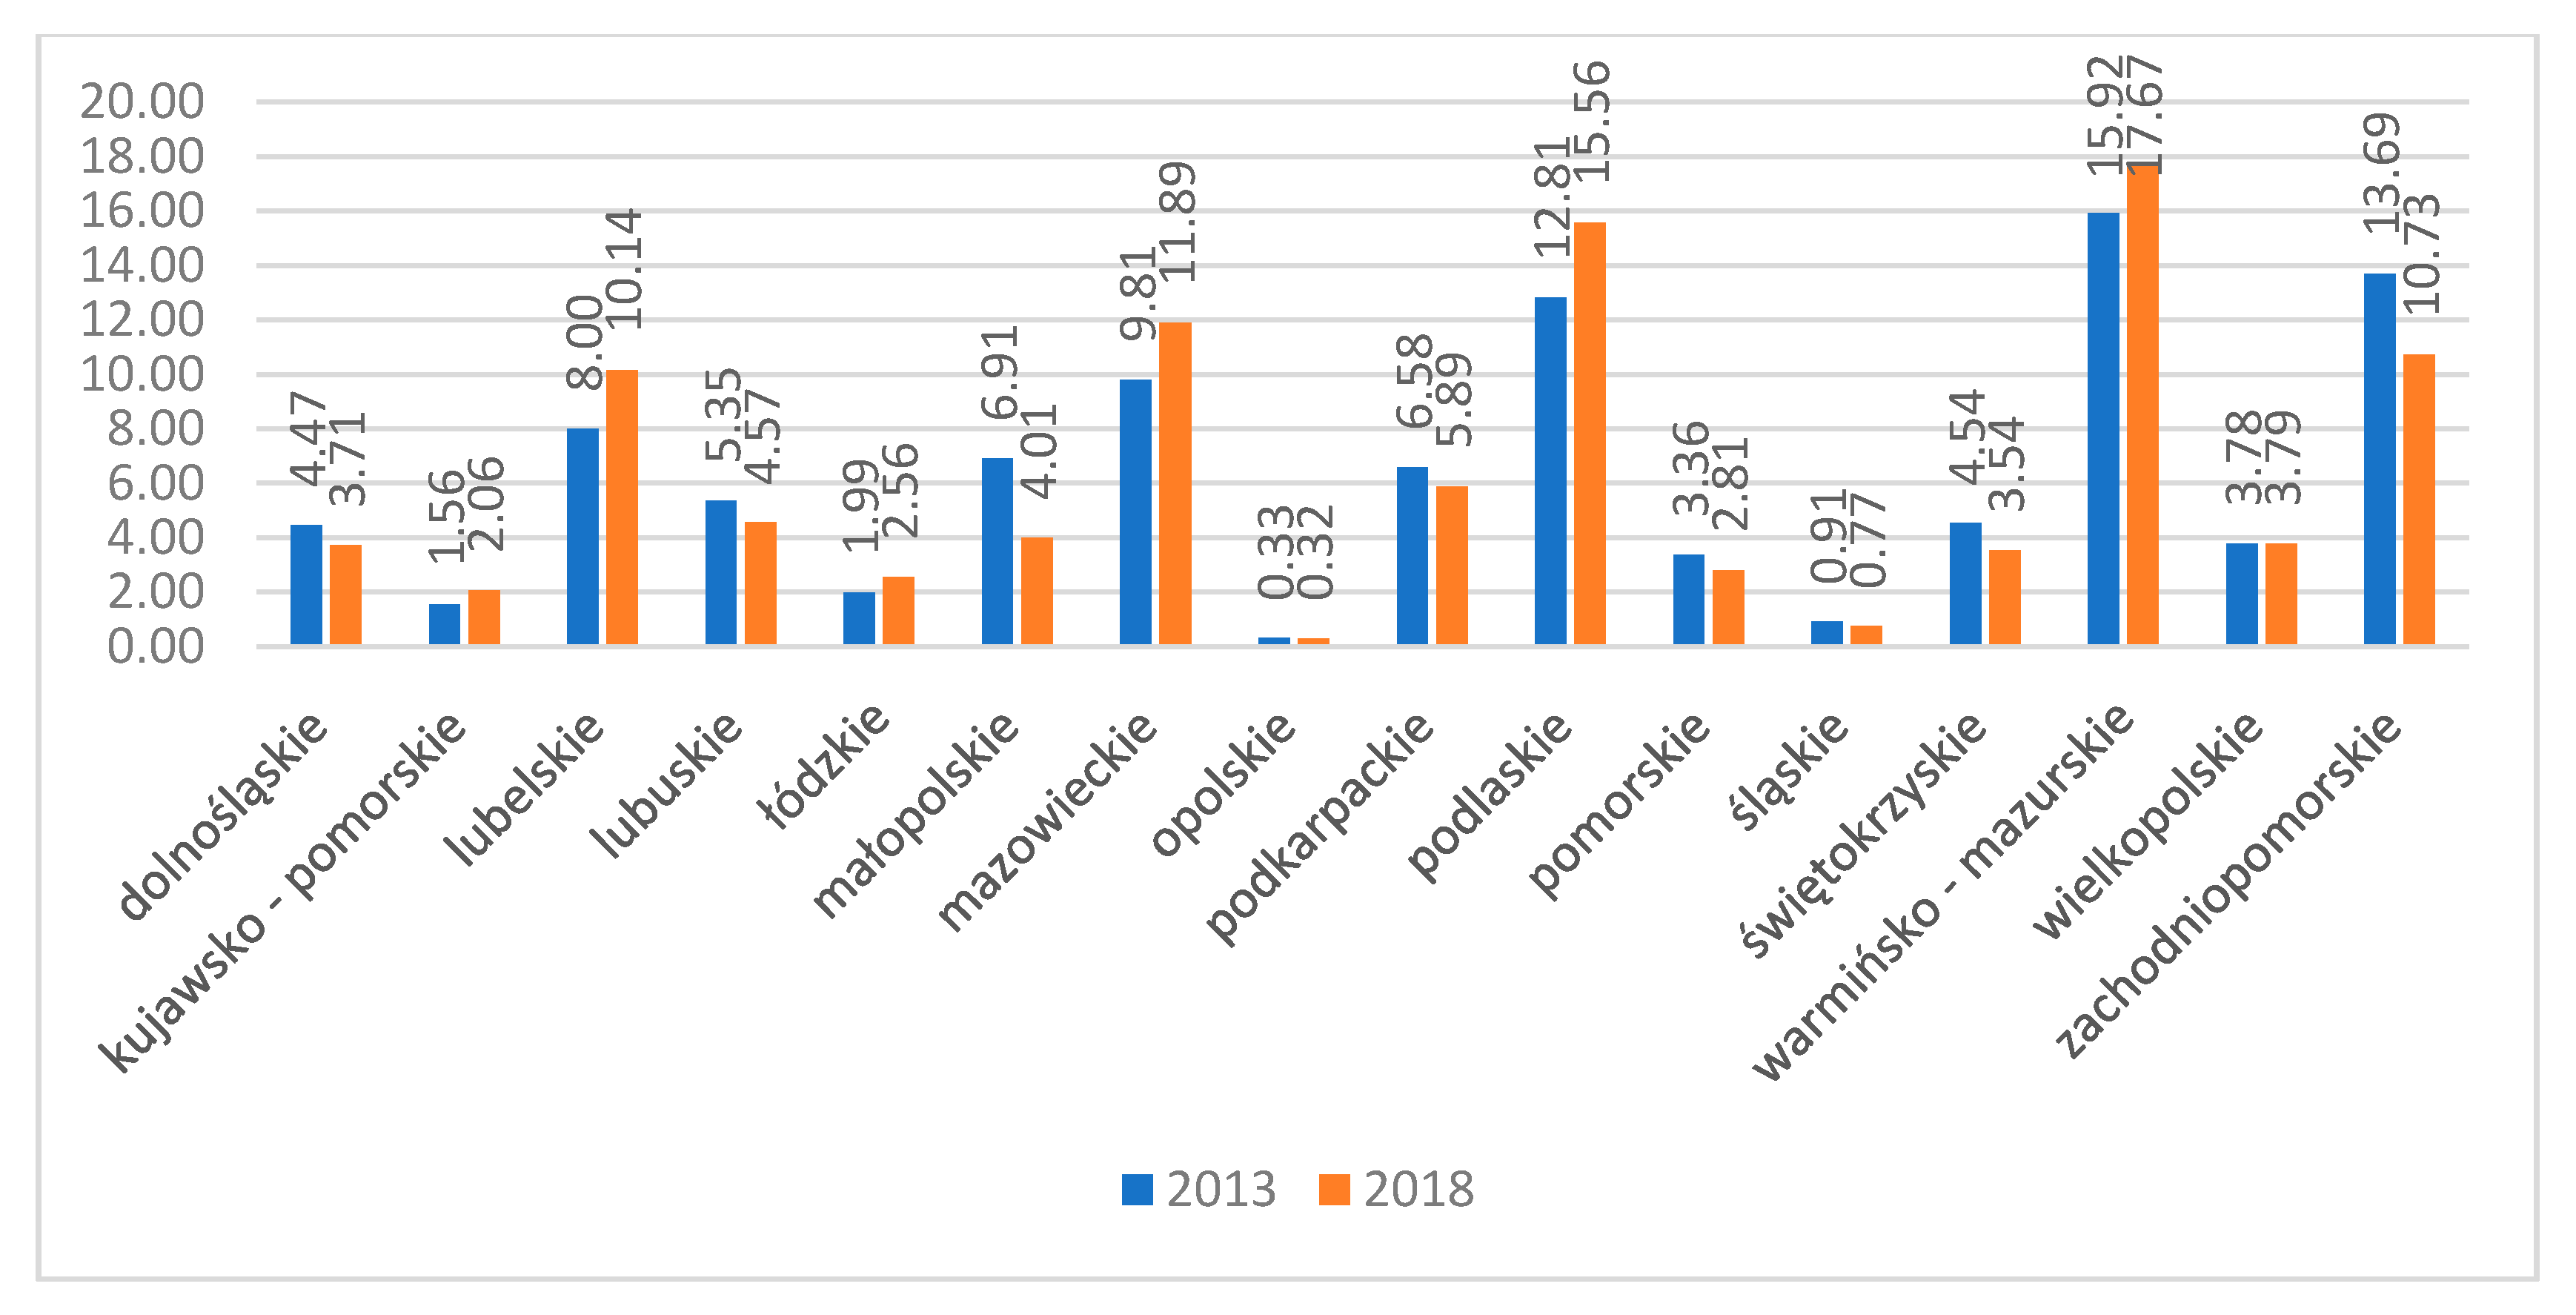
The Warmińsko-Mazurskie Voivodship (Figure 1) had the largest share of organic farms—more than 17% in 2018. The percentage in the Opolskie Voivodship did not exceed 1% of all farms of this type in Poland. More than half of all organic farms were situated in four voivodships (Mazowieckie, Podlaskie, Warmińsko-Mazurskie and Zachodniopomorskie). Such farms in the Kujawsko-Pomorskie, Łódzkie, Opolskie and Śląskie Voivodships accounted only for 4.79% and 5.70% of all organic farms in Poland in 2013 and 2018, respectively. Organic farms accounted for less than 10% of all farms in 11 voivodships in 2018.
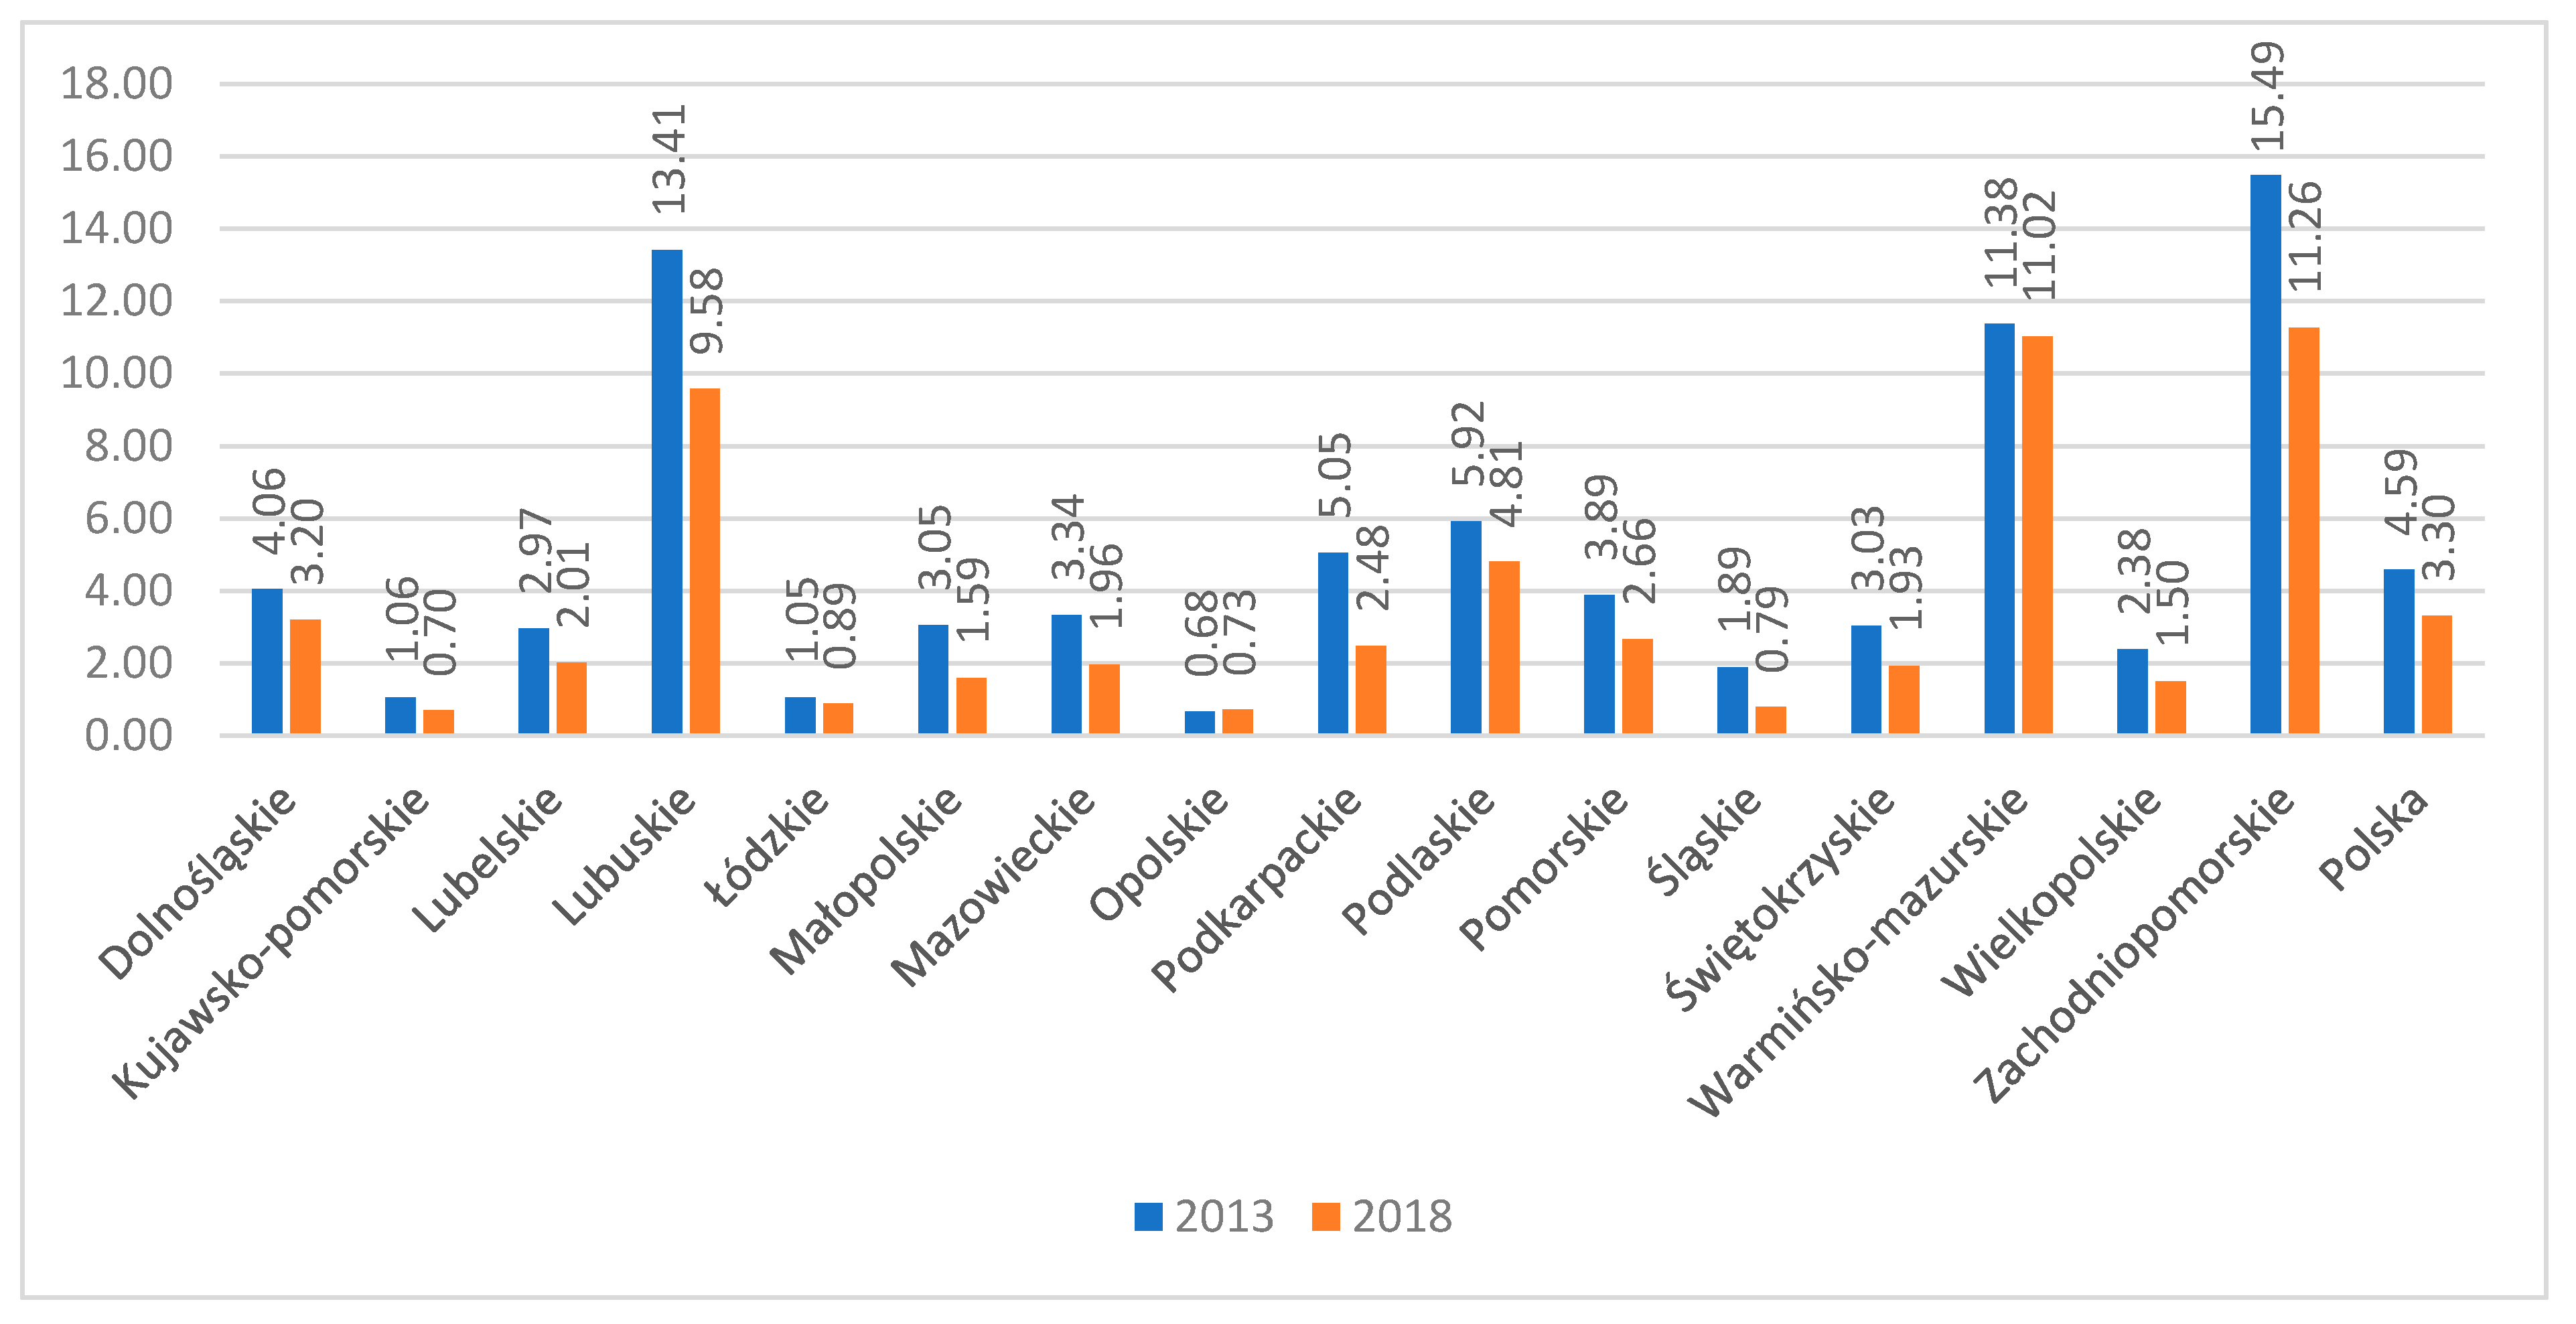
The largest portion of organic farmland, as referred to the total agricultural land acreage in Poland, was recorded in the Warmińsko-Mazurskie and Zachodniopomorskie Voivodships (Figure 2). The percentage was approximately 11% in these voivodships in 2018. The organic farmland share expressed as the percentage of the total agricultural land acreage in Poland decreased by 1.29% in the years under study. The largest decrease (by 3.83% and 4.23%, respectively) was observed in the Lubuskie and Zachodniopomorskie Voivodships, whereas the lowest was in the Warmińsko-Mazurskie Voivodship. Notably, the Lubuskie, Warmińsko-Mazurskie and Zachodniopomorskie Voivodships have the largest share of organic farmland acreage in the total agricultural land acreage compared with the other voivodships. It should be noted that both the organic farmland acreage and its share in the total agricultural land acreage decreased in that year.
The data presented in Table 2 show that the selected organic crop production varied between voivodships in 2013 and 2018. The crop structure is dominated by cereals. The lowest production was recorded in the Opolskie and Śląskie Voivodships. An over five-fold increase in cereal production was recorded in the Opolskie Voivodship in 2018. It increased by nearly 80 thousand tonnes (i.e., by 66.74%) in Poland. The highest fruit and vegetable production on organic farms was recorded in the Lubuskie and Mazowieckie Voivodships, whereas it was the lowest in the Opolskie and Śląskie Voivodships, where it did not exceed 321 tonnes in the analysed years. This production increased by nearly 1.5-fold in Poland in 2018. The production of these crops in the Lubelskie, Mazowieckie and Podkarpackie Voivodships accounted for 61.14% of their production in Poland.
The voivodships in the north-eastern part of Poland (Podlaskie and Warmińsko-Mazurskie) dominated in terms of organic potato production, which accounted for 35% of the total production on organic farms in Poland. No significant changes in organic potato production were observed in Poland, where it increased by 242.45 tonnes (i.e., by 1.58%) in 2018. A decrease in the organic potato production was observed in seven voivodships, with the largest decrease (by 52.04%) in the Zachodniopomorskie Voivodship.
As with the other crops, the lowest fruit and vegetable production was recorded in the Opolskie and Śląskie Voivodships. Their production accounted for less than 0.2% of the total production in Poland. Organic fruit and vegetable production increased by over 300% in the Lubuskie and Mazowieckie Voivodships.
The largest portion of organic farmland (Figure 3, Figure 4 and Figure 5) was occupied by cereals (13.19% to 20.45%), followed by fruit and vegetables (approx. 8%). Potatoes were the last with the acreage of their cultivation not exceeding 0.3%. The largest portion of cereal cultivation in the total organic farmland acreage (30.70% in 2018) was recorded in the Dolnośląskie Voivodship. Notably, the percentage of this crop cultivation acreage in organic farms decreased only in the Małopolskie, Podkarpackie and Świętokrzyskie Voivodships compared with 2013.
The largest share of organic potato cultivation acreage in the total organic farmland acreage was recorded in the Małopolskie (1.27% and 0.8%) and Świętokrzyskie (1.51% and 1.01%) Voivodships. The total acreage of this crop cultivation in the 14 voivodships accounted for not more than 1% of the total organic farmland acreage in the voivodships.
Box diagrams were drawn to graphically present the organic production of cereals, potatoes and fruit and vegetables (Figure 6). The midpoints on the diagrams were determined by mean values of the attributes under study, the box—by the standard deviations and the “tails” of the plots—by the smallest and the largest values of the attributes under study.
The distribution of selected organic crop production (Figure 6) reveals the highest diversity between voivodships in the organic cultivation of cereals and fruit and vegetables. Long “tails” are noticeable on box plots showing the production distribution for these crops. It indicates that there are voivodships with large cereal production (Dolnośląskie, Warmińsko-Mazurskie, Zachodniopomorskie). The figures show the relatively largest right-sided asymmetry in the cereal and fruit and vegetable organic cultivation acreage. Box plots for potato cultivation show the lowest diversity of this attribute in voivodships.
The mean production of selected organic crops was increasing during the analysed period (Table 2). The largest increase was recorded for fruit and vegetables—by 99,215.89 tonnes (i.e., by 144.41%). A considerable spatial diversity between voivodships was observed for the analysed crop production, which is indicated by the coefficients of variance. The largest variance range can be observed for fruit and vegetables in 2018. The highest and the lowest production levels differed by 34,937.06 tonnes and were recorded for these crops in the Mazowieckie and Opolskie Voivodships. The organic crop production in the voivodships is characterised by right-sided asymmetry. The strongest asymmetry was observed for fruits and vegetables, whose production was lower than the national average in 11 voivodships.
The classification of voivodships according to the production volume of selected organic crops (Table 2) was carried out using the k-means method. The coefficients of variation (Table 3) indicate that the analysed characteristics demonstrate spatial variability [50]. An important assumption regarding cluster analysis is the absence of co-linearity, which occurs when the variables under examination are correlated with each other. The presence of co-linearity may result in the formation of an unrealistic cluster system [60]. The Pearson’s coefficients of linear correlation for pairs of attribute values indicate that the strongest linear correlation exists between organic production of cereals and potatoes in each of the analysed years. The correlation coefficients, in this case, are equal to 0.4. The Pearson’s coefficients of linear correlation, calculated for the other pairs in the analysed years do not significantly differ from zero, at the level of significance of 5%.
Table 4 shows the results of classifying voivodships by the surveyed volumes of organic crops in 2013. The first cluster includes the Kujawsko-Pomorskie, Łódzkie, Opolskie and Śląskie Voivodships, where the production of all analysed organic crops reached low values in 2013, below the average production of these crops in Poland. The second cluster includes voivodships where, in the year under study, a low level of organic production of potatoes and fruit and vegetables was recorded. The Lubuskie Voivodship ranked third in terms of the production of these crops. The third cluster included five voivodships with the highest organic fruit and vegetable production in 2013. In comparison with the average for Poland, in the Małopolskie Voivodship, it was higher by 15.91%, and in the Lubelskie Voivodship, it was higher by 227.38%. The fourth cluster consists of the voivodships of Warmińsko-Mazurskie and Podlaskie, which in 2013 were leading in terms of organic cereal production. This is proven by the significantly higher value of the average cereal production for cluster four as compared to the average values of this attribute for the other clusters.
Based on the production volume of selected organic crops in 2018, the voivodships were divided into four clusters (Table 5). This year, the cluster with the highest average organic production of cereals and potatoes included the Podlaskie and Warmińsko-Mazurskie Voivodships. Cluster 2 proved to be the most numerous. In the voivodships belonging to this cluster, the volume of organic cereal production was the lowest in 2018. The average volume of organic cereal production for cluster 2 in 2018 was more than five times lower than the average volume of this production for cluster 1.
The average values of the attributes for the obtained clusters in 2013 and 2018 indicate that the voivodships located in the north-eastern part of Poland are characterised by the highest organic cereal production. It can be noted that in the years under examination, the same group included the Lubelskie, Mazowieckie and Podkarpackie Voivodships, where the organic production of fruit and vegetables was the highest.
The degree of differentiation of the resulting clusters for the k-means method was evaluated using standard analysis of variance (Table 6). After division into four clusters, satisfactory F-statistic values and corresponding significance levels were obtained. It can be concluded that, at a significance level of 0.05, the tested variables significantly discriminate the clusters created.
Graphs of depth contours for respective two-dimensional sets in the analysed years were drawn to better illustrate the selected organic crop production (Table 2). The depth contour orientation indicates that a positive correlation exists between the attributes. The depth contour graphs (Figure 7) can be used to rank the voivodships characterised by the given crop production size relative to the distance from the central cluster, which is determined by the contour of the largest depth. They can be used to visualise certain two-dimensional set properties, for which they were drawn. The vertices of the outermost depth contours (convex coats) are determined by two-dimensional points (voivodships) and reach a considerable size in the graphs. It shows that there are voivodships with much higher or much lower values of the attributes. Zachodniopomorskie Voivodship belongs to the outermost depth contour because of its very large organic cereal production in 2013 and 2018 (3 times and 2.5 times higher, respectively, than the mean cereal production in Poland). Depth contour edges are clustered near low attribute values, which is indicative of right-sided asymmetry, i.e., of small organic production in most voivodships. Opolskie and Śląskie voivodships are in the first contour due to their very low production levels of all of the analysed organic crops.
Pomorskie Voivodship is positioned centrally in all of the depth contour graphs for 2013. It can be assumed that the production size of all organic crops is the most typical in this case. The Zachodniopomorskie Voivodship has the central position in the “data cloud” among all the voivodships because of its production of potatoes and fruit and vegetables.
5. Discussion and Conclusions
Organic farming in Poland has been developing intensively since the country joined the European Union. Information provided in IJHARS reports shows a considerable increase in the organic farm number and acreage after 2004. The number of organic farms in Poland steadily increased until 2013. This is a consequence of the financial aid provided as part of agri-environmental programs. They allowed farmers to switch from conventional to organic land management.
Organic farms of up to 100 ha were entitled to the full payments as part of the support for organic farming in 2007–2013. Economic factors may have been the main reason for taking up organic land management by farmers. A decrease in the number of organic farms after 2013 may have been caused by changes in subsidies as part of the PROW 2014–2020 program [15]. Organic farms of up to 50 ha are entitled to full payments (https://www.gov.pl/attachment/cf18ba94-f3d3-4fe8-98b9-556ebe193ba8, last access 10 May 2021). This might result in a decrease in the number of organic farms and it might stimulate interest in organic cultivation of cereals and fruit and vegetables. High regional diversity of organic farming development was observed in Poland during the years under study. Beneficial climate and soil conditions, relatively unpolluted environment and a low level of chemical agent used in agricultural production are decisive factors in the regionalisation of this type of farming.
However, their concentration in some parts of the country is noticeable. The importance of organic farming can be seen to be increasing in the north-west and the north-east of Poland. The number of organic farms and organic farmland acreage were the highest in the voivodships in these parts of Poland. More than 1/3 (33.23%) of all organic farms were situated in the Podlaskie and Warmińsko-Mazuskie Voivodships in 2018. The Zachodniopomorskie Voivodship clearly specialised in the organic production of cereals, whereas the Podlaskie Voivodship specialised in the production of potatoes. The Lubelskie, Mazowieckie and Podkarpackie Voivodships were the leaders in the organic production of fruit and vegetables.
According to Statistics Poland data, the average organic farm acreage in the analysed years was approx. 25 ha and a conventional farm acreage was approx. 10 ha [61], which shows that the average organic farm acreage was larger than a conventional farm, even though the organic farm number and acreage in Poland decreased by nearly 30% during the analysed period. Despite this, organic cereal, fruit and vegetable production increased in Poland by 37.22% and 59.64%, respectively, in 2018. Organic farming is still an important land cultivation method in Poland. Its development may contribute to an increase in natural food production, environmental protection and may become an important factor supporting sustainable development. The beneficial soil and climate conditions in Poland should facilitate organic food production. Organic farming is the most popular in voivodships with a low level of industrialisation (Podlaskie, Warmińsko-Mazurskie and Zachodniopomorskie).
Organic farming contributes considerably to boosting interest in rural areas. The beneficial soil and climate conditions in Poland should facilitate organic food production. Poland could potentially become a considerable producer and exporter of organic food. The development of organic farming is founded on the European Union’s common agricultural policy, whose financial support could contribute to an increase in farmers’ interest in pro-environmental sectors. The promotion of organic farming has a positive impact on human health, the environment and the economy with respect to sustainable development.
In view of the increasing demand for organic products and the opportunities for further development of organic farming, it seems necessary to take further measures to support this sector.
Funding
This research received no external funding.
Institutional Review Board Statement
Not applicable.
Informed Consent Statement
Not applicable.
Data Availability Statement
Conflicts of Interest
The author declares no conflict of interest.
References
- Funk, C.; Kennedy, B. The New Food Fights: U.S. Public Divides Over Food Science. Pew Res. Cent. 2016, 13. Available online: https://www.pewresearch.org/science/2016/12/01/the-new-food-fights/ (accessed on 4 August 2021).
- Connor, D. Short communication Organic agriculture cannot feed the world. Field Crop. Res. 2008, 106, 187. [Google Scholar] [CrossRef]
- Singh, M. Organic Farming for Sustainable Agriculture. Indian J. Org. Farming 2021, 1, 8. [Google Scholar]
- Crowder, D.W.; Reganold, J.P. Financial competitiveness of organic agriculture on a global scale. Proc. Natl. Acad. Sci. USA 2015, 112, 7611–7616. [Google Scholar] [CrossRef] [PubMed] [Green Version]
- Runowski, H. Rolnictwo ekologiczne—Rozwój czy regres? Rocz. Nauk Rol. Ser. G Ekon. Rol. 2009, 96, 182–193. [Google Scholar]
- Sobocińska, M.; Mazurek-Łopacińska, K.; Skowron, S.; Graczyk, A.; Kociszewski, K. The Role of Marketing in Shaping the Development of the Market of Organic Farming Products in Poland. Sustainability 2021, 13, 130. [Google Scholar] [CrossRef]
- Dudek, M.; Wrzaszcz, W. On the Way to Eco-Innovations in Agriculture: Concepts, Implementation and Effects at National and Local Level. The Case of Poland. Sustainability 2020, 12, 4839. [Google Scholar] [CrossRef]
- Remeikienė, R.; Gasparenienė, L. Green farming development opportunities: The case of Lithuania. Oeconomia Copernic. 2017, 8, 401–416. [Google Scholar] [CrossRef] [Green Version]
- Vinha, A.; Barreira, S.; da Costa, A.G.; Alves, R.C.; Oliveira, B. Organic versus conventional tomatoes: Influence on physicochemical parameters, bioactive compounds and sensorial attributes. Food Chem. Toxicol. 2014, 67, 139–144. [Google Scholar] [CrossRef] [Green Version]
- Mukherjee, A.; Omondi, E.C.; Hepperly, P.R.; Seidel, R.; Heller, W.P. Impacts of Organic and Conventional Management on the Nutritional Level of Vegetables. Sustainability 2020, 12, 8965. [Google Scholar] [CrossRef]
- Shen, C.-C.; Chang, Y.-R.; Liu, D.-J. Sustainable Development of an Organic Agriculture Village to Explore the Influential Effect of Brand Equity from the Perspective of Landscape Resources. Sustainability 2020, 12, 7416. [Google Scholar] [CrossRef]
- Tahat, M.M.; Alananbeh, K.M.; Othman, Y.A.; Leskovar, D.I. Soil Health and Sustainable Agriculture. Sustainability 2020, 12, 4859. [Google Scholar] [CrossRef]
- Seufert, V.; Ramankutty, N. Many shades of gray—The context-dependent performance of organic agriculture. Sci. Adv. 2017, 3, e1602638. [Google Scholar] [CrossRef] [PubMed] [Green Version]
- Brodzińska, K. Rozwój rolnictwa ekologicznego w Polsce na tle uwarunkowań przyrodniczych i systemu wsparcia finansowego. Zesz. Nauk. SGGW Warszawie Probl. Rol. Świat. 2010, 10, 12–21. [Google Scholar]
- Kociszewski, K. The Policy of Financial Support for Organic Farming in Poland. Pr. Nauk. Uniw. Ekon. We Wrocławiu 2017, 491, 235–243. [Google Scholar] [CrossRef] [Green Version]
- Regulation (EU) No 1305/2013 of the European Parliament and of the Council of 17 December 2013 on Support for Rural Development by the European Agricultural Fund for Rural Development (EAFRD) and Repealing Council Regulation (EC) No 1698/2005. Available online: http://op.europa.eu/en/publication-detail/-/publication/c973adc4-6c03-11e3-9afb-01aa75ed71a1/language-en (accessed on 11 July 2021).
- Pawlewicz, A.; Bórawski, P. Realizacja programu rolnośrodowiskowego w Polsce. Rocz. Nauk. Ser. 2013, 15, 271–276. [Google Scholar]
- Kułyk, P.; Michałowska, M. Stan rozwoju rolnictwa ekologicznego w Polsce w latach 2004–2014. Zesz. Nauk. SGGW Ekon. Organ. Gospod. Żywn. 2016, 113, 17–32. [Google Scholar] [CrossRef] [Green Version]
- Golik, D.; Żmija, D. Rolnictwo ekologiczne i perspektywy jego rozwoju w Polsce w świetle doświadczeń unijnych. Zesz. Nauk. Uniw. Ekon. Krakowie Crac. Rev. Econ. Manag. 2017, 1, 117–129. [Google Scholar] [CrossRef] [Green Version]
- Rossi, R. Facts and Figures on Organic Agriculture in the European Union; European Commission: Brussels, Belgium, 2016; p. 47. [Google Scholar]
- Willer, E.H.; Schlatter, B.; Trávní, J.; Kemper, L.; Lernoud, J. The World of Organic Agriculture Statistics and Emerging Trends 2020; Organic Eprints: Foulum, Denmark, 2020. [Google Scholar]
- Sadowski, A.; Wojcieszak, M.; Zmyślona, J. Economic Situation of Organic Farms in Poland on the Background of the European Union. Zagadnienia Ekon. Rolnej Probl. Agric. Econ. 2021, 367, 101–118. [Google Scholar] [CrossRef]
- Jarecki, W.; Tobiasz-Salach, R.; Bobrecka-Jamro, D. Development of organic farming in Poland over the period of 2004–2018. Acta Agrophysica 2020, 26, 23–30. [Google Scholar] [CrossRef]
- Pawlewicz, A.; Brodzinska, K.; Zvirbule, A.; Popluga, D. Trends in the Development of Organic Farming in Poland and Latvia Compared to the EU. Rural Sustain. Res. 2020, 43, 8. [Google Scholar] [CrossRef]
- Biernat-Jarka, A.; Trębska, P. The Importance of Organic Farming in the Context of Sustainable Development of Rural Areas in Poland. Acta Sci. Pol. Oeconomia 2018, 17, 39–47. [Google Scholar] [CrossRef]
- Gołaś, Z. Development of Organic Farming in Poland. J. Agribus. Rural Dev. 2016, 4, 533–543. [Google Scholar] [CrossRef]
- Kociszewski, K. Changes in the Environmental Impact of Polish Agriculture after the Accession to the European Union. J. Agribus. Rural Dev. 2018, 50, 385–393. [Google Scholar] [CrossRef]
- Śpiewak, R.; Jasiński, J. Organic Farming as a Rural Development Factor in Poland—the Role of Good Governance and Local Policies. Int. J. Food Syst. Dyn. 2020, 11, 52–71. [Google Scholar] [CrossRef]
- Nestorowicz, R. Asymetria wiedzy a rozwój rynku żywności ekologicznej w Polsce. Handel Wewnętrzny 2018, 5, 212–224. [Google Scholar]
- Grzybowska-Brzezińska, M.; Gorlowa, O. Conditions for the Establishment of Distribution Channels in the Organic Food Market. J. Agribus. Rural Dev. 2019, 51, 35–42. [Google Scholar] [CrossRef]
- Pawlewicz, A. Regional diversity of organic food sales in the European Union. In Proceedings of the 2019 International Conference on Economic Science For Rural Development, Jelgava, Latvia, 9–10 May 2019. [Google Scholar] [CrossRef]
- Rembialkowska, E. Quality of plant products from organic agriculture. J. Sci. Food Agric. 2007, 87, 2757–2762. [Google Scholar] [CrossRef]
- Zhang, B.; Fu, Z.; Huang, J.; Wang, J.; Xu, S.; Zhang, L. Consumers’ perceptions, purchase intention, and willingness to pay a premium price for safe vegetables: A case study of Beijing, China. J. Clean. Prod. 2018, 197, 1498–1507. [Google Scholar] [CrossRef]
- Kociszewski, K.; Graczyk, A.; Mazurek-Łopacinska, K.; Sobocińska, M. Social Values in Stimulating Organic Production Involvement in Farming—The Case of Poland. Sustainability 2020, 12, 5945. [Google Scholar] [CrossRef]
- Łuczka, W.; Kalinowski, S. Barriers to the Development of Organic Farming: A Polish Case Study. Agriculture 2020, 10, 536. [Google Scholar] [CrossRef]
- Meredith, S.; Willer, H. Organic in Europe—Prospects and Developments; Meredith, S., Willer, H., Eds.; IFOAM EU Group: Brussels, Belgium, 2014. Available online: https://orgprints.org/id/eprint/25649/ (accessed on 28 March 2021).
- Meemken, E.-M.; Qaim, M. Organic Agriculture, Food Security, and the Environment. Annu. Rev. Resour. Econ. 2018, 10, 39–63. [Google Scholar] [CrossRef] [Green Version]
- Johansson, E.; Hussain, A.; Kuktaite, R.; Andersson, S.C.; Olsson, M.E. Contribution of Organically Grown Crops to Human Health. Int. J. Environ. Res. Public. Health 2014, 11, 3870–3893. [Google Scholar] [CrossRef]
- Wang, J.; Pham, T.L.; Dang, V.T. Environmental Consciousness and Organic Food Purchase Intention: A Moderated Mediation Model of Perceived Food Quality and Price Sensitivity. Int. J. Environ. Res. Public. Health 2020, 17, 850. [Google Scholar] [CrossRef] [Green Version]
- Grzybowska-Brzezińska, M. Premises for Purchase of Ecological food According to Respondents. Economic 2008, 69, 90. [Google Scholar] [CrossRef]
- Pilarski, S. Development of Organic Food Market in Germany. Economic 2008, 3, 69–89. [Google Scholar] [CrossRef]
- Rocznik Statystyczny Rolnictwa. Główny Urząd Statystyczny, Warszawa. 2014. Available online: https://stat.gov.pl/obszary-tematyczne/roczniki-statystyczne/roczniki-statystyczne/rocznik-statystyczny-rolnictwa-2014,6,8.html (accessed on 25 August 2020).
- Rocznik Statystyczny Rolnictwa. Główny Urząd Statystyczny, Warszawa. 2019. Available online: https://stat.gov.pl/obszary-tematyczne/roczniki-statystyczne/roczniki-statystyczne/rocznik-statystyczny-rolnictwa-2019,6,13.html (accessed on 25 August 2020).
- Instytut Jakości Handlowej Artykułów Rolno-Spożywczych. Raport o Stanie Rolnictwa Ekologicznego w Polsce w Latach 2013–2014. Warszawa; 2015. Available online: https://www.gov.pl/attachment/f9e08b43-4284-4713-956b-85ab2231163f (accessed on 15 August 2020).
- Instytut Jakości Handlowej Artykułów Rolno-Spożywczych. Raport o Stanie Rolnictwa Ekologicznego w Polsce w Latach 2017–2018. Warszawa; 2019. Available online: https://www.gov.pl/attachment/fc28d2a3-00b6-4323-8dd1-1ddf69585c21 (accessed on 15 August 2020).
- Miłek, D. Spatial differentiation in the social and economic development level in Poland. Equilib. Q. J. Econ. Econ. Policy 2018, 13, 487–507. [Google Scholar] [CrossRef]
- Tukey, J.W. Exploratory Data Analysis; Addison-Wesley: Reading, MA, USA, 1977. [Google Scholar]
- Hubert, M.; Vandervieren, E. An adjusted boxplot for skewed distributions. Comput. Stat. Data Anal. 2008, 52, 5186–5201. [Google Scholar] [CrossRef]
- Gatnar, E.; Walesiak, M. Metody Statystycznej Analizy Wielowymiarowej w Badaniach Marketingowych; Wydawnictwo Akademii Ekonomicznej im; Oskara Langego: Wrocław, Poland, 2004; ISBN 978-83-7011-703-0. [Google Scholar]
- Panek, T. Statystyczne Metody Wielowymiarowej Analizy Porównawczej; Oficyna Wydawnicza SGH Warszawa: Warszawa, Poland, 2009. [Google Scholar]
- Dobosz, M. Wspomagana Komputerowo Statystyczna Analiza Wyników Badań; Akademicka Oficyna Wydawnicza EXIT: Warszawa, Poland, 2001. [Google Scholar]
- Tukey, J.W. Mathematics and the picturing of data. In Proceedings of the International Congress of Mathematicians, Vancouver, BC, Canada; 1975; pp. 523–531. Available online: https://www.mathunion.org/fileadmin/ICM/Proceedings/ICM1974.1/ICM1974.1.ocr.pdf (accessed on 4 August 2021).
- Rousseeuw, P.J.; Ruts, I. Algorithm AS 307: Bivariate location depth. J. R. Stat. Soc. Ser. C Appl. Stat. 1996, 45, 516–526. [Google Scholar] [CrossRef]
- Liu, R.Y.; Parelius, J.M.; Singh, K.; Eddy, W.F.; Baggerly, K.A.; Scott, D.W.; Hettmansperger, T.P.; Oja, H.; Visuri, S. Multivariate analysis by data depth: Descriptive statistics, graphics and inference. Discussion. Rejoinder. Multivar. Anal. Data Depth Descr. Stat. Graph. Inference Discuss. Rejoinder 1999, 27, 783–858. [Google Scholar]
- Donoho, D.L.; Gasko, M. Breakdown Properties of Location Estimates Based on Halfspace Depth and Projected Outlyingness. Ann. Stat. 1992, 20, 1803–1827. [Google Scholar] [CrossRef]
- Ruts, I.; Rousseeuw, P.J. Computing depth contours of bivariate point clouds. Comput. Stat. Data Anal. 1996, 23, 153–168. [Google Scholar] [CrossRef]
- Kobylińsk, M.; Wagner, W. Numerical Aspects of Determining Measures and Contours in Depth for Data In R2. Acta Univ. Lodz. Folia Oeconomica 2002, 162, 19–32. [Google Scholar]
- Kobylińska, M.; Wagner, W. Spatial analysis of the communes of the province of Warmia-Mazury aided with measures and contours of depth. Econ. Sci. Univ. Warm. Mazury Olszt. 2003, 6, 103–122. [Google Scholar]
- Kobylińska, M. Observation Depth Measure in a Sample in the Voivodeship Classification of the Property Market. Olszt. Econ. J. 2013, 8, 373–382. [Google Scholar] [CrossRef]
- Stanisz, A. Przystępny kurs statystyki z zastosowaniem Statistica PL Tom 3. StatSoft Pol. 2007, 3, 161–163. [Google Scholar]
- GUS. Rolnictwo w 2019 Roku. Available online: https://stat.gov.pl/obszary-tematyczne/rolnictwo-lesnictwo/rolnictwo/rolnictwo-w-2019-roku,3,16.html (accessed on 9 May 2021).
Figure 1.
Percentage of organic farms in voivodships in 2013 and 2018. Source: prepared by the author.
Figure 1.
Percentage of organic farms in voivodships in 2013 and 2018. Source: prepared by the author.

Figure 2.
The share of organic farmland in the total agricultural land in the voivodships in 2013 and 2018. Source: prepared by the author.
Figure 2.
The share of organic farmland in the total agricultural land in the voivodships in 2013 and 2018. Source: prepared by the author.

Figure 3.
The share of cereal cultivation acreage compared with the total organic farmland acreage in 2013 and 2018 (%). Source: prepared by the author.
Figure 3.
The share of cereal cultivation acreage compared with the total organic farmland acreage in 2013 and 2018 (%). Source: prepared by the author.

Figure 4.
The share of potato cultivation acreage compared with the total organic farmland acreage in 2013 and 2018 (%). Source: prepared by the author.
Figure 4.
The share of potato cultivation acreage compared with the total organic farmland acreage in 2013 and 2018 (%). Source: prepared by the author.

Figure 5.
The share of fruit and vegetable cultivation acreage compared with the total organic farmland acreage in 2013 and 2018 (%). Source: prepared by the author.
Figure 5.
The share of fruit and vegetable cultivation acreage compared with the total organic farmland acreage in 2013 and 2018 (%). Source: prepared by the author.

Figure 6.
Distribution of selected organic crop production in 2013 and 2018 (tonnes). Notes: ZB13, ZB18, ZI13, ZI18, WO13, WO18 denote the production of cereals (ZB), potatoes (ZI) and fruit and vegetable (WO) in 2013 and 2018, respectively. Source: prepared by the author.
Figure 6.
Distribution of selected organic crop production in 2013 and 2018 (tonnes). Notes: ZB13, ZB18, ZI13, ZI18, WO13, WO18 denote the production of cereals (ZB), potatoes (ZI) and fruit and vegetable (WO) in 2013 and 2018, respectively. Source: prepared by the author.

Figure 7.
Depth contour graphs for two-dimensional sets of selected organic crop production in 2013 and 2018. Notes: ZB13, ZB18, ZI13, ZI18, WO13, WO18 denote the production of cereals (ZB), potatoes (ZI) and fruit and vegetables (WO) in 2013 and 2018, respectively (Table 3). Source: prepared by the author with “depth” software.


Table 1.
The organic farm number and acreage in voivodships in 2013 and 2018.
| Voivodship | Organic Farms | Organic Farmland Acreage (ha) | ||
|---|---|---|---|---|
| 2013 | 2018 | 2013 | 2018 | |
| Dolnośląskie | 1189 | 713 | 37,455 | 27,357 |
| Kujawsko-Pomorskie | 415 | 395 | 11,152 | 7655 |
| Lubelskie | 2129 | 1948 | 40,819 | 28,428 |
| Lubuskie | 1422 | 877 | 54,692 | 37,174 |
| Łódzkie | 528 | 491 | 10,342 | 8905 |
| Małopolskie | 1838 | 770 | 17,005 | 8844 |
| Mazowieckie | 2609 | 2284 | 63,445 | 42,049 |
| Opolskie | 88 | 61 | 3543 | 3554 |
| Podkarpackie | 1750 | 1131 | 29,506 | 13,630 |
| Podlaskie | 3407 | 2989 | 63,548 | 51,608 |
| Pomorskie | 893 | 540 | 28,721 | 19,974 |
| Śląskie | 242 | 148 | 7220 | 2951 |
| Świętokrzyskie | 1207 | 680 | 15,122 | 9087 |
| Warmińsko-Mazurskie | 4235 | 3393 | 116,199 | 104,574 |
| Wielkopolskie | 1006 | 727 | 41,617 | 25,994 |
| Zachodniopomorskie | 3640 | 2060 | 129,585 | 92,892 |
| Poland | 26,598 | 19,207 | 669,971 | 484,676 |
Source: based on Statistical Yearbook of Agriculture (2014 and 2019).
Table 2.
Production of selected organic crops in voivodships in 2013 and 2018 (tonnes).
| No. | Voivodship | Cereal | Potatoes | Fruit and Vegetables | |||
|---|---|---|---|---|---|---|---|
| 2013 | 2018 | 2013 | 2018 | 2013 | 2018 | ||
| 1 | Dolnośląskie | 13,081.22 | 20,790.84 | 498.20 | 542.35 | 1643.30 | 1599.30 |
| 2 | Kujawsko-Pomorskie | 3018.05 | 4768.09 | 384.00 | 951.38 | 1595.86 | 3586.34 |
| 3 | Lubelskie | 7635.98 | 14,927.66 | 446.40 | 1103.63 | 14,058.26 | 33,052.57 |
| 4 | Lubuskie | 7356.58 | 13,497.44 | 236.40 | 142.14 | 1122.87 | 4868.19 |
| 5 | Łódzkie | 2554.02 | 4342.31 | 303.15 | 577.34 | 3816.20 | 13,138.70 |
| 6 | Małopolskie | 2660.87 | 2937.12 | 1451.73 | 1095.99 | 4977.30 | 5640.47 |
| 7 | Mazowieckie | 9492.23 | 17,357.77 | 840.42 | 1381.85 | 8608.71 | 35,222.12 |
| 8 | Opolskie | 651.41 | 4100.97 | 63.95 | 198.7 | 325.98 | 285.06 |
| 9 | Podkarpackie | 3293.65 | 4311.31 | 1444.99 | 1008.23 | 8724.79 | 34,395.02 |
| 10 | Podlaskie | 9591.07 | 20,999.97 | 2833.37 | 2818.75 | 2340.73 | 4154.30 |
| 11 | Pomorskie | 5909.69 | 6361.02 | 409.28 | 465.05 | 2235.07 | 2234.71 |
| 12 | Śląskie | 1450.61 | 1810.71 | 95.10 | 95.5 | 320.39 | 295.64 |
| 13 | Świętokrzyskie | 4582.64 | 4871.06 | 1755.42 | 1453.66 | 8535.18 | 11,547.01 |
| 14 | Warmińsko-Mazurskie | 14,740.64 | 25,774.31 | 2793.63 | 2653.11 | 3700.20 | 4202.65 |
| 15 | Wielkopolskie | 9610.81 | 19,058.68 | 358.70 | 428.76 | 2566.56 | 7098.80 |
| 16 | Zachodniopomorskie | 21,871.55 | 30,012.04 | 1405.51 | 646.26 | 4135.30 | 6601.71 |
| Poland | 117,501.02 | 195,921.30 | 15,320.25 | 15,562.70 | 68,706.70 | 167,922.59 | |
Source: based on data from the IJHARS Report (2013–2014, 2017–2018).
Table 3.
Statistics for selected organic crop production in 2013 and 2018.
| Item | 2013 | 2018 | ||||
|---|---|---|---|---|---|---|
| ZB | ZI | WO | ZB | ZI | WO | |
| Mean | 7343.81 | 957.52 | 4294.17 | 12,245.08 | 972.67 | 10,495.16 |
| Minimum | 651.41 | 63.95 | 320.39 | 1810.71 | 95.50 | 285.06 |
| Maximum | 21,871.55 | 2833.37 | 14,058.26 | 30,012.04 | 2818.75 | 35,222.12 |
| Standard deviation | 5673.12 | 900.88 | 3826.10 | 9171.90 | 805.17 | 12,287.29 |
| Coefficient of variation | 77.25 | 94.09 | 89.10 | 74.90 | 82.78 | 117.08 |
| Coefficient of asymmetry | 1.17 | 1.13 | 1.30 | 0.53 | 1.32 | 1.46 |
Notes ZB, ZI, WO denote the production of cereals, potatoes and fruit and vegetables from organic farms, respectively. Source: based on data from the IJHARS Report (2013–2014, 2017–2018)
Table 4.
Results of the classification of voivodships by diagnostic attributes in 2013 obtained with the k-means method.
Table 4.
Results of the classification of voivodships by diagnostic attributes in 2013 obtained with the k-means method.
| Cluster | Voivodships | Attributes | Average Values of Attributes for Clusters |
|---|---|---|---|
| 1 | Kujawsko-Pomorskie, Łódzkie, Opolskie, Śląskie | ZB13 | 1918.52 |
| ZI13 | 211.55 | ||
| WIO13 | 1514.61 | ||
| 2 | Dolnośląskie, Lubuskie, Pomorskie, Wielkopolskie | ZB13 | 8989.58 |
| ZI13 | 375.645 | ||
| WIO13 | 1891.95 | ||
| 3 | Lubelskie, Małopolskie, Mazowieckie, Podkarpackie, Świętokrzyskie | ZB13 | 5533.07 |
| ZI13 | 1187.79 | ||
| WIO13 | 8980.85 | ||
| 4 | Podlaskie, Warmińsko-Mazurskie, Zachodniopomorskie | ZB13 | 15,401.09 |
| ZI13 | 2344.17 | ||
| WIO13 | 3392.08 |
Notes: ZB13, ZI13, WO13, denote the production of cereals (ZB), potatoes (ZI) and fruit and vegetable (WO) in 2013, respectively. Source: Own work using the Statistica 13 software package.
Table 5.
Results of the classification of voivodships by diagnostic attributes in 2018 obtained with the k-means method.
Table 5.
Results of the classification of voivodships by diagnostic attributes in 2018 obtained with the k-means method.
| Cluster | Voivodships | Attributes | Average Values of Attributes for Clusters |
|---|---|---|---|
| 1 | Podlaskie, Warmińsko-Mazurskie | ZB18 | 23,387.14 |
| ZI18 | 2735.93 | ||
| WIO18 | 4178.48 | ||
| 2 | Kujawsko-Pomorskie, Łódzkie, Małopolskie, Opolskie, Pomorskie, Śląskie, Świętokrzyskie | ZB18 | 4170.18 |
| ZI18 | 691.09 | ||
| WIO18 | 5246.85 | ||
| 3 | Dolnośląskie, Lubuskie, Wielkopolskie, Zachodniopomorskie | ZB18 | 20,839.75 |
| ZI18 | 439.88 | ||
| WIO18 | 5042.00 | ||
| 4 | Lubelskie, Mazowieckie, Podkarpackie | ZB18 | 12,198.91 |
| ZI18 | 1164.57 | ||
| WIO18 | 34,223.24 |
Notes: ZB18, ZI18, WO18 denote the production of cereals (ZB), potatoes (ZI) and fruit and vegetable (WO) in 2018, respectively. Source: Own work using the Statistica 13 software package.
Table 6.
Results of the analysis of variance for the k-means method.
| Diagnostic Attributes | Analysis of Variance in 2013 | |||||
| Intergroup Variance | df | Intragroup Variance | df | F-Statistics | p-Value | |
| ZB13 | 10.56 | 3 | 4.44 | 12 | 9.50 | 0.002 |
| ZI13 | 11.85 | 3 | 3.15 | 12 | 15.02 | 0.000 |
| WIO13 | 11.36 | 3 | 3.64 | 12 | 12.47 | 0.001 |
| Diagnostic Attributes | Analysis of Variance in 2018 | |||||
| Intergroup Variance | df | Intragroup Variance | df | F-Statistics | p-Value | |
| ZB18 | 11.89 | 3 | 3.11 | 12 | 15.29 | 0.000 |
| ZI18 | 12.37 | 3 | 2.63 | 12 | 18.81 | 0.000 |
| WIO18 | 13.78 | 3 | 1.22 | 12 | 45.22 | 0.000 |
Notes: ZB13, ZB18, ZI13, ZI18, WO13, WO18 denote the production of cereals (ZB), potatoes (ZI) and fruit and vegetable (WO) in 2013 and 2018, respectively. Source: Own work using the Statistica 13 software package.
Publisher’s Note: MDPI stays neutral with regard to jurisdictional claims in published maps and institutional affiliations. |
© 2021 by the author. Licensee MDPI, Basel, Switzerland. This article is an open access article distributed under the terms and conditions of the Creative Commons Attribution (CC BY) license (https://creativecommons.org/licenses/by/4.0/).
Share and Cite
MDPI and ACS Style
Kobylińska, M. Spatial Diversity of Organic Farming in Poland. Sustainability 2021, 13, 9335. https://0-doi-org.brum.beds.ac.uk/10.3390/su13169335
AMA Style
Kobylińska M. Spatial Diversity of Organic Farming in Poland. Sustainability. 2021; 13(16):9335. https://0-doi-org.brum.beds.ac.uk/10.3390/su13169335
Chicago/Turabian StyleKobylińska, Małgorzata. 2021. "Spatial Diversity of Organic Farming in Poland" Sustainability 13, no. 16: 9335. https://0-doi-org.brum.beds.ac.uk/10.3390/su13169335
Note that from the first issue of 2016, this journal uses article numbers instead of page numbers. See further details here.