
Tourism-Related Loans as a Driver of a Small Island Economy: A Case of Northern Cyprus


1
Faculty of Tourism Management, Eastern Mediterranean University, Famagusta 99628, Turkey
2
Department of Business Administration, Eastern Mediterranean University, Famagusta 99628, Turkey
3
Department of Economics and Finance, Istanbul Gelisim University, Istanbul 34010, Turkey
4
Department of Economics and Finance, South Ural State University, Chelyabinsk 454080, Russia
*
Author to whom correspondence should be addressed.
Sustainability 2021, 13(17), 9508; https://0-doi-org.brum.beds.ac.uk/10.3390/su13179508
Submission received: 13 July 2021
/
Revised: 6 August 2021
/
Accepted: 12 August 2021
/
Published: 24 August 2021
(This article belongs to the Special Issue Sustainable Island Tourism)
Abstract
:Although the literature on the contribution of tourism to economic expansion vis-à-vis the tourism-led growth hypothesis has been widely explored, so far, limited attention has been paid to the specificity of the role of tourism-related loans or financial inducement in economic growth. This paper examines the short-run and long-run relationships between bank loan disbursements to the tourism sector and economic growth in Northern Cyprus. We structurally derive empirical equations for co-integration and error-correction models by extending the original Solow growth model, applying a cointegration approach that is strengthened by the autoregressive distributed lag and Granger causality approaches to reveal important findings. The empirical findings suggest unidirectional causality from loans disbursed to the tourism sector to economic growth in Northern Cyprus for the period under study. Additionally, we show that tourism-related loans and human and technological advancement all spur economic growth in the short- and long-run. These findings’ main policy implication is that long-term complementary policies in the domestic banking system can increase the access to financial sources for tourism enterprises and, consequently, promote tourism-led economic growth, especially in small tourism-dependent economies where capital sources are scarce.
1. Introduction
With the increasing challenges to economic prosperity amidst human quest for survival, economies across the globe have continued to explore the different options of economic diversification and expansion. Given the aforementioned major concern, most economies have resorted to deepening the development and integration of the aspects of economic sectors such as the tourism. Thus, this aspect of the economy vis-à-vis tourism has increasingly provided economic opportunities in health and medical tourism, leisure, adventure, and agricultural-related tourism. This, as it hinges on the economic growth model [1], on the one hand lauds the tourism-led growth relationship in the literature [2,3,4]) and on the other hand promotes the growth-led tourism development illustrations [5,6,7].
Thus, as highlighted in the extant literature, the association between economic growth and tourism development has largely been ascribed to either bidirectional or unidirectional correlation. Given the existence of empirical evidence on the relationship between the development of the tourism sector and economic growth [8,9,10,11,12,13,14,15,16,17], other associated factors are potential contributors to tourism development or at least mediate the nexus between economic growth and tourism development. For instance, the role of access to financial resources in sustaining the relationship between economic growth and tourism development has been sparsely explained in the existing literature. Although many socioeconomic and financial factors—such as urbanization, economic policy uncertainty, interest rates, and many more—have been explored in the extant literature (2–17), the specificity of financial services such as loan or credit disbursement has barely been considered. Thus, this paper attempts to fill this gap by exploring (i) whether there is a causal relationship between loan disbursements to the tourism sector and economic growth, (ii) what is the direction of causality between them, and (iii) the impact of tourism-related credit availability among other factors on the economic expansion of the country in context.
This paper’s motivation originates from the real-world observation that, on the one hand, tourism is a capital-intensive sector and, therefore, tourism development requires substantial investments both from the public and private sectors [18]. On the other hand, empirical evidence shows that the domestic banking sector’s development contributes significantly to economic growth [19,20]. Given that the tourism sector is recognized in many small economies as one of the main sectors of the economy, the natural question that arises here is whether the relationship between the two can increase the rate of productive investments in the tourism sector and eventually result in economic growth.
In order to investigate the answer to this question, time-series data from Northern Cyprus from 1977 to 2016 was used. Northern Cyprus provides a unique environment for our analysis, for at least two reasons. First, since its establishment or annexation from the Republic of Cyprus in the 1970s, this self-governed state has not been officially recognized by any country in the international community except Turkey. Over these years, this state barely had any options to spur economic growth other than exploiting its tourism potential. Moreover, the tourism industry of the small island state is mainly driven by entrepreneurially small recreational and/or tourism-related activities that are mostly supported by credits from financial institutions. However, the significance of examining the case of Northern Cyprus is driven from its semblance to other small economies such as Malta, Cyprus, and coastal regions that have high dependence on their tourism sectors [21,22]. Thus, the lessons from different aspects of tourism-led growth from the aforementioned small island economies are billed to offer an insightful perspective for Northern Cyprus in the current study. Second, similarly to other sectors in an economy, the sustainable development of the tourism sector over time requires access to capital resources. Domestic capital resources in small economies are often not sufficient to domestically finance the capital investments required to implement tourism projects. In such a situation, small economies often exploit foreign direct investments (FDI) to compensate for the lack of sufficient domestic funds [23]. However, in the case of Northern Cyprus, access to international capital markets and financing has been limited by international economic embargoes [24], and the alternative source of capital has been loans from domestic banks. Thus, lessons from Northern Cyprus can be very valuable for the governments of other small tourism-dependent economies when it comes to designing policies for the development of the tourism sector, especially during times when access to foreign capital markets is limited.
This study contributes to the existing literature in several ways. The first contribution of this paper to the existing literature is methodological. The theoretical foundation of a robust empirical analysis should be based on a proper growth model in order to distinguish a valid causal relationship from a correlation. Although there are several empirical studies evaluating the relationship between the development of the tourism sector and economic growth, none of those studies provide a theoretical foundation for such empirical analyses. Similar to [25,26], we fit structural convergence equations of economic growth by extending the Solow growth model. In this framework, the level of technological and economic efficiency is not only dependent on the level of technology which grows at an exogenous rate but also on economy-wide policies. Second, our study contributes to the existing tourism literature on the importance of having access to financial resources in the tourism sector and economic growth in small economies [27,28]. While several studies found empirical evidence in support of tourism-induced growth for small economies [29,30], the underlying mechanisms have not been investigated. Our results provide new insights for policymakers in these economies by looking at the role of domestic investments in tourism-led growth. This is critical for small economies, given that increasing levels of debt to GDP can adversely affect economic growth [31]. Future studies could explore what other policies may be useful in improving the mechanisms that encourage domestic investments in the tourism sector of small tourism-dependent economies. Third, on a broader level, this study highlights the importance of designing long-term planning policies for sustainable economic growth. Our findings point out that even in the case of an isolated small state such as Northern Cyprus, access to financial resources can cause significant growth in the economy in the long run. As such, governments can spur economic growth by developing a good infrastructure for the banking system in order to channel financial resources earmarked for tourism sector development into the economy. This is consistent with the results of many studies in the extant literature [31,32], which indicate that government spending on infrastructure can significantly affect economic growth.
The rest of the paper is structured as follows: Section 2 provides a brief literature review and an overview of the tourism sector in Northern Cyprus. In Section 3, the dataset and methods for the investigation are described by providing information about the sources and statistical properties, the theoretical framework, and the adopted empirical approaches. This is now followed by the discussion of the result as detailed in Section 4. Lastly, Section 5 concludes the study with the summarized results, policy and recommendation for future study.
Peculiarity of Economic Growth in Northern Cyprus
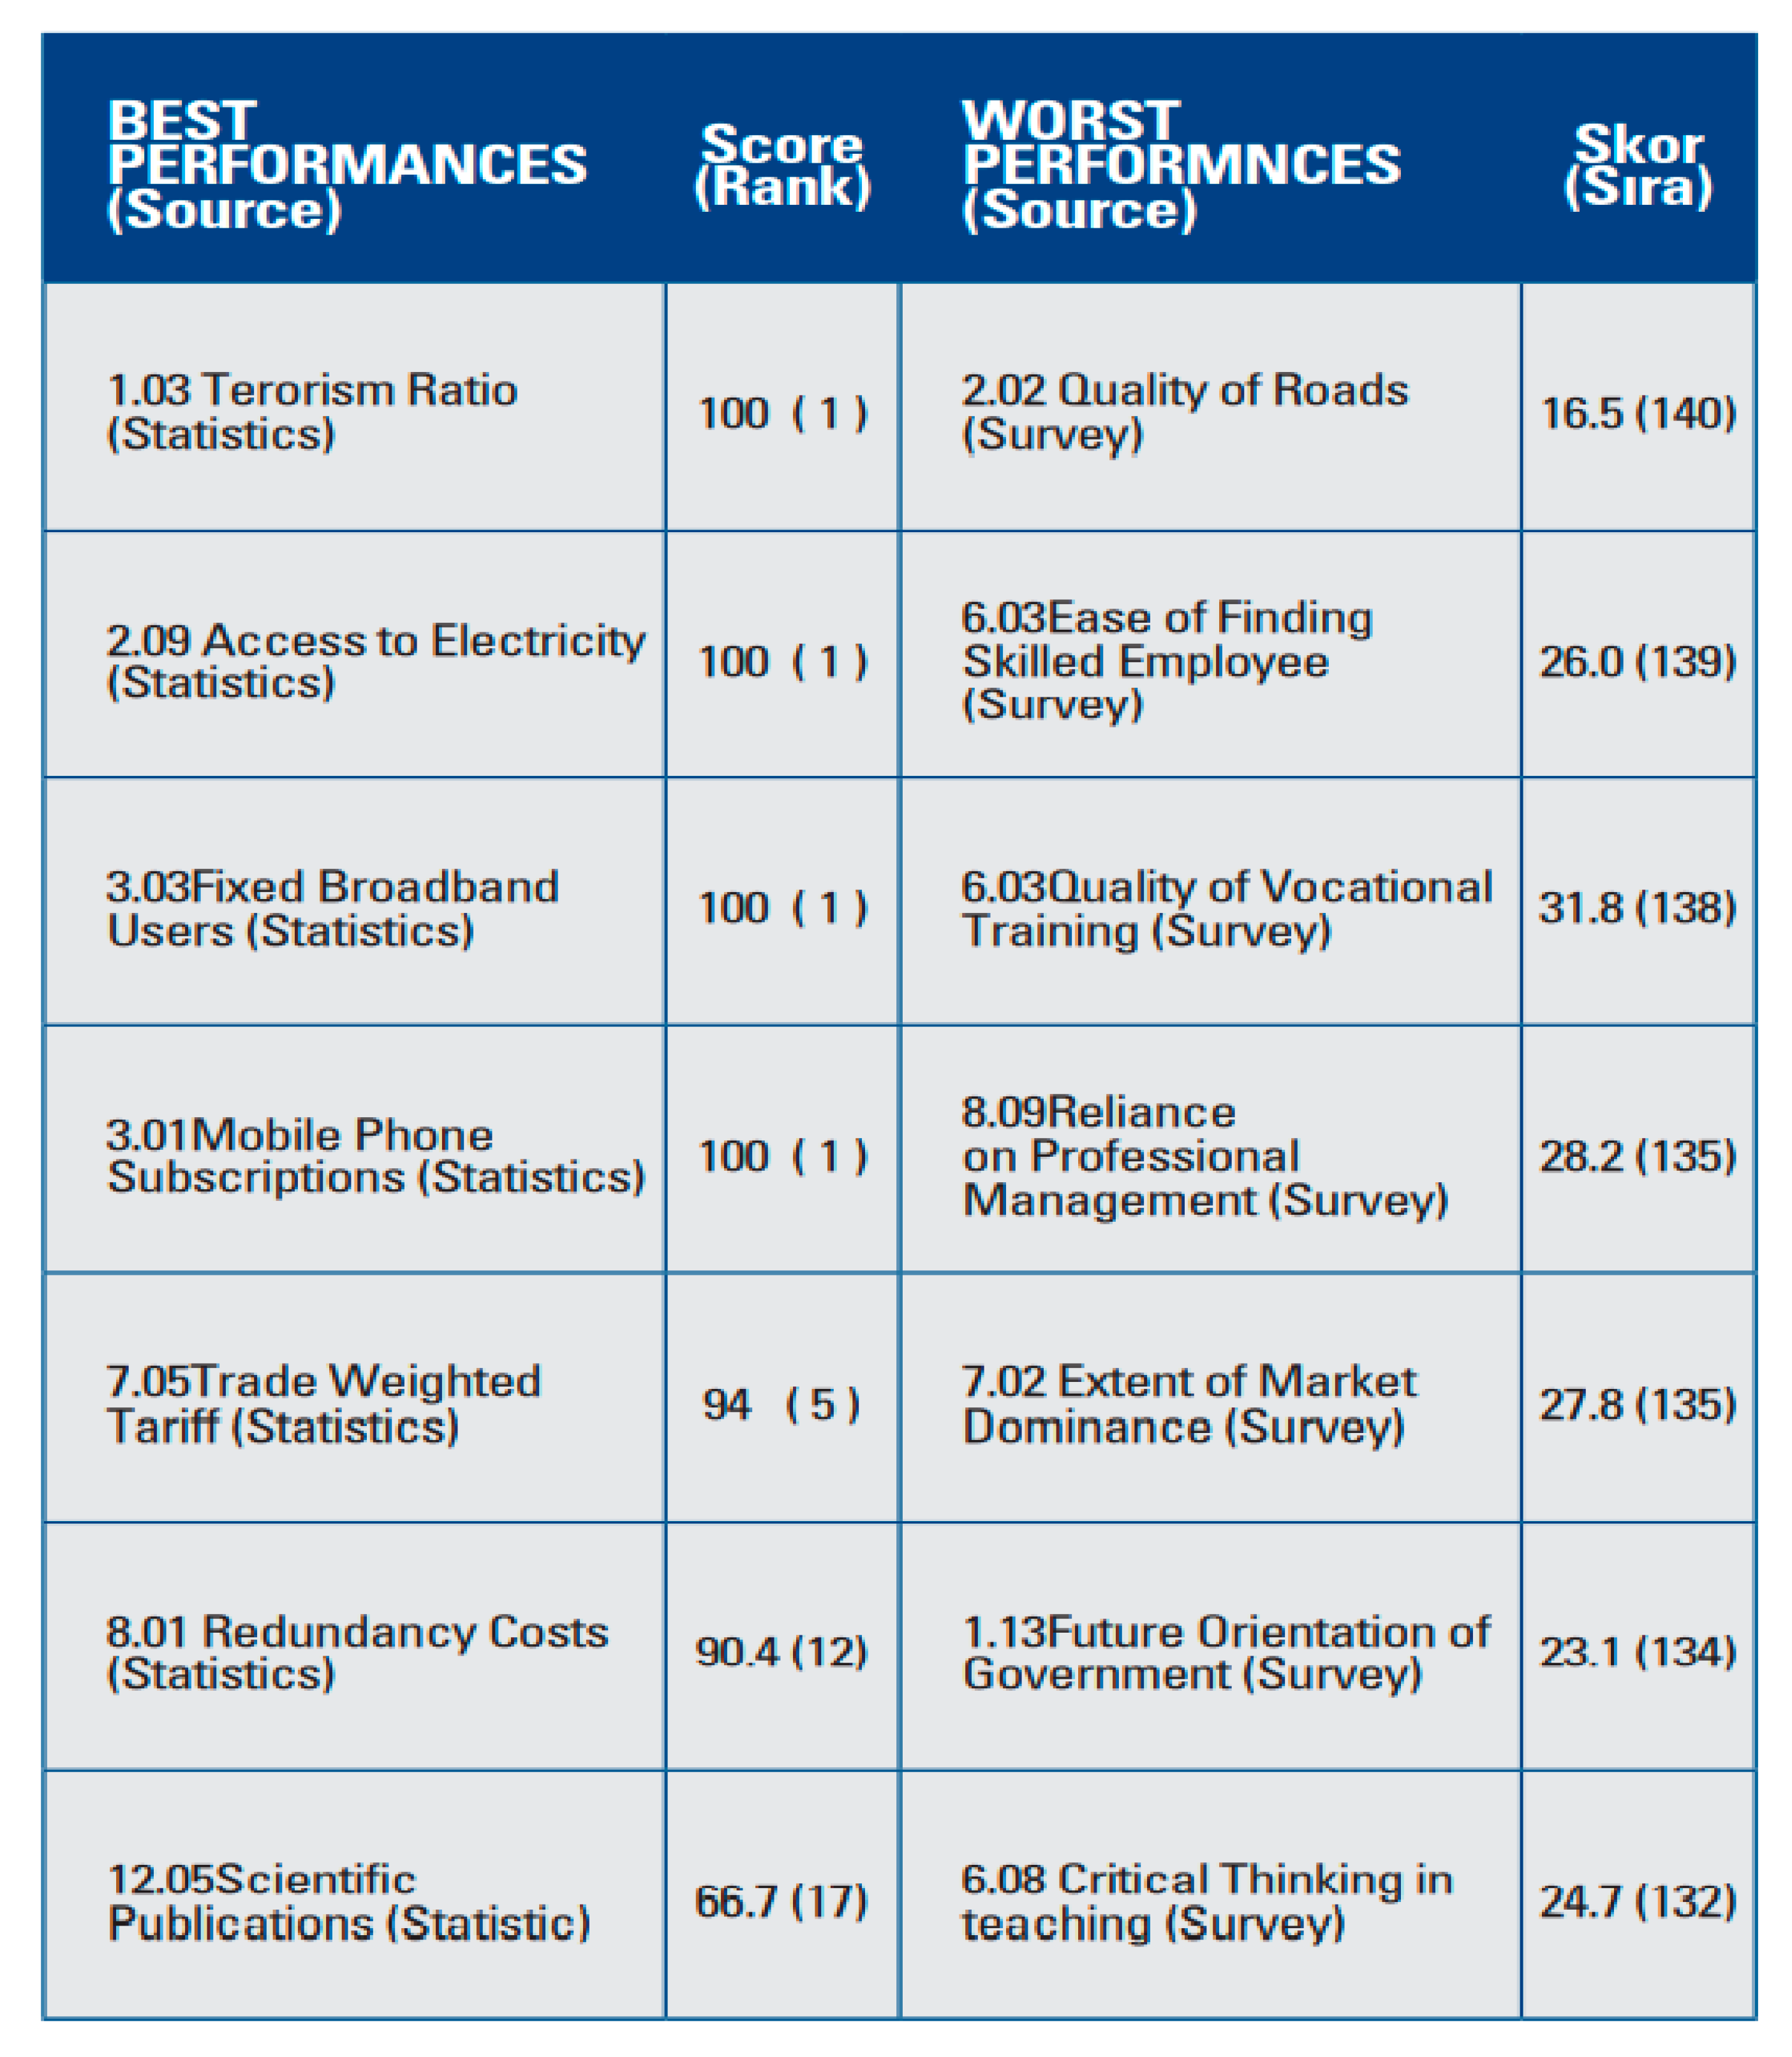
The territorial state of Northern Cyprus is a small Mediterranean island with limited natural resources. Since the establishment of this state in the 1970s, Northern Cyprus has experienced decades of isolation from the global economy due to international economic embargoes. Over the years, one of the main impacts of these embargoes has been the transition of the Northern Cyprus economy from manufacturing- to service-oriented. This transition is observable in its macroeconomic data when one looks at the sectorial distribution of the gross domestic product (GDP) over time. The share of the contribution of hotels and restaurants to GDP was only 2.6 percent back in 1977, compared to the 8.4 percent share of manufacturing. These figures, nonetheless, are reversed in 2016, with hotels and restaurants comprising more than 8.7 percent of the GDP compared to a share of only 3.7 percent for the manufacturing sector [33]. Like other economies across the globe, the economic activities of Northern Cyprus were brought to a standstill in 2020 by the yet-to-be-subdued corona virus (COVID-19) pandemic. Despite the havoc caused by the pandemic, the Northern Cyprus economy is known to majorly thrive on tourism, thus making the COVID-19 pandemic exert a devastating impact. Prior to 2020, as indicated in Figure A1 of the Appendix A, the state’s economy was measured by Best performance and Worst performance indicators.
The development of the tourism sector has provided a great opportunity for Northern Cyprus to absorb revenue inflows not only in domestic currency (Turkish Lira, TL) from Turkish visitors but also in foreign currencies from other international visitors. According to national statistics, the tourist arrivals only from Turkey in 2016 were 64 percent more than they were in 2010. Similarly, Northern Cyprus has become an attractive destination for international tourists despite the difficulties in reaching this destination because of the lack of direct international flights: there was an increase of 124 percent in the number of international tourists who landed in Northern Cyprus in 2016 compared to 2010 [34]. A number of studies have analysed the impact of the tourism industry in Northern Cyprus on economic growth [24,33,35,36,37]. The findings indicate that international tourism is in a long-run equilibrium relationship with real income growth in Northern Cyprus. In other words, although Northern Cyprus has suffered from political non-recognition and economic embargoes since 1974, international tourism has contributed significantly to the economic growth in this small island economy.
With the growing attraction of Northern Cyprus as a tourist destination among the Turkish and international community, the tourism sector has become one of the main sectors in Northern Cyprus’s economy. The revenues from tourism as a percentage of GDP amounted to 19 percent in 2016 [38]. The tourism sector, similarly to other sectors within the economy, requires access to financial sources for sustainable development. Domestic banks’ loans play a critical role in facilitating access to capital sources, especially when foreign direct investments are constrained. During recent decades, there has been some progress in this regard in Northern Cyprus: the loan disbursements to the tourism sector have increased over time. References [37,39,40,41,42] provided that the tourism sector has become one of the most important sectors contributing to economic growth in Northern Cyprus, policies set by the central bank in this small state can have significant impacts on the sustainability of such developments.
2. Literature: A Synopsis
Several studies have explored the channels through which the development of the tourism sector might affect economic growth in host countries [11,12,13,14,15,16,17,33,34,35,36]. The findings of these studies suggested several channels as the main drivers of economic growth, including an increase in foreign exchange earnings, an increase in local employment, induced demand for local products and services, and increased productivity of labour and capital resources. In line with the objective of the study, the extant literature is discussed in this section regarding the subject of the contribution of fixed capital formation, education, the labour force participation rate, and tourism-related loans to economic growth.
The importance of this sector is highlighted even more for developing countries, as their technological frontiers do not let them to compete with developed countries in the export of other products [38,43]. In line with the tourism-led growth hypothesis, Oh [9] argues that the revenues generated from the tourism sector help governments not only balance their current account deficits but also improve their balance of payments. This explains why many governments have prioritized public investments in the tourism sector. Empirical evidence suggests that an increased level of public expenditures in the tourism sector can effectively stimulate economic growth, but not homogenously for all countries. Chou (2013) investigated the answer to this question by looking at a dataset of 10 transition countries over 23 years. The results show that there is a positive correlation between government spending in the tourism sector and economic growth for some countries. While the findings support the existence of economic growth promoted by tourism spending in the cases of Cyprus, Latvia and Slovakia, the other countries in the sample tended to show a reverse relationship. The author argued that the findings highlight the heterogeneous nature of the tourism spending and growth relationship among different countries.
In addition to the tourism-led growth relationship, the validity of the fixed capital formation-led growth hypothesis is not unexpected, especially in tourism destinations. Expectedly, governments should be interested in understanding how the inflow of various sources of capital (domestic or foreign) into the tourism sector might stimulate economic growth in local economies. Capital sources are often too scarce in the developing world to domestically finance the capital investment requirements of tourism projects. Even in developed countries, local public finances are under considerable stress, emphasizing the need to rethink both expenditure and revenue policies at all government levels [40,42]. Developing countries compete to attract foreign direct investments (FDI) to compensate for the lack of sufficient domestic funds [16]. However, access to international capital markets can be very challenging for some countries, especially for those under international economic embargoes [37].
It is important to establish the relationship between the tourism sector and economic growth with respect to receiving loans and credit for financing the industry of tourism in a country. Several researchers have explored the relationship between tourism promotion and economic development, some of whom were Aliza Fleischer et al. in Israel. It was established that the impact of economic development was controversial and not necessarily obvious [43]. As a matter of fact, an empirical analysis that involved a hybrid form of assessing impact was employed, and it made a case for the growth of small-scale tourism businesses being supported by the public. Research conducted by Darcy et al. using a mixed-method explorative yet interpretive approach revealed that crowd-funding has contributed massively to the capital requirements of tourism start-ups, and that several financial instruments and programs such as investment bank loans and structural funds have done the same [44]. Similarly, a piece of research conducted in Nepal using the Johansen co-integration approach for the periods of 1975–2013 revealed that economic growth could be attributed to credit from the private sector, all of which could positively influence the performance of tourism [45]. The importance of understanding these feats can therefore not be overemphasized.
In reference to capital formation, papers examining the relationship between economic growth and capital formation in Sub-Saharan African countries were assessed using a variety of techniques. One of these revealed that, regardless of the measurement being used, higher economic growth is directly proportional to capital formation [46]. 13 SSA countries were assessed, and it was discovered that increases in the exports of a country, which could contribute to the autonomous growth of GDP, definitely have a positive correlation with capital formation, which in turn could be used in the development of tourism. A sneak peek into the rapid growth of China shows that physical and human capital formation played a major role. The impact of physical and human capital were examined using basic data techniques starting from the baseline equation; apparently, investing in innovation and private investments which could also be extrapolated to tourism were found to be equally necessary in facilitating economic growth [47].
The role of education in economic growth cannot be left out, as a plethora of researchers have utilized a variety of methods to estimate the impact of education on the growth of the economy of interest. Education is a significant characteristic of human capital investments, which involve using appropriate skills and competencies to achieve optimum results [48]. If there was anything that was observed, it was that there are multiple problems associated with estimation, and these might have contributed to the multiple divergent results. A piece of research conducted by Paul Glewwe et al. (2014) revealed that the quality of education provided in SSA was low when compared to other developing countries, and, therefore so was its contribution to economic growth [49]. Researchers such as Barro et al. (1994) were among the first to measure human capital using the average years of schooling of the adult population, and they were not linked to any form of economic growth. However, male secondary schooling had a significant and positive contribution to economic growth [50]. Using Northern Cyprus as a case study, tourism founded on the educational system has been a very important sector which was necessary for the generation of foreign revenue. Improvement was observed from the 1990s, and as of 2006 there were over 41,685 students in Northern Cyprus from foreign countries. The growth has indeed been steady, as the accredited universities have been branded to attract students from more than 68 countries around the world [51]. Educational tourism obviously has a positive impact on the growth of an economy regardless of the country of focus; it is therefore pertinent for local authorities to invest in the quality of education and branding in order to attract foreign investments.
3. Materials and Methods
Table 1 describes the variables used in this paper and lists the data source for each variable. The sample used to estimate Equation (8) consists of annual observations from Northern Cyprus national accounts for the annual period from 1977 to 2016, the latest available data coverage at the time of this analysis (the data was collected from the website of the State Planning Organization (SPO). See http://www.devplan.org for more information accessed on 10 June 2021). The dependent variable to measure economic growth is the log of real gross domestic product (GDP) per worker (LRGDP). The first two independent variables are , the log of fixed capital formation to GDP (LIGDP) and , the log of the secondary-level enrolment rate (LSENR). The next explanatory variable is the log of (LLABR). While we can calculate from the data, an assumption needs to be made for . Following the existing literature [38,52,53], we assume that . Lastly, for the exogenous policy variable Z, we use the log of the tourism-sector bank loan disbursements to the GDP ratio (LTLOAN).
3.1. Preliminary Estimations
The first step of empirical analysis is to evaluate whether the data series have a unit root test or not, because the outcome will be spurious estimates if the data series enter into the analysis in levels. Thus, we check the stationarity of the data series by performing some unit root tests. Four different unit root tests are employed: Augmented Dickey Fuller (ADF), Dickey Fuller GLS (DF-GLS), Phillips Perron (PP) and Kwiatkowski Phillips Schmidt Shin (KPSS). Performing four different unit root tests gauges the sensitivity of the results provided by each test, given that each of them has a different specification (for instance, KPSS proposes a different approach from the other unit root tests. KPSS assumes that the series has no unit roots (stationary), whereas the alternative null hypothesis by the other approaches is that the series has a unit root (non-stationary)).
The second step is the cointegration test in order to examine the long-run relation between the variables of interest. The idea here is that if the unit root tests establish the non-stationarity of all of the variables, then it is required to test whether a cointegration (long-run) relationship between the variables of interest. As such, we use the Johansen cointegration test proposed by Johansen and Juselius [54], and complement the Johansen test results before proceeding to the employment of the autoregressive distributed lag (ARDL) bounds testing approach proposed by Pesaran and colleagues [55].
3.2. Theoretical Framework and Empirical Methods
Our theoretical model was developed using an extended version of the original Solow growth model. The original model uses production functions to explain how exogenous factors result in economic growth through physical capital accumulation, population growth and technological advances. However, the augmented Solow model, originally developed by Mankiw et al. (54, takes into account the role of endogenous growth factors such as human capital. Thus, the augmented Solow model can outperform the original Solow model in explaining the channels of economic growth.
We start setting up our theoretical model by considering the following Cobb–Douglas production function:
where Y is real output, K represents physical capital, H is human capital, L is the stock of raw labour in the economy, A is the labour-augmenting factor reflecting the level of technology in the country, and t is the time index. It is assumed here that there are decreasing returns to factor inputs, i.e., α + β < 1.
Physical (K) and human capital (H) grow over time but depreciate at a rate of . The fractions of real output devoted to the accumulation of physical and human capital are denoted by and , respectively. Moreover, the stock of labour and technology in the economy evolve exogenously, as shown below:
where n is the exogenous rate of growth in the labour force, and g is the exogenous rate of technological progress. In this model, it is assumed that the state of labour-augmenting technology (A) depends not only on exogenous technological improvements (g) but also on bank loans disbursed to the tourism sector (Z). This factor is integrated into the model because access to capital markets and financial services can affect the level of efficiency in the economy. In our case study, the flow of bank loans into the tourism sector of Northern Cyprus is expected to affect the level of productive investments and labour productivity, which consequently contribute to economic growth.
In the steady state, the output per effective worker () is constant, whereas the output per worker evolves as follows:
Let the steady-state output per effective worker be . Taking the logs of both sides of Equation (4), we obtain , where ; therefore,
where and denote the fractions of real output devoted to the accumulation of physical and human capital, respectively.
Equation (5) shows the steady-state level of the total output per worker. In order to quantify the speed of convergence toward the steady state, we use the log-linearization method. Equation (6) shows the transitional dynamics of the model:
where , the annual speed of convergence. Rearranging Equation (6) provides us with Equation (7), below, which represents the transition path to the steady state:
The last step is to account for the off-equilibrium dynamics of the total output per worker. As such, Equation (7) is turned into an error-correction form, in which the explanatory variables are included both in levels and in the first differences in order to pick up transitional dynamics, in addition to the lagged dependent variable in levels:
where is the error term that is identically and independently distributed. Equation (8) represents the basic functional form that is used for empirical estimation in this study.
3.3. Empirical Method: ARDL Co-Integration Approach
The main advantage of the ARDL bounds test is its applicability even if the variables of interest tend to be of mix-orders. In other words, this method is more flexible compared to the Johansen approach because it can be used regardless of whether the variables are stationary, non-stationary and/or mutually cointegrated. Moreover, the outcome of ARDL is robust when the sample under study is relatively small [56]. Most importantly, a dynamic error correction model (ECM) can be derived from ARDL to capture both short-run and long-run dynamics. These features are highly appealing in our study.
Lastly, the directions of causality among the variables of interest are examined using the Granger causality based on block erogeneity Wald test which provides the Chi-squared statistics of coefficients on the lagged endogenous variables. The statistical significance of the coefficients can be inferred from these statistics, and it can be identified whether causality exists from the explanatory variables to economic growth.
4. Results and Discussion
In this section, we discuss the results of the preliminary investigation, as well detailing the observation from the short- and long-run estimates in addition to the Granger causality outcomes.
4.1. Preliminary Estimations
Table 2 shows the correlation matrix of our variables. The pairwise relationships between the explanatory variables do not show significant correlations, and therefore there is no sign of multicollinearity between the variables.
Table 3 reports the results of the unit root tests. The null hypothesis of a unit root cannot be rejected in the levels of the LRGDP, LSENR, LLABR and LTLOAN series, but it appears that LIGDP is integrated in the order zero, I(0) (columns 1–3). The result of KPSS in column 4 validates the robustness of our results from the other three tests: rejecting the null hypothesis of stationarity at the level form for LRGDP, LSENR, LLABR and LTLOAN, but failing to reject it in the level form for LIGDP. In columns 5 through 7, the results of the unit root tests in the first difference is listed. The null hypotheses of a unit root are rejected for all of the series in the first difference of the series. This means that LRGDP, LSENR, LLABR and LTLOAN are integrated in the order of order one [1]. Similarly to the level form, KPSS confirms the results obtained from the ADF, DF-GLS and PP tests.
Given that all of the data series are either I(0) or I(1), the next step is to proceed with the Johansen co-integration test to investigate the existence as well as number of co-integrating vectors. Panels A and B of Table 4 show that we can reject the null hypothesis of no co-integration by comparing the critical values at the 5% and 10% levels of significance with the reported statistics for the Max-Eigen and trace statistics. In Panel C of Table 4, we use three different criteria to select the optimal order of lags: the Akaike Information Criterion (AIC), the Schwarz Bayesian Criterion (SBC) and the Hannan–Quinn Criterion (HQC). It can be inferred from these criteria that the preferred order is 1.
We complement the Johansen co-integration test with the ARDL bounds test of co-integration. Table 5 shows the ARDL bounds test procedure, which is based on the joint F-statistic or the Wald statistic (W-statistic) for co-integration analysis. It is also worthwhile to note here that none of the variables were I(2) based on the outcomes of the unit root tests, which satisfies the assumption of the ARDL bound test. Otherwise, the computed statistics provided by the bound test would not be valid. The results of the bounds test reveal that the computed F-statistic and W-statistic exceed the upper bound critical values, and therefore the null hypothesis of no co-integration can be rejected. Put differently, the results confirm that there is a long-run relationship between LRGDP and the explanatory variables.
4.2. The Short- and Long-Run Results
In the presence of I(0) and I(1) variables, the ARDL model provides the best fit. Table 6 shows the estimation results of our ARDL model. The coefficient of bank loans is positive and statistically significant in both the short- and long-run. This implies that bank loans disbursed to the tourism sector have contributed to the economic expansion of the Northern Cyprus economy. It follows that these loans or credit-related disbursements to the tourism sector—especially to tourism-related businesses, such as investment in the hotel industry, restaurant businesses, tour and guide start-ups, and other tourism-inclined investments—are all important to the expansion of the small island’s economy. In comparison with the extant literature, Ahmad [9] and Alola et al. [21] are among the studies that highlight the role of financial supports in the form of moderate interest rates and exchange rates, and other financial tools’ desirability in expanding tourism investments, which in turn spur economic growth.
In addition to the role of tourism-related role in economic growth, the results in Table 6 further show that the intensity of capital investment (the ratio of capital investment to real GDP, i.e., LIGDP) and human capita (the ratio of the total number of students in vocational and technical high schools to the total population, i.e., LSENR) have a positively significant contribution to the economic expansion of the tourism island destination. Specifically, a 1% increase in both LIGDP and LSENR, respectively, spur the economic expansion of Northern Cyprus by 0.210% and 0.144% in the long run, and 0.120% and 0.082% in the short run. The economic intuition for this observation is that the investment in both human and technological advancement in the country are important dimensions to boost the country’s economy, in addition to the significance of tourism industry development. There is semblance of this result in the extant studies [13,34,57]. Specifically, like the case of Northern Cyprus, Babatunde [33] affirmed that government spending on health infrastructure and education spur growth in Nigeria. However, economic growth in the island state is notably slowed down by the LLABR, which stands for the rates of growth in the labour force (n), technological progress (g) and the depreciation rate (δ) in the short- and long-run [58].
Diagnostic tests were also conducted to test the validity of the model. The outcomes of the tests for serial correlation, functional form specification, normality and heteroscedasticity suggest that there are no issues with the model, as displayed in the lower part of Table 6.
Moreover, in Table 7, short-run coefficients and the error correction term are reported. The negative and statistically significant error correction term indicates that the dependent variable converges by an annual speed of 55.8 percent towards its long-term equilibrium level. In other words, 55.8 percent of the deviations from the long-run equilibrium in real GDP per worker were corrected toward equilibrium annually through a series of partial short-run adjustments.
4.3. Granger Causality Outcome
As the last step of the empirical analysis, Granger causality tests were carried out to detect the direction of causality between the variables, as well as short-run dynamics around the long-run co-integration relationship. The results in Table 8 suggest that there is unidirectional causality from the tourism sector bank loans to economic growth. It should be mentioned, however, that this relationship only exists in the long run. In other words, bank loans do not show any causal impact on Northern Cyprus economic growth in the short-run. This finding holds even after including deterministic trends in the model [59].
5. Conclusions and Policy Implications
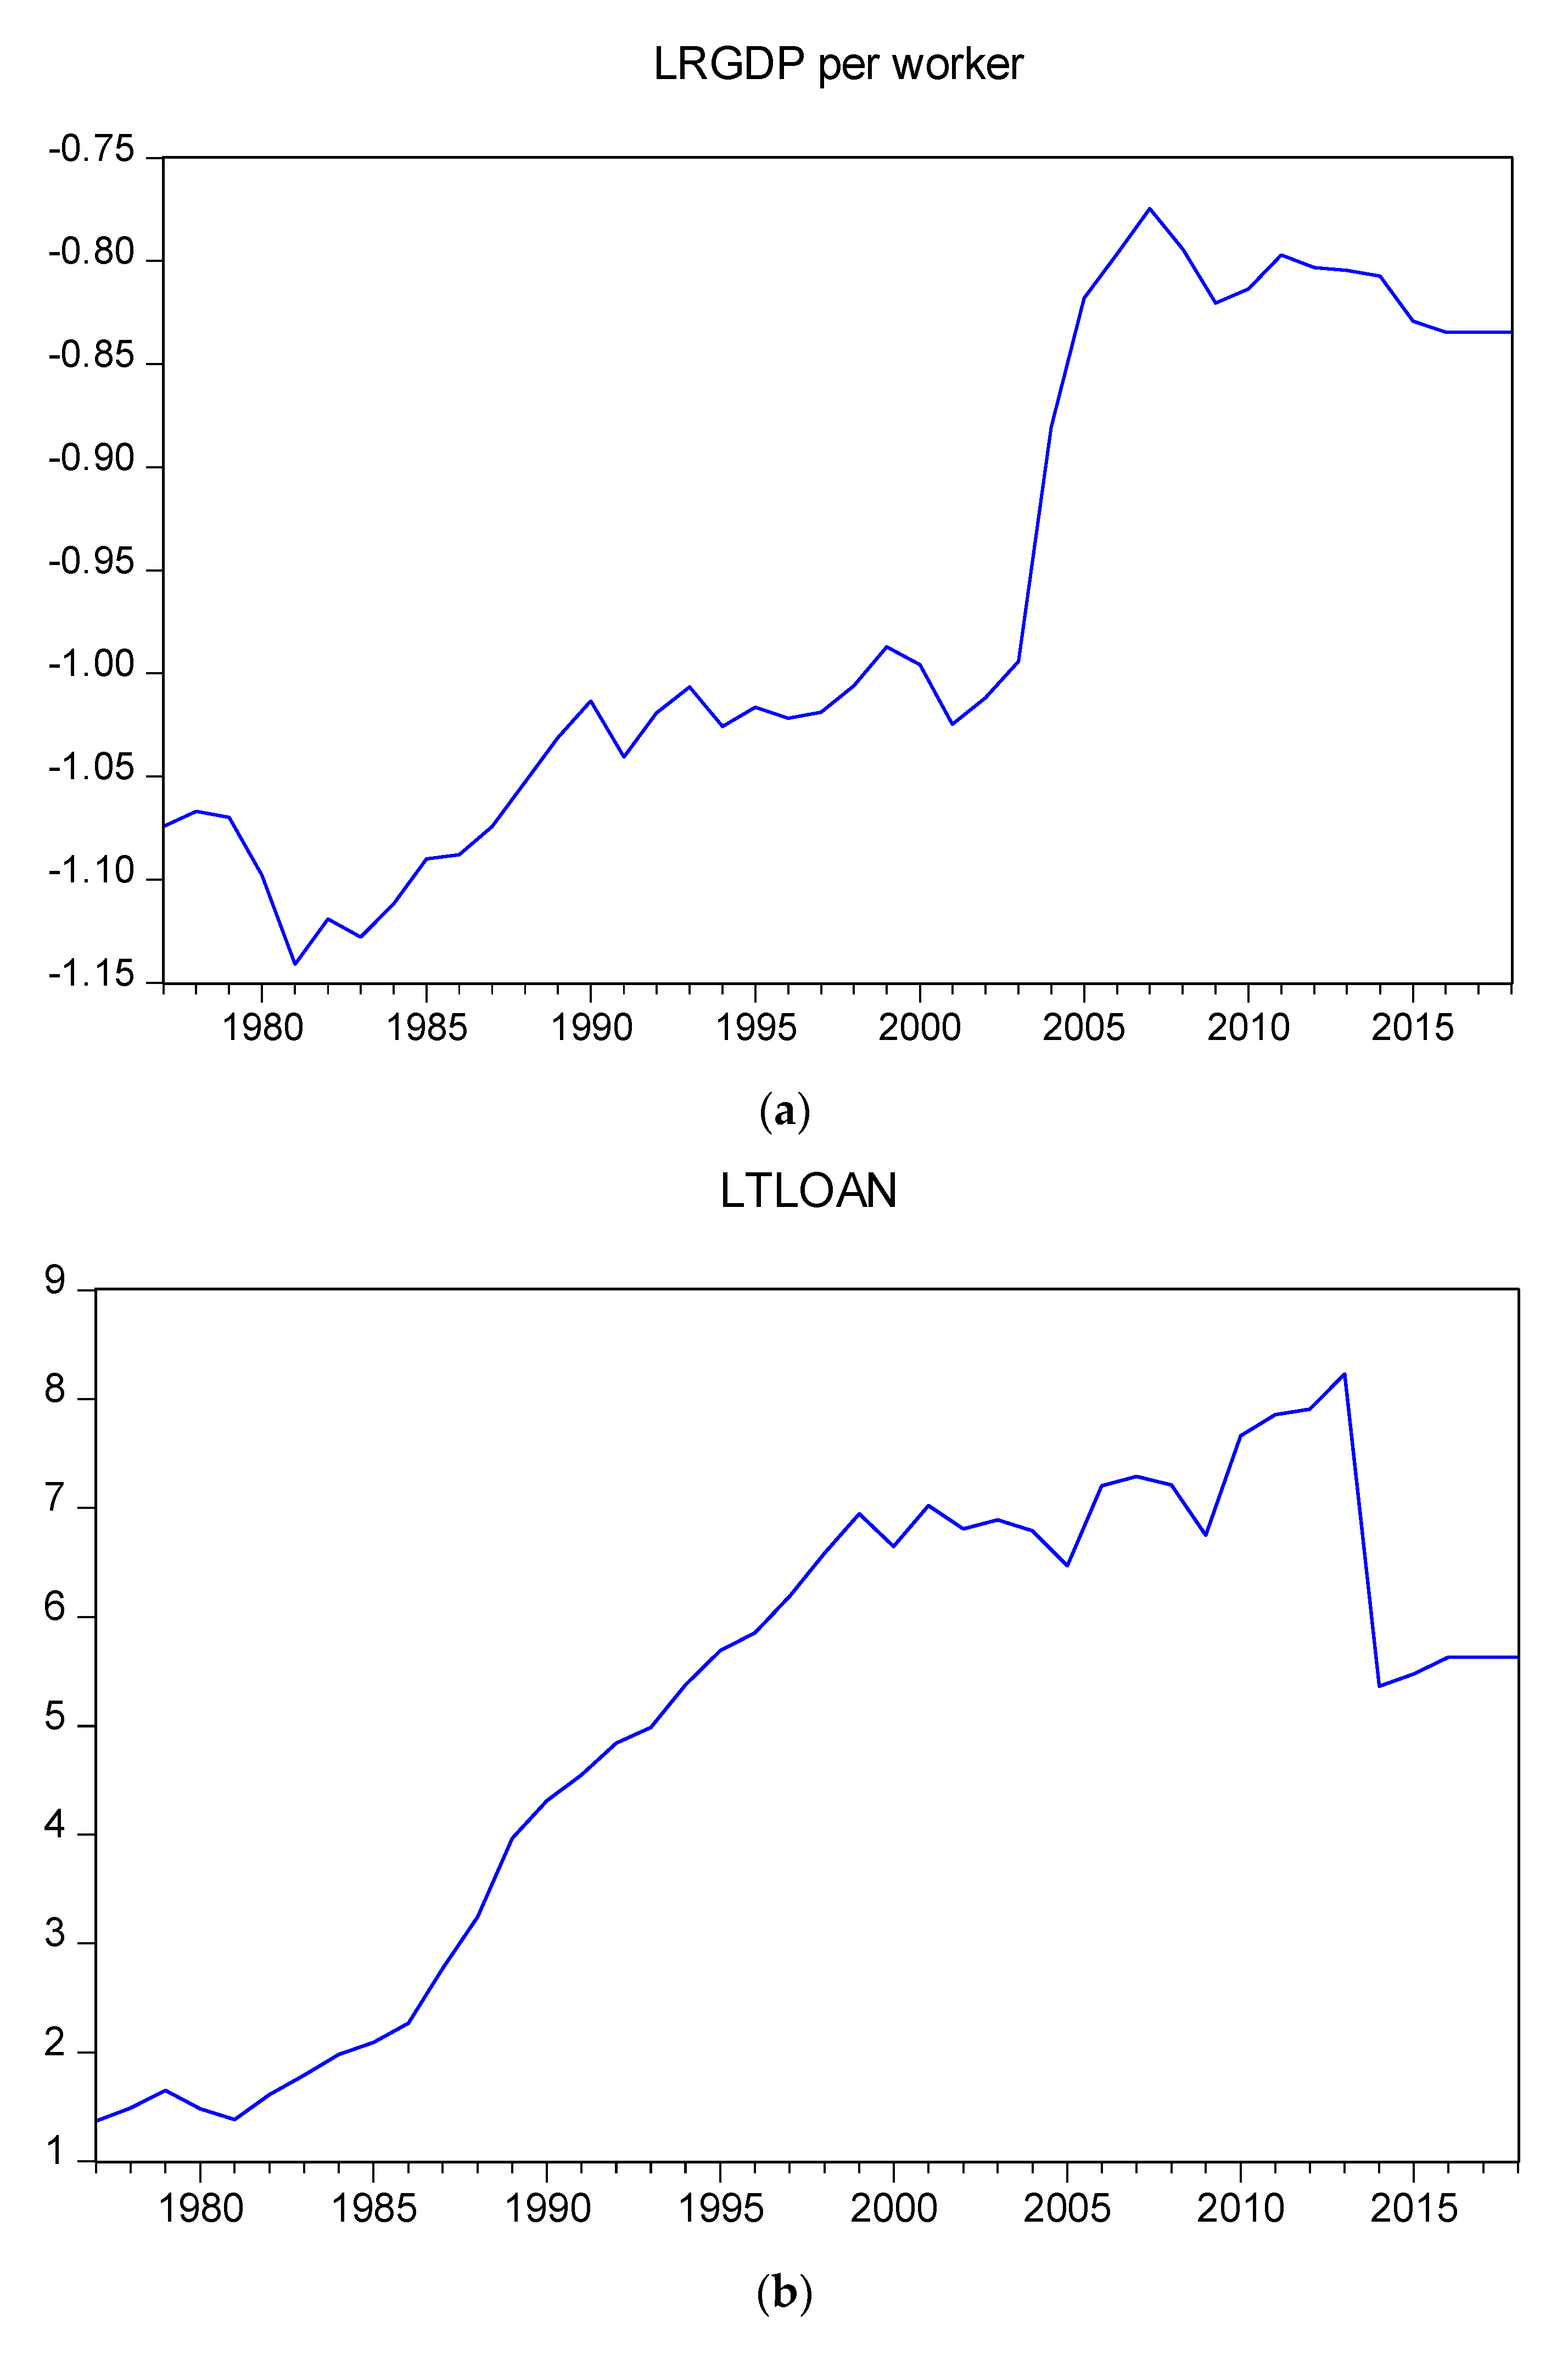
This study examined the causal link between the disbursement of bank loans to the tourism sector and economic growth in Northern Cyprus using annual time series data for the 1977 to 2016 period. An error correction model was developed for the augmented version of the Solow growth model. Then, the relationships between the variables in the model were examined using co-integration methods. The findings indicate that there is unidirectional causality from bank loans disbursed to the tourism sector to economic growth. Nonetheless, the empirical results suggest that this relationship only exists in the long-run, and there is no evidence of a causal impact in the short-run. Consequently, the error correction model shows that the deviations from long-run equilibrium in economic growth, measured by the real GDP per worker, are corrected annually by an adjustment speed of 55.8 percent toward equilibrium through a series of partial short-run adjustments. Furthermore, the result suggests that bank loans to the tourism-related activities and economic growth show a co-integration relationship, as perfectly captured in Figure 1. More specifically, our results point out that bank loans to the tourism sector and/or tourism-related activities stimulate economic growth in the short run, and more effectively in the long run. The possible reason for the observation could be the reliance of tourism-related business on domestic financing through bank credits and other financial instruments. Additionally, the impact of the intensity of fixed capital investment and human development on the economic rejuvenation of the island nation state is significantly positive in the short- and long-run. Considering the desirability of the aforementioned results, there are useful policy dimensions from the study for the government and tourism stakeholders.
5.1. Policy Perspectives
Our results have important policy implications for small economies (such as Northern Cyprus) with reliance on tourism as one of the main sectors of their economy. Central planners in these economies should try to channel the resources allocated for tourism sector development as much as possible through banks into the economy. The rationale is to increase the access to financial sources for business enterprises active in the tourism sector. Additionally, intermediation by banks can reduce the costs of acquiring and processing information about projects, and could therefore increase the efficiency of resource allocation. This is in line with the discussions of Kubickova and Li [17] about the critical role of the governments of tourism-dependent economies in addressing market failures.
From a broader perspective, the results highlight the importance of complementarity among the policies which are designed to target the development of the tourism sector. Proactive policies in the domestic banking systems can promote real economic growth by increasing the supply of bank loans to tourism sector projects. An example of such policies is a reform in the banking sector with the main objective of increasing their intermediation activities. The leading sectors in the economy can be recognized by the government, and financial resources can be directed toward these sectors through commercial banks. Eventually, these reforms can support sustainable investments in the productive sectors of the economy. Moreover, the removal of economic or finance-related constraints that are associated with the political disposition or statehood status of Northern Cyprus could boost or attract foreign investment and tourism financing.
5.2. Future Study Perspective
Considering the challenge associated with data availability, future studies could explore every reliable avenue to source the related dataset. Specifically, the focus of future studies could be directed at the examination of the economic impact of loans or credit-related disbursements to each aspect of tourism activities, such as restaurants, hotel investment and other tourism start-ups. Importantly, the current study fell short of elaborating or considering the devastating impact of the COVID-19 pandemic on the tourism sector of Northern Cyprus and the economy of the small island state. In spite of the short period of the pandemic (March 2020–2021), we look forward to future study that will incorporate the COVID-19 pandemic in a similar growth model within the framework of tourism development.
Author Contributions
S.S.: Writing—original draft and Data curation. S.F.: Methodology, Conceptualization draft, Investigation and Data curation. A.A.A.: Writing and Corresponding. All authors have read and agreed to the published version of the manuscript.
Funding
This research received no external funding.
Institutional Review Board Statement
Not applicable.
Informed Consent Statement
Not applicable.
Data Availability Statement
The data will be made available upon request.
Acknowledgments
We appreciate the editor of this journal for the opportunity to submit our study.
Conflicts of Interest
The authors declare no conflict of interest.
Appendix A
Figure A1.
Best and worst performance indicators for Northern Cyprus. Reprinted with permission from ref. [60]. Copyright 2020 Turkish Cypriot Chamber of Commerce.
Figure A1.
Best and worst performance indicators for Northern Cyprus. Reprinted with permission from ref. [60]. Copyright 2020 Turkish Cypriot Chamber of Commerce.

References
- Solow, R.M. A contribution to the theory of economic growth. Q. J. Econ. 1956, 70, 65–94. [Google Scholar] [CrossRef]
- Akadiri, S.S.; Akadiri, A.C.; Alola, U.V. Is there growth impact of tourism? Evidence from selected small island states. Curr. Issues Tour. 2019, 22, 1480–1498. [Google Scholar] [CrossRef]
- Fahimi, A.; Saint Akadiri, S.; Seraj, M.; Akadiri, A.C. Testing the role of tourism and human capital development in economic growth. A panel causality study of micro states. Tour. Manag. Perspect. 2018, 28, 62–70. [Google Scholar] [CrossRef]
- Saint Akadiri, S.; Eluwole, K.K.; Akadiri, A.C.; Avci, T. Does causality between geopolitical risk, tourism and economic growth matter? Evidence from Turkey. J. Hosp. Tour. Manag. 2020, 43, 273–277. [Google Scholar] [CrossRef]
- Athari, S.A.; Alola, U.V.; Ghasemi, M.; Alola, A.A. The (Un) sticky role of exchange and inflation rate in tourism development: Insight from the low and high political risk destinations. Curr. Issues Tour. 2020, 24, 1670–1685. [Google Scholar] [CrossRef]
- Uzuner, G.; Akadiri, S.S.; Alola, A.A. Tourist arrivals in four major economies: Another side of economic policy uncertainty and fear. Environ. Sci. Pollut. Res. 2020, 27, 29659–29665. [Google Scholar] [CrossRef] [PubMed]
- Alola, U.V.; Alola, A.A.; Avci, T.; Ozturen, A. Impact of corruption and insurgency on tourism performance: A case of a developing country. Int. J. Hosp. Tour. Adm. 2019, 1–17. [Google Scholar] [CrossRef]
- Demiroz, D.M.; Ongan, S. The contribution of tourism to the long-run Turkish economic growth. Ekon. Časopis 2005, 9, 880–894. [Google Scholar]
- Oh, C.O. The contribution of tourism development to economic growth in the Korean economy. Tour. Manag. 2005, 26, 39–44. [Google Scholar] [CrossRef]
- Fayissa, B.; Nsiah, C.; Tadasse, B. Impact of tourism on economic growth and development in Africa. Tour. Econ. 2008, 14, 807–818. [Google Scholar] [CrossRef] [Green Version]
- Cortes-Jimenez, I.; Pulina, M. Inbound tourism and long-run economic growth. Curr. Issues Tour. 2010, 13, 61–74. [Google Scholar] [CrossRef]
- Apergis, N.; Payne, J.E. Tourism and growth in the Caribbean–evidence from a panel error correction model. Tour. Econ. 2012, 18, 449–456. [Google Scholar] [CrossRef]
- Aslan, A. Tourism development and economic growth in the Mediterranean countries: Evidence from panel Granger causality tests. Curr. Issues Tour. 2014, 17, 363–372. [Google Scholar] [CrossRef]
- Kouchi, A.N.; Nezhad, M.Z.; Kiani, P. A study of the relationship between the growth in the number of Hajj pilgrims and economic growth in Saudi Arabia. J. Hosp. Tour. Manag. 2018, 36, 103–107. [Google Scholar] [CrossRef]
- Roudi, S.; Arasli, H.; Akadiri, S.S. New insights into an old issue–examining the influence of tourism on economic growth: Evidence from selected small island developing states. Curr. Issues Tour. 2019, 22, 1280–1300. [Google Scholar] [CrossRef]
- Khoshnevis Yazdi, S. Structural breaks, international tourism development and economic growth. Econ. Res. Ekon. Istraživanja 2019, 32, 1765–1776. [Google Scholar] [CrossRef] [Green Version]
- Ahmad, S.Z. Entrepreneurship in the small and medium-sized hotel sector. Curr. Issues Tour. 2015, 18, 328–349. [Google Scholar] [CrossRef]
- Bailliu, J.N. Private Capital Flows, Financial Development, and Economic Growth in Developing Countries; Bank of Canada: Ottawa, ON, Canada, 2000. [Google Scholar]
- Fethi, S.; Katircioglu, S. The role of the financial sector in the UK economy: Evidence from a seasonal co-integration analysis. Econ. Res. Ekon. Istraživanja 2015, 28, 717–737. [Google Scholar] [CrossRef] [Green Version]
- Alola, A.A.; Alola, U.V. Agricultural land usage and tourism impact on renewable energy consumption among Coastline Mediterranean Countries. Energy Environ. 2018, 29, 1438–1454. [Google Scholar] [CrossRef]
- Alola, A.A.; Alola, U.V. The dynamics of tourism—refugeeism on house prices in Cyprus and Malta. J. Int. Migr. Integr. 2019, 20, 521–536. [Google Scholar] [CrossRef]
- Bahl, R.; Bird, R. Subnational Taxes in Developing Countries: The Way Forward. Public Budg. Finance 2008, 28, 1–25. [Google Scholar] [CrossRef] [Green Version]
- Günçavdi, Ö.; Küçükç, S. Economic Growth Under Embargoes in North Cyprus: An Input-Output Analysis. Turk. Stud. 2009, 10, 365–392. [Google Scholar] [CrossRef] [Green Version]
- Katircioğlu, S.T. International tourism, higher education and economic growth: The case of North Cyprus. World Econ. 2010, 33, 1955–1972. [Google Scholar] [CrossRef]
- Balsalobre-Lorente, D.; Driha, O.M.; Bekun, F.V.; Adedoyin, F.F. The asymmetric impact of air transport on economic growth in Spain: Fresh evidence from the tourism-led growth hypothesis. Curr. Issues Tour. 2021, 24, 503–519. [Google Scholar] [CrossRef]
- Altin, M.; Memili, E.; Sönmez, S. Institutional economics and firm creation in the hospitality and tourism industry: A comparative analysis of developing and developed economies. Tour. Econ. 2017, 23, 1381–1397. [Google Scholar] [CrossRef]
- Kubickova, M.; Campbell, J.M. The role of government in agro-tourism development: A top-down bottom-up approach. Curr. Issues Tour. 2020, 23, 587–604. [Google Scholar] [CrossRef]
- Türkcan, K.; Erkuş-Öztürk, H. The impact of economic and political crises on the survival of tourism-related firms: Evidence from Antalya. Tour. Econ. 2020, 26, 1152–1174. [Google Scholar] [CrossRef]
- Schubert, F.S.; Brida, J.G.; Risso, W.A. The impacts of international tourism demand on economic growth of small economies dependent on tourism. Tour. Manag. 2011, 23, 377–385. [Google Scholar] [CrossRef]
- Akadiri, S.S.; Akadiri, A.C. Examining the Causal Relationship between Tourism, Exchange Rate, and Economic Growth in Tourism Island States: Evidence from Second-Generation Panel. Int. J. Hosp. Tour. Adm. 2019, 22, 235–250. [Google Scholar]
- Brown, K.G.; Cave, J. Island tourism: Marketing culture and heritage—Editorial introduction to the special issue. Int. J. Cult. Tour. Hosp. Res. 2010, 4, 87–95. [Google Scholar] [CrossRef]
- Afonso, A.; Alves, J. The Role of Government Debt in Economic Growth. Hacienda Pública Española 2015, 215, 9–26. [Google Scholar] [CrossRef] [Green Version]
- Babatunde, S.A. Government spending on infrastructure and economic growth in Nigeria. Econ. Res. Ekon. Istraživanja 2018, 31, 997–1014. [Google Scholar] [CrossRef] [Green Version]
- Brida, J.G.; Cortes-Jimenez, I.; Pulina, M. Has the tourism-led growth hypothesis been validated? A literature review. Curr. Issues Tour. 2016, 19, 394–430. [Google Scholar] [CrossRef]
- Cannonier, C.; Burke, M.G. The economic growth impact of tourism in Small Island Developing States—evidence from the Caribbean. Tour. Econ. 2019, 25, 85–108. [Google Scholar] [CrossRef]
- Santos, L.D.; Vieira, A.C. Tourism and regional development: A spatial econometric model for Portugal at municipal level. Port. Econ. J. 2020, 19, 285–299. [Google Scholar] [CrossRef]
- Tecel, A.; Katircioğlu, S.; Taheri, E.; Bekun, F.V. Causal interactions among tourism, foreign direct investment, domestic credits, and economic growth: Evidence from selected Mediterranean countries. Port. Econ. J. 2020, 19, 195–212. [Google Scholar] [CrossRef]
- Dibeh, G.; Fakih, A.; Marrouch, W. Tourism–growth nexus under duress: Lebanon during the Syrian crisis. Tour. Econ. 2020, 26, 353–370. [Google Scholar] [CrossRef]
- Katircioğlu, S.; Fethi, S.; Kilinç, C. A long run equilibrium relationship between international tourism, higher education, and economic growth in Northern Cyprus. Econ. Res. Ekon. Istraživanja 2010, 23, 86–96. [Google Scholar] [CrossRef]
- Viljoen, A.; Saayman, A.; Saayman, M. Determinants influencing inbound arrivals to Africa. Tour. Econ. 2019, 25, 856–883. [Google Scholar] [CrossRef]
- Fleischer, A.; Felsenstein, D. Support for Rural Tourism: Does it make a difference? Ann. Tour. Res. 2000, 27, 1007–1024. [Google Scholar] [CrossRef]
- State Planning Organization. Economic and Social Indicators; SPO: Lefkoşa, Turkey, 2020. [Google Scholar]
- Makun, K. External debt and economic growth in Pacific Island countries: A linear and nonlinear analysis of Fiji Islands. J. Econ. Asymmetries 2021, 23, e00197. [Google Scholar] [CrossRef]
- Darcy, S.; Cameron, B.; Pegg, S. Accessible tourism and sustainability: A discussion and case study. J. Sustain. Tour. 2000, 18, 515–537. [Google Scholar] [CrossRef]
- Timsina, N. Impact of Bank Credit on Economic Growth in Nepal. Nepal Rastra Bank 2014, 22, 1–23. [Google Scholar]
- Uneze, E. The relation between capital formation and economic growth: Evidence from sub-Saharan African countries. J. Econ. Policy Reform 2013, 16, 272–286. [Google Scholar] [CrossRef]
- Ding, S.; Knight, J. Why has China Grown So Fast? The Role of Physical and Human Capital Formation. Oxf. Bull. Econ. Stat. 2011, 73, 141–174. [Google Scholar] [CrossRef] [Green Version]
- Benos, N.; Zotou, S. Education and Economic Growth: A Meta-Regression Analysis. World Dev. 2014, 64, 669–689. [Google Scholar] [CrossRef] [Green Version]
- Glewwe, P.; Maiga, E.; Zheng, H. The Contribution of Education to Economic Growth: A Review of the Evidence, with Special Attention and an Application to Sub-Saharan Africa. World Dev. 2014, 59, 379–393. [Google Scholar] [CrossRef] [Green Version]
- Barro, R.J.; Lee, J.W. Sources of economic growth. Carnegie Rochester Conf. Ser. Public Policy 1994, 40, 1–46. [Google Scholar] [CrossRef]
- Vincent-Lancrin, S. Developing Capacity through Cross-border Tertiary Education. In Cross-border Tertiary Education: A Way towards Capacity Development; OECD: Paris, France, 2007; pp. 47–108. [Google Scholar]
- Özkutlu, S. “Peace” perceptions of Special Education Students in North Cyprus: A metaphorical approach. Qual. Quant. 2018, 52, 1287–1296. [Google Scholar] [CrossRef]
- Katircioğlu, S.; Fethi, S.; Caner, H. Testing the higher education-led growth hypothesis in a small island: An empirical investigation from a new version of the Solow growth model. Qual. Quant. 2014, 48, 729–744. [Google Scholar] [CrossRef]
- Mankiw, N.G.; Romer, D.; Weil, D.N. A contribution to the empirics of economic growth. Q. J. Econ. 1992, 107, 407–437. [Google Scholar] [CrossRef]
- Cellini, R. Implications of Solow’s growth model in the presence of a stochastic steady state. J. Macroecon. 1997, 19, 135–153. [Google Scholar] [CrossRef]
- Johansen, S.; Juselius, K. Maximum likelihood estimation and inference on cointegration—with applications to the demand for money. Oxf. Bull. Econ. Stat. 1990, 52, 169–210. [Google Scholar] [CrossRef]
- Pesaran, M.H.; Shin, Y.; Smith, R.J. Bounds testing approaches to the analysis of level relationships. J. Appl. Econom. 2001, 16, 289–326. [Google Scholar] [CrossRef]
- Pesaran, M.H.; Shin, Y. An autoregressive distributed-lag modelling approach to cointegration analysis. Econom. Soc. Monogr. 1998, 31, 371–413. [Google Scholar]
- Bezić, H.; Nikšić Radić, M. Tourism foreign direct investment led tourism gross value added: A cointegration and causality analysis of Croatian tourism. Econ. Res. Ekon. Istraživanja 2017, 30, 1443–1460. [Google Scholar] [CrossRef] [Green Version]
- Amca, H.; Süreç, Y.; Çerkez, A. Northern Cyprus Economy Competitiveness Report 2018–2019; Turkish Cypriot Chamber of Commerce: Lefkoşa, Northern Cyprus, 2020. [Google Scholar]
Figure 1.
Illustration of the trend in the (a) real GDP per worker and (b) tourism loans.


Table 1.
Description of the variables and data sources.
| Variable | Abbreviation | Description | Source |
|---|---|---|---|
| Dependent variable: Log (real GDP per worker) | LRGDP | The ratio of real GDP (constant 1977 prices) to worker’s population. | State Planning Organization (SPO) http://www.devplan.org/ accessed on 10 June 2021 |
| Log(fixed capital formation, % of GDP) | LIGDP | The ratio of fixed capital investments to real GDP. | State Planning Organization (SPO) http://www.devplan.org/ accessed on 10 June 2021 |
| Log (secondary-level enrolment, % of population) | LSENR | The ratio of total number of students in vocational and technical high schools to total population. | State Planning Organization (SPO) http://www.devplan.org/ accessed on 10 June 2021 |
| Log (summation of exogenous rates of growth in the labour force (n), technological progress (g) and depreciation rate (δ)) | LLABR | Estimating the annual speed of Used for Equation (8). | Existing literature: Mankiw et al., 1992; Cellini, 1997; Katircioglu et al., 2014. |
| Log (loan disbursements to tourism sector, % of GDP) | LTLOAN | The ratio of bank loans disbursed to tourism sector to real GDP. | State Planning Organization (SPO) http://www.devplan.org/ accessed on 10 June 2021 |
Table 2.
Correlation matrix.
| LRGDP | LIGDP | LSENR | LLABR | LTLOAN | |
|---|---|---|---|---|---|
| LRGDP | 1 | ||||
| LIGDP | 0.93 | 1 | |||
| LSENR | 0.79 | 0.19 | 1 | ||
| LLABR | −0.67 | 0.28 | 0.18 | 1 | |
| LTLOAN | 0.94 | 0.36 | 0.13 | 0.17 | 1 |
Table 3.
Unit root tests.
| Levels | FIRST DIFFERNCE | |||||||
|---|---|---|---|---|---|---|---|---|
| Variables | ADF | DF-GLS | PP | KPSS | ADF | DF-GLS | PP | KPSS |
| (1) | (2) | (3) | (4) | (5) | (6) | (7) | (8) | |
| LRGDP | ||||||||
| τΤ | −2.891 | −2.581 | −2.244 | 0.095 ** | −4.112 ** | −4.219 *** | −4.112 ** | 0.090 |
| τμ | −0.972 | −0.736 | −0.795 | 0.703 ** | −4.167 *** | −4.221 *** | −4.167 *** | 0.093 |
| τ | −0.962 | −1.197 | −4.095 *** | −4.107 *** | ||||
| LIGDP | ||||||||
| τΤ | −3.575 ** | −3.593 ** | −2.581 * | 0.071 | −5.242 *** | −5.376 *** | −7.908 *** | 0.229 |
| τμ | −3.617 *** | −3.225 *** | −2.641 * | 0.141 | −5.294 *** | −5.363 *** | −7.348 *** | 0.207 |
| τ | −3.390 | −0.434 | −5.361 *** | −7.418 *** | ||||
| LSENR | ||||||||
| τΤ | −1.817 | −1.827 | −1.930 | 0.151 ** | −5.753 *** | −5.906 *** | −5.727 *** | 0.109 |
| τμ | −0.926 | −0.481 | −0.915 | 0.686 ** | −5.827 *** | −5.902 *** | −5.809 *** | 0.110 |
| τ | −1.369 | −1.442 | −5.718 *** | −5.709 *** | ||||
| LLABR | ||||||||
| τΤ | −2.549 | −1.788 | −2.539 | 0.156 ** | −5.901 *** | −6044 *** | −5.886 *** | 0.117 |
| τμ | −1.156 | 1.007 | −1.916 | 0.795 *** | −5.795 *** | −5.763 *** | −5.772 *** | 0.271 |
| τ | 4.465 | 4.514 | −4.286 *** | −4.369 *** | ||||
| LTLOAN | ||||||||
| τΤ | −0.764 | −1.049 | −0.423 | 0.181 ** | −7.869 *** | −7.679 *** | −7.920 *** | 0.126 |
| τμ | −1.647 | 0.423 | −1.877 | 0.772 *** | −7.591 *** | −6.174 *** | −7.578 *** | 0.385 |
| τ | 2.302 | 2.127 | −3.161 *** | −6.031 *** | ||||
Note: τT represents the model with a drift and trend; τμ represents the model with a drift and without a trend; and τ represents the model without a drift and trend * ** and *** denote statistical significance at the 1, 5 and 10 percent levels, respectively.
Table 4.
Johansen–Juselius multivariate likelihood cointegration tests summary.
| Panel A: Maximal Eigenvalue | Statistics | 5% CV a | 10% CV b | ||
| r = 0 | r = 1 | 33.48 | 28.68 | 25.00 | |
| r ≥ 1 | r = 2 | 11.33 | 22.88 | 18.98 | |
| r ≥ 2 | r = 3 | 7.85 | 15.12 | 13.02 | |
| r ≥ 3 | r = 4 | 0.10 | 8.07 | 6.50 | |
| Panel B: Trace statistic | Statistics | 95% CV | 90% CV | ||
| r = 0 | r = 1 | 52.78 | 49.12 | 46.30 | |
| r ≥ 1 | r = 2 | 19.29 | 32.46 | 29.12 | |
| r ≥ 2 | r = 3 | 7.96 | 18.14 | 16.25 | |
| r ≥ 3 | r = 4 | 0.10 | 8.07 | 6.50 | |
| Panel C: Selecting the lag order | Rank | Max. LL | AIC | SBC | HQC |
| r = 0 | 218.76 | 206.76 | 196.47 | 203.01 | |
| r = 1 | 235.50 | 216.50 | 200.22 | 210.57 | |
| r = 2 | 241.16 | 217.16 | 196.60 | 209.68 | |
| r = 3 | 245.09 | 218.09 | 194.96 | 209.67 | |
| r = 4 | 245.15 | 217.15 | 193.16 | 208.41 |
Notes: a represents a critical value for rejection at the 5% level of significance; b represents a critical value for rejection at the 10% level of significance. The Maximal Eigenvalue test conducts separate tests on each eigenvalue. The null hypothesis is that there are r co-integrating vectors present against the alternative that there are (r + 1) present. The Trace test is a joint test; the null hypothesis is that the number of co-integrating vectors is less than or equal to r, against a general alternative hypothesis that there is more than r.
Table 5.
Bounds test for cointegration on ARDL.
| Computed Values | 90 Percentiles | 95 Percentiles | Conclusion | ||||
|---|---|---|---|---|---|---|---|
| I(0) | I(1) | I(0) | I(1) | ||||
| F-statistic | 23.1022 | 4.2764 | 5.2574 | 5.2231 | 6.3593 | Reject | |
| W-statistic | 69.3067 | 12.8291 | 15.7721 | 15.6692 | 19.0778 | Reject | |
Based on the procedure introduced by Pesaran et al. [43].
Table 6.
ARDL estimation results.
| Variable | Coefficient | Std. Error | t-Statistic | Prob. |
|---|---|---|---|---|
| LRGDP (−1) | 0.441 *** | 0.059 | (7.475) | 0.000 |
| LTLOAN | 0.324 *** | 0.041 | (7.768) | 0.000 |
| LIGDP | 0.210 *** | 0.053 | (4.039) | 0.000 |
| LLABR | −0.312 *** | 0.035 | (−8.729) | 0.000 |
| LSENR | 0.146 *** | 0.029 | (5.031) | 0.000 |
| YEAR80 a | −0.126 *** | 0.040 | (−3.085) | 0.004 |
| R-squared | 0.917 | |||
| Schwarz criterion | 74.774 | |||
| Durbin-Watson stat | 1.713 | |||
| S.E. of Regression | 0.032 | |||
| Residual Sum of Squares | 0.036 | |||
| F-statistic | 575 *** | 0.000 | ||
| Diagnostic Tests | ||||
| Serial correlation LM test | 0.778 | 0.378 | ||
| Functional form test | 0.049 | 0.944 | ||
| Normality test | 0.757 | 0.685 | ||
| Heteroskedasticity test | 0.707 | 0.496 |
The *** denote statistical significance at the 10 percent levels, respectively. Notes: a a dummy variable was added to control for the structural break in the Northern Cyprus economy in the year 1980 due to a military takeover in Turkey. The 1980 military intervention promoted a new economic regime.
Table 7.
Short-run coefficients and the conditional error correction ARDL model.
| Variable | Coefficient | Std. Error | t-Statistic | Prob. |
|---|---|---|---|---|
| ΔLTLOAN | 0.181 *** | 0.031 | (5.816) | 0.000 |
| ΔLIGDP | 0.120 *** | 0.029 | (4.037) | 0.000 |
| ΔLLABR | −0.175 *** | 0.024 | (−7.310) | 0.000 |
| ΔLSENR | 0.082 *** | 0.02 | (4.067) | 0.000 |
| YEAR80 | −0.070 **** | 0.021 | (−3.238) | 0.003 |
| ECM (−1) | −0.558 *** | 0.059 | (−9.461) | 0.000 |
| R-squared | 0.752 | |||
| Schwarz criterion | 74.774 | |||
| Durbin-Watson stat | 1.713 | |||
| S.E. of Regression | 0.032 | |||
| Residual Sum of Squares | 0.036 | |||
| F-statistic | 21 *** | 0.000 |
*** denote statistical significance at the 10 percent levels, respectively.
Table 8.
Granger causality/block exogeneity Wald test results.
| Without Deterministic Trend | ||||||
| Short Run | Long Run | |||||
| Dependent Variables | ΔLRGDP | ΔLIGDP | ΔLTLOAN | ΔLLABR | ΔLSENR | ECMt−1 |
| ΔLRGDP | - | 0.213 (0.646) | 2.316 (0.137) | 1.188 (0.283) | 1.944 (0.172) | −2.849 *** (0.007) |
| ΔLIGDP | 0.841 (0.365) | - | 0.767 (0.387) | 1.022 (0.319) | 0.0003 (0.985) | 1.514 (0.139) |
| ΔLTLOAN | 0.456 (0.504) | 0.020 (0.887) | - | 1.460 (0.235) | 0.081 (0.776) | −0.857 (0.397) |
| ΔLLABR | 0.103 (0.749) | 0.145 (0.705) | 1.155 (0.290) | - | 0.054 (0.817) | 2.403 ** (0.022) |
| ΔLSENR | 1.535 (0.224) | 7.127 ** (0.011) | 0.992 (0.326) | 3.098 * (0.087) | - | −2.138 ** (0.039) |
| With Deterministic Trend | ||||||
| Short run | Long run | |||||
| Dependent Variables | ΔLRGDP | ΔLIGDP | ΔLTLOAN | ΔLLABR | ΔLSENR | ECMt−1 |
| ΔLRGDP | - | 0.099 (0.754) | 4.070 * (0.051) | 1.171 (0.286) | 2.737 (0.107) | −2.610 ** (0.013) |
| ΔLIGDP | 0.955 (0.335) | - | 0.010 (0.918) | 0.636 (0.430) | 0.222 (0.640) | 2.376 ** (0.023) |
| ΔLTLOAN | 0.486 (0.490) | 0.066 (0.797) | - | 2.163 (0.150) | 0.451 (0.506) | −1.667 * (0.094) |
| ΔLLABR | 0.079 (0.779) | 0.031 (0.859) | 3.390 * (0.074) | - | 0.529 (0.471) | 2.910 *** (0.006) |
| ΔLSENR | 1.726 (0.197) | 7.201 ** (0.011) | 4.048 * (0.052) | 4.938 ** (0.033) | - | −3.319 *** (0.002) |
*, ** and *** denote statistical significance at the 1, 5 and 10% levels, respectively.
Publisher’s Note: MDPI stays neutral with regard to jurisdictional claims in published maps and institutional affiliations. |
© 2021 by the authors. Licensee MDPI, Basel, Switzerland. This article is an open access article distributed under the terms and conditions of the Creative Commons Attribution (CC BY) license (https://creativecommons.org/licenses/by/4.0/).
Share and Cite
MDPI and ACS Style
Shirkhani, S.; Fethi, S.; Alola, A.A. Tourism-Related Loans as a Driver of a Small Island Economy: A Case of Northern Cyprus. Sustainability 2021, 13, 9508. https://0-doi-org.brum.beds.ac.uk/10.3390/su13179508
AMA Style
Shirkhani S, Fethi S, Alola AA. Tourism-Related Loans as a Driver of a Small Island Economy: A Case of Northern Cyprus. Sustainability. 2021; 13(17):9508. https://0-doi-org.brum.beds.ac.uk/10.3390/su13179508
Chicago/Turabian StyleShirkhani, Setareh, Sami Fethi, and Andrew Adewale Alola. 2021. "Tourism-Related Loans as a Driver of a Small Island Economy: A Case of Northern Cyprus" Sustainability 13, no. 17: 9508. https://0-doi-org.brum.beds.ac.uk/10.3390/su13179508
Note that from the first issue of 2016, this journal uses article numbers instead of page numbers. See further details here.