
Geospatial Simulation Model of Sustainable Mangrove Development Scenarios for the Years 2030 and 2050 in Marismas Nacionales, Mexico

 , , ,
, , ,
Abstract
:1. Introduction
2. Materials and Methods
2.1. Data
2.2. Methods
2.2.1. Qualitative Description of the Sustainable Scenarios of the Mangrove Forest
2.2.2. Mangrove Forest Surface Demand Model in MN
2.2.3. Factors and Restrictions
2.2.4. Scenarios
2.2.5. Sustainability Indicators
Land-Use Change Indicator
CO2 Indicator Estimate
3. Results
3.1. Change Detection
3.2. Demand Surface of the Mangrove Forest Sustainable Model
3.3. Weighting of Factors
3.4. Normalization of Modeled Factors
3.5. Restrictions
3.6. Map of Suitability
3.7. Sustainability Indicators
3.7.1. Change Indicators
3.7.2. CO2 Estimation Indicator
3.7.3. Mitigation Strategies
4. Discussion
5. Conclusions
Author Contributions
Funding
Institutional Review Board Statement
Informed Consent Statement
Data Availability Statement
Acknowledgments
Conflicts of Interest
References
- Lacerda, L.D.; Borges, R.; Ferreira, A.C. Neotropical mangroves: Conservation and sustainable use in a scenario of global climate change. Aquat. Conserv. Mar. Freshw. Ecosyst. 2019, 29, 1347–1364. [Google Scholar] [CrossRef]
- Adams, J.B.; Rajkaran, A. Changes in mangroves at their southernmost African distribution limit. Estuar. Coast. Shelf Sci. 2020, 247, 106862. [Google Scholar] [CrossRef]
- Asbridge, E.F.; Bartolo, R.; Finlayson, C.M.; Lucas, R.M.; Rogers, K.; Woodroffe, C.D. Assessing the distribution and drivers of mangrove dieback in Kakadu National Park, northern Australia. Estuar. Coast. Shelf Sci. 2019, 228, 106353. [Google Scholar] [CrossRef]
- Lagomasino, D.; Fatoyinbo, L.; Castaneda, E.; Cook, B.; Montesano, P.; Neigh, C.; Ott, L.; Chavez, S.; Morton, D. Storm surge, not wind, caused mangrove dieback in southwest Florida following Hurricane Irma. Nat. Commun. 2020. [Google Scholar] [CrossRef]
- Harada, Y.; Fry, B.; Lee, S.Y.; Maher, D.T.; Sippo, J.Z.; Connolly, R.M. Stable isotopes indicate ecosystem restructuring following climate-driven mangrove dieback. Limnol. Oceanogr. 2020, 65, 1251–1263. [Google Scholar] [CrossRef]
- Lovelock, C.E.; Feller, I.C.; Reef, R.; Hickey, S.; Ball, M.C. Mangrove dieback during fluctuating sea levels. Sci. Rep. 2017, 7, 1680. [Google Scholar] [CrossRef]
- Rodríguez, C.; Ramírez, L. Dinámica de la cobertura de manglar y del carbono asociado en Sipacate-Naranjo, Guatemala. Rev. Mesoam. Biodivers. Cambio Climático 2018, 2, 17–26. [Google Scholar]
- Servino, R.N.; de OliveiraGomes, L.E.; Bernardino, A.F. Extreme weather impacts on tropical mangrove forests in the Eastern Brazil Marine Ecoregion. Sci. Total Environ. 2018, 628–629, 233–240. [Google Scholar] [CrossRef]
- Sippo, J.Z.; Maher, D.T.; Schulz, K.G.; Sanders, C.J.; McMahon, A.; Tucker, J.; Santos, I.R. Carbon outwelling across the shelf following a massive mangrove dieback in Australia: Insights from radium isotopes. Geochim. Cosmochim. Acta 2019, 253, 142–158. [Google Scholar] [CrossRef]
- Rosenzweig, C.; Karoly, D.; Vicarelli, M.; Neofotis, P.; Wu, Q.; Casassa, G.; Menzel, A.; Root, T.L.; Estrella, N.; Seguin, B.; et al. Attributing physical and biological impacts to anthropogenic climate change. Nature 2008, 453, 353–357. [Google Scholar] [CrossRef] [PubMed]
- Singh, S.; Reddy, C.S.; Pasha, S.V.; Dutta, K.; Saranya, K.R.L.; Satish, K.V. Modeling the spatial dynamics of deforestation and fragmentation using Multi-Layer Perceptron neural network and landscape fragmentation tool. Ecol. Eng. 2017, 99, 543–551. [Google Scholar] [CrossRef]
- Monjardin-Armenta, S.A.; Plata-Rocha, W.; Pacheco-Angulo, C.E.; Franco-Ochoa, C.; Rangel-Peraza, J.G. Geospatial Simulation Model of Deforestation and Reforestation Using Multicriteria Evaluation. Sustainability 2020, 12, 10387. [Google Scholar] [CrossRef]
- Overmars, K.P.; Verburg, P.H. Multilevel modelling of land use from field to village level in the Philippines. Agric. Syst. 2006, 89, 435–456. [Google Scholar] [CrossRef]
- Verburg, P.H.; Kok, K.; Pontius, R.G.; Veldkamp, A. Modeling Land-Use and Land-Cover Change; Springer: Berlin/Heidelberg, Germany, 2006; pp. 117–135. ISBN 978-3-540-32202-3. [Google Scholar]
- Veldkamp, A.; Lambin, E. Predicting land-use change. Agric. Ecosyst. Environ. 2001, 85, 1–6. [Google Scholar] [CrossRef]
- Patel, M.; Kok, K.; Rothman, D.S. Participatory scenario construction in land use analysis: An insight into the experiences created by stakeholder involvement in the Northern Mediterranean. Land Use Policy 2007, 24, 546–561. [Google Scholar] [CrossRef]
- Wood, K.A.; Stillman, R.A.; Hilton, G.M. Conservation in a changing world needs predictive models. Anim. Conserv. 2018, 21, 87–88. [Google Scholar] [CrossRef] [Green Version]
- Leija-Loredo, E.G.; Reyes-Hernández, H.; Reyes-Pérez, O.; Flores-Flores, J.L.; Sahagún-Sanchéz, F.J. Cambios en la cubierta vegetal, usos de la tierra y escenarios futuros en la región costera del estado de Oaxaca, México. Madera Bosques 2016, 22, 125–140. [Google Scholar] [CrossRef] [Green Version]
- Chen, C.; Son, N.; Chang, N.; Chen, C.; Chang, L.; Valdez, M.; Centeno, G.; Thompson, C.A.; Aceituno, J.L. Multi-Decadal Mangrove Forest Change Detection and Prediction in Honduras, Central America, with Landsat Imagery and a Markov Chain Model. Remote Sens. 2013, 5, 6408–6426. [Google Scholar] [CrossRef] [Green Version]
- Hirales Cota, M. Cambios de Cobertura y Servicios Ambientales del Manglar de Franja en la Zona Costera Mahahual-Xcalak. Master’s Thesis, El Colegio de la Frontera Sur, Lerma Campeche, Mexico, 2009. [Google Scholar]
- Merecí-Guamán, J.; Cifuentes, M.; Casanoves, F.; Brenes, C.; Delgado, D. Caracterización de la Dinámica de uso de Suelo (1985, 2003 y 2016), Determinación de Flujos de CO2 Históricos y Simulación de la Cobertura de Manglar y Camaroneras al 2030. Master’s Thesis, Centro Agronómico Tropical de Investigación y Enseñanza, Turrialba, Costa Rica, 2017; pp. 37–65. [Google Scholar]
- Rodríguez-Hernández, A.H. Existencias de Carbono Azul y la Dinámica Histórica de la Cobertura del Bosque Manglar en el Área Conservación Sipacate Naranjo, Guatemala, Centroamérica; Centro Agronómico Tropical de Investigación: Turrialba, Costa Rica, 2017. [Google Scholar]
- Berger, U.; Rivera-Monroy, V.H.; Doyle, T.W.; Dahdouh-guebas, F.; Duke, N.C.; Fontalvo-herazo, M.L.; Hildenbrandt, H.; Koedam, N.; Mehlig, U.; Piou, C.; et al. Advances and limitations of individual-based models to analyze and predict dynamics of mangrove forests: A review. Aquat. Bot. 2008, 89, 260–274. [Google Scholar] [CrossRef] [Green Version]
- Aguilera Benavente, F.; Valenzuela Montes, L.; Soria Lara, J.; Gómez Delgado, M.; Plata Rocha, W. Escenarios y modelos de simulación como instrumento en la planificación territorial y metropolitana. Ser. Geogr. 2011, 17, 11–28. [Google Scholar]
- FAO. The World’s Mangroves 1980–2005. Available online: http://www.fao.org/3/a1427e/a1427e00.pdf (accessed on 7 September 2019).
- Rossi, R.E.; Archer, S.K.; Giri, C.; Layman, C.A. The role of multiple stressors in a dwarf red mangrove (Rhizophora mangle) dieback. Estuar. Coast. Shelf Sci. 2020, 237, 106660. [Google Scholar] [CrossRef]
- FAO. Evaluación de los Recursos Forestales Mundiales 2010: Informe Principal. Estudio FAO Montes. Available online: www.fao.org/docrep/013/i1757s/i1757s00.htm (accessed on 28 August 2019).
- Valderrama-Landeros, L.H.; Rodríguez-Zúñiga, M.T.; Troche-Souza, C.; Velázquez-Salazar, S.; Villeda-Chávez, E.; Alcántara-Maya, J.A.; Vázquez-Balderas, B.; Cruz-López, M.I.; Ressl, R. Manglares de México. Actualización y exploración de los datos del sistema de monitoreo 1970/1980-2015; CONABIO: Mexico City, Mexico, 2017; ISBN 978-607-8328-78-9. [Google Scholar]
- Zhong, L.; Qiguo, Z. Organic carbon content and distribution in soils under different land uses in tropical and subtropical China. Plant Soil 2001, 231, 175–185. [Google Scholar] [CrossRef]
- Adame, M.F.; Brown, C.J.; Bejarano, M.; Herrera-Silveira, J.A.; Ezcurra, P.; Kauffman, J.B.; Birdsey, R. The undervalued contribution of mangrove protection in Mexico to carbon emission targets. Conserv. Lett. 2018, 11, e12445. [Google Scholar] [CrossRef] [Green Version]
- Sasmito, S.D.; Sillanpää, M.; Hayes, M.A.; Bachri, S.; Saragi-Sasmito, M.F.; Sidik, F.; Hanggara, B.B.; Mofu, W.Y.; Rumbiak, V.I.; Taberima, S.; et al. Mangrove blue carbon stocks and dynamics are controlled by hydrogeomorphic settings and land-use change. Glob. Chang. Biol. 2020, 26, 3028–3039. [Google Scholar] [CrossRef] [Green Version]
- Duke, N.C.; Meynecke, J.-O.; Dittmann, S.; Ellison, A.M.; Anger, K.; Berger, U.; Cannicci, S.; Diele, K.; Ewel, K.C.; Field, C.D.; et al. A World Without Mangroves? Science 2007, 317, 41–42. [Google Scholar] [CrossRef] [PubMed] [Green Version]
- Valdez-Hernández, J.I.; Ruiz-Luna, A.; Guzmán-Arroyo, M.; González-Farias, F.; Acosta-Velázquez, J.; Vázquez-Lule, A.D. Caracterización del sitio de Manglar Teacapán–Agua Brava–Marismas Nacionales, Sinaloa–Nayarit; CONABIO: Mexico City, Mexico, 2009; pp. 1–20. [Google Scholar]
- ONU. Objetivos de Desarrollo Sostenible. La Asamblea General Adopta la Agenda 2030 para el Desarrollo Sostenible. Available online: https://www.un.org/sustainabledevelopment/es/2015/09/la-asamblea-general-adopta-la-agenda-2030-para-el-desarrollo-sostenible/ (accessed on 15 September 2020).
- CONAFOR. Estrategia Nacional para REDD+ México 2007-2030 ENAREDD+, 1st ed.; CONABIO: Mexico City, Mexico, 2017; pp. 6–114. [Google Scholar]
- Bouillon, S. Carbon cycle: Storage beneath mangroves. Nat. Geosci. 2011, 4, 282–283. [Google Scholar] [CrossRef] [Green Version]
- Lovelock, C.E. Soil Respiration and Belowground Carbon Allocation in Mangrove Forests. Ecosystems 2008, 11, 342–354. [Google Scholar] [CrossRef]
- Nellemann, C.; Corcoran, E.; Duarte, C.M.; Valdes, L.; De Young, C.; Fonseca, L.; Grimsditch, G. Blue Carbon. A Rapid Response Assessment; United Nations Environment Programme; GRID: Arendal, Noriega, 2009; pp. 5–74. ISBN 978-82-7701-060-1. [Google Scholar]
- LGCC. Ley General de Cambio Climático. Available online: https://www.profepa.gob.mx/innovaportal/file/6583/1/ley_general_de_cambio_climatico.pdf (accessed on 16 May 2021).
- Piña, C.M.; Ortega, J. Informe Nacional REDDX MÉXICO; Bundesministerium für Umwelt, Naturschutz und nukleare Sicherheit: Bonn, Germany, 2016. [Google Scholar]
- INEGI. Encuesta Intercensal 2015. Available online: https://www.inegi.org.mx/programas/intercensal/2015/?ps=Microdatos (accessed on 23 July 2019).
- Cárdenas, G.G. Tesoro Ecológico en Riesgo. Los Manglares de Marismas Nacionales. Available online: http://www.comoves.unam.mx/numeros/articulo/156/tesoro-ecologico-en-riesgo-los-manglares-de-marismas-nacionales (accessed on 15 August 2020).
- Rodríguez-Zúñiga, M.T.; Troche-Souza, C.; Vázquez-Lule, A.D.; Márquez-Mendoza, J.D.; Vázquez-Balderas, B.; Valderrama-Landeros, L.; Velázquez-Salazar, S.; Cruz-López, M.I.; Ressl, R.; Uribe-Martínez, A.; et al. Manglares de México: Extensión, Distribución y Monitoreo, 1st ed.; Comisión Nacional para el Conocimiento y Uso de la Biodiversidad: Mexico City, Mexico, 2013; ISBN 978-607-8328-02-4. [Google Scholar]
- NOM-059-SEMARNAT-2010 NORMA Oficial Mexicana NOM-059-SEMARNAT-2010, Protección Ambiental-Especies Nativas de México de Flora y Fauna Silvestres-Categorías de Riesgo y Especificaciones para su Inclusión, Exclusión o Cambio-Lista de Especies en Riesgo. Available online: http://biblioteca.semarnat.gob.mx/janium/Documentos/Ciga/agenda/DOFsr/DO2454.pdf (accessed on 9 September 2020).
- SEMARNAT & CONANP. Programa de Manejo Reserva de la Biosfera Marismas Nacionales Nayarit, 1st ed.; SEMARNAT & CONANP: Mexico City, Mexico, 2013. [Google Scholar]
- Peña El Cultivo de Camarón y la Calidad Ambiental: ¿Cómo Disminuir sus Efectos Nocivos en las Costas de Nayarit? Available online: http://fuente.uan.edu.mx/publicaciones/01-01/el_cultivo_de_camaron_y_la_calidad_ambiental.pdf (accessed on 4 June 2019).
- Rubio Cisneros, N.; Arbuto-Oropeza, O. Marismas Nacionales:su subsistencia en el tiempo. Biodiversistas 2013, 108, 2–16. [Google Scholar]
- CONANP. Estudio Previo Justificativo para el Establecimiento del área Natural Protegida con la Categoría de Reserva de la Biósfera “Marismas Nacionales Sinaloa”; CONANP: Mexico City, Mexico, 2008. [Google Scholar]
- Quintero-Morales, A.; Plata-Rocha, W.; Olimón-Andalon, V.; Monjardín-Armenta, S.; Nemiga-Antonio, X. Dynamics of changes in land use and estimation of CO2 in mangroves in the Marismas Nacionales area, Mexico Dinámica de cambios de uso de suelo y estimación de CO2 en manglares de la zona Marismas Nacionales, Mexico. Cienc. Mar. 2021, 47, 105–125. [Google Scholar] [CrossRef]
- CONABIO. Portal de Información Geográfica—CONABIO. Available online: http://www.conabio.gob.mx/informacion/gis/ (accessed on 9 June 2019).
- INEGI (Instituto Nacional de Estadística y Geografía) Vías de Comunicación. Available online: https://www.inegi.org.mx/temas/viascomunicacion/default.html#Descargas (accessed on 1 August 2020).
- Aguilera Benavente, F.; Plata Rocha, W.; Bosque Sendra, J. Diseño y simulación de escenarios de demanda de suelo urbano en ámbitos metropolitanos. Rev. Int. Sostenibilidad Tecnol. Humanismo 2009, 4, 57–80. [Google Scholar]
- Plata-Rocha, W.; Monjardin-Armenta, S.A.; Pacheco-Angulo, C.E.; Rangel-Peraza, J.G.; Franco-Ochoa, C.; Mora-Felix, Z.D. Proximate and underlying deforestation causes in a tropical basin through specialized consultation and spatial logistic regression modeling. Land 2021, 10, 186. [Google Scholar] [CrossRef]
- Saaty, T. The Analytic Hierarchy Process: Planning, Priority Setting, Resource Allocation; McGraw-Hill International Book: New York, NY, USA; London, UK, 1980; ISBN 0070543712. [Google Scholar]
- Pontius, R.G.; Shusas, E.; McEachern, M. Detecting important categorical land changes while accounting for persistence. Agric. Ecosyst. Environ. 2004, 101, 251–268. [Google Scholar] [CrossRef]
- FAO. Forest Resources Assessment 1990—Survey Tropical Forest Cover Studies of Change Processes. Available online: http://www.fao.org/3/w0015e/w0015e00.htm (accessed on 20 January 2021).
- IPCC. Good Practice Guidance for Land Use, Land-Use Change and Forestry; Institute for Global Environmental Strategies (IGES) for the IPCC: Hayama, Japan, 2003; ISBN 4-88788-003-0. [Google Scholar]
- INECC-SEMARNAT. First Biennial Update Report to the United Nations Framework Convention on Climate Change, 1st ed.; INECC-SEMARNAT: Tlalpan, Mexico, 2015; pp. 3–37. [Google Scholar]
- Caldeira, K. Avoiding mangrove destruction by avoiding carbon dioxide emissions. Proc. Natl. Acad. Sci. USA 2012, 109, 14287–14288. [Google Scholar] [CrossRef] [PubMed] [Green Version]
- Lizano, O.G. La Dinámica Oceanográfica Frente al Humedal Nacional Térraba-Sierpe y su Relación con la Muerte del Manglar. Rev. Biol. Trop. 2015, 63, 29–46. [Google Scholar] [CrossRef]
- Zavala, T. Recuperación del Estero Huaylá en la Ciudad de Machala—Ecuador, Mediante Backcasting Participativo. Master’s Thesis, Universitat Politecnica de Catalunya Barcelona, Barcelona, Spain, 2017. [Google Scholar]


| Category | Description |
|---|---|
| Mangrove | Rhizophora mangle, Avicennia germinans, Laguncularia racemosa, and Conocarpus erectus |
| Disturbed mangrove | Dead or regenerating mangrove |
| Anthropic development | Villages, aquaculture ponds, shrimp farms, salt mines, roads and highways, and hydraulic infrastructure works that include channels |
| Livestock-agricultural | Rainfed and irrigated agriculture, pastures for livestock activity, anthropic cover for food production, and resting agricultural areas |
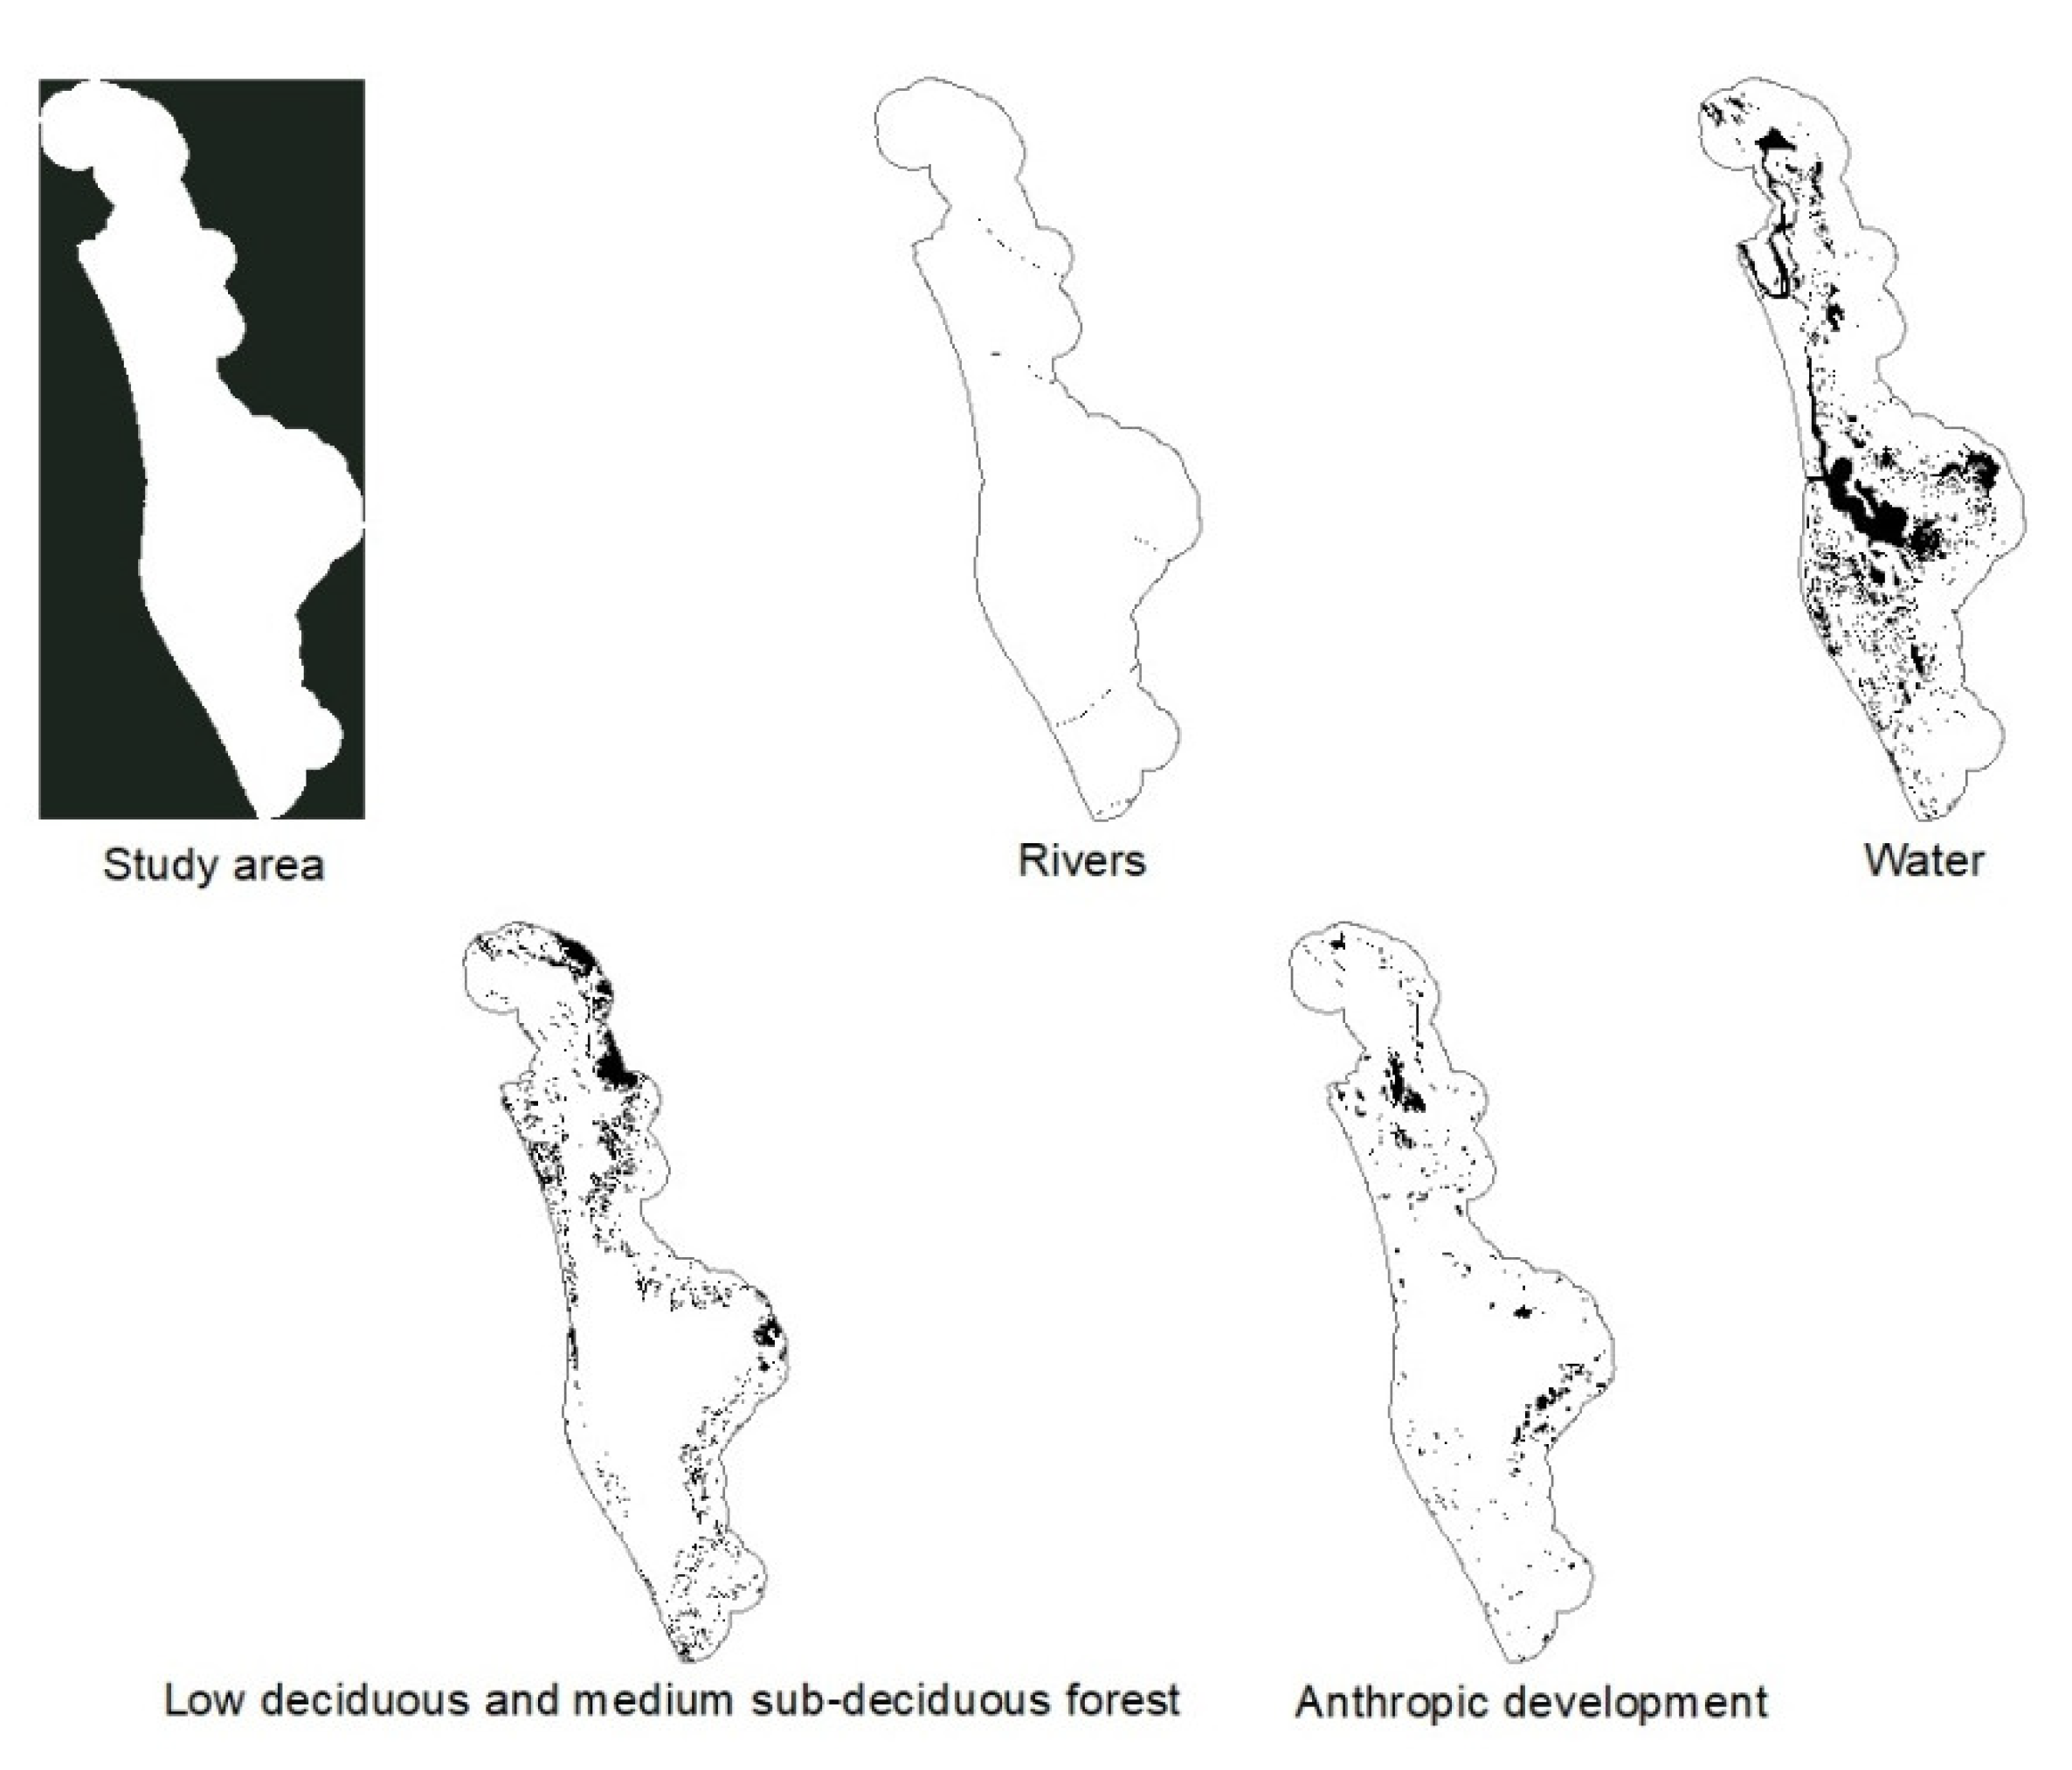
| Low deciduous and medium sub-deciduous forest | Tropical deciduous forest, tropical thorny deciduous forest, and medium sub-deciduous forest |
| Without vegetation | Eroded areas without apparent vegetation, coastal sand dunes, and beaches |
| Other wetlands | Hydrophytic vegetation: popal, tular, reed beds, and flooded grasslands |
| Water | Bays, estuaries, lagoons, rivers, dams, and cenotes |
| Data | Scale/Resolution and Format | Source |
|---|---|---|
| Edaphology (2001) | 1:1,000,000 Vector | [50] |
| Land use and vegetation map of the coastal zone associated with mangrove forests, North Pacific Region. (2005, 2015) | 1:2,500,000 Vector | [50] |
| Population by locality (2010) | Number of population Numeric | [50] |
| Communication routes (2019) | 1:50,000 Vector | [51] |
| Hydrography (2008) | 1:4,000,000 Vector | [50] |
| Variables | Factors | Description |
|---|---|---|
| Edaphology | Optimal Soils | The most suitable soils for the growth and development of the mangrove forest are weighted, taking the Solonchak gléyco soil type as a reference. |
| Land use and vegetation | Inverse proximity to livestock-agricultural areas | Models of the areas to be restored or reforested with mangroves, fragmented by rainfed or irrigated agriculture and pastures dedicated to livestock activity. In addition, the proposed areas will be more successful if they are located further away from a livestock-agricultural areas and close to the existing mangrove. |
| Proximity to low deciduous and medium sub-deciduous forest | Shows how the mangrove forest can expand to areas of low and medium jungles as long as conditions are optimal, allowing the growth and development of the mangrove forest. | |
| Proximity to existing mangrove 2015 | Models mangrove development contiguously to existing mangrove areas, reducing mangrove fragmentation, i.e., the closer the proposed areas to be reforested or restored are to the existing mangrove, the more successful the growth and development of these plants will be. | |
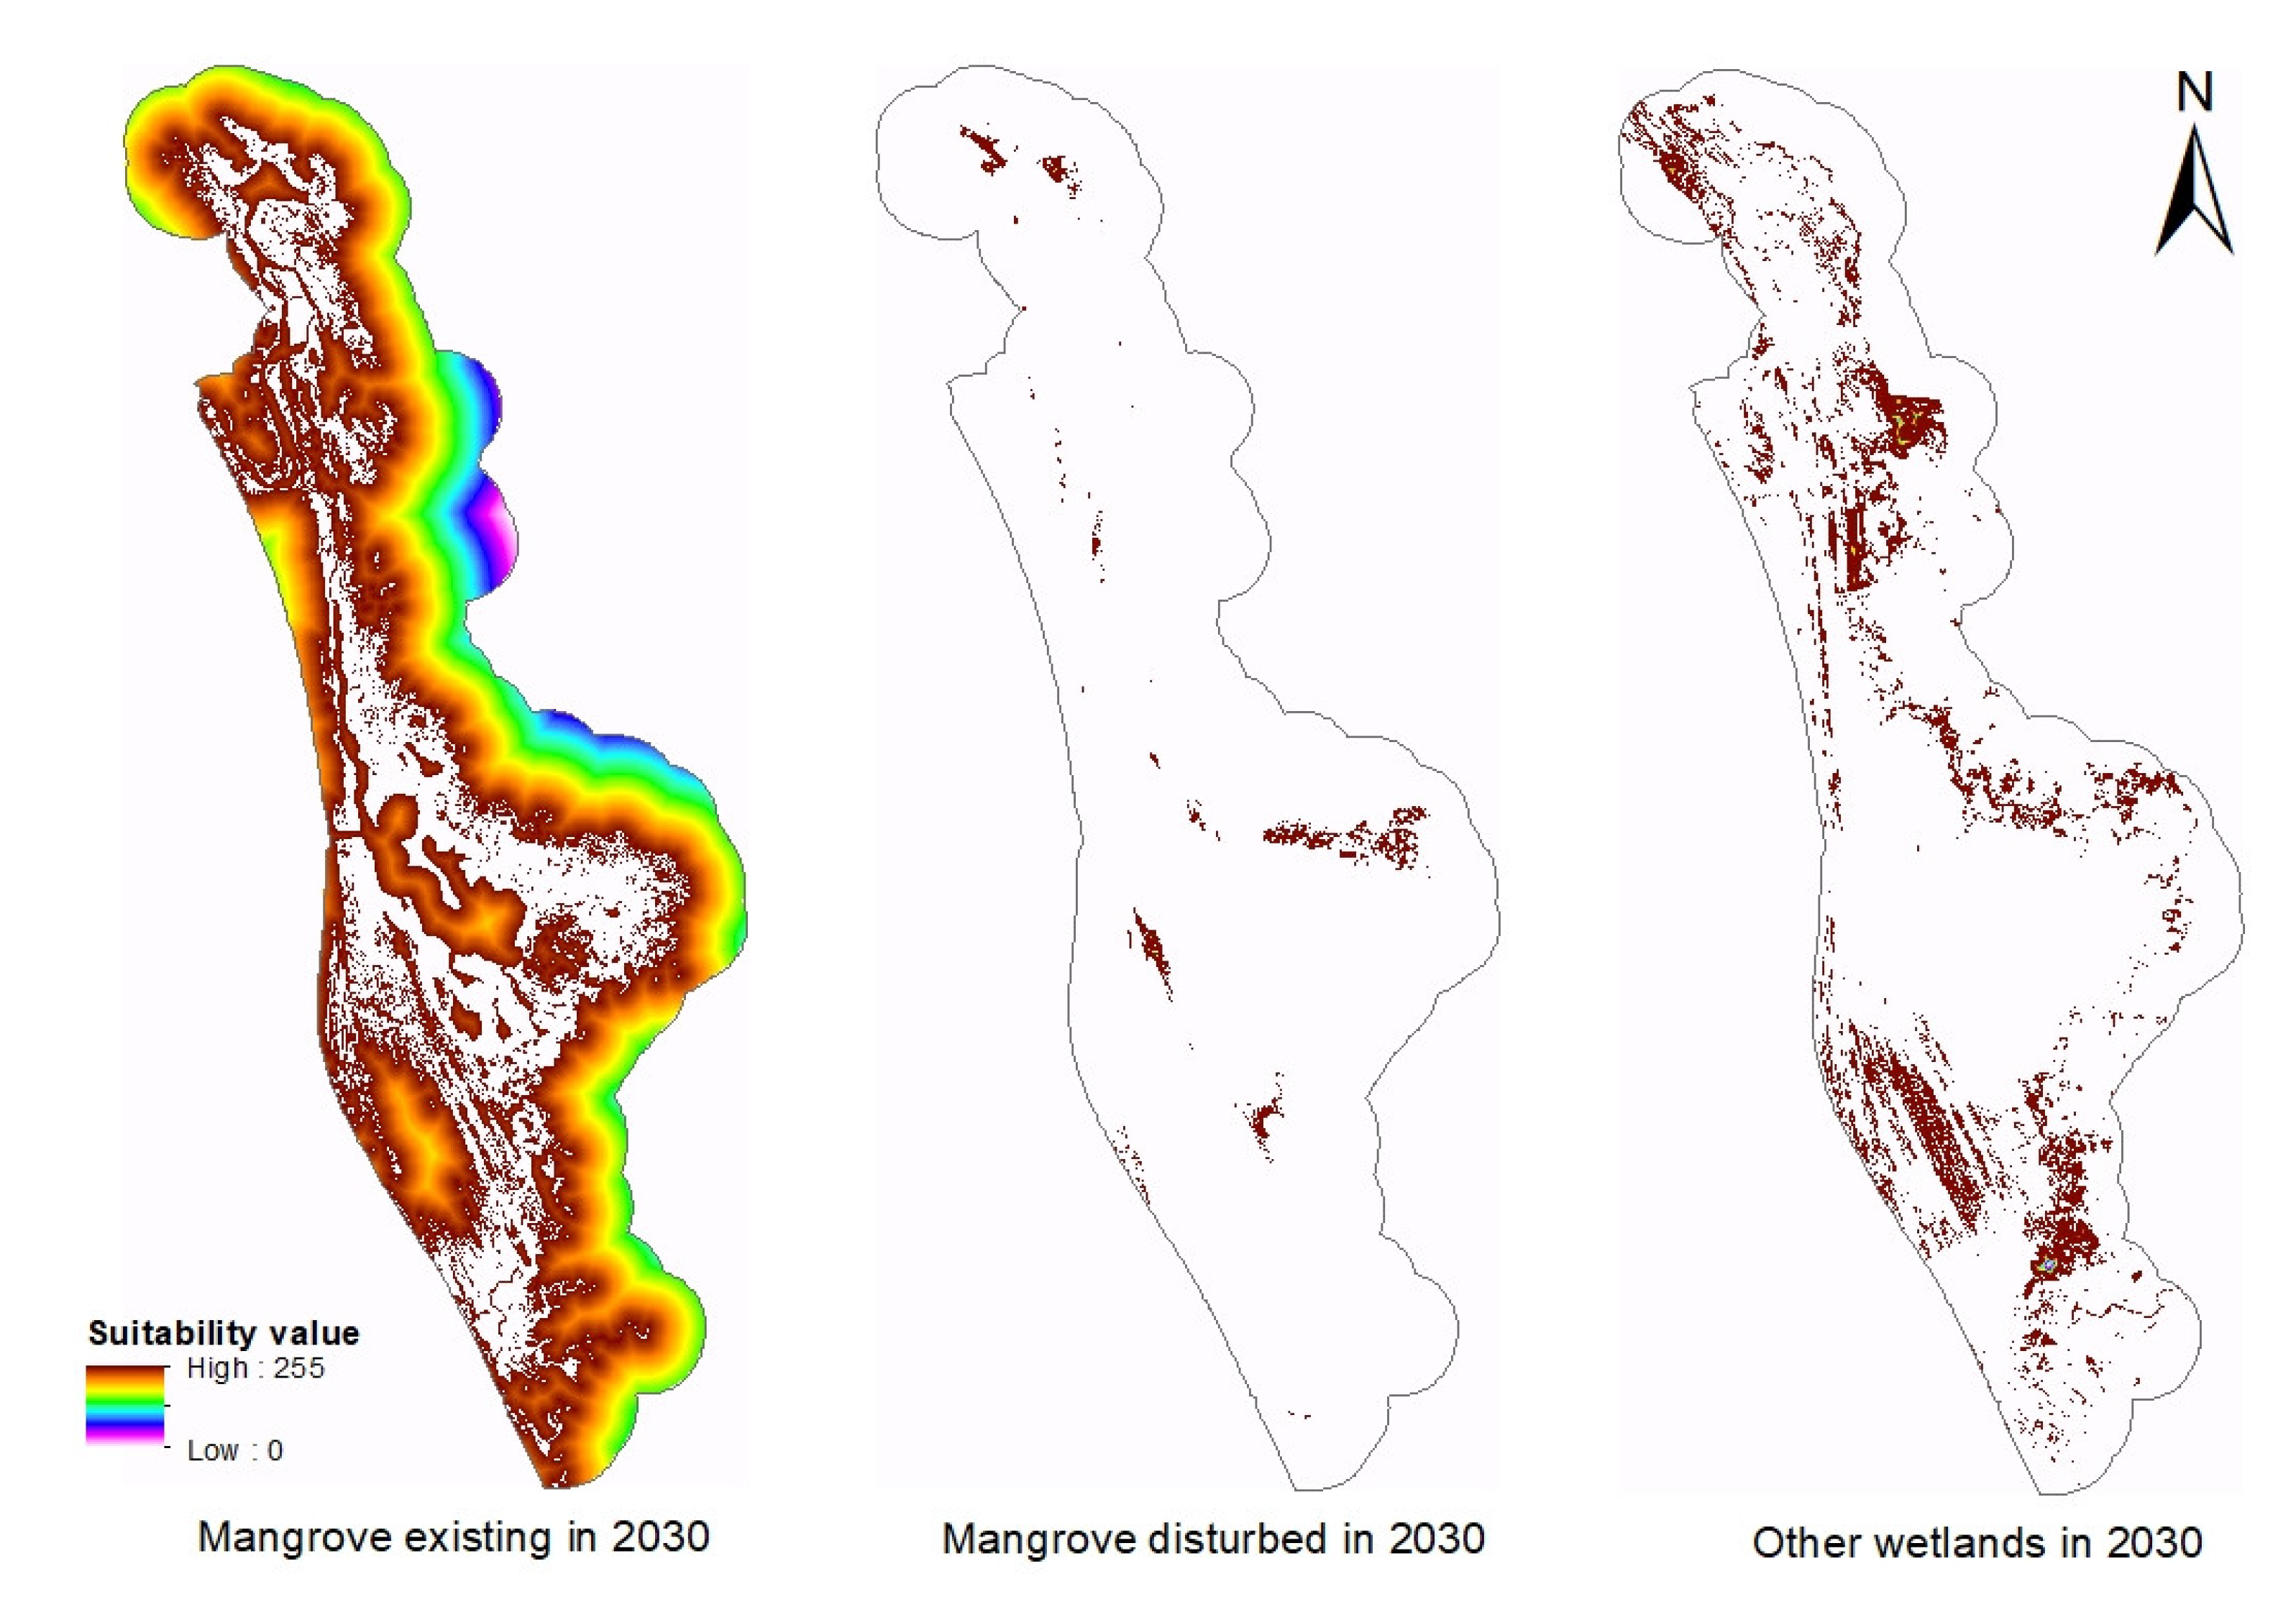
| Disturbed mangrove areas | Indicates the optimal areas that favor the increase of the mangrove forest since it can regenerate naturally or carry out reforestation or restoration programs. | |
| Hydrography | Proximity to rivers | Indicates that the areas closest to the rivers provide optimal conditions for the growth and development of the mangrove forest. |
| Road network | Remoteness from highways and roads | Models the farthest distance from highways and roads, obtaining the best surfaces that allow the growth and development of mangroves through reforestation or restoration programs. |
| Localities | Weighted proximity to localities | Models mangrove conservation at a greater distance from the localities, creates the ideal areas for the growth and development of the mangrove forest, establishes the areas with the lowest population, and shows us where the largest economically active population and the lowest marginalization are located. |
| Period | Year | Surface (ha) | Gain (ha) | Annual Rate of Gain (ha) |
|---|---|---|---|---|
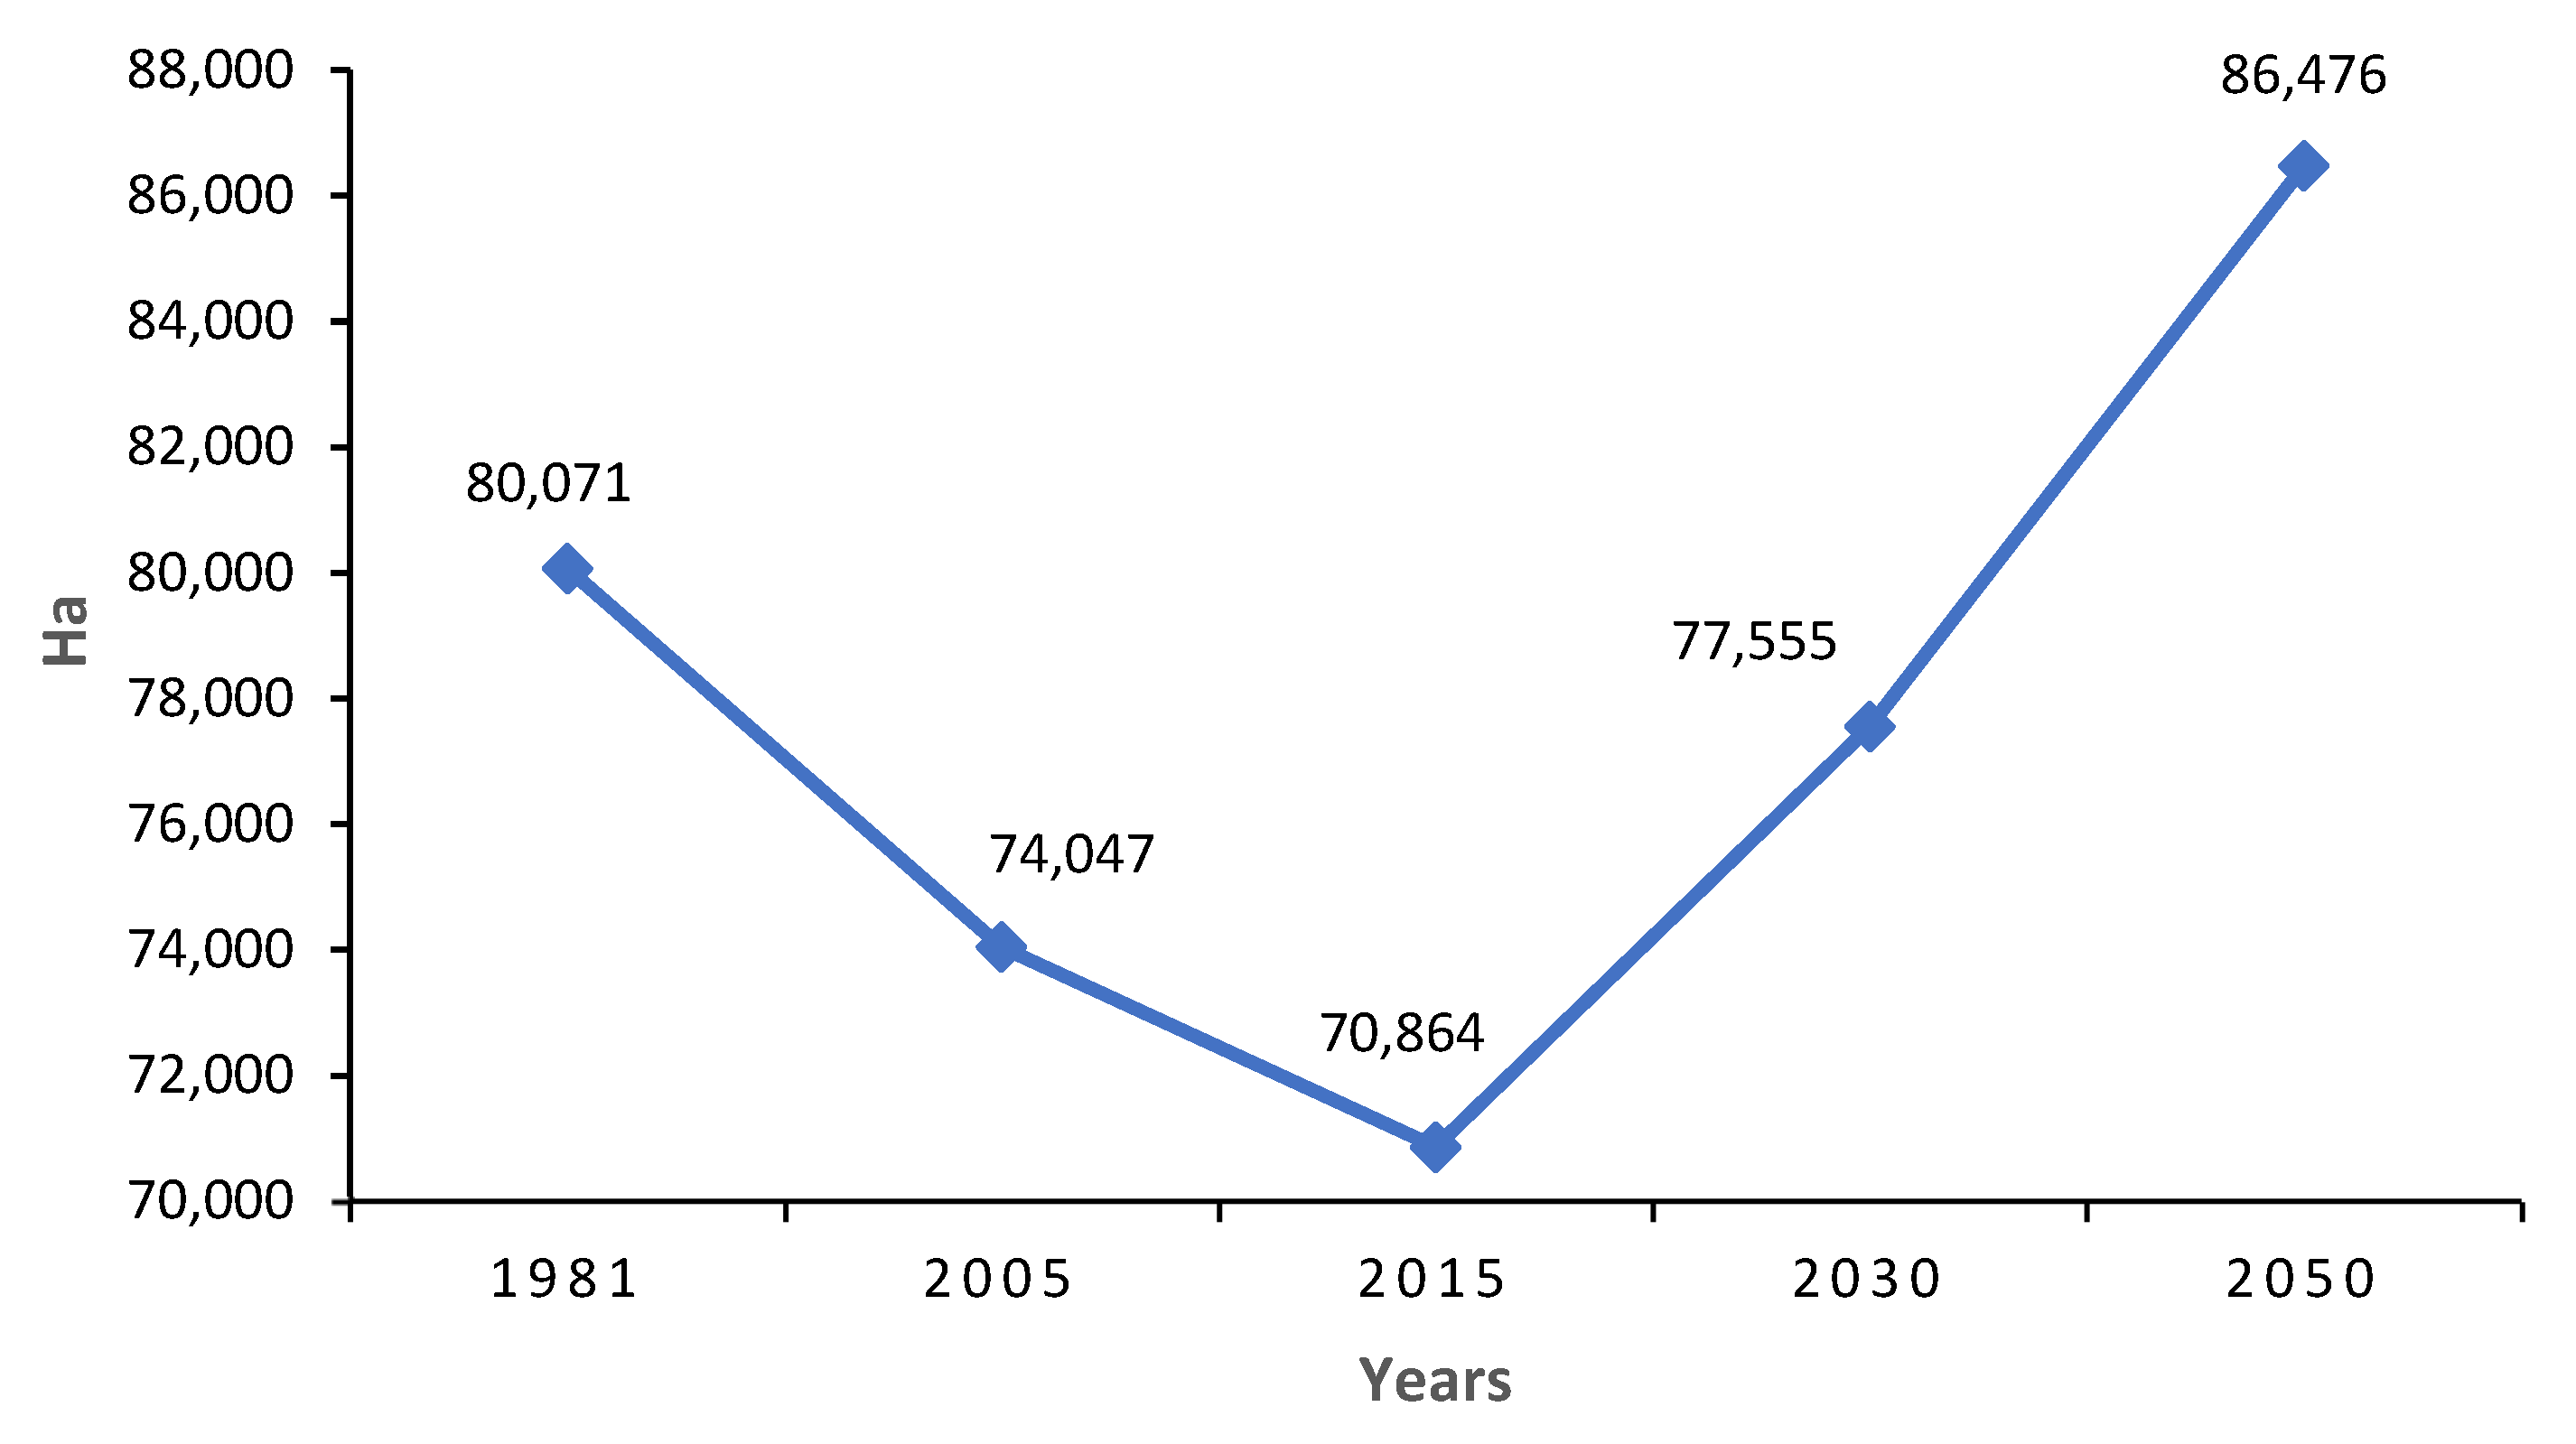
| 1981 | 80,071 | |||
| 1981–2005 | 2005 | 74,047.00 | 7479.00 | 311.63 |
| 2005–2015 | 2015 | 70,864.00 | 2689.00 | 268.90 |
| Future periods | Year | Estimated surface (ha) | Future land demand | Annual future rate |
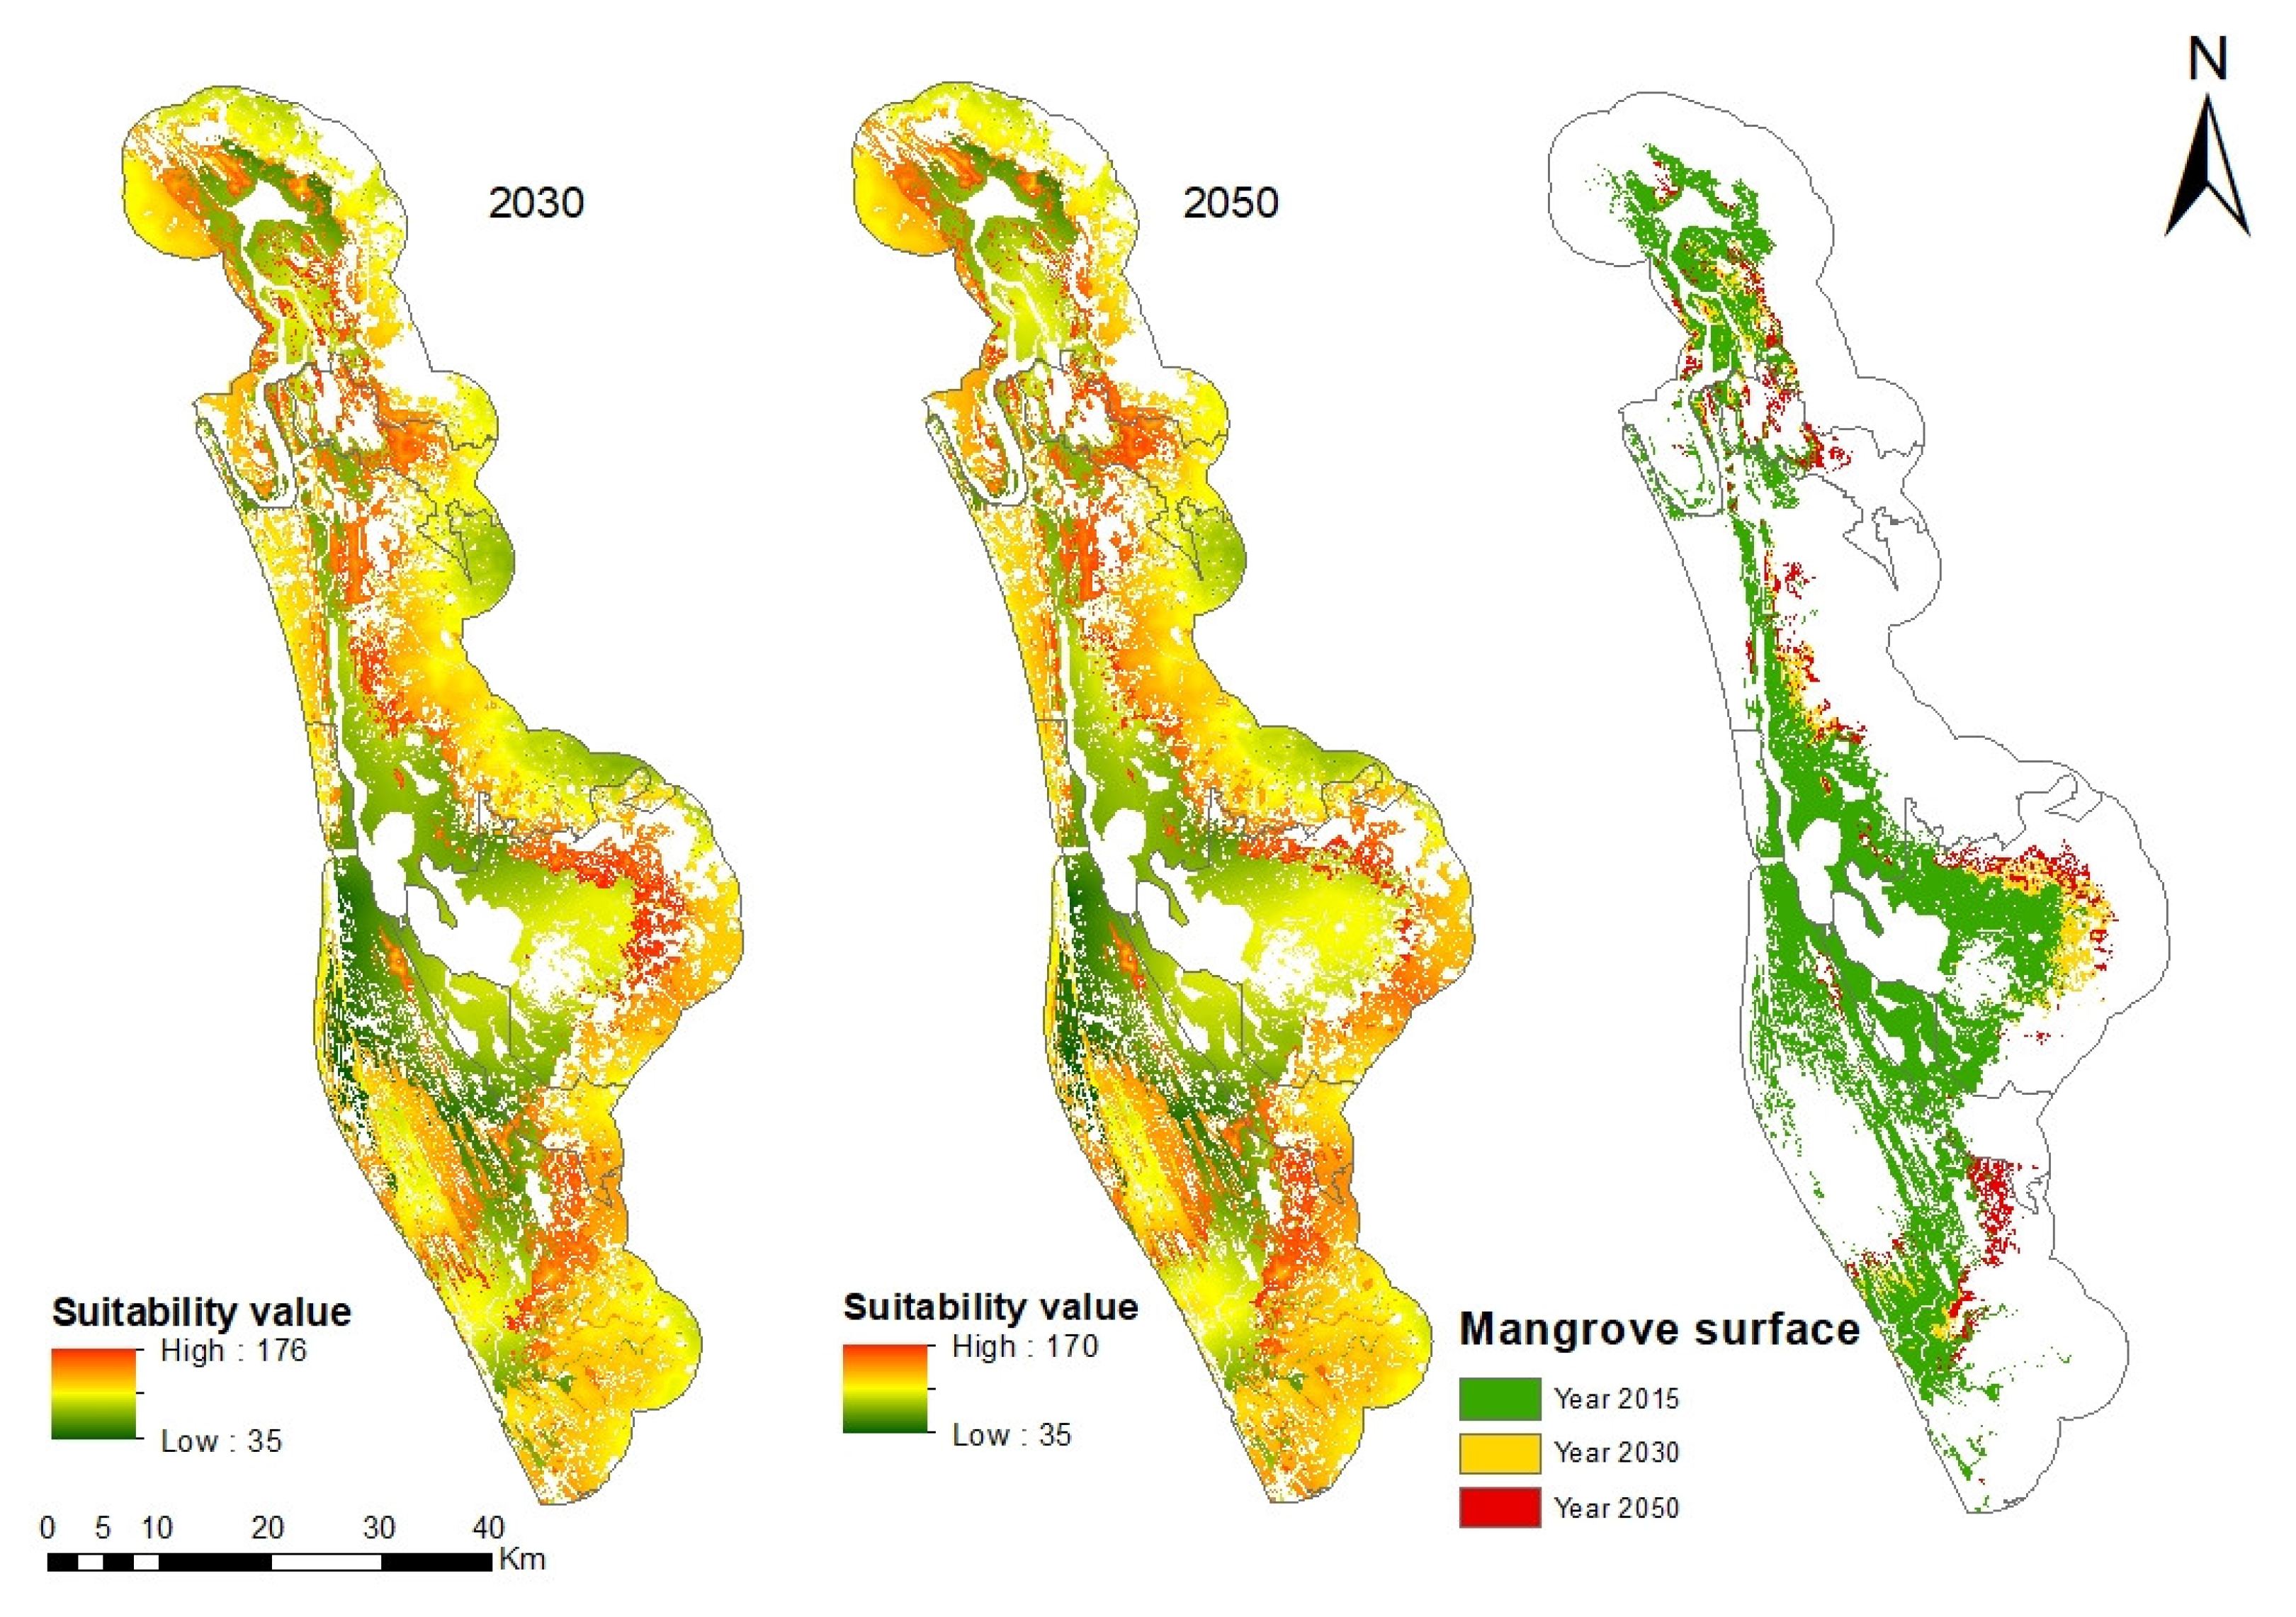
| 2015–2030 | 2030 | 77,555 | 6691 | 446.08 |
| 2030–2050 | 2050 | 86,476 | 8921 | 254.90 |
| Reclassification According to the Degree of Suitability | Saaty’s Pairwise Comparison Matrix | ||||||
|---|---|---|---|---|---|---|---|
| Soils | Importance value | 3 | 4 | 6 | 8 | 9 | Weight |
| Eutric Cambisol | 3 | 1 | 0.10 | ||||
| Haplic Feozem | 4 | 1.33 | 1 | 0.13 | |||
| Eutric Fluvisol | 6 | 2.00 | 1.50 | 1 | 0.20 | ||
| Eutric Regosol | 8 | 2.67 | 2.00 | 1.33 | 1 | 0.27 | |
| Gleyic Solonchak | 9 | 3.00 | 2.25 | 1.50 | 1.13 | 1 | 0.30 |
| ∑ | 1 | ||||||
| Reclassification According to the Degree of Suitability | Saaty’s Pairwise Comparison Matrix | ||||||
|---|---|---|---|---|---|---|---|
| Weighting of localities | Importance value | 1 | 2 | 4 | 6 | 8 | Weight |
| Locality from 2500–4999 | 1 | 1 | 0.04 | ||||
| Locality from 1000–2499 | 2 | 2 | 1 | 0.10 | |||
| Locality from 500–999 | 4 | 4 | 2 | 1 | 0.19 | ||
| Locality from 250–499 | 6 | 6 | 3 | 1.5 | 1 | 0.29 | |
| Locality from 1–249 | 8 | 8 | 4 | 2 | 1.3 | 1 | 0.38 |
| ∑ | 1 | ||||||
| Suitability of Factor | Saaty’s Matrix | ||||||||||
|---|---|---|---|---|---|---|---|---|---|---|---|
| Model factors | Importance value | 1 | 2 | 3 | 6 | 6 | 7 | 8 | 8 | 9 | Final weight |
| Optimum soils | 1 | 1 | 0.02 | ||||||||
| Inverse proximity to livestock-agricultural areas | 2 | 2 | 1 | 0.04 | |||||||
| Proximity to low deciduous and medium sub-deciduous forest | 3 | 3 | 1.5 | 1 | 0.06 | ||||||
| Weighted proximity to localities | 6 | 6 | 3 | 2 | 1 | 0.12 | |||||
| Remoteness to highways and roads | 6 | 6 | 3 | 2 | 1 | 1 | 0.12 | ||||
| Proximity to other wetlands | 7 | 7 | 3.50 | 2.33 | 1.17 | 1.17 | 1 | 0.14 | |||
| Proximity to rivers | 8 | 8 | 4 | 2.67 | 1.33 | 1.33 | 1.14 | 1 | 0.16 | ||
| Proximity to existent mangrove | 8 | 8 | 4 | 2.67 | 1.33 | 1.33 | 1.14 | 1 | 1 | 0.16 | |
| Areas near disturbed mangrove | 9 | 9 | 4.50 | 3 | 1.50 | 1.50 | 1.29 | 1.13 | 1.13 | 1 | 0.18 |
| ∑ | 1 | ||||||||||
| Period | Category | Gain (Ha) | Loss (Ha) | Rate of Annual Gain (%) |
|---|---|---|---|---|
| 2015–2030 | Mangrove | 6691 | 0 | 0.59 |
| Disturbed mangrove | 0 | 2354 | 0 | |
| Other wetlands | 0 | 4337 | 0 | |
| 2030–2050 | Mangrove | 8921 | 0 | 0.73 |
| Disturbed mangrove | 0 | 2323 | 0 | |
| Other wetlands | 0 | 6598 | 0 |
| Period | Year | Surface (ha) | Absorption (Gg de CO2 e) |
|---|---|---|---|
| 1981 | 80,071 | 370.59 | |
| 1981–2005 | 2005 | 74,047.00 | 342.71 |
| 2005–2015 | 2015 | 70,864.00 | 327.98 |
| 2015–2030 | 2030 | 77,555 | 358.95 |
| 2030–2050 | 2050 | 86,476 | 400.24 |
Publisher’s Note: MDPI stays neutral with regard to jurisdictional claims in published maps and institutional affiliations. |
© 2021 by the authors. Licensee MDPI, Basel, Switzerland. This article is an open access article distributed under the terms and conditions of the Creative Commons Attribution (CC BY) license (https://creativecommons.org/licenses/by/4.0/).
Share and Cite
Quintero-Morales, M.A.; Plata-Rocha, W.; Monjardín-Armenta, S.A.; Olimón-Andalón, V.; Torres-Montoya, E.H. Geospatial Simulation Model of Sustainable Mangrove Development Scenarios for the Years 2030 and 2050 in Marismas Nacionales, Mexico. Sustainability 2021, 13, 9551. https://0-doi-org.brum.beds.ac.uk/10.3390/su13179551
Quintero-Morales MA, Plata-Rocha W, Monjardín-Armenta SA, Olimón-Andalón V, Torres-Montoya EH. Geospatial Simulation Model of Sustainable Mangrove Development Scenarios for the Years 2030 and 2050 in Marismas Nacionales, Mexico. Sustainability. 2021; 13(17):9551. https://0-doi-org.brum.beds.ac.uk/10.3390/su13179551
Chicago/Turabian StyleQuintero-Morales, María Alejandra, Wenseslao Plata-Rocha, Sergio Alberto Monjardín-Armenta, Vicente Olimón-Andalón, and Edith Hilario Torres-Montoya. 2021. "Geospatial Simulation Model of Sustainable Mangrove Development Scenarios for the Years 2030 and 2050 in Marismas Nacionales, Mexico" Sustainability 13, no. 17: 9551. https://0-doi-org.brum.beds.ac.uk/10.3390/su13179551