Article

Hybrid Platform for Assessing Air Pollutants Released from Animal Husbandry Activities for Sustainable Livestock Agriculture

by
Razvan Alexandru Popa
1,2,
Dana Catalina Popa
1,
Gheorghe Emil Mărginean
1,
George Suciu
3,
Mihaela Bălănescu
3,
Denisa Paștea
3,
Alexandru Vulpe
2,4,*,
Marius Vochin
2,4 and
Ana Maria Drăgulinescu
2,4
1
Faculty of Animal Production Engineering and Management, University of Agricultural Sciences and Veterinary Medicine, 59 Marasti Blv., 011464 Bucharest, Romania
2
Beam Innovation SRL, 041386 Bucharest, Romania
3
R&D Department, Beia Consult International, 041386 Bucharest, Romania
4
Telecommunications Department, University POLITEHNICA of Bucharest, 041386 Bucharest, Romania
*
Author to whom correspondence should be addressed.
Sustainability 2021, 13(17), 9633; https://0-doi-org.brum.beds.ac.uk/10.3390/su13179633
Submission received: 7 July 2021 / Revised: 20 August 2021 / Accepted: 23 August 2021 / Published: 27 August 2021

Abstract

:
Farming livestock—cattle, sheep, goats, pigs, and chickens—contributes to the air pollution of the atmosphere. Agricultural air pollution comes mainly in the form of ammonia, which enters the air as a gas from heavily fertilized fields and livestock waste. A reduction in air pollutants from the livestock sector can be achieved by reducing production and consumption, lowering the emission intensity of production, or combining the two. This work proposes an approach for assessing the air pollutant emissions derived from intensive cattle farming. For doing this, the animal feed, the animal behavior, and characteristics and the stable environment data are monitored and collected by a cloud platform. Specifically, Internet of Things (IoT) devices are installed in the farm and key air pollutant parameters from the stable environment (such as CO, NH3, PM1, PM2.5, PM10) are monitored. In this scope, a study about monitoring air pollutants is conducted, showing the most relevant platforms used in this domain. Additionally, the paper presents a comparison between the estimated and monitored air pollutants (AP), showing the fluctuation of the measured parameters. The key takeaway of the study is that ammonia concentration has a higher level during the night, being influenced by the ventilation system of the farm.

1. Introduction

Obtaining animal products such as milk, meat, eggs, etc., comes bundled with a price that we are forced to pay. The population explosion and the change in human eating behavior are increasing the demand for animal products [1] (pp. 189–195). This situation is leading to a significant increase in emissions from animal farming [2] (pp. 409–411). Thus, to cover the requirements, several directions are being taken at the same time: genetic improvement of animal populations in order to increase production capacity, increase in land areas for fodder, improvement of environmental conditions on farms. Animal farms are essentially anthropogenic ecosystems with inputs and outputs. The different productions represent the outputs from the system, but there are also large quantities of substances with destructive potential on the environment, implicitly on humans. By considering the various outputs of a farm, an unfavorable general framework that highlights the destructive potential of animal farms is observed. To reduce potential harmful outputs, the anthropogenic factor should interpose between the inputs and outputs of the system. This would regulate the share of each aspect that contributes to the system’s functioning. It thus becomes mandatory to monitor emissions of harmful substances, make forecasts and draw up scenarios to minimize them.
Emissions of air pollutants (APs) associated with dairy cows have as sources animals (excreting animals on pasture, housing systems), manure management (storage of manure in lagoons, storage of fresh manure on platforms, fertilization of land with composted manure), feed management (cow diet), bedding used in animal housing, use of fossil fuels [3] (pp. 69–76), [4] (pp. 3407–3416), being represented by microscopic particles, nitrogen oxides, volatile organic compounds, ammonia, methane, carbon dioxide. These pollutants affect both the environment, being determinants of the greenhouse effect, and human health, either by direct or indirect action [5] (pp. 121–131).
Animal farms produce a series of air pollutants consisting of a mixture of gases rich in ammonia (NH3), carbon monoxide (CO) and microscopic particles known as particulate matter (PM), usually contaminated with microorganisms and toxins [6] (pp. 298–302). Ammonia is an irritating gas produced, under the action of enzymes, from animal manure, being an essential precursor of secondary inorganic aerosols, contributing significantly to the concentration of PM in the atmosphere, the most important being PM10 (microscopic particles less than 10 microns in diameter) and PM2.5 (microscopic particles less than 2.5 microns in diameter), the latter being easily transported over long distances [7]. PM1 represent ultrafine particles with an aerodynamic diameter of less than 1 micrometer. Ultra-fine dust is the most damaging variant of fine particles because the particles penetrate directly through the lungs into the bloodstream and are thus spread to the organs. CO is an odorless, colorless, tasteless gas. Higher concentrations of carbon monoxide in the air can cause weakness, confusion, flu-like symptoms with nausea and vomiting, and sudden death to young animals.
Ammonia is a severe problem, both for the environment and for the health of animals and humans; important diseases, especially in the lungs, can be associated with it in communities living near animal farms. The effects of ammonia on human health have been highlighted in a series of studies that showed a decrease in lung capacity (due to various pathologies), both in children and adults, in communities with high exposure to ammonia from the exploitation of animals [8,9,10,11,12,13] (pp. 300–308, pp. 146–154, pp. 575–585, pp. 1605–1614, pp. 134–140, pp. 278–287). In the environment, indirectly affecting humans, ammonia determines the effect of eutrophication [4,5].
Microscopic particles are represented by suspended matter in atmospheric air and carried by it; they are in the form of dust, smoke, or any other aerosols, their size being directly influenced by origin and chemical composition. Emissions from agriculture (plant and animal) have a significant contribution to the formation of particles smaller than 2.5 microns [14] (pp. 367–371).
The origin of microscopic particles from cow farms comes from animal movement, animal maintenance (on bedding or not), ventilation rate, the microclimate in the shelter, feed management (wet vs. dry food, feed distribution system, feed storage), or indirectly by oxidation of ammonia or other precursor gases [4,7,14].
The amount of particles is directly influenced by the animal species on the farm, being higher on pig and poultry farms [15] (pp. 1–17), but microscopic particles with dimensions below 2.5 microns formed by chemical reaction of gases (named secondary), especially ammonia, from dairy farms are the ones that raise major problems [15,16,17] (pp. 1–17, pp. 3130–3136, pp. 12813–12826), as they contribute significantly to large-scale pollution, being easily transportable [15,18] (pp. 1–17, pp. 272–277). These secondary microscopic particles pose a grave risk to the environment and human health. Their production is related to animal maintenance and manure management, especially how to apply in the field, respectively, spraying or injection [19,20,21,22] (pp. 123–137, pp. 707–723, pp. 134–173, pp. 3693–3706).
Several studies have highlighted the substantial contribution of agriculture to microscopic particle pollution and the impact on this state of affairs [7,14,23,24] (pp. 367–351, pp. 5394–5400, pp. 831–832). Microscopic particles are often contaminated with toxins (endotoxins) and microorganisms [6], and their transport by air dramatically affects the health of communities in the proximity of farms [25,26] (pp. 3300–3309, pp. 211–220). Exposure to endotoxins from animal farms is significantly associated with respiratory problems, such as asthma, wheezing, and cough [27]. Bioaerosols can also be contaminated with various pathogens that cause zoonoses and can be transported remotely and infect humans by inhalation [15,18].
The objectives of this study are:
  • To present the current knowledge on the methodologies and platforms employed for monitoring the air pollutants resulted due to animal husbandry activities.
  • To propose an open-source, sustainable hardware–software IoT platform for monitoring the air pollutants generated by livestock-related activities.
  • To propose a case study in a real environment where the proposed IoT infrastructure was deployed for monitoring key parameters of the stable environment: gas sensors (CO, NH3), and PM sensors (PM2.5, PM1, PM10).
  • To estimate the air pollutants concentrations based on European Monitoring and Evaluation Programme (EMEP) methodology and to compare the estimated values with the monitored concentrations.
The paper is organized as follows. Section 2 reviews state of the art in the area of AP monitoring methodologies as well as platforms used for AP monitoring. Section 3 describes the architecture of the proposed platform for AP monitoring while Section 4 outlines a case study conducted using the proposed platform. Section 5 compares the estimated and monitored AP concentration data while Section 6 draws the conclusions.

2. State of the Art

The livestock sector is a serious user of natural resources and has a significant influence on air, soil, and water quality by altering the biogeochemical cycles of nitrogen, phosphorus, and carbon [28], giving rise to environmental concerns. Therefore, livestock farming is gradually becoming oriented towards more sustainable systems, applying management strategies and innovative technologies to mitigate environmental risks.

2.1. Methodologies for AP Monitoring Used in Animal Husbandry Activities

Air pollution is known to be challenging to evaluate. As human activities mainly cause it, it is only logical to try to monitor it to reduce it. Sensor technology has significantly evolved in recent years. It has become accessible not only to public environmental agencies but also to people through low-cost sensors.
A recent study [29] compared neuro-fuzzy and neural network techniques to see which is the best option for estimating ammonia concentration in poultry farms. A thermohydrometer was used to monitor indoor air temperature and relative humidity distribution. For the airspeed distributions, they employed a hotwire anemometer. The ammonia (NH3) concentrations were estimated with a portable ammonia gas detector (AR8500) which seems to have an accuracy of ±2.00% and a resolution of 0.01 ppm. Of the four explored models (multilayer perceptron (MLP), adaptive neuro-fuzzy inference systems with grid partitioning and subtractive clustering (ANFIS-GP, ANFIS-SC), and multiple linear regression (MLR)), after analyzing the simulation results, the ANFIS-SC model showed to be the best choice, while the MLR was appreciated as the least favored model for NH3 concentration prediction.
Another study [30] describes a farm-based model for the ammonia emission estimation in the United States. The model consists of two major components: Farm Emissions Model (FEM) and National Practices Model (NPM). FEM is a semi-empirical model of ammonia emissions from dairy farms, and its inputs include manure management practices and yearly climatic conditions per farm. By using those inputs, the model can predict monthly emission factors for a dairy cow. It traces the nitrogen flow throughout stages of manure management like storage, feeding, and grazing. They made a sub-model for each manure management phase and stored the nitrogen mass and volume of manure after every stage. NPM is a statistical model that predicts farming practices for each county in the analyzed area. As inputs, it needs the distribution of farm sizes in a county, historical farming practices, milk production, and climate data. The final model’s way of working is presented as follows: the NPM model predicts the most used farming practices for every county, and then, the FEM model is put to work with each of them.
Table 1 presents a schematic overview of the methodologies for air pollutants estimation presented in Section 2.1.

2.2. Existing Digital Platforms for AP Estimation

Recent studies suggest that globally, air pollution is one of the most significant environmental health risks and a leading factor for disease burden. Such studies use estimates of air pollutant concentration fields in reaching their conclusions. In the past, a variety of approaches have been used to assign pollution concentration levels to populations or areas of expertise, including simple measurement-based methods, empirical modeling, and air quality modeling techniques. More recently, hybrid methods combining multiple approaches have been developed.
A work [31] whose focus is on farming activities presents AgriBigCAT: an online software platform that uses geophysical information and web technologies for estimating the impact of the agricultural sector on the environment. Its final goal is to increase food production at a lower environmental impact. The platform calculations consider land, water, air emissions (e.g., greenhouse gases), animal feeding practices, and popular manure management techniques in its predictions based on the guidelines. The datasets are stored using Apache Hive. The geospatial analysis and the visualization of the datasets are made using ArcGIS and its API for JavaScript. The AgriBigCAT platform can also illustrate maps that classify farms after different filters: type of animals they grow, number of animals, yearly methane emissions, yearly nitrogen excreted from animals’ manure, and others.
This paper [32] proposes an AQM (air quality monitoring) LEACH (Low Energy Adaptive Clustering Hierarchy Aggregation) algorithm (AQM-LEACH) to monitor the AQI (air quality index) values using a wireless sensor network. Unlike LEACH, where data are sent to a base station at every round, AQM-LEACH saves energy by not sending data unless the AQI values are higher and negatively affect human health. The frequency of collecting data reaches its maximum when the air parameters are at a dangerous level. The used network is taken from EPA (the United States Environmental Protection Agency) and contains 23 sensors. The used dataset is also from EPA. It has air quality index (AQI) values for the following gases: carbon monoxide (CO), nitrogen dioxide (NO2), and sulfur dioxide (SO2), with timestamps that define the time at which they were recorded.
Another study [33] presents a low-cost air quality monitoring and prediction system via Raspberry Pi, which runs the Kalman Filter algorithm after receiving the data. The hardware part of the system also contains a Wi-Fi module and a sensor network that realizes real-time monitoring of the concentration of air pollutants such as SO2, NO2, CO, O3, PM2.5, and PM10. The software part is mainly the cloud data storage and client system. The Air Quality Monitoring System consists of three layers: the perception layer, the network layer, and the application layer.
Table 2 presents the platforms by considering the following: source, air pollutant, type, and functionality and it underlines the advantages and disadvantages of each air pollutant platform.
Compared to the platforms mentioned above, the platform implemented within this project transmits data via wireless technologies to the data aggregator associated with the Cloud. The platform is a combination of the estimated AP concentrations at the European level and the monitored data, an essential advantage of the system being the wide range of parameters of the stable environment that it can monitor: temperature, humidity, atmospheric pressure, CO, NH3, and PM sensors (PM2.5, PM1, PM10). In addition to monitoring the AP, the platform offers farmers the opportunity to use the data in a valuable way to reduce increased emissions.

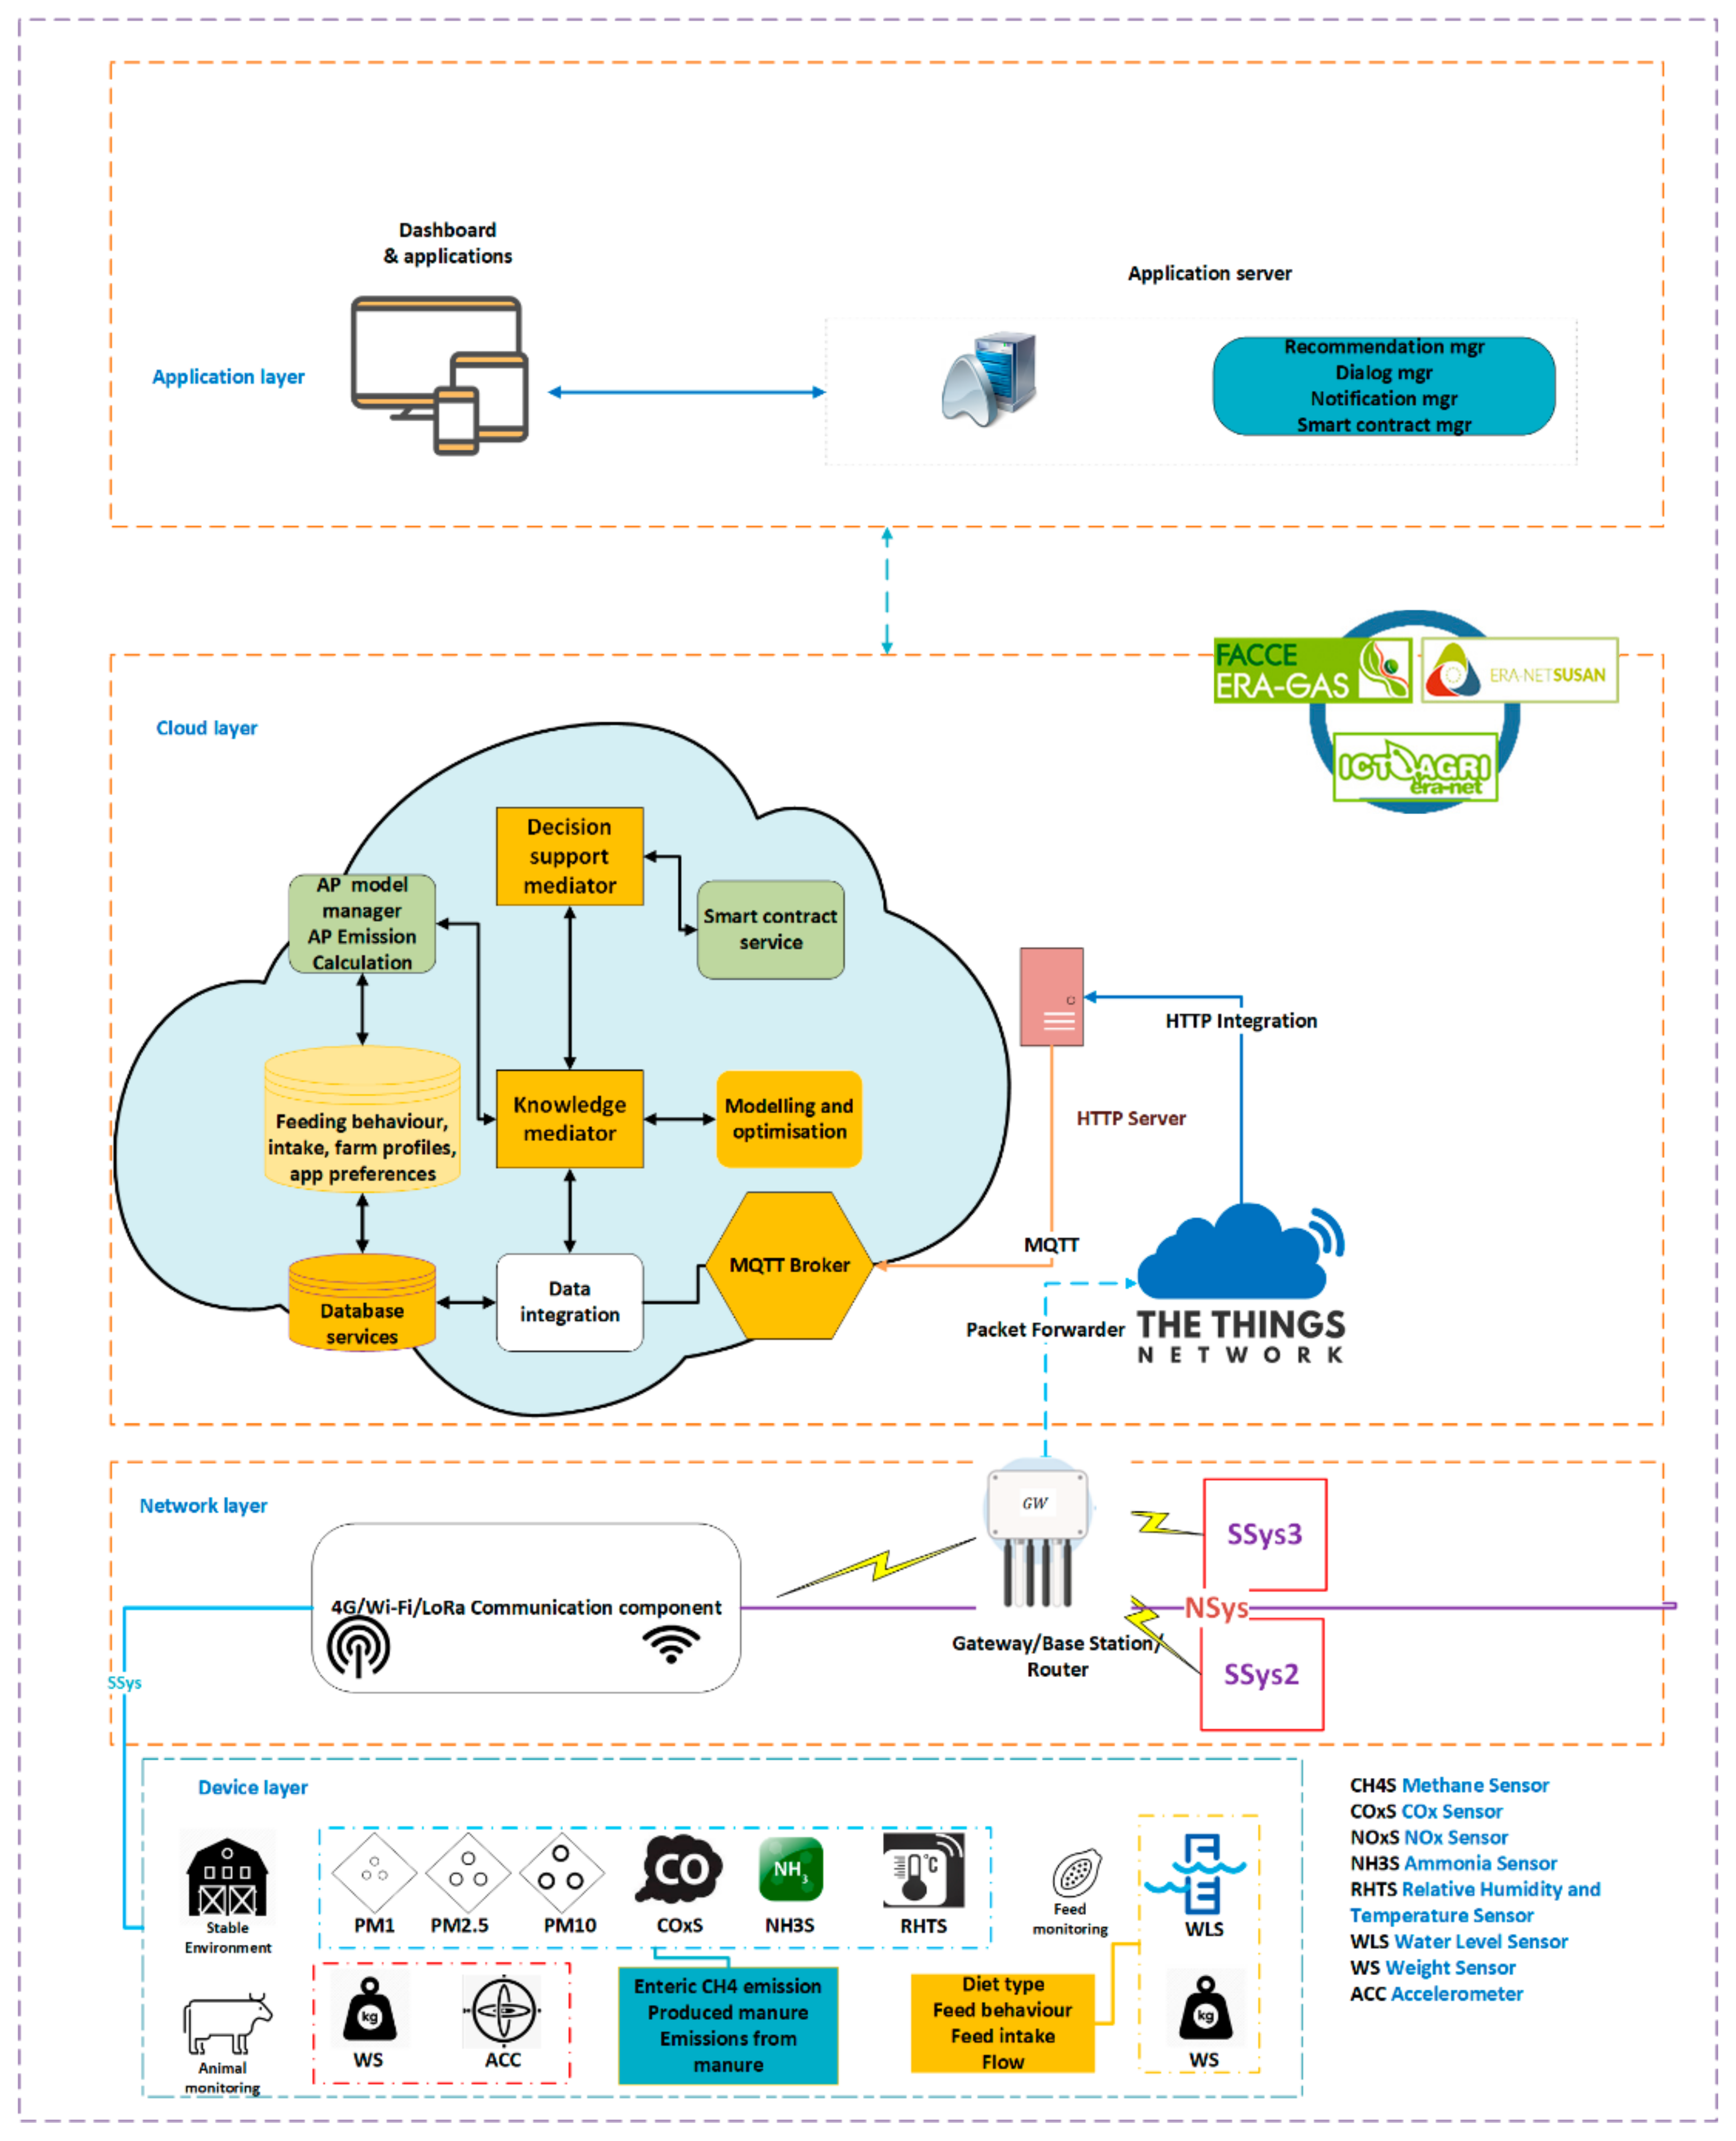
3. Platform Architecture

We designed a hybrid platform that will incorporate both AP concentrations estimated through EMEP methodologies and monitored data. The system would enable an efficient approach to allow farmers to concentrate on their daily farm activities and use the data to their advantage. Figure 1 illustrates the envisioned platform architecture.
Inspired by the latest IoT reference architecture designs [34], we decided to follow a layered architecture to specialize in each domain. These functional domains are deployed with different features providing a finer overview. This is encouraged by the design principle of using a modular approach that increases the platform’s extensibility, and thus, the scalability of the resulting solution. From a high-level point of view, we can distinguish three different main domains:
  • Sensor data integration (device + network layer): This macrodomain integrates both the device layer at the farm and edge and the network/middleware layer at the platform.
  • Knowledge aggregation and mediation (cloud layer): It has different functions to fill the knowledge structure with the generated data and also the integration of the AP model features.
  • Application layer: Includes both the final applications and the decision support services.
It is important to highlight that these three main domains play different roles, two of them representing the inputs and outputs of the system in terms of data integration and stakeholder interaction, and the one in the middle, the Knowledge layer, that conveys the interactions between these two domains. The Knowledge layer has a central role in building “wisdom”, useful to arrive at a final decision support system for precision agriculture. This separation is part of the goal of achieving a decoupled architecture that allows separating the business logic from the complexity and the heterogeneity of the network technologies.

3.1. Device Layer

The device layer is made of all the different sensors, devices, and client agents in charge of collecting and transmitting data to the platform. Due to the diverse nature of the sensors as well as potentially different farm sites, this layer tends to be very heterogeneous in terms of technologies, networks, protocols.
In order to standardize the process of context data integration, we adhere to a common data model. To cater for the integration of different technologies we provide what are called specific Farm IoT Agent clients that communicate with the same IoT protocol rather than direct communication with the selected sensors. In turn, they will communicate with Farm IoT Agents in the back end. Typically, in IoT, transport protocols like REST HTTP, MQTT, and CoAP are used.

3.2. Network Layer

The network layer consists of the communication component and the gateway. There are multiple options for communication and the gateway component. This flexibility enables a large set of use cases and provides adaptability without requiring any customization. The main element of the network layer is the gateway, which links the device layer with the cloud layer. The gateway used is Dragino DLOS8 integrated and registered together with the wireless sensor nodes in The Things Network [35]. In Figure 1, SSys comprises the devices (stable and animal sensors, devices for assessing the feed and water intake) and the network devices. To the gateway, one may connect more SSys, for adjacent farms.

3.3. Cloud Layer

The cloud layer is in charge of transforming plain data into knowledge to enrich the higher-level services with intelligence. It consists of two main parts. The first part is The Things Network which receives data from the network layer and sends them via MQTT to the cloud. The most important components of the cloud layer are:
  • Knowledge mediator: This is a component that connects the integrated data with other components. It is in charge of aggregating, extracting, publishing and notifying regarding semantic and context-aware information to other components. The Knowledge mediator plays a central role as the coordinator of the data bus. The data bus works using the “Publish/Subscribe” paradigm: a messaging pattern where senders (also known as publishers) categorize messages into classes without knowing which receivers (also known as subscribers) will receive them. Subscribers, on the other side, express interest on one or more message classes and only receive those, without knowing which publishers are generating them. Finally, the data are organized into a data model. The way to access the data model is through the Knowledge mediator.
  • AP model Manager and AP emission calculation: This component is responsible for selecting and managing the AP model used on a farm. The model will differ in terms of both static information (farm size, animal characteristics, type of feed used, etc.) and dynamic ones (parameters read from sensors placed within the farm). The model manager takes the results of both the database and from the information entered directly by the agricultural actor who uses the system (feeding behavior, farm profile, etc.). Based on the model provided by the AP Model Manager and the information taken from both the modeling and simulation block through the knowledge mediator, the AP emissions are concretely calculated.
  • Modeling and optimization: The component focuses on deriving appropriate livestock emission mitigation strategies. This module will act as a decision support system for farmers to devise the best suitable mitigation strategy. For this, the module will access data from all relevant data sources. The module has two primary activities: modeling and simulation to estimate AP from livestock farms and using optimization on top of it, to recommend concrete activities to reduce air pollutants.
    Since the system expects large amounts of high-frequency data collected from multiple sources, it opens up the possibility of applying advanced computational and mathematical models for achieving a more accurate emission prediction. The modeling techniques could be statistical, mechanistic, and machine-learning. As a starting point, the modeling part will be concentrating on Tier 2 models. A mathematical relationship between the input and AP emitted from farms will be established here. The data input could be animal characteristics, feed intake, and manure management. The periodical data collected from livestock farms located in various geographical locations also open the possibility of analyzing the spatial and temporal variations in the data points. These space-time variations of livestock farm parameters could be important while building a global model. Once models are built and simulated, simulation results will be rendered through appropriate data visualization. Users will be able to try out different scenarios, such as what happens if they change animal feed and manure management and see their effects on AP emissions from the farm.
  • Smart contract service: provides the application layer with the functionality of a smart contract based on the blockchain and database service and the data obtained through the knowledge mediator module.

3.4. Application Layer

The Dashboard is an important component in our application as it provides a quick overview of the livestock farm performance. It uses the output from the AP modeling block and several other farm information from the database to generate a visual representation of some key performance indicators (KPIs) of livestock farms. These KPIs could be productivity, AP emissions, profit, etc., and the visual representations could be tables, line charts, bar charts, etc.

3.5. Discussion on User-Friendliness, Maintenance and Sustainability of the Platform
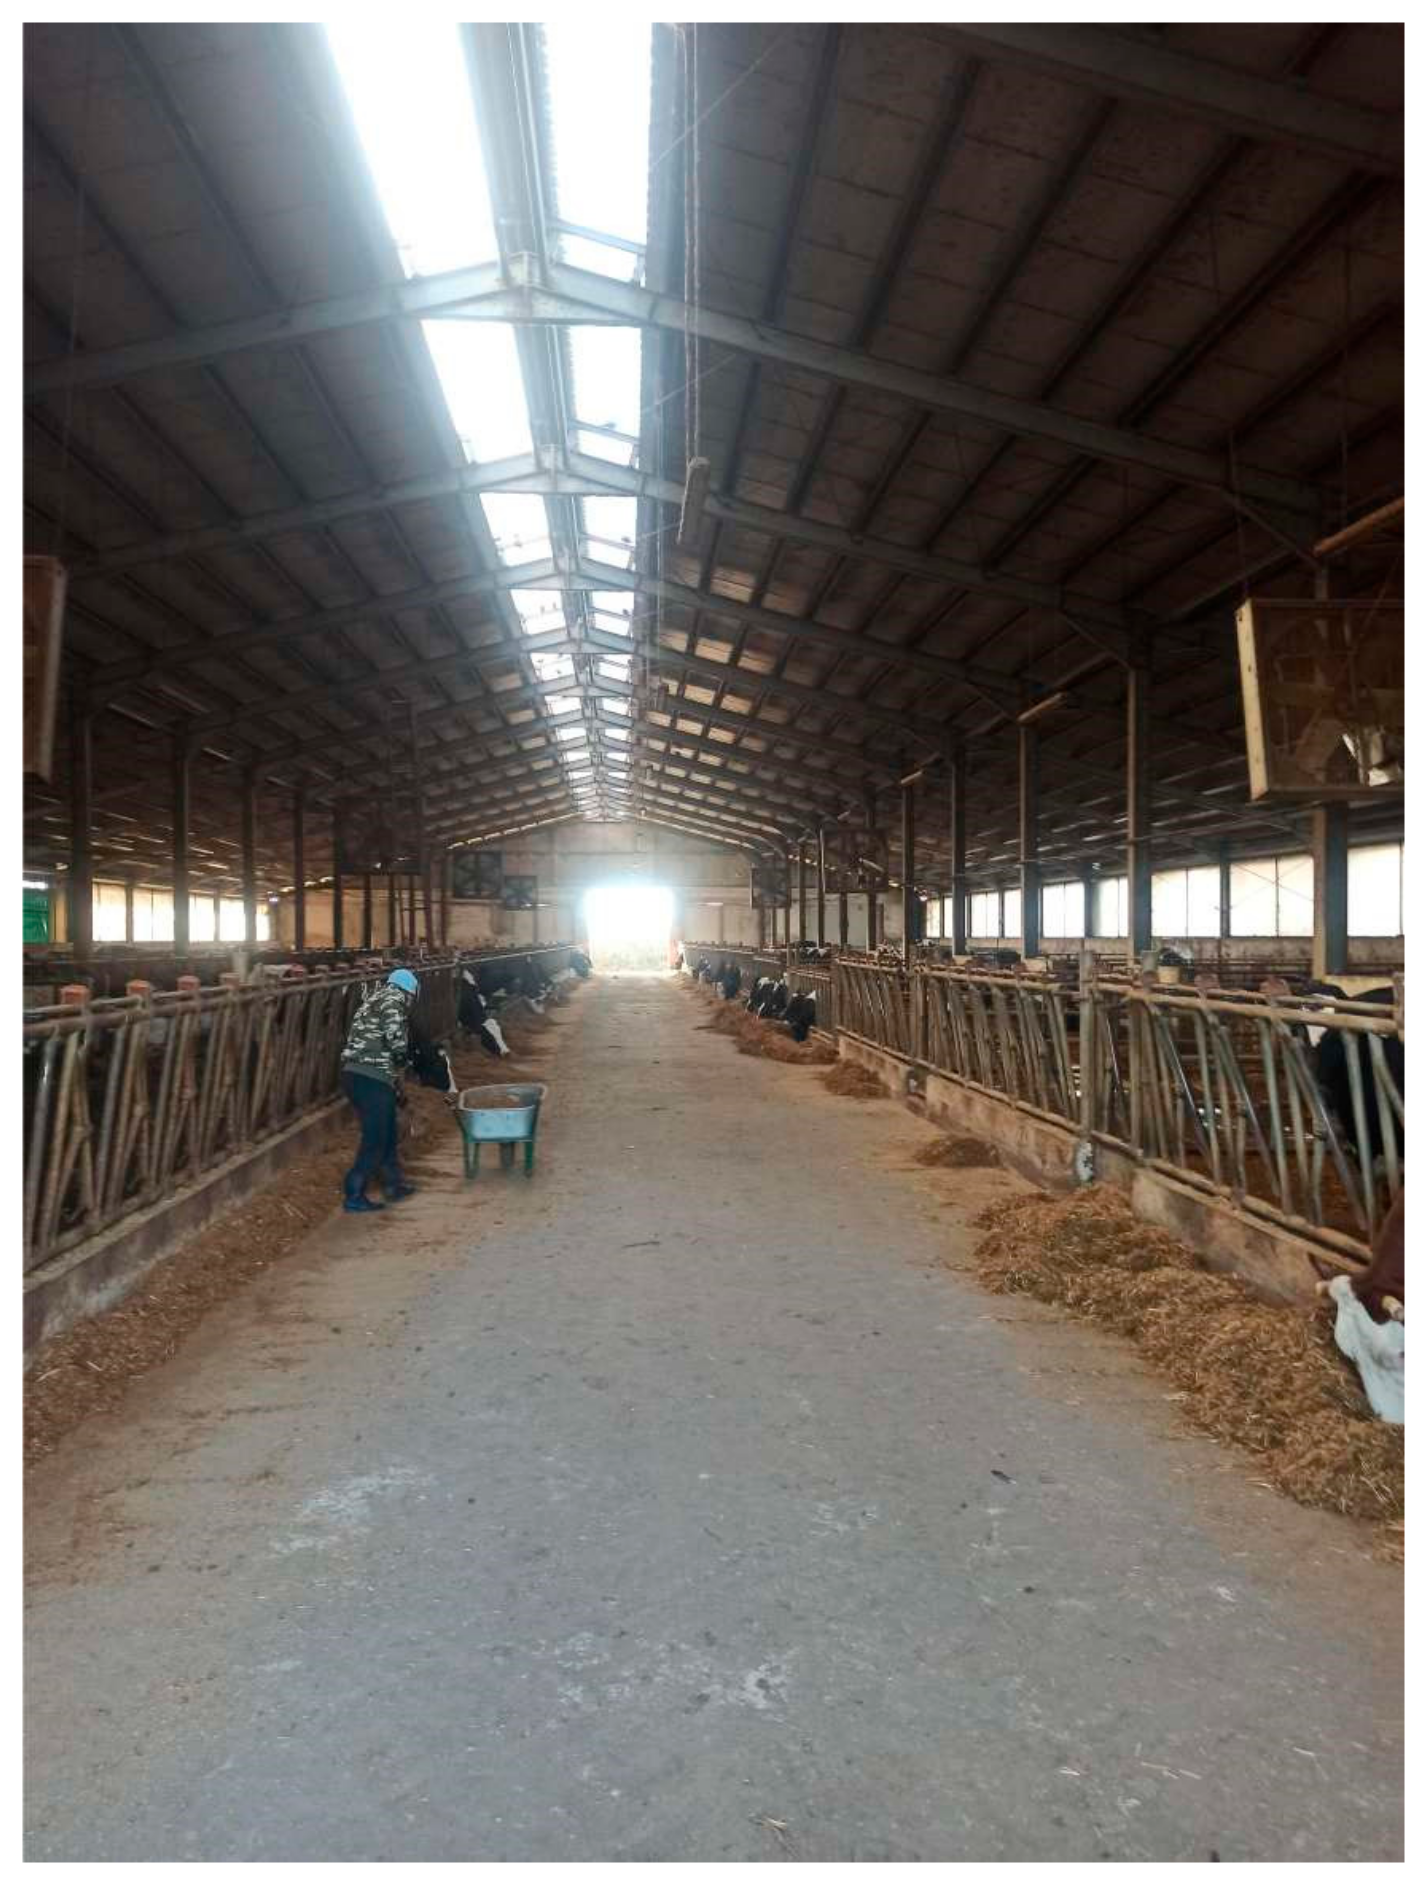
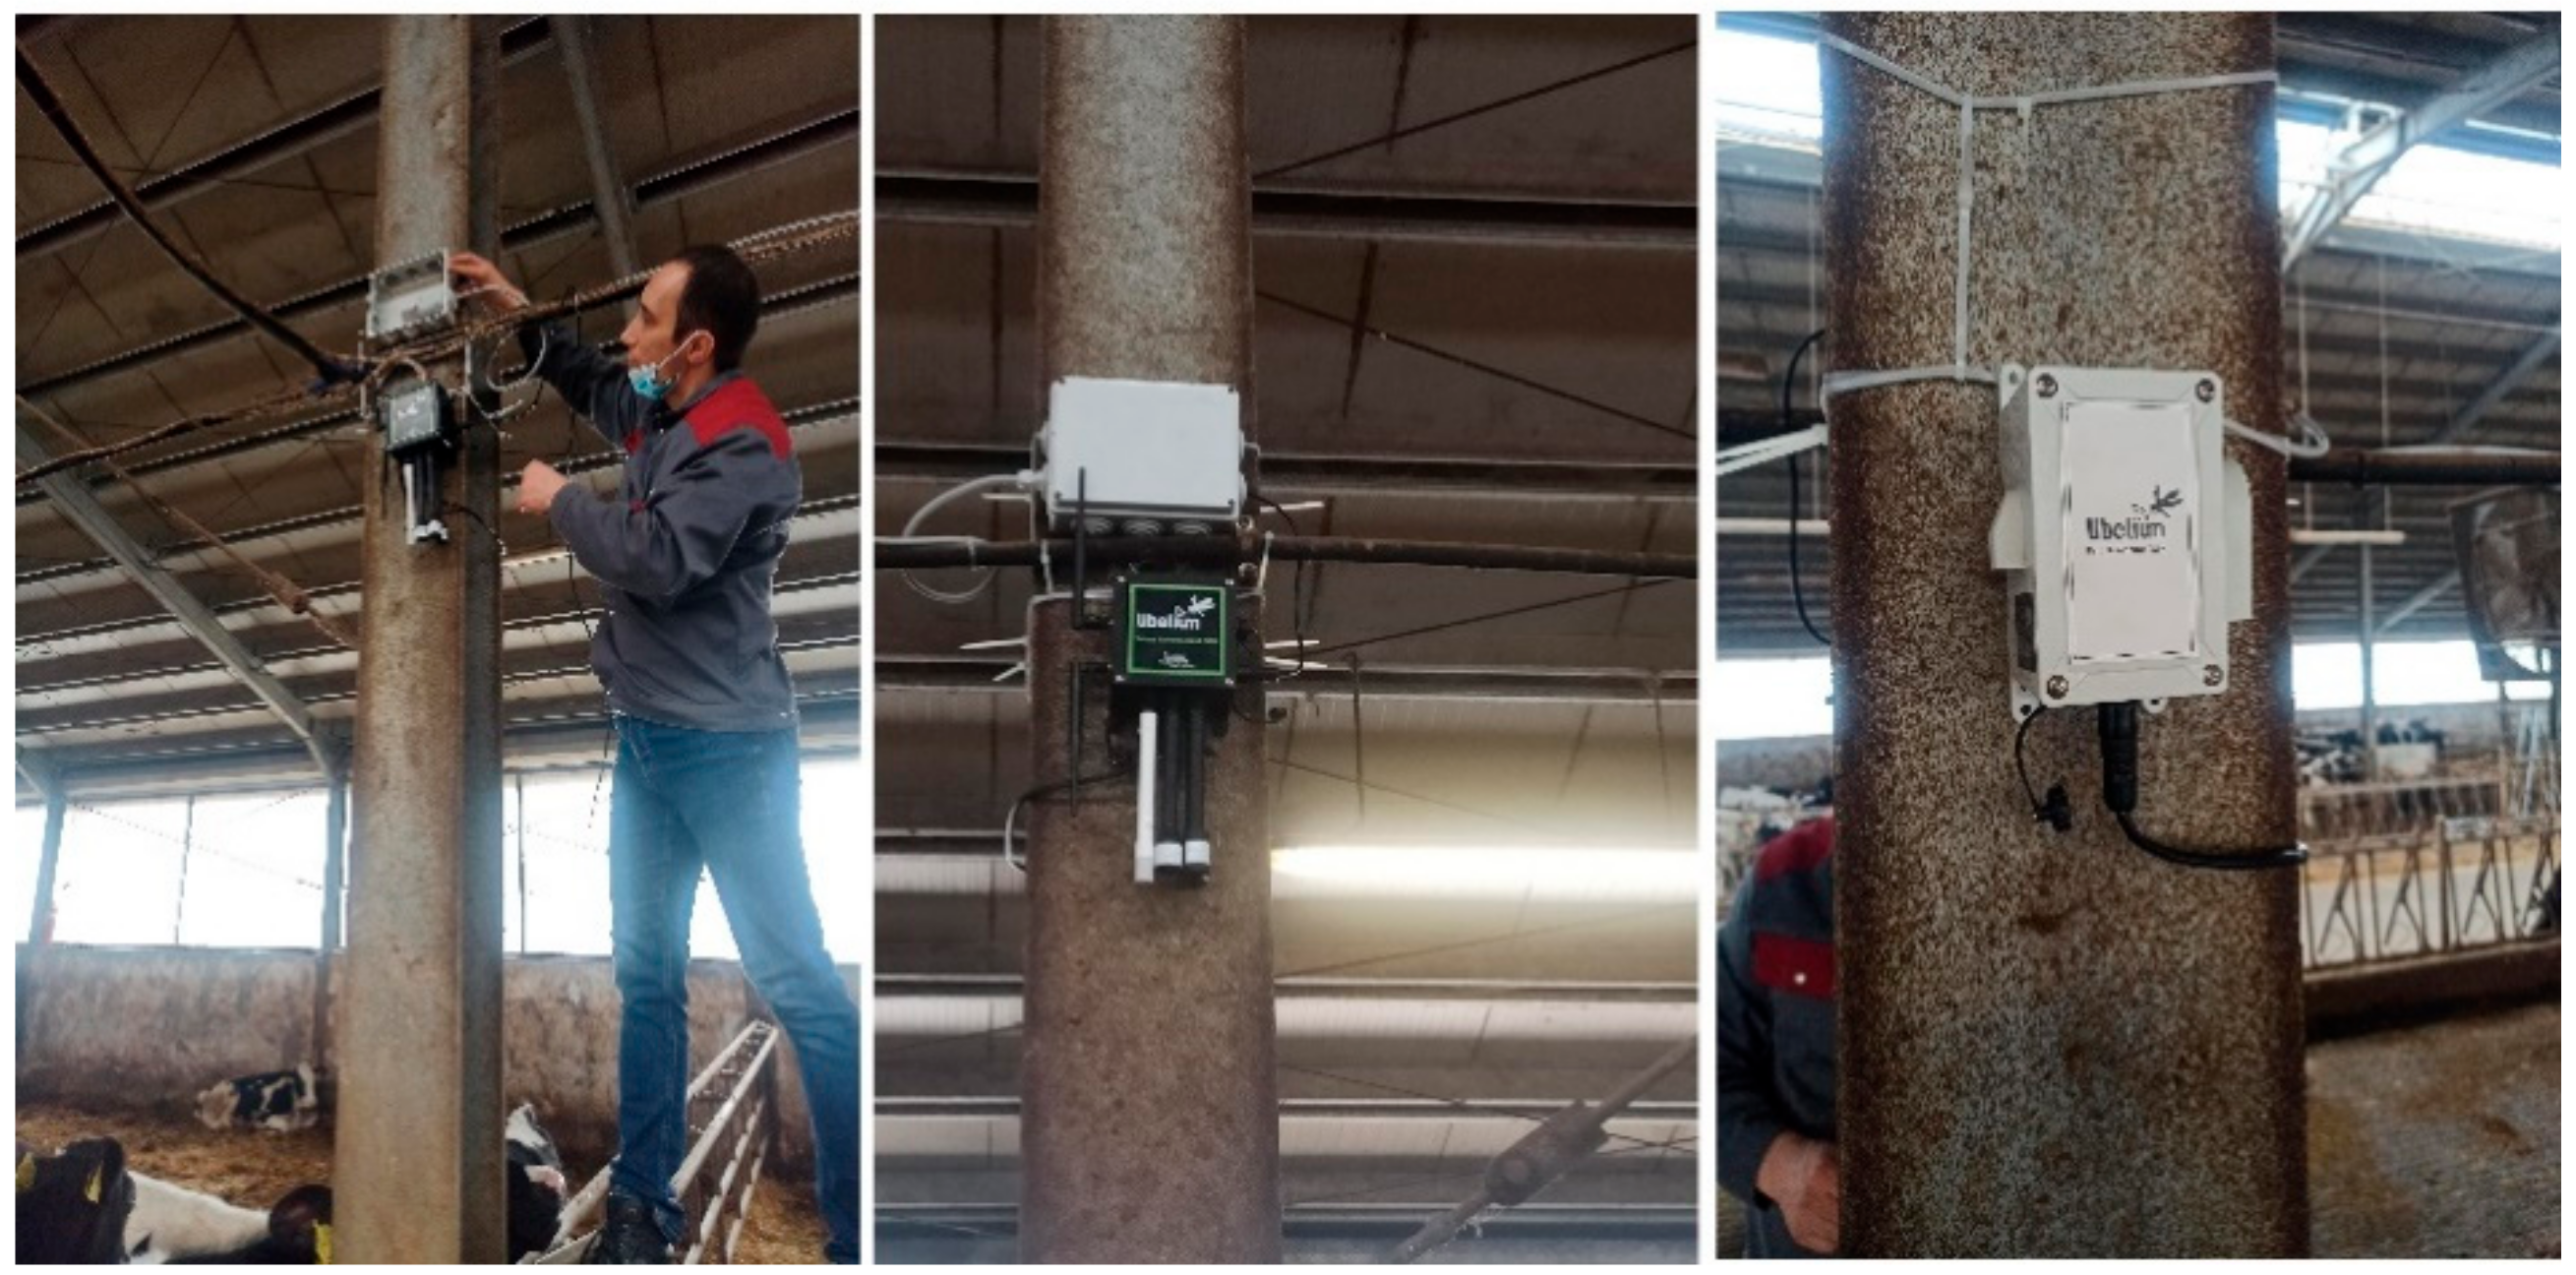
With the help of visualization components, users can easily understand the bigger picture of the situation of livestock farms and see where the farm stands in relation to global sustainability goals. Apart from visualizing the current state of the farm, representation of results from the recommendation engine can also be delivered through the dashboard. With effective visualization, farmers can also analyze and reason about the data and evidence, which, in turn, helps them in decision-making processes. Through the interactive components such as filters and tabs, users can also check different scenarios and their effects on sustainability. Figure 4 shows an example of a user-friendly dashboard showing the user an at-a-glance situation of the monitored farm.
When a hardware sensor experiences a failure, at the level of the development board notifications are generated and sent to the Application layer to inform the farmer and the technical personnel. Software maintenance supposes, on one hand, that sensors and development boards are reprogrammed Over The Air (OTA) such that the physical presence of the technical personnel is not necessary. Thus, the maintenance of the platform is easy to achieve.
The platform is based on discreet monitoring sensors, low-power radio transmission technologies (LoRa, cellular IoT) with 10+ years of operation without battery replacement as well as open-source software components. Therefore, the platform is deemed to be sustainable both from an environmental point of view as well as from the point of view of human resources needed for extending and modifying the platform.

4. Case Study

The case study was conducted on a 200 head dairy cow farm, Milanovici Farm, situated in Moșteni commune, the northeastern part of Teleorman county, in the Friza and Montbeliard breeds. The structure of the herd is as follows: 110 dairy cows, with an average daily production of 30 kg/head/day, live body weight 700 kg; 50 heifers and primiparous heads, live body weight 600 kg, and 40 young heads (0–9 months), average live body weight 200. All categories are bred-free housing, in the same stable, with dimensions of 70 m × 32 m × 9 m (length, width, height), including calves (0–3 months). The animals have no paddock and do not go to pastures at any time of the year.
Figure 2 shows the interior of the farm, where the sensors were mounted.
The monitoring of the farm environment using the IoT infrastructure (including sensors and network devices for data transmission) enables precise environmental data collection. This component transmits data via wireless technologies to the data aggregator associated with the Cloud. The parameters monitored on the farm premises provide structured data relevant for the substantiation of the adoption of business decisions to process optimization at the farm level. The collected data are used to generate models. Therefore, based on simulations and modeling, this service allows the definition of optimal system configurations to maximize the results in the zootechnical field.
On-farm wireless sensors transmit unique information to determine the source of AP emissions and the costs associated with these emissions in the form of taxes. In Figure 3, it can be observed how carefully the IoT devices positioning was chosen so that they do not disturb the everyday activities of the animals.
Specifically, IoT devices are installed in the farm for monitoring key parameters of the stable environment: temperature, humidity, atmospheric pressure, gas sensors (CO, NH3), and PM sensors (PM2.5, PM1, PM10).
From the described setup, we can see the added value of the cloud layer as it was envisioned such that sensors placed in different parts of farms, buildings in a farm, and different farms may transmit their data in a distributed manner. Thus, users may benefit from cloud-based data collection and decision-making services.
Using the EMEP methodology (see Section 5) we use the aggregated sensor readings for generating new information. Examples of the model that can be used and the type of information that can be generated to be used in decision-making by the end-user are shown in Section 5.

5. Comparison between Estimated and Monitored AP Concentrations

This chapter will present the estimation of the air pollutants (AP) concentrations using the EMEP methodology and a short comparison between the estimated and the monitored data.

5.1. AP Concentration Estimated Using EMEP Methodology

The EMEP (The co-operative programme for monitoring and evaluation of the long-range transmission of air pollutants in Europe—unofficially the European Monitoring and Evaluation Programme) 2019 guideline proposes several methods for estimating atmospheric pollutants. Tier 1 is the simplest and refers to multiplying the number of animals by the default emission factor given in the guide. this method was used to estimate the amounts of microscopic powders. Tier 2 of the EMEP guide, used to estimate the ammonia concentration uses specific farm parameters, so that the emission factor is calculated based on the technological particularities and the manure management system, starting from the ration administered to the animals. it is a much more accurate method, compared to method 1, the estimation of emissions comprising all the technological links of manure management (structure and chemical composition of the ration, the percentage of milk fat, the amount of nitrogen ingested and excreted in various manure management systems.
For CO, there are no specific equations in the IPCC or EMEP guidelines, and in our case study, the data refer exclusively to the sensor measurements. Table 3 presents the parameters and equations used for AP emissions.
The farm provided the primary data needed to calculate excreted nitrogen (Nex) (equations 10.32 and 10.33). The rations administrated to all three categories do not fluctuate during the year but are different depending on the animal’s age and the category of exploitation.
When calculating the caloricity of the energy gross intake of each recipe or ration, the following equivalences were considered [36] (p. 114):
1 g crude protein = 5.72 kcal;
1 g crude fat = 9.5 kcal;
1 g crude fibers = 4.79 kcal;
1 g SEN (non-nitrate extractable substances) = 4.17 kcal.
The GE calculation formula [36] is (p. 131):
GE (kcal/kg) = 5.72∙GP + 9.5∙GB + 4.79∙CelB + 4.17∙SEN
where:
GE = gross energy intake;
GP = crude protein;
GB = crude fat;
CelB = crude fibers;
SEN = non-nitrate extractable substances
The rations were established according to the equation above, and the values of crude protein, crude fat, crude fibers, and non-nitrate extractable substances were taken from the tables with the feed chemical composition [36] (pp. 513–517). In these tables, the value of these nutrients is expressed as a percentage (for 100 g, for example), so that, in the calculation of ratios and recipes, we multiplied the values by 10 to express the caloricity for 1 kg (to comply with the requirements of the IPCC 2019 on the energy expression in MJ/kg).
The total value of the ration, expressed in kcal, was divided by 239 in order to obtain the equivalence in MJ (Mega Joules).
The equivalence relations are as follows [36] (p. 114):
1 MJ = 239 kcal,
where:
MJ = megajoule and Kcal = kilocalorie
For each feed category, the values of crude protein, crude fat, crude fibers and non-nitrate extractable substances are included in a table [36] (pp. 513–517); these table values are multiplied by the caloricity specific to each nutrient (5.72 kcal for 1 g of crude protein, etc.), followed by the adding of the caloricity of each nutrient and the achievement of the respective forage caloricity. This value is multiplied by the number of feed kilograms specified in the ration. Table 4 presented the specific parameters used for the calculation of ammonia emissions.
The percent of crude protein in dry matter (CP%) was calculated based on the chemical composition of each feed and then multiplied by the proportion of feed in the total ratio.
As it is known from the practice of animal husbandry and the literature, ammonia is a strong air pollutant. It significantly affects the health status of cows, but also human health. As a result of these effects, in most European countries, the maximum allowable limit is 25 ppm over 8 h, except for Sweden, which accepts a maximum of 10 ppm [37] (pp. 79–95) The report of the Climatization of Animal Houses (1984) [38] (p. 72) working group recommends that the maximum admissibility limit of the ammonia concentration inside the stables be 20 ppm, above this value the concentrations affecting the health status of the animals. The results obtained in our study were significantly lower than the technological recommendations, but similar to those obtained in another research. A distinction must also be made between the data recorded by sensors inside the stable, which are effectively related to animal welfare issues and the results obtained from estimating emissions based on IPCC equations related to air pollution. The actions following the two investigations will go in two different directions.
For better data analysis and improved decision support, we used Grafana (https://grafana.com/) (accessed on 7 July 2021) for monitoring our station (FARM1). The Grafana dashboard is shown in Figure 4.
Table 5 and Table 6 present the estimated emissions of ammonia (t NH3/year) and dust (kg PM/year). EMEP methodology does not contain estimated concentrations for PM 1, that is why they are not included in Table 6.
The analysis of the presented data obtained in the case of ammonia reveals the existence of a pattern, respectively, increases in ammonia concentration during the night, when the stable is closed and without activity inside it and significant decreases during the day, starting from the first hour of the morning, when specific activities begin: disposal of manure, feeding, milking, etc. These activities also contribute to lowering humidity, increasing the speed of air currents, ultimately reducing the concentration of ammonia. From the comparative analysis of the graphs, it can be seen that an increase in temperature inside the stable contributes to the increase in humidity and implicitly to higher concentrations of ammonia. From the point of view of ensuring the welfare of dairy cows, the farm where this study was undertaken strictly respects the technology, the stable being adequate in terms of ventilation, this being observable during the night where, even in the absence of intense activities, the concentration of ammonia does not approach the maximum allowable limits. Our study was conducted during the winter when, due to low outside temperatures, ventilation in the stable was significantly reduced by closing the doors and lowering the tarpaulins (curtains) that make up the longitudinal walls.
Inside the cow shelter, the concentration of ammonia is a function of the corroborated action of several factors: the type of stable, its volume, the ventilation system (natural, artificial, or a combination of the two), animal density, animal maintenance system (individually or in collective boxes), manure management (frequency of their removal from the shelter), season, air current speed, air humidity, etc., [39], [40,41] (pp. 3–9, pp. 577–584).
Ventilation rate is an important factor in ensuring animal welfare. Depending on this, the other microclimate parameters are regulated inside the shelter, respectively, the humidity and the concentration of harmful gases. High humidity caused by inadequate ventilation causes ammonia to accumulate, which will cause pathologies that will lead to decreased milk production and even increased mortality [42,43,44] (pp. 89–99, pp. 139–147, pp. 109–119).
Similar to the results obtained in the present paper, Simsek et al. (2012) [45] (pp. 2116–2120) find a high concentration of ammonia inside the stable in the time interval 00.00–02.00, as a consequence of the reduction in air currents and low activity of the animals. The ammonia concentration decreases significantly in the middle of the day, between 12.00 and 14.00; in our study, this interval being higher, respectively, between 08.00 and 17.00. This fact is also confirmed by the results obtained by Kang and Lee (2008) [46] (pp. 2132–2141), who points out that during periods when the ventilation inside the stable is low, there is a deterioration in air quality, a situation which, in our case, would correspond to the night period. Osario et al. (2009) [42] (pp. 89–99) point out the same thing, namely a decrease in air quality when the stable is closed.
During the night, when the technological activity is stopped, the activity of the animals is reduced and the stable closed, the indoor temperature increases, due to the biological heat, the humidity also increases, consequently increases in ammonia concentration will be registered. Zhao et al. (2007) [47] (pp. 339–346) and Harper et al. (2009) [48] (pp. 2326–2337) claiming the correlation between increasing temperature and increasing ammonia emissions. This increase in emissions can be explained by the increase in urease activity at high temperatures, which causes higher ammonia emissions [49] (pp. 2579–2587).
The AP concentrations above were estimated starting from rations calculated using relations in [35] and by using the EMEP methodology [50].

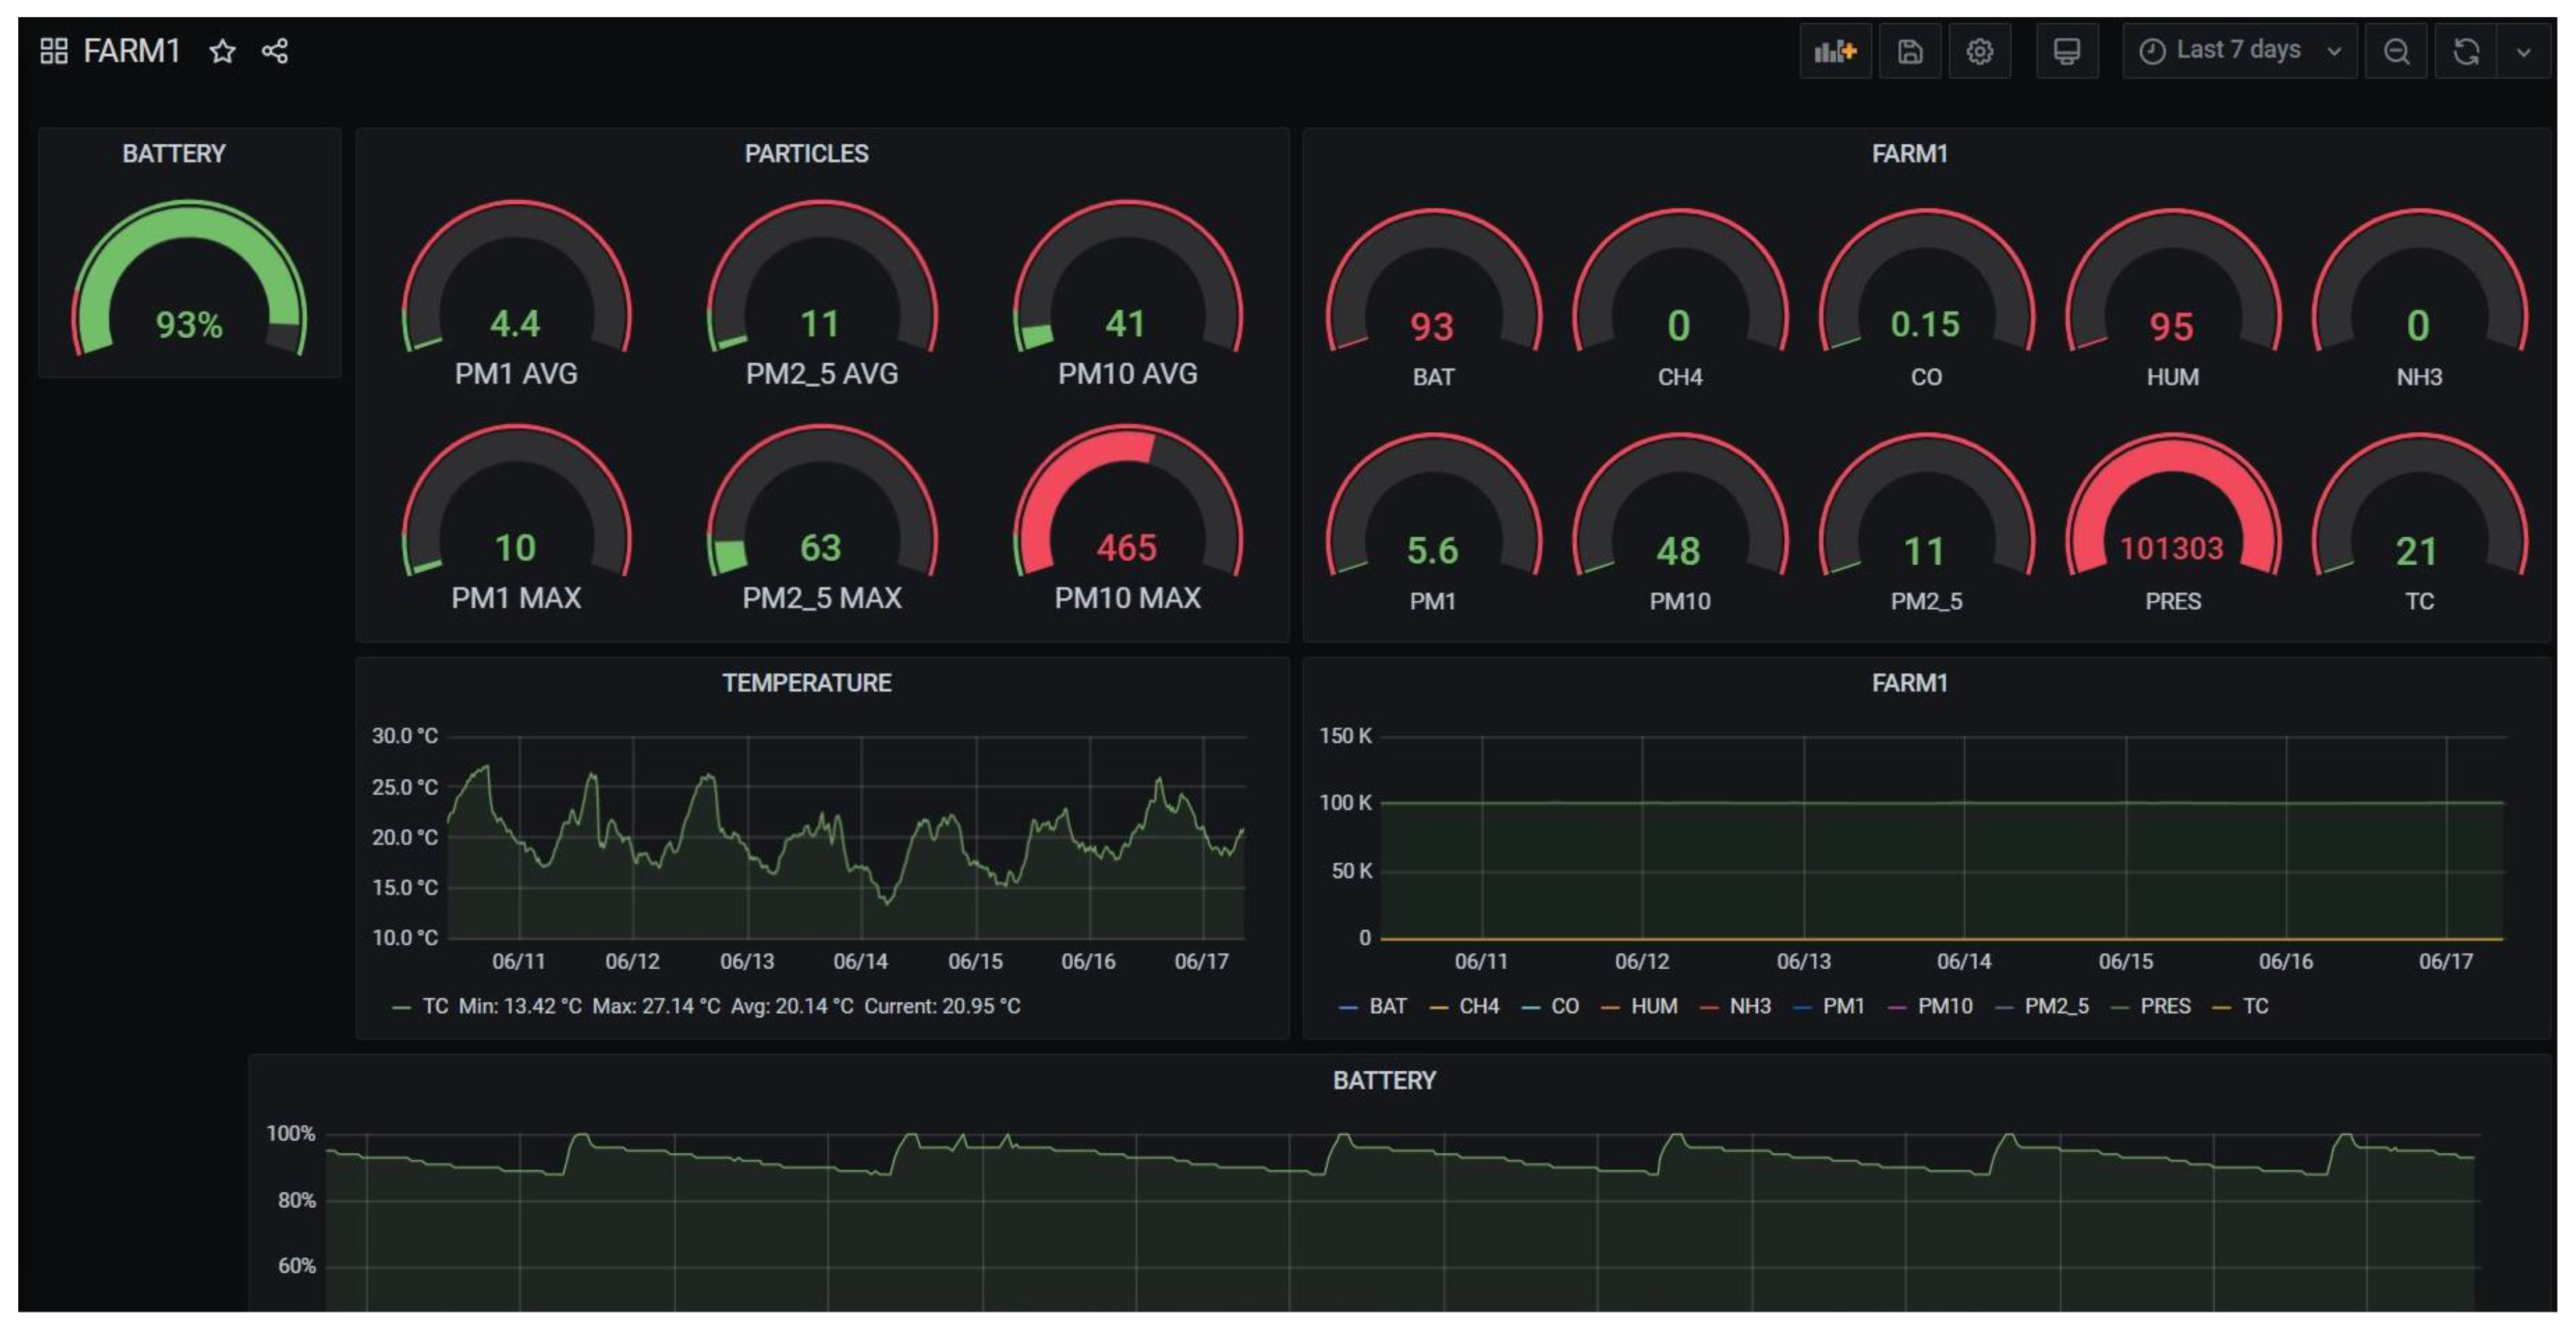
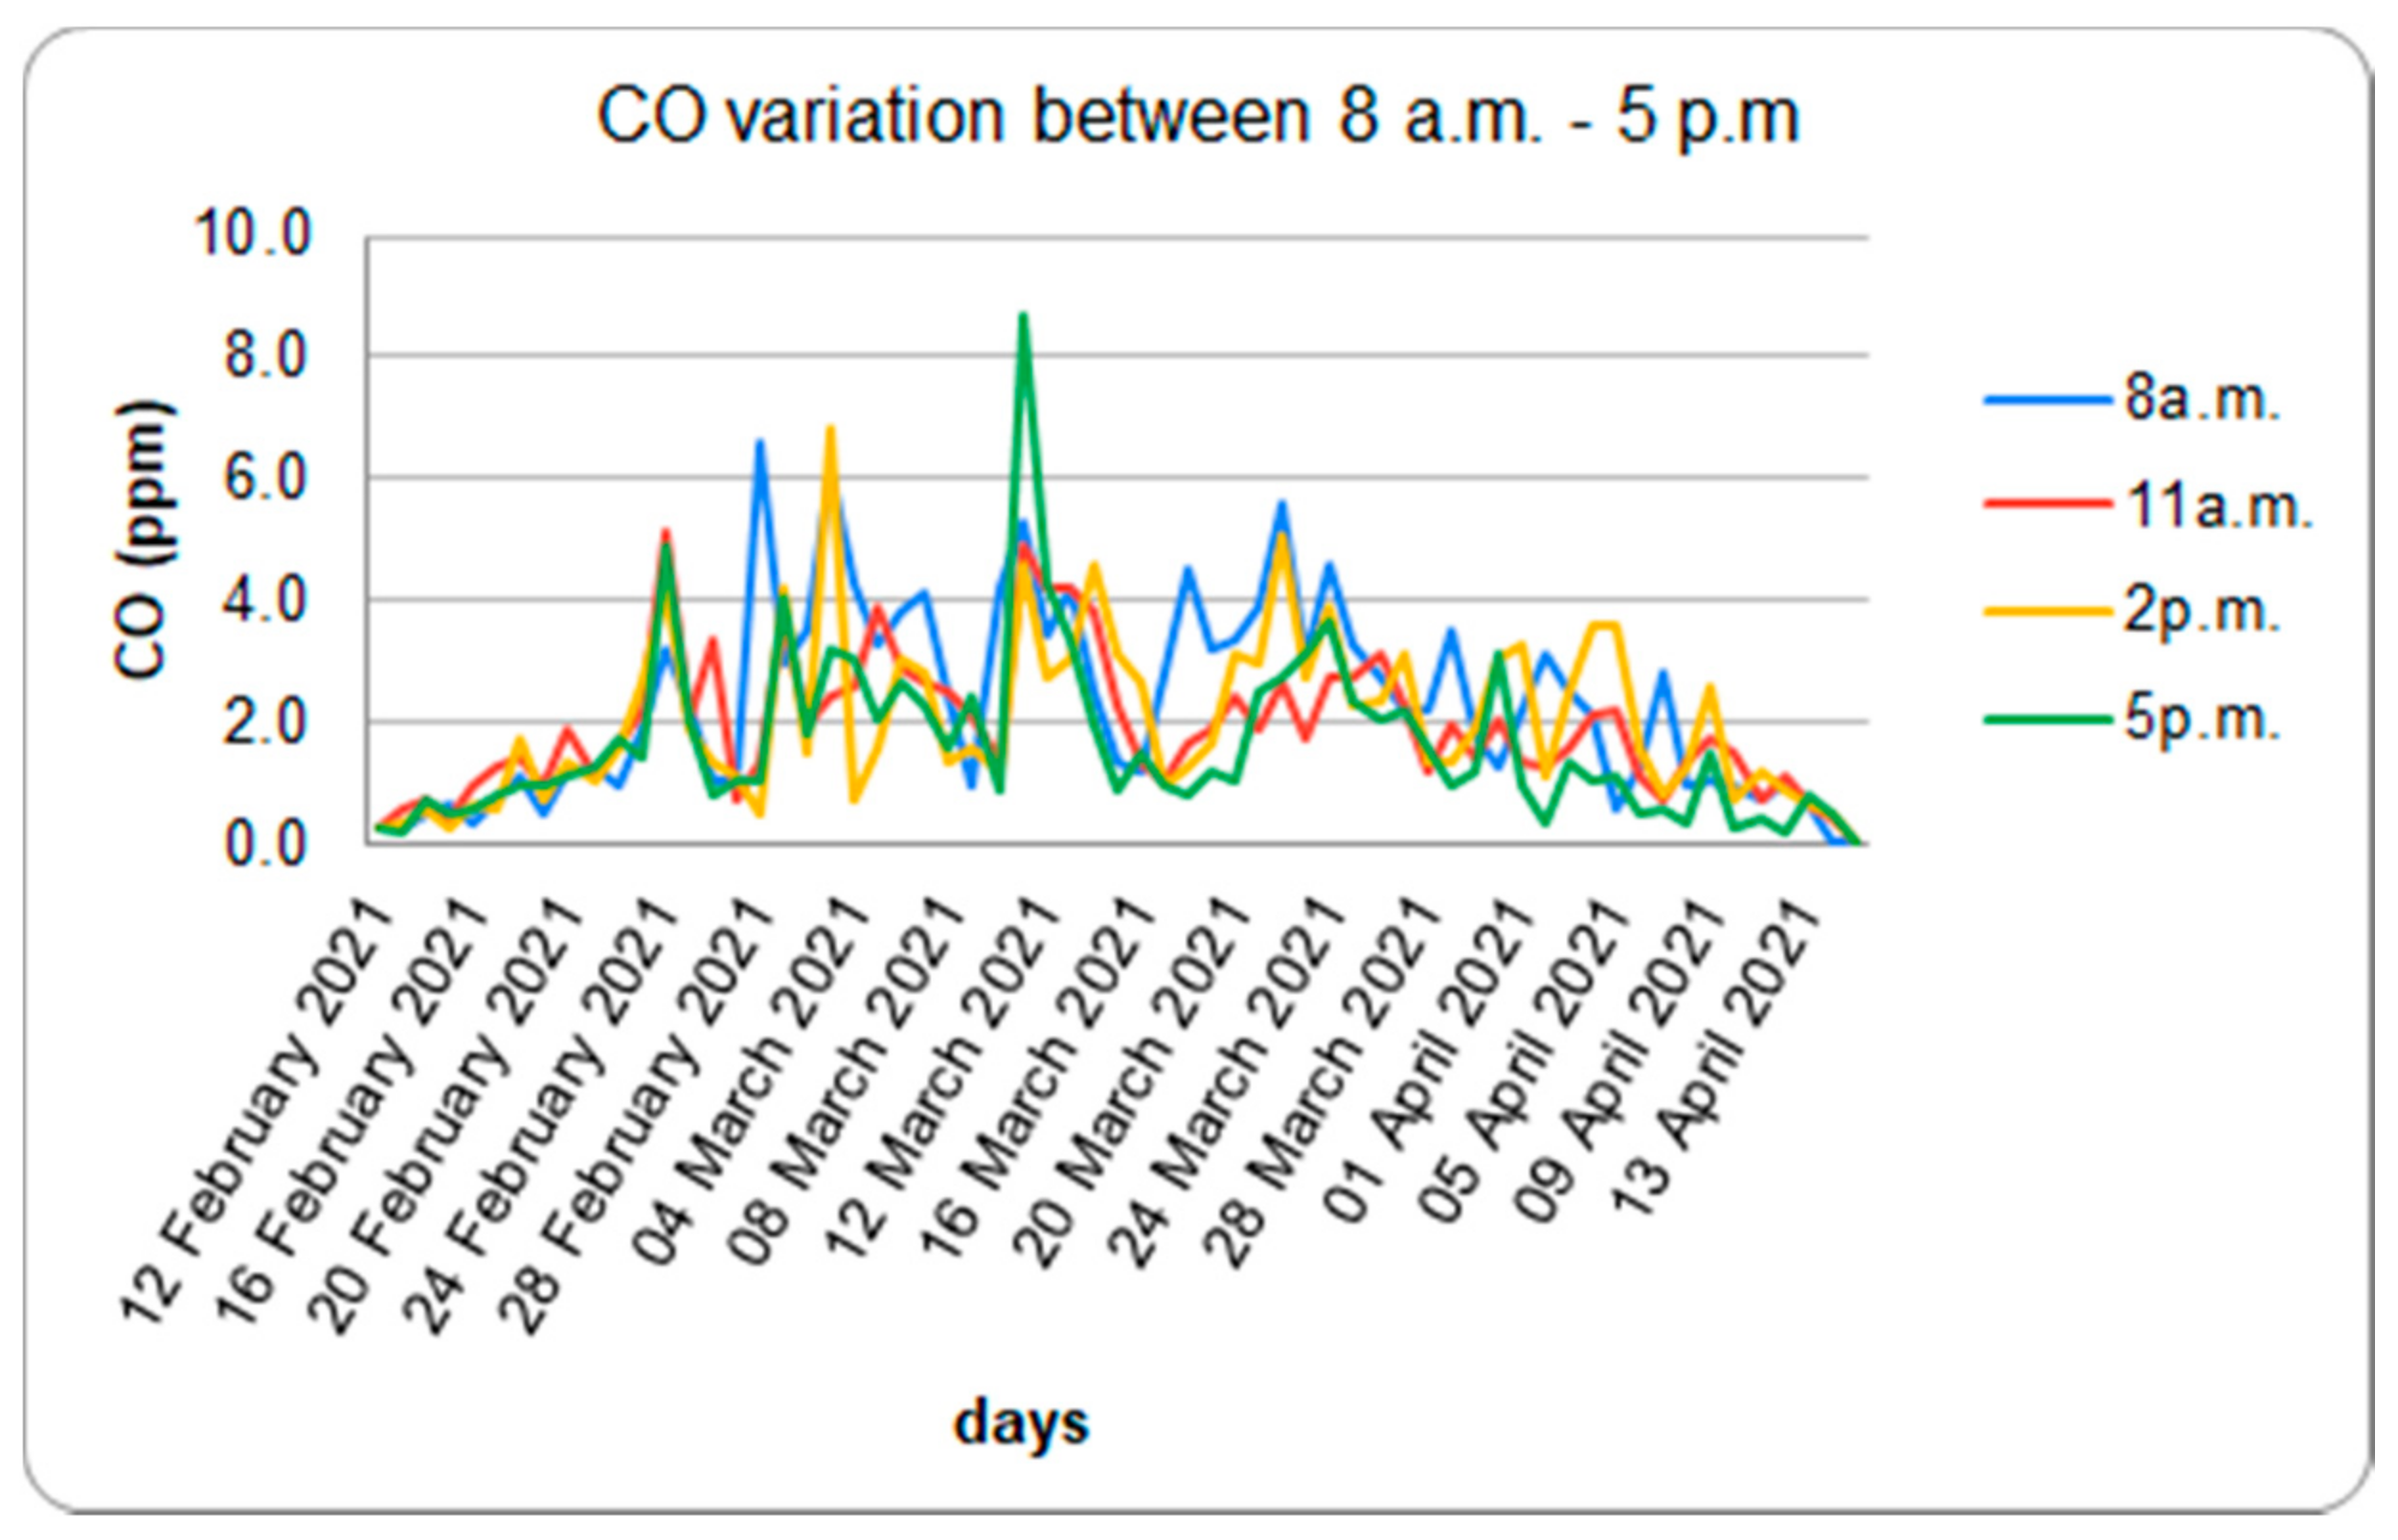
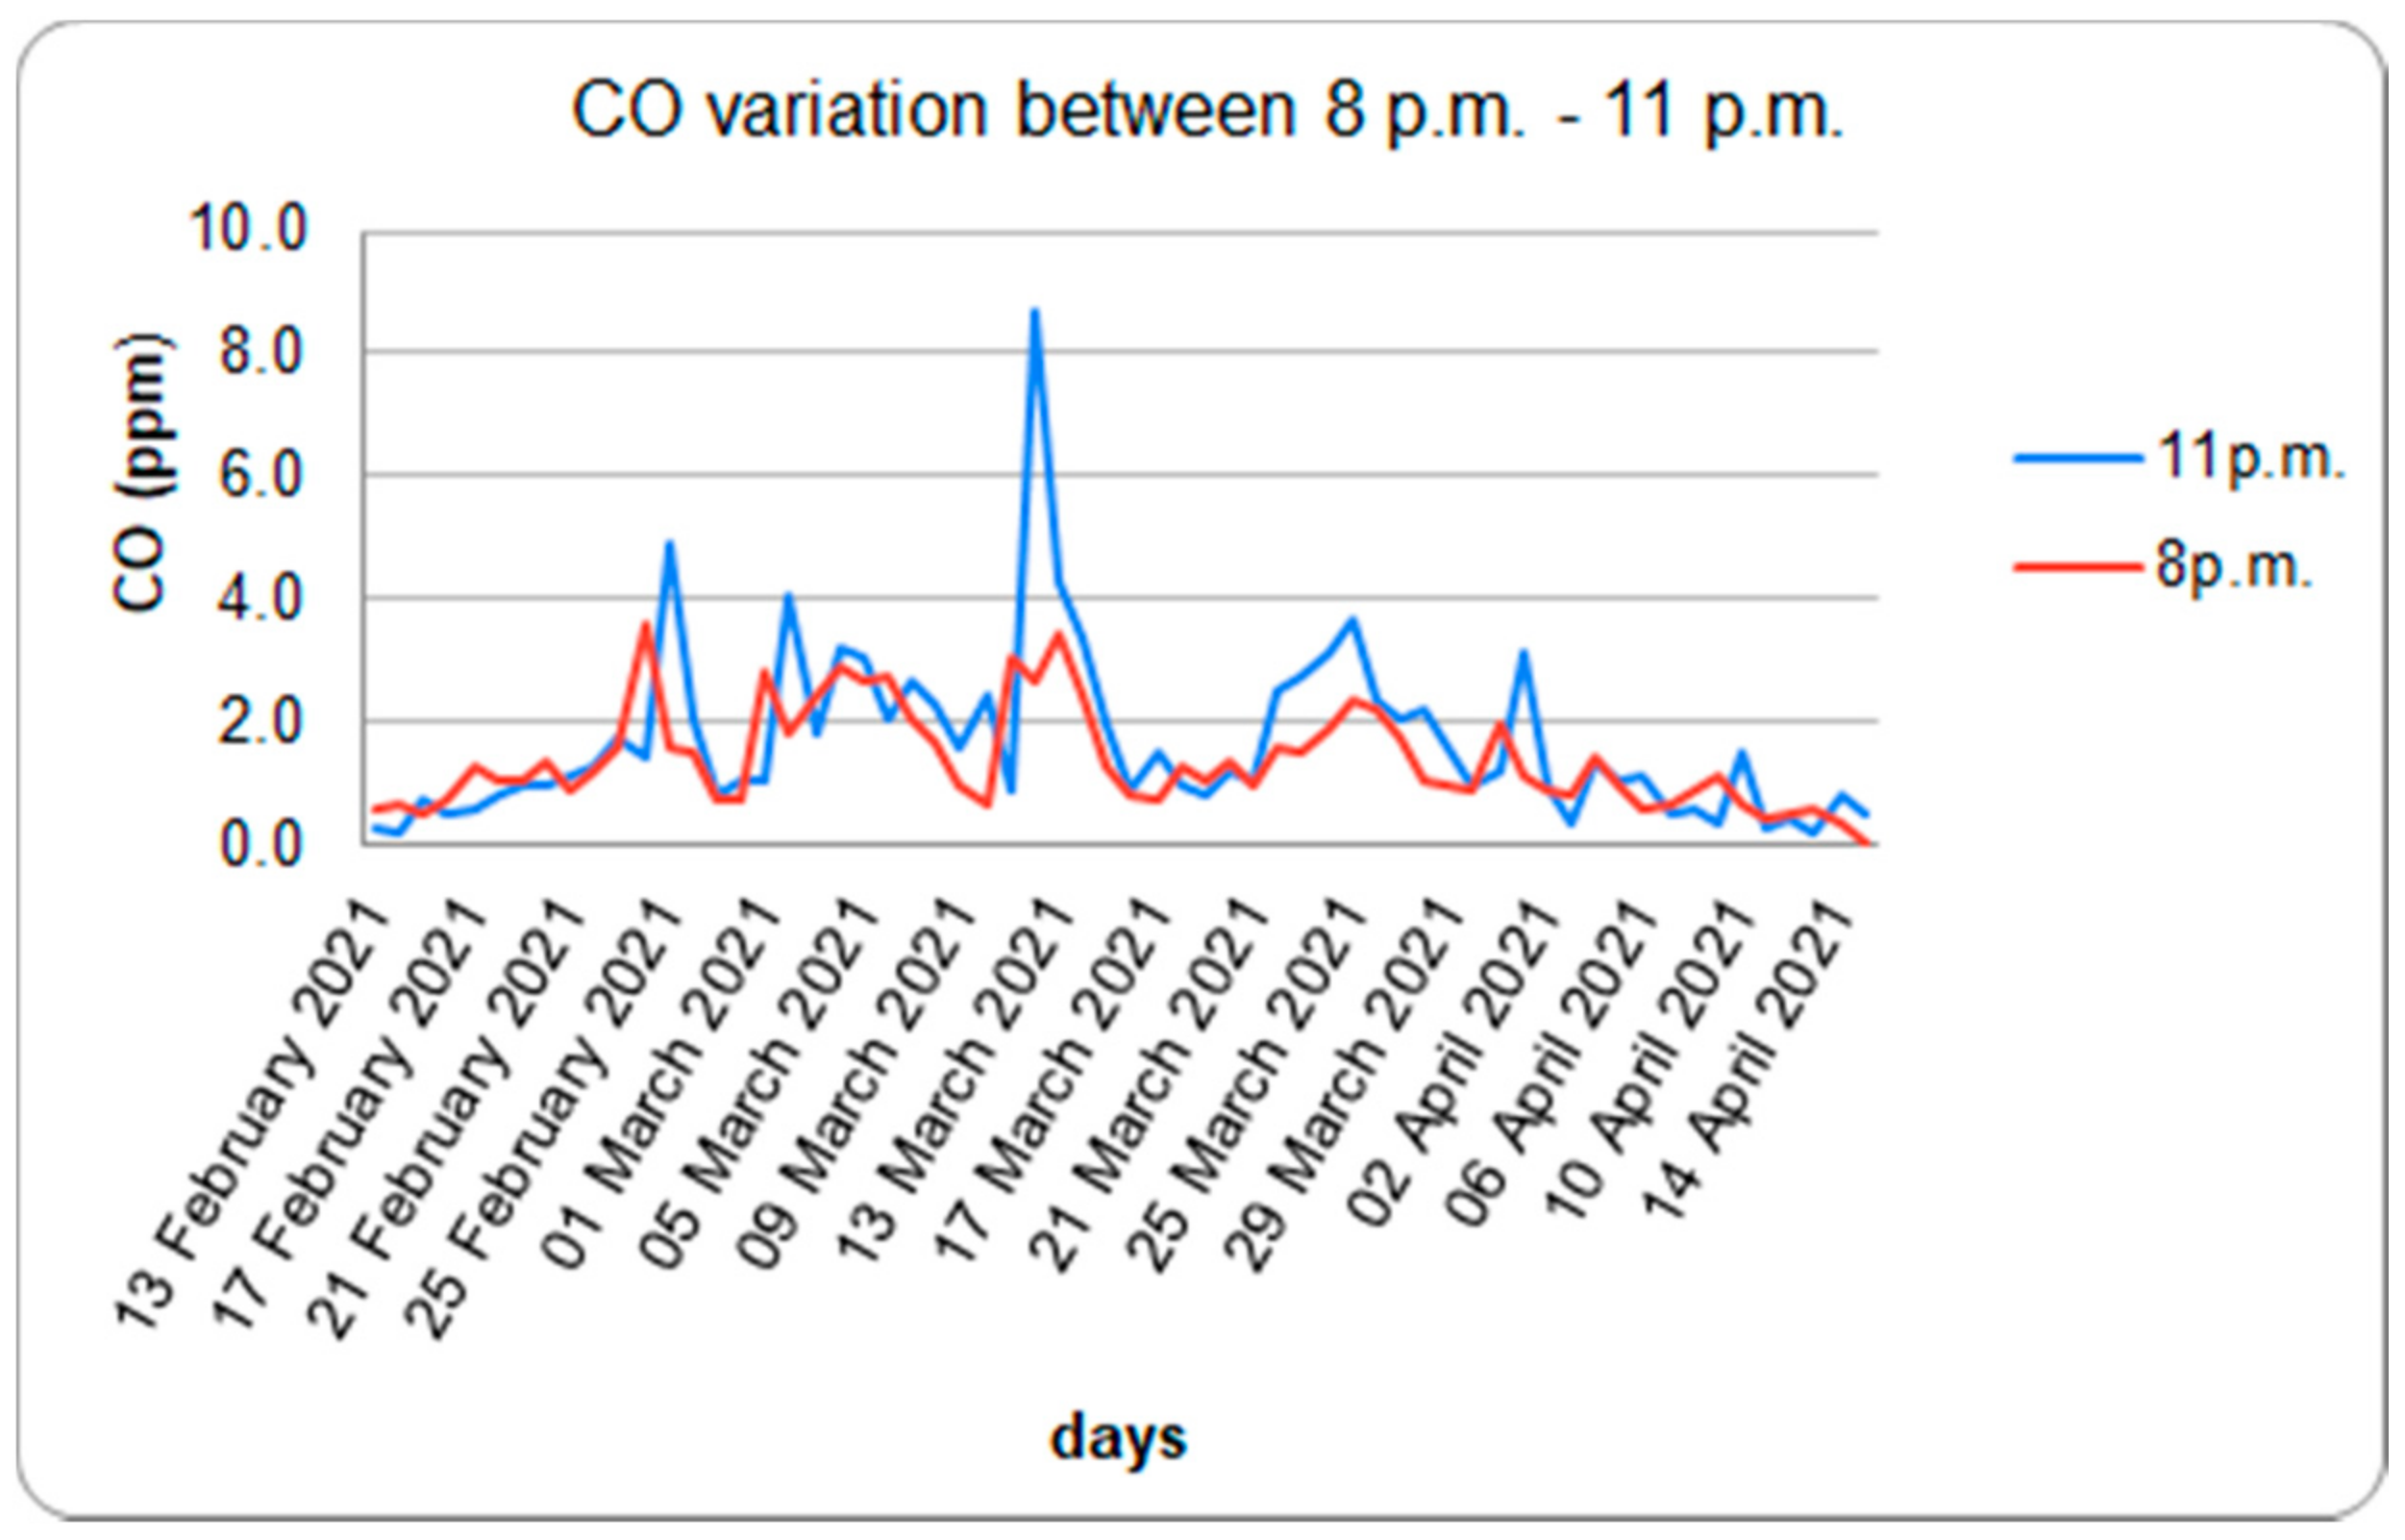
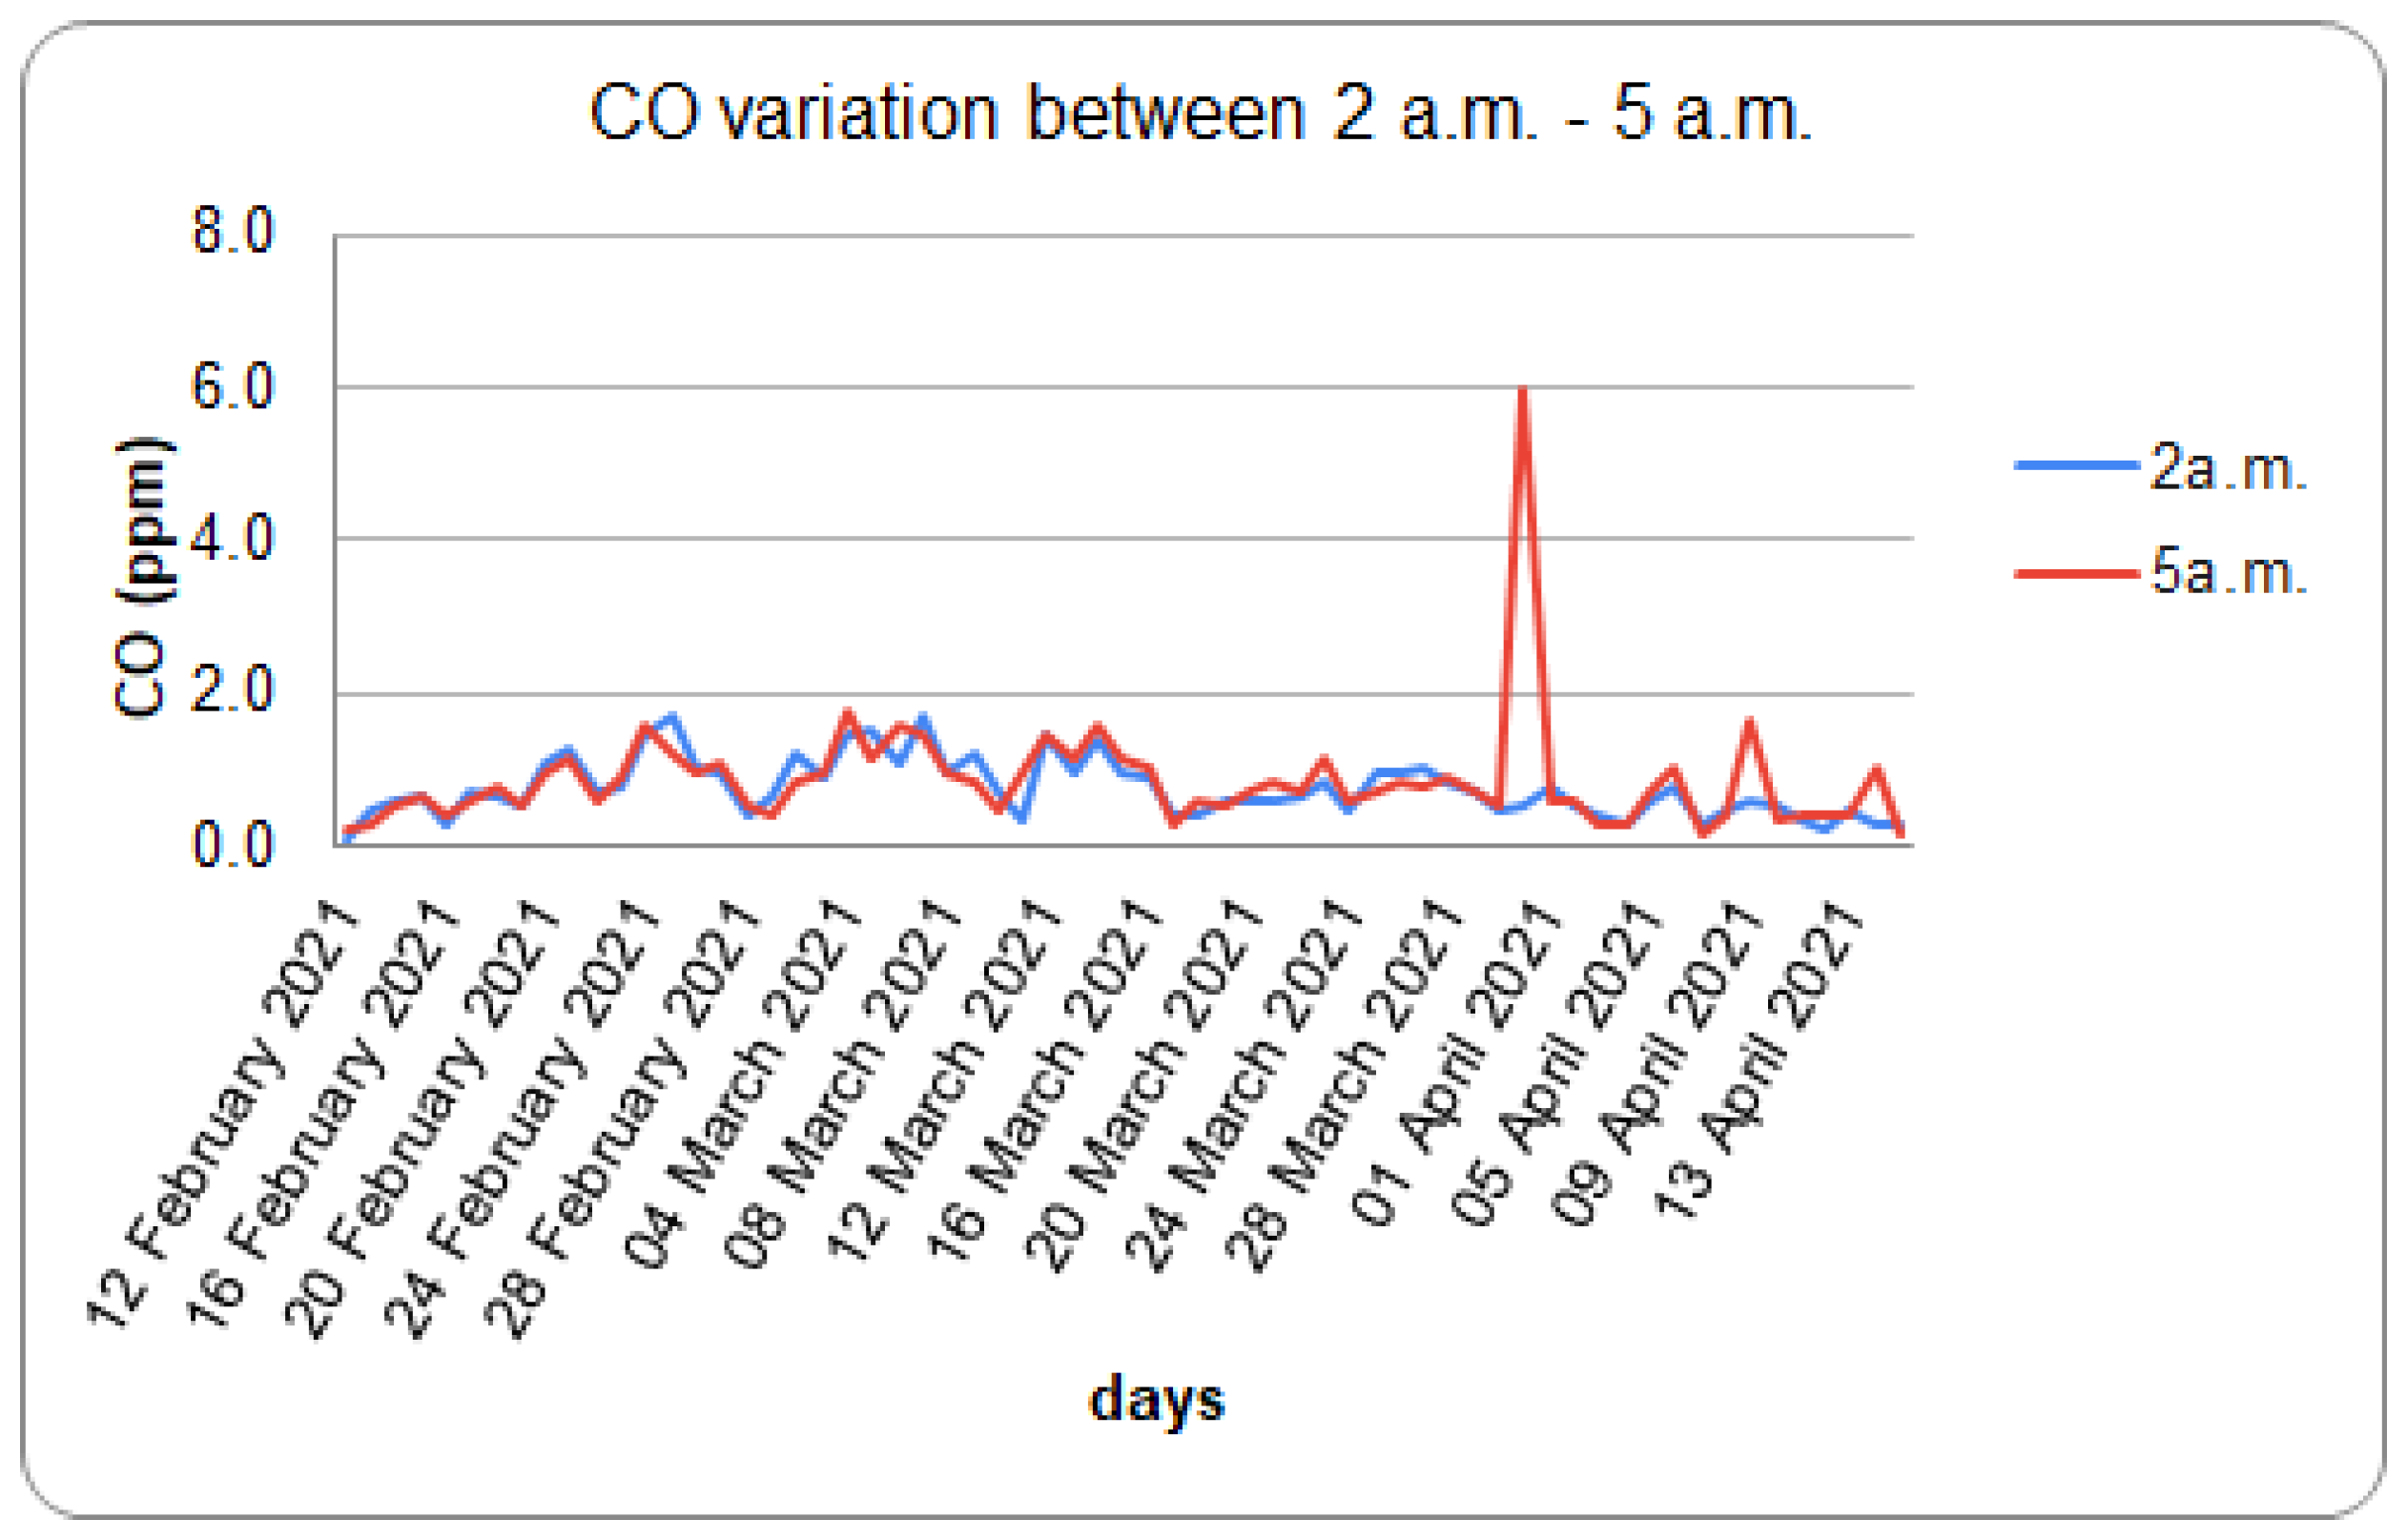
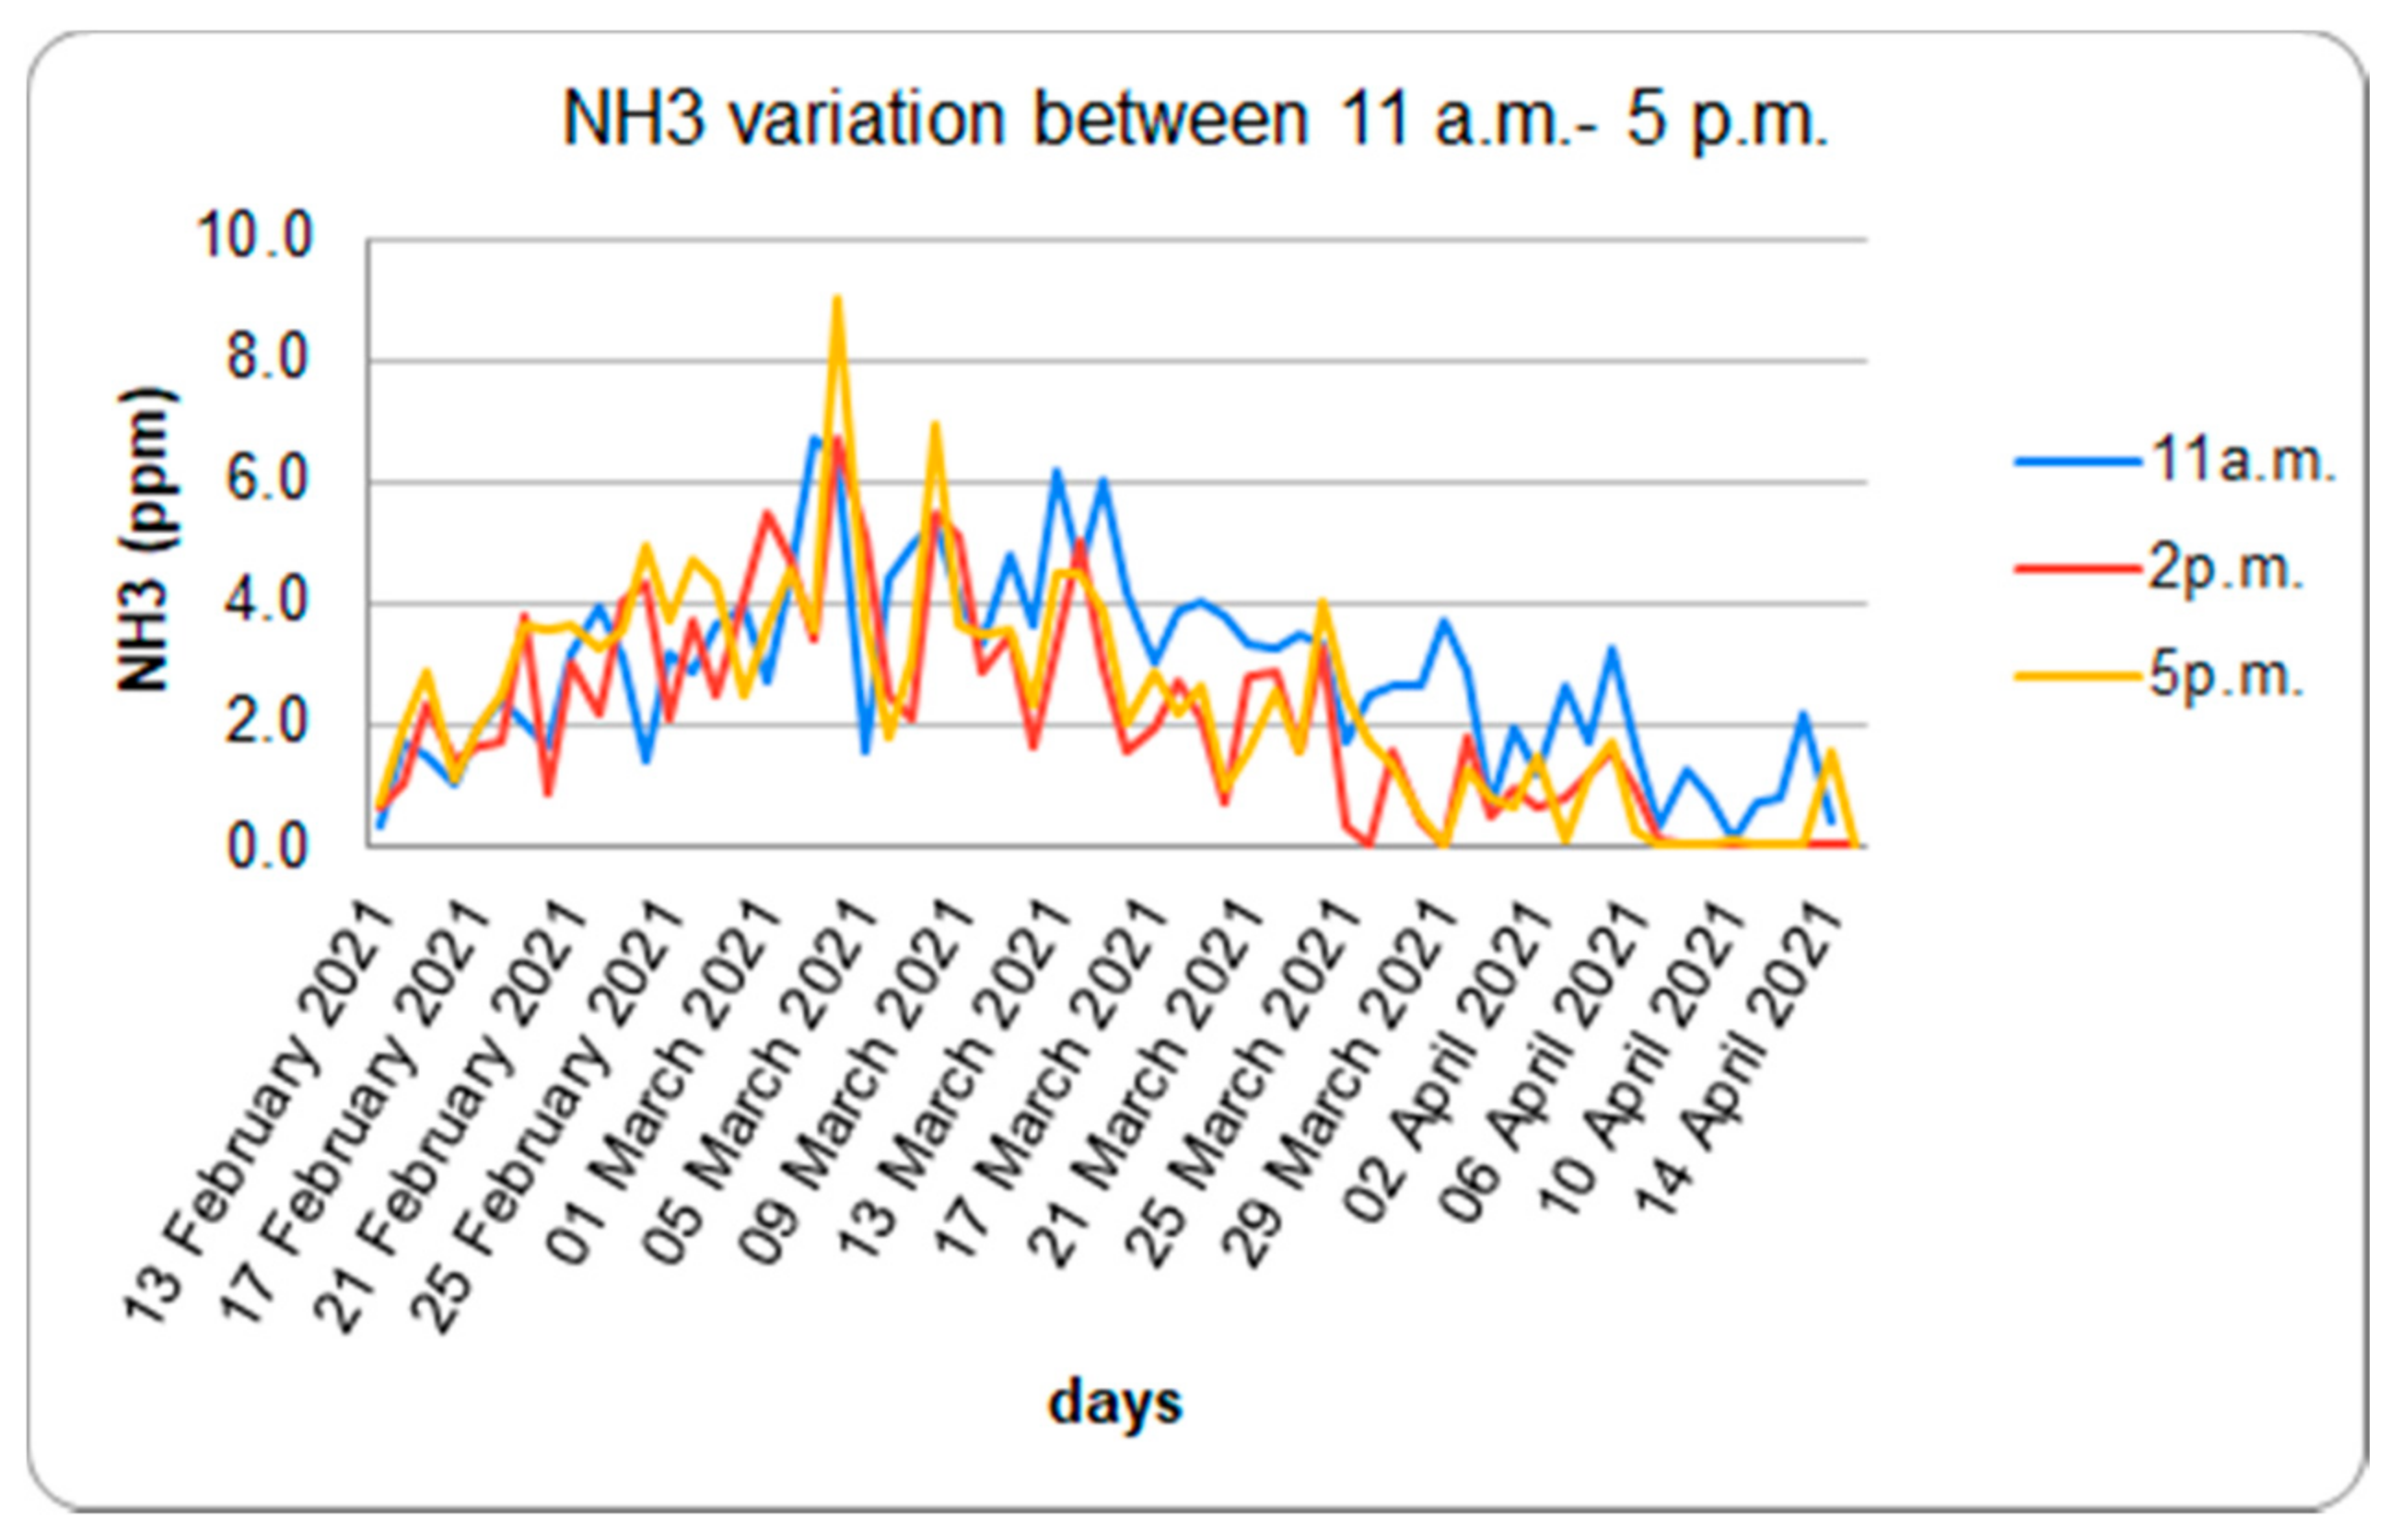
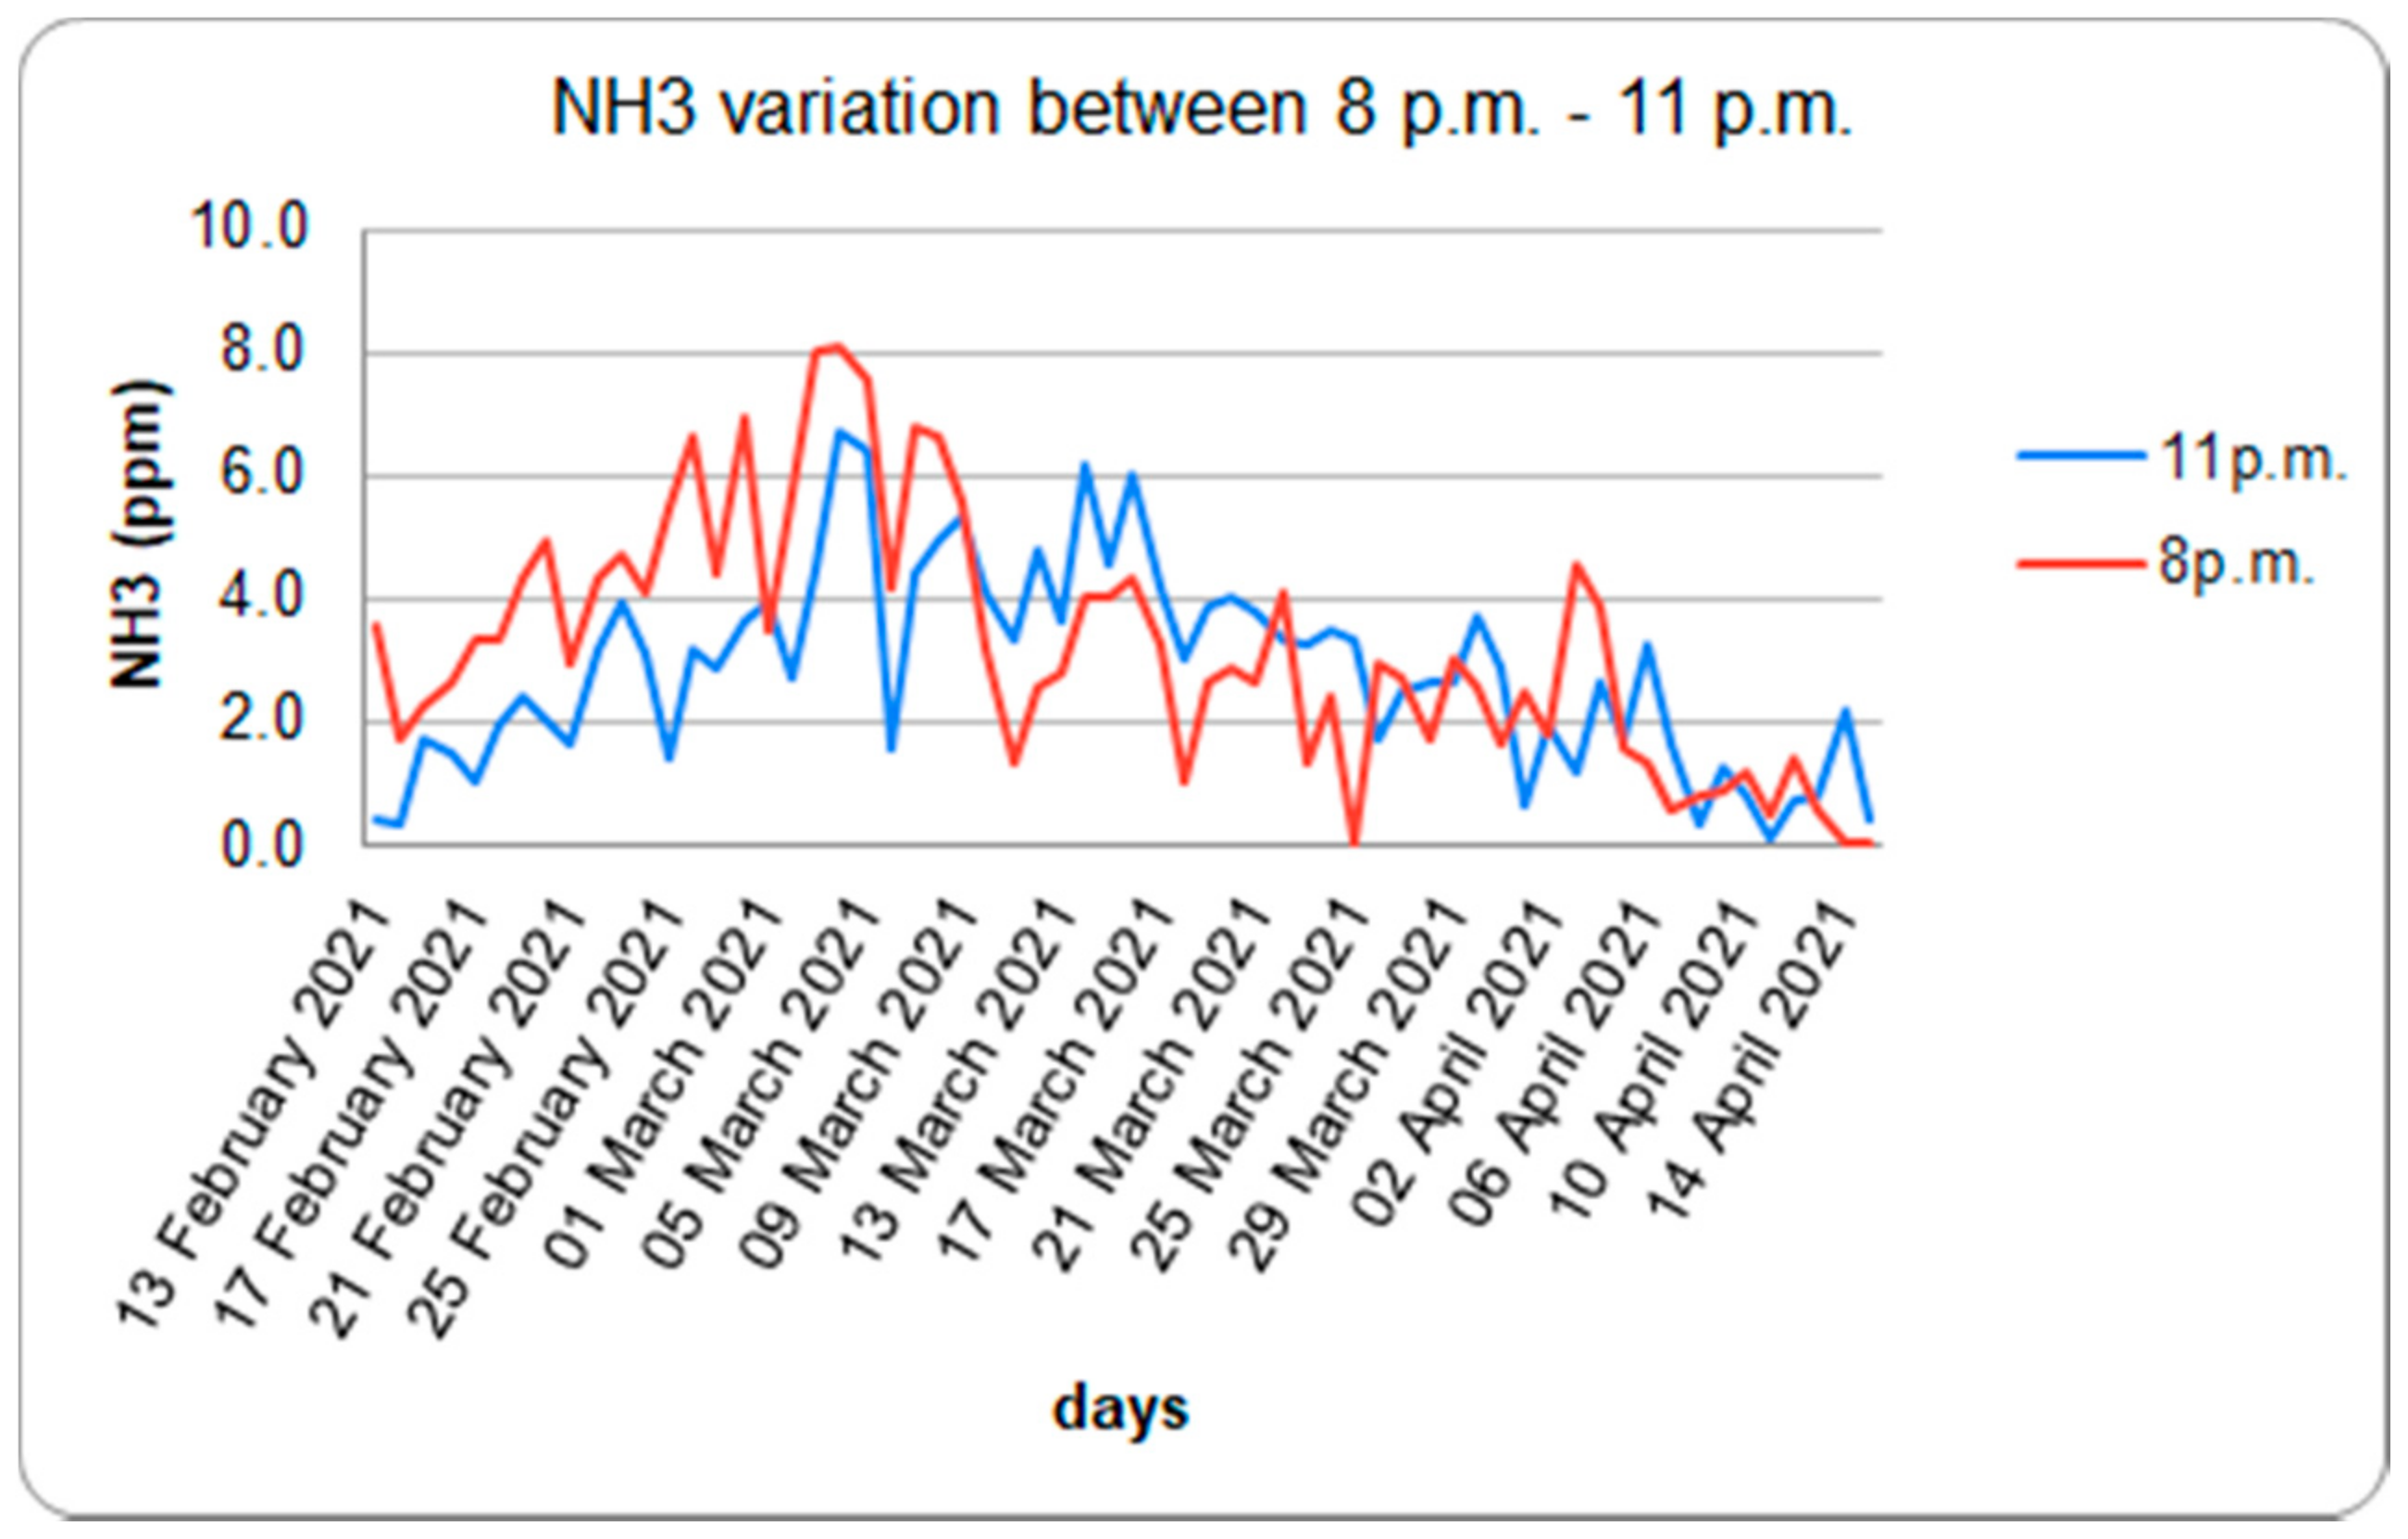
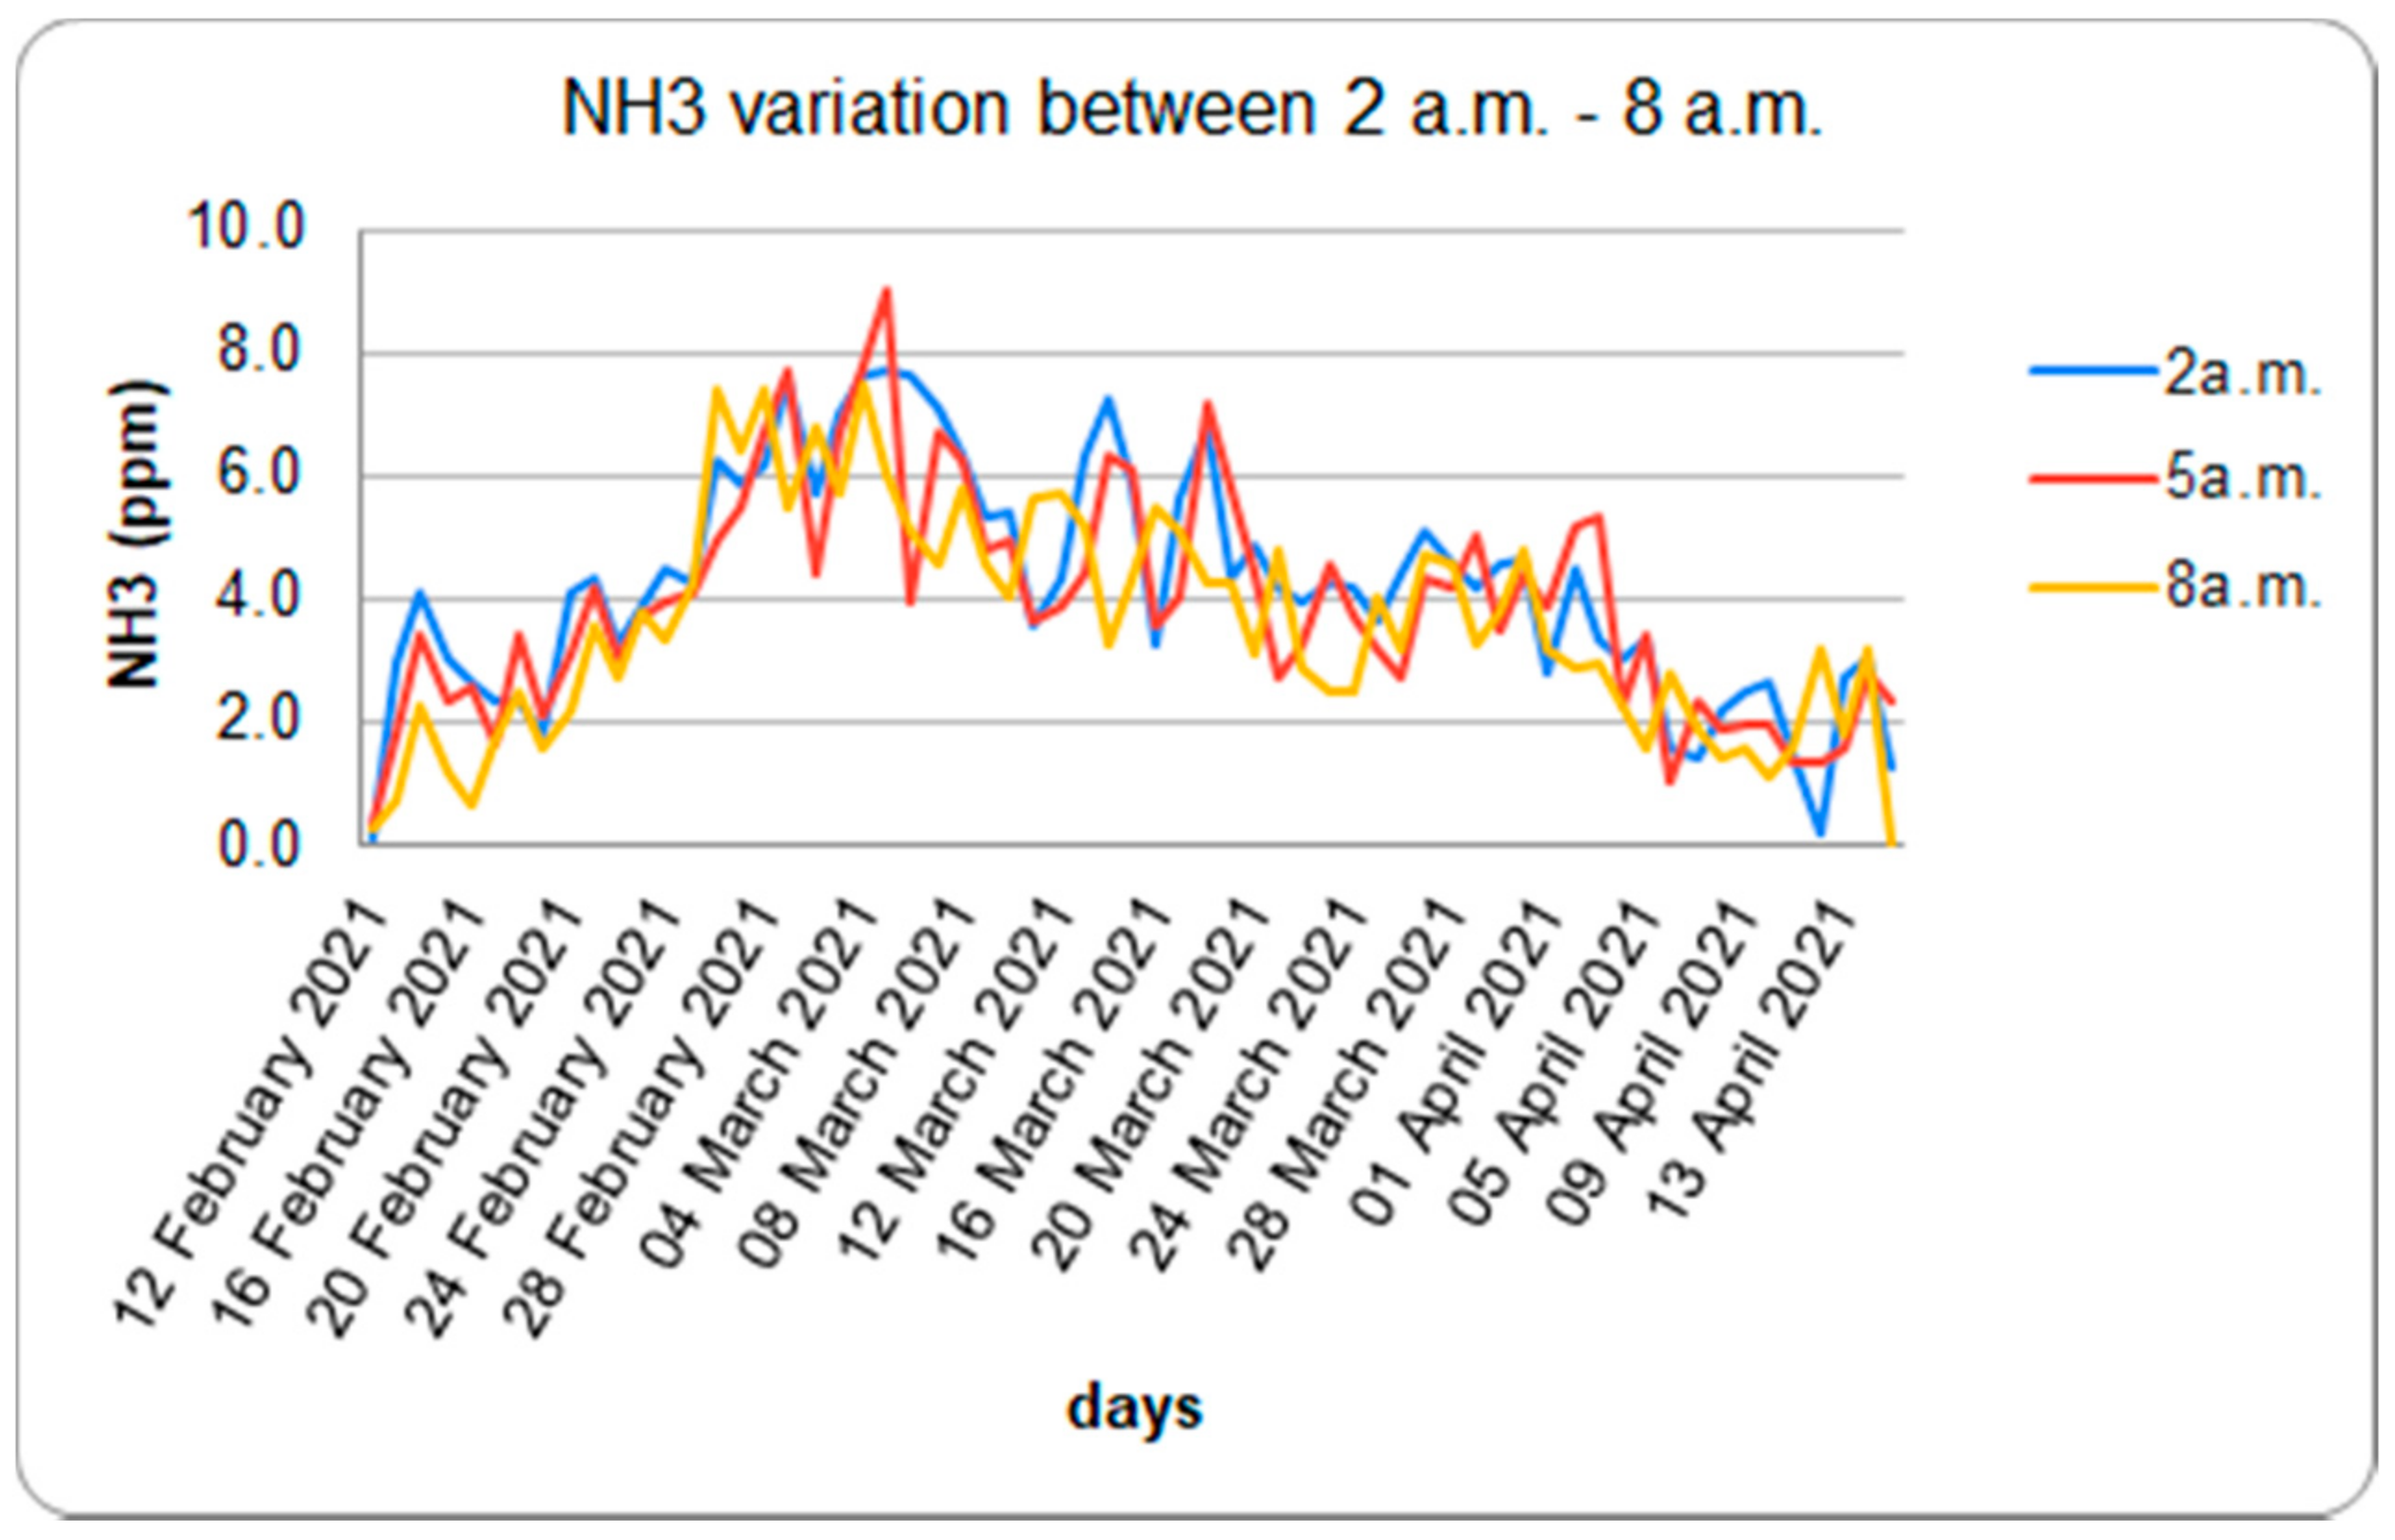
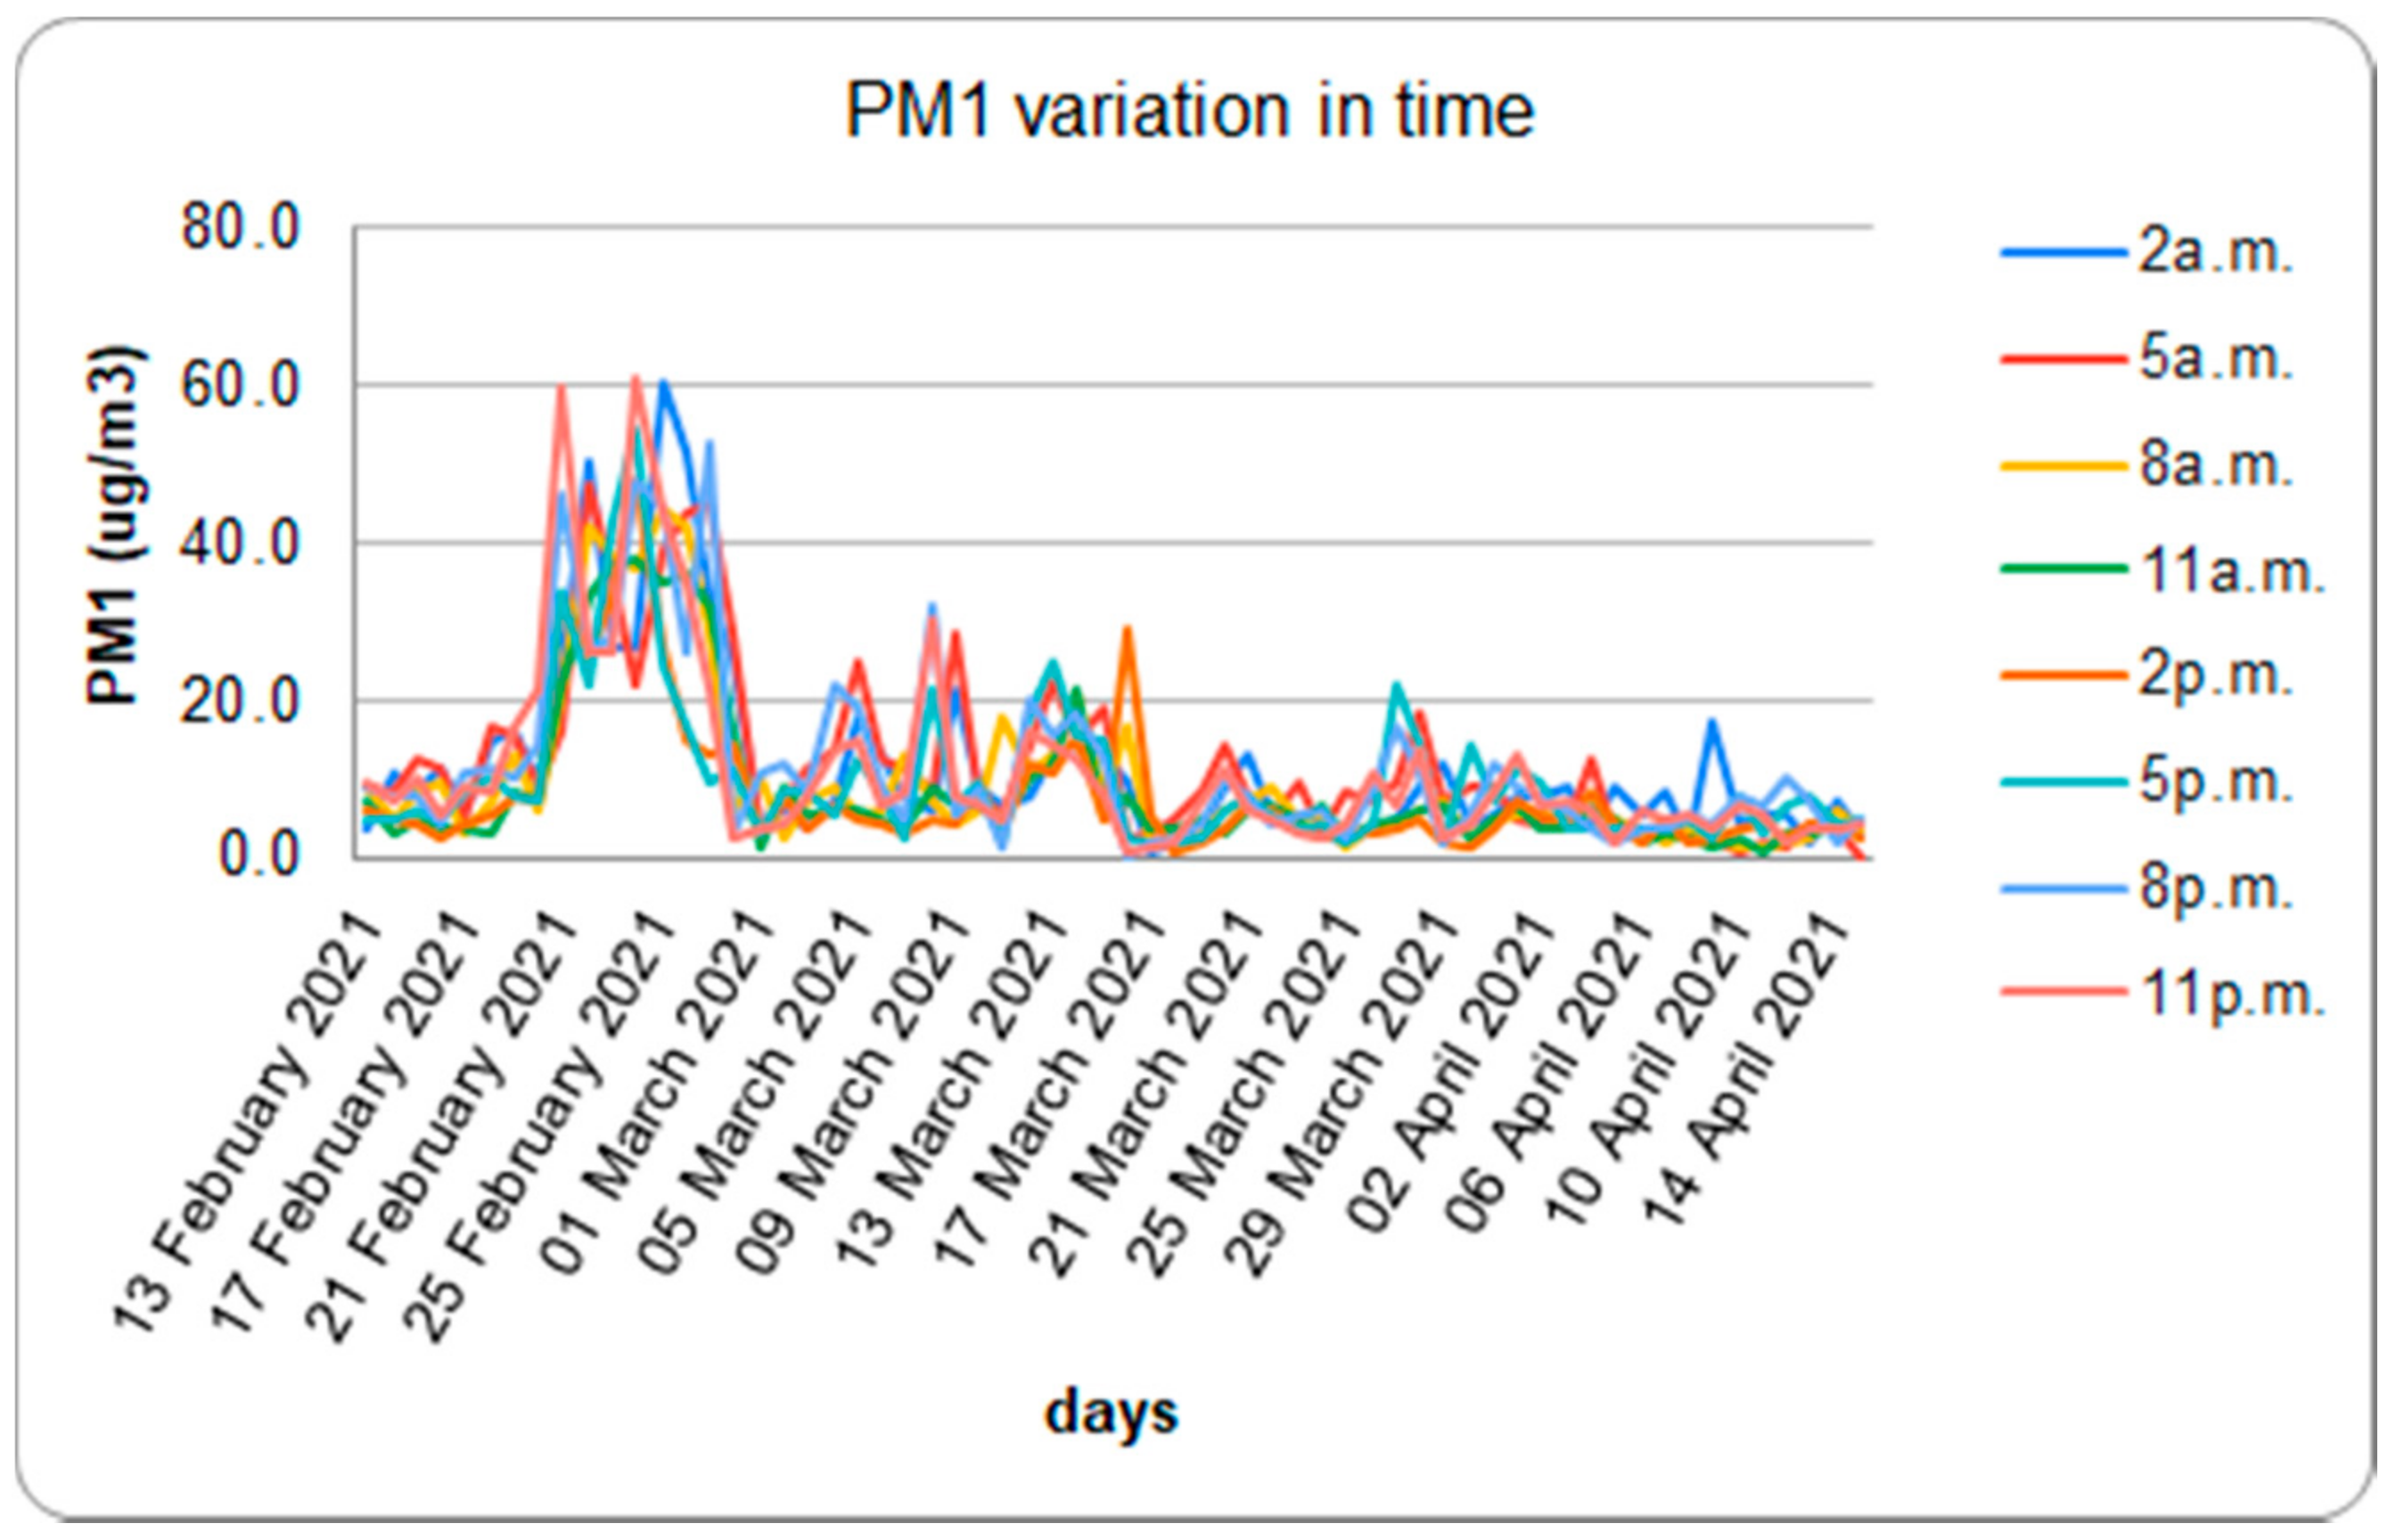
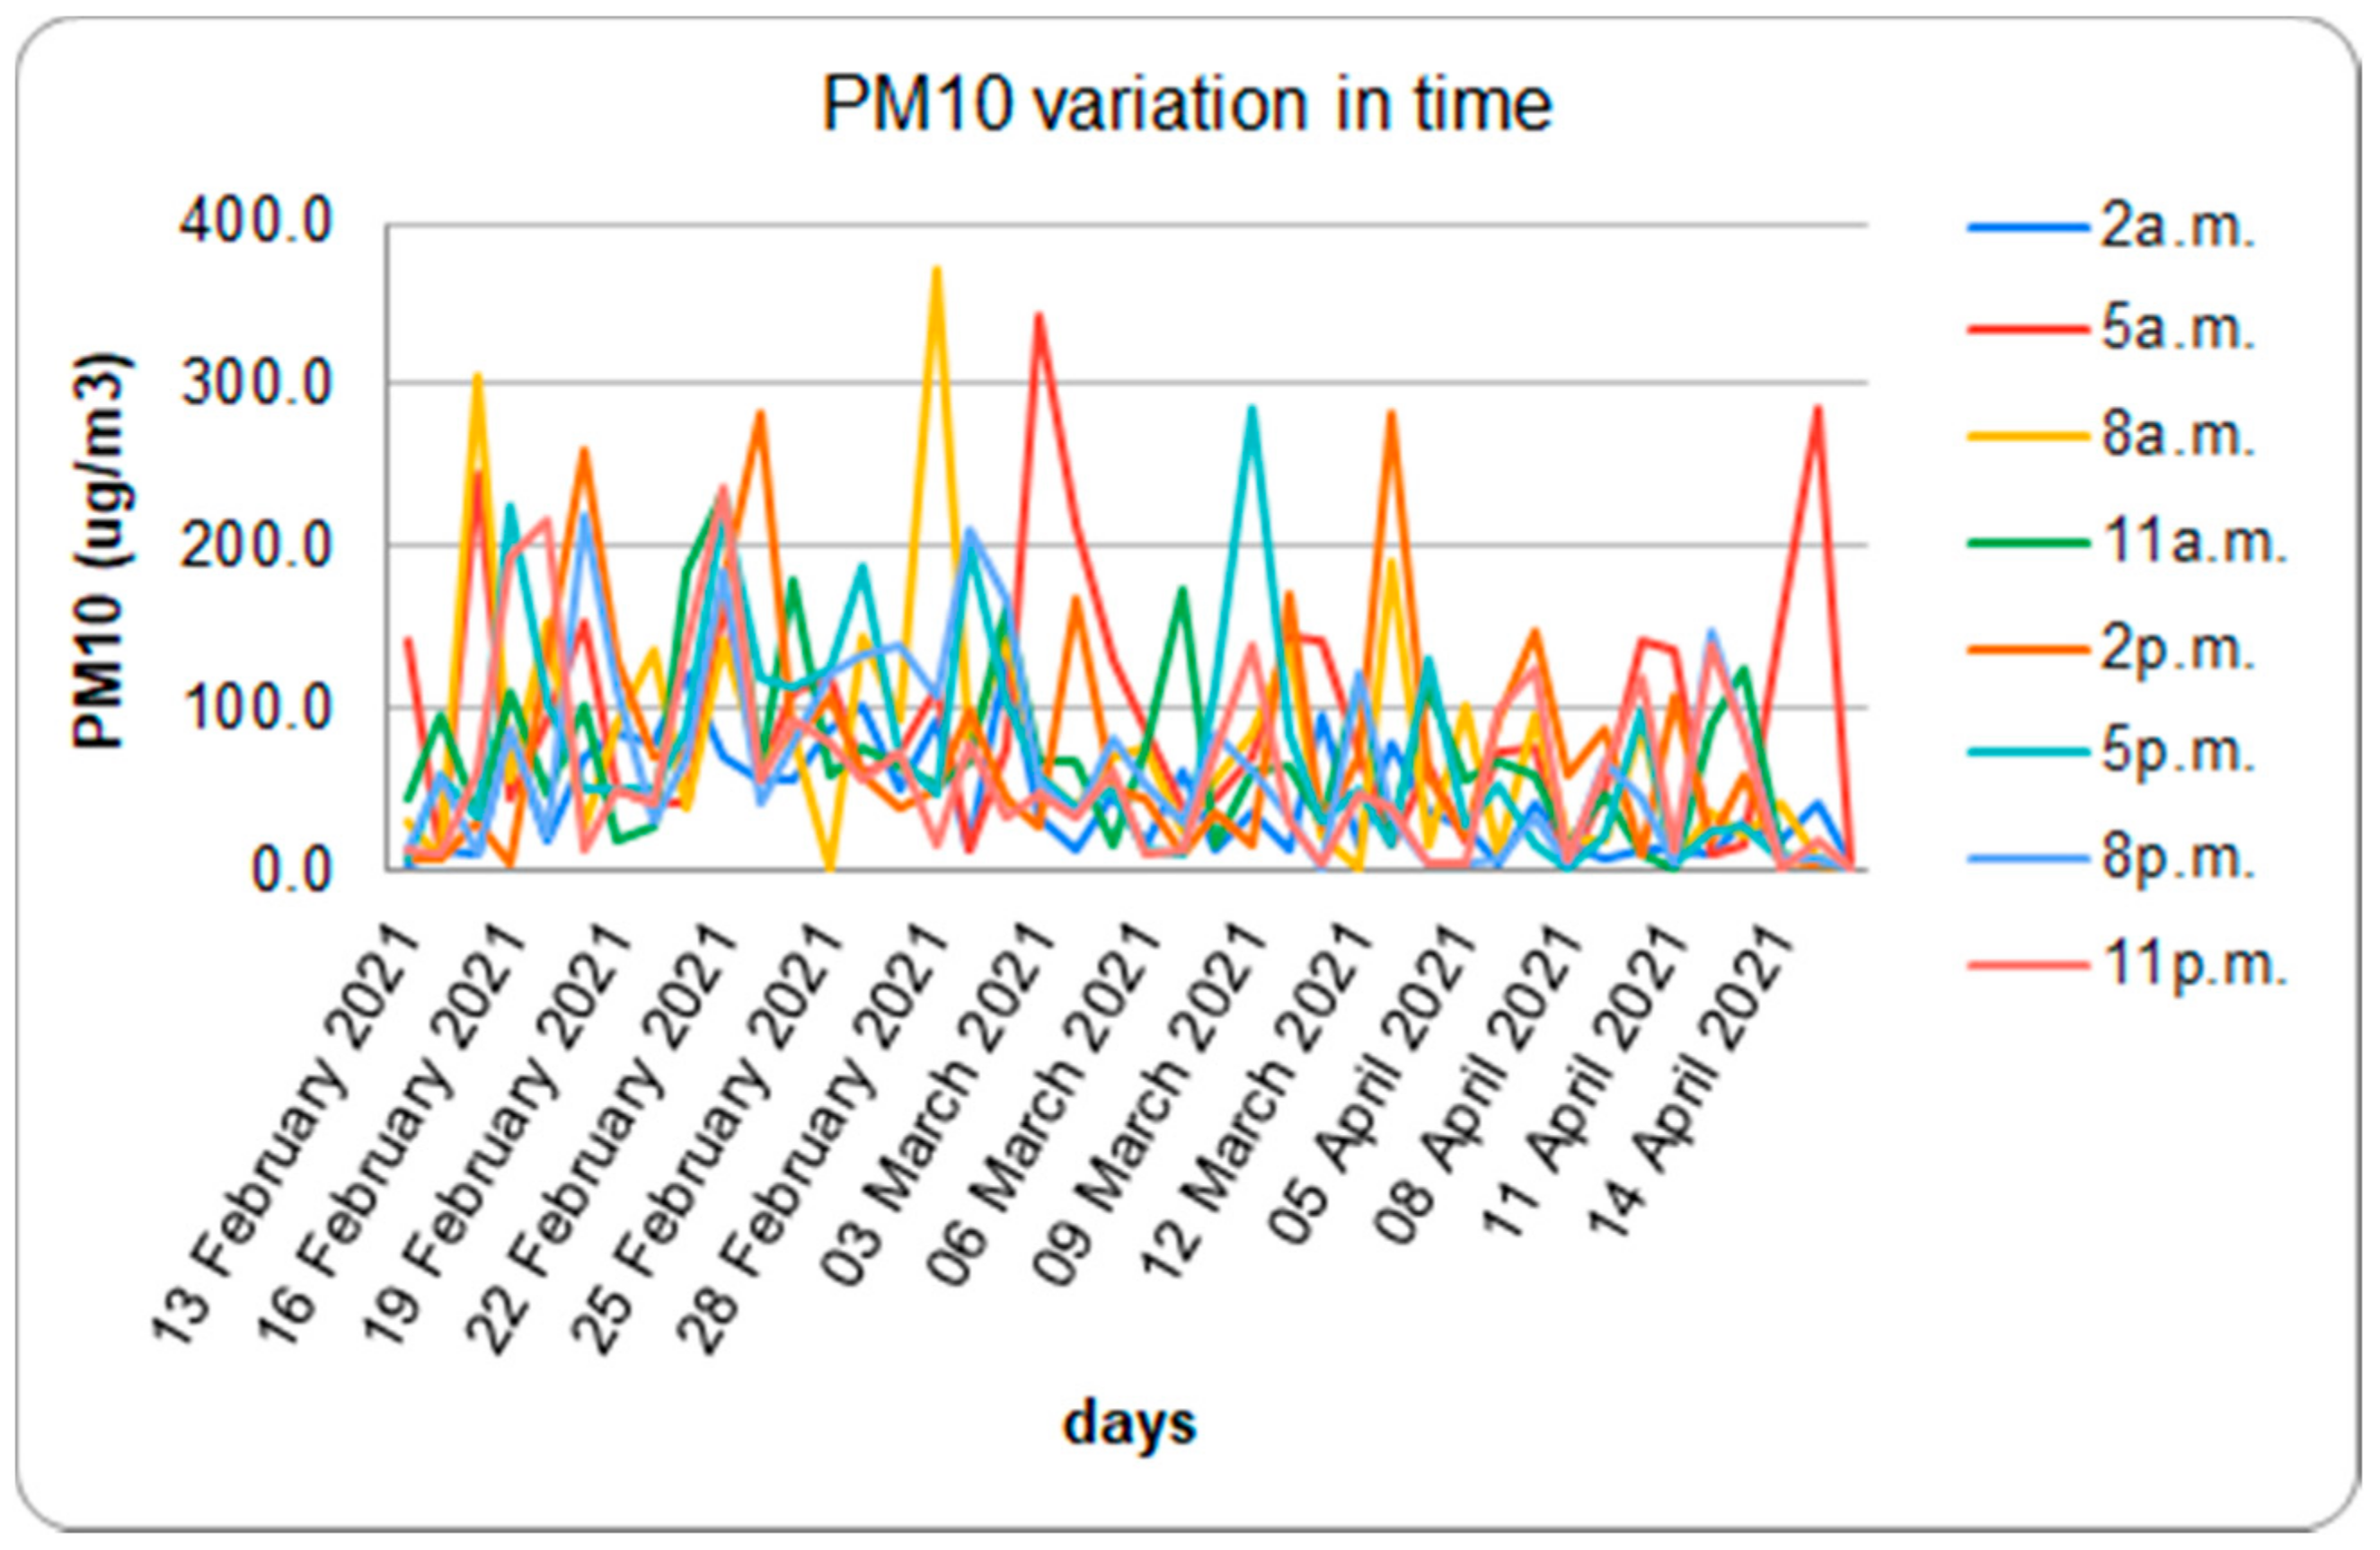
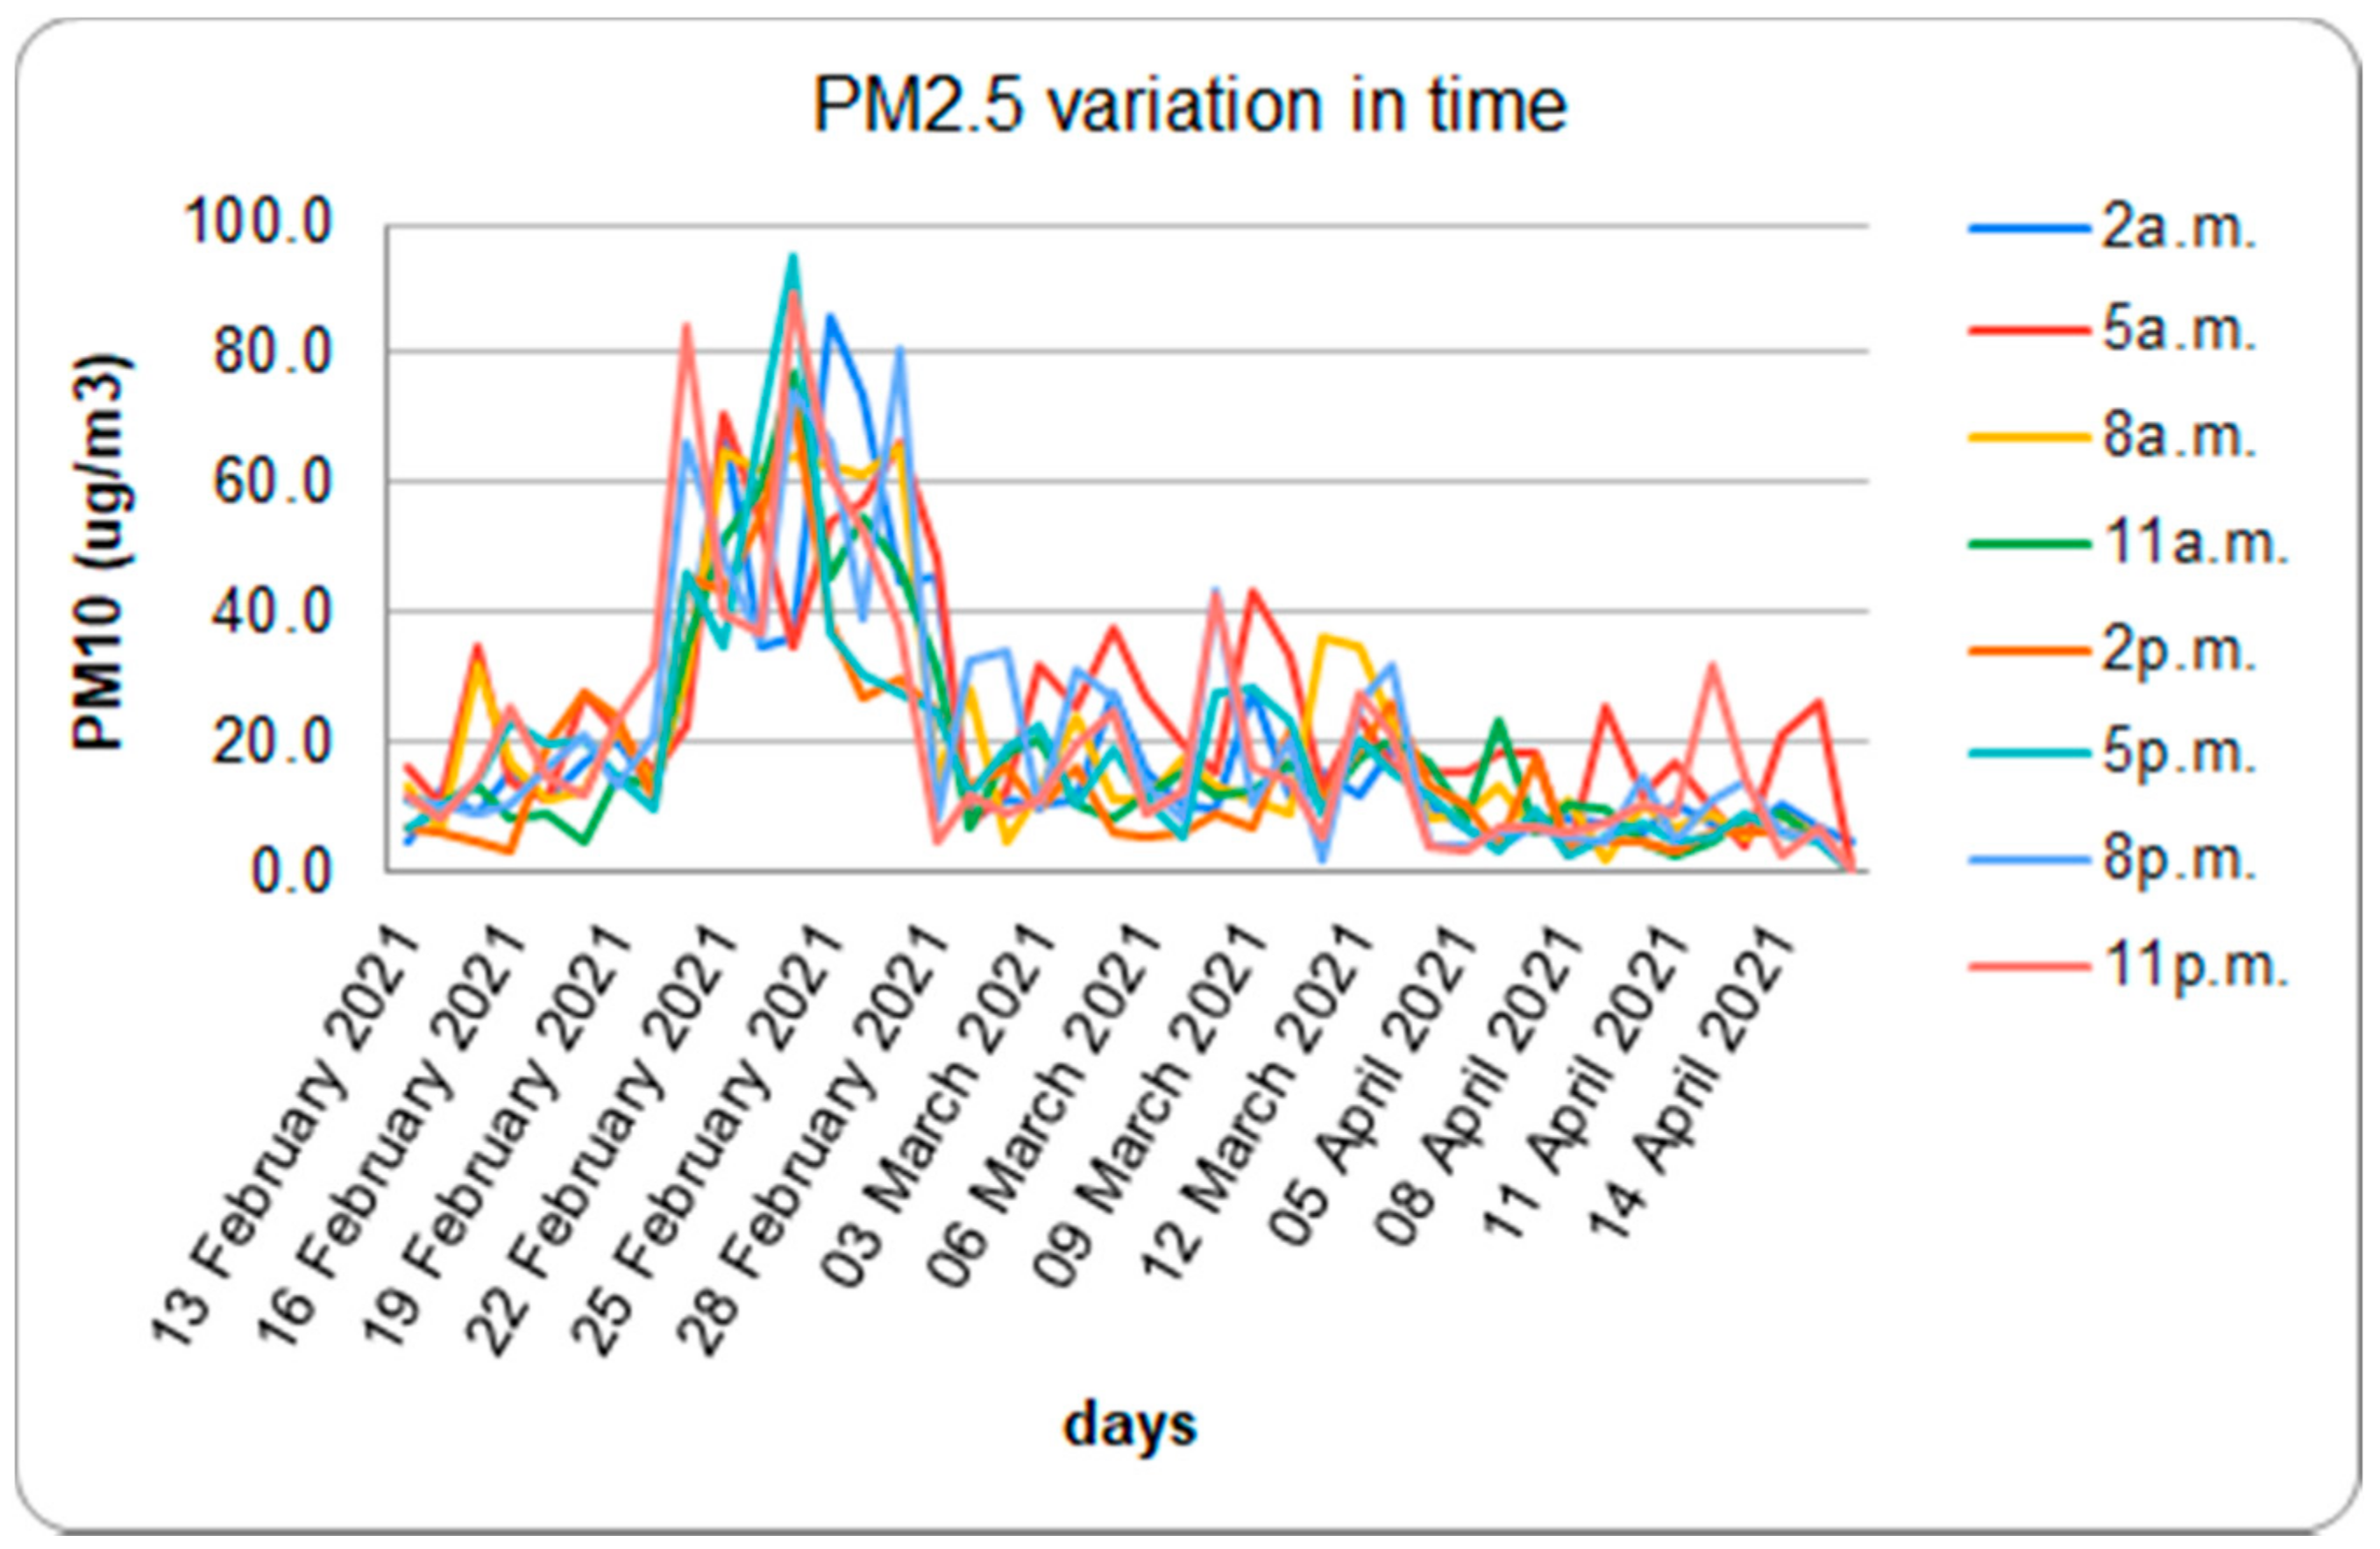
5.2. AP Concentration Monitored Using Sensors

For better observation, after making different combinations regarding the hours’ interval, we split the data into three intervals to underline the similarities between the air pollutants (AP) estimated values. The measures were made once in three hours. The intervals are the same for almost all of the parameters:
  • From 8 a.m. to 5 p.m.
  • From 8 p.m. to 11 p.m.
  • From 2 a.m. to 5 a.m.
The only air pollutant which did not fit into the intervals mentioned above is ammonia (NH3). For it, the intervals were decided as follows:
  • From 2 a.m. to 8 a.m.
  • From 11 a.m. to 5 p.m.
  • From 8 p.m. to 11 p.m.
By comparing the three parts of the day presented in Figure 5, Figure 6 and Figure 7, we observed that the estimated concentration has the lowest values between 2 a.m. and 5 a.m. and the highest between 5 p.m. and 11 p.m. During our study, most of the values were between 0 and 2 ppm, and 0 and 4 ppm, respectively. So, we can already assume that in the future, the ranges will remain the same.
For NH3, the estimated concentration has the lowest values between 11 a.m. and 8 p.m. and the highest around 5 a.m. In the first part of the study, the NH3 estimated concentrations decreased from 8 p.m. to 11 p.m., but they were going backward from the 9th of March (Figure 8, Figure 9 and Figure 10).
PM1 concentration reaches the lower values around 11 a.m. and the maximum around 2 a.m. (Figure 11). PM10 and PM2.5 concentrations reach the lowest values around 5 and 11 p.m., respectively. The maximum values for PM10 are reached at 5 a.m., while PM2.5 has its maximum at 2 p.m. (Figure 12 and Figure 13).

6. Conclusions

This article presents a hybrid platform that monitors air pollutants released from animal husbandry activities using four main layers (device, cloud, network, and application layer). Through these layers, the hardware system communicates with the platform to provide to the end-user precise AP estimations, which will serve as business decision indicators. For example, on-farm wireless sensors transmit information to determine the sources of AP emissions and, implicitly, the associated costs (taxes). Some critical parameters of the stable environment, animals, and feed can be easily monitored via IoT devices installed in farms.
Our use-case from the Milanovici farm showed that the estimated ammonia concentration increases during the night and decreases during the day when specific morning activities occur. The reduction in air currents from the stable raises the ammonia level during the night, but it does not approach the maximum allowable limits because of a proficient farm ventilation system. Regarding CO concentrations, it was observed that the minimum and maximum values were reached between 2 a.m. and 5 a.m. and 5 p.m. and 11 p.m., respectively. Furthermore, the results showed that particle pollution PM1 emissions reach both minimum and maximum levels in the first part of the day (11 and 2 a.m., respectively). On the opposite side, there are the PM2.5 concentrations with the maximum and minimum values in the second part of the day; 2 and 11 p.m., respectively. In the end, we mention that PM10 seems to have the lowest value around 5 p.m. and the maximum value at 5 a.m.
There are multiple implications of this study, especially for future work. We aim to monitor the stable conditions also during other seasons and compare the winter results with the new datasets from summer. Thus, a deeper understanding of correlations between the emissions and geographical and seasonal factors may be obtained, leading ultimately to new AP emission mitigation algorithms.

Author Contributions

Conceptualization, A.V. and G.S.; methodology, D.C.P. and M.B.; software, A.M.D.; validation, R.A.P., D.C.P. and A.M.D.; writing—original draft preparation, R.A.P., D.P. and M.V.; writing—review and editing, A.V., D.C.P. and M.V.; project administration, A.V. and G.S.; funding acquisition, G.E.M. All authors have read and agreed to the published version of the manuscript.

Funding

This research was partially supported by a grant of the Romanian National Authority for Scientific Research and Innovation, CCCDI-UEFISCDI, projects no. ERANET-ERAGAS-ICTAGRI3-FarmSusteinaBl-1 and ERANET-ERAGAS-ICTAGRI3-FarmSusteinaBl-2 (FarmSustainaBl) within PNCDI III, and funded in part by European Union’s Horizon 2020 research and innovation program under grant agreements No. 872698 (HUBCAP) and No. 826452 (Arrowhead Tools), and from the NO Grants 2014-2021, under Project contract no. 42/2021, RO-NO-2019-0499-“A Massive MIMO Enabled IoT Platform with Networking Slicing for Beyond 5G IoV/V2X and Maritime Services”-SOLID-B5G. The APC was funded by the University of Agricultural Sciences and Veterinary Medicine.

Institutional Review Board Statement

Not applicable.

Informed Consent Statement

Not applicable.

Data Availability Statement

The data presented in this study are available on request from the corresponding author.

Acknowledgments

The authors are grateful for the support of the Milanovici farm for making available their facilities for sensor installation and data collection and to Beia Cercetare SRL for providing the unified messaging and cloud data storage services.

Conflicts of Interest

The authors declare no conflict of interest. The funders had no role in the design of the study; in the collection, analyses, or interpretation of data; in the writing of the manuscript, or in the decision to publish the results.

Abbreviations

In the manuscript, we used the following abbreviations and chemical symbols:
AAP Average Annual Population
ANFIS-GP Adaptive Neuro-Fuzzy Inference Systems with Grid Partitioning
ANFIS-SC Adaptive Neuro-Fuzzy Inference Systems with Subtractive Clustering
AP Air Pollutant
AQI Air Quality Index
AQM Air Quality Monitoring
CFC Cloud Farm Controller
CoAP Constrained Application Protocol
CP Crude Protein
EFEmission Factor
EMEP European Monitoring and Evaluation Programme
EPA United States Environmental Protection Agency
EX-ACT EX-Ante Carbon-balance Tool
FEM Farm Emissions Model
HTTP Hypertext Transfer Protocol
IoT Internet of Things
IPCC Intergovernmental Panel on Climate Change
KF Kalman Filter
KPI Key Performance Indicator
LEACH Low Energy Adaptive Clustering Hierarchy Aggregation
LFC Local Farm Controller
LMC Litter Moisture Content
MLP Multilayer Perceptron
MLR Multiple Linear Regression
MQTT Message Queuing Telemetry Transport
NPM National Practices Model
pH Potential of Hydrogen
PM Microscopic Particles
PMx Microscopic Particles less than x microns in diameter, where x {1, 2.5, 10}
REST Representational State Transfer
WSN Wireless Sensor Network
CO carbon monoxide
CO2 carbon dioxide
CH4 methane
N₂O nitrous oxide
NO2 nitrogen dioxide
NH3 ammonia
O3 ozone
SO2 sulfur dioxide

References

  1. Hyland, J.J.; Henchion, M.; McCarthy, M.; McCarthy, S.N. The role of meat in strategies to achieve a sustainable diet lower in greenhouse gas emissions: A review. Meat Sci. 2017, 132, 189–195. [Google Scholar] [CrossRef]
  2. Aneja, V.; Schlesinger, W.; Erisman, J. Farming pollution. Nat. Geosci. 2008, 1, 409–411. [Google Scholar] [CrossRef]
  3. Grossi, G.; Goglio, P.; Vitali, A.; Williams, A.G. Livestock and climate change: Impact of livestock on climate and mitigation strategies. Anim. Front. 2018, 9, 69–76. [Google Scholar] [CrossRef] [PubMed] [Green Version]
  4. Place, S.E.; Mitloehner, F.M. Invited review: Contemporary environmental issues: A review of the dairy industry’s role in climate change and air quality and the potential of mitigation through improved production efficiency. J. Dairy Sci. 2010, 93, 3407–3416. [Google Scholar] [CrossRef] [PubMed]
  5. Havlikova, M.; Kroeze, C.; Huijbregts, M.A. Environmental and health impact by dairy cattle livestock and manure management in the Czech Republic. Sci. Total Environ. 2008, 396, 121–131. [Google Scholar] [CrossRef] [PubMed]
  6. Heederik, D.; Sigsgaard, T.; Thorne, P.S.; Kline, J.N.; Avery, R.; Bonlokke, J.H.; Chrischilles, E.A.; Dosman, J.A.; Duchaine, C.; Kirkhorn, S.R.; et al. Health effects of airborne exposures from concentrated animal feeding operations. Environ. Health Perspect. 2007, 115, 298–302. [Google Scholar] [CrossRef] [Green Version]
  7. Sutton, M.; Howard, C.; Erisman, J. The European Nitrogen Assessment: Sources, Effects and Policy Perspectives; Cambridge University Press: Cambridge, UK, 2011. [Google Scholar]
  8. Radon, K.; Schulze, A.; Ehrenstein, V.; van Strien, R.T.; Praml, G.; Nowak, D. Environmental exposure to confined animal feeding operations and respiratory health of neighboring residents. Epidemiology 2007, 18, 300–308. [Google Scholar] [CrossRef]
  9. Schulze, A.; Rommelt, H.; Ehrenstein, V.; van Strien, R.; Praml, G.; Kuchenhoff, H.; Nowak, D.; Radon, K. Effects on pulmonary health of neighboring residents of concentrated animal feeding operations: Exposure assessed using optimized estimation technique. Arch. Environ. Occup. Health 2011, 66, 146–154. [Google Scholar] [CrossRef]
  10. Hoopmann, M.; Hehl, O.; Neisel, F.; Werfel, T. Associations between bioaerosols coming from livestock facilities and asthmatic symptoms in children. Gesundheitswesen 2006, 68, 575–584. [Google Scholar] [CrossRef]
  11. Borlee, F.; Yzermans, C.J.; van Dijk, C.E.; Heederik, D.; Smit, L.A.M. Increased respiratory symptoms in COPD patients living in the vicinity of livestock farms. Eur. Respir. J. 2015, 46, 1605–1614. [Google Scholar] [CrossRef] [Green Version]
  12. Smit, L.A.M.; Hooiveld, M.; van der Sman-de Beer, F.; Opstal-van Winden, A.W.J.; Beekhuizen, J.; Wouters, I.M.; Yzermans, C.J.; Heederik, D. Air pollution from livestock farms, and asthma, allergic rhinitis and COPD among neighbouring residents. Occup. Environ. Med. 2014, 71, 134–140. [Google Scholar] [CrossRef] [Green Version]
  13. van Dijk, C.E.; Garcia-Aymerich, J.; Carsin, A.E.; Smit, L.A.M.; Borlee, F.; Heederik, D.J.; Donker, G.A.; Yzermans, C.J.; Zock, J.P. Risk of exacerbations in COPD and asthma patients living in the neighborhood of livestock farms: Observational study using longitudinal data. Int. J. Hyg. Environ. Health 2016, 219, 278–287. [Google Scholar] [CrossRef] [PubMed]
  14. Lelieveld, J.; Evans, J.S.; Fnais, M.; Giannadaki, D.; Pozzer, A. The contribution of outdoor air pollution sources to premature mortality on a global scale. Nature 2015, 525, 367–371. [Google Scholar] [CrossRef]
  15. Cambra-López, M.; Aarnink, A.J.A.; Zhao, Y.; Calvet, S.; Torres, A.G. Airborne particulate matter from livestock production systems: A review of an air pollution problem. Environ. Pollut. 2010, 158, 1–17. [Google Scholar] [CrossRef]
  16. Hristov, A.N. Technical note: Contribution of ammonia emitted from livestock to atmospheric fine particulate matter (PM2.5) in the United States. J. Dairy Sci. 2011, 94, 3130–3136. [Google Scholar] [CrossRef] [PubMed]
  17. Pozzer, A.; Tsimpidi, A.P.; Karydis, V.A.; de Meij, A.; Lelieveld, J. Impact of agricultural emission reductions on fine-particulate matter and public health. Atmos. Chem. Phys. 2017, 17, 12813–12826. [Google Scholar] [CrossRef] [Green Version]
  18. Smit, L.A.M.; Heederik, D. Impacts of intensive livestock production on human health in densely populated regions. GeoHealth 2017, 1, 272–277. [Google Scholar] [CrossRef]
  19. Basinas, I.; Sigsgaard, T.; Kromhout, H.; Heederik, D.; Wouters, I.M.; Schlünssen, V. A comprehensive review of levels and determinants of personal exposure to dust and endotoxin in livestock farming. J. Expo. Sci. Environ. Epidemiol. 2013, 25, 123–137. [Google Scholar] [CrossRef]
  20. Basinas, I.; Sigsgaard, T.; Erlandsen, M.; Andersen, N.T.; Takai, H.; Heederik, D.; Omland, Ø.; Kromhout, H.; Schlünssen, V. Exposure-affecting factors of dairy farmers’ exposure to inhalable dust and endotoxin. Ann. Occup. Hyg. 2014, 58, 707–723. [Google Scholar] [PubMed] [Green Version]
  21. Douglas, P.; Robertson, S.; Gay, R.; Hansell, A.L.; Gant, T.W. A systematic review of the public health risks of bioaerosols from intensive farming. Int. J. Hyg. Environ. Health 2018, 221, 134–173. [Google Scholar] [CrossRef]
  22. Dungan, R.S. Board-invited review: Fate and transport of bioaerosols associated with livestock operations and manures. J. Anim. Sci. 2010, 88, 3693–3706. [Google Scholar] [CrossRef]
  23. Bauer, S.E.; Tsigaridis, K.; Miller, R. Significant atmospheric aerosol pollution caused by world food cultivation. Geophys. Res. Lett. 2016, 43, 5394–5400. [Google Scholar] [CrossRef] [Green Version]
  24. Brunekreef, B.; Harrison, R.M.; Kunzli, N.; Querol, X.; Sutton, M.A.; Heederik, D.J.; Sigsgaard, T. Reducing the health effect of particles from agriculture. Lancet Respir. Med. 2015, 3, 831–832. [Google Scholar] [CrossRef] [Green Version]
  25. Dungan, R.S.; Leytem, A.B.; Bjorneberg, D.L. Concentrations of airborne endotoxin and microorganisms at a 10,000-cow open-freestall dairy. J. Anim. Sci. 2011, 89, 3300–3309. [Google Scholar] [CrossRef] [Green Version]
  26. Thorne, P.S.; Ansley, A.C.; Perry, S.S. Concentrations of bioaerosols, odors, and hydrogen sulfide inside and downwind from two types of swine livestock operations. J. Occup. Environ. Hyg. 2009, 6, 211–220. [Google Scholar] [CrossRef] [PubMed] [Green Version]
  27. de Rooij, M.M.T.; Smit, L.A.M.; Erbrink, H.J.; Hagenaars, T.J.; Hoek, G.; Ogink, N.W.M.; Winkel, A.; Heederik, D.J.J.; Wouters, I.M. Endotoxin and particulate matter emitted by livestock farms and respiratory health effects in neighboring residents. Environ. Int. 2019, 132, 105009. [Google Scholar] [CrossRef] [PubMed]
  28. Leip, A.; Billen, G.; Garnier, J.; Grizzetti, B.; Lassaletta, L.; Reis, S.; Simpson, D.; Sutton, M.; De Vries, W.; Weiss, F.; et al. Impacts of European livestock production: Nitrogen, sulphur, phosphorus and greenhouse gas emissions, land-use, water eutrophication and biodiversity. Environ. Res. Lett. 2015, 10, 115004. [Google Scholar] [CrossRef]
  29. Küçüktopcu, E.; Cemek, B. Comparison of Neuro-Fuzzy and Neural Networks Techniques for Estimating Ammonia Concentration in Poultry Farms. [online] ScienceDirect. 2021. Available online: https://0-www-sciencedirect-com.brum.beds.ac.uk/science/article/abs/pii/S221334372100676X (accessed on 24 June 2021).
  30. Pinder, R.; Anderson, N.; Strader, R.; Davidson, C.; Adams, P. Ammonia Emissions from Dairy Farms: Development of a Farm Model and Estimation of Emissions from the United States. [online]. 2021. Available online: https://citeseerx.ist.psu.edu/viewdoc/download?doi=10.1.1.587.9890&rep=rep1&type=pdf (accessed on 20 June 2021).
  31. Kamilaris, A.; Assumpcio, A.; Blasi, A.; Torrellas, M.; Prenafeta-Boldú, F. Estimating the Environmental Impact of Agriculture by Means of Geospatial and Big Data Analysis: The Case of Catalonia. Progress in I.S.; [online]. 2017, pp. 39–48. Available online: https://0-link-springer-com.brum.beds.ac.uk/chapter/10.1007/978-3-319-65687-8_4 (accessed on 18 June 2021).
  32. Abdulsalam, H.; Ali, B.; AlYatama, A.; AlRoumi, E. Deploying a LEACH Data Aggregation Technique for Air Quality Monitoring in Wireless Sensor Network. Procedia Comput. Sci. 2014, 34, 499–504. [Google Scholar] [CrossRef] [Green Version]
  33. Lai, X.; Yang, T.; Wang, Z.; Chen, P. IoT Implementation of Kalman Filter to Improve Accuracy of Air Quality Monitoring and Prediction. Appl. Sci. 2019, 9, 1831. [Google Scholar] [CrossRef] [Green Version]
  34. Elloumi, O.; Desbenoit, J. High Level Architecture (HLA). [online] Aioti.eu. 2018. Available online: https://aioti.eu/wp-content/uploads/2018/06/AIOTI-HLA-R4.0.7.1-Final.pdf (accessed on 2 July 2021).
  35. Thethingsnetwork.org. The Things Network. [online]. 2021. Available online: https://www.thethingsnetwork.org/ (accessed on 2 July 2021).
  36. Stoica, I. Nutriţia și Alimentaţia Animalelor; Sanivet, C., Ed.; Tipografia Moldova: Bucuresti, Romania, 1997. [Google Scholar]
  37. Groot Koerkamp, P.W.G.; Metz, J.H.M.; Uenk, G.H.; Phillips, V.R.; Holden, M.R.; Sneath, R.W.; Short, J.L.; White, R.P.; Hartung, J.; Seedorf, J.; et al. Concentrations and emissions of ammonia in livestock buildings in northern Europe. J. Agric. Eng. Res. 1998, 70, 79–95. [Google Scholar] [CrossRef]
  38. Climatization of Animal Houses. Report of Working Group; Scottish Farm Buildings Investigation Unit: Aberdeen, UK, 1984; 72p. [Google Scholar]
  39. Georgescu, G. Tehnologia Creșterii Bovinelor; EDP: București, Romania, 1990. [Google Scholar]
  40. Wathes, C.M.; Phillips, V.R.; Holden, M.R.; Sneath, R.W.; Short, J.L.; White, R.P.; Hartung, J.; Seedorf, J.; Schröder, M.; Linkert, K.H.; et al. Emissions of aerial pollutants in livestock buildings in Northern Europe; Overview of a multinational project. J. Agric. Eng. Res. 1998, 70, 3–9. [Google Scholar] [CrossRef]
  41. Herbut, P.; Angrecka, S.; Nawalany, G. The impact of barriers inside herringbone milking parlour on efficiency of the ventilation system. Ann. Anim. Sci. 2012, 12, 577–584. [Google Scholar] [CrossRef]
  42. Osario, J.A.; Tinoco, I.F.; Ciro, H.J. Ammonia: A review of concentration and emission models in livestock structures. Dyna 2009, 76, 89–99. [Google Scholar]
  43. Zahner, M.; Schrader, L.; Hauser, R.; Keck, M.; Langhans, W.; Wechsler, B. The influence of climatic conditions on physiological and behavioural parameters in dairy cows kept in open stables. Anim. Sci. 2004, 78, 139–147. [Google Scholar] [CrossRef]
  44. Herbut, P.; Angrecka, S.; Nawalany, G. Influence of wind on air movement in a free-stall barn during the summer period. Ann. Anim. Sci. 2013, 13, 109–119. [Google Scholar] [CrossRef] [Green Version]
  45. Simsek, E.; Kilic, I.; Yaslioglu, E.; Arici, I. Ammonia emissions from dairy cattle barns in summer season. J. Anim. Vet. Adv. 2012, 11, 2116–2120. [Google Scholar]
  46. Kang, J.H.; Lee, S.J. Improvement of natural ventilation in a large factory building using a louver ventilator. Build Environ. 2008, 43, 2132–2141. [Google Scholar] [CrossRef]
  47. Zhao, L.Y.; Brugger, M.F.; Manuzon, R.B.; Arnold, G.; Imerman, E. Variations in air quality of new Ohio dairy facilities with natural ventilation systems. Appl. Eng. Agric. 2007, 23, 339–346. [Google Scholar] [CrossRef] [Green Version]
  48. Harper, L.A.; Flesch, T.K.; Powell, J.M.; Coblentz, W.K.; Jokela, W.E.; Martin, N.P. Ammonia emissions from dairy production in Wisconsin. J. Dairy Sci. 2009, 92, 2326–2337. [Google Scholar] [CrossRef] [PubMed] [Green Version]
  49. Moreira, V.R.; Satter, L.D. Effect of scraping frequency in a freestall barn on volatile nitrogen loss from dairy manure. J. Dairy Sci. 2006, 89, 2579–2587. [Google Scholar] [CrossRef]
  50. EMEP/EEA Air Pollutant Emission Inventory Guidebook 2019, ISSN 1977-8449. [online]. Available online: https://www.eea.europa.eu/publications/emep-eea-guidebook-2019/download (accessed on 22 June 2021).
Figure 1. Proposed platform architecture.
Sustainability 13 09633 g001
Figure 2. Inside view of the Milanovici farm.
Sustainability 13 09633 g002
Figure 3. IoT devices installed in the farm.
Sustainability 13 09633 g003
Figure 4. Grafana Dashboard with station FARM1.
Sustainability 13 09633 g004
Figure 5. CO concentration variation between 8 a.m. and 5 p.m.
Sustainability 13 09633 g005
Figure 6. CO concentration variation between 8 p.m. and 11 p.m.
Sustainability 13 09633 g006
Figure 7. CO concentration variation between 2 a.m. and 5 a.m.
Sustainability 13 09633 g007
Figure 8. NH3 concentration variation between 11 a.m. and 5 p.m.
Sustainability 13 09633 g008
Figure 9. NH3 concentration variation between 8 p.m. and 11 p.m.
Sustainability 13 09633 g009
Figure 10. NH3 concentration variation between 2 a.m. and 8 a.m.
Sustainability 13 09633 g010
Figure 11. PM1 concentration variation.
Sustainability 13 09633 g011
Figure 12. PM10 concentration variation.
Sustainability 13 09633 g012
Figure 13. PM2.5 concentration variation.
Sustainability 13 09633 g013
Table 1. Overview of methodologies for AP monitoring used in animal husbandry activities.
Neuro-Fuzzy and Neural Network TechniquesFarm-Based Model Made for the Ammonia Emission Estimation
Source[29][30]
Air pollutantNH3NH3
Input parameters
  • indoor air temperature (T)
  • relative humidity (RH)
  • speed (V)
  • FEM: a set of manure management practices and yearly climatic conditions/dairy farm
  • NPM: distribution of farm sizes in a county, milk production, historical farming practices, and climate data
Output
  • NH3 concentration estimation/poultry building
  • FEM: monthly emission factors/dairy cow
  • NPM: most common farming practices for a location
Similarities
  • same AP is being monitored
  • both methods use AI techniques
  • seasonally estimations are being performed, chosen based on the farm type
Differences:
Type of monitored farmpoultry farmdairy farm
Number of tested models41
Studied areaSamsun, TurkeyUnited States
Table 2. Overview of existing digital platforms for AP estimation.
AgriBigCAT LEACH Algorithm Kalman Filter Algorithm
Source[31] [32] [33]
Air pollutantgreenhouse
gases
CO, NO2, SO2 SO2, NO2, CO, O3, PM2.5, and PM10
Typeonline software platform algorithm algorithm
Functionalityenvironment impact estimation
farms mapping
AQI values monitoring real-time air quality monitoring,
prediction system
Similarities
  • All of them are air pollution monitoring application
  • Both Kalman Filter and LEACH Algorithm use wireless sensor networks
  • Both AgriBigCat and LEACH Algorithm are used to estimate the impact on the environment and helps to save energy
Particularities
  • Uses geographical information employing geospatial and big data analysis
  • Can assist both the farmers’ decision-taking processes and the administration planning and policymaking
  • Can assist both the farmers’ decision-taking processes and the administration planning and policymaking
  • Uses geographical information employing geospatial and big data analysis
  • Has real-time prediction system
  • Based on IoT edge computing
  • Ignores the influence of the external environment of pollutants
Table 3. Parameters used for the estimation of AP emissions and methodology.
Crt. No.ParameterGuidelineEquation from Guideline
Calculated parameters
1NexIPCC, 201910.31A
2NintakeIPCC, 201910.32
3NretentionIPCC, 201910.33
4NEgIPCC, 201910.6
5mhous_NEMEP, 20195
6mhous_TANEMEP, 201910
7mhous_solid_NEMEP, 201914
8Ehous_solidEMEP, 201916
9Estorage_solidEMEP, 201934
10EMMS_NH3EMEP, 201946
Default values
1XTANEMEP, 2019Table 3.9
2EFhousingEMEP, 2019Table 3.9
3EFPM2.5, EFPM10EMEP, 2019Table 3.5
Table 4. Parameters’ values used for calculated excreted nitrogen (Nex).
Category
Parameter
Dairy CowsHeifers and PrimipArousYouth (3–9 Months)
Days of life365365180
Heads number1105040
AAP36536519.73
GE (MJ/head/day)258.5799.6642.55
CP% (%)0.1070.0840.097
Milk (kg/head/day)30--
Milk% (%)1.92--
WG (kg/day)0.20.40.9
NEg (MJ/head/day)3.977.959.06
Nintake (kg/head/day)0.360.130.06
Nretention (kg/head/day)0.0820.0080.028
Nex (kg/head/year)101.1943.7311.46
AAP = average annual population, AAP = number of animals produced annually * days of live; GE = gross energy intake (MJ/head/day); CP% = percent crude protein in dry matter (%); Milk = milk production (kg/head/day); Milk% = percent of protein in milk, calculated as [1.9 + 0.4 × %Fat], where %Fat is an input, assumed to be 4% (%); WG = weight gain (kg/day); NEg = net energy for growth, calculated in livestock characterization, based on current weight, mature weight, rate of weight gain, and IPCC constants ((MJ/head/day); Nintake = daily N consumed per animal of each category (kg N/head/day); Nretention = amount of daily N intake by head of animal (kg N/head/day); Nex = annual N excretion rates (kg N/head/year).
Table 5. Emissions of ammonia (t NH3/year).
CategoryAAPHeads NoNex
(kg/Head/Year)
Nex/AAP/YearNH3
Emissions
(kg N-NH3/AAP/Year)
NH3
Emissions
(t NH3/an)
Dairy cows365110101.1911130.9648.7720.649
Heifers
and primiparous
3655043.732187127.4710.127
Young1804011.46226.0613.1760.013
TOTAL 0.789
Table 6. Dust emissions (PM2.5, PM10) (kg PM/year).
CategoryHeads NoLife
Days
AAPEFEmissions (kg/Year)
PM10PM2.5PM10PM2.5
Dairy cows1103651100.630.4169.345.1
Heifers and primiparous50365500.270.1813.59.0
Young4018019.730.270.185.33.6
TOTAL 88.1357.65
Publisher’s Note: MDPI stays neutral with regard to jurisdictional claims in published maps and institutional affiliations.

