
Environmental Impact of Solar Home Systems in Sub-Saharan Africa


1
Department of Mechanical Engineering, University of La Rioja, 26006 Logroño, Spain
2
Mechanical Engineering, Colorado State University, 430 University Ave, Fort Collins, CO 80523, USA
*
Author to whom correspondence should be addressed.
Sustainability 2021, 13(17), 9708; https://0-doi-org.brum.beds.ac.uk/10.3390/su13179708
Submission received: 28 July 2021
/
Revised: 21 August 2021
/
Accepted: 23 August 2021
/
Published: 30 August 2021
(This article belongs to the Special Issue New Solar Technologies for Sustainable Development)
Abstract
:Solar home systems (SHS) represent one of the most promising technologies for a rapid and independent electrification in those areas of Sub-Saharan Africa (SSA) without access to electricity. This study addressed the environmental impact of SHS in SSA through updated life cycle inventories and five impact categories: greenhouse gases (GHG) emissions, fossil fuels, metal and water depletion and human toxicity. Sixteen scenarios were considered, including manufacturing, transportation, recycling and user-related variables, such as the installation site, adequacy of SHS user operation and battery lifespan. The results showed that lead-acid batteries were the largest contributor to environmental impact among the SHS components, accounting for up to 36–76% of the environmental impact indicators. Apart from the components, user training for SHS operation, with the goal of maximizing usable energy and battery lifetime, proved to be critical to achieve improvements in the energy payback time and GHG emissions, which (under scenarios of high solar resources) can reach the range of 5.3–7.1 years and 0.14–0.18 kgCO eq/kWh, respectively. In addition, SHS GHG emission factors were benchmarked with those of other electrification approaches, such as national grids, 100% PV and hybrid PV-diesel off-grid mini grids and off-grid diesel generators. SHS achieved GHG emission factor values equivalent to PV-based mini grids in most scenarios and was strikingly lower compared to SSA national grids and diesel generators.
1. Introduction
An estimated of 789 million people lack electricity globally endangering the fulfillment of Sustainable Development Goal 7 (SDG7), which aims to “ensure access to affordable, reliable, sustainable and modern energy for all for 2030” [1]. Sub-Saharan Africa (SSA) accounts for 573 million people without access to electricity, mainly in rural and remote areas, in which grid extension remains unplanned [2]. Even in grid connected areas, access to electricity and quality of service has a long way to improve in SSA [3], and alternatives for back-up electrification are becoming popular, such as third generation mini grids and solar home systems (SHS) [4].
While off-grid mini grids are attractive from the techno-economic side for unelectrified dense populations without plans for grid extension, remote scattered households, semi-nomadic populations and unelectrified households close to the grid, such as unplanned off-grid suburbs in cities, usually remain out of these national plans for mini grids. It is in these situations where SHS represents the most feasible solution for a rapid and independent access to electricity. This explains an estimated 136 million people with access to an electricity source of 11–50 W globally, 85% based on SHS [5].
Most SHS in SSA integrate a crystalline-silicon photovoltaic (PV) generator, a storage system traditionally based on lead-acid batteries (LAB) with a pulse width modulation (PMW) charge controller and, less frequently, an inverter if AC is desired [6]. While lithium-based batteries, maximum power point tracking (MPPT) controllers and PV generators of 1–3 kW are becoming more popular in other regions, installations of 20–100 Wp with lead-acid batteries and PMW charge controllers predominate in SSA due to the lower initial cost and ease of access for rural populations [7,8].
Battery lifetime is the weakest part of SHS, and it frequently reflects the impact caused by the lack of SHS training and unproper use: non-optimal orientations and tilt angles of the PV generator, lack of PV-module cleaning, system over-utilization when no solar irradiance is available, bypassing of charge controllers and deep battery discharges with subsequent lifetime reductions [9,10,11,12,13].
In this line, a significant difference in LAB lifetime can be found between theoretical SHS studies, ranging 5–7 years [14,15,16] and real-case studies in rural SSA of 1–3 years [13,17,18,19,20]. In addition to this, SHS components without internationally-accepted quality certifications, frequently sold at local markets in SSA (estimated to represent the 72% of the total SHS [20]), represent a major issue for environmental impact, due to the ridiculously low life-spans, which are sometimes in the range of weeks [21].
SHS can be found in SSA as ’customized systems’—SHS designed to supply the required loads and installed by technician, ‘plug-and-play’—fixed kits integrating all SHS components and installed by the user, and ‘mix-and-match’—SHS components purchased separately in local markets and combined together based on the choices of the user. In this line, early SHS failures were found at striking rates of 56%, 75% and 93%, respectively, for ’customized systems’, ’plug-and-play’ and ’mix-and-match’ in Uganda, due to the lack of expertise in installation and operation and the low quality of components, with battery lifespans of 1–2 years [21].
Early battery failures not only generate customer dissatisfaction with SHS [22] (considering the significant investment that a SHS represents for the unelectrified household economy in SSA) but also represents an environmental concern when system lifespans are reduced in a dramatic way, especially in regions without central waste management and with LAB being treated informally.
The environmental life cycle assessment (LCA) for SHS was pioneered in 2000 considering two SHS of 50 Wp in Indonesia, concluding that batteries accounted for 50–90% of environmental scores [23]. In addition, the greenhouse gas (GHG) emissions of SHS were calculated in 2003 and compared with alternatives of kerosen and petroleum lighting [17]. In Bangladesh, a 2 kWp SHS was estimated to save 36.7 tonnes of CO during 25 years of operation [24]. In the same country, a different study concluded that SHS could avoid between 6.15 and 7.34 tonnes of CO emissions in a medium size household during the 20 year lifetime [25].
In a different approach, Bhandari et al. (2015) [26] evaluated the energy payback time (EPT) of different PV installations finding striking variations depending on the inventory data, leading to a wide variability of results among LCA studies. In this line, the displacement from Europe and North America to Asia in module (>90% of the global production) and battery manufacturing led to noticeable changes in life cycle inventories [27,28]. These changes in the market justify the need to update LCA analysis in PV systems and to include sensitivity assessments to evaluate the impact of changes into final environmental scores [29].
A lack of studies analyzing the environmental impact of SHS in SSA was found in the reviews about the state of the art performed by Brunet et al. (2018) [30], Kizilcec and Parikh (2020) [31] and Antonanzas-Torres et al. (2021) [32]. This research gap between theoretical/ideal and real SHS operation in SSA has motivated this article, whose contributions are twofold:
- Environmental impact sensitivity analysis for SHS adapted to SSA conditions (desertic and equatorial sites) considering different choices for SHS manufacturing origin, transportation, operation adequacy, battery lifespan and end of life management.
- Environmental impact comparison of SHS with other alternatives for rural electrification in SSA: diesel generator, 100% PV mini grid and hybrid PV-diesel mini grid and, also, with national grids in SSA.
The article is structured in the following way: the methods and metrics are defined in Section 2; lifecycle inventories related to manufacturing, transportation and end-of-life of SHS components and other necessary data are shown in Section 3; the results are presented in Section 4; and the discussion and concussions are in Section 5 and Section 6, respectively.
2. Method
The LCA methodology used in this paper and described in this section follows the standards ISO 14040 [33], ISO 14044 [34] and the International Energy Agency (IEA) recommendations [35].
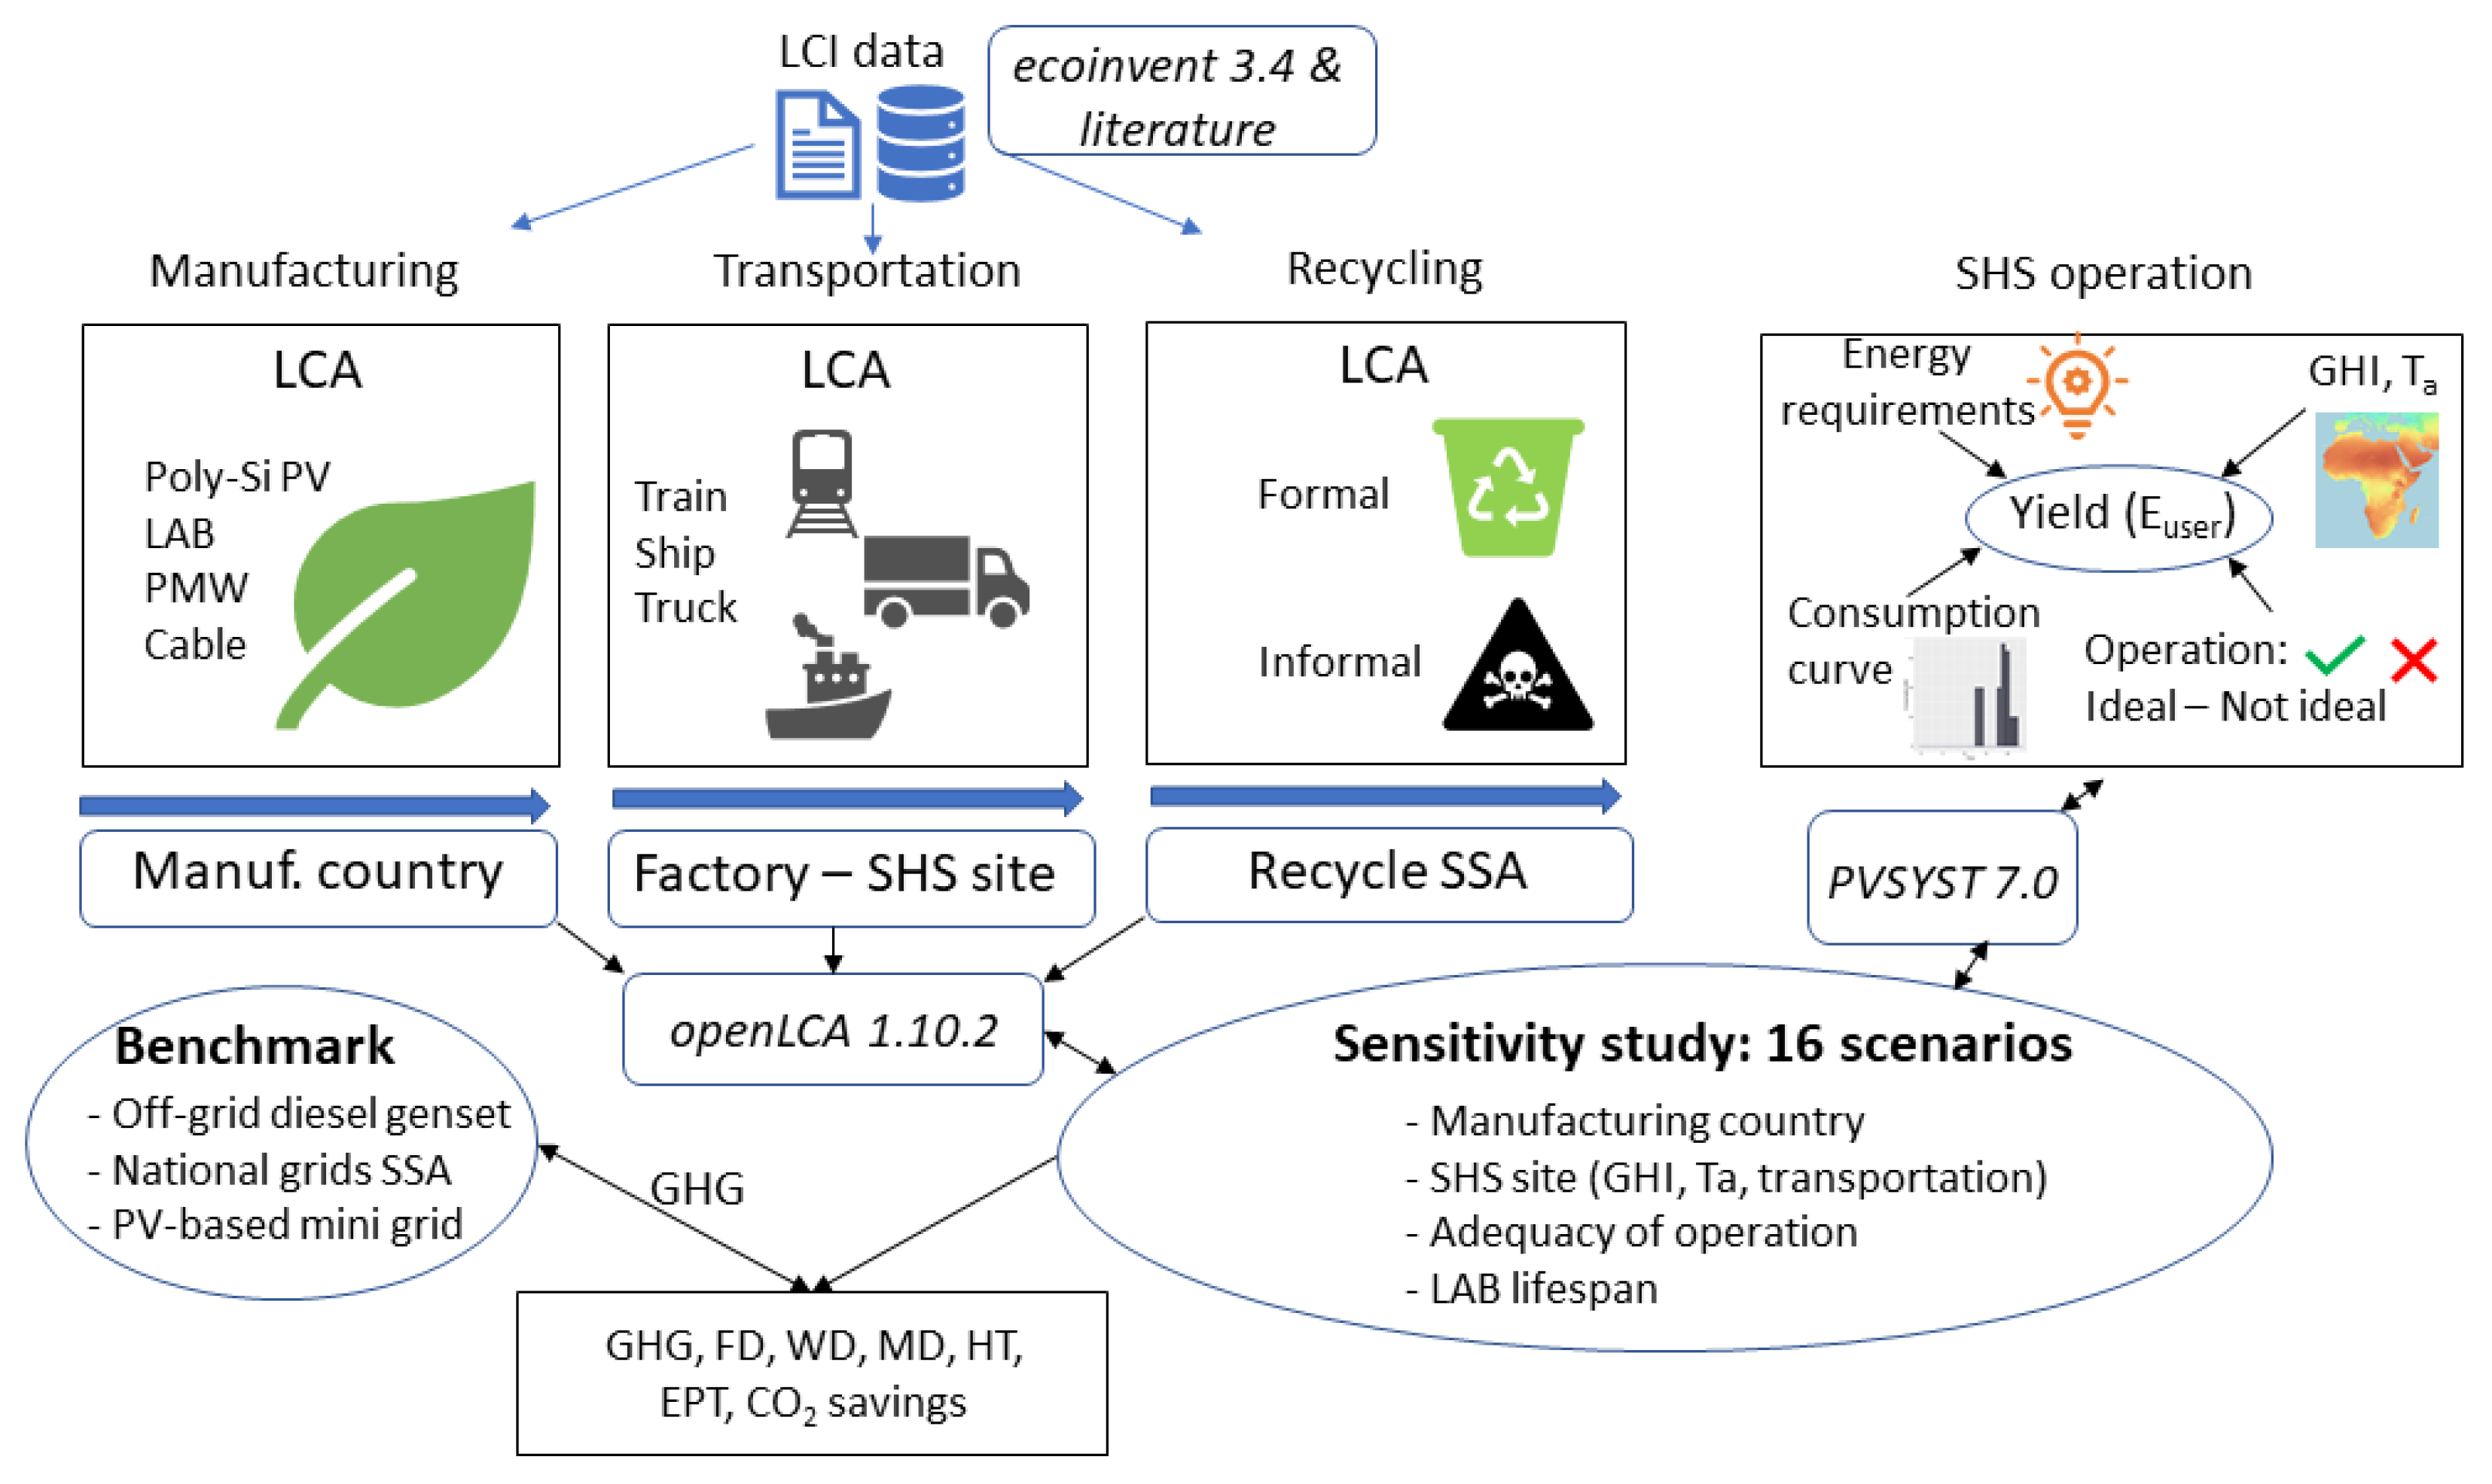
Figure 1 depicts the method followed along the study combining LCI data for manufacturing, transportation and recycling, SHS modeling based on energy requirements and site conditions, the sensitivity study and the benchmark with other alternatives for electrification.
2.1. Goal and Scope of the Study
The goal of the study was to evaluate the environmental impact of SHS under SSA conditions regarding the technology used, solar resources and user-related variables, such as adequacy of operation and battery lifespan and compare it with other alternatives for electrification: national grids, PV-based mini grids and diesel generators.
The SHS analyzed is composed of a poly-crystalline PV module, a LAB battery, a PWM charge controller and copper cable. The functional unit used was 1 kWh of DC electricity provided at the gate of the charge controller. The inverter, if present in certain installations, and plugged devices, such as light bulbs, phones, etc., were not included in the study. The choice of a functional unit as energy unit instead of power unit eases normalizing generation and benchmarking with other technologies for electrification [29].
Other alternatives of electrification usually work in AC, while SHS considered in the study work in DC. System boundaries included raw material extraction, manufacturing, transportation, installation, operation and end of life management of each of the components considered. Unlike for larger PV installations, the impact of the construction stage for SHS was neglected: no vegetation or land management were considered. Most SHS in SSA are installed with basic fixation to the roof without additional framing or specific foundations. Operation and maintenance (cleaning of the PV module and replacement of components if necessary) was assumed to be performed by the SHS owner with a minimum transportation impact.
The audience of this study is intended to be researchers involved in SDG7 and the European Green Deal (specific research line of ’Accelerating the green transition and energy access partnership with Africa’) [36] and also policy makers and environmental impact practitioners as it provides updated life cycle inventories and a sensitivity study addressing critical variables influencing the environmental impact of SHS.
2.2. Metrics
2.2.1. Cumulative Energy Demand
The guidelines described by Antonanzas et al. (2019) [29] were followed for computing the cumulative energy demand (), which pay attention only to non renewable energy sources. The was obtained from the LCA modeling.
2.2.2. Energy Payback Time
Based on the , the SHS energy payback time () shows the period in which the energy used from the SHS compensates the . As it is the energy used and not the energy that can be generated by the SHS that is considered for the calculation, the can be optimized by displacing consumption to periods with the battery fully charged to maximize usable generation. Equation (1) depicts the formula.
where is the annual electricity used by the SHS user, obtained from the SHS system modeled with PV-SYST 7.0 [37], and is the SHS conversion factor of primary energy to electricity. A conservative value of 2 for was assumed [38].
2.2.3. CO Savings
The CO saving potential () describes the amount of CO emissions avoided by the SHS during its lifetime (Equation (2)).
where is the CO displazed from using an off-grid diesel generator and GHG are the greenhouse gases emitted during the SHS lifetime.
2.3. Life Cycle Impact Assessment and Software
The midpoint ReCiPe (H) [39] method was used to calculate the water (WD), fossil (FD) and metal (MD) depletion; human toxicity (HT); and GHG emissions [40]. These indicators have been frequently used in the literature for benchmarking the environmental impact of energy sources [29,41]. The free open source openLCA 1.10.2 software [42] was considered integrating updated life cycle inventories from the literature and ecoinvent 3.4 [43], allowing the replication and modification of the study in the future. In addition, the cutoff approach with attributional inventories was selected to account for burden free recycled materials, considering primary production for primary user.
2.4. SHS Modeling
This study combines a SHS modeling with a LCA of its components to determine the environmental impact. First, a bottom-up approach was followed to design a SHS based on the necessities of a low income household in an off-grid region of SSA as it is depicted in Figure 1. The values considered for each of the parameters are presented in Section 3. The system was modeled with PV-SYST 7.0 [37] and the annual yield for each installation was obtained using irradiation values from PV-GIS [44]. Then, the LCA of each SHS during the entire lifetime was performed, and the environmental impact (according to five impact categories) of the SHS was calculated.
The total environmental impacts were combined with the annual yield from the installations to determine the impacts per functional unit and were compared to those resulting from mini-grids, national grids and diesel generators. A scenario analysis was performed to understand the environmental performance sensitivity to key design parameters.
2.5. Scenarios
Sixteen different scenarios were created to understand the impact of manufacturing location, SHS operation, solar irradiation and climate conditions of installation site and LAB lifetime on the environmental impact of SHS.
As electricity has been shown to be the largest contributor to GHG emissions from PV manufacturing [29,45,46] and the carbon emission factor from electricity production varies significantly between countries due to differences in electricity origin, two countries that manufacture SHS components were assessed: China, the world’s largest manufacturer of SHS components, and Germany, also an important agent in the SHS supply chain. In addition to GHG emissions, electricity is also a large contributor to the other environmental impacts considered.
SHS location and operation are also key variables in understanding the environmental impact of these systems. As an example, the and the are dependent on the electricity supplied by the SHS, which varies with site conditions and user operation. With respect to site conditions, two locations with different global horizontal irradiation (GHI) were analyzed.
Regarding SHS operation, some practices can result in yield losses that, consequently, have an effect on the SHS environmental impact. This scenario will support the discussion about how user-training could improve the environmental impact. The following elements were considered: yield losses related to near shading, tilt and orientation angles, temperature, and soiling; battery storage temperature, the DOD and the battery speed rate of discharge; and charge controller and cabling characteristics. These technical losses have been included in two categories.
As battery operation mainly affects the battery lifetime, and malfunctions in its operation have been assumed to reduce battery lifetime from the 4 year baseline to 2. Due to the great diversity of the rest of technical losses (described in Annex I) and the simultaneous combination of them, they were grouped into two different scenarios: a scenario with minimum technical losses ’Ideal’ and other considering a loss of 30% of the PV yield, denoted as ’Not ideal’.
The value of 30% was previously assumed in the literature to account for user dependent losses [47]. Appendix A describes user dependent losses. Data describing the differences between the electricity grids in China and Germany, site selection and operation malfunctions are described in Section 3.
Table 1 summarizes the scenarios considered for environmental impact analysis.
3. Data
This section is structured based on the source of data, either SHS design and site conditions data (Section 3.1 and Section 3.2) or LCI related data (Section 3.3).
3.1. SHS Design Parameters
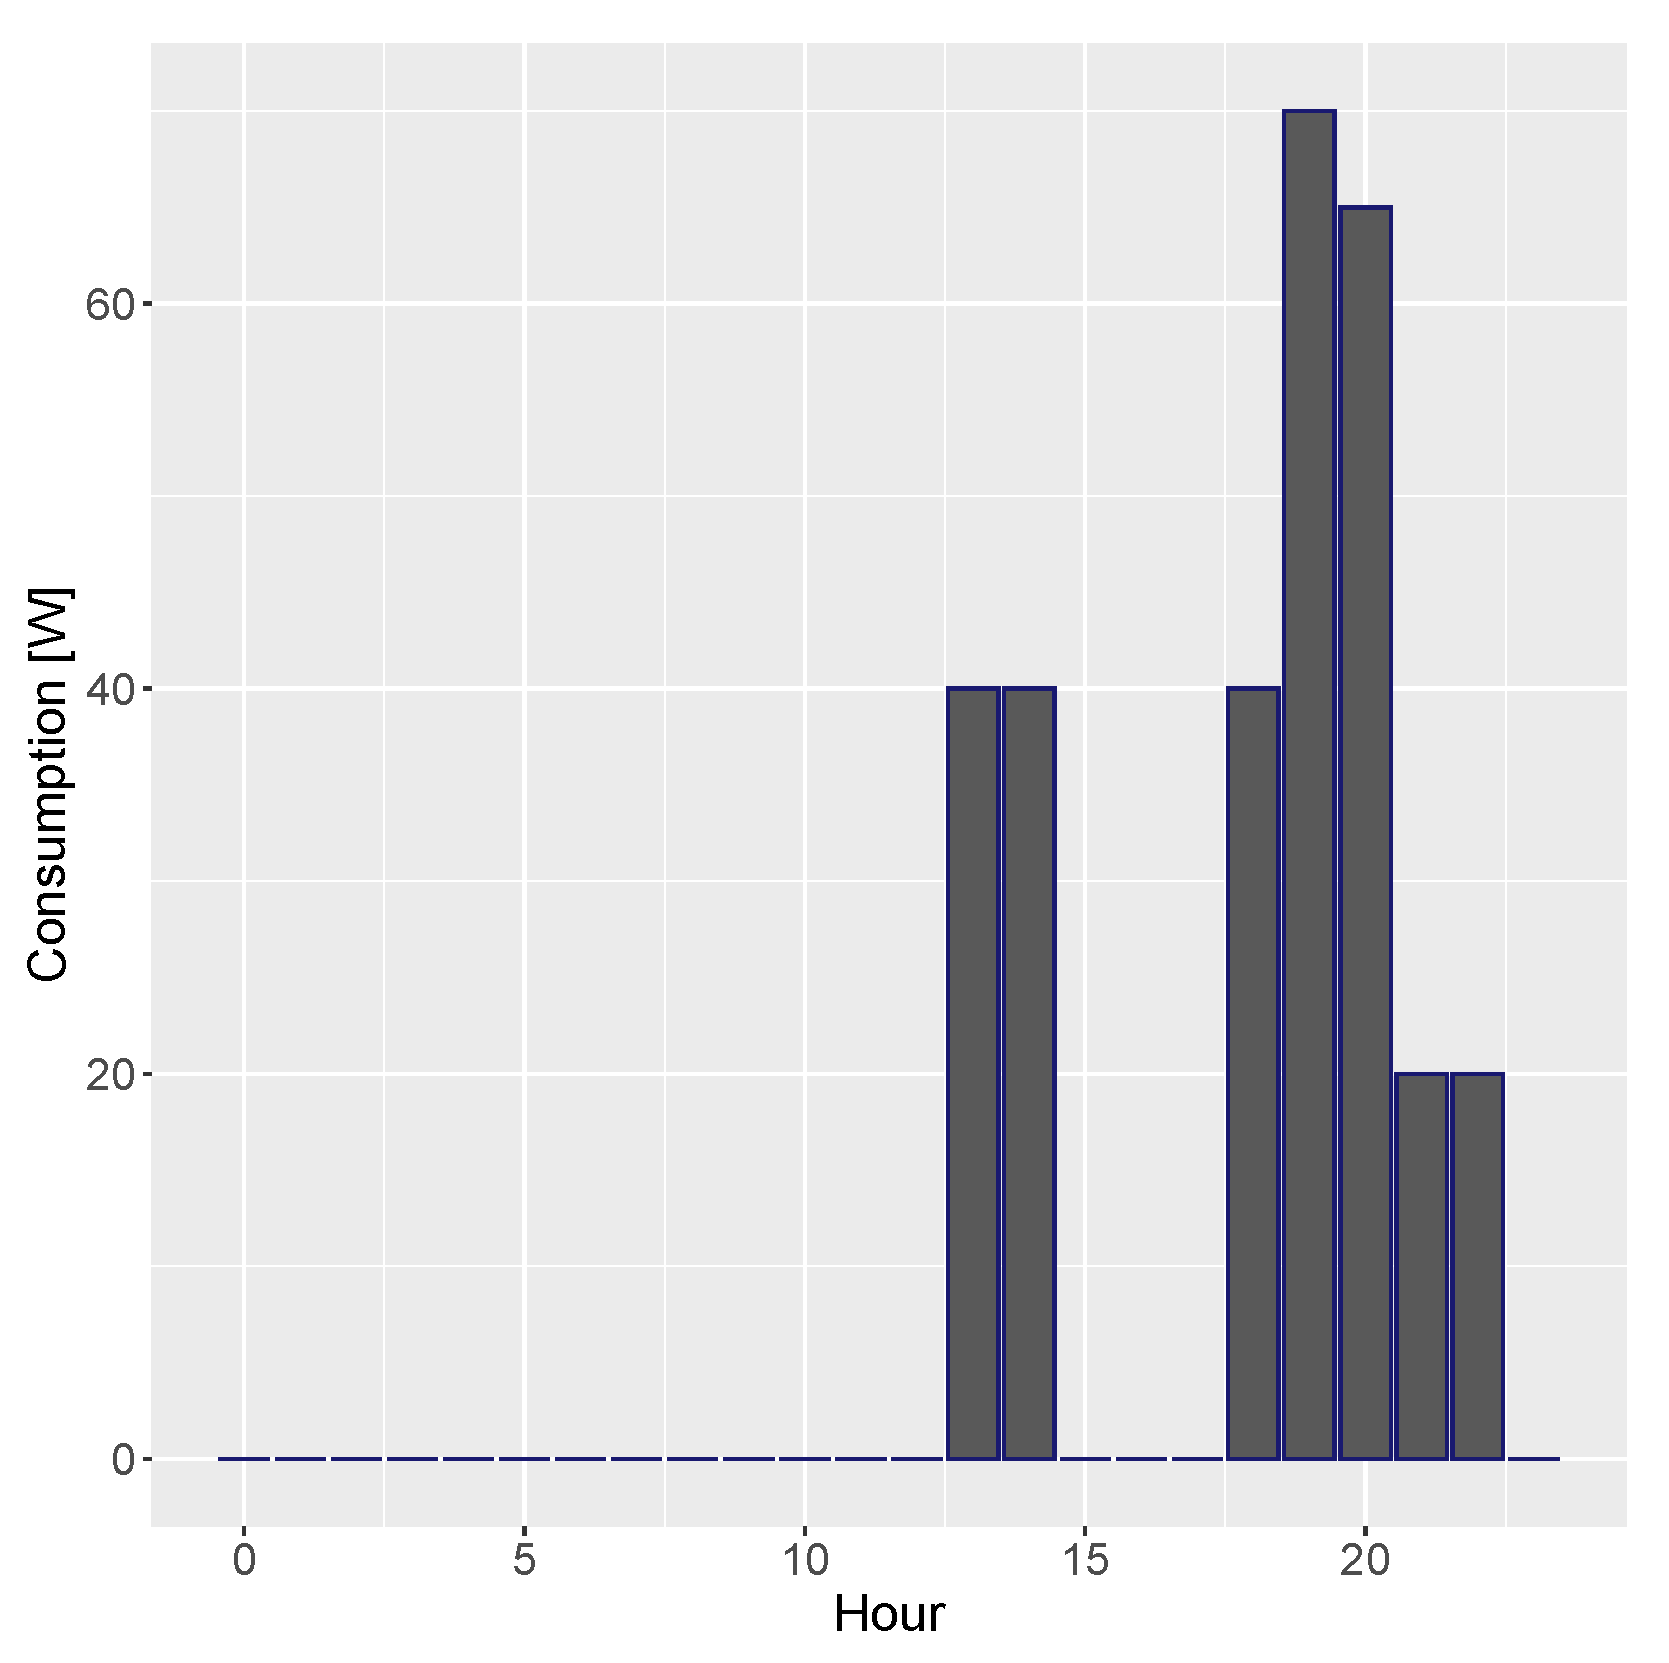
A bottom-up approach was used to calculate the electricity loads that the SHS must satisfy. DC energy uses for lighting (two light bulbs of 10 W operating 4 h), cell phone charging (two phones at 5 W for 1.5 h), an unspecified electric device (40 W for 5 h) and a stand-by LED (1 W for 24 h), adding up to a total of 319 Wh/day, were considered based on a previous field study [38]. Regarding the consumption rate, the well-described in literature evening-peak load curve for off-grid systems was considered based on specific assessments in SSA [48] and depicted in Figure 2.
3.2. Site Selection
The climatic conditions of two representative sites in SSA for high GHI (>2400 kWh/year) and low GHI (1850 kWh/year) were considered to represent a desertic site with low cloud cover: Gobabeb, Namibia (lat: −23.56°, lon: 15.04°, elev: 401 m), and an equatorial climate site, with higher prevalence of clouds and lower solar resource: Goma, DR Congo (lat: −1.66°, 29.22°, elev: 1536 m). The choice of these sites also responded to the selection of locations with low and high environmental impact related to truck transportation from the SSA port: 200 km for Gobabeb and 1800 km for Goma.
Eventually, a SHS composed of a 80 Wp poly-crystalline PV module, a 60 Ah 12 V LAB, 10 m of 2.5 mm copper wire and a PWM charge controller was designed to cover the necessities in both locations. Table 2 depicts the monthly accumulated global horizontal irradiation (GHI) with open data from PV-GIS [44] and average temperature at 2-m above the ground (Ta) and wind speed at 10-m above the ground (Ws) for both sites [37]. A solar fraction, the ratio of energy provided by the SHS () to energy required by the user, of at least 0.85 was considered as a compromise between over-design and energy demand coverage.
The solar fraction depends on the demand curve. Thus, higher solar fractions could be achievable with demand curves following the solar resource and relying less on energy supplied by the LAB. The in Gobabeb reached 116.0 kWh/year and in Goma 98.6 kWh/year, while the solar fractions were 0.996 and 0.85, respectively.
3.3. Life Cycle Inventory for SHS
3.3.1. Manufacturing
The SHS analyzed was composed of a poly-crystalline PV module, a LAB battery, a PWM charge controller and copper cable. The poly-crystalline PV module manufacturing LCI was obtained from the review performed by Xie et al. (2018) [45] considering manufacturing conditions of 2013, integrating 2/3 of the PV crystalline industry. Later, this LCI was updated with latest improvements claimed by the PV manufacturing industry regarding electricity and water consumption, and module efficiency increases.
Reductions of 15% and 10% for electricity and water, respectively, with respect to values presented in Xie et al. (2018) [45], and efficiency increases from 15.0% to 17.5% were considered [29]. LCI data on LAB manufacturing was obtained from GREET (2019) [49]. Cabling and PWM were modeled using ecoinvent 3.4 [43] background information and assuming a copper wire of 2.5 mm and a PWM charge controller integrated by 0.015 kg of electronic components and 0.060 kg of polyvinyl chloride (PVC).
To determine the total amount of components used during the SHS lifetime, individual lifetimes were considered: SHS (20 years), PV module (20 years, 7.3 kg/item ), LAB (2 and 4 years, 24 kg/item), PWM charge controller (5 years, 0.075 kg/item) and cabling (20 years, 0.031 kg/m). This means, for example, that four PWM devices need to be manufactured, transported and recycled during the SHS lifetime. Table 3 depicts the lifecycle inventories (LCI) of the materials considered.
3.3.2. Transportation
The types of transportation and distances between manufacturing and SHS installations are shown in Table 4. Table 5 depicts the environmental impact indicators related to transportation. Goma represents a site with higher GHG emissions related to transportation than Gobabeb due to a larger distance covered by truck, the transportation type with highest carbon emissions per distance and unit of weight transported among the types considered.
3.3.3. End of Life
Formal recycling was considered for end of life treatment of SHS components. Formal recycling is understood as the controlled and unified process to minimize the negative impact into the environment. PV recycling in SSA still remains an informal activity but the expected deployment of PV (utility scale, mini grid and SHS) will bring massive PV material resources at the end of their lifetime, and thus formal recycling should become the standard.
Regarding PV module recycling, mechanical, thermal, acid leaching and electrolysis processes were considered to separate silicon and metals while using polymers for incineration and electricity generation [29,50]. LAB recycling has a longer tradition in SSA due to the use of LAB in the automobile sector. However, due to the lack of specific recycling inventories for LAB in SSA, formal recycling was obtained from ecoinvent 3.4 as performed in Europe; the same applies to cabling and PWM recycling, modeled with European conditions.
The empirical results found in LAB formal recycling facilities in SSA revealed much higher lead values than those found in European plants [51]. Under this scenario, the environmental impacts calculated for LAB formal recycling would be conservative. With the aim of addressing the impact of lead and antimony leaks in LAB recycling, informal recycling was analyzed. Informal recycling of LAB, being performed with minimum environmental guarantees, is a common practice in SSA [52]. Lead and antimony leaks are persistent and surface concentrations remain after long periods, which impacts HT [53].
Due to the lack of inventories of informal LAB recycling in SSA and the complexity of unifying a process that it is frequently performed outdoors, close or within inhabited areas, using basic instruments and smelting without protections for avoiding emissions [54,55], emissions of lead and antimony 10 and 100 times superior to formal recycling were assumed to analyze the impact of the HT indicator rather than considering informal recycling as part of the sensitivity study.
3.4. Scenario Analysis Data
As mentioned in Section 2, electricity consumption has a large impact on the PV panel environmental footprint, and this was the reason to create two separate manufacturing scenarios. Table 6 depicts the electricity mix in China and Germany with which the environmental indicators of electricity generation were calculated. China’s 2018 electricity grid was chosen in the absence of more recent data. A look at the carbon intensity of Chinese and German electricity generation (924 g CO/kWh and 377 g CO/kWh, respectively) reveals some large differences that also extend to the rest of environmental indicators.
While a high contribution of renewables and nuclear in Germany (59.3% of total electricity production) compared to that of China (31.8%) contributes to reduced GHG emissions, FD and WD, the use of lignite in Germany (16.3% of the mix), with a much higher HT emission factor associated, significantly penalizes the HT of electricity generation in Germany. The higher share of renewables in Germany, including technologies intensive in metal use, such as PV and Wind, contributed to a more intense MD for this country as well. In this line, electricity accounted to as much as 35–57% of GHG emissions, 35–50% of FD, 23–41% of HT and 41–77% of WD for PV module manufacturing.
4. The Results
LCA results from SHS components are described first, then, the scenario analysis and finally, the comparison with other alternatives for electrification.
4.1. Component-Level Results
The non renewable energy requirements for manufacturing, aggregated into the , were computed for each component and manufacturing country as depicted in Table 7.
The environmental indicators for manufacturing and formal recycling are depicted in Table 8. GHG emissions, FD and WD are higher if PV panels are manufactured in China vs. Germany: 34%, 17% and 245% higher, respectively, due to the different origin of electricity generation. The high use of lignite in Germany for electricity generation had a noticeable impact on HT, especially for PV module manufacturing—47% higher.
Regarding informal recycling, the sensitivity to lead and antimony emissions is evaluated in Table 9. HT increased by 164% and 807% for informal recycling with 10-fold and 100-fold increases in lead and antimony emissions, respectively, compared to formal recycling.
4.2. Scenario Analysis the Results
The environmental impact of one SHS during its entire lifetime is computed in Table 10. The results show that LAB lifetime is the main variable affecting all environmental indicators. Thus, scenarios considering a LAB lifespan of 2 years (scenarios 3–4, 7–8, 11–12 and 15–16) had environmental indicators 65–70% higher than similar scenarios with the only difference being a LAB lifespan of 4 years. In addition to this, GHG emissions and CEDnr were 7–12% larger for SHS installations in Goma compared to those of Gobabeb due to longer transportation by truck to reach final destination.
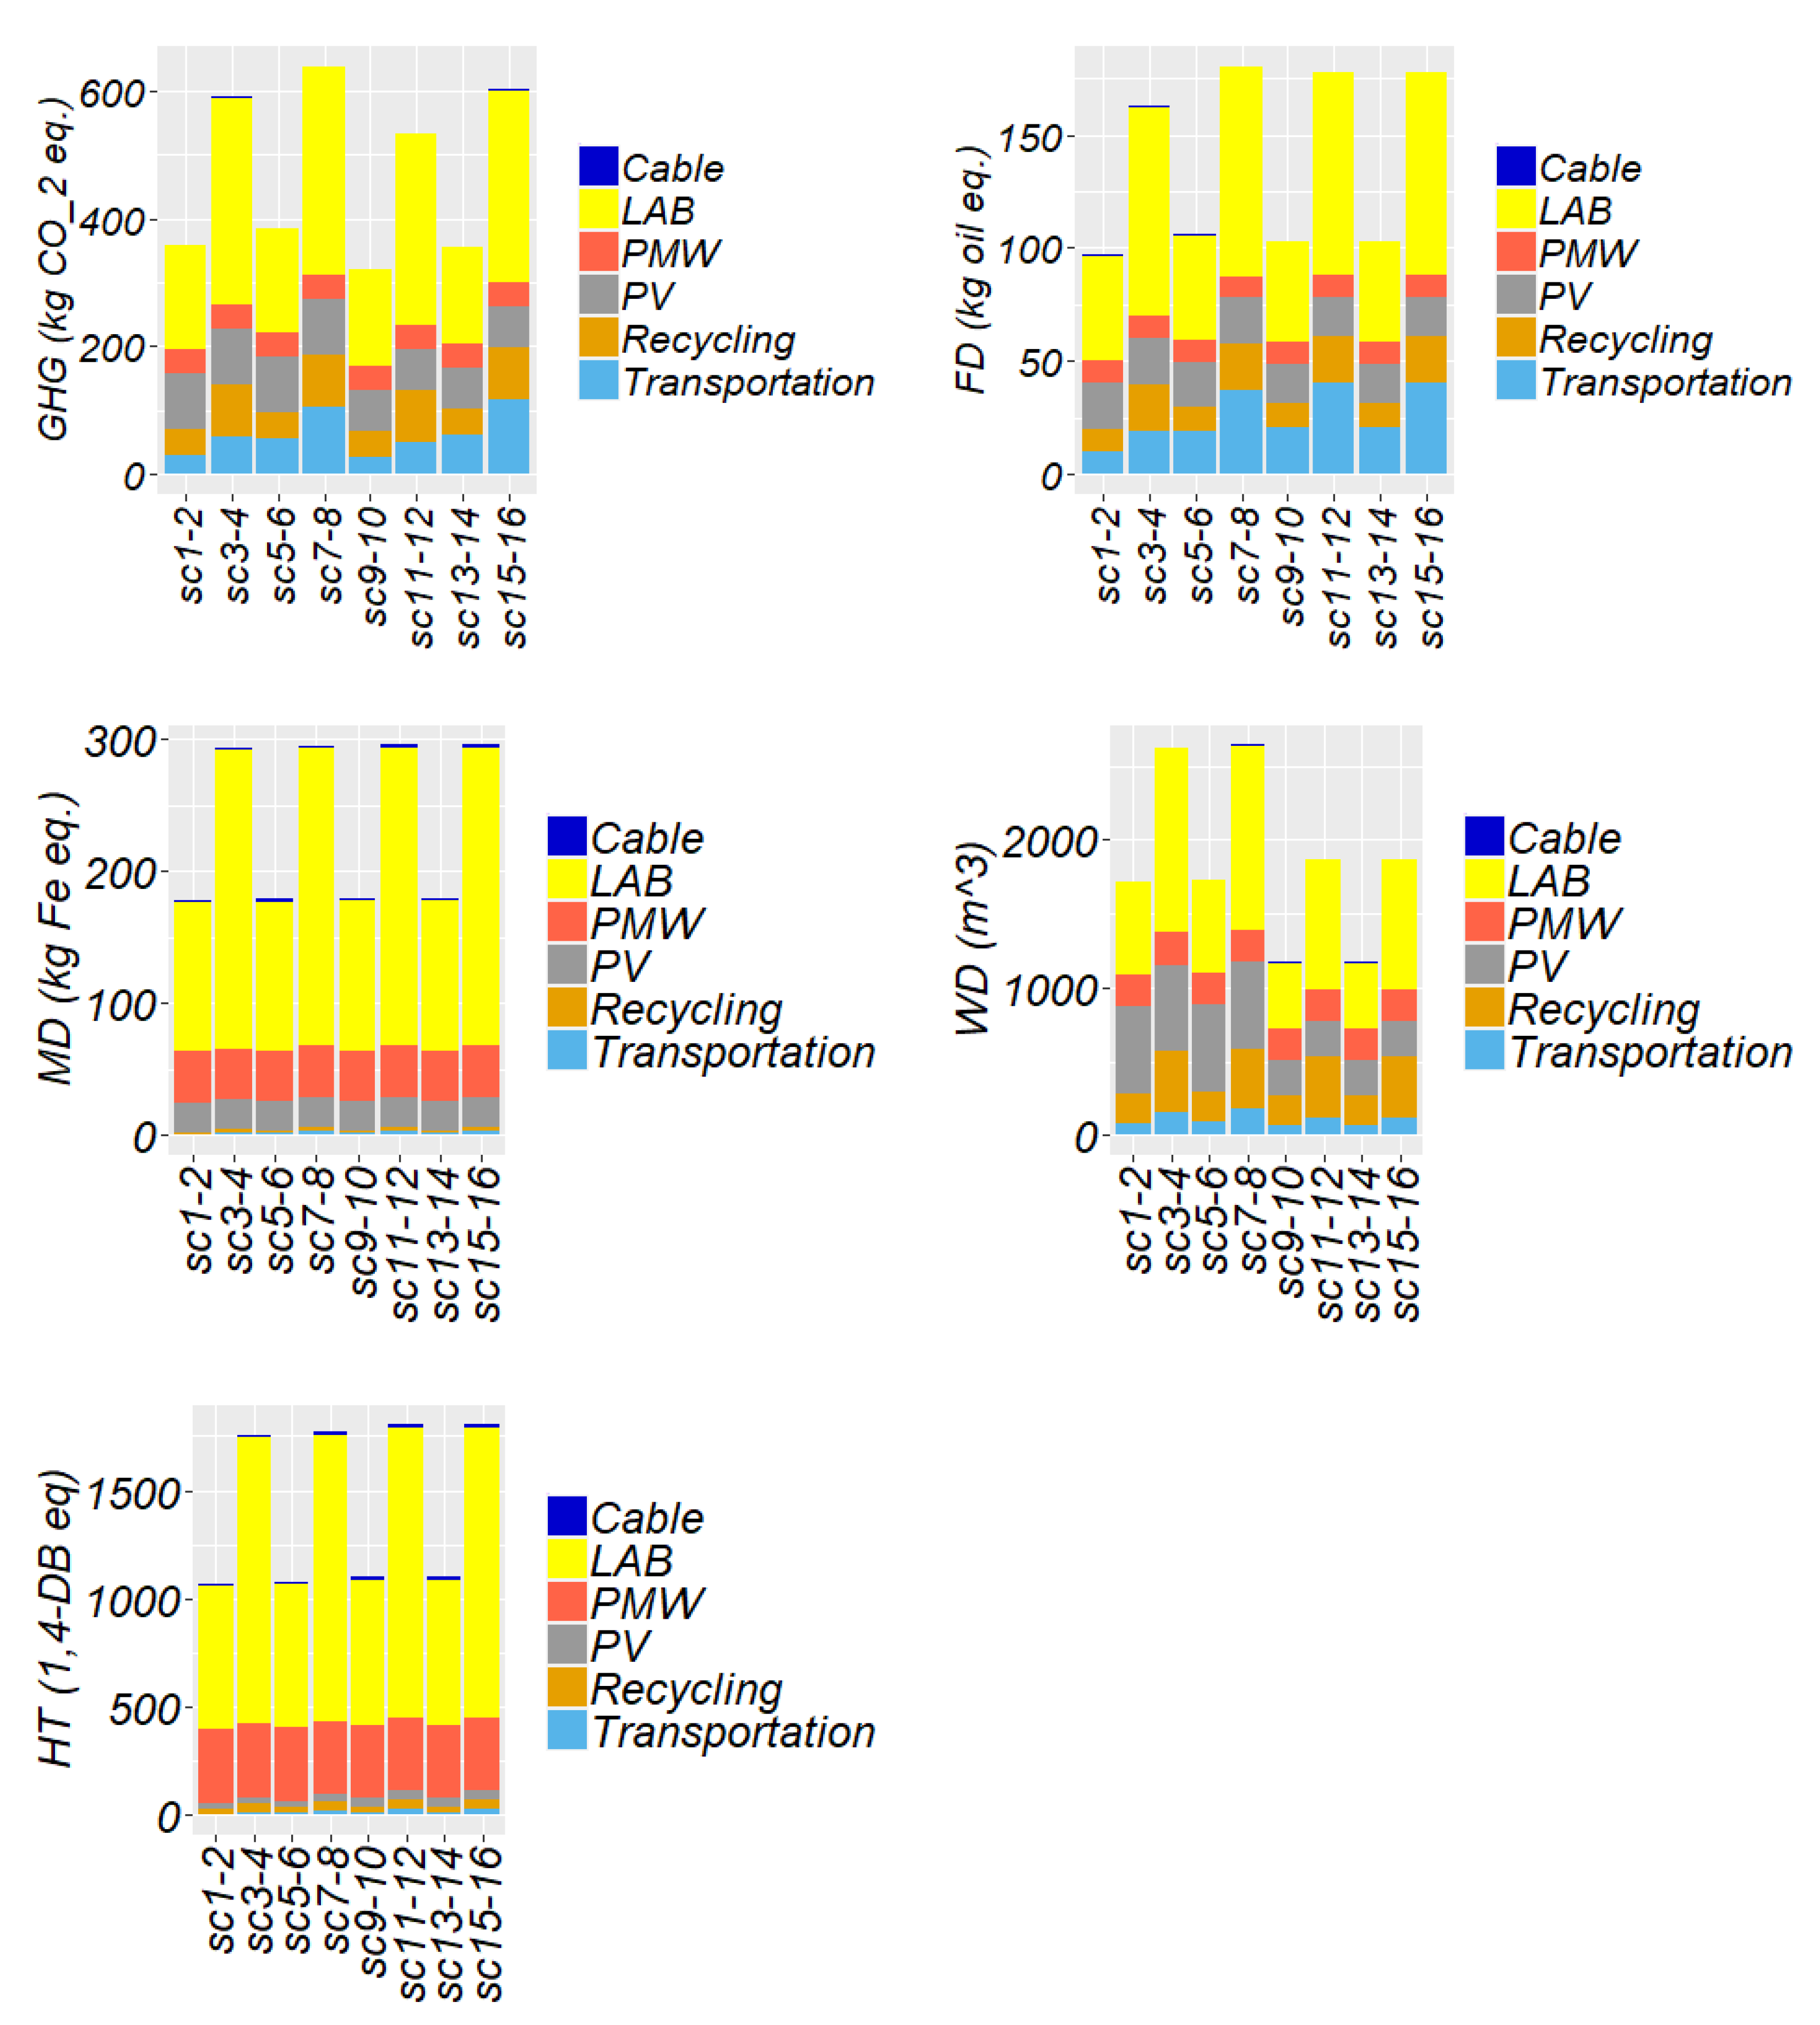
Figure 3 depicts GHG emissions, FD, MD, WD and HT disaggregated into manufacturing, transportation and recycling for each scenario. Regarding components, the LAB was the most important contributor to all the environmental indicators considered. The contribution of LABs to total GHG emissions and FD ranged 42–56%, respectively, for the 4 and 2 year LABs lifetime scenarios. The contribution of LABs to MD and HT reached 63–76% and 36–47% for WD. Regarding GHG and FD significance of PV module, PMW charge controller and cabling contributions ranged 11–24% (highest significance for scenarios 1–2), 6–12% (highest for scenarios 9–10) and 0.13–0.25%, respectively.
Transportation was responsible for up to 19% of the total GHG emissions and FD in scenarios that combined long transportation distances and low LAB lifetime (scenarios 15–16). The impact of transportation on WD, MD and HT was negligible compared to the impact of the manufacturing phase. Recycling accounted for 11–15% of the total GHG emissions and FD. As shown in Table 9, informal recycling increased HT 164% to 807% considering a 10-fold and 100-fold increase in lead and antimony emissions with respect to formal recycling, respectively.
Table 11 depicts the electricity delivered by the SHS based on the installation site and adequacy of operation, the EPT, the CO savings and the GHG emission factor for each scenario. Manufacturing country and transportation were a second order factor for EPT. The best cases, scenarios 2 and 10 both with ’Ideal’ user operation, achieved EPTs of 5.7 and 5.3 years considering the manufacturing countries of China and Germany, respectively.
If ’Non ideal’ operation was considered, as for scenarios 1 and 9, the EPT reached 8.1 and 7.6 years, which represents an increase of 2.4 and 2.3 years, respectively. Thus, some minor changes in SHS operation, as described in Section 3.4, can have a large impact on the environmental performance. For instance, introducing optimum tilt and orientation PV angles, avoiding shades, keeping the LAB in a cool place and with proper PV cleaning schedule, among others, could reduce the EPT in 2 years.
As a contrast, the worst case scenarios, 7 and 15, which considered a LAB lifespan of 2 years in a site with low GHI and ’Not ideal’ user operation reached EPT of 17.7 and 17.3 years for China and Germany, values close to the SHS lifetime. If ’Ideal’ user operation was assumed (scenarios 8 and 16), the EPT was improved by 5.3 and 5.2 years, respectively.
The CO savings ranged between 2203 and 862.5 kg CO depending on the scenario considered: scenarios 10 (best) and 7 (worst). With the aim of comparing SHS electricity with other alternatives of electrification the relative GHG emissions were computed for each scenario. The results showed that the relative GHG emissions were highly dependent on the scenario considered ranging from values of 0.138 and 0.463 kg CO/kWh.
4.3. Comparison to SHS Alternatives
Current alternatives to SHS for off-grid electrification in SSA are usually based on PV-based mini grids and diesel generators. In a recent study analyzing mini grids for off-grid electrification in West Africa, 95% of them are currently based on 100% PV and hybrid PV-diesel technologies [32]. Alternatively, diesel generators have been traditionally used in stand-alone systems, 100% diesel mini grids and also as back-up systems for grid connected users, while other hybrid technologies, PV-wind-diesel, PV-wind and hydro-diesel, among others, have a much lower implementation in SSA [38].
With the aim of comparing different electrification approaches, Table 12 depicts the relative GHG emissions of national grids, 100% PV and hybrid PV-diesel mini grids for a variety of countries in SSA. 100% PV mini grids and hybrid PV-diesel mini grids achieved a GHG emission factor of 0.12–0.16 kg CO/kWh and 0.14–0.23 kg CO/kWh, respectively. These values are equivalent to the GHG emission factor obtained in most SHS scenarios except for scenarios 3, 7, 8, 11 and 15, corresponding to scenarios with LAB lifespans of 2 years and with ’Not ideal’ user operation, except scenario 8 that corresponds to the site with low GHI, components manufactured in China and user-operation ’Ideal’.
Regarding GHG emission factors from national grids, 16 out of 18 of the SSA countries analyzed surpassed 0.4 kg CO/kWh (only Burkina Faso and Sudan had lower GHG emissions), while only scenarios 7 and 15 corresponding to SHS installed in sites with low GHI, LAB lifespan of 2 years and user operation ’Not ideal’ surpassed this value. This means that, under most scenarios, the electricity provided by a SHS had a lower climate change impact than that from national grids in SSA and was equivalent to PV-based mini grids. However, SHS emission factors remain much higher than those of utility-scale PV, which have been shown to range 0.011–0.013 kg CO/kWh in sites with GHI of 2070 kWh/m year [29].
Compared to the GHG emissions from a diesel generator, estimated at 1.090 kg CO/kWh, all SHS scenarios considered provided electricity with significantly lower GHG emissions. Only in Mozambique, Namibia, South Africa and Zambia, the national grid had a comparable GHG emission factor to diesel generators.
5. Discussion
LABs were found to be the weakest part of the SHS and with the highest impact on the LCA, which was also found in previous studies [23,24,25]. While most of the batteries deployed in SHS in SSA rely on the lead-acid technology, Li-ion batteries for SHS are increasing the market share in other regions, such as Europe and North America [58]. Market trend in SSA and the higher capital cost per new battery are factors that explain the relatively slow deployment of Li-ion batteries for SHS in this region.
However, some PV-based mini grids in SSA have recently adopted Li-ion batteries [38], which might contribute to the expansion of this technology also for SHS. How Li-ion batteries will be treated at the end of their life to score the environmental impact remains a question due to the lack of Li-ion battery recycling facilities in SSA [6]. In this line, future investigations should analyze and compare the environmental impact of SHS in SSA considering Li-ion batteries analyzing the end of life treatment.
The lack of literature related to informal LAB recycling in SSA poses a great challenge when evaluating the HT. In this line, future studies treating the typification and mapping of informal LAB recycling processes in SSA would help to reduce the uncertainty related to HT and to put more light into a critical impact of SHS for human health.
In this study, the CO savings were calculated comparing SHS to the electricity generated with a diesel generator, which has traditionally been the most frequently alternative for off-grid electrification. However, the transition from no electrification to SHS is highly frequent in SSA [59], and, under this scenario, no CO saving would occur. Instead, the SHS would represent the only electricity source for the user. When benchmarking SHS with PV-based mini grids, SHS achieved GHG emissions equivalent in most scenarios.
Regarding scenarios of SHS installed in sites with low GHI, with LAB lifespans of 2 years and operated not ideally, the EPT reached values higher than 17 years, very near the expected lifespan of the SHS, estimated at 20 years. This means that, under worse considerations of GHI, LAB lifespan or user operation the EPT could exceed the SHS lifespan. Under these cases, more energy would be required to operate the SHS than the energy provided to the user. Even under these extreme cases of high environmental impact compared to other scenarios evaluated for SHS, the discussion regarding the environmental impact of SHS should not block the positive contributions that this technology represents for early electrification in SSA.
Unlike for utility scale power facilities and mini grids, whose design and operation are performed and managed by technical professionals with specific training, SHS in SSA are frequently sold, installed and operated by people without specific training, in many cases, making the transition from no electrification to SHS [59]. This lack of training is the source of a variety of non-optimal choices (described in Annex I) affecting the energy yield, the component lifespan and consequently, the environmental impact of the whole system.
Improvements in SHS operation training would lead to achieving at least two major goals: the reduction of environmental impact of SHS electrification and improvement of user satisfaction with these systems via a lower LCOE. This training could be targeted either to users and/or to hardware store staff that could be evaluated by off-grid policy makers, who, at the same time, should impose minimum standards to avoid uncertified SHS components with much lower lifespans [21] reaching the market.
Not only can SHS user training influence a wide range of technical choices regarding installation and operation but it can also serve to influence the SHS consumption curve, which, in this study, was considered as the frequently described in literature evening-peak curve [48]. Although it is not always feasible for users to adopt a consumption curve more simultaneous with the solar resource (i.e. users not at home during the daytime), displacing energy consumption to periods of time with high solar irradiance and the LAB fully charged enables a higher availability of usable energy and the avoidance of deep LAB discharges, with the subsequent reduction of environmental impact.
In addition, if basic weather forecasts are considered as user-decision tools, for instance, displacing weekly high energy consumption from cloudy-overcast days to sunny forecast days, that would also contribute to reduce the environmental impact of SHS through lower LAB discharges. The impact of this “smart” SHS use into the LCA should be a matter of future investigations.
6. Conclusions
SHS have attracted high interest in unelectrified households in SSA due to the ease of installation and the reduction of cost. However, the environmental impact of these systems has been scarcely studied for this region, and previous analysis frequently considered technologies that are not representative for current technology trends in SSA: poly-crystalline PV module, lead-acid battery and PMW charge controller. SHS for two different locations were modeled, and their environmental impacts were assessed. A sensitivity analysis on some of the main qualitative parameters that affect environmental performance was performed, where the impact of manufacturing country, installation site, LAB lifespan and adequacy of user operation were analyzed, a total of 16 scenarios.
The results showed that the LAB of the installation was the main contributor to most of the environmental impacts considered, with a share of 36–76% in GHG emissions, FD, MD, WD and HT. If LAB recycling was performed in an informal way, the HT values increased severely.
The environmental impact of SHS showed a large variability with respect to certain model parameters, such as the adequacy of operation and LAB lifespan, while the impact of other modeling choices, such as the manufacturing country, was more limited. In this line, GHG ranged between 0.138 kg CO/kWh and EPT of 5.3 years corresponding to a SHS manufactured in Germany, with minimum truck transportation, installed in a site with high GHI, user-operation ’Ideal’ and battery lifespan of 4 years and GHG of 0.463 kg CO/kWh and EPT of 17.7 years for a system manufactured in China, with major truck transportation to a site with low GHI, operated ’Not Ideal’ and with a battery lifespan of 2 years.
SHS were benchmarked with PV-based off-grid mini grids, national grid and diesel generators achieving GHG equivalent to PV-based mini grids for most scenarios and significantly lower GHG compared to national grids and diesel generators.
Author Contributions
Conceptualization: F.A.-T. and J.A.; methodology: F.A.-T.; software: F.A.-T. and J.A.; formal analysis: F.A.-T. and J.A.; writing—original draft preparation: F.A.-T. and J.B.-F.; supervision: F.A.-T. and J.B.-F. All authors have read and agreed to the published version of the manuscript.
Funding
F. Antonanzas-Torres would like to express his gratitude for the postdoctoral fellowship Juan de la Cierva Incoporación 2018 (IJC2018-037635-I) granted by the Spanish Ministry of Science, Innovation and Universities.
Institutional Review Board Statement
Not applicable.
Informed Consent Statement
Not applicable.
Data Availability Statement
Not applicable.
Conflicts of Interest
The authors declare no conflict of interest.
Abbreviations
The following abbreviations are used in this manuscript:
| Combined cycle gas turbine | |
| CO displazed from using off-grid diesel generator | |
| Non-renewable cummulative energy demand | |
| Conversion factor of primary energy to electricity | |
| Depth Of discharge | |
| Annual electricity used from SHS | |
| Energy payback time | |
| Fossil depletion | |
| Greenhouse gas | |
| Global horizontal irradiation | |
| Human toxicity | |
| Lead-acid battery | |
| Life cycle assessment | |
| Life cycle inventory | |
| Levelized cost of electricity | |
| Metal depletion | |
| Maximum power point tracking | |
| Pulse width modulation | |
| Photovoltaic | |
| Sustainable Development Goal 7 | |
| Solar home system | |
| CO saving potential | |
| Sub-Saharan Africa | |
| Air temperature | |
| Water depletion | |
| Wind speed |
Appendix A. SHS User Adequacy
With respect to PV yield losses and the Ideal and Not ideal scenarios, as mentioned in Section 2, PV-related losses usually come from near shading, tilt and orientation angles, temperature-derived losses associated to the fixing method and soiling. While far-horizon shades are generally complex to be avoided due to the household nature of SHS, near-shading is frequently avoidable or optimized by a correct PV module location or management of near bodies [60].
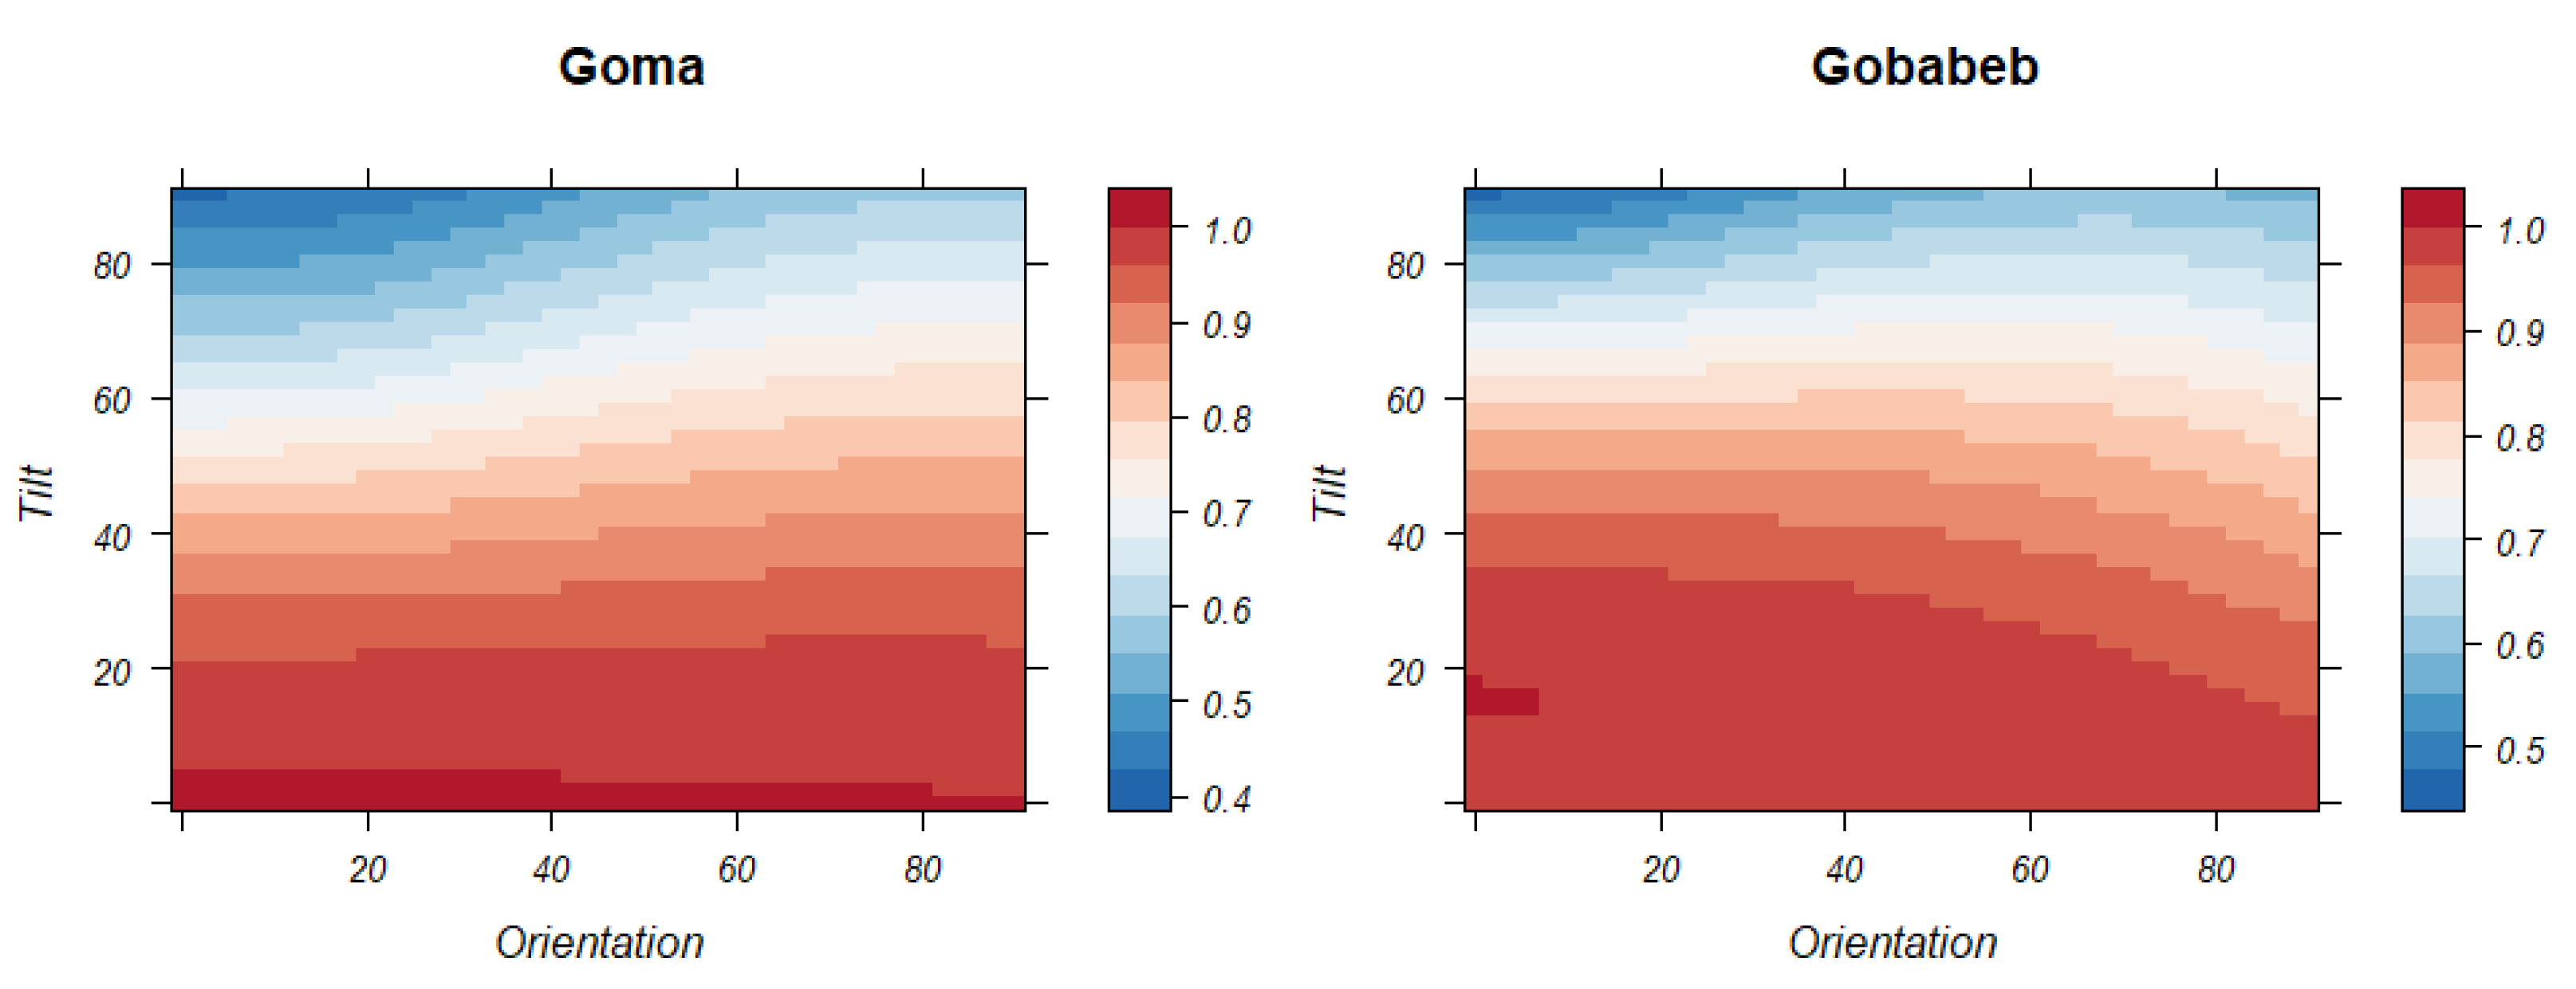
Near-shading not only impacts PV generation with annual losses ranging from 2% to 12.5% for small posts or bodies [61] but also may contribute to PV module early degradation through hotspots, which reduces PV efficiency and lifetimes. In addition to shading, the tilt and orientation angles have a direct impact on the PV yield. Figure A1 depicts variations in PV yield for the tilt and orientation angles for Goma and Gobabeb. Losses attributed to not-optimal angles could rise to 20–30% for angles deviating by 40°.
Figure A1.
Sensitivity of the PV yield to orientation and tilt angles (°) per unit (e.g., 0.9 accounts for 90% of the potential yield under optimum angles). Own elaboration with GHI data with permission from PVGIS [44].
Figure A1.
Sensitivity of the PV yield to orientation and tilt angles (°) per unit (e.g., 0.9 accounts for 90% of the potential yield under optimum angles). Own elaboration with GHI data with permission from PVGIS [44].

Regarding the PV fixing method, it is a common practice for SHS users to fix PV modules directly to household roofs, saving the cost of an independent structure, but, at the same time, likely failing to achieve optimum tilt and orientation angles. This also hinders PV module ventilation with the implicit decay of PV efficiency at a rate of 0.35–0.41°C from the nominal operating cell temperature of 45 °C [62,63]. The persistence of sheet metal roofs in large regions of SSA, with a higher thermal conductivity, contributes to fostering PV-cell warming and increasing thermal losses. Furthermore, soiling on the PV module and lack of appropriate cleaning schedules introduces outstanding losses, which in arid or desert regions can reach the range of 15–20% [64].
Appendix A.1. Battery
Batteries represent the weakest part of SHS in terms of lifetime and cost for the user. The choice of battery technology usually depends on the capital cost -not the levelized cost of electricity (LCOE)- and availability in local markets. Lead-acid car batteries and lead-acid absorbent glass mats are typical for SHS in SSA, while Li-ion batteries remain minoritarial [20]. The initial battery choice influences the number of discharge cycles (life-span) under a certain depth-of-discharge (DOD). The battery storage temperature, the DOD and the speed rate of discharge have a critical impact reducing the battery storage capacity and the life-span at higher values [65]. For a detailed review on battery degradation in SHS, the authors refer to [15].
Appendix A.2. Charge Controller and Cabling
Using a PWM instead of a MPPT charge controller leads to non optimum tracking of the PV current-voltage characteristic curve. Frequent issues associated to the PWM charge controller come from bypassing the device to obtain deeper LAB discharges with the subsequent LAB life-span reduction [21]. In addition to this, non-optimum cable thickness, inadequate cable connections and excessive cable length can lead to electric losses.
References
- UN. United Nations General Assembly: Transforming Our World: The 2030 Agenda for Sustainable Development; The General Assembly of the United Nations: Washington, DC, USA, 2015. [Google Scholar]
- IEA; IRENA; UNSD; WB; WHO. Tracking SDG 7: The Energy Progress Report 2020; IRENA: Washington, DC, USA, 2020. [Google Scholar]
- Falchetta, G.; Pachauri, S.; Byers, E.; Dany, O.; Parkinson, S.C. Satellite observations reveal inequalities in the progress and effectiveness of recent electrification in Sub-Saharan Africa. One Earth 2020, 2–4, 364–379. [Google Scholar] [CrossRef]
- ESMAP. Mini Grids for Half a Billion People: Market Outlook and Handbook for Decision Makers; World Bank: Washington, DC, USA, 2020. [Google Scholar]
- ESMAP. Beyond Connections Energy Access Redefined: Conceptualization Report; The World Bank Group: Washington, DC, USA, 2015. [Google Scholar]
- Diouf, B.; Avis, C. The potential of Li-ion batteries in ECOWAS solar home systems. J. Energy Storage 2019, 22, 295–301. [Google Scholar] [CrossRef]
- López-Vargas, A.; Fuentes, M.; Vivar, M. Current challenges for the advanced mass scale monitoring of Solar home Systems: A review. Renew. Energy 2021, 163, 2098–2114. [Google Scholar] [CrossRef]
- IRENA. Solar PV in Africa: Costs and Markets; IRENA: Bonn, Germany, 2016. [Google Scholar]
- Gebreslassie, M.G. Solar home systems in Ethiopia: Sustainability challenges and policy directions. Sustain. Energy Technol. Assess. 2020, 42, 100880. [Google Scholar] [CrossRef]
- Tillmans, A.; Schweizer-Riesb, P. Knowledge communication regarding solar home systems in Uganda: The consumers’ perspective. Energy Sustain. Dev. 2011, 15, 337–346. [Google Scholar] [CrossRef]
- Soltowski, B.; Bowes, J.; Strachan, S.; Anaya-Lara, O. A Simulation-Based Evaluation of the Benefits and Barriers to Interconnected Solar Home Systems in East Africa; IEEE PES/IAS PowerAfrica: Cape Town, Sourth Africa, 2018. [Google Scholar]
- Azimoh, C.L.; Wallin, F.; Klintenberg, P.; Karlsson, B. An assessment of unforeseen losses resulting from inappropriate use of solar home systems in South Africa. Appl. Energy 2014, 136, 336–346. [Google Scholar] [CrossRef] [Green Version]
- Azimoh, C.; Klintenberg, P.; Wallin, F.; Karlsson, B. Illuminated but not electrified: An assessment of the impact of Solar Home System on rural households in South Africa. Appl. Energy 2015, 155, 354–364. [Google Scholar] [CrossRef] [Green Version]
- Narayan, N.; Chamseddine, A.; Vega-Garita, V.; Qin, Z.; Popovic-Gerber, J.; Bauer, P.; Zemana, M. Exploring the boundaries of Solar Home Systems (SHS) for off-grid electrification: Optimal SHS sizing for the multi-tier framework for household electricity access. Appl. Energy 2019, 240, 907–917. [Google Scholar] [CrossRef]
- Narayan, N.; Papakosta, T.; Vega-Garita, V.; Qin, z.; Popovic-Gerber, J.; Bauer, P.; Zeman, M. Estimating battery lifetimes in Solar Home System design using a practical modelling methodology. Appl. Energy 2018, 228, 1629–1639. [Google Scholar] [CrossRef]
- Ayengoa, S.P.; Schirmer, T.; Kairies, K.-P.; Axelsen, H.; Sauer, D.U. Comparison of off-grid power supply systems using lead-acid and lithium-ion batteries. Sol. Energy 2018, 162, 140–152. [Google Scholar]
- Posorski, R.; Bussmann, M.; Menke, C. Does the use of Solar Home Systems (SHS) contribute to climate protection? Renew. Energy 2003, 28, 1061–1080. [Google Scholar] [CrossRef]
- Fuentes, M.; Vivar, M.; Hosein, H.; Aguilera, J.; Muñoz-Cerona, E. Lessons learned from the field analysis of PV installations in the Saharawi refugee camps after 10 years of operation. Renew. Sust. Energy Rev. 2018, 93, 100–109. [Google Scholar] [CrossRef]
- Gustavsson, M.; Mtonga, D. Lead-acid battery capacity in solar home systems-Field tests and experiences in Lundazi, Zambia. Sol. Energy 2005, 79, 551–558. [Google Scholar] [CrossRef]
- Samarakoon, S. The troubled path to ending darkness: Energy injustice encounters in Malawi’s off-grid solar market. Energy Res. Soc. Sci. 2020, 69, 101712. [Google Scholar] [CrossRef]
- Groenewoudt, A.C.; Romijn, H.A.; Alkemade, F. From fake solar to full service: An empirical analysis of the solar home systems market in Uganda. Energy Sustain. Dev. 2020, 58, 100–111. [Google Scholar] [CrossRef]
- Ellegard, A.; Arvidson, A.; Nordström, M.; Kalumiana, O.S.; Mwanza, C. Rural people pay for solar: Experiences from the Zambia PV-ESCO project. Renew. Energy 2004, 29, 1251–1263. [Google Scholar] [CrossRef]
- Alsema, E.A. Environmental Life Cycle Assessment of Solar Home Systems Report NWS-E-2000-15; Utrecht University: Utrecht, The Netherlands, 2000. [Google Scholar]
- Hossain, C.A.; Chowdhury, N.; Longo, M.; Yaici, W. System and cost analysis of stand-alone solar home system applied to a developing country. Sustainability 2019, 11, 1403. [Google Scholar] [CrossRef] [Green Version]
- Sarker, S.A.; Wang, S.; Adnan, K.M.M.; Anser, M.K.; Ayoub, Z.; Ho, T.H.; Tama, R.A.Z.; Trunina, A.; Hoque, M.M. Economic viability and socio-environmetal impacts of solar home systems for off-grid rural electrification in Bangladesh. Energies 2020, 13, 679. [Google Scholar] [CrossRef] [Green Version]
- Bhandari, K.P.; Collier, J.M.; Ellingson, R.J.; Apul, D.S. Energy payback time (EPBT) and energy return on energy invested (EROI) of solar photovoltaic systems: A systematic review and meta-analysis. Renew. Sust. Energy Rev. 2015, 47, 133–141. [Google Scholar] [CrossRef]
- Wetzel, T.; Borchers, S. Update of energy payback time and greenhouse gas emission data for crystalline silicon photovoltaic modules. Prog. Photovolt. 2015, 23, 1429–1435. [Google Scholar] [CrossRef]
- REN21. Renewables 2020 Global Status Report; REN21: Paris, France, 2020. [Google Scholar]
- Antonanzas, J.; Arbeloa-Ibero, M.; Quinn, J.C. Comparative life cycle assessment of fixed and single axis tracking systems for photovoltaics. J. Clean. Prod. 2019, 240, 118016. [Google Scholar] [CrossRef]
- Brunet, C.; Savadogo, O.; Baptiste, P.; Bouchard, M.A. Shedding some light on photovoltaic solar energy in Africa—A literature review. Renew. Sust. Energy Rev. 2018, 96, 325–342. [Google Scholar] [CrossRef]
- Kizilcec, V.; Parikh, P. Solar Home Systems: A comprehensive literature review for Sub-Saharan Africa. Energy Sustain. Dev. 2020, 58, 78–89. [Google Scholar] [CrossRef]
- Antonanzas-Torres, F.; Antonanzas, J.; Blanco-Fernandez, J. State of the art of mini grids for rural electrification in West Africa. Energies 2021, 14, 990. [Google Scholar] [CrossRef]
- ISO 14040:2006. Environmental Management–Life Cycle Assessment–Principles and Framework; International Organization for Standardization: Geneve, Switzerland, 2006. [Google Scholar]
- ISO 14044:2006. Environmental Management—Life Cycle Assessment—Requirements and Guidelines; International Organization for Standardization: Geneve, Switzerland, 2006. [Google Scholar]
- Frischknecht, R.; Heath, G.; Raugei, M.; Sinha, P.; de Wild-Scholten, M.; Fthenakis, V.; Kim, H.C.; Alsema, E.; Held, M. Methodology guidelines on life cycle assessment of photovoltaic electricity. In IEA PVPS Task 12, International Energy Agency Photovoltaic Power Systems Programme, 3rd ed.; Report IEA-PVPS T12-06:2016; IEA: Paris, France, 2016; ISBN 978-3-906042-38-1. [Google Scholar]
- EGD. The European Green Deal 2020—Accelerating the Green Transition and Energy Access Partnership with Africa; European Commission: Brussels, Belgium, 2020. [Google Scholar]
- PVSYST, 2021. PV SYST 7.0. Available online: https://www.pvsyst.com (accessed on 2 January 2021).
- Antonanzas-Torres, F.; Antonanzas, J.; Blanco-Fernandez, J. Environmental life cycle impact of off-grid rural electrification with mini grids in West Africa. Sustain. Energy Technol. Assess. 2021, 47, 101471. [Google Scholar]
- Goedkoop, M.; Heijungs, R.; Huijbregts, M.; Schryver, A.D.; Struijs, J.; van Zelm, R. ReCiPe 2008: A Life Cycle Impact Assessment Method Which Comprises Harmonised Category Indicators at the Midpoint and the Endpoint Level, 3rd ed.; Report I: Characterisation; Ministerie van Volkshuisvesting: Bilthoven, The Netherslands, 2008. [Google Scholar]
- Huijbregts, M.A.J.; Steinmann, Z.J.N.; Elshout, P.M.F.; Stam, G.; Verones, F.; Vieira, M.D.M.; Hollander, A.; Van Zelm, R. ReCiPe2016: A Harmonized Life Cycle Impact Assessment Method at Midpoint and Endpoint Level; RIVM Report 2016-0104; Ministerie van Volkshuisvesting: Bilthoven, The Netherlands, 2016. [Google Scholar]
- Kiss, B.; Kacsor, E.; Szalay, Z. Environmental assessment of future electricity mix - Linking an hourly economic model with LCA. J. Clean. Prod. 2020, 264, 121536. [Google Scholar] [CrossRef]
- GreenDelta, 2019. openLCA 1.10.2 Software. Available online: https://openlca.org (accessed on 2 January 2021).
- Wernet, G.; Bauer, C.; Steubing, B.; Reinhard, J.; Moreno-Ruiz, E.; Weidema, B. The ecoinvent database version 3 (part I): Overview and methodology. Int. J. Life Cycle. Assess. 2016, 21, 1218–1230. [Google Scholar] [CrossRef]
- PVGIS. Photovoltaic Geographical Information System (PVGIS). 2021. Available online: https://ec.europa.eu/jrc/en/pvgis (accessed on 28 July 2021).
- Xie, M.; Ruan, J.; Bai, W.; Qiao, Q.; Bai, L.; Zhang, J. Pollutant payback time and environmental impact of Chinese multi- crystalline photovoltaic production based on life cycle assessment. J. Clean. Prod. 2018, 184, 648–659. [Google Scholar] [CrossRef]
- Sagastume-Gutierrez, A.; Cabello-Eras, J.J.; Sousa-Santos, V.; Hernandez-Herrera, H.; Hens, L.; Vandecasteele, C. Electricity management in the production of lead-acid batteries: The industrial case of a production of a production plant in Colombia. J. Clean. Prod. 2018, 198, 1443–1458. [Google Scholar] [CrossRef]
- Mainali, B.; Dhital, R. Isolated and mini-grid solar PV systems: An alternative solution for providing electricity access in remote areas (case study from Nepal). Sol. Energy Storage 2015, 15, 359–374. [Google Scholar]
- Prinsloo, G.; Dobson, R.; Brent, A. Scoping exercise to determine load profile archetype reference shapes for solar co-generation models in isolated off-grid rural African villages. J. Energy S. Afr. 2016, 27, 11–27. [Google Scholar] [CrossRef] [Green Version]
- GREET: The Greenhouse Gases, Regulated Emissions, and Energy Use in Technologies Model; Argonne National Laboratory: Argonne, IL, USA, 2019.
- Latunussa, C.E.L.; Ardente, F.; Andrea, G.; Mancini, L. Life cycle assessment of an innovative recycling process for crystalline silicon photovoltaic panels. Sol. Energy Mater Sol. Cells 2016, 156, 101–111. [Google Scholar] [CrossRef]
- Gottesfeld, P.; Were, F.H.; Adogame, L.; Gharbi, S.; San, D.; Nota, M.M.; Kuepouo, G. Soil contamination from lead battery manufacturing and recycling in seven African countries. Environ. Res. 2018, 161, 609–614. [Google Scholar] [CrossRef]
- Bensch, G.; Peters, J.; Sievert, M. The lighting transition in rural Africa—From kerosene to battery-powered LED and the emerging disposal problem. Energy Sustain. Dev. 2017, 39, 13–20. [Google Scholar] [CrossRef]
- WHO. World Health Organization—Recycling Used Lead Acid Batteries: Health Considerations; World Health Organization: Geneva, Switzerland, 2017. [Google Scholar]
- CTM, 2020. Closing the Loop. Making a Business Case for African Battery Recycling. Available online: https://circulareconomy.europa.eu/platform/en/knowledge/making-business-case-african-battery-recycling (accessed on 4 February 2021).
- Manhart, A.; Amera, T.; Kuepou, G.; Mathai, D.; Mnganya, S.; Schleicher, T. The Deadly Business—Findings from the Lead Recycling Africa Project; Oeko-Institut e.V.: Freiburg, Germany, 2016; Available online: https://www.econet.international/index.php?id=3 (accessed on 4 February 2021).
- Clean Energy Wire. 2021. Available online: https://www.cleanenergywire.org/factsheets/germanys-energy-consumption-and-power-mix-charts (accessed on 4 February 2021).
- Institute for Global Environmental Strategies (IGES). List of Grid Emission Factors Version 10.9; IGES: Hayama, Japan, 2020. [Google Scholar]
- Rossi, F.; Heleno, M.; Basosi, R.; Sinicropi, A. Environmental and economic optima of solar home systems design: A combined LCA and LCC approach. Sci. Total Environ. 2020, 744, 140569. [Google Scholar] [CrossRef] [PubMed]
- Domingez, C.; Orehounig, K.; Carmeliet, J. Understanding the path towards a clean energy transition and post-electrification patterns of rural households. Energy Sustain. Dev. 2021, 61, 46–64. [Google Scholar] [CrossRef]
- Babatunde, A.A.; Abbasoglu, S.; Senol, M. Analysis of the impact of dust, tilt angle and orientation on performance of PV plants. Renew. Sust. Energy Rev. 2018, 90, 1017–1026. [Google Scholar] [CrossRef]
- Brecl, K.; Bokalic, M.; Topic, M. Annual energy losses due to partial shading in PV modules with cut wafer-based Si solar cells. Renew. Energy 2021, 168, 195–203. [Google Scholar] [CrossRef]
- Trina. Trina Solar. 2020. Available online: https://www.trinasolar.com (accessed on 18 December 2020).
- Jinko. Jinko Solar. 2021. Available online: hhttps://www.jinkosolar.com (accessed on 22 January 2021).
- Alquthami, T.; Menoufi, K. Soiling of photovoltaic modules: Comparing between two distinct locations within the framework of developing the photovoltaic soiling index (PVSI). Sustainability 2019, 11, 4697. [Google Scholar] [CrossRef] [Green Version]
- Perpinan, O. Energía Solar Fotovoltaica; Oscar Perpiñan Editorial: Madrid, Spain, 2012. [Google Scholar]
Figure 1.
The SHS LCA modeling method.

Figure 2.
SHS consumption curve considered.

Figure 3.
Environmental impact contribution of manufacturing country, transportation and recycling to each scenario (sc). All the impacts are expressed with respect to a SHS operating 20 years.
Figure 3.
Environmental impact contribution of manufacturing country, transportation and recycling to each scenario (sc). All the impacts are expressed with respect to a SHS operating 20 years.


Table 1.
Scenarios considered for SHS analysis.
| Sc. | Manufacturing | Site | LAB (Years) | Operation |
|---|---|---|---|---|
| 1 | China | High GHI | 4 | Not ideal |
| 2 | China | High GHI | 4 | Ideal |
| 3 | China | High GHI | 2 | Not ideal |
| 4 | China | High GHI | 2 | Ideal |
| 5 | China | Low GHI | 4 | Not ideal |
| 6 | China | Low GHI | 4 | Ideal |
| 7 | China | Low GHI | 2 | Not ideal |
| 8 | China | Low GHI | 2 | Ideal |
| 9 | Germany | High GHI | 4 | Not ideal |
| 10 | Germany | High GHI | 4 | Ideal |
| 11 | Germany | High GHI | 2 | Not ideal |
| 12 | Germany | High GHI | 2 | Ideal |
| 13 | Germany | Low GHI | 4 | Not ideal |
| 14 | Germany | Low GHI | 4 | Ideal |
| 15 | Germany | Low GHI | 2 | Not ideal |
| 16 | Germany | Low GHI | 2 | Ideal |
Table 2.
Climatic conditions and monthly SHS energy provided to the user () in Gobabeb and Goma. Note that climate variables are the monthly accumulated GHI with permission [44] and monthly average Ta and Ws with permission [37].
| Gobabeb (Desertic) | Goma (Equatorial) | |||||||
|---|---|---|---|---|---|---|---|---|
| Month | GHI [kWh/m] | Ta [°C] | Ws [m/s] | [kWh] | GHI [kWh/m] | Ta [°C] | Ws [m/s] | [kWh] |
| January | 254.00 | 22.60 | 3.64 | 9.89 | 164.50 | 22.40 | 2.15 | 8.64 |
| February | 195.20 | 24.30 | 2.73 | 8.83 | 144.10 | 23.30 | 2.04 | 7.60 |
| March | 222.60 | 24.60 | 3.50 | 9.89 | 169.60 | 22.90 | 1.93 | 8.66 |
| April | 181.10 | 22.20 | 3.70 | 9.57 | 131.60 | 22.00 | 1.95 | 7.18 |
| May | 156.80 | 22.20 | 3.97 | 9.81 | 148.10 | 22.60 | 2.60 | 8.21 |
| June | 134.60 | 16.00 | 4.20 | 9.51 | 138.30 | 21.70 | 1.69 | 7.69 |
| July | 146.20 | 16.90 | 4.45 | 9.89 | 174.40 | 23.20 | 1.99 | 9.52 |
| August | 163.60 | 17.80 | 3.48 | 9.80 | 159.30 | 21.50 | 1.82 | 8.63 |
| September | 200.90 | 18.40 | 3.70 | 9.57 | 151.30 | 22.20 | 2.10 | 7.65 |
| October | 243.90 | 19.30 | 3.93 | 9.89 | 170.90 | 22.30 | 2.03 | 8.96 |
| November | 244.50 | 22.40 | 3.65 | 9.41 | 157.00 | 21.70 | 2.04 | 8.38 |
| December | 272.20 | 21.00 | 3.46 | 9.89 | 142.00 | 21.70 | 1.94 | 7.30 |
| Year | 2415.60 | 20.60 | 3.70 | 116.0 | 1,851.10 | 22.30 | 2.02 | 98.6 |
Table 3.
LCI of SHS components. Electricty consumption for polycrystalline silicon PV module manufacturing includes the electricity consumption of solar-grade silicon manufacturing, wafering and cell and panel production.
Table 3.
LCI of SHS components. Electricty consumption for polycrystalline silicon PV module manufacturing includes the electricity consumption of solar-grade silicon manufacturing, wafering and cell and panel production.
| Component | Value | Unit |
|---|---|---|
| Polycrystalline silicon PV module (kW) | ||
| Silicon solar cell | 5.15 | m |
| Aluminium alloy | 10.61 | kg |
| Solder, tin | 0.138 | kg |
| Solder, copper | 0.538 | kg |
| Glass | 30.89 | kg |
| Ethylvinylacetate, foil | 4.54 | kg |
| Back foil, PVDE | 0.588 | kg |
| Back foil, PET | 1.963 | kg |
| Corrugated board box | 6.25 | kg |
| Water | 106.23 | kg |
| Electricity | 519 | kWh |
| LAB (kg) | ||
| Polypropylene | 0.06 | kg |
| Sulfuric acid | 0.08 | kg |
| Tap water | 0.127 | kg |
| Lead | 0.7 | kg |
| Glass fibre | 0.02 | kg |
| Electricity | 0.256 | kWh |
| Heat, natural gas | 1.504 | MJ |
| Cable (m) | ||
| Copper | 0.0061 | kg |
| Plastic pipes | 0.0134 | kg |
| Glass fibre | 0.00775 | kg |
| Polyethylene | 0.01342 | kg |
| PWM (item) | ||
| Polyvinyl chloride | 0.06 | kg |
| Integrated circuit | 0.013 | kg |
| Transistor wired | 5.9 × 10 | kg |
Table 4.
Transportation distances considered in the study in km.
| Manufacturing Germany | Manufacturing China | |||||
|---|---|---|---|---|---|---|
| SHS Site | Ship | Train | Truck | Ship | Train | Truck |
| Gobabeb | 13,000 | 200 | 200 | 17,000 | 200 | 200 |
| Goma | 14,000 | 200 | 1800 | 11,000 | 200 | 1800 |
Table 5.
ReCiPe indicators for transportation in Germany (GE) and China (PRC) from ecoinvent 3.4.
| ReCiPe | ||||
|---|---|---|---|---|
| GHG (kgCO eq/t · km) | 0.0110 | 0.164 | 0.047 | 0.048 |
| WD (m/t · km) | 0.0171 | 0.118 | 0.188 | 0.172 |
| FD (kg oil eq/t · km) | 0.0037 | 0.059 | 0.013 | 0.013 |
| MD (kg Fe eq/t · km) | 0.0003 | 0.006 | 0.006 | 0.006 |
| HT (kg 1,4-DB eq/t · km) | 0.0013 | 0.044 | 0.029 | 0.013 |
Table 6.
Electricity mix of China (2018) with permission from [43] and Germany (2020) with permission from [56] and the impacts of electricity generation for Germany and China per kWh, calculated with ecoinvent 3.4.
| Source | China | Germany |
|---|---|---|
| Biomass | 1.4% | 7.8% |
| CCGT | 3.3% | 16.2% |
| Hard Coal | 64.6% | 7.5% |
| Lignite | - | 16.3% |
| Hydro | 16.9% | 3.3% |
| Nuclear | 4.6% | 11.4% |
| Oil | 0.3% | 0.7% |
| Pumped-hydro | 0.5% | - |
| PV | 3.0% | 8.9% |
| Waste | - | 4.2% |
| Wind | 5.4% | 23.7% |
| GHG (kgCO eq) | 0.925 | 0.378 |
| FD (kg oil eq) | 0.188 | 0.102 |
| HT (kg 1,4-DB eq) | 0.135 | 0.308 |
| MD (kg Fe eq) | 0.0047 | 0.0074 |
| WD (m) | 7.822 | 1.740 |
Table 7.
for SHS components based on manufacturing country.
| Component | Germany | China |
|---|---|---|
| PV module (MJ/kW) | 11,105 | 12,101 |
| LAB (MJ/kg) | 18 | 19 |
| PWM charge controller (MJ/item) | 124.5 | 124.5 |
| Cabling (MJ/m) | 1.73 | 1.73 |
Table 8.
ReCiPe indicators for SHS components manufactured in Germany (GE) and China (PRC) and recycled in SSA.
Table 8.
ReCiPe indicators for SHS components manufactured in Germany (GE) and China (PRC) and recycled in SSA.
| Manufacturing & Formal Recycling | ||||||
|---|---|---|---|---|---|---|
| ReCiPe | (1 kW) | (1 kg) | (Item) | (m) | ||
| GHG (kgCO eq) | 811.2 | 1.591 | 1089.7 | 1.696 | 9.59 | 0.080 |
| WD (m) | 2999.6 | 5.359 | 7356.8 | 6.867 | 54.4 | 0.578 |
| FD (kg oil eq) | 217.9 | 0.459 | 255.2 | 0.471 | 2.40 | 0.035 |
| MD (kg Fe eq) | 279.9 | 0.952 | 278.6 | 0.952 | 9.63 | 0.213 |
| HT (kg 1,4-DB eq) | 568.8 | 5.750 | 385.9 | 5.681 | 84.5 | 1.186 |
Table 9.
Evaluation of formal and informal recycling regarding HT. Note that and stand for informal recycling with lead and antimony emissions of 10-fold and 100-fold increases compared to the formal recycling process.
Table 9.
Evaluation of formal and informal recycling regarding HT. Note that and stand for informal recycling with lead and antimony emissions of 10-fold and 100-fold increases compared to the formal recycling process.
| LAB Recycling (1 kg) | Antimony (kg) | Lead (kg) | HT (kg 1,4-DB eq) |
|---|---|---|---|
| Formal | 5.58 × 10 | 1.26 × 10 | 0.280 |
| 5.58 × 10 | 1.26 × 10 | 0.460 | |
| 5.58 × 10 | 1.26 × 10 | 2.260 |
Table 10.
Scenarios based on manufacturing country, carbon relevance in transport, LAB’s lifespan in years, ReCiPe indicators and CEDnr for the entire SHS life cycle.
Table 10.
Scenarios based on manufacturing country, carbon relevance in transport, LAB’s lifespan in years, ReCiPe indicators and CEDnr for the entire SHS life cycle.
| Sc. | GHG (kgCO eq) | WD (m) | FD (kg oil eq) | MD (kg Fe eq) | HT (kg 1,4-DB eq) | CEDnr (MJ) |
|---|---|---|---|---|---|---|
| 1–2 | 359 | 1719 | 97 | 178 | 1067 | 4746 |
| 3–4 | 591 | 2621 | 163 | 293 | 1753 | 7980 |
| 5–6 | 384 | 1730 | 106 | 179 | 1075 | 5156 |
| 7–8 | 639 | 2643 | 180 | 295 | 1769 | 8775 |
| 9–10 | 320 | 1170 | 91 | 179 | 1099 | 4467 |
| 11–12 | 534 | 1872 | 153 | 296 | 1802 | 7507 |
| 13–14 | 355 | 1170 | 103 | 179 | 1099 | 5156 |
| 15–16 | 602 | 1872 | 178 | 296 | 1802 | 8775 |
Table 11.
Energy yield of the SHS system, EPT, GHG emission factor and CO savings for each scenario considered.
Table 11.
Energy yield of the SHS system, EPT, GHG emission factor and CO savings for each scenario considered.
| Sc. | Energy Yield (kWh/year) | EPT (years) | GHG (kg CO/kWh) | CO Savings (kg) |
|---|---|---|---|---|
| 1 | 81.2 | 8.1 | 0.221 | 1407 |
| 2 | 116.0 | 5.7 | 0.155 | 2163 |
| 3 | 81.2 | 13.6 | 0.364 | 1175 |
| 4 | 116.0 | 9.6 | 0.255 | 1932 |
| 5 | 69.0 | 10.4 | 0.278 | 1117 |
| 6 | 98.6 | 7.3 | 0.195 | 1760 |
| 7 | 69.0 | 17.7 | 0.463 | 863 |
| 8 | 98.6 | 12.4 | 0.324 | 1506 |
| 9 | 81.2 | 7.6 | 0.197 | 1446 |
| 10 | 116.0 | 5.3 | 0.138 | 2203 |
| 11 | 81.2 | 12.8 | 0.329 | 1232 |
| 12 | 116.0 | 9.0 | 0.230 | 1989 |
| 13 | 69.0 | 10.1 | 0.257 | 1146 |
| 14 | 98.6 | 7.1 | 0.180 | 1790 |
| 15 | 69.0 | 17.3 | 0.436 | 899 |
| 16 | 98.6 | 12.1 | 0.305 | 1542 |
Table 12.
Relative GHG for national grids, source: [57]; 100% PV mini grids (PVMG) and hybrid PV-diesel mini grids (HybridMG) with permission from [38] in kg CO eq/kWh for SSA countries.
| Country | Grid | PVMG | HybridMG | Country | Grid | PVMG | HybridMG |
|---|---|---|---|---|---|---|---|
| Angola | 0.841 | - | - | Nigeria | 0.573 | 0.16 | 0.2 |
| Burkina Faso | 0.368 | 0.120 | 0.160 | Rwanda | 0.654 | - | - |
| Cote d Ivoire | 0.634 | 0.160 | 0.220 | Senegal | 0.681 | 0.120 | 0.140 |
| Ghana | 0.479 | 0.150 | 0.230 | Sierra Leone | 0.402 | 0.160 | 0.180 |
| Kenya | 0.603 | - | - | South Africa | 0.953 | - | - |
| Madagascar | 0.601 | - | - | Sudan | 0.305 | - | - |
| Mali | 0.614 | 0.120 | 0.194 | Uganda | 0.487 | - | - |
| Mozambique | 0.964 | - | - | Tanzania | 0.529 | - | - |
| Namibia | 0.920 | - | - | Zambia | 0.964 | - | - |
Publisher’s Note: MDPI stays neutral with regard to jurisdictional claims in published maps and institutional affiliations. |
© 2021 by the authors. Licensee MDPI, Basel, Switzerland. This article is an open access article distributed under the terms and conditions of the Creative Commons Attribution (CC BY) license (https://creativecommons.org/licenses/by/4.0/).
Share and Cite
MDPI and ACS Style
Antonanzas-Torres, F.; Antonanzas, J.; Blanco-Fernandez, J. Environmental Impact of Solar Home Systems in Sub-Saharan Africa. Sustainability 2021, 13, 9708. https://0-doi-org.brum.beds.ac.uk/10.3390/su13179708
AMA Style
Antonanzas-Torres F, Antonanzas J, Blanco-Fernandez J. Environmental Impact of Solar Home Systems in Sub-Saharan Africa. Sustainability. 2021; 13(17):9708. https://0-doi-org.brum.beds.ac.uk/10.3390/su13179708
Chicago/Turabian StyleAntonanzas-Torres, Fernando, Javier Antonanzas, and Julio Blanco-Fernandez. 2021. "Environmental Impact of Solar Home Systems in Sub-Saharan Africa" Sustainability 13, no. 17: 9708. https://0-doi-org.brum.beds.ac.uk/10.3390/su13179708
Note that from the first issue of 2016, this journal uses article numbers instead of page numbers. See further details here.