
IT-Enabled Sustainable Innovation and the Global Digital Divides

1
Ted Rogers School of Information Technology Management, Ryerson University, Toronto, ON M5B 2K3, Canada
2
School of Management, Swansea University, Swansea SA2 8PP, UK
*
Author to whom correspondence should be addressed.
Sustainability 2021, 13(17), 9711; https://0-doi-org.brum.beds.ac.uk/10.3390/su13179711
Submission received: 21 July 2021
/
Revised: 19 August 2021
/
Accepted: 23 August 2021
/
Published: 30 August 2021
(This article belongs to the Special Issue IT-Enabled Sustainability and Development)
Abstract
:This article investigates the impact of information and communication technologies (ICTs), human capital, institutional settings, socio-economic, and environmental parameters on sustainable innovation (SI) using archival data for 127 economies from 2008 to 2017. We developed an econometrics research framework for investigating factors influencing SI on a global scale. We found that ICT variables, such as ICT access and ICT broadband network, positively influence sustainable innovation in conjunction with the socio-economic and political parameters. Despite differences among economies in terms of ICTs, socio-economic development, and educational attainment, ICTs are the significant drivers of sustainable innovation and economic growth. We observed a growing digital divide among nations within the context of the knowledge-based economy and the expansion of digital commerce, particularly in the least developed countries and Africa, a phenomenon impeding sustainable innovation growth. To the best of our knowledge, this is the first study that empirically investigates the global digital divide from sustainable innovation perspectives. The results of this study suggest that to tackle the digital divide issues, policymakers and educational institutes need to perform constructive educational reform in higher education curricula, particularly concerning STEM programs, which should reflect the necessary skills and competencies for deploying emergent technologies. In addition, ICT should be considered part of a country’s critical infrastructure, particularly investment in the broadband networks regarded as the backbone of today’s innovation.
1. Introduction
The fourth industrial revolution, or industry 4.0, is marked by emergent technologies such as big data, cloud computing, quantum computing, artificial intelligence (AI), Internet of things (IoT), 5G, blockchain, machine-to-machine (M2M) communication, and business process automation, where the majority of products, processes, and services are digitized. This has drastically increased productivity, forcing major global economies to innovate and shift directions; thus, spawning knowledge-based economies. As defined by the Organization for Economic Co-operation and Development (OECD), knowledge-based economies describe an environment where technology and applying information are key factors in creating a competitive edge and maintaining some economic stability [1]. The strength of a knowledge-based economy is its ability to grow through innovation [2].
In this article, we use the definition of innovation as: “the intentional introduction and application within a role, group, or organization, of ideas, processes, products or procedures, new to the relevant unit of adoption, designed to significantly benefit the individual, the group, or wider society” [3] (p.10). Similarly, Carrillo-Hermosilla, Del Río, and Könnölä [4] define sustainable innovation (SI) as innovation that improves sustainability performance from the ecological, economic, and social perspectives. Other terms used for sustainable innovation are eco-innovation [5], and the green economy innovation system. SI is defined as the process of developing new ideas, behavior, products, and techniques that contribute to a reduction in environmental burdens or ecologically specified sustainability targets [5]. Furthermore, innovation towards a sustainable society may be conceived as technological, social, and institutional [5]. In this context, government, society and market are driving forces towards the increase in both consumers’ and companies’ ecological awareness [6] (p. 76). Other scholars refer to smart government; its direct institutional support is to utilize environmentally friendly ICT, enhance work productivity, improve employees’ work–life balance, and boost work processes’ general efficiency [7].
From the perspective of sustainable development, innovation is viewed as capabilities of actors (firms, organizations, academic institutes, and individuals) in science and technology to innovate in products, processes, and services backed mainly through the intensity of investment in research and development (R&D) [8]. We are witnessing large divides among countries in technical skills, and R&D efforts and capacity [8]. As mentioned in [9], it is easy to assume that access to the digital economy is ubiquitous, and that online shopping is the natural evolution of commerce. E-commerce is only one facet of the evolving digital economy. Innovation, production, and sales are all being transformed by technological platforms, data analytics, artificial intelligence, 5G mobile networks, 3D printing, open science, connected and automated vehicles, smart agriculture, smart grids, e-health, emerging models for financial transactions, blockchains, cryptocurrency, digital wallets, and the Internet of things (IoT). However, the growth of e-commerce is not automatic, and the spread of its benefits not assured. The world economy has vastly different countries, each struggling from its challenges, some with decades of famine, others with astounding growth, and others with geopolitical tensions.
The main objective of this study is to investigate implications of ICT development, socio-economic development, intellectual capacities, institutional settings, and CO2 emissions per GDPP in determining their impacts on predicting SI using global archival data for the period 2008–2017. Another objective is to investigate the existence of digital divides among countries and regions regarding broadband networks, classified as the backbone infrastructure for growth and development in the era of digital economies. These objectives are mapped to the following research questions:
RQ1: What is the impact of ICTs on the reduction of CO2 emissions? Related to this question, what is the impact of ICTs on sustainable innovation and economic growth (RQ2)?
RQ3: What are the impacts of the intellectual capital, socio-economic and political settings on sustainable innovation?
RQ4: How to tackle the growing global digital divides from the perspectives of sustainable innovation?
As suggested by Higón, Gholami, and Shirazi [10], a macroeconomic approach examining the relationship between ICTs, socio-economic and political development, CO2 emissions per capita, and innovation may help us answer these questions.
Thus, this study aggregates data for SI to determine these variables’ significance. We conclude that although ICT is a critical factor in a country’s ability to innovate, a basic level of the socio-economic, institutional environment, and intellectual capital must exist to maximize the potential of ICTs in increasing SI. Specifically, it makes recommendations for the least developed countries lagging behind the global trends. The article is organized as follows: Section 2 presents the literature review; Section 3 presents our research framework and the empirical model. In Section 4, we discuss our findings and the notion of digital divides from SI perspectives. Finally, discussions and conclusions are in Section 5.
2. Literature Review
2.1. ICT and SI
The rapid evolution of ICTs has changed business and communication among people. Billions of data are generated each day from businesses, medical records, media, governments, and individuals. It is estimated that 90 percent of the world’s data has been created in the last two years, with both machines and humans contributing to its growth. According to IDC [11], data will grow exponentially from around 33 zettabytes (A zettabyte is 1021 bytes) in 2018 to approximately 175 zettabytes by 2025; and nearly 30% of the world’s data will need real-time processing; but more data does not translate into better information [12]. Mining data, and extracting, analyzing, and aggregating meaningful information to build desired knowledge, skills, and the ability to solve complex tasks has been welcomed by governments, policymakers, industry analysts, business strategists, and marketing pros as a new frontier for innovation, competition, and productivity [13]. Big data allows value to be created in new ways, and insights to be made on a large scale, impacting organizations, markets, and government-citizen relationships [12].
The underlying root of ICT’s ability to affect SI is its purpose of facilitating information sharing, its impact on motivating humans to transfer knowledge [14,15,16], and the necessary tools to tackle environmental issues. For Hadad [17], changes in the paradigm of development of the global economy lead to an unprecedented increase in science value, as highly specialized knowledge and skills create SI and sustain competitive advantage [18]. In other words, since humans ultimately have to decide to share knowledge, the use of ICTs circumvents things like organizations with unfriendly sharing cultures. Thus, rather than facilitate the transfer of knowledge, ICTs offer four features and benefits to motivate individuals and organizations to share knowledge:
- ICT removes barriers of distance, generation gaps, and social status.
- It allows for storage of and access to data for multiple uses over an indefinite period.
- Case-based reasoning tools provide the ability to iterate and continuously add to the knowledge available.
- Information as meta-knowledge or information about the knowledge providers is embedded in the information.
These fundamental characteristics of ICT fulfill higher-level self-actualization needs, which include personal growth and achievement [19,20]. With ICT fulfilling this intrinsic human need, its ability to encourage and motivate individuals to transfer knowledge is strong [14,16,21]. For Van Laar et al. [22], although ICTs are a foundation for innovation, they do not create a knowledge-based economy. Innovation starts with people who can efficiently extract knowledge from the amount of available information and effectively apply such knowledge, both in their professional and personal lives.
With the right organizational approach, the benefits of ICT on productivity are evident [23,24,25]. Recent studies suggest a positive impact of ICT on innovation [26,27,28,29] in small to medium-sized enterprises (SMEs). In SMEs in the UK, ICT used in R&D departments produced high innovation levels in both process and product. Companies that maintained their websites were 8% more likely to innovate [27]. Gera and Gu [30] obtained similar results in their study of IT’s effects on organizational innovation: the importance of ICT as a tool to stimulate innovation within SMEs is evident, given that favorable organizational structures and employee engagement exist. Specific advancements in ICT innovation, such as artificial intelligence, cloud computing, big data analytics, the Internet of things (IoT), m-banking, e-commerce, and more broadly, the Internet, are viewed as intrinsic factors that positively affect SI.
Although ICT is one source of global warming, generating more than 2% of global emissions and a major source of e-waste [10] it has offered several innovative tools to save energy. According to the Global e-Sustainability Initiative, ICT can reduce greenhouse gas (GHG) emissions by 20% by 2030 by helping companies and consumers more intelligently use energy. ICT applications can help increase agricultural crop yields by 30%, saving over 300 trillion liters of water, and 25 billion barrels of oil a year, generating USD 11 trillion in economic benefits by 2030 [31]. Also, as highlighted by UNCTAD’s Review of Maritime Transport Report [32], the implementation of technical and operational measures for ships could increase efficiency and reduce the emissions rate by up to 75 percent. Moreover, the further reduction could be achieved by implementing innovative technologies (p. 89).
Motivated both by consumers, large ICT firms such as Google, Facebook, Adobe, IBM, and others are using renewable energy, mostly wind and solar [31]. In addition, ICT is part of a country’s critical infrastructure [8,9]. ICT creates synergies with other technologies such as biotechnology, nanotechnology, and advanced manufacturing as an enabling technology.
2.2. Broadband Networks, SI and the Paradigm of Economic Growth
Broadband networks are the backbone of IoT, the infrastructure for innovation, and the knowledge economy. Choi and Kim [33] argue that the future of a data eco–society relies on data intelligence and data science, the cornerstone for analyzing human life, business, and system operations to make better decisions. For UNCTAD [9], the number of IoT devices should grow from USD 15 billion in 2015 to USD 50 billion in 2020, with one third being computers, smartphones, televisions, and mobile devices. Valued at USD 656 billion in 2015, the market should reach USD 1.7 trillion in 2020 and between USD 3.9 and 11.1 trillion by 2025 [9] (p. 27). IoT drives the expansion of the Internet into the real world, due to the availability of inexpensive technologies that connect sensors, triggers, actuators, RFID tags, GPS locators, accelerometers, and more [34]. As an emerging innovation, IoT requires ubiquitous access to broadband networks to connect devices and objects and increase their efficiency by exploiting the potential of networking [35]. The next wave of innovation, 5G networks, is expected to provide connections for massive IoT, where billions of smart devices can be connected to the Internet [36], generating the next wave of big data resources. This broadband technology will have a marked impact on business and society, introducing new applications and opportunities for business models, markets, and essential public services delivery. They also offer several environmentally friendly applications, from monitoring the environment and animals to applications of e-agriculture. Thus, IoT requires new performance criteria such as energy efficiency, massive connectivity, security, trustworthiness, coverage of wireless communication, ultra-low latency, throughput, and ultra-reliability for a vast number of devices [35,36,37].
From the perspective of SI, wireless sensor technology provides energy-saving applications, such as smart grids, homes, buildings, metering, and renewable energy. For example, in transportation, the establishment of intelligent online transport systems integrated with GPS modules contributed to reducing traffic flows across cities. Software applications, such as video communication, e-commerce, and teleworking reduced the worldwide traveling of both people and goods, contributing to the reduction of greenhouse gas [38].
2.3. Human Capital and SI
With globalization and the decreased control of governments on business, innovation is positively affected. For Erkan [39], the freedoms endowed by the government (e.g., property rights, trade, and financial freedoms), directly affect citizens’ ability to work and focus on innovating. However, economic freedoms favor companies [40] and labor freedom has the greatest impact on innovation. A study of Latin American countries found education provides the framework upon which economic freedom, FDI, and ICT build [41]. Lack of education inhibits innovation and slows the economy down. Education is a component of human capital, a determinant of economic growth. Thus, countries with high GDP and high levels of educational attainment have high capital stocks [42]. For UNCTAD [9], human capital relies on all levels of education, stimulates advanced cognitive skills, such as complex problem-solving, socio-behavioral skills, such as teamwork, and skill combinations, such as reasoning and self-efficacy [43]. It includes both the technical and managerial skills involved in innovation activities, from R&D, design and engineering to technology brokerage and networking [13]. Intellectual capital is the basis for innovation capability and sustainable economic competitiveness. The interactions among human capital, R&D, and ICT infrastructure are vital components of sustainable innovation [9].
2.4. Economic Freedom, FDI, and SI
The concept of economic freedom has been documented by economists and academics who have defined economic freedom and how it relates to macro-economic prosperity and economic growth [44,45], and opportunistic factors, such as personal happiness [46]. For Gwartney and Lawson [47] four components of economic freedom are: (1) personal rather than collective choice, (2) voluntary exchange coordinated by markets, (3) freedom to enter and compete in markets, and (4) protection of persons and their property from aggression by others, including governments. For Dreher et al. [48], economic freedom is a precondition for foreign investors before investing in a country. Recent studies found that economic freedom is associated with the inflow of Foreign Direct Investment (FDI) [49,50,51]. Although economic freedom describes global freedoms on a per-country level, this study considers increasing the level of economic freedom as a paradigm from which to derive other parameters such as ICTs, FDI inflows, economic growth, and innovation. In other words, factors that lead to increased international economic freedom should increase innovation at “intra-national” levels.
Many nations have incentives to encourage FDI in their countries. Multiple benefits to local companies, the surrounding population, and the country make it an attractive policy. Several studies found a positive impact of FDI on innovation, R&D, and the global expansion of ICTs [51,52,53,54]. One often-discussed benefit of FDI is the influx of new technologies and sharing ideas fundamental to innovation [55]. Beyond the transfer of information, collaborative problem solving, and knowledge generation, FDI is an important driver of innovation [56]. Studies suggest that knowledge gathered through spillover is more valuable to innovation than the sharing of thoughts, ideas, and technologies [57]. For Taiwanese enterprises, FDI fundamentally altered best practices, ultimately forcing government policy to reflect the newly acquired knowledge of global standards from foreign partners [58,59].
However, the spillover effect of FDI into China was unique. Local innovators developed competing products and services to foreign ones, resulting in the accelerated growth of knowledge [60]. Studies by Cheung and Lin [60], Fu [52], and Wang and Kafouros [61] found that FDI had drastically contributed to R&D and innovation capacities in China. For Cheung and Lin [60], the increased innovation capacities in China, in part, were associated with the level of FDI flows, which provided spillover channels such as reverse engineering, skilled labor turnover, demonstration effects, and supplier–customer relationships. The rise of FDI from developing and transitional economies is of specific relevance to low-income countries, and FDI became an important component of developing countries’ economic [62]. For example, developing countries in Asia with FDI inflows surpassed half a trillion dollars, remaining the world’s largest FDI recipient region [53]. Other regional studies suggest the reciprocal impact of FDI investments. For example, in addition to traditional FDI spillovers, Japanese firms found their FDIs in the US particularly useful in propelling their R&D sector [63]. Another indirect effect of FDI on innovation is that it forces companies and countries to find new ways to create competitive advantages. Tang and Hussler [64] argued that in the case of FDI flows into China; international companies began to lose their competitiveness in their production costs and even quality. This forced investing nations to shift their economies to become knowledge-based to create value [65]. In addition to FDI, other sources of external capital flow, particularly for developing countries, are concessional loans from international financial institutions, long-term commercial debts, aid, and remittances [66]. However, investigating such resources is beyond the scope of this study.
2.5. SI and CO2 Emissions
Lubberink et al. [67] argue that SI responds to societal and environmental challenges that require the involvement of multiple stakeholders. SI considers social and environmental impacts, in addition to economic impact, as desirable innovation outcomes [67]. For Cascio and Montealegre [68], although digital innovation will continue to advance, technology is not enough. Fulfilling its potential requires leaders and decision-makers to recreate their organizations’ operation in a world of digital ubiquity. For Higón, Gholami, and Shirazi [10], CO2 emissions are the base currency of global warming measures. Although research mainly focused on emissions of other pollutants such as sulfur dioxide or nitrogen oxides, recent studies increasingly focus on carbon emissions.
One issue with measuring CO2 (metric tons per capita) as a standalone variable is that it discriminates against countries with low population density. For example, Qatar will become the highest polluted economy, while countries such as China, India, and Iran with a high level of CO2 emissions will go unnoticed. Thus, we used the econometric variable CO2 per GDPP to tackle this issue. This econometric variable highlighted these countries as economies with high environmental pollutions, which otherwise went unnoticed. Most countries with high CO2 emission/GDPP are in Asia, followed by South Africa and Egypt, and four eastern European countries (Ukraine, Russia, Bulgaria and Estonia). On the other hand, the 20 low CO2 emissions performers include Switzerland and Scandinavian countries (Sweden, Norway, and Denmark; Table 1b). We know that environmental issues are a serious global concern and need extensive national and international efforts. Thus, Table 1 is instructive for lessons learned from other economies, rather than relaxing global issues that impact all nations.
The table highlights that the world’s largest per capita CO2 emitters are the major oil-producing countries; this is particularly true for those with low populations [69]. Most are in the Middle East: In 2017, Qatar had the highest emissions at 49 tons (t) per capita, followed by Trinidad and Tobago (30 t); Kuwait (25 t); United Arab Emirates (25 t); Brunei (24 t); Bahrain (23 t) and Saudi Arabia (19 t). However, many major oil producers have a relatively small population meaning their total annual emissions are low. More populous countries with some of the highest per capita emissions are Australia (17 t), the United States (16.2 t), and Canada (15.6 t). These countries produce more than three times the global average, which in 2017 was 4.8 t.
2.6. Institutional Settings and SI
Recently, our lives have been affected by significant limitations on how we interact, work, travel, learn, and create value, and technology often came to the rescue, helping us mitigate or circumvent such limitations. Teleworking, teleconferencing, telemedicine, distance learning, and e-commerce became part of a “new normal” that is changing every day [70]. The acceleration impelled by the COVID-19 pandemic has not been limited to the use of digital tools and services. It prompted a significant “deepening” of how governments, businesses, and individuals consider ICT innovations, technology adoption, and digital transformation [70].
A widening digital divide also highlighted the gap between developed and developing nations, particularly least developed countries (LDCs). Related to e-government growth and public-sector engagement, they felled short of expectations. The notion of e-government does not solely depend on technology. The complexity of e-government evolved to include political, cultural, economic, social, and technical dimensions. Using ICTs to serve citizens more efficiently [71] is an area where digital technologies can generate broad-based gains [70]. Bringing all these aspects together is so complicated that it needs carefully planned strategies informed at local, national, and international contextual characteristics.
From the perspectives of SIs, governments can play a supportive role in creating an environment that quickly reacts to new developments. This includes a supportive innovation ecosystem through government-promoted R&D investments, promoting and facilitating ICT adoption, supporting patents and ecological initiatives, and enforcing competition, building out infrastructure, and having a clear ICT strategy [70,72,73,74]. Systemic changes in current technological, institutional, and social settings are needed to achieve long-term sustainability goals [75].The authors argue that the way to advance delivery of SI policy is by promoting public/private institutional structures to enhance regulator/regulated relationships and stakeholder activities; and ensuring broad stakeholder participation, particularly from the innovation constituency [75]. However, other than developing strategically and economically viable novelty, innovation is understood as a latent need that has to be undertaken to contemplate social and environmental issues [6].
3. Research Framework and the Empirical Model
The literature regarding economic growth as measured by per capita GDP (GDPP), FDI, economic freedom, and ICTs indicate that their impact on innovation is substantial. However, these reports are limited by the metrics measuring innovation. Traditionally, they were measured by the number of patents filed, patents cited, and R&D investments. These indicators provided data-based foundations for empirical research for a somewhat intangible concept. Acs and Audretsch [76] discussed the inherent value of using patent filings and citations as a tool to measure innovation, and concluded that this metric, although not perfect, aptly explains innovative activity. Griliches [77] describes the patent data as resistant to change in the absence of relevant data. This consistency over an extensive period makes patent data a useful resource in studying innovation [77]. Similarly, patent citations is a measurable form of data that helps identify links between different knowledge sources. Although, this is not a clear-cut indication of innovation, it suggests that these patents provide a basis for further inventions and therefore affect innovation.
Despite its accessibility and breadth, challenges exist in using patent related data as a tool to assess innovation. As found by Carpenter and Narin [78], and Kurtossy et al. [79], it has limited usefulness beyond ‘developed’ nations, where patenting technology is an established process for countries such as USA, Germany, and Japan. Despite attempts to standardize patent laws and procedures globally, the value put on them by developing nations, the incentives given to firms and the openness of an economy all play a significant role in patent filings [80]. In Kenya, for example, the lack of financial and procedural support from the government made filing patents by local companies less effective [81], while government policies, such as China’s grant subsidies, increased patent filings in that country by 30% [82].
Furthermore, industries where patent technology is an integral part of company success—for example, pharmaceuticals—are likely to skew the data. For Arundel and Kabla [83], in European countries, pharmaceuticals, chemicals, machinery, and precision instruments are the only ones likely to patent a product or process. The pharmaceutical industry leads product patenting by 79.2% [83]. This does not mean that other firms are less innovative or less careful in protecting their innovations. Instead, apart from these industries, patents provide more disclosure [84], and often facilitate competitors’ development of new products. Instead, Cohen et al. [85] determined that lead-time and secrecy [86] are more effective methods for companies to protect innovation and proprietary information. Consequently, innovation studies focused on the patent information must incorporate other estimating innovation methods, as outlined in the following framework.
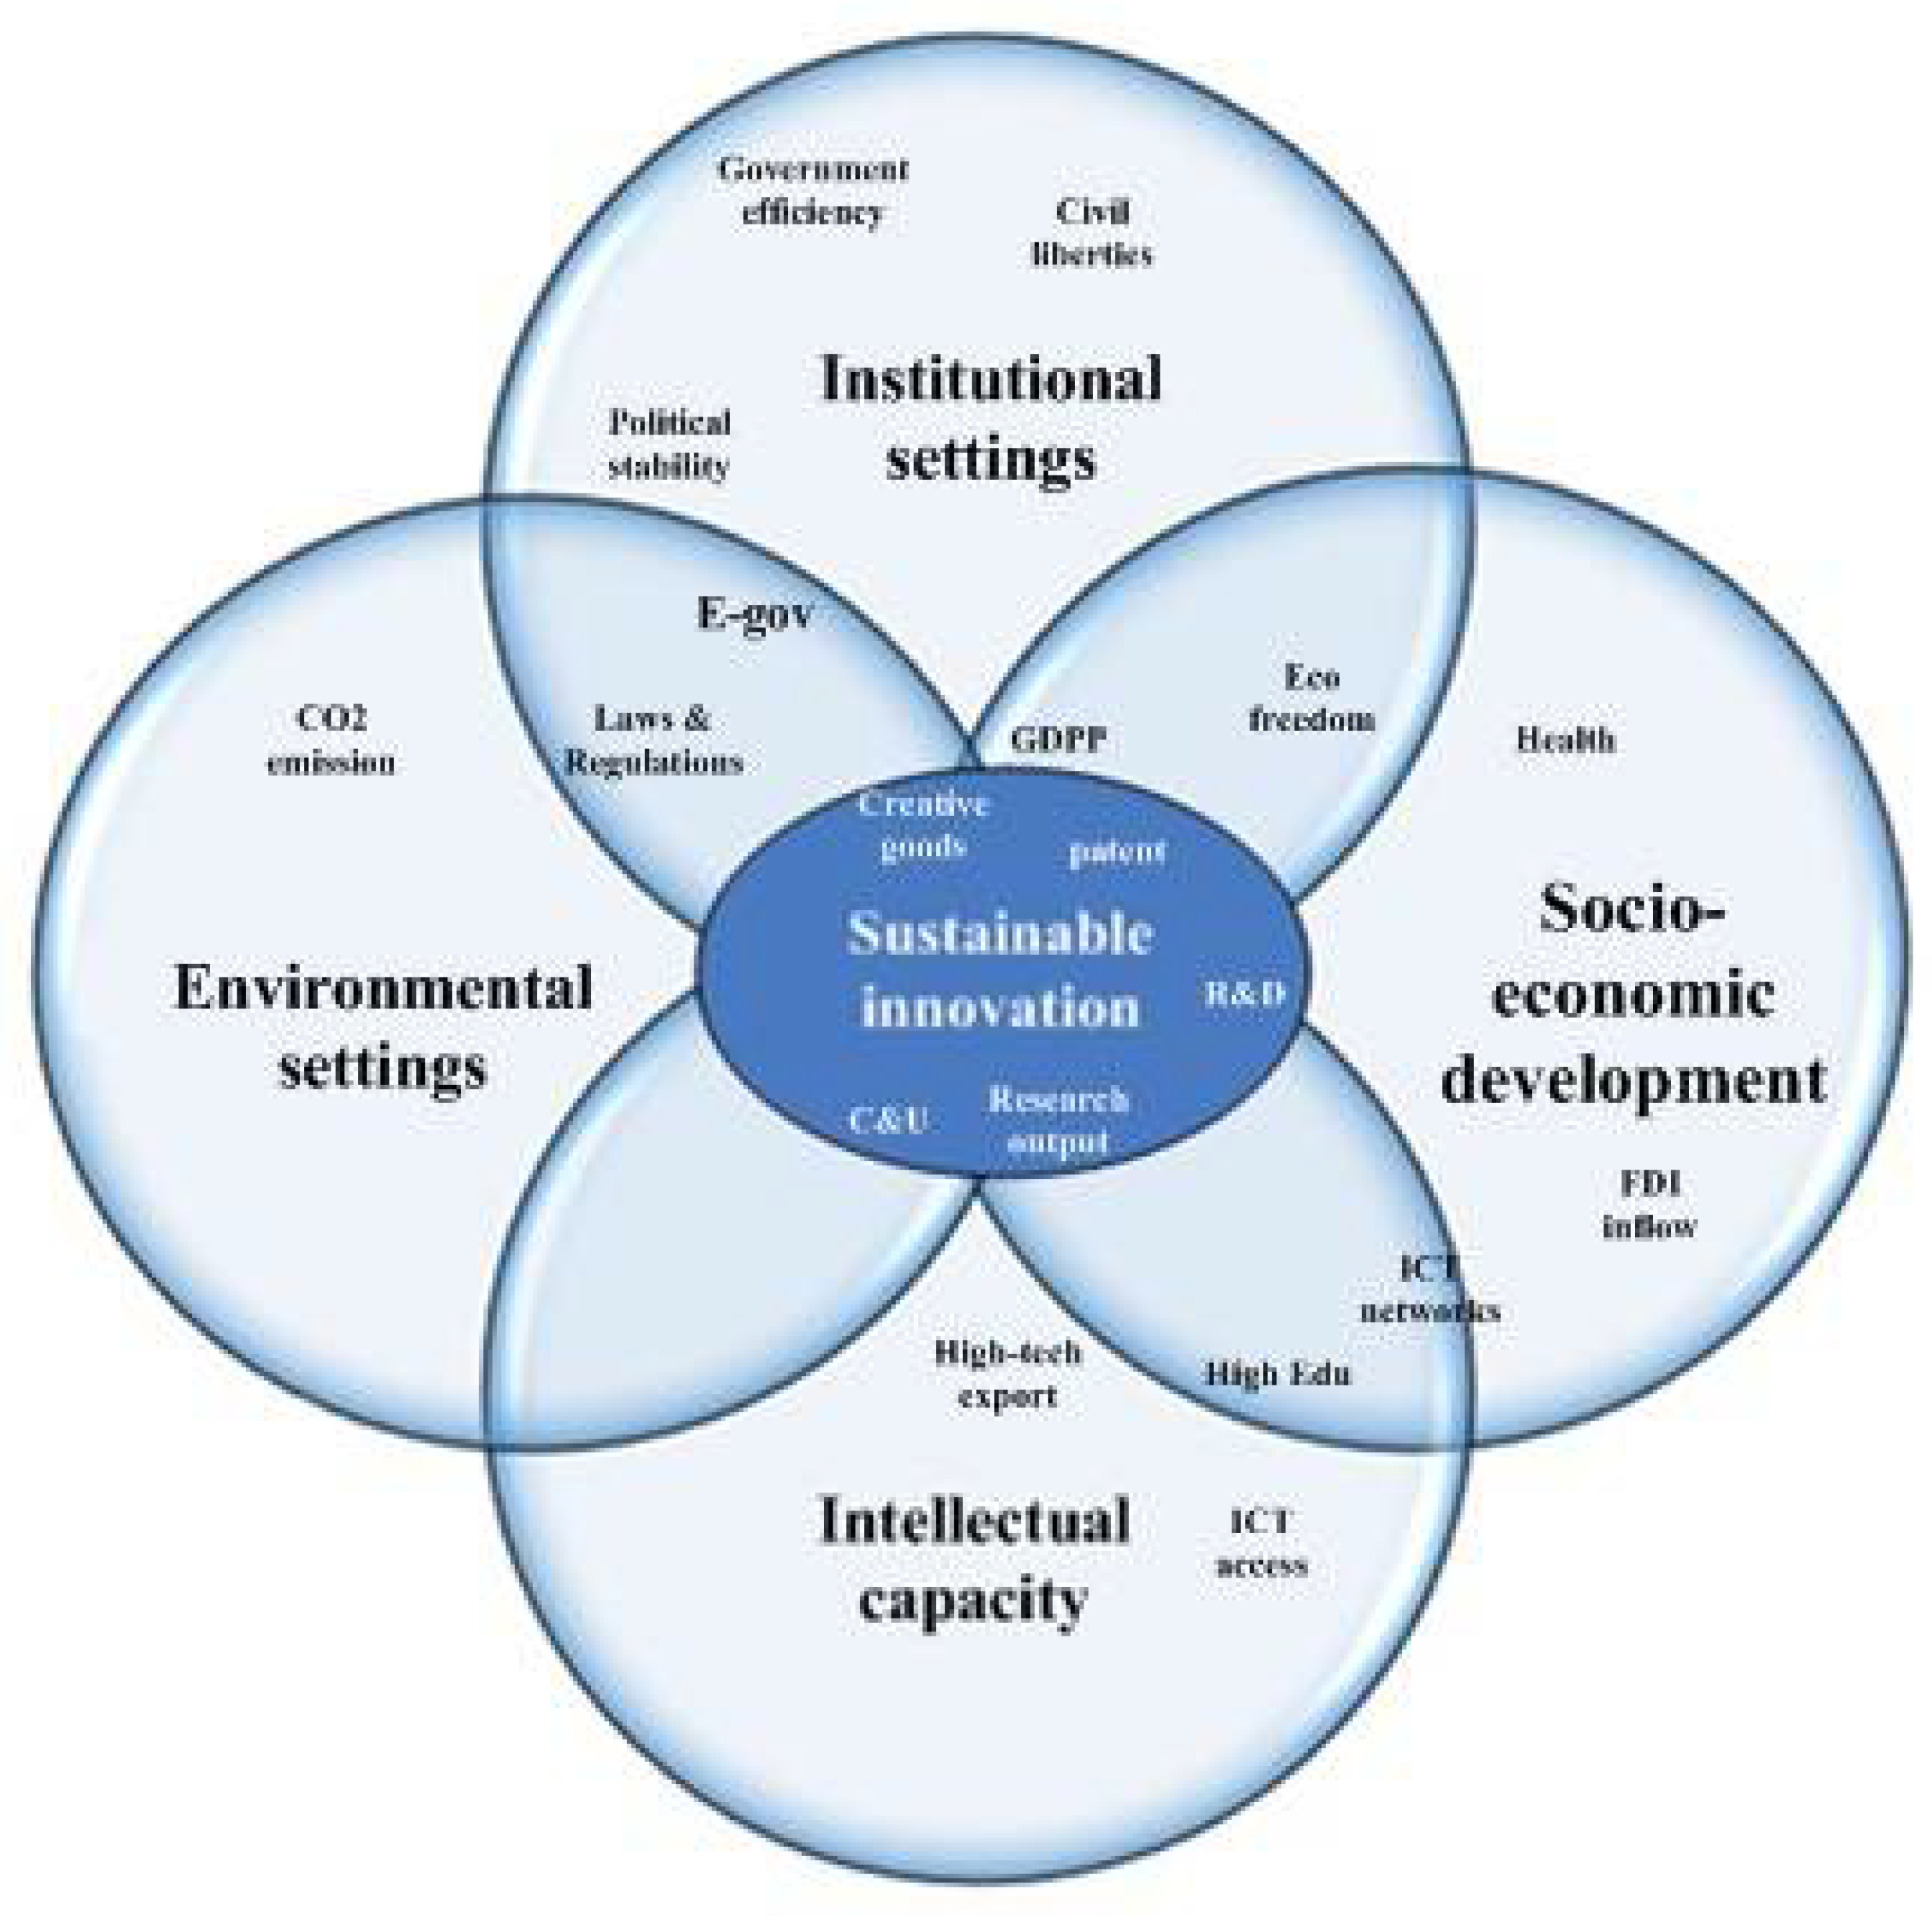
Figure 1 illustrates our research framework for investigating factors influencing SI on a global scale. The research aims to determine the extent to which four pillars of sustainable development impact innovation to tackle a wide range of socio-economic and political environments with the help of ICTs. The framework contains four pillars affecting SI: institutional settings, socio-economic development, intellectual capacity, and environmental settings. The framework is a building block in the construction of SI and other new technologies. There are variables within each group, and associated historical data explained in the next section. This framework allows us to investigate how ICT expansion and other parameters influence innovation and sustainable economic growth from 2008 to 2017. Analyzing the global digital divide among countries and its impact on human development is part of this study.
For UNCTAD [62], there is a strong correlation between a country’s ICT expansion, its income, human development level, and its citizens’ educational attainment. UNCTAD [9] highlights the fact that there is a divide in R&D intensity (R&D intensity is the expenditure on R&D as a proportion of GDP) and the uneven distribution of researchers, particularly in developing countries. The report emphasizes the fact that increasing R&D intensity remains a long-term objective worldwide. R&D intensity in most developing countries is much lower than either the world average or developed countries. The technological gap is acute for the LDCs, where the intensity was 0.25 percent in 2014, and 0.41 percent in sub-Saharan Africa. This is alarming when we compare these facts with other countries such as the Republic of Korea (4.27 percent), Singapore (2.2 percent), and China (2.02 percent) [9]. Besides R&D gaps, ICT expansion, digitalization, and automation impose changes across many sectors, mainly manufacturing. Here, it plays a vital role in preparing the labor force with skills that complement technological advances. However, UNCTAD [9] highlights the “race between education and technology” [87], and the fact that “there are indications that educational institutes are not keeping pace with technological advances” (p. 42). To assess the independent variable’s impact on SI (SI), we used data from 127 economies (we considered all economies with a complete set of data; please see Appendix A for a list of countries.) for the period 2008–2017. In the estimates, we used Stata software version 15.0.
3.1. Empirical Model
Based on the conceptual framework, we deployed ordinary least squares (OLS) regression and a general structural equation model called two-stage least squares (2SLS)/instrumental variable (IV). This model’s main challenge is to find IV estimators correlated with the endogenous variable(s), but uncorrelated with the error term. In econometrics, these IVs are predetermined variables that use the instrument variables to find a consistent estimator of the coefficient for the original explanatory variable. We used the World Bank’s political stability index as an instrument for the endogenous governmental variable (gov).
Our research model is the following reduced form Equation (1).
where the subscripts refer to economy (i) and year (t); α is the intercept, and εit is the error term. We assume that the index of sustainable innovation (SI) depends on a number of ICT-based variables as in Equation (2).
Note that mobile broadband access as required by the emergent technologies, such as IoT, relies on the existence of national backbone infrastructure [37]. National backbone infrastructure and international Internet connectivity are key building blocks to drive broadband demand, access, and use. The amount of international Internet bandwidth available in a country provides crucial insights into the quality and speed of networks [37]. Additionally, international Internet bandwidth plays a vital role in delivering data-intensive applications and services through high-speed networks. While national fiber transmission networks are essential infrastructure for access to high-speed networks, information on bandwidth is also required to gauge the actual quality and speed available [37].
Equation (3) shows the institutional category of independent variables. The variable legal potentially belongs to this category, mainly as it is also an indication of government and institutional settings’ quality. It is also associated with environmental settings as it measures the quality of environmental regulation in each economy.
Equation (4) contains variables associated with socio—economic development in each nation. Another index associated with socio-economic development found in literature is the UN’s Human Development Index (HDI) [88,89,90,91,92]. We did not use this index because it contains GDPP and educational information that may cause collinearity issues with other variables deployed in this study.
Finally, the environmental pollutions measured by CO2 emission per GDPP (USD) are associated with Equation (5).
3.2. Data
The panel data consist of 127 economies from 2008 to 2017, resulting in an unbalanced panel with 1270 observations. We used different data sources, as explained below.
The economic freedom index is an average value of indicators from the Heritage Foundation and Wall Street Journal (HFWSJ). This construct was generated from 12 indicators—from property rights to financial freedom [93]. Economic Freedom (ecof) is an index between 1 and 100 (highest freedom) [94]. According to HFWSJ, within the context of economically free societies, governments allow labor, capital, and goods to move freely, and refrain from coercion or constraint of liberty beyond the extent necessary to protect and maintain liberty itself [95]. HFWSJ scores the level of economic freedom for each country on an annual basis. Economic freedom is important for countries because countries with more economic freedom experience much smaller economic crises and can recover to pre-crisis GDP levels in a much shorter time [96].
The inflow FDI data in log format (variable lnfdi) was from the UNCTAD database. The higher education (highedu) from the UNESCO Institute for Statistics (http://uis.unesco.org/ (accessed on 22 September 2019)) is an average value of two indices: gross enrollment ratio in tertiary education, and graduates in science and engineering. The latter measures sectors associated with innovation. Formal education is not the only source of acquiring innovation knowledge. However, this format was setup due to the absence of other education sources, such as employee training or employees who achieved a higher level of knowledge and expertise as part of firms’ R&D projects.
The government efficiency index (gov) comprises two components: government effectiveness index and e-government readiness index. The index of government effectiveness was from the World Bank database. The index varies from −2.5 (weak) to 2.5 (strong) governance performance but was converted to 100 as the highest level of efficiency and 0 as the lowest. The e-government readiness index from the UN database measures the electronic government efficiency when it comes to ICTs, and in particular, the case of innovation. According to UN [97], the e-government readiness index captures the scope and quality of online services, the status of telecommunication infrastructure, and existing human capacity. The civil liberty index (cl) was from Freedom House. This variable recalculated and transformed from its original value with the scale of 0–100 (100 = highest level of civil liberty). The political stability index was used as an instrument for our 2SLS regression. This variable (not shown in equations) is from the World Bank’s public database. This index was transformed to 0–100 (100 = the highest level of political stability) to indicate peace and the absence of violence.
ICT data (ICT access and ICT network infrastructure) were from the International Telecommunication Union (ITU). ICT access (ictacc) comprises four indicators: number of fixed telephone lines, Internet users, mobile cell phone subscribers, and number of households with a computer per 100 inhabitants. ICT network (ictnet) consists of two indicators: fixed broadband infrastructure networks in a country and international Internet bandwidth (Mbit/s per capita). The high technology export (hightec_exp), and the inflow FDI data were from the UNCTAD database. These data are in millions of USD.
Variable health consists of life expectancy at birth for both sexes (years), maternal mortality ratio (deaths per 100,000 population), total fertility rate (children per women), hospital beds (per 10,000 people), and total expenditure on health as percent of GDP. Data was from the World Health Organization’s public database (who.int (accessed on 30 May 2020)).
Variable legal consists of two indices: regularity quality and rule of law from the World Banks’ public database (databank.worldbank.org (accessed on 30 May 2020)). To emphasize the importance of the quality of regulations and the rule and law, we placed variable legal in this category, even though it contains measures associated with environmental regulations’ quality. As mentioned by EPI (epi.yale.edu (accessed on 30 May 2020)), the regulatory quality captures perceptions of the government’s ability to formulate and implement sound policies and regulations that permit and promote private sector development. This includes the quality of environmental regulations. The rule of law captures the extent to which agents have confidence in and abide by society’s rules.
The dependent variable, SI (SI) is composed of indices such as total R&D personnel (per thousand labor force), number of researchers per thousand employees, R&D expenditure as percentage of GDP (UN database), creative goods and services (UNCTAD), number of resident patent applications (per million population) (World Intellectual Property Organization, WIPO), scientific and technical publications, and trademark applications from WIPO, INSEAD, and Cornell University dataset. An issue in harnessing sustainable innovation is intellectual property (IP) transactions: purchase, sale, assignment, and licensing of intellectual property rights (IPRs). As IPRs are associated with technical innovation, patents are particularly important. The standard rationale for the patent system is to provide incentives for innovation [9].
Finally, variable co2gdpp measured the environmental pollution in each country. This index provides the amount of CO2 emission (metric tons per capita) divided by GDPP (USD). We collected this data from the Environmental Performance Index (EPI, epi.yale.edu (accessed on 30 May 2020)), and the World Bank’s public database.
4. Findings
Column (1) and (2) of Table 2 depicts the results of OLS and 2SLS/IV regressions for the entire dataset, while columns (3) and (4) show the results for least developed countries (LDCs). We deployed a first-order linear regression model [98] containing the main effects of all predictor variables. For the whole sample, there is a strong relationship between the dependent variable (SI) and the independent variables that construct intellectual capacities (ICT access (ictacc), ICT network (ictnet), high technology exports (hightec_exp), and higher education (highedu)). Their impacts are statistically significant at 0.01. It highlights the important roles of higher education on sustainable development, including the role of science and technology (SandT), in promoting innovation [99]. For Liu et al. [21], China has transformed itself from a planning to a market-oriented economy over three decades and has sustained a long period of rapid economic growth, to which the contributions from innovation in SandT have become important. Science and technology’s role in economic development occurred after World War II. There has been a shift of focus from universities and technological sectors toward all parts of the economy to impact the innovation process [21,100].
However, variable co2gdpp shows a negative but statistically significant impact on SI (corr = −0.1897). The mutual relationships between these variables also show that SI is able to reduce CO2 emissions caused by economic activities as measured by GDP regressions per capita.
The results of OLS and 2SLS/IV (columns (1) and (2)) related to institutional settings (cl, gov, and legal) show statistically significant impacts of government efficiency index (gov) on sustainable development at 0.01. The results indicate governments’ effectiveness in setting sound policies in conjunction with civil liberties (cl); the quality of laws and regulations (legal) plays an essential role in promoting SI. It also highlights that civil liberties and the rule of law, the quality of regulations, including environmental regulations, play significant roles in sustainable development. These variables together also highlight the institutional trust in safeguarding individuals and firms in SI: development-led innovation policies have the function of identifying constraints and restrictions in the transformation process towards a new technological paradigm, and as building blocks in the construction of other new technologies [74]. For Foxon, and Pearson [75], sustainable innovation approaches emphasize the importance of institutional factors in influencing innovation’s rate and direction.
The last group addresses the variables associated with socio-economic development and their impacts on SI. In Table 2 (columns (1) and (2)), the health variable’s quality of life has a statistically significant effect on SI at 0.01. As manifested by the UN’s Sustainable Development Goals (SDGs), the focus is on plans where ICT and innovation have roles to play, including such indicators as health, education, and environment. An example of addressing health on SI is through the current pandemic. A range of health-related innovations were introduced to manage the current health crisis effectively. These include innovations in digital health, biotechnology, pharmaceutical research, agriculture, and food safety [13,101,102,103,104,105,106,107,108,109]. Variables such as ecof (Economic Freedom) and lnfdi (inflow FDI) have a significant impact on SI at 0.05. However, in 2SLS/IV regressions, the results show that ecof has a significant impact on SI at 0.01. The effect of economic freedom on innovation confirms earlier studies that for the economically free nations, the capabilities for innovation (e.g., financial innovation) increase (columns (1) and (2); Table 2), as performance deviates from aspiration. In contrast, for the least economically free nations, financial innovation, for example, decreases (columns (3) and (4)), as performance deviates from aspiration. Dreher et al. [48] mentioned that economic freedom is the precondition for globalization for foreign investors to invest in a country. This study also confirms earlier studies that inflow FDI has a positive and significant impact on innovation, and when FDI increases as technology absorption and innovation capacity increases [110,111,112,113].
The R2 (OLS and 2SLS/IV) in Table 2 for the whole sample is 0.82, indicating that the explanatory variables explain 82% of the variation in the target variable (SI). The R2 for the LDCs is 22.4% (column (3)) or 26% (column (4)), compared with the values for the whole sample. In the next section, we discuss the findings of LDCs.
To assess the instrument validity in the 2SLS/IV approach, the p for the Durbin [114] and Wu–Hausman [115] tests of overidentifying restrictions are in Table 3. In all regressions, the p of the Durbin and Wu–Hausman indicate that the instruments are valid. The null hypothesis of these tests is that the variable under consideration can be treated as exogenous. Both statistics are highly significant, so we reject the null hypothesis of exogeneity. As such, we treat the gov variable as endogenous, and this variable has a high adjusted R2 (0.834), indicating its significance when it comes to instrumental variable political rights. The other issues concerning the data set were related to heteroskedasticity and autocorrelation. We used the Huber–White robust standard errors approach [116] to test our OLS regression model’s heteroskedasticity-consistent standard error estimators (e.g., Stata vce(robust) option). To test the same issue associated with 2SlS/IV, we used two models (Table A2 and Table A3) as reported in Appendix B. Table A2 is based on Kleibergen’s [117] heteroskedasticity test. As Kleibergen [117] mentioned, this test is set up to evaluate the weak instrument robust score based on Lagrange Multiplier (LM) measures. It also tests for autocorrelation issues related to a time-series model. Table A3 in Appendix B is another heteroskedasticity test using the fitted values (e.g., X-hat*beta-hat). Both models assure that there are no heteroskedasticity or autocorrelation issues, as discussed above.
Another issue relates to the multicollinearity among variables. For Lin, Foster, and Ungar [118], variable selection algorithms are designed to seek an estimate of β that minimizes the penalized sum of squared errors. Multicollinearity is often encountered in applied regression models and occurs when two or more predictor variables are correlated. High levels of multicollinearity may lead to large variances in the least-squares estimators of beta coefficients in the regression equation. The correlations between the predictor variables’ magnitude influence the variance inflation factor (VIF). In detecting multicollinearity, we examined the variance of inflation (VIF). VIF is determined by . where the VIF for independent variable i is the reciprocal of the inverse of R2 for the regression model. The literature offers unclear guidance about which values for VIF are too large, and how the researcher should respond [119]. However, the simulation results suggest that a small sample size and low R2 interact with high collinearity to produces inaccurate regression coefficients [120]. This is not the case of this study as it includes 15,240 sample points, considered a large dataset.
As argued by Daoud [121], multicollinearity can be observed in the following cases: (i) large changes in the estimated coefficients when a variable is added or deleted; (ii) large differences in the coefficients when a data point is altered or dropped. Multicollinearity may be present if: (i) the algebraic signs of the estimated coefficients do not conform to the prior expectation; (ii) coefficients of variables that are expected to be important have large standard errors (small t-values). The latter points did not apply to this study. VIF values less than 5 are acceptable. While value 1 indicates no multicollinearity, values larger than 5 indicate high collinearity [121]. As shown in Table 4, the highest reported VIF score was 4.14 (health), and lowest score was 1.04 (hightec_exp) and the average was reported as 2.58 indicating low levels of multicollinearity [122].
4.1. Least Developed Countries
As revealed by ITU [37], out of 44 countries ranked as least developed countries (LDCs) or least connected countries (LCCs), 30 are in Africa, including the ten countries with the lowest rankings. Other LDCs are located in the Americas (one) and nine countries in Asia-Pacific. This study covers data for 23 LDCs (21 countries from Africa and two from Asia). In these countries, the availability and affordability of high-speed fixed-broadband services remain a challenge. A fixed-broadband plan with a minimum of 1GB of data per month corresponds, on average, to over 60 percent of GDP per capita. In addition, the offered broadband services in terms of speed and quality are usually lower quality [37].
In Table 2 (columns (3) and (4)), both OLS and 2SLS/IV report that ICT access (ictacc) in LDCs has a positive and statistically significant impact on SI. This is due to the expansion and the use of mobile cell phone [123,124] and internet access in LDCs during the ten years. On the other hand, high-speed ICT network (ictnet), as measured by fixed broadband networks and the international Internet bandwidth, is statistically insignificant at 0.05. Consequently, the export of high-tech products and services, as measured by hightec_exp, is impacted by low ICT access and ICT networks. Table 2 shows the statistically insignificant impact of hightec_exp on SI, indicating a growing digital divide compared to the rest of the world. In this context, despite slow progress on intellectual capacity, we witness a widening gap in higher education, including in the areas of science and technology. In Table 2, the highed variable is statistically insignificant. Additionally, the socio-economic parameters such as health, economic freedom (ecof), and inflow FDI (lnfdi) are statistical insignificant. The same is true when it comes to the institutional and environmental settings and variables such as government effectiveness (gov), civil liberties (cl), legal and co2gdpp. These variables point out the inadequate quality of institutional arrangements, and the extent to which governments promote participation in SI through regulation and adhere to principles of civil liberties and the quality of the rule of law and regulations.
4.2. Digital Divide
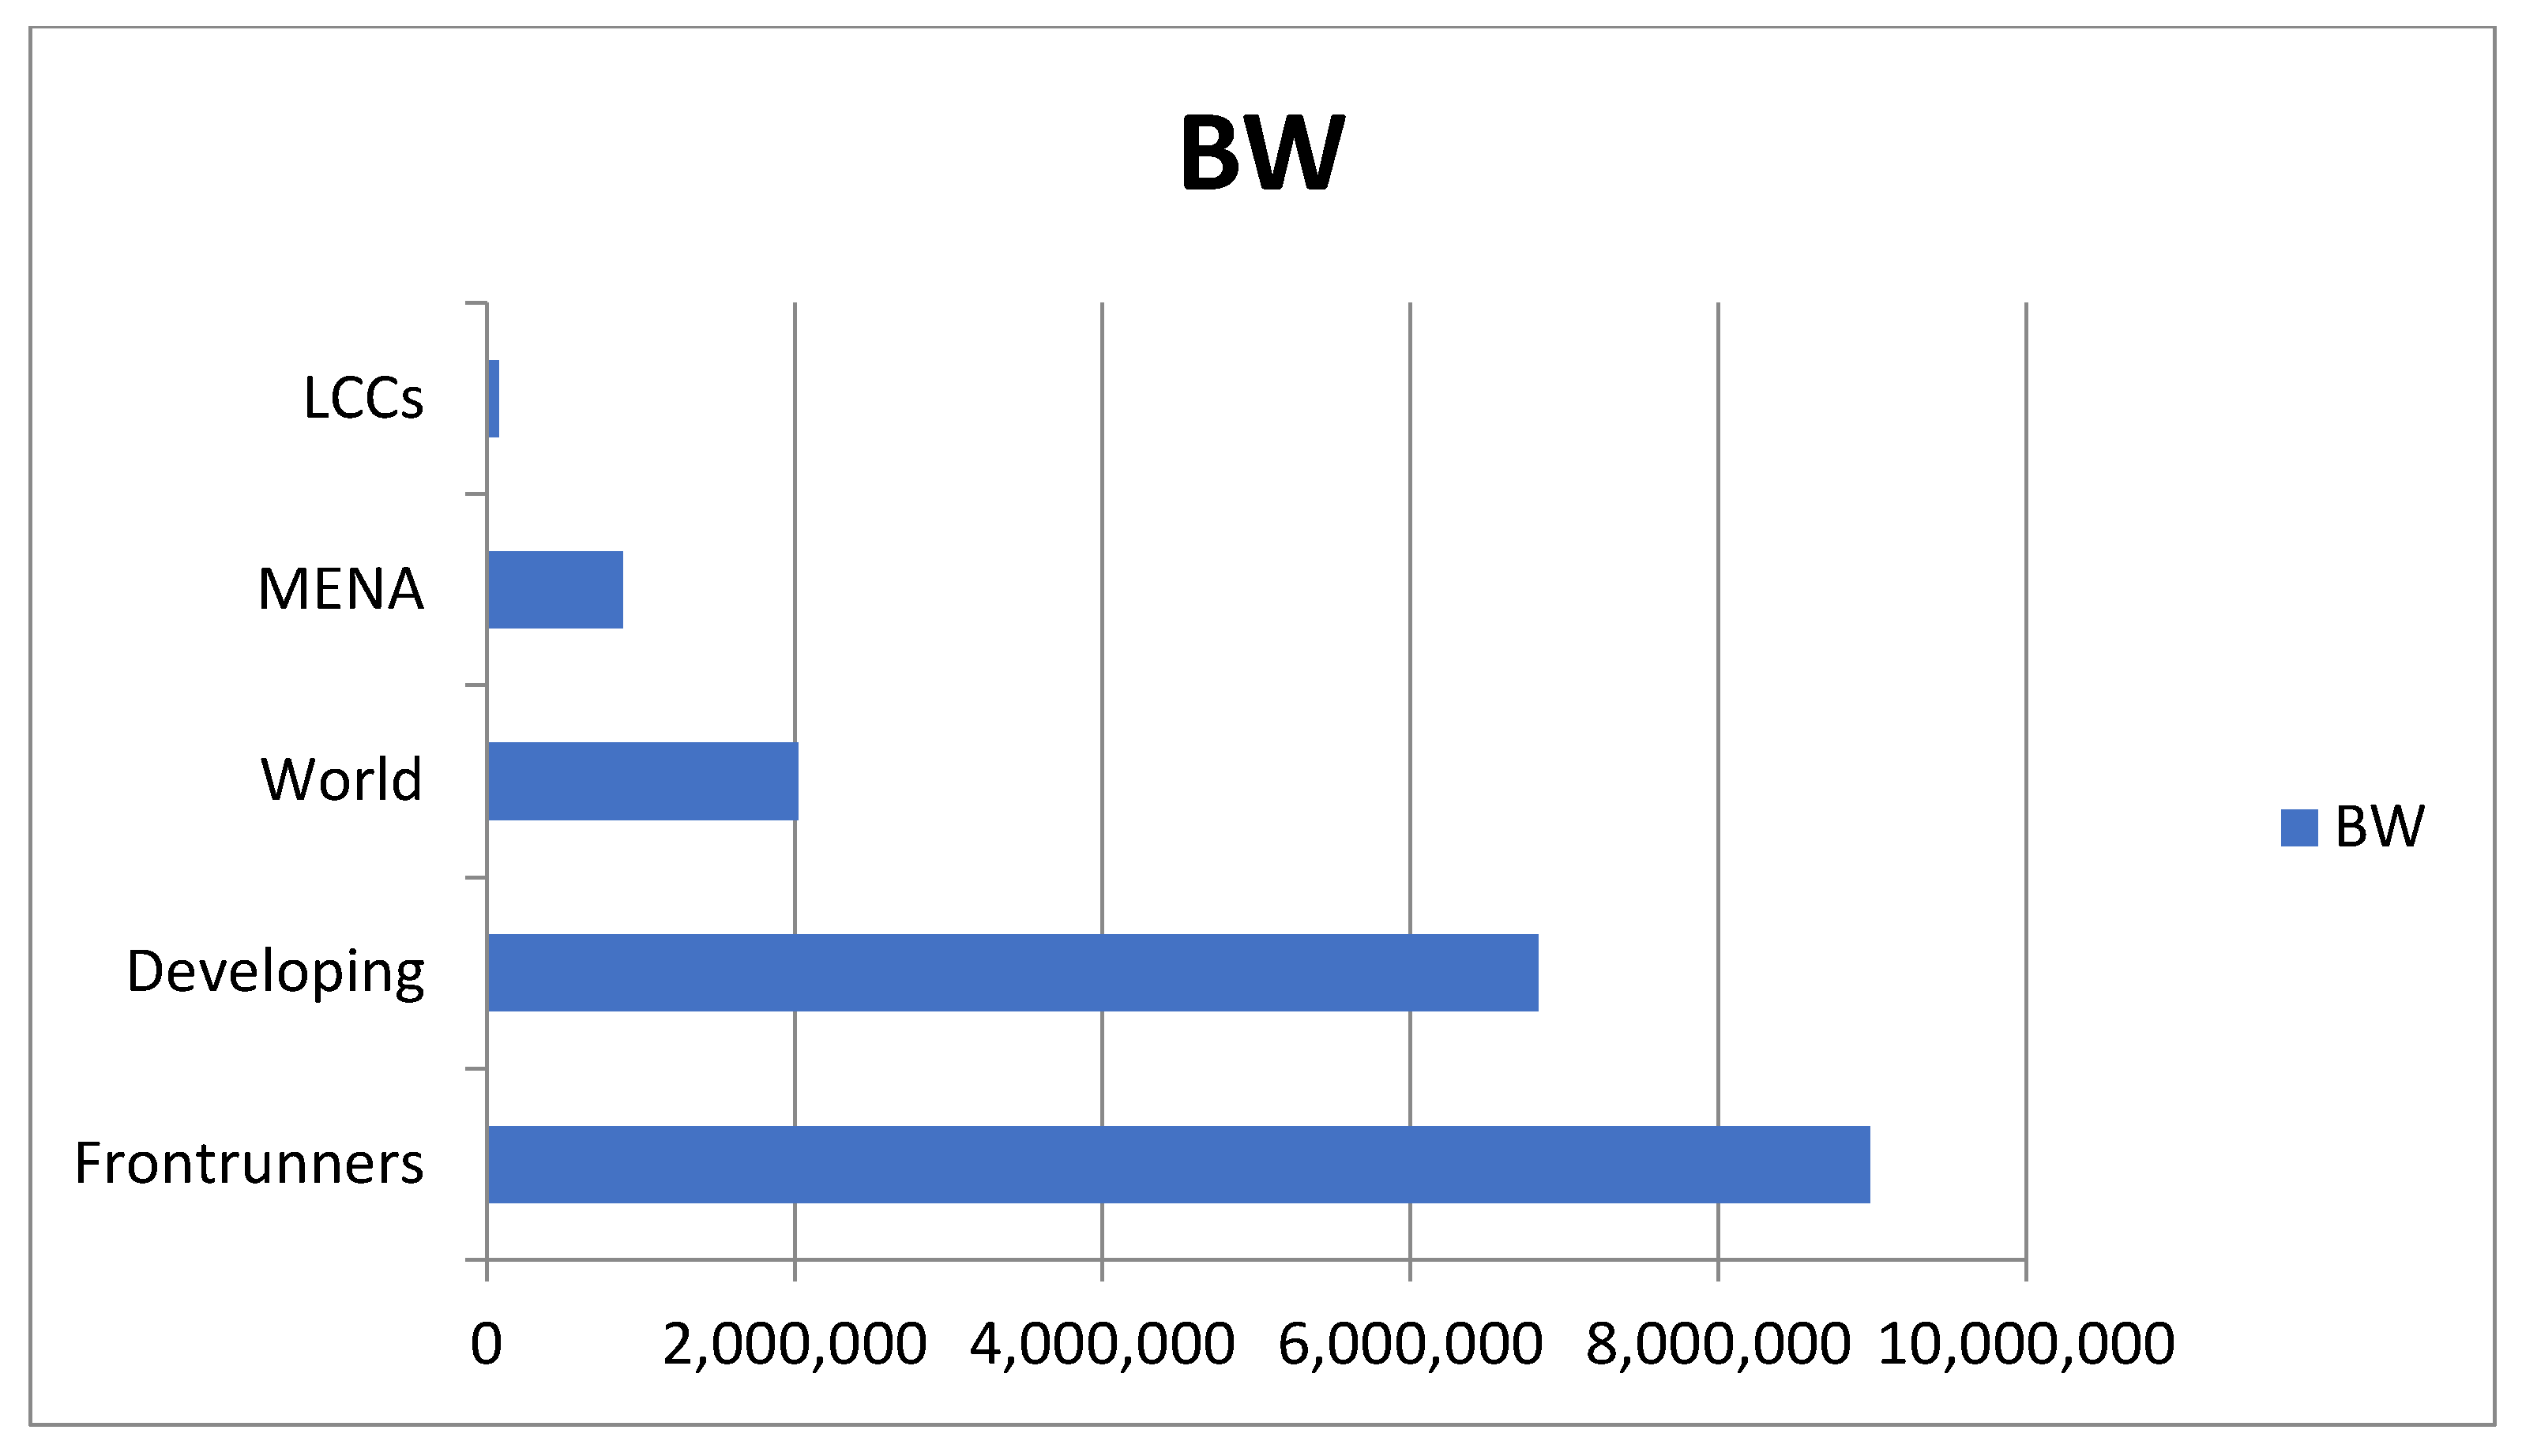
Cater [125] argued that the least developed nations face enormous obstacles in reaching even the low development levels of other poor nations; our study’s findings show that the same is true 33 years later. As discussed, the international Internet bandwidth per capita remains particularly low in the LDCs, suggesting that the lack of international connectivity remains a major bottleneck in the Internet infrastructure of these countries. The findings show that the share of bandwidth for these countries is less than 1%. In addition, there is a sharp digital divide with the rest of the world and the most developed ICT nations. Figure 2 compares the international internet bandwidth of LDCs with four other categories namely Middle East and North African (MENA), ICT developed nations, ICT frontrunners (ICT frontrunners are economies with very high performance in ICT access, ICT network, and innovation. These countries in alphabetic order include Australia, Canada, Finland, France, Germany, Hong Kong (China), Korea Rep., Japan, Netherlands, Norway, Singapore, Sweden, Switzerland, UK, and the USA) and the rest of the world.
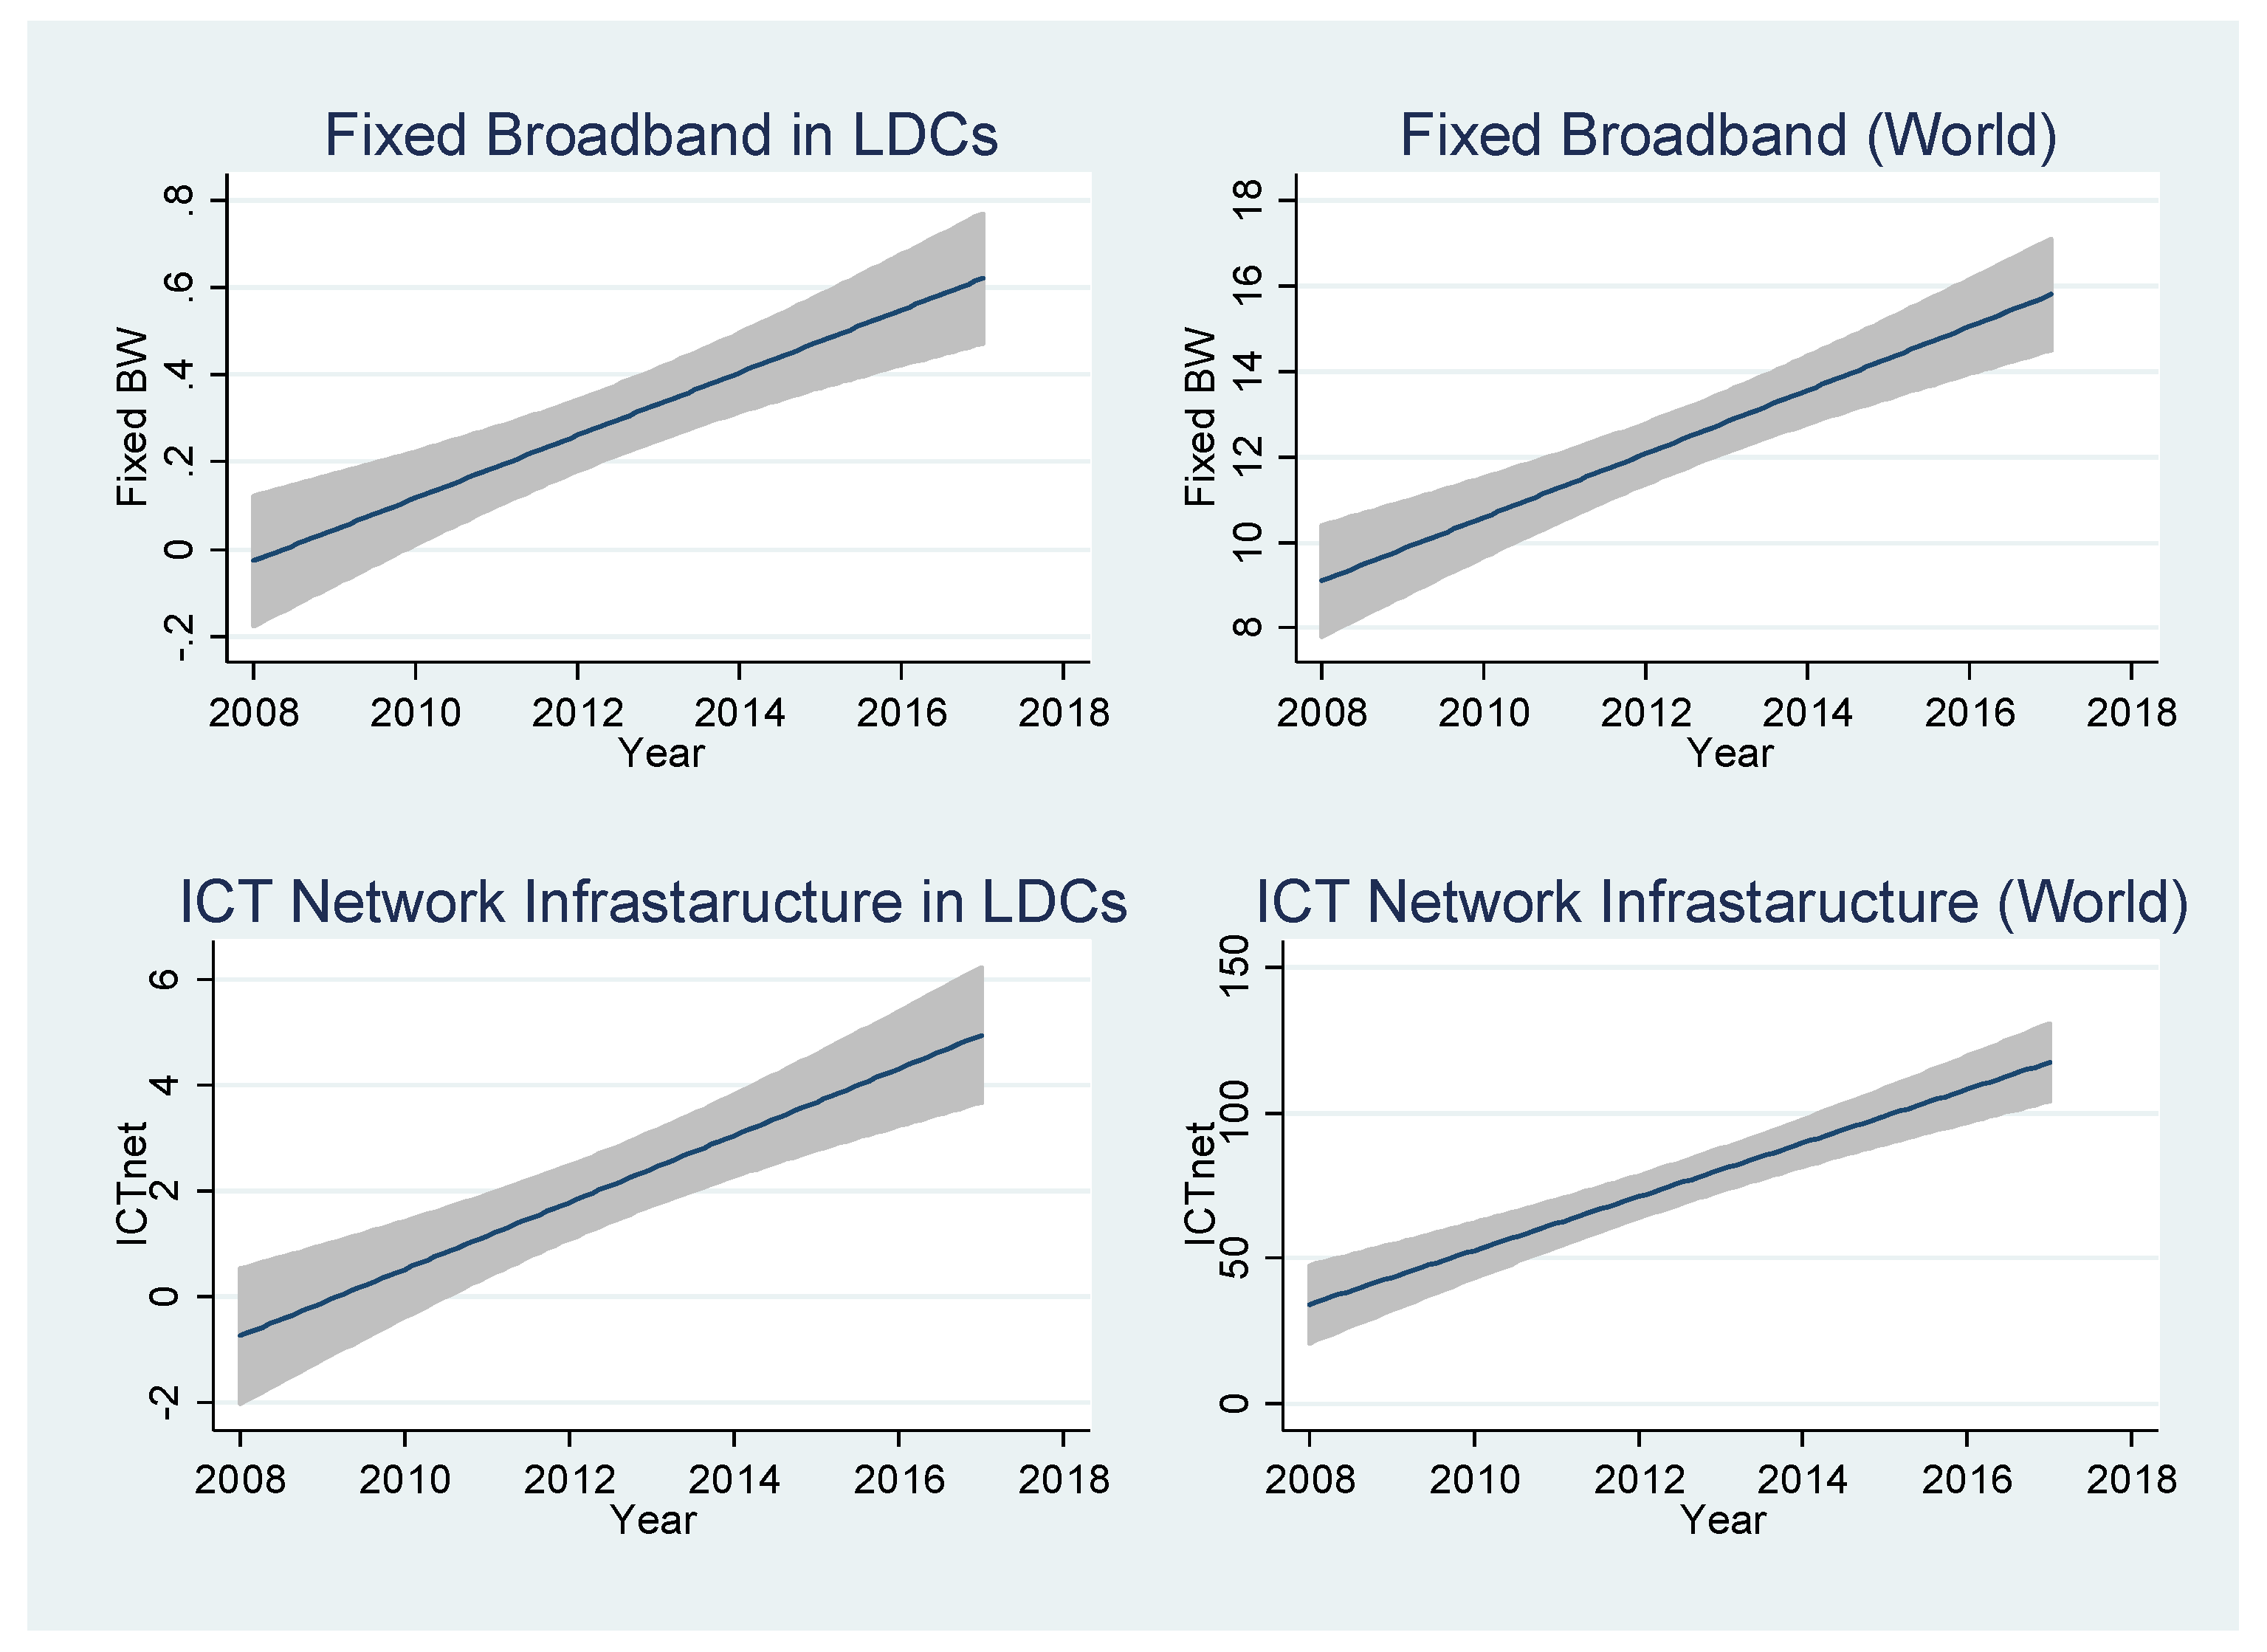
Figure 3 shows the existence of a digital divide in LDCs and the rest of the world from the perspective of fixed broadband networks, and the combined fixed broadband and international Internet bandwidth (ictnet). While the world average of fixed broadband network was around 12.45 Mbit/s per capita, the share of this network for LDCs was around 0.30, compared the frontrunners’ share of 33.80. This is important, because broadband networks are not only the backbone of today’s IoT, but also the infrastructure for innovation, and the knowledge economy in general. According to OECD and WTO [126], high-speed affordable broadband access is essential for social and economic development. Technological advances in areas such as IoT and artificial intelligence, combined with hyper-connectivity, are leading to an increasing variety of services and applications that can serve economic, social, and entertainment needs [126].
For African countries and LDCs, the most significant innovation challenges relate to institutional settings and socio-economic developments. Access to ICT is critical to innovation. However, in countries like Nigeria, which do business in relatively well-defined and regulated industries, inflow FDI is necessary for ICT to continue to push innovation as it incentivizes knowledge sharing [127]. The findings show that the degree of FDI inflow into the host country is directly associated with existing economic freedom. Economic freedom increases the possibility of FDI inflows [49].
Nevertheless, a more detailed analysis of LDCs’ data shows that besides ICT access, a significant factor in predicting a nation’s innovation levels, the existing level of tertiary education is insignificant. According to UNCTDA [9], there is a wide gap between LDCs, African countries, and the rest of the world regarding the distribution of science, technology, engineering, and mathematics (STEM) graduates. Africa’s STEM share is less than one percent compared to 29.2% for India and 26% for China. A holistic approach is required concerning the educational systems within STEM, as an essential factor for developing necessary skills and competencies in today’s digital business marked by cognitive economies [128]. This approach should come from a collaboration among policy-makers educational, and training institutes through a constructive reform in curricula. Akcomak and Weel [129] suggested that the educational system builds large social capital within a country, directly affecting SI. As Van Deursen and Van Dijk [130] mentioned, the most consistent determinant in digital divide research is undoubtedly educational attainment. Van Dijk and Hacker [131] view the digital divide as a complex and dynamic phenomenon, particularly when it comes to the diffusion of digital technology and innovation [132]. From the perspectives of ICTs and SI, the most consistent determinant in digital divide research is probably the educational level attained. From the viewpoint of today’s networked society and information economy [133], people with a high level of education use more information [130] on a daily basis. Sustainable innovations play not only major roles in today’s ICT—enabled knowledge economy [45], but managing knowledge is also associated with innovation [134].
As shown in Table 2 (columns (3) and (4)), there is no significant impact on the level of CO2 emission per GDPP on sustainable innovation in LDCs. These countries contributed least to the emission of greenhouse gases, but they are most vulnerable to the effects of climate change [135]. Additionally, emergent “technologies hold the promise to revive productivity and make plentiful resources available to end poverty for good, enable more sustainable patterns of growth, and mitigate or even reverse decades of environmental degradation” [9] (p. 4). However, technological change and innovation need to be directed towards inclusive and sustainable outcomes, through a purposeful effort by governments, in collaboration with civil society, business, and academia. Governments are also falling behind using digital technologies efficiently for social impact [73]. Because innovation can be understood to flow from knowledge creation and applications [136], governments can do more to invest in innovative digital solutions to drive social impact. If policy-makers are not proactive technological disruption can entrench inequality, further marginalize the poor, and fuel reactionary movements against open societies and economies [8]. This is an alarming situation based on Africa’s population growth rate, including many LDCs. According to the World Bank, the population growth rate of 2.7% in Africa in 2017 is the highest population growth globally. In addition, the rapid expansion of urbanization, become a significant concern when it comes to air pollution, habitat destruction, and the loss of arable land. This is also an alarming situation when it comes to the quality of health care systems in LDCs. Our findings show that there is no statistical significance between variable health and sustainable innovation in LDCs.
The findings confirm studies by Dünser, Baelani, and Ganbold [137] who mention that given the high incidence of poverty, low literacy rates, unresolved and on-going civil conflicts, mismanagement of resources, and deficits in socio-economic, political, and infrastructural conditions, general health care coverage remains a severe issue for many LCDs. They highlighted statistical figures that confirm the international health organizations’ annual reports of low health care systems in these countries [137]. Additionally, regarding SI, patents, and knowledge economy, the primary obstacle to local innovation in developing countries and LDCs is not inadequate intellectual property rights (IPRs) protection, but lack of capabilities [8,9]. The creation of low-cost research activities is a high priority to stimulate the knowledge economy.
5. Concluding Remarks
Considering the rapid population growth and the finite nature of non-renewable resources, research studies focused on sustainable economic growth and innovation have become more and more critical for academics, practitioners, international and regional organizations, national authorities, and citizens alike [138]. A favorable environment for individuals, companies, and nations for sustainable innovation is fundamental to their ability to excel in the fourth industrial revolution. Historically, information and communication technologies (ICTs) provided the essential infrastructure, tools, and services to share and expedite the transfer of knowledge necessary for sustainable innovation.
Foreign direct investment (FDI), ICT, education, GDPP, and economic freedom are well documented for their direct positive effect and spillover effects on innovation. However, regarding sustainable innovation, we used Lubberink et al.’s [67] definition: an innovation that considers the intellectual capacities, socio-economic, and environmental impacts as desirable outcomes. Here environmentally sustainable product innovation involves developing products or technologies that are both market-oriented and cause minimal environmental impacts [6]. Following a literature review, we developed a conceptual framework to investigate the effects of these four categories on sustainable innovation. We analyzed the impacts of ICTs, intellectual capacities, institutional and environmental settings, and the progress of socio-economic development on sustainable innovation from archival data for 127 economies from 2008–2017. This study is among a few that investigate sustainable innovation on a global scale and the widening digital divide.
As shown in Table 2, despite the positive impacts of these variables, our study found an increasing digital divide between LDCs, those of developed countries, and the rest of the world. The digital divide impedes economic growth and innovation. To tackle the digital divide issues, we recommend constructive educational reforms and investment in national broadband networks by attacking FDI inflows in these countries. Besides, FDI inflows should consider implementing ICT broadband networks, as a backbone to innovative solutions and sustainable growth [139]. As emphasized in the literature, the latter requires political stability, respect for fundamental civil liberty, and the rule of law. The educational reform should emphasize practical, applied, and experimental learning approaches [9]. The reform in LDCs and African countries’ curricula, particularly concerning STEM programs, should reflect the necessary skills and competencies for deploying emergent technologies. For deploying ICT infrastructure, policymakers and decision-makers should focus on incentives for attracting FDI flows, particularly in ICT broadband networks, as a backbone to innovative solutions and sustainable growth. Parallel with the above recommendations, the health of a growing population of African countries and especially LDCs requires deploying effective health care systems.
As emphasized by the UN’s World Economic Situation and Prospects [140], structural challenges continue to hamper significant economic and social development progress. This includes a lack of infrastructure and public services, political instability, institutional deficiencies, and vulnerability to shocks from commodity revenue and extreme weather events. Finally, future studies on ICT innovation in developing countries should investigate the impacts from gender divide perspectives. It is claimed that the digital divide negatively influences women’s participation in the digital sector, as women are seriously underrepresented in LDCs. For example, according to UNCTAD [9] there is a major gender divide in mobile phone ownership, especially in South Asia, and in Internet use, especially in LDCs and sub-Sahara Africa, where the gap has widened since 2013.
Research Limitations/Implications
This study is limited to investigating digital divides from the perspectives of sustainable innovation. However, studies on ICT innovation in developing countries should also explore digital divides from gender perspectives, as the digital divide negatively influences women’s participation in today’s economic development as marked by ICTs.
Also, future studies should consider the deployment of ensemble techniques containing multiple models that are averaged in a particular manner to improve the accuracy of predictions [98].
Author Contributions
Conceptualization, F.S. and N.H.; methodology, F.S. and N.H.; software, F.S. and N.H.; validation, F.S. and N.H.; formal analysis, F.S. and N.H.; investigation, F.S. and N.H.; resources, F.S. and N.H.; data curation, F.S. and N.H.; writing—original draft preparation, F.S. and N.H.; writing—review and editing, F.S. and N.H.; visualization, F.S. and N.H.; supervision, F.S. and N.H.; project administration, F.S. and N.H.; funding acquisition, F.S. and N.H. All authors have read and agreed to the published version of the manuscript.
Funding
This research received no external funding.
Institutional Review Board Statement
Not applicable.
Informed Consent Statement
Not applicable.
Data Availability Statement
The data presented in this paper are publicly available from sources mentioned in this study.
Conflicts of Interest
The authors declare that they have no conflict of interest.
Appendix A

Table A1.
Economies.
| 1 | Albania | 44 | Guatemala | 87 | Norway |
| 2 | Algeria | 45 | Guinea | 88 | Oman |
| 3 | Argentina | 46 | Guyana | 89 | Pakistan |
| 4 | Armenia | 47 | Honduras | 90 | Panama |
| 5 | Australia | 48 | Hong Kong, China | 91 | Paraguay |
| 6 | Austria | 49 | Hungary | 92 | Peru |
| 7 | Bahrain | 50 | Iceland | 93 | Philippines |
| 8 | Bangladesh | 51 | India | 94 | Poland |
| 9 | Barbados | 52 | Indonesia | 95 | Portugal |
| 10 | Belarus | 53 | Iran | 96 | Qatar |
| 11 | Belgium | 54 | Ireland | 97 | Romania |
| 12 | Benin | 55 | Israel | 98 | Russia |
| 13 | Botswana | 56 | Italy | 99 | Rwanda |
| 14 | Brazil | 57 | Jamaica | 100 | Saudi Arabia |
| 15 | Bulgaria | 58 | Japan | 101 | Senegal |
| 16 | Burkina Faso | 59 | Jordan | 102 | Singapore |
| 17 | Cambodia | 60 | Kazakhstan | 103 | Slovak Republic |
| 18 | Cameroon | 61 | Kenya | 104 | Slovenia |
| 19 | Canada | 62 | Korea (Rep.) | 105 | South Africa |
| 20 | Chad | 63 | Kuwait | 106 | Spain |
| 21 | Chile | 64 | Latvia | 107 | Sri Lanka |
| 22 | China | 65 | Lebanon | 108 | Sudan |
| 23 | Colombia | 66 | Lesotho | 109 | Suriname |
| 24 | Costa Rica | 67 | Lithuania | 110 | Sweden |
| 25 | Côte d’Ivoire | 68 | Luxembourg | 111 | Switzerland |
| 26 | Croatia | 69 | Madagascar | 112 | Tajikistan |
| 27 | Cyprus | 70 | Malawi | 113 | Tanzania |
| 28 | Czech Republic | 71 | Malaysia | 114 | Thailand |
| 29 | Denmark | 72 | Mali | 115 | Togo |
| 30 | Dominican Rep. | 73 | Malta | 116 | Trinidad and Tobago |
| 31 | Ecuador | 74 | Mauritius | 117 | Tunisia |
| 32 | Egypt | 75 | Mexico | 118 | Turkey |
| 33 | El Salvador | 76 | Mongolia | 119 | Uganda |
| 34 | Estonia | 77 | Morocco | 120 | Ukraine |
| 35 | Ethiopia | 78 | Mozambique | 121 | United Arab Emirates |
| 36 | Fiji | 79 | Myanmar | 122 | United Kingdom |
| 37 | Finland | 80 | Namibia | 123 | United States |
| 38 | France | 81 | Nepal | 124 | Uruguay |
| 39 | Gambia | 82 | Netherlands | 125 | Vietnam |
| 40 | Georgia | 83 | New Zealand | 126 | Zambia |
| 41 | Germany | 84 | Nicaragua | 127 | Zimbabwe |
| 42 | Ghana | 85 | Niger | ||
| 43 | Greece | 86 | Nigeria |
Appendix B
Table A2.
Sargan’s homoskedastic and autocorrelation test. LM = n R 2. {\displaystyle {\text{LM}}=nR^{2}.}
Table A2.
Sargan’s homoskedastic and autocorrelation test. LM = n R 2. {\displaystyle {\text{LM}}=nR^{2}.}
| Underidentification test (Kleibergen-Paap [141] rk LM statistic): | 300.156 | |
| hi-sq(1) P-val = | 0.0000 | |
| Weak identification test (Kleibergen-Paap [141] rk Wald F statistic): | 817.105 | |
| Stock-Yogo [142] weak ID test critical values: | 10% maximal IV size | 16.38 |
| 15% maximal IV size | 8.96 | |
| 20% maximal IV size | 6.66 | |
| 25% maximal IV size | 5.53 | |
| Source: Stock-Yogo [142]. Reproduced by permission. | ||
| NB: Critical values are for Cragg-Donald [143] F statistic and i.i.d. errors. | ||
| Hansen J statistic (overidentification test of all instruments): | 0.000 | |
| (equation exactly identified) | ||
| Instrumented: | gov | |
| Included instruments: co2gdpp ictnet ictacc hightech_exp highedu cl legal lnfdi | ||
| ecof hdi | ||
| Excluded instruments: pr (political rights) | ||
Note: According to Baum, Schaffer, and Stillman [144], the ivreg2, is an extension of Stata’s 2SLS/IV module. It is designed under the assumption of conditional homoskedasticity, Hansen’s J-statistic becomes Sargan’s statistic. The J-statistic is consistent in the presence of heteroskedasticity and autocorrelation. Sargan’s statistic is consistent if the disturbance is homoskedastic and (for AC-consistent estimation) if it is also autocorrelated. See also [98,145] for other model fit criteria.
Table A3.
Stata IV heteroskedasticity test with fitted value (ivhettest).
| IV heteroskedasticity test(s) using fitted value (X-hat*beta-hat) |
| Ho: Disturbance is homoskedastic |
| Pagan-Hall [146] general test statistic: 2.969 Chi-sq(1) p–value = 0.0849 |
References
- OECD. The Knowledge-Based Economy; Organisation for Ecomic Co-Operation and Development: Paris, France, 1996. [Google Scholar]
- ERBD. The Knowledge Economy and Innovation. Available at: From European Bank for Reconstruction and Development. 2017. Available online: http://www.ebrd.com/what-we-do/sectors-and-topics/ebrd-knowledge-economy-innovation.html (accessed on 15 November 2019).
- Nieuwboer, M.V.D.; van de Burgwal, L.; Claassen, E. A quantitative key-opinion-leader analysis of innovation barriers in probiotic research and development: Valorisation and improving the tech transfer cycle. PharmaNutrition 2016, 4, 9–18. [Google Scholar] [CrossRef]
- Carrillo-Hermosilla, J.; Del Río, P.; Könnölä, T. Diversity of eco-innovations: Reflections from selected case studies. J. Clean. Prod. 2010, 18, 1073–1083. [Google Scholar] [CrossRef]
- Hellström, T. Dimensions of environmentally sustainable innovation: The structure of eco-innovation concepts. Sustain. Dev. 2007, 15, 148–159. [Google Scholar] [CrossRef]
- De Medeiros, J.F.; Ribeiro, J.L.D.; Cortimiglia, M.N. Success factors for environmentally sustainable product innovation: A systematic literature review. J. Clean. Prod. 2014, 65, 76–86. [Google Scholar] [CrossRef]
- Eom, S.-J.; Choi, N.; Sung, W. The use of smart work in government: Empirical analysis of Korean experiences. Gov. Inf. Q. 2016, 33, 562–571. [Google Scholar] [CrossRef]
- UNCTAD. World Investment Report 2018, Investment and New Industrial Policies; United Nations Publication: New York, NY, USA, 2018. [Google Scholar]
- UNCTAD Report. Technology and Innovation Report 2018, Harnessing Frontier Technologies for Sustainable Development; United Nations Publication: New York, NY, USA, 2018. [Google Scholar]
- Higon, D.A.; Gholami, R.; Shirazi, F. ICT and environmental sustainability: A global perspective. Telemat. Inform. 2017, 34, 85–95. [Google Scholar] [CrossRef]
- IDC Report. Data Age 2025, the Digitization of the World from Edge to Core. 2018. Available online: https://www.seagate.com/files/www-content/our-story/trends/files/idc-seagate-dataage-whitepaper.pdf (accessed on 10 October 2017).
- ITU. Big Data: Big Today, Normal Tomorrow, ITU-T Technology Watch Report November 2013; ITU Publication: Geneva, Switzerland, 2013. [Google Scholar]
- UNCTAD. The Digital Divide Report: ICT Diffusion Index 2005; United Nations Publication: New York, NY, USA, 2006. [Google Scholar]
- Hendricks, P. Why share knowledge? The influence of ICT on the motivation for knowledge sharing. Knowl. Process. Manag. 1999, 6, 91–100. [Google Scholar] [CrossRef]
- Lin, H.-F. An empirical investigation of mobile banking adoption: The effect of innovation attributes and knowledge-based trust. Int. J. Inf. Manag. 2011, 31, 252–260. [Google Scholar] [CrossRef]
- Wu, Y.; Chen, J.-C. A structured method for smart city project selection. Int. J. Inf. Manag. 2021, 56, 101981. [Google Scholar] [CrossRef]
- Hadad, S. Knowledge Economy: Characteristics and Dimensions. Manag. Dyn. Knowl. Econ. 2017, 5, 203–225. [Google Scholar] [CrossRef] [Green Version]
- Lüthi, S.; Thierstein, A.; Bentlage, M. Interlocking Firm Networks in the German Knowledge Economy. On Local Networks and Global Connectivity. Raumforsch. Raumordn. 2011, 69, 161–174. [Google Scholar] [CrossRef]
- Schmitt, U. The Role of Personal Knowledge Management Systems in Making Citizens Highly Knowledgeable. Available online: https://www.researchgate.net/publication/268741177_The_Role_of_Personal_Knowledge_Management_Systems_in_making_Citizens_highly_knowledgeable (accessed on 20 January 2018).
- Tampoe, M. Motivating knowledge workers—The challenge for the 1990s. Long Range Plan. 1993, 26, 49–55. [Google Scholar] [CrossRef]
- Liu, F.C.; Simon, D.F.; Sun, Y.T.; Cao, C. China’s innovation policies: Evolution, institutional structure, and trajectory. Res. Policy. 2011, 40, 917–931. [Google Scholar] [CrossRef]
- Van Laar, E.; Van Deursen, A.J.A.M.; Van Dijk, J.A.G.M.; De Haan, J. The relation between 21st-century skills and digital skills: A systematic literature review. Comput. Hum. Behav. 2017, 72, 577–588. [Google Scholar] [CrossRef]
- Hajli, N.; Tajvidi, M.; Gbadamosi, A.; Nadeem, W. Understanding market agility for new product success with big data analytics. Ind. Mark. Manag. 2020, 86, 135–143. [Google Scholar] [CrossRef]
- Hollenstein, H. The Decision to Adopt Information and Communication Technologies (ICT): Firm-Level Evidence for Switzerland; OECD Publications Service: Paris, France, 2004. [Google Scholar]
- Oliner, S.D.; E Sichel, D. The Resurgence of Growth in the Late 1990s: Is Information Technology the Story? J. Econ. Perspect. 2000, 14, 3–22. [Google Scholar] [CrossRef] [Green Version]
- Etro, F. The economic impact of cloud computing on business creation, employment and output in Europe: An application of the endogenous market structures approach to a GPT innovation. Rev. Bus. Econ. 2009, 179–185. [Google Scholar]
- Higon, D.A. The impact of ICT on innovation activities: Evidence for UK SMEs. Int. Small Bus. J. Res. Entrep. 2011, 30, 684–699. [Google Scholar] [CrossRef]
- Huy, V.L.; Rowe, F.; Truex, D.; Huybh, Q.M. An empirical study of determinants of e-commerce adoption in SMEs in Vietnam an economy in transition. J. Glob. Inf. Manag. 2012, 20, 23–54. [Google Scholar]
- Tehrani, S.R.; Shirazi, F. Factors influencing the adoption of cloud computing by small and medium size enterprises (SMEs). In Human Interface and the Management of Information. Information and Knowledge in Applications and Services. HIMI 2014. Lecture Tes in Computer Science, 8522; Yamamoto, S., Ed.; Springer: Berlin/Heidelberg, Germany, 2014. [Google Scholar]
- Gera, S.; Gu, W. The Effect of Organizational Innovation and Information Technology on Firm Performance. Available online: http://0-dx-doi-org.brum.beds.ac.uk/10.2139/ssrn.1404689 (accessed on 10 June 2021).
- UNCC. ICT Sector Helping to Tackle Climate Change. 2016. Available online: https://unfccc.int/news/ict-sector-helping-to-tackle-climate-change (accessed on 12 June 2017).
- UNCTAD. Review of Maritime Transport 2017; United Nations Publication: New York, NY, USA, 2017. [Google Scholar]
- Choi, J.K.; Kim, J.H. Analysis of Digital Data Technologies Toward Future Data Ecosociety, ITUT Technical Paper. Available online: https://www.itu.int/dms_pub/itu-t/oth/23/01/T23010000240001PDFE.pdf (accessed on 16 March 2020).
- Guszcza, J.; Lewis, H.; Lucker, J. IoT’s about us: Emerging forms of Innovation in the Internet of Things, Deloitte Review Issue 17. 2015. Available online: https://www2.deloitte.com/insights/us/en/deloitte-review/issue-17/internet-of-things-innovation.html (accessed on 5 August 2017).
- ITU. The Tactile Internet. ITU-T Technology Watch Report; ITU Publication: Geneva, Switzerland, 2014. [Google Scholar]
- Li, S.; Da Xu, L.; Zhao, S. 5G Internet of Things: A survey. J. Ind. Inf. Integr. 2018, 10, 1–9. [Google Scholar] [CrossRef]
- ITU. Measuring The Information Society Report 2016; ITU Publications: Geneva, Switzerland, 2016. [Google Scholar]
- Yi, L.; Thomas, H.R. A review of research on the environmental impact of e-business and ICT. Environ. Int. 2007, 33, 841–849. [Google Scholar] [CrossRef]
- Erkan, M.K. Economic Freedom and Innovation. Int. J. Sci. Res. 2015, 1806–1809. [Google Scholar]
- Zhu, H.; Zhu, S.X. Corporate innovation and economic freedom: Cross-country comparisons. Q. Rev. Econ. Finance 2017, 63, 50–65. [Google Scholar] [CrossRef]
- Balboni, M.; Rovira, S.; Vergara, S. ICT in Latin America: A Microdata Analysis; United Nations Economic Commission for Latin America and the Caribbean: Santiago, Chile, 2011. [Google Scholar]
- Stevens, P.; Weale, M. Education and economic growth.–London. Natl. Inst. Econ. Soc. Res. 2003. NIESR Working Paper. Available online: http://cee.lse.ac.uk/conference_papers/28_11_2003/martin_weale.pdf (accessed on 30 June 2021).
- World Bank. The Changing Nature of Work. In World Development Report 2019: The Changing Nature of Work.; World Bank: Washington, DC, USA, 2019. [Google Scholar]
- De Haan, J.; Sturm, J.E. On the relationship between economic freedom and economic growth. Eur. J. Political Econ. 2000, 16, 215–241. [Google Scholar] [CrossRef] [Green Version]
- Gwartney, J.; Lawson, R. The concept and measurement of economic freedom. Eur. J. Political Econ. 2003, 19, 405–430. [Google Scholar] [CrossRef]
- Gropper, D.M.; Lawson, R.A.; Thorne, J.T. Economic freedom and happiness. Cato J. 2011, 31, 237–255. [Google Scholar]
- Gwartney, J.; Lawson, R. Economic Freedom of The World: 2006 Annual Report; The Fraser Institute: Vancouver, BC, Canada, 2006. [Google Scholar]
- Dreher, A.; Gassebner, M.; Siemers, L.-H.R. Globalization, Economic Freedom, and Human Rights. J. Confl. Resolut. 2011, 56, 516–546. [Google Scholar] [CrossRef] [Green Version]
- Ghazalian, P.L.; Amponsem, F. The effects of economic freedom on FDI inflows: An empirical analysis. Appl. Econ. 2018, 51, 1111–1132. [Google Scholar] [CrossRef]
- Quazi, R. Economic Freedom and Foreign Direct Investment in East Asia. J. Asia Pac. Econ. 2007, 12, 329–344. [Google Scholar] [CrossRef]
- Shirazi, F.; Gholami, R.; Higón, D.A. The impact of information and communication technology (ICT), and regulation on economic freedom in Islamic Middle Eastern countries. Inf. Manag. 2009, 46, 426–433. [Google Scholar] [CrossRef]
- Fu, X. Foreign Direct Investment, Absorptive Capacity and Regional Innovation Capabilities: Evidence from China. Oxf. Dev. Stud. 2008, 36, 89–110. [Google Scholar] [CrossRef]
- UNCTAD. World Investment Report 2016, Investor Nationality: Policy Challenges; United Nations Publication: Geneva, Switzerland, 2016. [Google Scholar]
- WSIS. World Summit on the Information Society: Outcome Document, WSIS Forum 2011, Geneva. Available online: http://groups.itu.int/wsisforum2011/Agenda/OutcomeDocument.aspx (accessed on 12 October 2017).
- De Bondt, R. Spillovers and innovative activities. Int. J. Ind. Organ. 1997, 15, 1–28. [Google Scholar] [CrossRef]
- Conley, T.G.; Ligon, E. Economic Distance and Cross-Country Spillovers. J. Econ. Growth 2002, 7, 157–187. [Google Scholar] [CrossRef]
- Peri, G. Determinants of Knowledge Flows and Their Effect on Innovation. Rev. Econ. Stat. 2005, 87, 308–322. [Google Scholar] [CrossRef]
- Chen, K.-H.; Hsiao, H.-M.; Yang, H.-Y. Spillover effects of innovation: Taiwanese evidence. Appl. Econ. 2010, 42, 3417–3437. [Google Scholar] [CrossRef]
- Damijan, J.P.; Knell, M.; Majcen, B.; Rojec, M. The role of FDI, R&D accumulation and trade in transferring technology to transition countries: Evidence from firm panel data for eight transition countries. Econ. Syst. 2003, 27, 189–204. [Google Scholar]
- Cheung, K.-Y.; Lin, P. Spillover effects of FDI on innovation in China: Evidence from the provincial data. China Econ. Rev. 2004, 15, 25–44. [Google Scholar] [CrossRef] [Green Version]
- Wang, C.; Kafouros, M. What factors determine innovation performance in emerging economies? Evidence from China. Int. Bus. Rev. 2009, 18, 606–616. [Google Scholar] [CrossRef]
- UNCTAD. World Investment Report, FDI from Developing and Transition Economies: Implications for Development; United Nations Publication: Geneva, Switzerland, 2006. [Google Scholar]
- Branstetter, L. Is foreign direct investment a channel of knowledge spillovers? Evidence from Japan’s FDI in the United States. J. Int. Econ. 2006, 68, 325–344. [Google Scholar] [CrossRef] [Green Version]
- Tang, M.; Hussler, C. Betting on indigenous innovation or relying on FDI: The Chinese strategy for catching-up. Technol. Soc. 2011, 33, 23–35. [Google Scholar] [CrossRef]
- Steensma, H.; Lyles, M.A. Explaining IJV survival in a transitional ecomy through social exchange and knowledge-based perspectives. Strateg. Manag. J. 2000, 21, 831–851. [Google Scholar]
- Batrancea, I.; Batrancea, L.; Maran Rathnaswamy, M.; Tulai, H.; Fatacean, G.; Rus, M.I. Greening the financial system in USA, Canada and Brazil: A panel data analysis. Mathematics 2020, 8, 2217. [Google Scholar] [CrossRef]
- Lubberink, R.; Blok, V.; Van Ophem, J.; Omta, O. Lessons for Responsible Innovation in the Business Context: A Systematic Literature Review of Responsible, Social and Sustainable Innovation Practices. Sustainability 2017, 9, 721. [Google Scholar] [CrossRef] [Green Version]
- Cascio, W.F.; Montealegre, R. How Technology Is Changing Work and Organizations. Annu. Rev. Organ. Psychol. Organ. Behav. 2016, 3, 349–375. [Google Scholar] [CrossRef]
- Ritchie, H. Where in the World Do People Emit the Most CO2? 2019. Available online: https://ourworldindata.org/per-capita-co2 (accessed on 16 December 2019).
- Dutta, S.; Lanvin, B. The Network Readiness Index 2020: Accelerating Digital Transformation in A Post-COVID Global Economy; Portulans Institute, WITSA: Washington, DC, USA, 2020. [Google Scholar]
- Gaskell, A. How Estonia Became the Digital Leader of Europe. Available online: https://www.forbes.com/sites/adigaskell/2017/06/23/how-estonia-became-the-digital-leaders-of-europe/#e765c8f256da (accessed on 15 July 2017).
- Lee, S.; Kim, M.-S.; Park, Y. ICT Co-evolution and Korean ICT strategy—An analysis based on patent data. Telecommun. Policy 2009, 33, 253–271. [Google Scholar] [CrossRef]
- NRI. The Networked Readiness Index 2016. Available online: https://widgets.weforum.org/gitr2016/index.html (accessed on 17 July 2017).
- Strumsky, D.; Lobo, J. Identifying the sources of techlogical velty in the process of invention. Res. Policy 2015, 44, 1445–1461. [Google Scholar] [CrossRef] [Green Version]
- Foxon, T.; Pearson, P. Overcoming barriers to innovation and diffusion of cleaner technologies: Some features of a sustainable innovation policy regime. J. Clean. Prod. 2008, 16, S148–S161. [Google Scholar] [CrossRef]
- Acs, Z.J.; Audretsch, D.B. Patents as a Measure of Innovative Activity. Kyklos 1989, 42, 171–180. [Google Scholar] [CrossRef]
- Griliches, Z. Patent Statistics as Economic Indicators: A Survey. Available online: https://0-www-jstor-org.brum.beds.ac.uk/stable/2727442 (accessed on 15 July 2017).
- Carpenter, M.P.; Narin, F. The adequacy of the Science Citation Index (SCI) as an indicator of international scientific activity. J. Am. Soc. Inf. Sci. 1981, 36, 430–439. [Google Scholar] [CrossRef]
- Kurtossy, J.; Harhoff, D.; Narin, F.; Scherer, F.; Vopel, K. Citation frequency and the value of patented inventions. Rev. Econ. Stat. 1999, 511–515. [Google Scholar]
- Lall, S. Indicators of the relative importance of IPRs in developing countries. Res. Policy 2003, 32, 1657–1680. [Google Scholar] [CrossRef] [Green Version]
- Rutenburg, I. Faking it: Time to Rethink Intellectual Property in Developing Countries? 2013. Available online: https://www.theguardian.com/global-development-professionals-network/2013/oct/29/intellectual-property-rights-google (accessed on 20 January 2018).
- Dang, J.; Motohashi, K. Patent statistics: A good indicator for innovation in China? Patent subsidy program impacts on patent quality. China Econ. Rev. 2015, 35, 137–155. [Google Scholar] [CrossRef]
- Arundel, A.; Kabla, I. What percentage of innovations are patented? Empirical estimates for European firms. Res. Policy 1998, 27, 127–141. [Google Scholar] [CrossRef]
- Gallini, N.T. The Economics of Patents: Lessons from Recent U.S. Patent Reform. J. Econ. Perspect. 2002, 16, 131–154. [Google Scholar] [CrossRef]
- Cohen, W.; Nelson, R.; Walsh, J. Protecting Their Intellectual Assets: Appropriability Conditions and Why U.S. Manufacturing Firms Patent (or Not). In Protecting Their Intellectual Assets: Appropriability Conditions and Why U.S. Manufacturing Firms Patent (or Not); National Bureau of Economic Research: Cambridge, MA, USA, 2000. [Google Scholar]
- Kultti, K.; Takalo, T.; Toikka, J. Simultaneous Model of Innovation, Secrecy, and Patent Policy. Am. Econ. Rev. 2006, 96, 82–86. [Google Scholar] [CrossRef] [Green Version]
- Goldin, C.; Katz, L. The Race Between Education and Technology: The Evolution of U.S. Al Wage Differentials, 1890 To 2005; Working Paper 12984; National Bureau of Economic Research: Cambridge, MA, USA, 2007. [Google Scholar]
- Bankole, F.O.; Shirazi, F.; Brown, I. Investigating the Impact of ICT Investments on Human Development. Electron. J. Inf. Syst. Dev. Ctries. 2011, 48, 1–19. [Google Scholar] [CrossRef]
- Hickel, J. The sustainable development index: Measuring the ecological efficiency of human development in the anthropocene. Ecol. Econ. 2020, 167, 106331. [Google Scholar] [CrossRef]
- Khan, N.H.; Ju, Y.; Hassan, S.T. Modeling the impact of ecomic growth and terrorism on the human development index: Collecting evidence from Pakistan. Environ. Sci. Pollut. Res. 2018, 25, 34661–34673. [Google Scholar] [CrossRef]
- Kummu, M.; Taka, M.; Guillaume, J.H. Gridded global datasets for gross domestic product and Human Development Index over 1990–2015. Sci. Data 2018, 5, 180004. [Google Scholar] [CrossRef] [PubMed] [Green Version]
- Sarkodie, S.A.; Adams, S. Electricity access, human development index, governance and income inequality in Sub-Saharan Africa. Energy Rep. 2020, 6, 455–466. [Google Scholar] [CrossRef]
- The Heritage Foundation. 2019 Index of Economic Freedom. 2019. Available online: https://www.heritage.org/index/pdf/2019/book/highlights.pdf (accessed on 10 March 2020).
- Ecomic Freedom. About the Index. 2019. Available online: https://www.heritage.org/index/ (accessed on 9 September 2019).
- The Heritage Foundation. 2016 Index of Economic Freedom. 2017. Available online: http://www.heritage.org/index/ (accessed on 12 June 2017).
- Bjørnskov, C. Economic freedom and economic crises. Eur. J. Political Econ. 2016, 45, 11–23. [Google Scholar] [CrossRef] [Green Version]
- UN. E-Government Survey 2020: Digital Government in the Decade of Action for Sustainable Development; United Nations Publication: New York, NY, USA, 2020. [Google Scholar]
- Yang, H. The case for being automatic: Introducing the automatic linear modeling (LINEAR) procedure in SPSS statistics. Mult. Linear Regres. Viewp. 2013, 39, 27–37. [Google Scholar]
- Pulakkat, H. Why India’s Steady, if not Spectacular, Growth in Global Innovation Index Is Worth Noting. Available online: http://economictimes.indiatimes.com/news/economy/indicators/why-indias-steady-if-t-spectacular-growth-in-global-innovation-index-is-worth-noting/articleshow/59258519.cms (accessed on 18 July 2017).
- Lundvall, B.Å.; Borrás, S. Science, technology and innovation policy. In The Oxford Handbook of Innovation; Fagerberg, J., Mowery, D.C., Nelson, R.R., Eds.; Oxford University Press: Oxford, UK, 2005; pp. 599–631. [Google Scholar]
- Batchelor, S. Biotech plays critical role in protecting against coronavirus outbreak. Ind. Biotechnol. 2020, 16, 43. [Google Scholar] [CrossRef]
- Chang, T.-Y.; Hong, G.; Paganelli, C.; Phantumvanit, P.; Chang, W.-J.; Shieh, Y.-S.; Hsu, M.-L. Innovation of dental education during COVID-19 pandemic. J. Dent. Sci. 2021, 16, 15–20. [Google Scholar] [CrossRef]
- Darwish, S.A.A.D.; Ahmed, U.M.A.I.R.; Pahi, M.H. Innovative work behavior during COVID-19 for medical representative in the pharmaceutical industry: Test of a moderation model in Bahrain. Int. J. Pharm. Res. 2020, 12, 1927–1934. [Google Scholar]
- Henry, R. Innovations in Agriculture and Food Supply in Response to the COVID-19 Pandemic. Mol. Plant 2020, 13, 1095–1097. [Google Scholar] [CrossRef]
- Hensel, A.; Bauer, R.; Heinrich, M.; Spiegler, V.; Kayser, O.; Hempel, G.; Kraft, K. Challenges at the Time of COVID-19: Opportunities and Innovations in Antivirals from Nature. Planta Med. 2020, 86, 659–664. [Google Scholar] [CrossRef]
- Jawed, I.; Tareen, F.R.; Cauhan, K.; Nayeem, M. Food safety and COVID-19: Limitations of HACCP and the way forward. Pharma Innov. 2020, 9, 1–4. [Google Scholar] [CrossRef]
- Kadakia, K.; Patel, B.; Shah, A. Advancing digital health: FDA innovation during COVID-19. NPJ Digit. Med. 2020, 3, 161. [Google Scholar] [CrossRef]
- Verna, E.C.; Serper, M.; Chu, J.; Corey, K.; Fix, O.K.; Hoyt, K.; Page, K.A.; Loomba, R.; Li, M.; Everson, G.T.; et al. Clinical Research in Hepatology in the COVID-19 Pandemic and Post-Pandemic Era: Challenges and the Need for Innovation. Hepatology 2020, 72, 1819–1837. [Google Scholar] [CrossRef]
- Woolliscroft, J.O. Innovation in Response to the COVID-19 Pandemic Crisis. Acad. Med. 2020, 95, 1140–1142. [Google Scholar] [CrossRef]
- Bing, X.G.Y. The spillover effect of FDI on China’s invasion capacity. World Econ. 2005, 10. [Google Scholar]
- Filippetti, A.; Frenz, M.; Ietto-Gillies, G. The impact of internationalization on innovation at countries’ level: The role of absorptive capacity. Camb. J. Econ. 2016, 41, 413–439. [Google Scholar] [CrossRef] [Green Version]
- Kayalvizhi, P.; Thenmozhi, M. Does quality of innovation, culture and governance drive FDI?: Evidence from emerging markets. Emerg. Mark. Rev. 2018, 34, 175–191. [Google Scholar] [CrossRef]
- Liangke, J.D.X. The Empirical Study of the Function of FDI on Innovation in China’s High-Tech Industries. Available online: https://en.cnki.com.cn/Article_en/CJFDTotal-SJJJ200508001.htm (accessed on 26 October 2020).
- Durbin, J. Errors in Variables. Rev. l’Institut Int. Stat. / Rev. Int. Stat. Inst. 1954, 22, 23–32. [Google Scholar] [CrossRef]
- Wu, D.-M. Alternative Tests of Independence between Stochastic Regressors and Disturbances: Finite Sample Results. Econometrica 1974, 42, 529–546. [Google Scholar] [CrossRef]
- Hayes, A.F.; Cai, L. Using heteroskedasticity-consistent standard error estimators in OLS regression: An intro-duction and software implementation. Behav. Res. Methods 2007, 39, 709–722. [Google Scholar] [CrossRef] [Green Version]
- Kleibergen, F. Generalizing weak instrument robust IV statistics towards multiple parameters, unrestricted covariance matrices and identification statistics. J. Econ. 2007, 139, 181–216. [Google Scholar] [CrossRef]
- Lin, D.; Foster, D.P.; Ungar, L.H. VIF Regression: A Fast Regression Algorithm for Large Data. J. Am. Stat. Assoc. 2011, 106, 232–247. [Google Scholar] [CrossRef] [Green Version]
- O’Brien, R.M. A Caution Regarding Rules of Thumb for Variance Inflation Factors. Qual. Quant. 2007, 41, 673–690. [Google Scholar] [CrossRef]
- Lavery, M.R.; Acharya, P.; Sivo, S.A.; Xu, L. Number of predictors and multicollinearity: What are their effects on error and bias in regression? Commun. Stat.-Simul. Comput. 2017, 48, 27–38. [Google Scholar] [CrossRef]
- Daoud, J.I. Multicollinearity and Regression Analysis. J. Physics Conf. Ser. 2017, 949, 012009. [Google Scholar] [CrossRef]
- Myers, R.H. Classical and Modern Regression Application, 2nd ed.; Duxbury Press: Belmont, CA, USA, 1990. [Google Scholar]
- Aker, J.C.; Mbiti, I.M. Mobile phones and economic development in Africa. J. Econ. Perspect. 2010, 24, 207–232. [Google Scholar] [CrossRef] [Green Version]
- ITU. Measuring the Information Society 2007, ICT Opportunity Index and World Telecommunication/ICT Indicators; ITU Publications: Geneva, Switzerland, 2007. [Google Scholar]
- Cater, E.A. Tourism in the least developed countries. Ann. Tour. Res. 1987, 14, 202–226. [Google Scholar] [CrossRef]
- OECD & WTO. Aid for Trade at a Glance 2017: Promoting Trade, Inclusiveness and Connectivity for Sustainable Development. Available online: https://0-www-oecd--ilibrary-org.brum.beds.ac.uk/development/aid-for-trade-at-a-glance-2017_aid_glance-2017-en (accessed on 2 May 2021).
- Adams, S. Can foreign direct investment (FDI) help to promote growth in Africa? Afr. J. Bus. Manag. 2009, 3, 178–183. [Google Scholar]
- Ogiela, L.; Ogiela, M.R. Cognitive systems for intelligent business information management in cognitive economy. Int. J. Inf. Manag. 2014, 34, 751–760. [Google Scholar] [CrossRef]
- Akcomak, S.; Weel, B. Social capital, innovation and growth: Evidence from Europe. Eur. Econ. Rev. 2009, 9, 544–567. [Google Scholar] [CrossRef] [Green Version]
- Van Deursen, A.J.; Van Dijk, J.A. Toward a multifaceted model of internet access for understanding digital di-vides: An empirical investigation. Inf. Soc. 2015, 31, 379–391. [Google Scholar] [CrossRef]
- Van Dijk, J.A.; Hacker, K. The Digital Divide as a Complex and Dynamic Phenomenon. Inf. Soc. 2003, 19, 315–326. [Google Scholar] [CrossRef]
- Van Dijk, J.A. The Deepening Divide: Inequality in the Information Society; SAGE Publications Ltd: Sauzend Oaks, CA, USA, 2005. [Google Scholar]
- Shirazi, F. Virtual Bazaar: A Means of Supporting Microtrade in the Least Developed Countries. Law Dev. Rev. 2012, 5, 5. [Google Scholar] [CrossRef]
- Hall, R.; Andriani, P. Managing knowledge associated with innovation. J. Bus. Res. 2003, 56, 145–152. [Google Scholar] [CrossRef]
- Huq, S.; Reid, H.; Konate, M.; Rahman, A.; Sokona, Y.; Crick, F. Mainstreaming adaptation to climate change in least developed countries (LDCs). Clim. Policy 2004, 4, 25–43. [Google Scholar] [CrossRef]
- Popadiuk, S.; Choo, C.W. Innovation and knowledge creation: How are these concepts related? Int. J. Inf. Manag. 2006, 26, 302–312. [Google Scholar] [CrossRef]
- Dünser, M.W.; Baelani, I.; Ganbold, L. A review and analysis of intensive care medicine in the least developed countries. Crit. Care Med. 2006, 34, 1234–1242. [Google Scholar] [CrossRef]
- Batrancea, I.; Rathnaswamy Malar, M.; Batrancea, L.; Nichita, A.; Gaban, L.; Fatacean, G.; Tulai, H.; Bircea, I.; Rus, M.I. A Panel Data Analysis on Sustainable Economic Growth in India, Brazil, and Romania. J. Risk Financ. Manag. 2020, 13, 170. [Google Scholar]
- OECD. ICT Infrastructures and ICT Policies for Innovation. 2017. Available online: https://www.oecd.org/sti/outlook/eoutlook/stipolicyprofiles/interactionsforinnovation/ictinfrastructuresandictpoliciesforinnovation.htm (accessed on 26 October 2017).
- UN. World Economic Situation and Prospects 2018, United Nations Department of Economic and Social Affairs (UN/DESA); United Nations Publication: New York, NY, USA, 2018. [Google Scholar]
- Kleibergen, F.; Paap, R. Generalized reduced rank tests using the singular value decomposition. J. Econ. 2006, 133, 97–126. [Google Scholar] [CrossRef] [Green Version]
- Stock, J.H.; Yogo, M. Testing for weak instruments in linear IV regression. In Identification and Inference for Econometric Models: Essays in Honor of Thomas Rothenberg; Andrews, D.W.K., Stock, J.H., Eds.; Cambridge University Press: Cambridge, UK, 2005; pp. 80–108. [Google Scholar]
- Cragg, J.G.; Donald, G.S. Testing identfiability and specification in instrumental variables models. Econom. Theory 1993, 9, 222–240. [Google Scholar] [CrossRef]
- Baum, C.F.; Schaffer, M.E.; Stillman, S. Ivreg2: Stata Module for Extended Instrumental Variables/2SLS, GMM and AC/HAC, LIML, and k-Class Regression. Boston College Department of Economics, Statistical Software Compo-Nents S425401. 2007. Available online: http://ideas.repec.org/c/boc/bocode/s425401.html (accessed on 12 June 2020).
- Cavanaugh, E.J. Unifying the derivations for the Akaike and corrected Akaike information criteria. Stat. Probab. Lett. 1997, 3, 201–208. [Google Scholar] [CrossRef]
- Pagan, A.R.; Hall, D. Diagnostic tests as residual analysis. Econom. Rev. 1983, 2, 159–218. [Google Scholar] [CrossRef]
Figure 1.
Conceptual framework.

Figure 2.
International Internet bandwidth, by region, 2008–2017.

Figure 3.
Digital divide in LDCs and the world.

Table 1.
The average values of CO2 emission per GDPP (2008–2017).
| (a) High CO2 Emission/GDPP | (b) Low CO2 Emission/GDPP | ||
|---|---|---|---|
| Mongolia | 2.690958 | Switzerland | 0.058854 |
| Trinidad and Tobago | 1.849018 | Sweden | 0.078634 |
| Ukraine | 1.816396 | Denmark | 0.105314 |
| Kazakhstan | 1.779817 | Rwanda | 0.110082 |
| Iran (I. R.) | 1.471903 | Norway | 0.111517 |
| South Africa | 1.314536 | Mali | 0.112198 |
| Belarus | 1.124969 | Uruguay | 0.120387 |
| Russian Federation | 1.093554 | Ireland | 0.121051 |
| Lesotho | 1.025634 | Malta | 0.123077 |
| Bahrain | 0.973398 | Hong Kong, China | 0.126415 |
| India | 0.929597 | France | 0.141763 |
| Oman | 0.926816 | United Kingdom | 0.145570 |
| Saudi Arabia | 0.926701 | Iceland | 0.145655 |
| Egypt | 0.918451 | Sudan | 0.148973 |
| Algeria | 0.900062 | Costa Rica | 0.150810 |
| Vietnam | 0.879712 | Paraguay | 0.151200 |
| Kuwait | 0.856230 | Luxembourg | 0.152446 |
| Bulgaria | 0.841819 | Panama | 0.161824 |
| Benin | 0.811288 | Austria | 0.168985 |
| Qatar | 0.802793 | Zambia | 0.180893 |
| China | 0.796917 | New Zealand | 0.181094 |
| Malaysia | 0.795647 | Finland | 0.181652 |
| Tajikistan | 0.794244 | Italy | 0.186226 |
| Mozambique | 0.784163 | Singapore | 0.188144 |
| Estonia | 0.748789 | Israel | 0.197262 |
Table 2.
OLS and 2SLS/IV results (2008–2017).
| Whole Sample | LDCs | |||
|---|---|---|---|---|
| SI | (1) OLS | (2) 2SLS/IV | (3) OLS | (4) 2SLS/IV |
| co2gdpp | −1.046 ** (−2.82) | −0.917 ** (−2.39) | −2.803 (−1.71) | −1.781 (−1.04) |
| ictnet | 0.604 *** (11.43) | 0.597 *** (11.27) | 0.273 (1.89) | 0.282 (1.91) |
| ictacc | 0.0209 *** (4.86) | 0.0189 *** (4.36) | 0.0510 *** (3.94) | 0.0503 *** (3.89) |
| hightec_exp | 0.0491 *** (3.64) | 0.0441 *** (3.25) | −0.0224 (−0.66) | −0.0248 (−0.74) |
| highedu | −0.606 *** (−6.90) | −0.590 *** (−6.38) | 0.484 (1.80) | 0.495 (1.83) |
| gov | 0.186 *** (14.29) | 0.235 *** (14.31) | 0.237 (1.19) | 0.248 (1.65) |
| cl | 0.214 *** (4.87) | 0.171 *** (3.78) | −0.129 (−1.19) | −0.144 (−1.28) |
| legal | 0.191 *** (3.78) | 0.207 *** (4.09) | −0.131 (−0.90) | −0.131 (−0.91) |
| lnfdi | 0.162 *** (3.22) | 0.147 ** (2.89) | 0.327 (1.14) | 0.447 (1.55) |
| health | 0.383 *** (6.67) | 0.358 *** (6.19) | 0.121 (1.32) | 0.129 (1.38) |
| ecof | 0.128 ** (2.77) | 0.157 *** (3.36) | 0.107 (0.67) | 0.263 (1.57) |
| _cons | −23.31 *** (−4.60) | −21.53 *** (−4.23) | 6.725 (0.44) | −0.570 (−0.04) |
| N | 1270 | 1270 | 230 | 230 |
| R–Square | 0.8184 | 0.8178 | 0.224 | 0.260 |
Notes: OLS (1) and (3) are robust regressions. The table provides variable coefficients along with OLS t–values and 2SLS/IV z–values in parenthesis. ** p < 0.01, *** p < 0.001.
Table 3.
Endogeneity test and IV restrictions.
| Variable | R–sq. | Adjusted R–sq. | Partial R–sq. | F (2,1259) | Prob > F |
|---|---|---|---|---|---|
| gov | 0.8357 | 0.8344 | 0.6749 | 1306.65 | 0.000 |
| Durbin (Score) chi2(1) | 32.1445 (p = 0.000) | ||||
| Wu-Hausman F (1,1259) | 31.6181 (p = 0.000) | ||||
Table 4.
VIF values of variables.
| Variable | VIF | 1/VIF |
|---|---|---|
| health | 4.14 | 0.241546 |
| ecof | 3.75 | 0.266667 |
| cl | 3.65 | 0.273973 |
| highedu | 3.18 | 0.314465 |
| legal | 3.04 | 0.328947 |
| gov | 2.79 | 0.358423 |
| ictnet | 2.26 | 0.442478 |
| ictacc | 2.18 | 0.458716 |
| co2gdpp | 1.18 | 0.847458 |
| lnfdi | 1.14 | 0.877193 |
| hightec_exp | 1.04 | 0.961538 |
| Mean VIF | 2.58 | |
Publisher’s Note: MDPI stays neutral with regard to jurisdictional claims in published maps and institutional affiliations. |
© 2021 by the authors. Licensee MDPI, Basel, Switzerland. This article is an open access article distributed under the terms and conditions of the Creative Commons Attribution (CC BY) license (https://creativecommons.org/licenses/by/4.0/).
Share and Cite
MDPI and ACS Style
Shirazi, F.; Hajli, N. IT-Enabled Sustainable Innovation and the Global Digital Divides. Sustainability 2021, 13, 9711. https://0-doi-org.brum.beds.ac.uk/10.3390/su13179711
AMA Style
Shirazi F, Hajli N. IT-Enabled Sustainable Innovation and the Global Digital Divides. Sustainability. 2021; 13(17):9711. https://0-doi-org.brum.beds.ac.uk/10.3390/su13179711
Chicago/Turabian StyleShirazi, Farid, and Nick Hajli. 2021. "IT-Enabled Sustainable Innovation and the Global Digital Divides" Sustainability 13, no. 17: 9711. https://0-doi-org.brum.beds.ac.uk/10.3390/su13179711
Note that from the first issue of 2016, this journal uses article numbers instead of page numbers. See further details here.