Article

“Everything Somewhere” or “Something Everywhere”: Examining the Implications of Automated Vehicles’ Deployment Strategies

1
UHasselt, Faculty of Engineering Technology, Agoralaan, B-3590 Diepenbeek, Belgium
2
Faculty of Civil Engineering and Geosciences, TUDelft, Stevinweg 1, 2628 CN Delft, The Netherlands
3
UHasselt, Transportation Research Institute (IMOB), Agoralaan, B-3590 Diepenbeek, Belgium
*
Author to whom correspondence should be addressed.
Sustainability 2021, 13(17), 9750; https://0-doi-org.brum.beds.ac.uk/10.3390/su13179750
Submission received: 31 July 2021 / Revised: 24 August 2021 / Accepted: 27 August 2021 / Published: 30 August 2021
(This article belongs to the Collection Emerging Technologies and Sustainable Road Safety)

Abstract

:
“Everything somewhere” or “something everywhere” is the classic dilemma concerning the development and implementation of the future generation of vehicles, i.e., automated vehicles (AVs). Both strategies include diverse policy options that could significantly impact road networks’ planning, design, operation, and utilization. Until now, no significant research has been conducted concerning their implications. In this paper, we aim to examine how ready the current physical infrastructure is by identifying the requirements of each strategy and then applying them in a common type of intersection. The study’s findings demonstrate that AVs’ performance can be affected by policy implementation decisions and adds further weight to the argument of AVs separation or no-separation from no-AVs traffic. Furthermore, the insignificant improvements in traffic performance imply the low readiness of the current road networks in urban areas to accommodate the new technology. This study contributes to determining that research on the readiness of the road infrastructure and the deployment of AVs in urban areas is inevitable. It also identifies that roads’ geometric design can dramatically affect AVs’ operation and the difficulties of implementing dedicated lanes in urban areas due to space availability.

1. Introduction

Arthur C. Clarke quoted back in 1973 that the only way of discovering the limits of the possible is to venture a little way past them into the impossible [1]. Driverless vehicles were science fiction then, but now automated cars are already being seen on public roads. Implementing automated vehicles (AVs) in transport networks brings about a range of possible benefits and potential implications. However, despite the huge investments, they are unlikely to hit the markets shortly without first achieving 100% reliable and safe operation.
“Everything somewhere” and “something everywhere” are the two main strategies adopted to develop and deploy AVs. Both of them incorporate different policy options that could drastically affect the planning and design of road infrastructure. The “everything somewhere” approach implies the implementation of fully automated vehicles only in autonomy-enabled areas, while the second approach encompasses the improvement and enhancement of automated driving systems and the gradual progress to higher levels of automation (Table 1). The first strategy is embraced by the Information and Technology (IT) industry, compared to the “something everywhere” strategy, which the traditional car manufacturers adopt [2].
Level 1 vehicles are already on public roads as most modern passenger cars incorporate adaptive cruise control or lane-keep technologies. Nowadays, cars that qualify for level 2 automation are also available to the public. Various automobile companies have already produced vehicles that simultaneously merged two or more advanced driver assistance systems (ADAS). The “something everywhere” approach captures the advancement to the next level of automation. Level 3 or conditional automation is where the vehicle will be capable of performing various driving tasks independently. However, the human driver must be ready to intervene at any time upon request. At this point, the first issues have been raised concerning the safety risks of driverless cars. The anticipated interaction between the human and the system, the potentially mixed traffic flow, and the infrastructure requirements challenge the road network’s readiness. There is a lack of studies examining the implications of level 3 vehicles on the physical infrastructure in the literature [4]. Because of the aforementioned unsolved matters, different initiatives decided to skip this level and pursue higher levels of AVs. The next level (level 4) is where the “everything somewhere” approach begins [3]. Cars will be ready to travel without human interference in multiple scenarios and geographic areas, although the driver will still have the option to take back the control. The main difference between levels 3 and 4 is that the vehicles can handle critical situations themselves in the latter. Here, a key challenge will be to expand their operation in more road types and beyond certain speed limits. In the last level of automation (i.e., level 5 or full automation), the car will be able to drive in every condition without requiring human attention. The vehicles will not feature steering wheels or pedals, and they will function more like a taxi than conventional cars. The last two levels of automation are the ones that hold the potential to dramatically change the way people travel and also the form of urban areas [5].
Automated vehicles are expected to improve road safety [6] since human error is a major cause of crashes [7]. However, their anticipated benefits are mainly untested and contain a great deal of speculation as new types of crashes may appear from this disruptive paradigm shift. Sharing the roads between different types of vehicles would also create different demands on road infrastructure. The main dilemma that arises from the two strategies related to the physical infrastructure is the separation or no-separation of AVs and no-AVs. Based on the literature, it is possible to identify different variants of these options as completely separated roads, dedicates lanes, separation only in some zones, the human driver to regain control in urban areas or mixed traffic flow, fully automated vehicles only under a specific context (e.g., platooning or shuttles in controlled environments) [3,8]. However, none of the abovementioned approaches seem to consider the readiness of the current infrastructure and the potential implications.
The design and construction of new roads or entire autonomy-enabled areas require significant investments and space. This approach might work outside urban areas or new housing zones but not inside cities where transport infrastructure has already consumed most of the “living space”. Alternative options such as city centers, congestion charging zones, high-occupancy vehicle lanes [9,10] have been identified as potential areas and zones for AVs implementation in highly-populated areas [2]. Despite the positive impacts like extra space provision, the deployment of AVs inside urban environments will increase the interactions with vulnerable road users, growing concerns about safety issues. Hence, particular countermeasures and infrastructure redesign would be required to improve road safety. A road lane width is generally between 2.7 to 3.6 m (9–12 ft.) depending on the type of the roadway [11]. Automated vehicles will allow narrower traffic lanes [9,12] to create more space for pedestrians and cyclists or increase road capacity. However, narrower lanes could not be applied where the traffic is also expected to consist of human-driven vehicles due to safety reasons. The option of mixed traffic flow will also affect other potential benefits of automation as smooth traffic flow, higher speed limits, less pollution, while the increased number of conflicts will further reduce the safety levels.
Until now, most of the ongoing research deals with the microscopic quantification of road traffic performance or safety levels after the deployment of AVs in certain road entities without considering or investigating potential road geometric design requirements of the new technology. For example, in [13], the authors examined the effects of traffic consisting only of AVs on travel speed and travel time. In contrast, in [14], the authors evaluated the impact of different AVs percentages and traffic volumes on the capacity ratio of the examined case study and the average speeds of AVs and human-driven vehicles. Concerning traffic safety performance, existing literature mainly focuses on estimating the number and severity of conflicts after introducing AVs in traffic streams under different market penetration scenarios and the number of preventable accidents/fatalities or the changes in crash/fatality rates by coupling road traffic simulation software with surrogate safety measures (e.g., [15,16]) or using effectiveness scenarios (e.g., [17,18]).
However, available evidence suggests that traffic performance and safety measures are influenced by other elements besides traffic composition and flow conditions, e.g., human-related factors and geometric road characteristics. For instance, in [19], the authors showed that the age and experience of drivers could affect traffic performance in terms of queue lengths and travel times, and traffic safety levels in terms of number and severity of conflicts. In [20], the authors demonstrated that the intersection control type could also affect the traffic performance after the introduction of AVs in traffic streams as it was found that uncontrolled intersections can enhance the anticipated benefits of the new vehicle technology compared to the other types of intersections.
This work focuses on the road infrastructure in urban areas. Until now, no significant research has been conducted concerning its readiness. Today’s roads are designed and built for human drivers, and it is essential to begin planning for the challenges and risks that these technologies would generate.
In this paper, we aim to examine how ready the current physical infrastructure is by:
  • reviewing the different strategies regarding their deployment,
  • applying them in a common type of intersection, and
  • identifying the potential benefits, barriers, and implications of each strategy.
No sufficient knowledge has yet been acquired on how the different AVs’ implementation strategies will impact the geometric design of roads. Currently, research on the configuration requirements is in the early stages, and this study attempts to identify and summarize the available evidence. It should be highlighted that connectivity capabilities were out of the scope of this study. Although connectivity in vehicles is a mature technology, the diffusion of the technology in the market is still not considerable [21], mainly due to the requirements that should be met, especially on road infrastructure [4].
The main contributions of this study are summarized as follows: Firstly, it provides a comprehensive overview of the relationships between the different deployment strategies of AVs, their road design, infrastructure and operation requirements, and their traffic performance implications. To the best of our knowledge, no other study has examined and compared the various implementation approaches nor considered their demands concerning infrastructure assets. Secondly, it examines the readiness of the current road infrastructure to accommodate AVs and identifies the influencing factors that need to be considered for the successful implementation of the new technology on public roads. Thirdly, it strives to address the identified gaps by providing recommendations to ease the transition to AVs.
The organization of the remaining article is structured as follows: Section 2 presents the materials and methods applied to conduct the present study. The results of each methodological step are analyzed in Section 3 and discussed in Section 4. Finally, Section 5 concludes the work and presents the direction of future research.

2. Materials and Methods

The primary objective of this research was to develop an evidence-based framework to explore the feasibility of each deployment strategy and evaluate the readiness of the current infrastructure for the implementation of AVs. The methodology involves the following tasks: (i) review of the road design requirements for each strategy, (ii) identification of specific parameters that allow the simulation of AVs’ behavior and determination of their values, (iii) development of the respective traffic models, and (iv) application of the two strategies in a real-world case study pertaining to various plausible scenarios.

2.1. Road Infrastructure Requirements for Automated Vehicles

The first step of the methodological approach was to identify and summarize the available evidence on geometric road design implications of AVs. A comprehensive and systematic literature search was conducted with the primary purpose of providing a broad descriptive overview of the topic by accumulating the existing literature and mapping its results. The following bibliographic databases were used to identify potential sources of evidence: Science Direct, Transportation Research International Documentation, and Web of Science. In order to achieve a comprehensive and precise search, a two-step strategy was adopted. More specifically, after identifying peer-reviewed articles (i.e., step 1), two more information sources were examined (i.e., step 2): (i) grey literature and (ii) documents suggested by the authors. Keywords defining the research topic’s content were linked using Boolean operators and were applied to provide results as shown below:
  • road AND (infrastructure OR geometry OR design) AND (“automated vehicle*” OR “autonomous vehicle*” OR “automated car*” OR “autonomous car*” OR “driver-less vehicle*” OR “self-driving vehicle*” OR “driver-less car*” OR “self-driving car*” OR “driverless vehicle*” OR “driverless car*” OR “automated driving” OR “autonomous driving”)
In the context of this work, reviewed studies were required to report potential geometric road design implications of AVs. Only documents published in English up to and including 2020 were considered.

2.2. Modelling of Automated Vehicles’ Driving Behavior

The adopted methodology’s next step necessitated identifying and selecting an appropriate set of driver behavior parameters to model AVs. The recognition and determination were based on a review of previous relevant research studies and recommendations from the software developer. This work presumed that AVs in the “something everywhere” strategy would operate on existing transport networks in mixed-flow traffic conditions with lower-automation capabilities, while on the “everything somewhere” strategy, they will function as fully automated only on designated infrastructure. Furthermore, their driving behavior would be rule-based without variations.

2.3. Traffic Model Development

Traffic modeling and simulation can help us explore AVs’ implications on transport networks and transport infrastructure [22,23,24]. This study utilized the microscopic multi-modal traffic flow simulation software package PTV Vissim, developed by PTV AG to model complex road geometries [25]. In PTV Vissim, different sets of parameters define vehicles’ longitudinal and lateral behavior and their responses toward road infrastructure. A common signalized intersection was designed in PTV Vissim based on real-world cases in Belgium to examine the readiness of the current infrastructure. The study area is a cross at-grade intersection controlled by traffic lights where the speed limit is 50 km/h. The major branches each have two traffic lanes plus a dedicated left-turn lane, a channelized right-turn lane, and a median. The minor street has one traffic lane in each direction plus dedicated left-turn lanes. Lane width on the main street is 3.00 m (i.e., 9.84 feet), whereas, on the minor street, it is 2.50 m (i.e., 8.20 feet).
The simulations intend to examine the readiness of the infrastructure and the feasibility of the different approaches for AV deployment. Although we try to model the road environment as close as possible to the actual conditions in this work, the models were not calibrated or validated since they are not site-specific or time-specific [26]. For each simulation run, a 15-min “warm-up” period before the analysis is foreseen to fill up the system (vehicles do not spend more than 10 min crossing the intersection). The final results of each scenario are the average values of 20 model runs with different random seeds to obtain greater variability in the results [27]. The total number of simulations performed was 100 (5 scenarios × 20 simulations).

2.4. Scenarios—Implementation Strategies

Table 2 contains the modeled scenarios that reflect the different implementation strategies for AVs. Two models in PTV Vissim were developed:
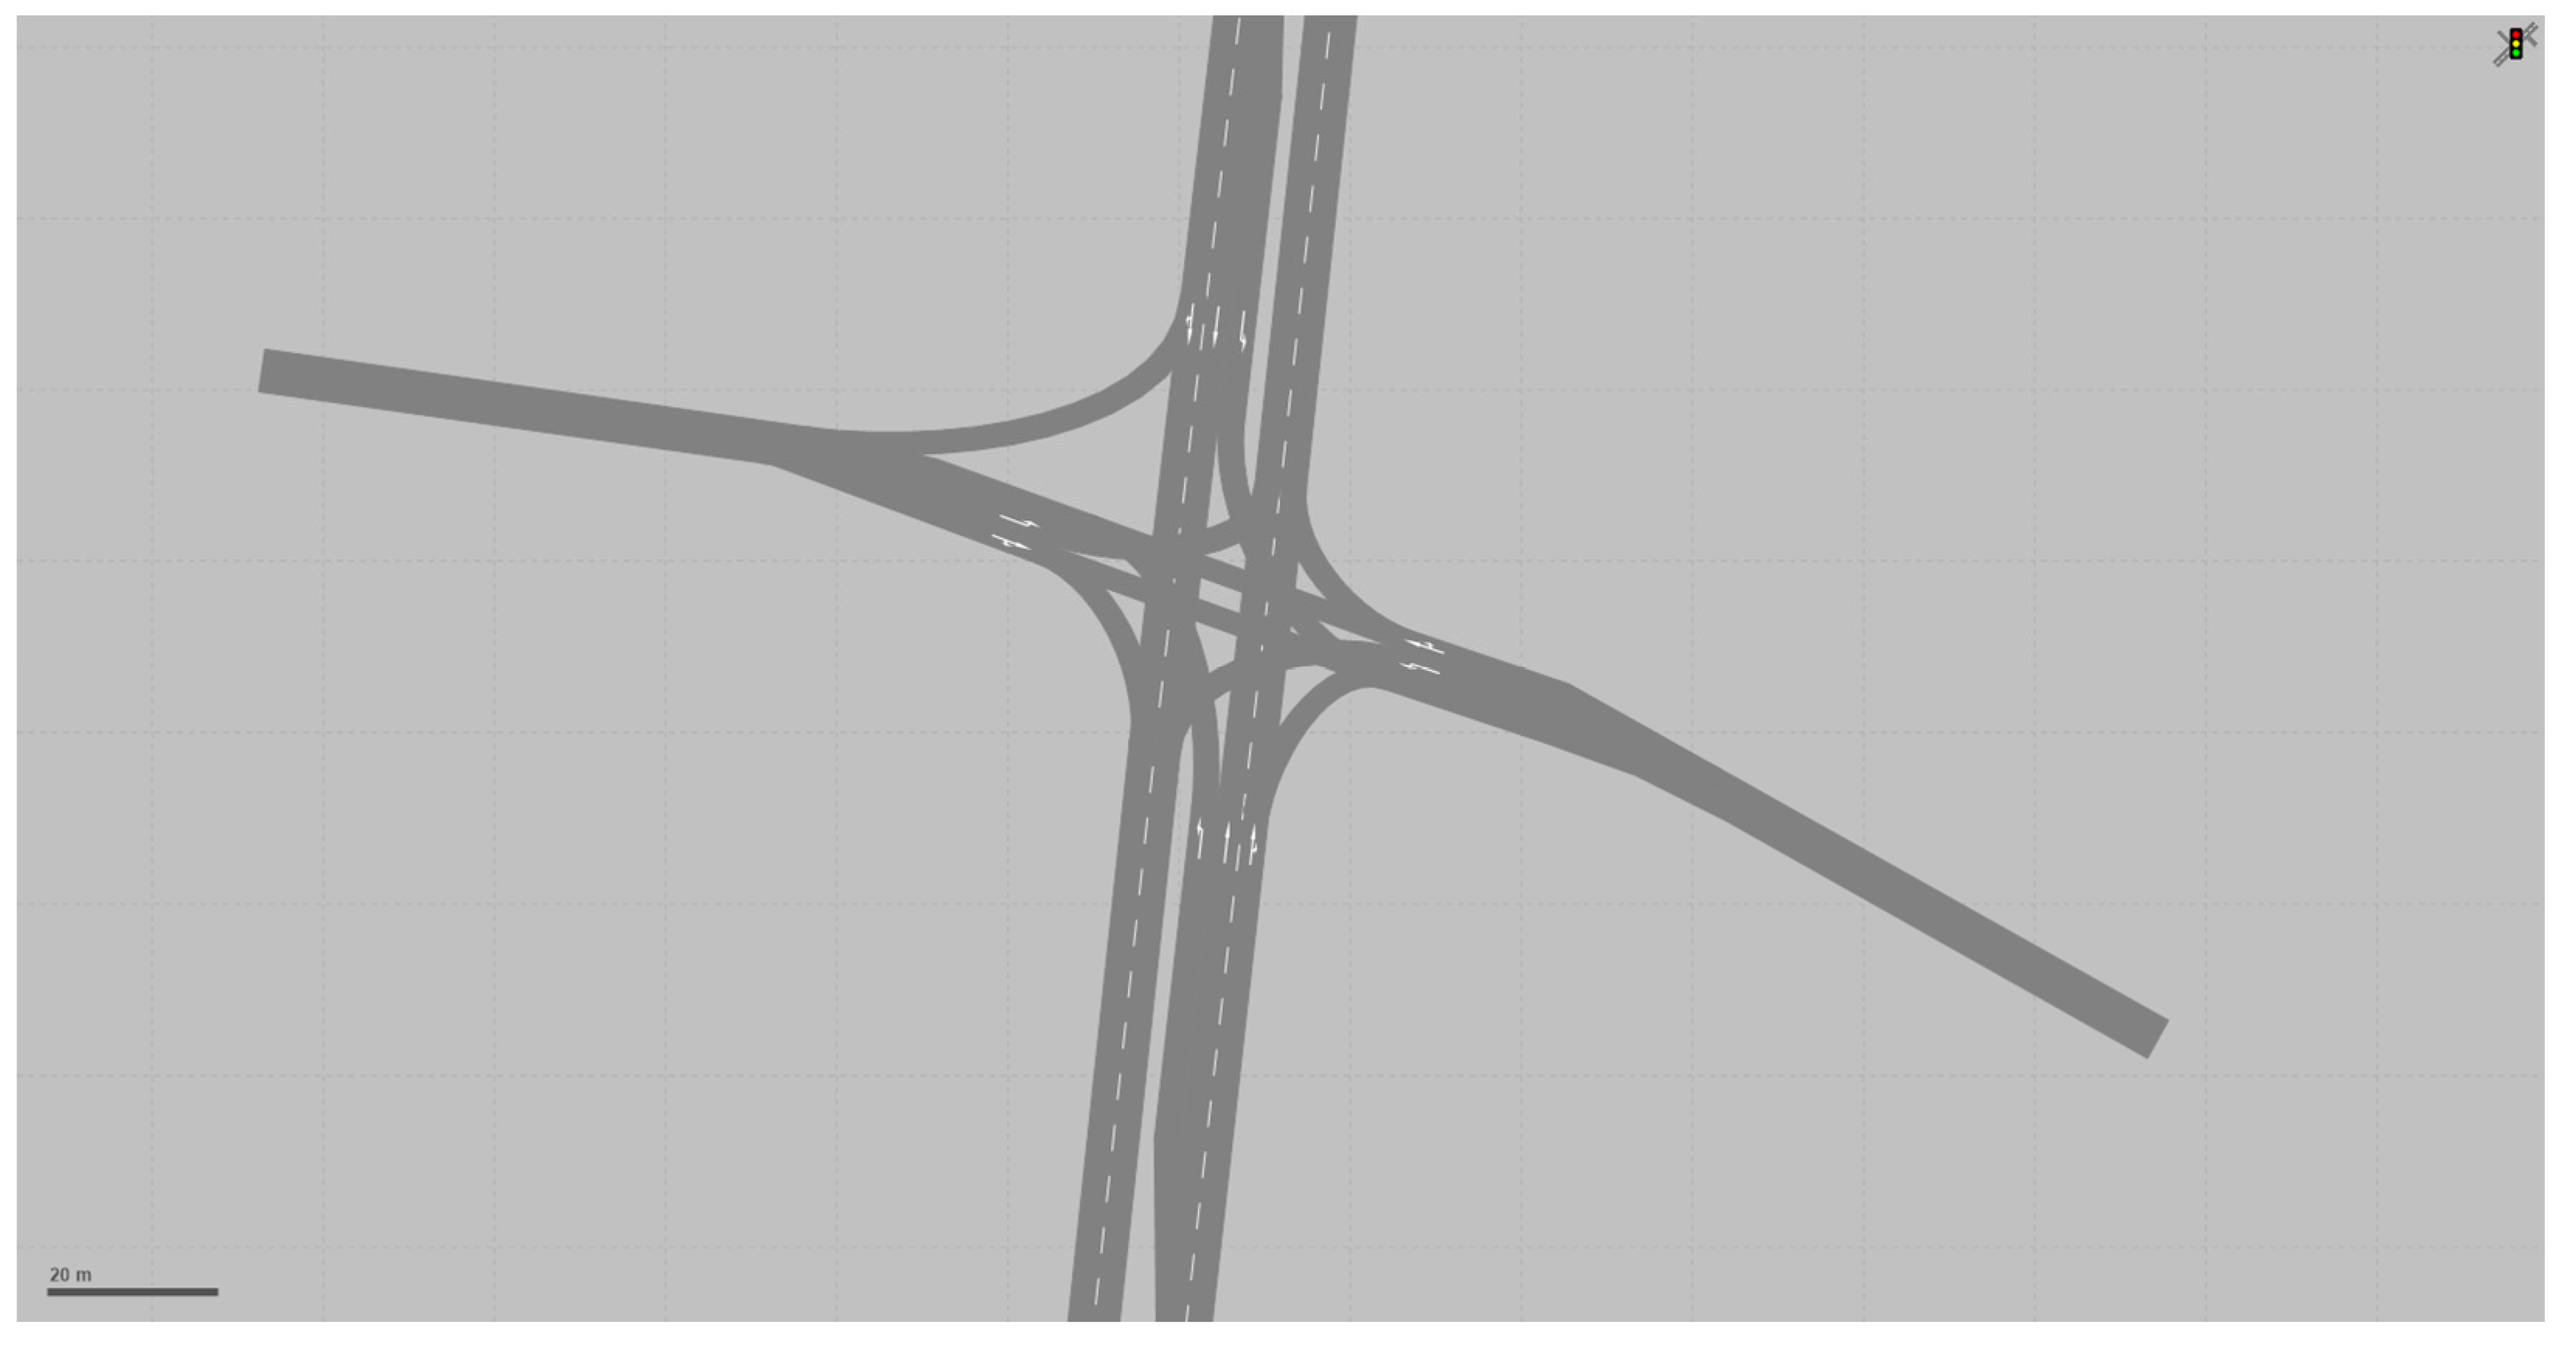
  • The existing intersection to examine the “something everywhere” strategy by exploring the interactions of AVs and no-AVs in common traffic conditions in Belgium, i.e., a do-nothing scenario with no requirements or public investment where AVs and no-AVs co-exist;
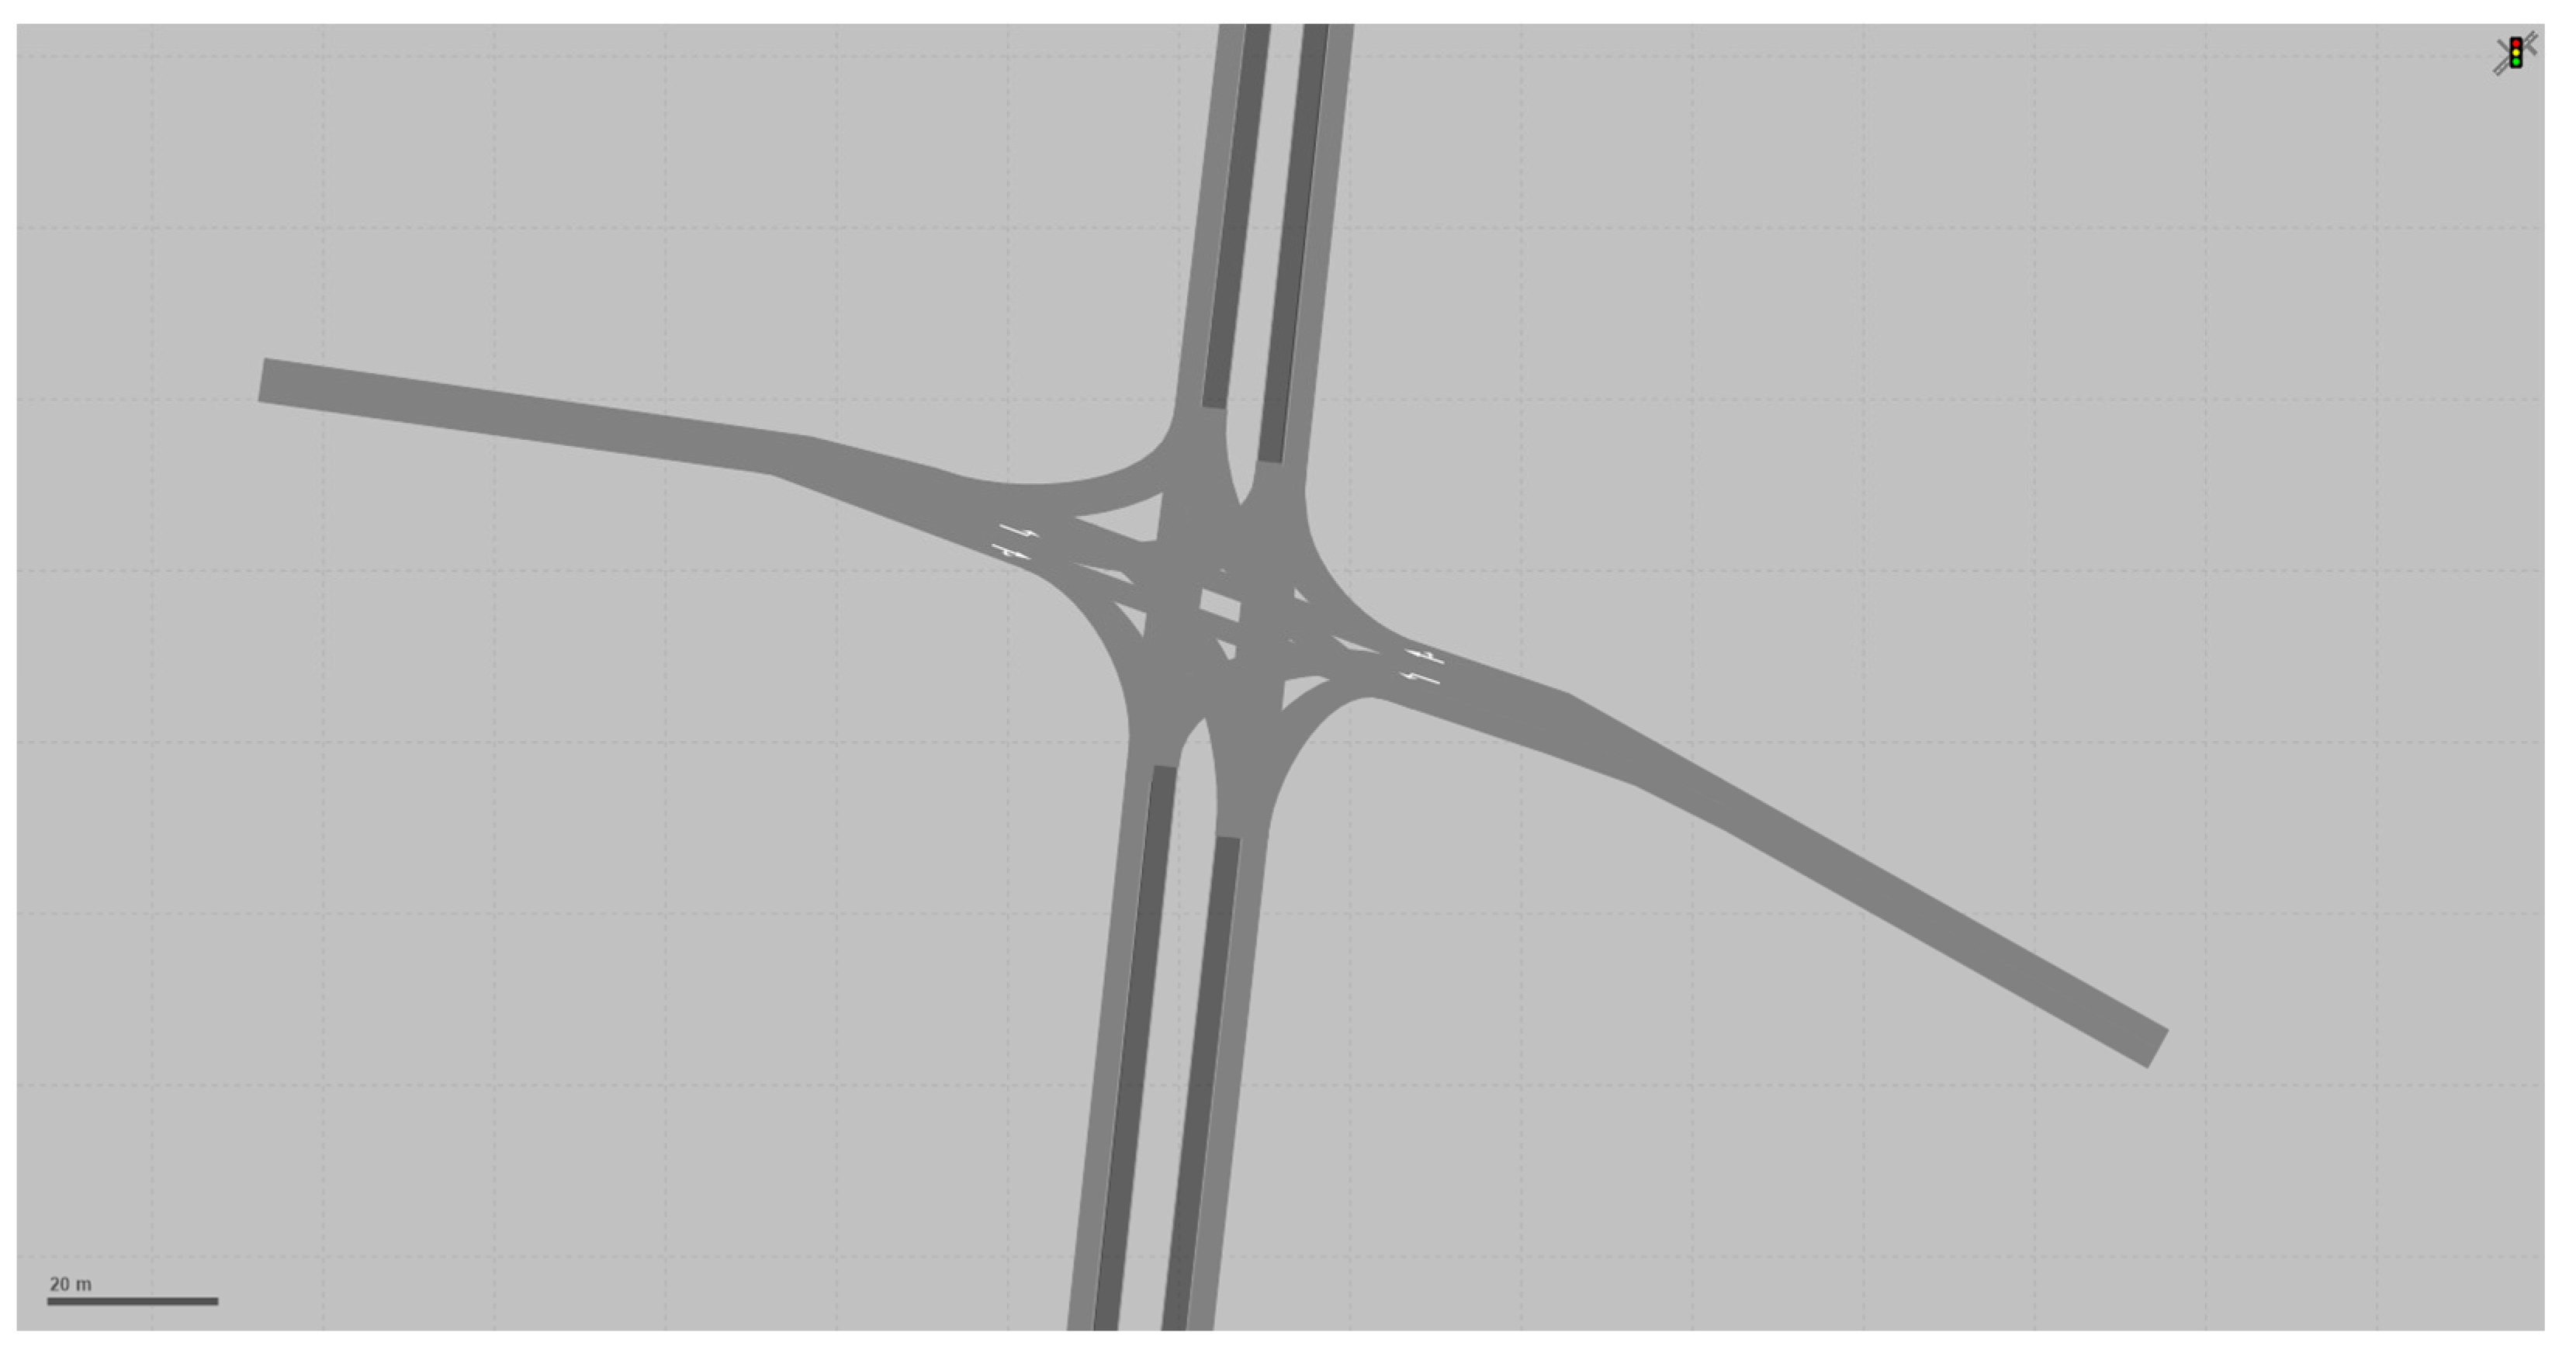
  • A modified intersection based on the literature review findings that could be considered appropriate for the “everything somewhere” strategy, i.e., a basic-adjustment scenario (short-term implementation scenario with no-AVs still available to the public), where minimum requirements are applied to ensure traffic safety, with minimum/no public investment.
Two different levels of AV penetration (i.e., 25% and 75%) were considered, trying to reflect diverse periods of their deployment (i.e., early period and late period). A high traffic flow scenario (peak hour) representing usual traffic conditions in urban areas (i.e., traffic congestion, delays, longer travel time) was considered for every simulation to study the interactions between vehicles and infrastructure in the most critical possible condition.

3. Results

3.1. Road Infrastructure Requirements for AVs

Since the implementation of AVs is still in its first steps (i.e., mainly under development or in test mode) and extensive actual data is not yet available, road infrastructure requirements for AVs were identified based on a multi-round literature scan of the media, technical reports, academic papers, and related projects. Table 3 reports the available evidence. It should be highlighted that the identified requirements are indications and not evidence-based and they mostly refer to higher levels of AVs operating under an “everything somewhere” scenario, i.e., segregated infrastructure for AVs.
In mixed traffic conditions, i.e., the “something everywhere” scenario, the co-existence of AVs and no-AVs will most probably not allow significant modifications on the current geometric road design standards. For instance, a narrow lane may be sufficient for AVs, although the current lane width recommendations should be maintained for human drivers. In addition, lanes should be sufficiently wide to allow the passage of intervention vehicles. From the literature, it was also possible to identify that new road infrastructure elements that could initially support the “everything somewhere” approach are the addition of new road lanes dedicated for AVs or the modification of existing lanes only for AVs.

3.2. Modeling AV’s Driving Behavior

To evaluate the benefits of each implementation strategy, the calibration of PTV Vissim’s driving behavior models was necessary to better capture AVs’ driving performance. However, the new technology is mostly under development or in test mode. Thus, limited empirical data is publicly available. At the moment, it is expected that AVs will operate with smaller headways, shorter reaction times, and higher speeds compared to no-AVs. In this study, an appropriate set of driver behavior parameters and their values was determined from a review of previous initiatives as well as recommendations from the software developer.
In both the examined deployment approaches, the driving performance characteristics of AVs were regarded as more enhanced than no-AVs. However, in the “something everywhere” strategy, where AVs would have to share the same road infrastructure with human drivers, their driving behavior was considered as “cautious”, e.g., shorter headways than no-AVs, compared to the “everything somewhere”, where it was considered as “aggressive”, e.g., even shorter headways than the previous approach. Table 4 describes the vehicle capabilities of AVs that were added for each strategy [3], while Table 5 presents the specific parameters adjusted to capture these behaviors. The assigned values were obtained from similar and well-documented studies [26,36,37] as well as the recommendations that were provided by PTV AG on how to model AVs in PTV Vissim considering different types of driving behaviors [38] and serve the purposes of this work (i.e., to represent the changes in vehicles’ behavior). It should be highlighted that for the simulation of AVs in both cases, the Wiedemann 99 car-following model was calibrated as it contains more parameters and better allows the modeling of AVs, while in the case of no-AVs, the Wiedemann 74 car-following model was adopted as it is suggested for urban road environments [38].
More analytically, in [38], the software developer provides general guidelines concerning the calibration of the PTV Vissim parameters for different driving behaviors of AVs, i.e., cautious, normal, all-knowing. It can be concluded that the values of the respective parameters are equal or more close to the default values in the case of cautious and normal driving behavior and significantly varying in the case of all-knowing driving behavior. This study, as it was previously explained, assumes that AVs will adopt a more conservative approach, i.e., cautious/normal driving behavior when they will have to share the roads with human-driven vehicles compared to a more aggressive approach, i.e., all-knowing driving behavior when they will operate on dedicated infrastructure. Having that in mind, studies aiming to evaluate the impact of different driving behavior modes of AVs were consulted [26,36,37]. After reviewing the applied values, this study adopted most of the values that are consistent with the PTV AG recommendations and adjusted specific values to provide a noticeable change in AVs driving behavior in the “something everywhere” strategy compared to human-driven vehicles and a more drastic change in the “everything somewhere” strategy. For instance, the standstill distance was reduced from 1.5 m (default value) for human-driven vehicles to 1 m for AVs in the “something everywhere” strategy and to 0.5 m for AVs in the “everything somewhere” strategy. The last column of Table 5 explains how the value of each listed parameter was determined. It should be noted that only the recommendations on driving behavior parameters that can be modified within the PTV Vissim program were considered for this analysis since this study strives to evaluate the operational effects of AVs based on different policy decisions.

3.3. Scenarios—Implementation Strategies

For the first implementation strategy of AVs, i.e., “something everywhere”, no modification on the existing road network was considered as the road infrastructure should also be suitable for human drivers (Figure 1). For the second implementation strategy, i.e., “everything somewhere”, a modified intersection based on the respective literature review findings was designed. More specifically, an existing lane was changed to a dedicated lane for AVs (dark grey-colored) on the major street to define the potential implications of the “everything somewhere” strategy in urban areas where not enough space is available for adding new lanes (Figure 2). Since this work also examines the readiness of the current road infrastructure, no additional investments or other special operation priorities for AVs were considered.
Another important parameter considered in the intersection redesign concerning the second implementation strategy, i.e., “everything somewhere”, was not increasing the risk to other road users from a more complex road environment and not changing how a traffic network works. For these reasons, the dedicated left-turn lanes at the major street were removed to reduce the number of potential conflict points of AVs and no-AVs. The intersection control type remained similar to the past in order not to increase the risk for vulnerable road users, although different signal groups were assigned for AVs and no-AVs movements, and the intergreen times were recalculated to assure the safe operation of the intersection. More specifically, the total traffic signal timing for the main streets remained the same, but it was equally split between the AVs and no-AVs movements. The vehicles retained their no-AVs capabilities when they entered the minor street and vice versa.

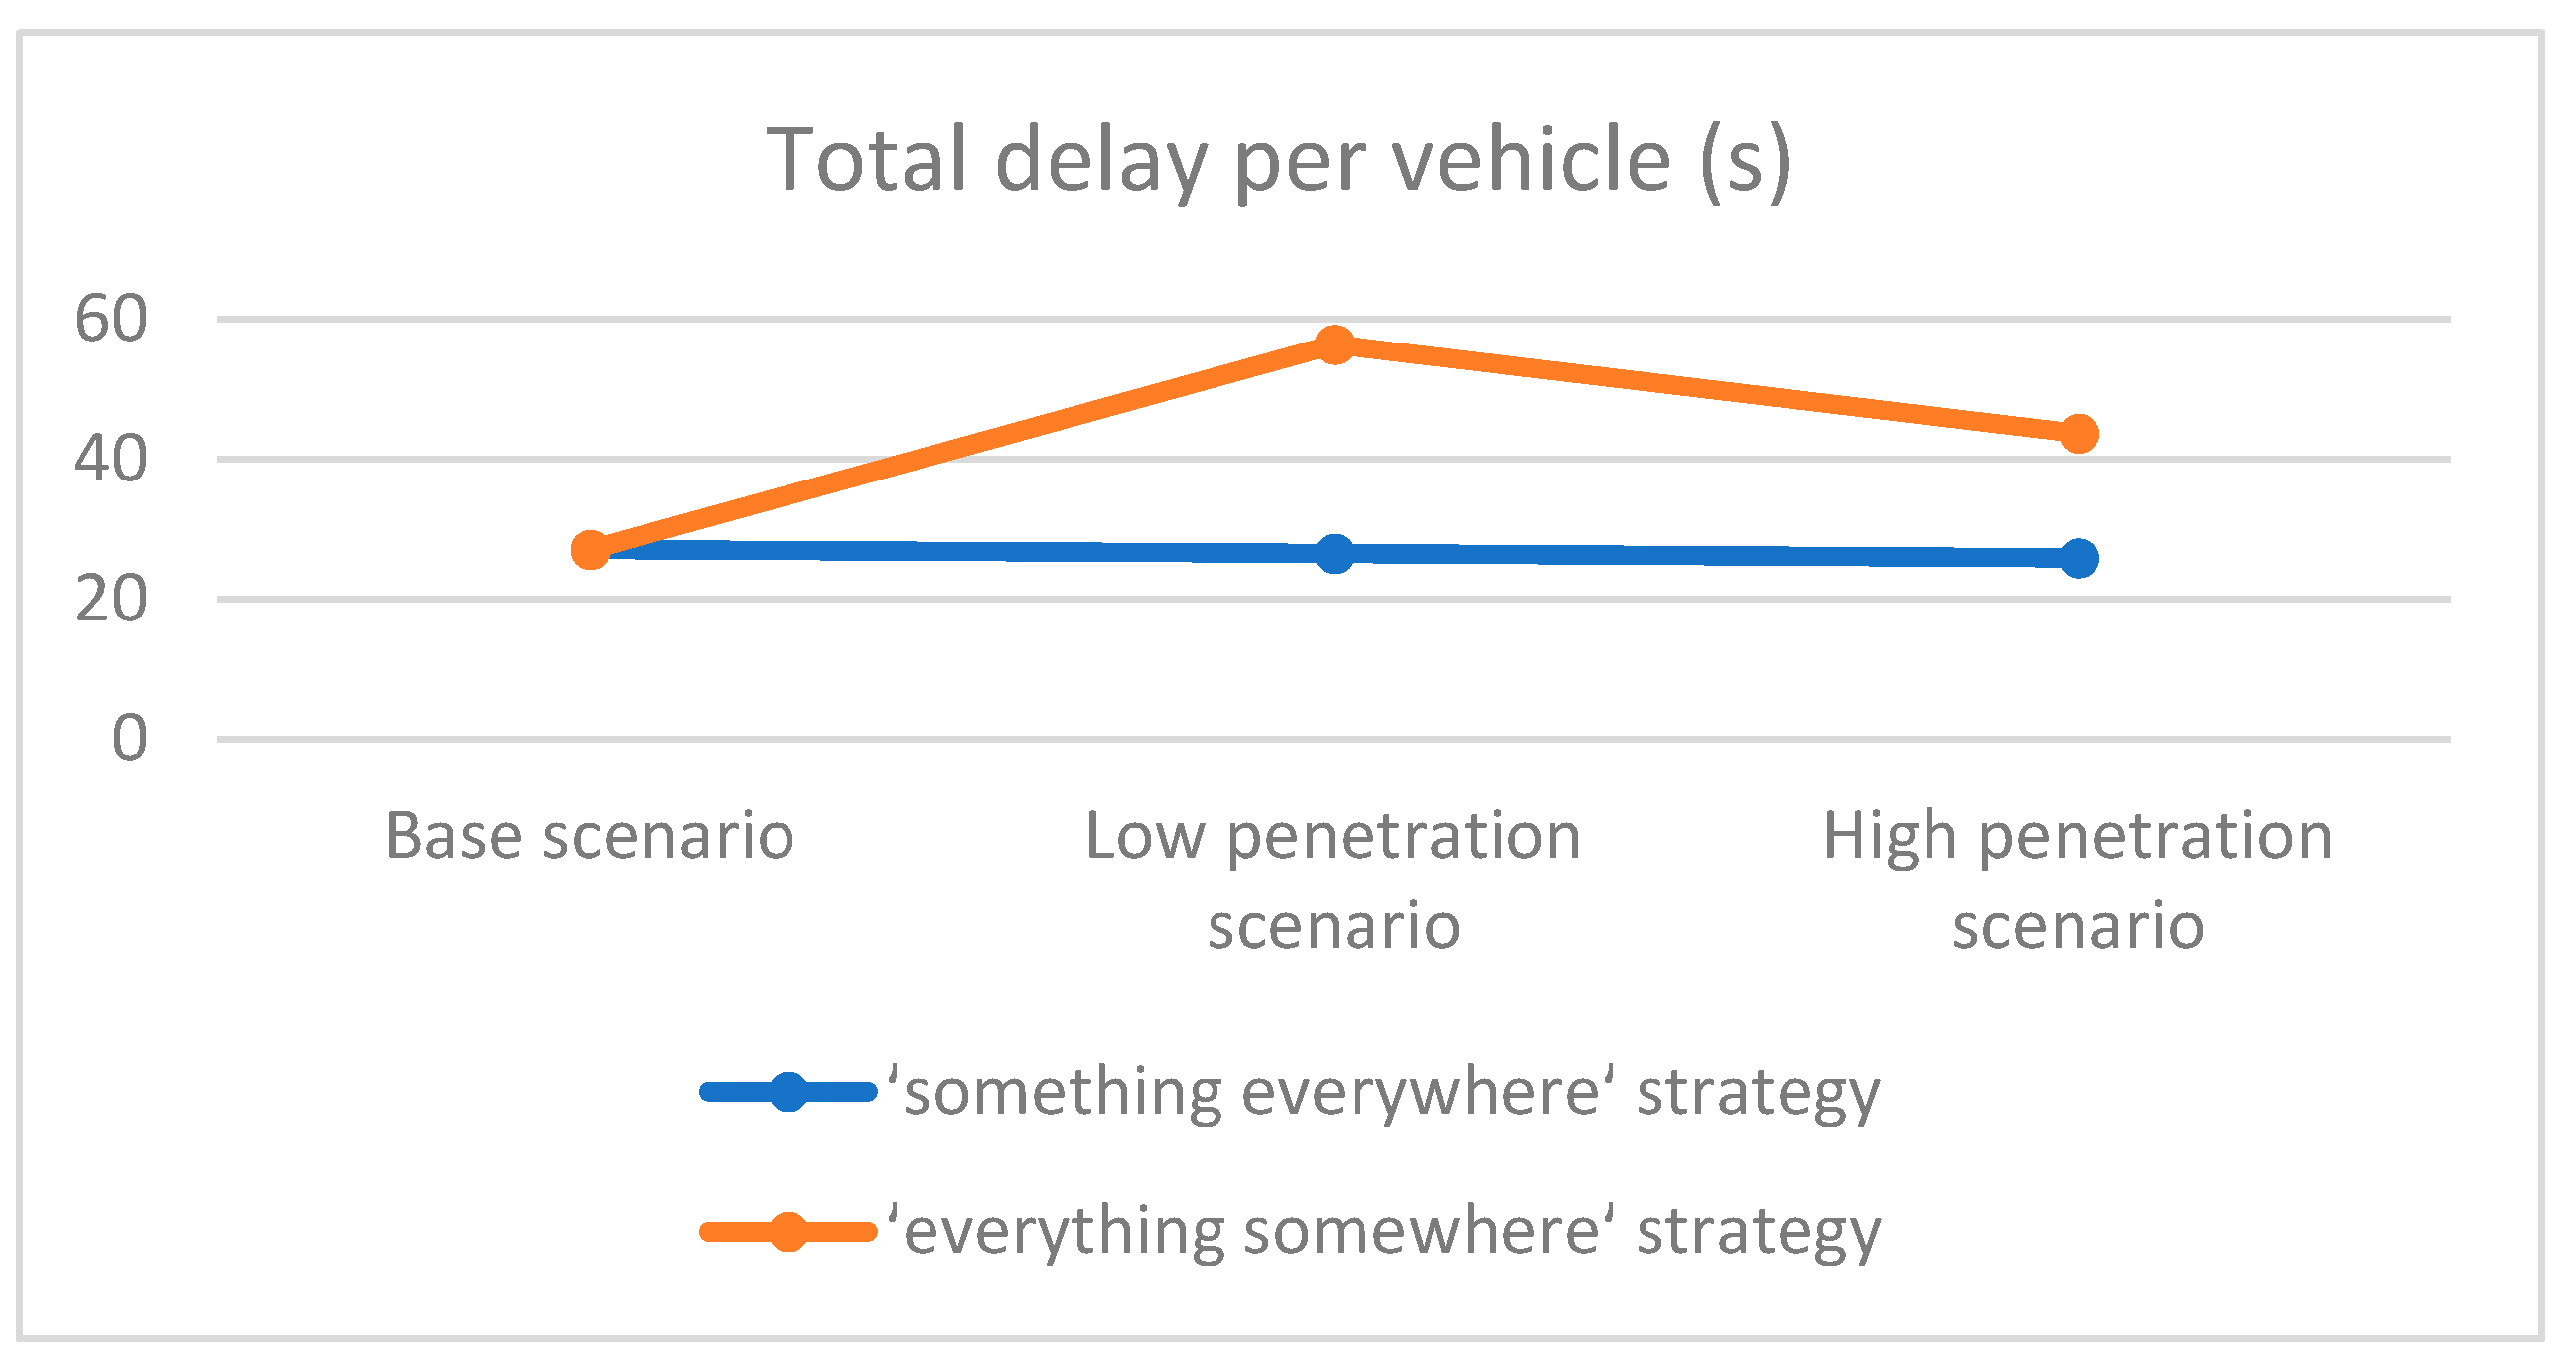
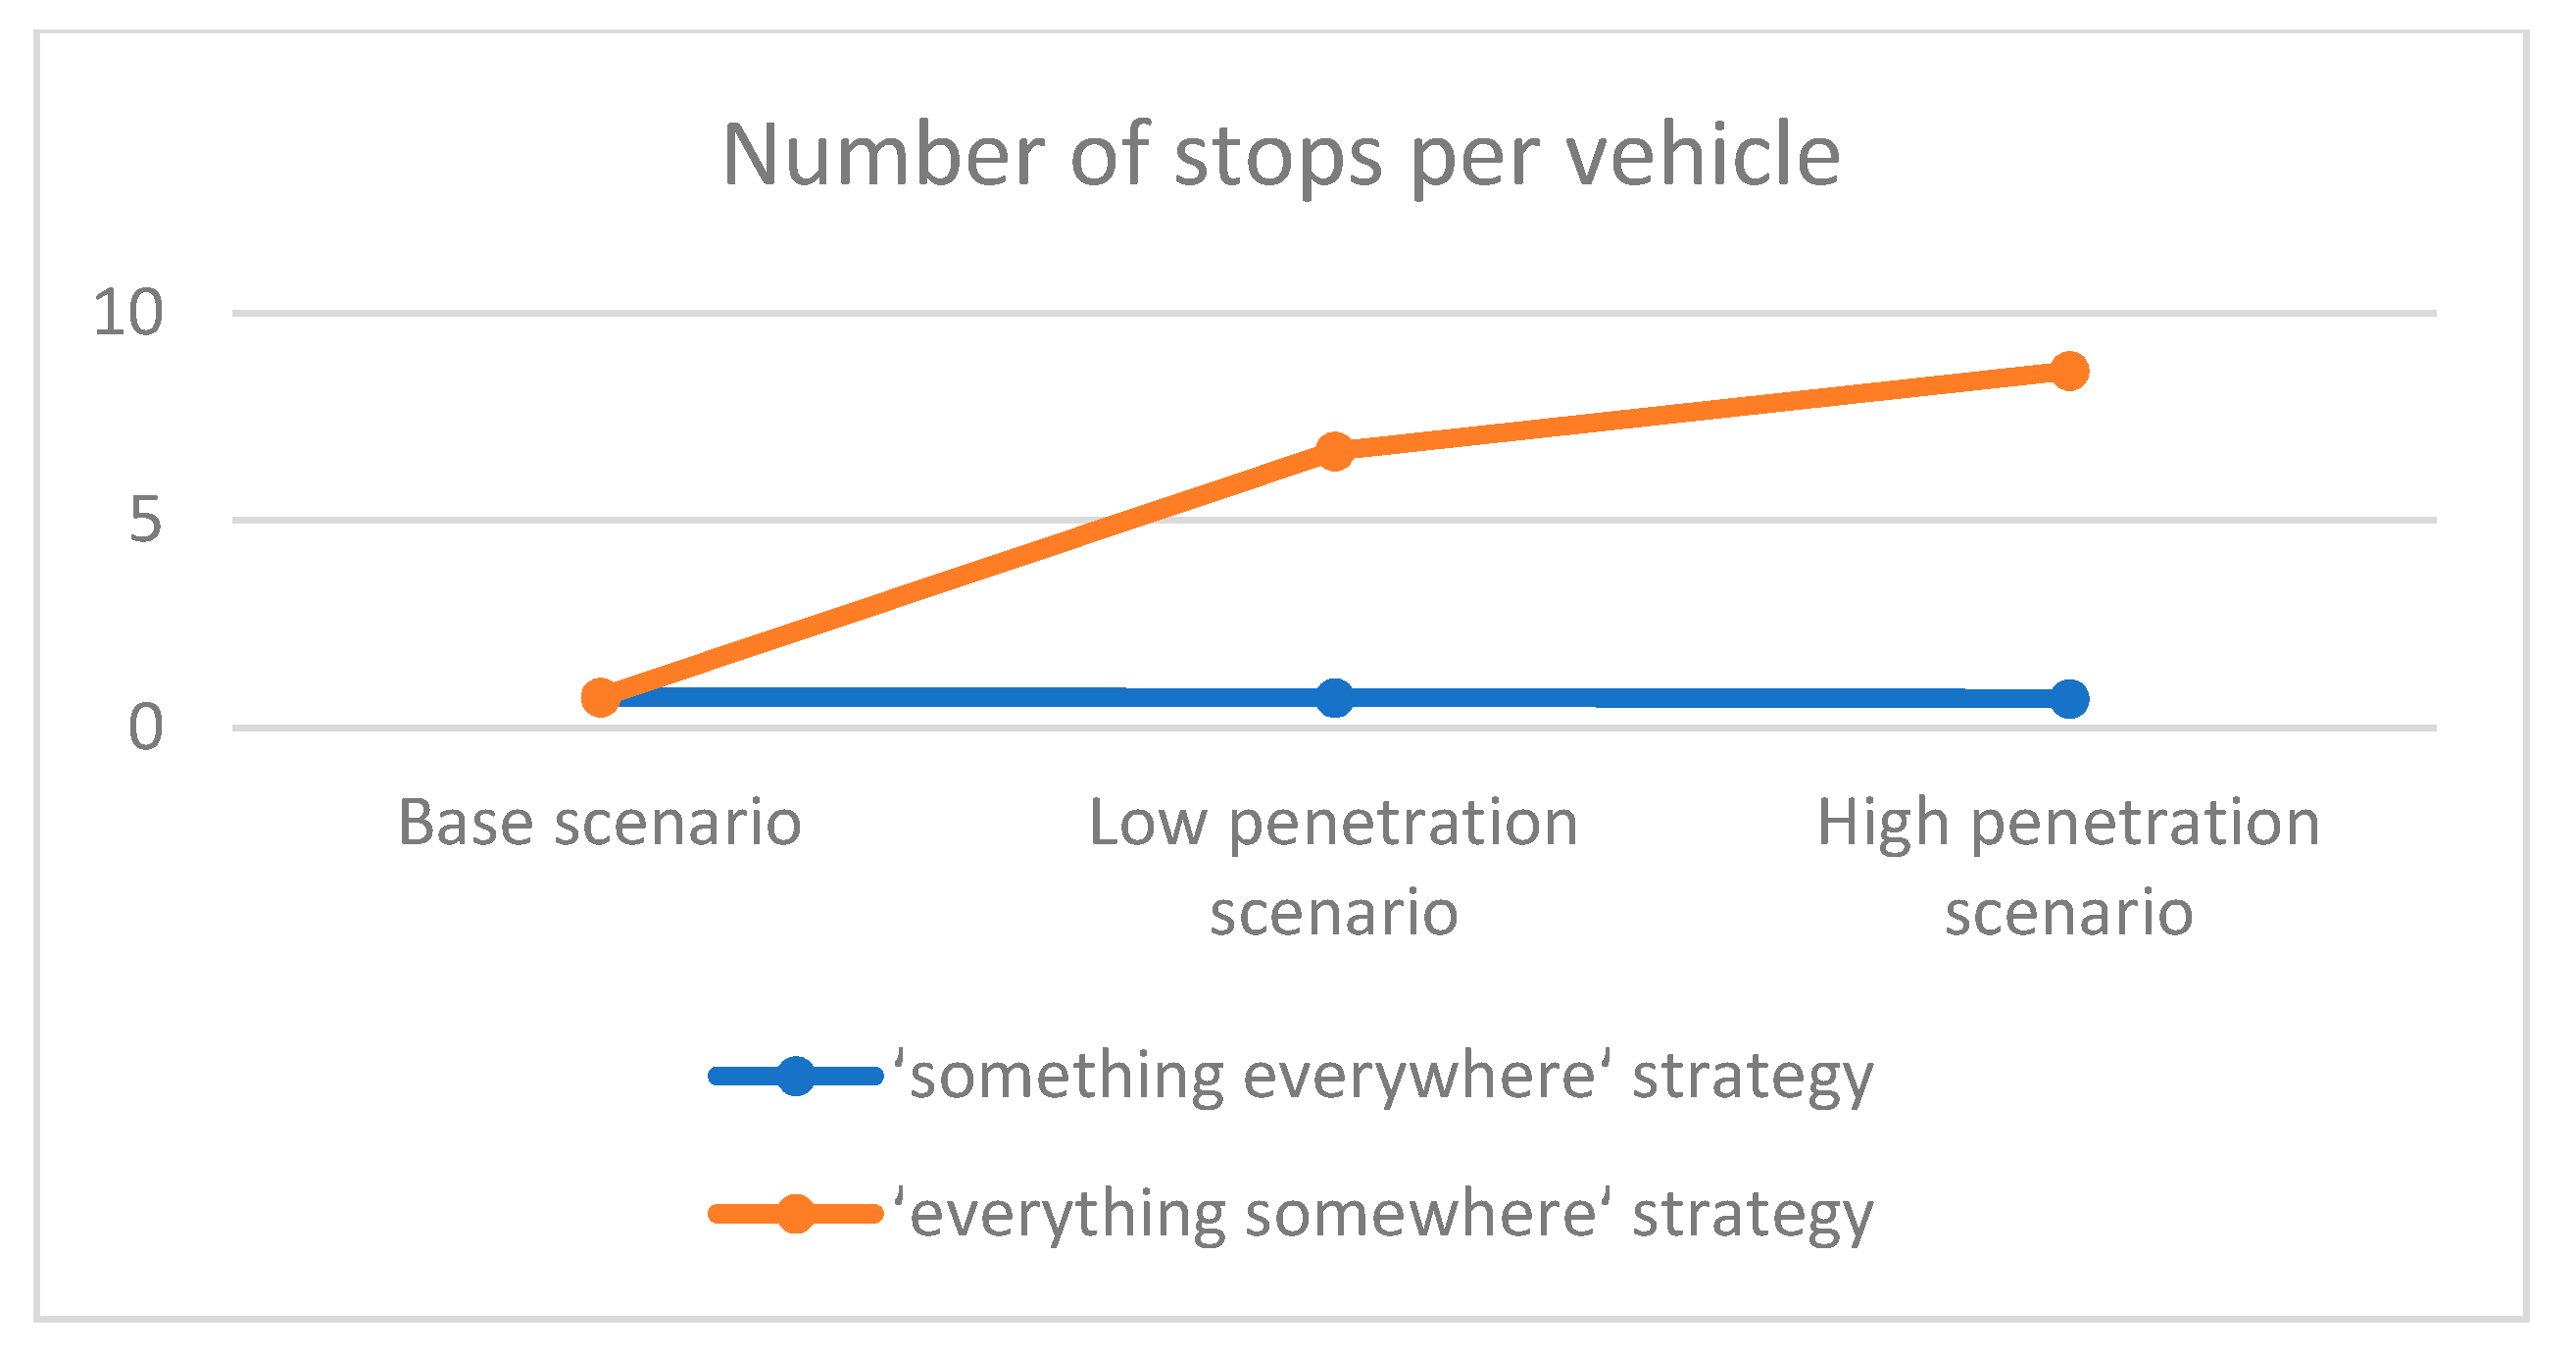
3.4. Traffic Micro-Simulation Results

Table 6 presents an overview of the findings of each scenario. The results focus on the intersection performance with observed values:
  • Total delay per vehicle;
  • Stop delay per vehicle;
  • Average queue length; and
  • Level of service (LOS).
Total delay per vehicle is the average total delay per vehicle in seconds. It is measured as the difference in the actual travel time and the theoretical travel time, while stop delay per vehicle is the average standstill time per vehicle in seconds, not including passenger stop times at public transportation stops or parking lots [39]. The LOS is used as a qualitative measure to analyze the intersection by assigning quality levels of traffic (A = free flow, B = stable flow, C = restricted flow, D = high-density flow, E = unstable flow, F = forced flow) based on performance measures like vehicle speed, density, congestion, etc. [40]. Heavy vehicles were not considered in this study. This study intends to compare the relative changes and differences among different scenarios and not the absolute values that should be calibrated and coupled with the actual measures in reality.
The results show that all simulations correspond to a high flow scenario with congestion and delays. Compared to the base scenario, the delay decreased (Figure 3) by introducing AVs in the road network in the mixed traffic flow scenario. However, the reductions are not statistically significant, indicating that AVs could not solve congestion problems in urban areas even in a high penetration rate scenario. The implementation of exclusive lanes worsens the situation since the total delay, and the number of stops per vehicle increased dramatically due to the higher number of movements that should be controlled (Figure 3 and Figure 4).
Table 7 and Table 8 show the traffic performance results for each direction of the main street. The direction with the channelized right-turn presented better results in terms of total delay, stop delay, number of stops per vehicle, and queue length in every scenario. However, the two-lane street presented a higher reduction in total delay per vehicle (Figure 5). Although the differences are insignificant, traditional road design concepts may not serve the new paradigm shift in traffic very well.

4. Discussion

The study’s findings highlight AVs’ risk as another technology that never reached its maturity and adds further weight to the argument of segregated or not segregated infrastructure for AVs. The insignificant changes in traffic performance (i.e., no improvements) imply the low readiness of road networks in urban areas to deploy AVs. The redesign of roads based on AVs requirements, e.g., tighter corner radii, reduced stopping sight distance, narrower lane width, would result in a more demanding road environment for human drivers. The risk of road crashes would be higher as a consequence. Furthermore, the potential removal of traffic signals would probably further aggravate the traffic conditions. It is indisputable that current road design guidelines should be adopted as long as AVs and no-AVs are expected to share the same roads.
On the other hand, the transformation of the existing urban road environment to create infrastructure for AVs provides limited possibilities, and it can turn out costly and not feasible. The traffic-microsimulation results suggested that potential segregation of AVs and no-AVs may require additional infrastructure to enhance their traffic performance, e.g., increased need for underpasses and bridges [8]. Moreover, the use of dedicated lanes in the context of the “everything somewhere” approach, even if it appears as a prominent solution, there is a lack of knowledge whether this is the optimal approach for congested urban areas. The results of the simulations indicated that the complexity of road networks in cities could reduce AVs’ anticipated benefits (e.g., fuel savings and traffic performance). Very little research has been done on infrastructure design and requirements for dedicated lanes (e.g., lane width, the transition zones between automated and manual driving, optimization of traffic signals operation). Moreover, operational issues (e.g., prevent conventional vehicles from using these lanes, ensure that the appropriate driving mode is active or how the transition (automatically or manually) would be made) need further investigation [30]. Further research is required to explore suitable road design applications for their deployment and study their impact on road safety and traffic efficiency
There is also a clear knowledge gap on the impact of AVs on safety and their interactions with vulnerable road users in urban areas. In addition, new types of crashes may emerge after the implementation of AVs (e.g., system failure, sensors malfunction, late response on responsibility transferred from the vehicle to the driver). Safety is a critical aspect for transportation engineers, and safety evaluation studies of AVs are vital before they become confident that these technologies will result in improvements. The deployment of AVs on public roads will also raise some operational concerns resulting from infrastructure conditions (e.g., pavement deterioration or not well-maintained road signs and markings). Further research is needed on how to address such issues and achieve standardization and harmonization among different countries.

5. Conclusions

In this study, we did not attempt to go deep into details of the benefits and implications of AVs but to examine if the road infrastructure is ready for them. It is evident from the literature review that for each strategy, different requirements are needed. In general, the results of this study highlight the need for advanced design and planning of infrastructure to ensure that AVs will reach their full potential. More specifically, the segregation of AVs and no-AVs would create a more demanding scenario in terms of road infrastructure requirements compared to a mixed traffic flow scenario in urban areas. In the latter case, maintaining the existing infrastructure under specific standards is the main requirement to proceed with the “something everywhere” strategy.
The analysis of the results also demonstrates that the “everything somewhere” strategy depends more on the road infrastructure’s readiness than the “something everywhere” approach that depends more on the market penetration of AVs. The road infrastructure should guarantee the smooth and safe operation of AVs. Otherwise, despite the considerable progress in autonomous vehicle technology, a lack of evidence to support solid decisions could result in a failed technology.
This study contributes to determining the need for research on the difficult questions related to the readiness of the road infrastructure and the feasibility of each strategy in urban areas. It identifies that roads’ geometric design can dramatically affect AVs’ expected benefits and the difficulties of implementing dedicated lanes for AVs in urban networks. The findings also guide decision-makers and transport authorities when considering future vehicle fleet mixes and road infrastructure design and planning. The proposed evidence-based framework can be straightforwardly used to examine different road design configurations as well as different market penetration scenarios of AVs.
Although the presented findings provide a useful starting point in understanding the scale of implications for each deployment strategy of AVs and practical suggestions concerning their application, the limitations of this study should be taken into consideration. As real-world AVs data is not widely accessible if available, the driving behavior of AVs within a real-world road network is still unknown, and their modeling is based on a series of assumptions that may limit the reliability of the outcomes. Nevertheless, this study follows previous best practices and aims to capture the enhanced driving performance of AVs compared to human-driven vehicles. Additionally, this study only considers a small network element and focuses on the urban road environment due to its challenging nature. It is expected that the deployment of AVs in highway environments would decrease the potential constraints and the infrastructure demands.
To fill the missing gaps identified and outlined in this study, future work could involve the development of an integrated safety evaluation using surrogate safety measures by coupling the microsimulation model PTV Vissim and SSAM (Surrogate Safety Assessment Model) [41] to advance the understanding of AVs’ implication on road design and safety. The SSAM tool, which was released by the Federal Highway Administration (FHWA), will provide us with surrogate safety measures, as well as the classification of conflict type and help us identify the most critical road geometry parameters. The SSAM automates traffic conflict analysis by processing vehicle trajectories from a microscopic traffic model (e.g., PTV Vissim), records surrogate measures of road safety, and determines whether an interaction between vehicles satisfies the condition deemed to be a conflict.

Author Contributions

Conceptualization, P.T. and A.P.; methodology, P.T.; software, P.T.; validation, P.T., H.F., T.B. and A.P.; formal analysis, P.T., H.F., T.B. and A.P.; investigation, P.T.; data curation, P.T.; writing—original draft preparation, P.T.; writing—review and editing, H.F., T.B. and A.P.; visualization, P.T.; supervision, A.P. All authors have read and agreed to the published version of the manuscript.

Funding

This research received no external funding.

Institutional Review Board Statement

Not applicable.

Informed Consent Statement

Not applicable.

Data Availability Statement

The data presented in this study are available on request from the corresponding author.

Acknowledgments

Pavlos Tafidis would like to acknowledge the support of PTV AG by providing PTV Vissim for his Ph.D. research project.

Conflicts of Interest

The authors declare no conflict of interest.

References

  1. Clarke, A.C. Hazards of Prophecy: The Failure of Imagination. In Profiles of the Future: An Inquiry into the Limits of the Possible; Harper & Row: New York, NY, USA, 1962; pp. 14, 21, 36. [Google Scholar]
  2. ITF (International Transport Forum). Automated and Autonomous Driving: Regulation under Uncertainty; OECD (Organization for Economic Co-operation and Development): Paris, France, 2015. [Google Scholar]
  3. SAE International. Taxonomy and Definitions for Terms Related to Driving Automation Systems for On-Road Motor Vehicles. In Surface Vehicle Recommended Practice J3016TM; SAE International: Warrendale, PA, USA, 2014. [Google Scholar]
  4. Farah, H.; Erkens, S.; Alkim, T.; Arem, B. Infrastructure for Automated and Connected Driving: State of the Art and Future Research Directions. In Road Vehicle Automation 4: Lecture Notes in Mobility; Meyer, G., Beiker, S., Eds.; Springer International Publishing AG: New York, NY, USA, 2018; pp. 187–197. [Google Scholar]
  5. Shladover, S.E.; Bishop, R. Road Transport Automation as a Public-Private Enterprise. In EU–US Symposium on Automated Vehicles, White Paper I; Transportation Research Board: Washington, DC, USA, 2015. [Google Scholar]
  6. Liu, J.; Khattak, A.J. Delivering improved alerts, warnings, and control assistance using basic safety messages transmitted between connected vehicles. Transp. Res. Part C Emerg. Technol. 2016, 68, 83–100. [Google Scholar] [CrossRef] [Green Version]
  7. Singh, S. Critical Reasons for Crashes Investigated in the National Motor Vehicle Crash Causation Survey. In Traffic Safety Facts Crash Stats; National Highway Traffic Safety Administration: Washington, DC, USA, 2015; pp. 2–3. [Google Scholar]
  8. Johnson, C. Readiness of the Road Network for Connected and Autonomous Vehicles; RAC Foundation: London, UK, 2017. [Google Scholar]
  9. Hayeri, Y.M.; Hendrickson, C.T.; Biehler, A.D. Potential Impacts of Vehicle Automation on Design, Infrastructure and Investment Decisions-A State DOT Perspective. In Transportation Research Board 94th Annual Meeting Compendium of Papers; Transportation Research Board: Washington, DC, USA, 2015. [Google Scholar]
  10. McDonald, S.S.; Rodier, C. Envisioning automated transit within the built environment: 2020, 2035, 2050. In Road Vehicle Automation 2: Lecture Notes in Mobility; Meyer, G., Beiker, S., Eds.; Springer: Cham, Switzerland, 2015; pp. 225–233. [Google Scholar] [CrossRef]
  11. AASHTO. A Policy on Geometric Design of Highways and Streets, 4th ed.; American Association of State Highway and Transportation Officials: Washington, DC, USA, 2001; p. 315. [Google Scholar]
  12. Lutin, J.M.; Kornhauser, A.L.; Lerner-Lam, E. The revolutionary development of self-driving vehicles and implications for the transportation engineering profession. ITE J. 2013, 83, 28–32. [Google Scholar]
  13. Aria, E.; Olstam, J.; Schwietering, C. Investigation of Automated Vehicles Effects on Driver’s Behavior and Traffic Performance. Transp. Res. Procedia 2016, 15, 761–770. [Google Scholar] [CrossRef] [Green Version]
  14. Elsahly, O.; Abdelfatah, A. Influence of Autonomous Vehicles on Freeway Traffic Performance for Undersaturated Traffic Conditions. Athens J. Technol. Eng. 2020, 7, 117–132. [Google Scholar] [CrossRef]
  15. Morando, M.M.; Tian, Q.; Truong, L.T.; Vu, H.L. Studing the safety impact of Autonomous Vehicles Using Simulation-Based Surrogate Safety Measures. J. Adv. Transp. 2018, 2018, 6135183. [Google Scholar] [CrossRef]
  16. Gueriau, M.; Dusparic, I. Quantifying the Impact of Connected and Autonomous Vehicles on Traffic Efficiency and Safety in Mixed Traffic. In Proceedings of the IEEE 23rd International Conference on Intelligent Transportation Systems (ITSC), Rhodes, Greece, 20–23 September 2020; pp. 1–8. [Google Scholar] [CrossRef]
  17. Luttrell, K.; Weaver, M.; Harris, M. The Effect of Autonomous Vehicles on Trauma and Health Care. J. Trauma Acute Care Surg. 2015, 79, 678–682. [Google Scholar] [CrossRef] [PubMed]
  18. Rau, P.; Yanagisawa, M.; Najm, W.G. Target Crash Population of Automated Vehicles. In Proceedings of the 24th International Technical Conference on the Enhanced Safety of Vehicles (ESV), Gothenburg, Sweden, 8–11 June 2015. [Google Scholar]
  19. Ulak, M.B.; Ozguven, E.E.; Moses, R.; Sando, T.; Boot, W.; Abdelrazig, Y.; Sobanjo, J. Assesment of Traffic Perfomance Measures and Safety Based on Driver Age and Experience: A Microsimulation Based Analysis for an Unsignalized T-Interection. J. Traffic Transp. Eng. 2019, 6, 455–469. [Google Scholar] [CrossRef]
  20. Tafidis, P.; Pirdavani, A.; Brijs, T.; Farah, H. Intersection Control Type Effect on Automated Vehicle Operation. In Proceedings of the 19th COTA International Conference of Transportation Professionals, Nanjing, China, 6–8 July 2019. [Google Scholar] [CrossRef]
  21. Coppola, P.; Silvestri, F. Autonomous vehicles and future mobility solutions. In Autonomous Vehicles and Future Mobility, 1st ed.; Coppola, P., Esztergár-Kiss, D., Eds.; Elsevier: Amsterdam, The Netherlands, 2019; pp. 1–15. [Google Scholar]
  22. Noort, M.V.; Arem, B.V.; Park, B. Mobysim: An integrated traffic simulation platform. In Proceedings of the 13th International IEEE Annual Conference on Intelligent Transportation Systems, Madeira Island, Portugal, 19–22 September 2010; pp. 19–22. [Google Scholar]
  23. Li, Z.; Chitturi, M.V.; Zheng, D.; Bill, A.R.; Noyce, D. Modeling Reservation-Based Autonomous Intersection Control in VISSIM. Transp. Res. Rec. J. Transp. Res. Board 2013, 2381, 81–90. [Google Scholar] [CrossRef] [Green Version]
  24. Wagner, P. Traffic Control and Traffic Management in a Transportation System with Autonomous Vehicles. In Autonomous Driving; Maurer, M., Gerdes, J., Lenz, B., Winner, H., Eds.; Springer: Berlin/Heidelberg, Germany, 2016; pp. 301–316. [Google Scholar] [CrossRef] [Green Version]
  25. Planung Transport Verkehr AG. PTV Vissim 10; Planung Transport Verkehr AG: Karlsruhe, Germany, 2017; Available online: http://vision-traffic.ptvgroup.com/en-us/products/ptv-vissim/ (accessed on 24 May 2017).
  26. ATKINS. Research on the Impacts of Connected and Autonomous Vehicles (CAVs) on Traffic Flow. In Stage 2: Traffic Modelling and Analysis Technical Report; Version 2.1; Department for Transport: London, UK, 2016. [Google Scholar]
  27. Fries, R.; Qi, Y.; Leight, S. How many times should I run the model? Performance Measure: Specific Findings from VISSIM models in Missouri. In Proceedings of the Transportation Research Board 96th Annual Meeting Compendium of Papers, Washington, DC, USA, 8–12 January 2017. [Google Scholar]
  28. Saeed, T. Road Infrastructure Readiness for Autonomous Vehicles. Ph.D. Thesis, Lyles School of Civil Engineering, West Lafayette, IN, USA, 2019. [Google Scholar]
  29. Wang, S.; Yu, B. Impacts on the Geometric Design of Highway from Non-Autonomous to Autonomous Vehicles (L1–L4). In Proceedings of the Transportation Research Board 98th Annual Meeting Compendium of Papers, Washington, DC, USA, 13–17 January 2019. [Google Scholar]
  30. Nitsche, P.; Mocanu, I.; Reinthaler, M. Requirements on tomorrow’s road infrastructure for highly automated driving. In Proceedings of the International Conference on Connected Vehicles and Expo, Vienna, Austria, 3–7 November 2014; IEEE: New York, NY, USA; pp. 939–940. [Google Scholar]
  31. Gowling WLG. Building the Road Infrastructure for the Future of Connected and Autonomous Vehicles; UK AutoDrive: London, UK, 2018. [Google Scholar]
  32. Somers, A. Infrastructure Changes to Support Automated Vehicles on Rural and Metropolitan Highways and Freeways. In Projects Findings and Recommendations (Module 5); Austroads Ltd.: Sydney, Australia, 2019. [Google Scholar]
  33. Lu, X.; Bahman, M.; Farah, H.; Snelder, M. Scenario-Based Infrastructure Requirements for Automated Driving. In Proceedings of the 19th COTA International Conference of Transportation Professionals, Nanjing, China, 6–8 July 2019. [Google Scholar]
  34. Liu, Y.; Tight, M.; Sun, Q.; Kang, R. A Systematic Review: Road Infrastructure Requirements for Connected and Automated Vehicles (CAVs). J. Phys. Conf. Ser. 2019, 1187, 042073. [Google Scholar] [CrossRef]
  35. Duarte, F.; Ratti, C. The impact of Autonomous Vehicles on Cities: A review. J. Urban. Technol. 2018, 25, 3–18. [Google Scholar] [CrossRef]
  36. Bierstedt, J.; Gooze, A.; Gray, C.; Peterman, J.; Raykin, L.; Walters, J. Effects of Next-Generation Vehicles on Travel Demand and Highway Capacity; FP Think Working Group, Fehr & Peers: Walnut Creek, CA, USA, 2014. [Google Scholar]
  37. Bohm, F.; Hager, K. Introduction of Autonomous Vehicles in the Swedish Traffic System: Effects and Changes Due to the New Self-Driving Car Technology; Uppsala Univeristet: Uppsala, Sweden, 2015. [Google Scholar]
  38. Sukennik, P. Micro-Simulation Guide for Automated Vehicles; COEXIST (h2020-coexist.eu); PTV Group: Karlsruhe, Germany, 2018. [Google Scholar]
  39. Planung Transport Verkehr AG. VISSIM 5.30-05 User Manual. 2011; Available online: https://www.yumpu.com/en/document/view/19525178/vissim-530-05-user-manual (accessed on 17 May 2021).
  40. Transportation Research Board. Highway Capacity Manual; Transportation Research Board: Washington, DC, USA, 2000. [Google Scholar]
  41. FHWA. Surrogate Safety Assessment Model (SSAM). Federal Highway Administration. Available online: https://www.fhwa.dot.gov/research/tfhrc/projects/projectsite/safety/ssam/index.cfm (accessed on 17 May 2021).
Figure 1. 2D view of the existing intersection in PTV VISSIM.
Sustainability 13 09750 g001
Figure 2. 2D view of the modified intersection in PTV VISSIM.
Sustainability 13 09750 g002
Figure 3. Total delay per vehicle.
Sustainability 13 09750 g003
Figure 4. Number of stops per vehicle.
Sustainability 13 09750 g004
Figure 5. Changes in total delay per vehicle (%).
Sustainability 13 09750 g005
Table 1. Levels of automation [3].
LevelNameDescriptionDriving
Environment
0no automationthe human drivers are entirely responsible for the control of their vehiclemonitored by human driver
1driver assistancelateral or longitudinal vehicle control is automated
2partial automationlateral and longitudinal vehicle control is automated
3conditional automationdriving tasks are automated, although human driver intervention is expected upon requestmonitored by automated driving system
4high automation driving tasks are automated, and human driver intervention is not expected
5full automationdriving tasks are automated, and no human driver intervention is required
Table 2. Modeled scenarios.
ScenarioFleet Composition
No-AVsLow Levels of AVsHigh Levels of AVs
Base100%
“something everywhere” strategy
Early deployment period75%25%
Late deployment period25%75%
“everything somewhere” strategy
Early deployment period75% 25%
Late deployment period25% 75%
Table 3. Road design requirements for automated vehicles (Avs).
StudyRoad ElementImplication
Hayeri et al. (2015) [9]
Johnson (2017) [8]
Farah et al. (2018) [4]
Saeed (2019) [28]
lane widthreduced lane width
Farah et al. (2018) [4]
McDonald and Rodier (2015) [10]
Saeed (2019) [28]
Wang and Yu (2019) [29]
speed limitsincreased speed limits
McDonald and Rodier (2015) [10]central reservationnot required
Hayeri et al. (2015) [9]central reservationreduced central reservation
Nitsche et al. [30]
Johnson (2017) [8]
Gowling WLG (2018) [31]
Somers (2019) [32]
Saeed (2019) [28]
Lu et al. (2019) [33]
Liu et al. (2019) [34]
lane markingsrequired
Nitsche et al. [30]
Johnson (2017) [8]
Gowling WLG (2018) [31]
Somers (2019) [32]
Saeed (2019) [28]
Lu et al. (2019) [33]
Liu et al. (2019) [34]
road signsrequired
Somers (2019) [31]
Liu et al. (2019) [33]
curbsrequired
Duarte and Ratti (2018) [35]traffic signalsrequired
Hayeri et al. (2015) [9]
Saeed (2019) [28]
traffic signalsnot required
Saeed (2019) [28]
Wang and Yu (2019) [29]
stopping sight distancereduced stopping sight distance
Hayeri et al. (2015) [9]
Gowling WLG (2018) [30]
Saeed (2019) [28]
Liu et al. (2019) [33]
shouldersrequired
Johnson (2017) [8]corner radiitighter corner radii
Saeed (2019) [28]corner radiistandard corner radii
Table 4. Behavior of vehicles in PTV Vissim.
Type of VehiclesDescriptionImpact on Vehicle Operation
No-AVsthe default behavior is assumed
AVs in “something everywhere” Strategyautomated longitudinal and lateral behavior is assumed reduced space between vehicles and faster and smoother acceleration/deceleration
AVs in “everything somewhere” Strategyenhanced automated longitudinal and lateral behavior is assumedmore significant reduction in space between vehicles and gap acceptance for lane change and even faster and smoother acceleration/deceleration
Table 5. Adjusted parameters in PTV Vissim.
ParameterDefinitionType of VehiclesSource
AVs in
“Something
Everywhere”
Strategy
AVs in
“Everything Somewhere”
Strategy
AVs in
“Something
Everywhere”
Strategy
AVs in
“Everything Somewhere”
Strategy
CC0the average desired standstill distance between two vehicles.1 m (3.28 ft)0.5 m (1.64 ft)adopted from [36,37,38]adopted from [26]
CC1time distribution of speed-dependent part of desired safety distance.0.5 s0.5 sadopted from [36,37]adjusted based on [39] recommendations
CC2restricts the distance difference
(longitudinal oscillation).
2 m (6.56 ft)0 m (0 ft)adopted from [36]adjusted based on [39] recommendations
CC4defines negative speed difference during the following process.−0.10adopted from [36,37]adjusted based on [39] recommendations
CC5defines positive speed difference during the following process.0.10adopted from [36,37]adjusted based on [39] recommendations
CC6influence of distance on speed oscillation while in the following process.0 km/h0 km/hadopted from [36,37]adjusted based on [39] recommendations
CC7oscillation during acceleration.0.25 m/s2 (0.82 ft/s2)0.4 m/s2
(1.3 ft/s2)
adopted from [36]adopted from [26,37]
CC8desired acceleration when starting from a standstill.3.5 m/s2 (11.48 ft/s2)4 m/s2
(13.12 ft/s2)
adopted from [36]adopted from [37]
Min headway (front/rear)the minimum distance between two vehicles that must be available after a lane change, so that the change can take place.0.5 m (1.64 ft)0.2 m (0.65 ft)adjusted based on [39] recommendationsadjusted based on [39] recommendations
Observed Vehiclesthe number of observed vehicles or certain network objects affect how well vehicles in the link can predict other vehicles’ movements and react accordingly.1010adopted from [37]adopted from [37]
Smooth closeup behaviorif this option is checked, vehicles slow down more evenly when approaching a stationary obstacle.adopted from [37]adopted from [37]
Table 6. Traffic performance results.
ScenarioTotal Delay
per Vehicle (s)
Stop Delay
per Vehicle (s)
Queue
Length (m)
Number
of Stops
per Vehicle
LOS
Base27.0718.796.670.74C
“something everywhere” strategy
Early deployment period26.5218.436.430.73C
Late deployment period25.8618.076.170.70C
“everything somewhere” strategy
Early deployment period56.36183.10147.916.67F
Late deployment period43.69180.23149.628.61F
Table 7. Traffic performance results of the two-lane street.
ScenarioTotal Delay
per Vehicle (s)
Stop Delay
per Vehicle (s)
Queue
Length (m)
Number
of Stops
per Vehicle
LOS
Base26.3317.5812.980.75C
“something everywhere” strategy
Early deployment period25.9317.4412.570.74C
Late deployment period25.3517.2712.060.72C
Table 8. Traffic performance results of the two-lane street with a channelized right-turn lane.
ScenarioTotal Delay
per Vehicle (s)
Stop Delay
per Vehicle (s)
Queue
Length (m)
Number
of Stops
per Vehicle
LOS
Base25.7417.7610.260.72C
“something everywhere” strategy
Early deployment period25.4417.5910.120.72C
Late deployment period24.9317.339.880.70C
Publisher’s Note: MDPI stays neutral with regard to jurisdictional claims in published maps and institutional affiliations.

