1. Introduction
The consequences of climate change and global warming, as well as the shortage of energy resources, have placed a focus on the greater use of energy from renewable sources. The European Parliament [
1] sets goals for nations for the implementation of these energies that include the binding objective of reducing the Union’s emissions by at least 40% by 2030, in line with objective number 7 of the United Nations’ 2030 Agenda of providing access to affordable, safe, sustainable, and modern energy. Within the EU’s strategy, some authors such as Panagiotidou et al. [
2] have indicated that buildings are responsible for 38% of total EU energy consumption, and their energy demand management brings an opportunity to reach the desired objectives by 2030.
With regards to domestic energy consumption, Fuentes et al. [
3] stated that domestic hot water (DHW) represents approximately 14% (in the EU) to 18% (in the USA) of total consumption. In Spain, the public body in charge of promoting the implementation of renewable energies, Instituto para la Diversificación y Ahorro de la Energía (IDAE), part of the Ministry for Ecological Transition, reported in 2017 that domestic consumption represented 18% of total energy consumed; this data was endorsed by Eurostat [
4]. Energy intake for DHW systems was obtained and found to be mainly from gas (55% of total) and petroleum products (20%), while electricity represented 15% and 10% of renewable energies. Solar thermal energy represented 8% of the energy dedicated to producing DHW.
Casanovas-Rubio and Armengou [
5] have claimed that an appropriate selection of DHW systems can widely reduce energy consumption and operational costs and protect the environment, and they recognized solar energy potential in the reduction of energy consumption dedicated to the supply of DHW. Likewise, De Somer et al. [
6] argued that generating DHW and storing it in a tank will act as a buffer and helps store energy more cheaply than in battery systems. As shown by Jack et al. [
7], the ability to store energy for later usage, as demonstrated by these tanks, reveals their potential as a smart system for energy management.
The research proposed by Panagiotidou et al. [
2], Wang et al. [
8], and Aguilar et al. [
9,
10] agree that the main renewable solar technologies currently applied in the production of DHW are solar thermal (ST), photovoltaic (PV), photovoltaic/thermal (PV/T), and solar-energy-assisted heat pumps (SAHPs). This is due to the swift growth in demand for thermal energy for buildings over the last few decades.
DHW generation in terms of a building’s energy needs and the comparison between different ST, PV, and PV/T technologies have been the object of study by Souliotis et al. [
11], Tse and Chow [
12], Good et al. [
13], and Mousa [
14] in order to assess energy balance; it was concluded that solar photovoltaic energy is sufficient to reach a zero energy balance. Likewise, Huide et al. [
15] proposed a comparative study to determine the choice of collectors or solar photovoltaic modules, depending on the available area, by selecting be-tween ST, PV, and PV/T and concluded that DHW demands can have an influence when choosing the number of solar modules and their layouts. These studies included an analysis of a building’s total energy demands.
In the case of SAHP systems, Wang et al. [
8], Aguilar et al. [
9,
10], and Angenendt et al. [
16] reviewed the real possibilities behind the production of DHW by heat pumps assisted by solar power PV and water tank storage. The research compared these heat pump systems with solar energy collectors [
10,
17], concluding that operational and maintenance costs increase due to circulation pumps and other hydronic component installations, as is the case of costs associated with pipes, valves, and interchangers, as shown by Huang et al.’s [
18] economic analysis, although the problems and limitations associated with this kind of installation are not mentioned. Likewise, another study [
2] concluded that SAHP technology presents a higher initial cost compared to ST, PV, and PV/T technologies; this considers that the PV/T hybrid technology costs are high due to the higher fitting and material costs, as shown by Brinkley et al. [
19].
The most common technologies used for the production of DHW in buildings are ST and, to a lesser degree, PV [
2]. This is because ST’s efficiency is high; solar thermal collectors have an 80% typical efficiency [
2]. However, ST transforms solar energy into an operating fluid’s internal energy, as described by Kumar et al. [
20]. Panagiotidou et al. [
2] and Kumar et al. [
20] agree that due to the use of an operating fluid, a pump is required, together with a start/stop controller and separate pipework. Because of the heat exchange, and in situations of low or no demand, the system can reach very high temperatures that will alter its normal functioning and degrade the installation components, which becomes a serious problem. On the other hand, Nems and Nems [
21] argued that photovoltaic component installations are less complex, and the developments in technology and prices, with regard to the production of such modules, make them a suitable alternative to thermal collectors. Supporting this approach, the afore-mentioned authors [
2] stated that PV costs, including its installation, amount to 39% of ST’s total initial costs. As far as maintenance costs are concerned, some authors such as Lin et al. [
22] assumed 2% of the initial cost of ST’s investment, while other authors such as Huang et al. [
18] assumed a 1% cost to the initial ST’s investment; PV bears none. The same authors [
18] stated in their financial analysis that in terms of operational costs, ST bears costs associated with the pump’s electricity consumption, whereas PV has no operational costs, which is an advantage of photovoltaic installations.
Javed et al. [
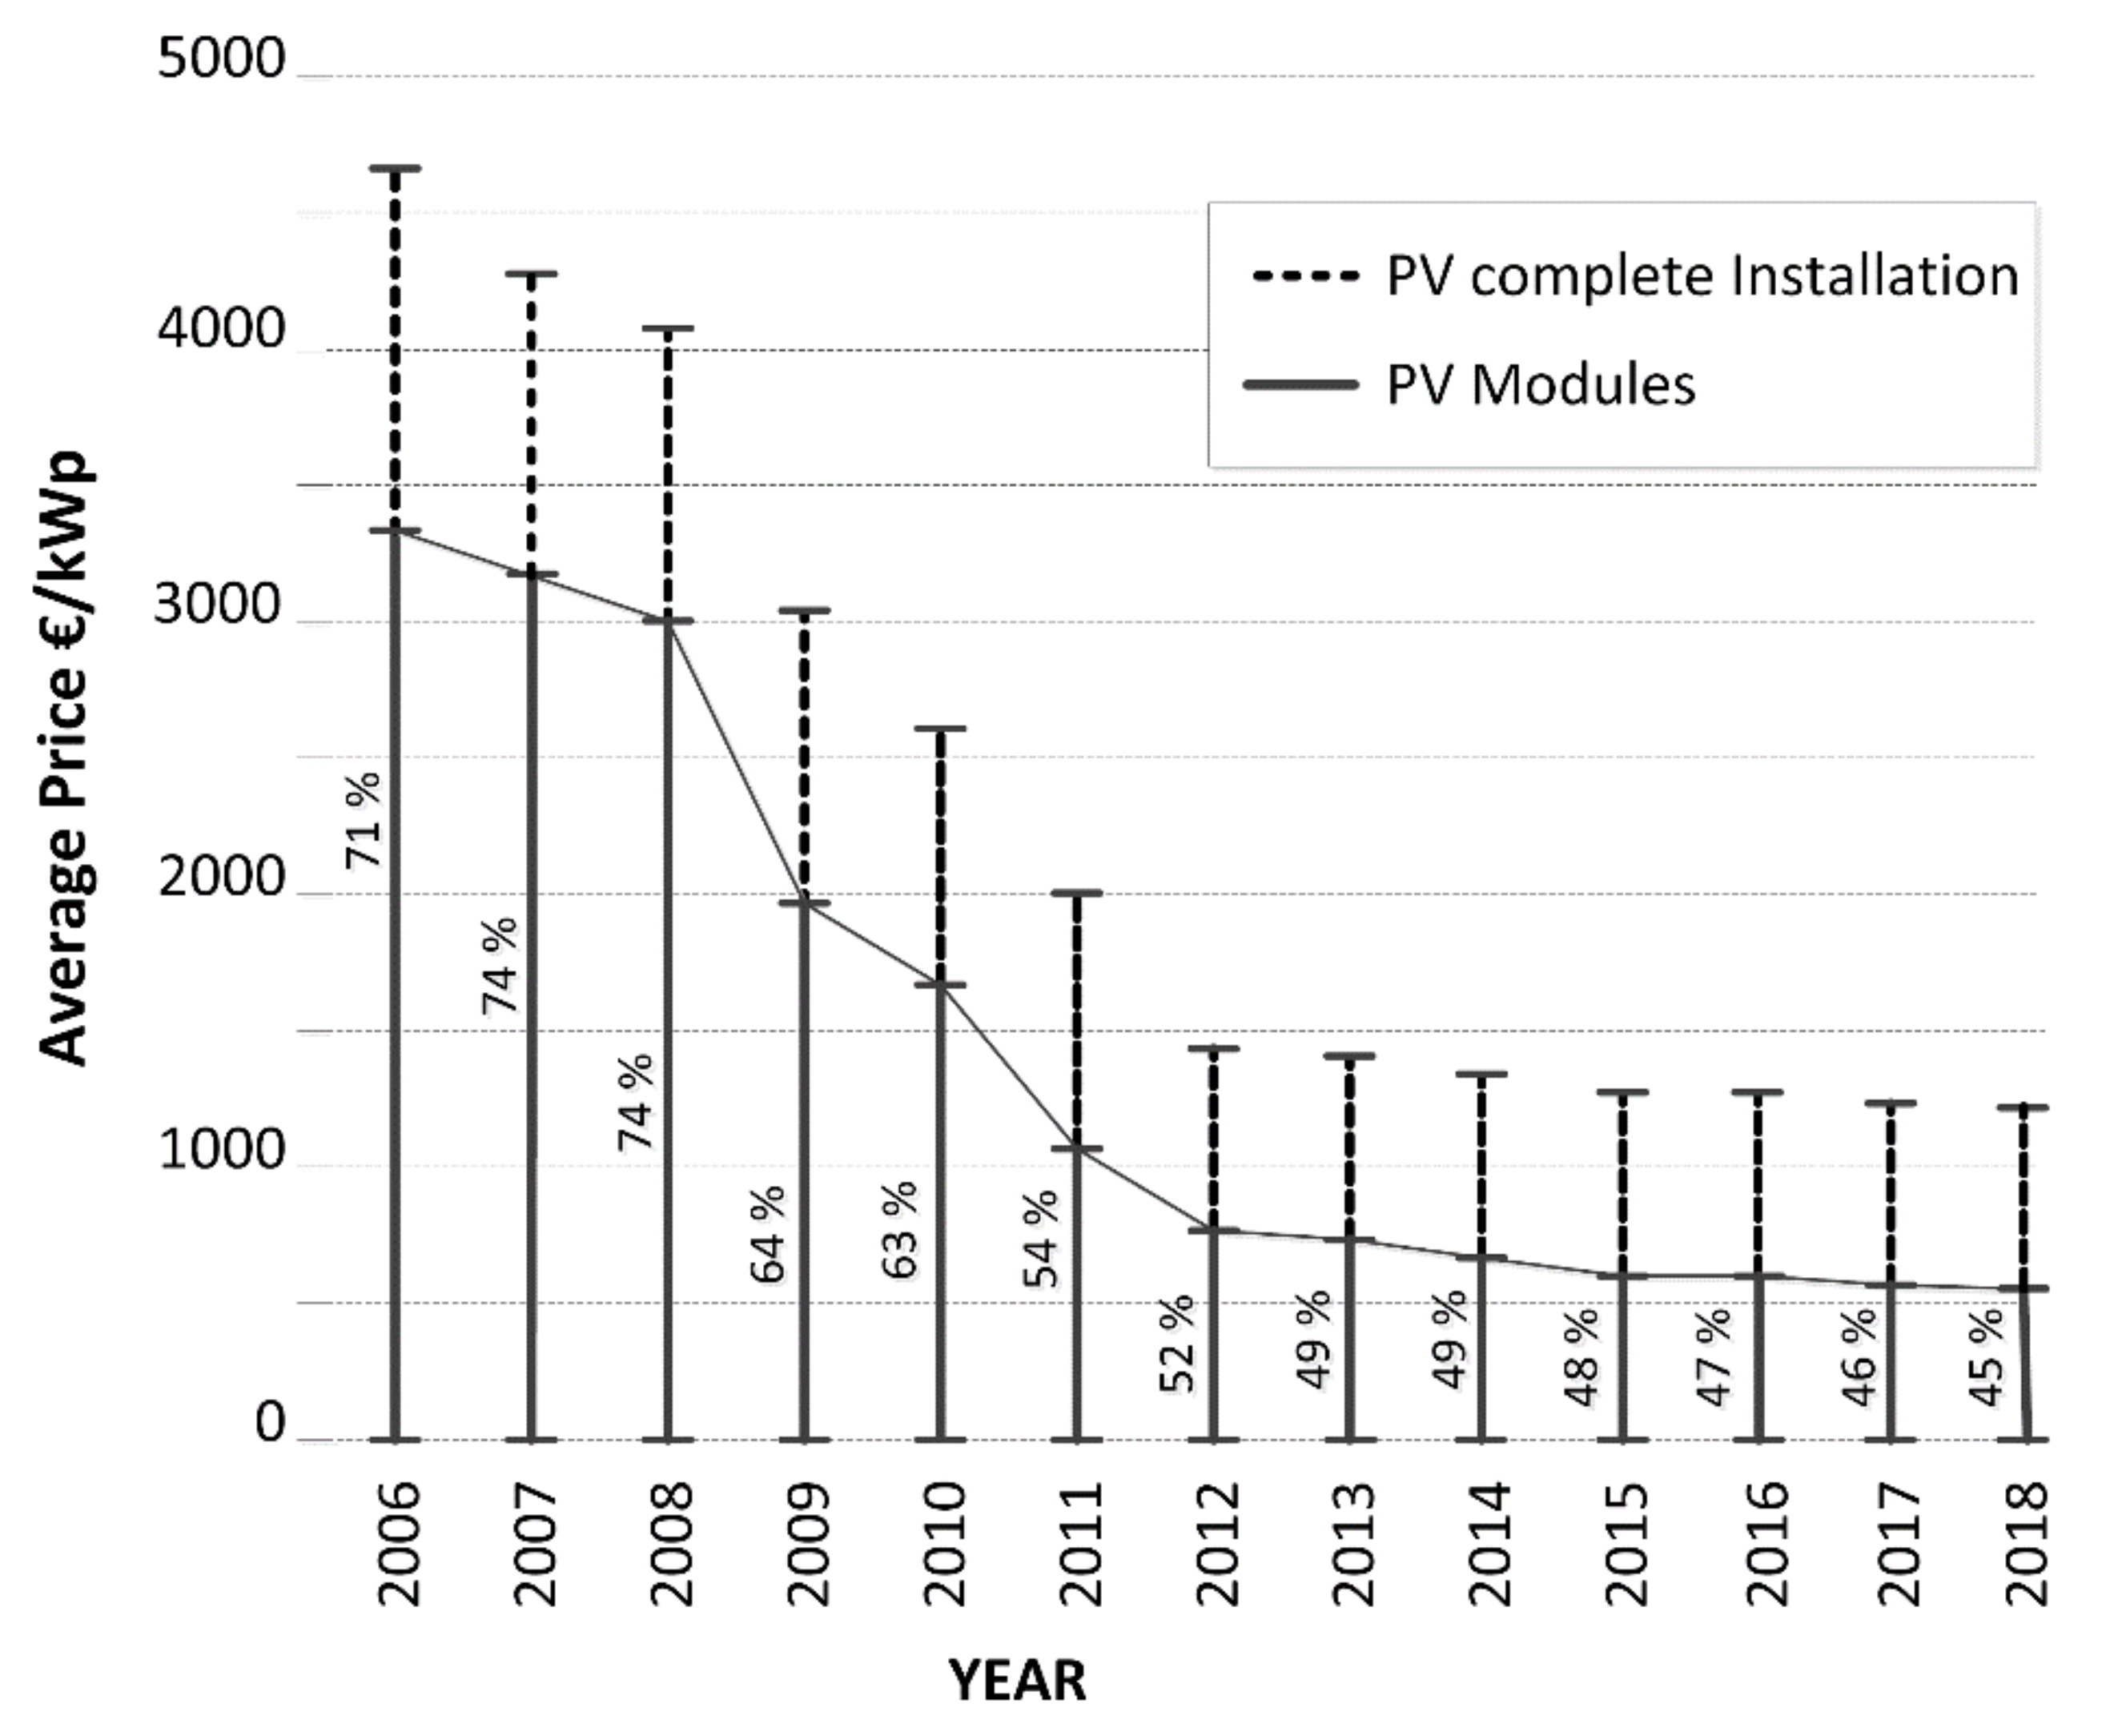
23], like other authors, have stated that when compared with other renewable sources, PV has proven to be the least contaminant, the quietest, and a limitless power source. Such characteristics render photovoltaic technology the preferred option amongst the renewable power sources, as shown in Hernandez-Callejo et al.’s [
24] research. The constant drop in the solar photovoltaic module prices, as shown in
Figure 1, including data provided by the Fraunhofer Institute [
25], has led different authors such as Ayadi et al. [
17], Klamka et al. [
26], and Chung et al. [
27] to note the interest of heat generation by direct coupling. This avoids the hydronic installation for heat transmission since the energy transformation takes place through an electrical resistance located inside the tank where DHW is produced and stored, as shown by the devices analyzed by Panagiotidou et al. [
2], Huide et al. [
15], and Kumar et al. [
20].
This situation has led several authors such as Ayadi et al. [
17], Akbari et al. [
28], and Casaleiro et al. [
29] to propose the use of solar photovoltaic energy for the production of DHW stored in a tank, with the objective of optimizing the self-consumption of electric energy generated by these means. The option of generating DHW by solar photovoltaic modules only has also been researched by Nems and Nems [
21] in order to determine the amount of power to be installed, depending on the installation’s demand. With that in mind, other authors [
30] have demonstrated that such a control strategy over demand affects DHW quality and supply as well as the tanks’ performance.
Meyers et al. [
31] showed that photovoltaic energy can produce thermal energy at competitive costs by heating electric resistance; this evidently supports our research into this specific use of photovoltaic power. In addition to that, Mousa et al. [
14] highlighted that solar photovoltaic energy can be used for generating heat in industrial processes and can also meet their energy demand requirements, as Talbi et al. [
32] have demonstrated. In fact, the industrial sector is the largest consumer of heat energy since 74% of its demand is in this way [
33]. These processes can include activities such as staining, bleaching, cooking, and drying, among others [
34]. For that purpose, research by Kumar et al. [
20] and Farjana et al. [
35] analyzed the appropriateness of solar heating applications in sectors as diverse as automotive, textiles, printing, food production, paper, plastics, chemicals, electrics, and machinery.
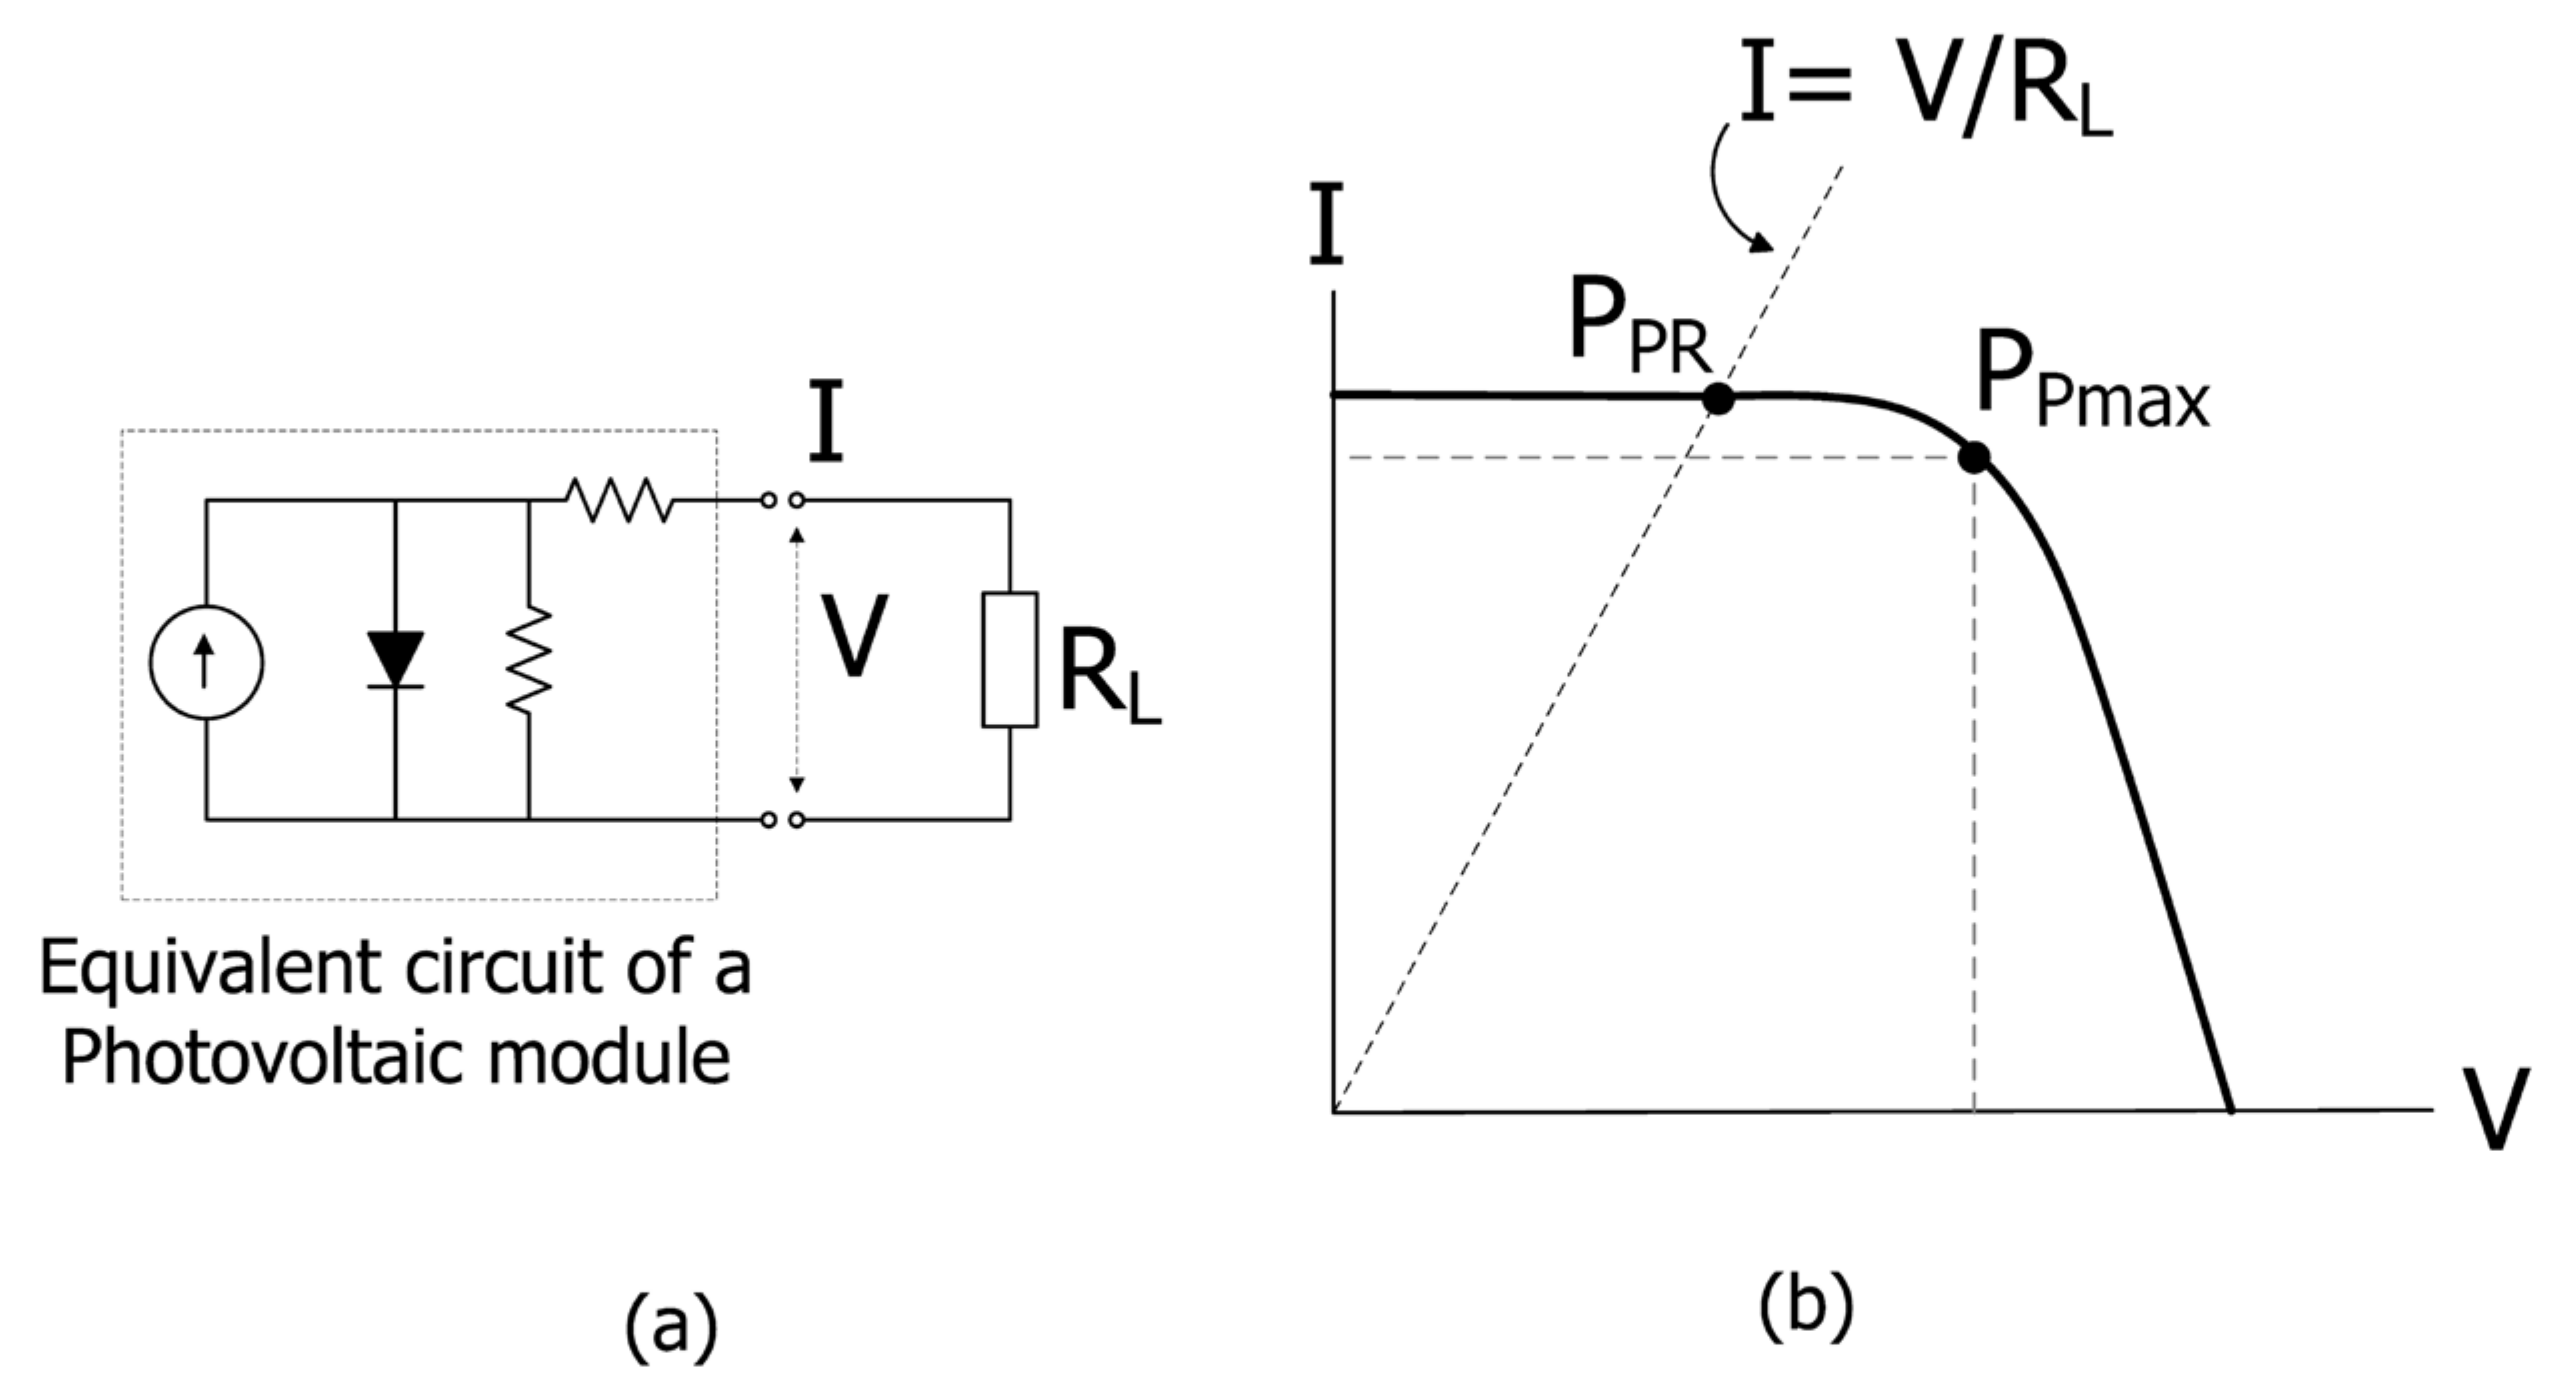
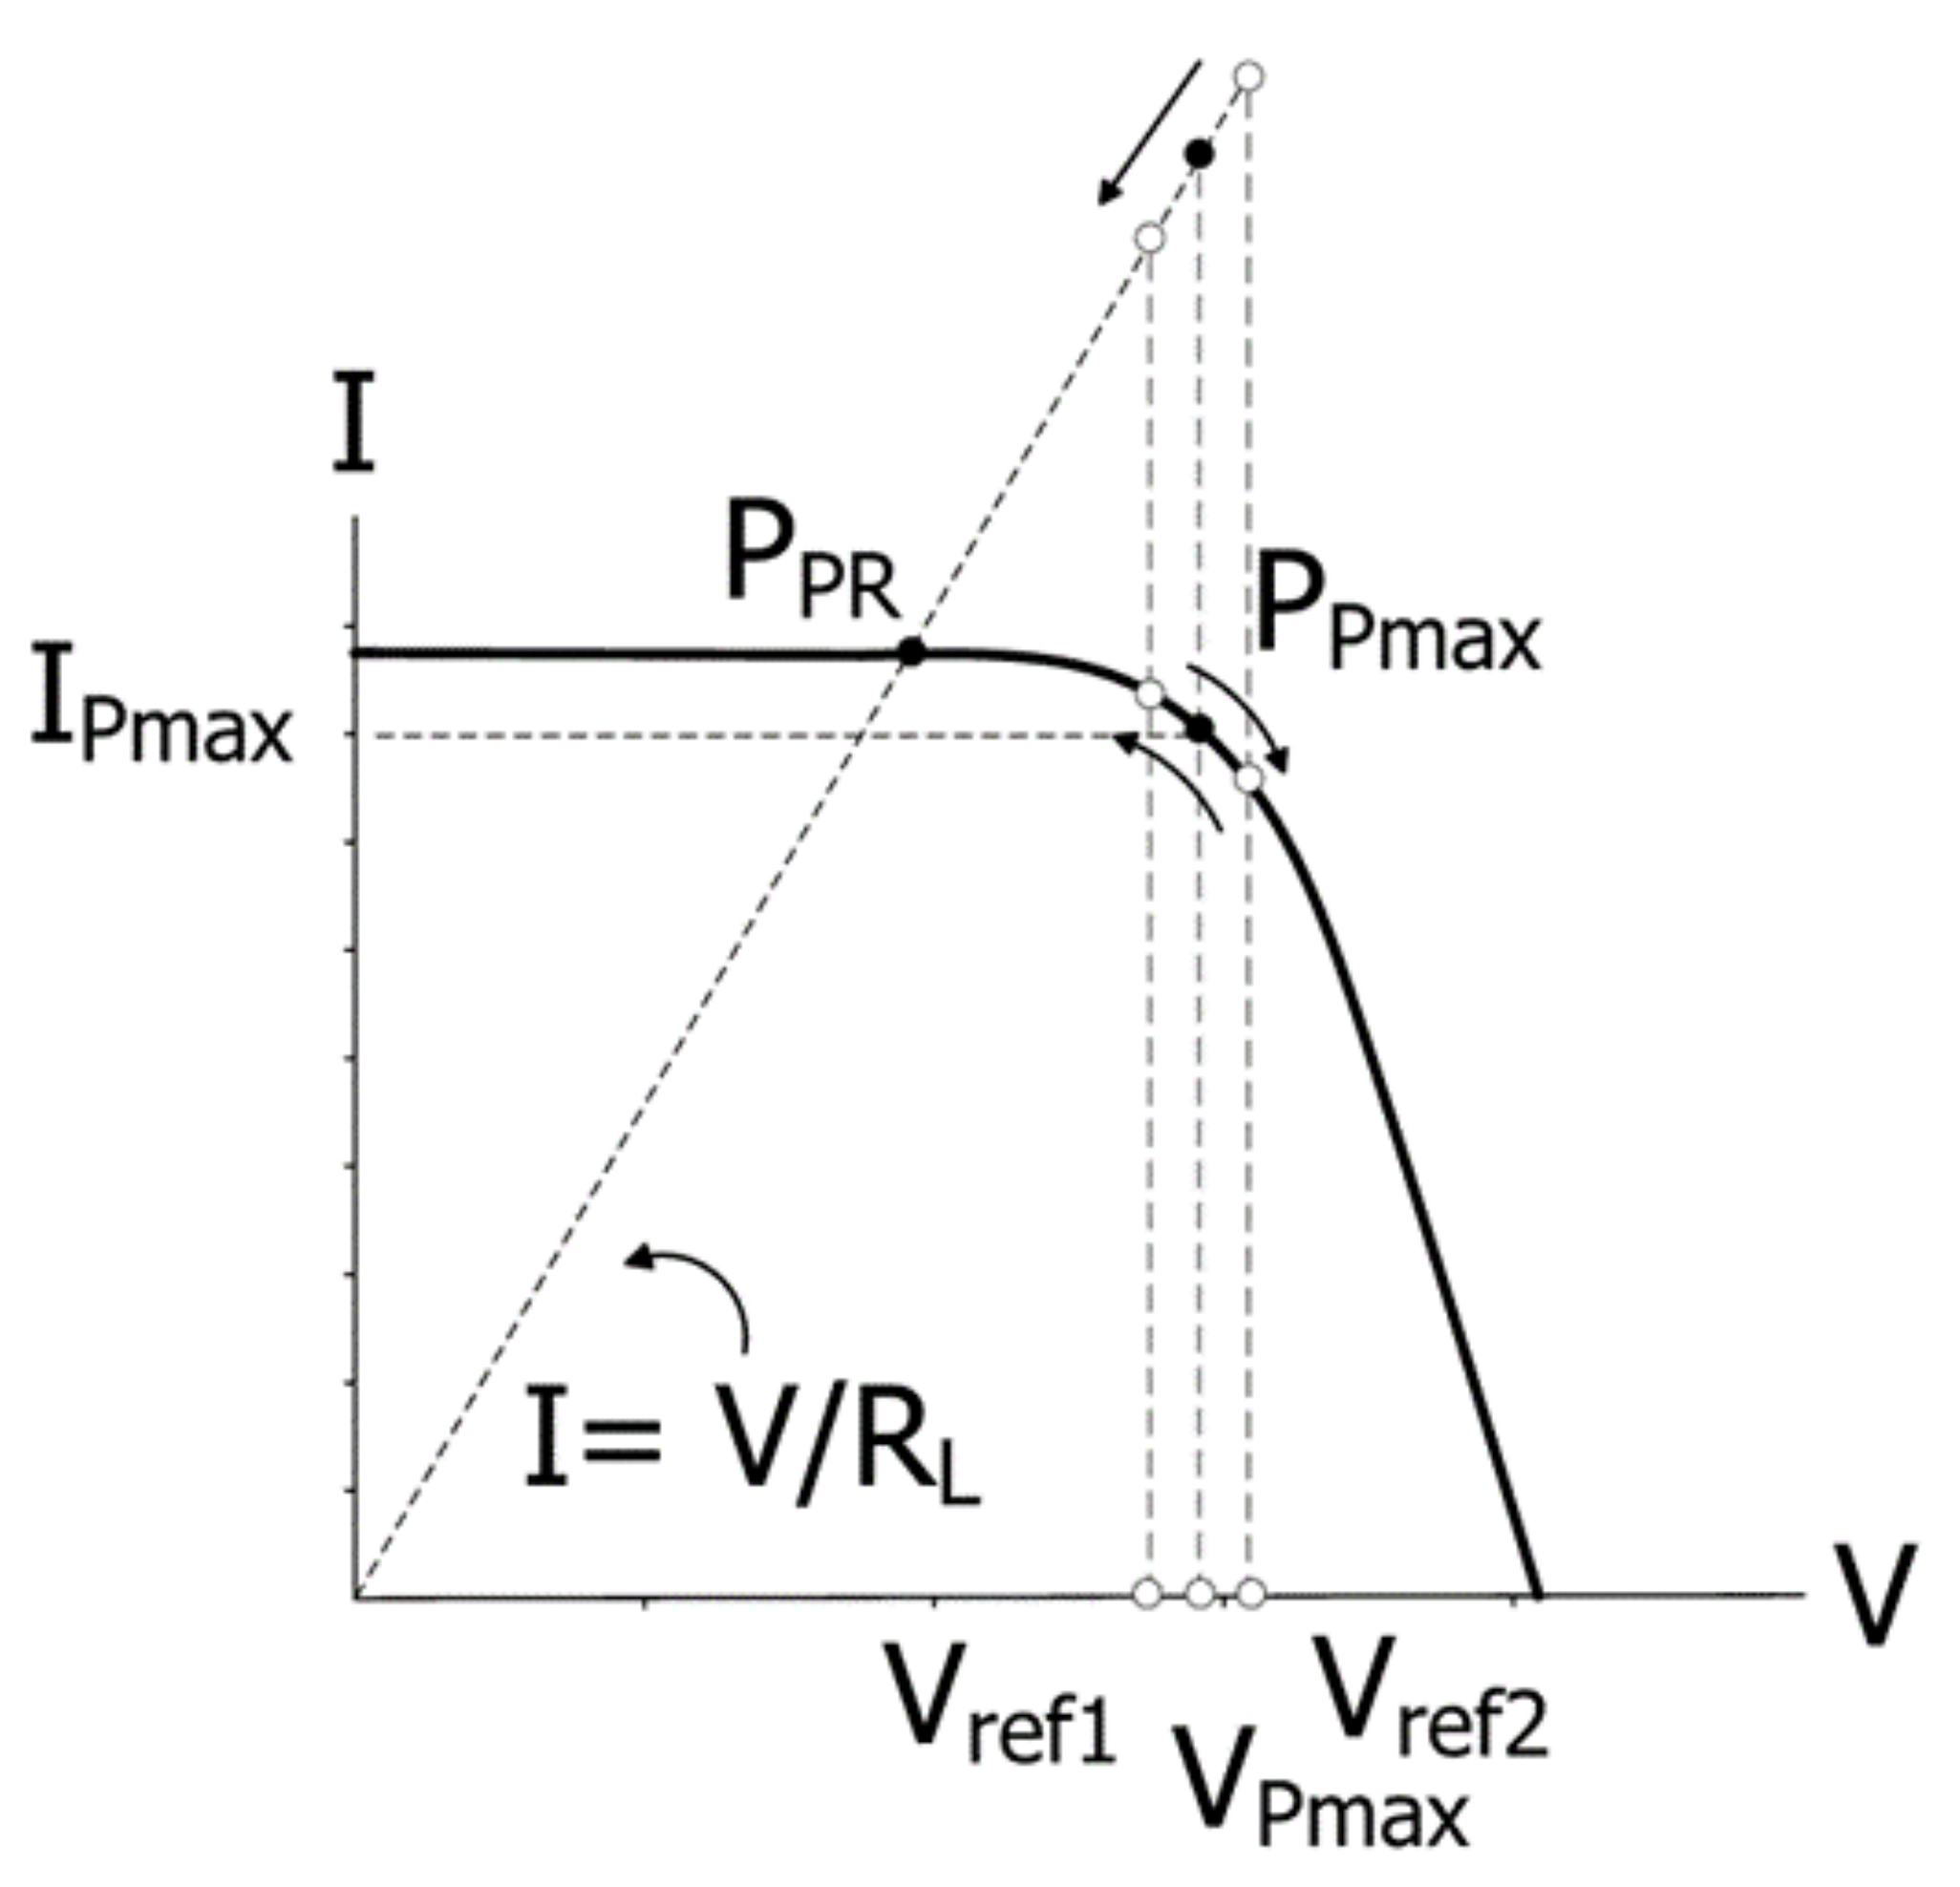
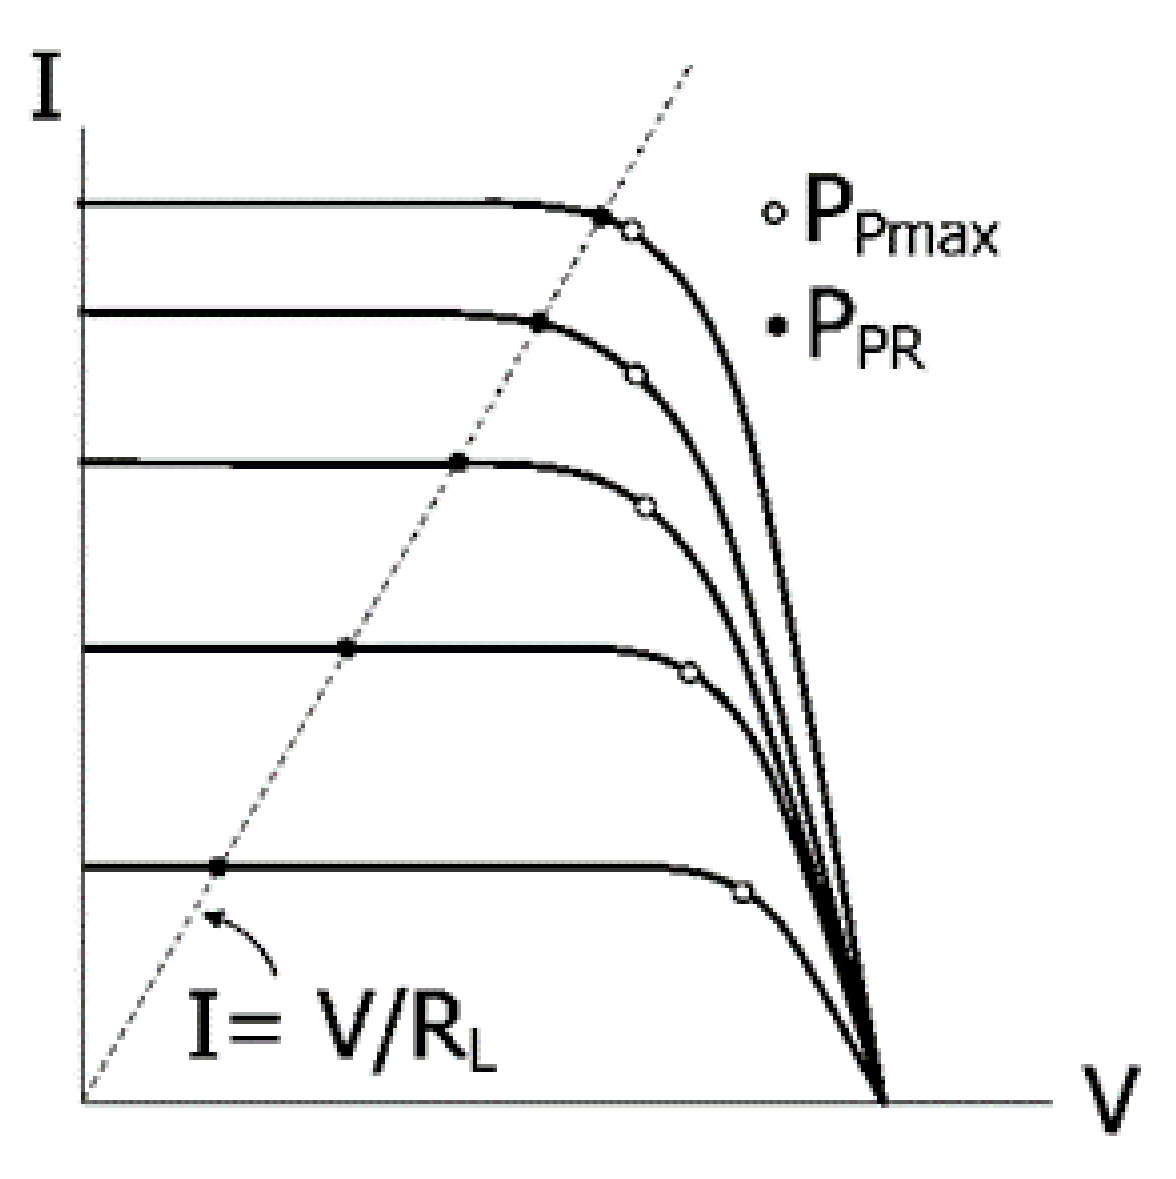
A simple and easy solution for solar water heating (SWH), as well as for other heating processes using PV, would be the direct coupling of all the photovoltaic modules into a resistance or a group of resistances. However, direct coupling would present us with a serious problem. The solar photovoltaic system’s behavior is similar to that of a constant current source, and when the electrical voltage exceeds a certain level, the current drops suddenly. If a purely resistive charge is connected, the operating point of the system P
PR will depend on the value of the resistance. This operating point can be far from the maxi-mum power point P
Pmax, as shown in
Figure 2. Being far from this maximum power point means being in a very low-efficiency situation because only part of the energy available in the photovoltaic field is used.
The systems proposed by Aguilar et al. [
10], Good et al. [
13], and Angenendt et al. [
16] were always, in practice, equipped with batteries or inverters, which represents important limitations in terms of the installation’s maintenance and costs. Alternatively, Hirech et al. [
36,
37] and Sibiya et al. [
38] analyzed photovoltaic direct coupling for direct current through converters DC-DC, including maximum power point tracking (MPPT) control systems; however, in the above-mentioned research, the use of a DHW commercial tank was not considered. The objective is to eliminate inverters and batteries and, thus, reduce investment and maintenance costs, as described by Hernandez-Callejo et al. [
24]. Talbi et al. [
32] already reflected upon the possibility of using electrical resistance with isolated photovoltaic systems without batteries, with the intention of heating water experimentally.
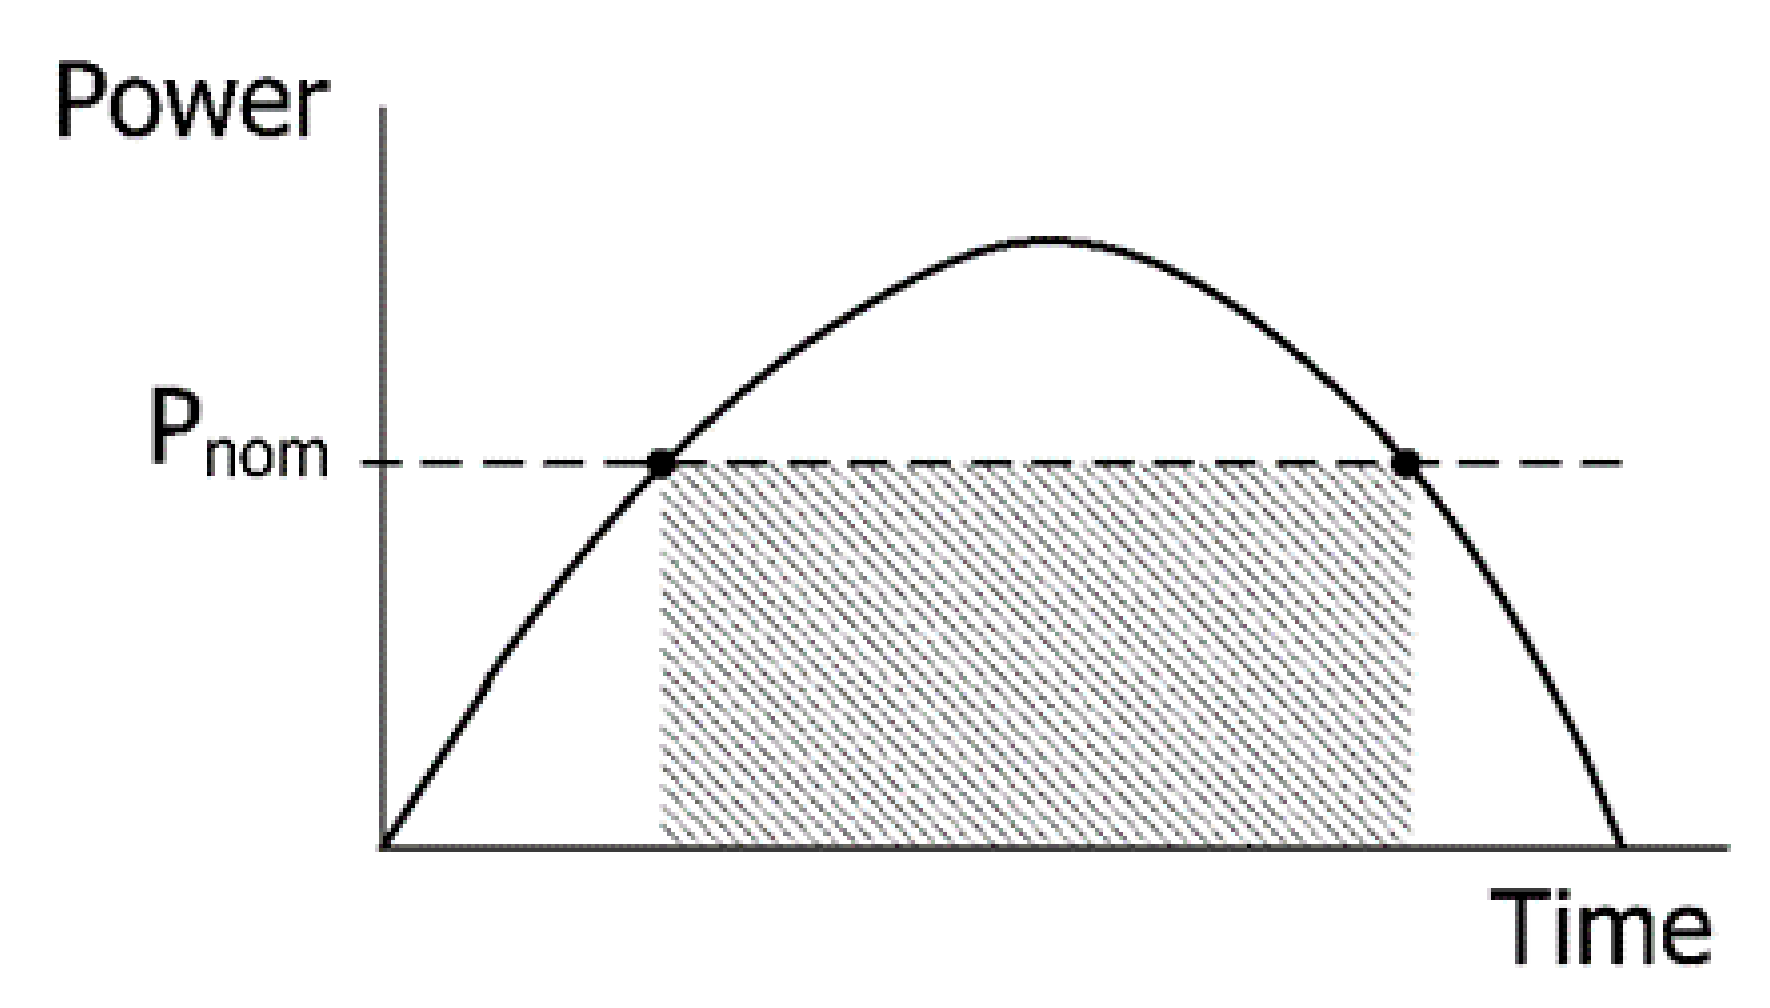
In any case, an isolated system with direct photovoltaic coupling by means of an inverter, without the existence of batteries, presents us with another problem. As shown in
Figure 3, the power supplied by the photovoltaic modules varies throughout the day.
In a direct coupling with an inverter, the system would only work as long as the photovoltaic system is able to supply power greater than the nominal power of the load (grated area). Therefore, if the photovoltaic system was designed so that its maximum power was less than the nominal power of the load, the system would never work. On the other hand, if the photovoltaic system was designed to have a maximum power greater than the nominal power of the load, the energy arising from the difference between the power of the system and the nominal power of the load would be lost. In any case, the energy provided by the photovoltaic system would always be lost as long as it is outside the area grated in
Figure 3.
The aim is to make available a simple system in terms of the number of components, low cost, and ease of maintenance in order to avoid the complexity of hydronic installations associated with heat exchange. This article shows the design and implementation of a low-cost solution oriented to the optimization of isolated thermal photovoltaic generation installations. Specifically, we have focused on an ACS production system.
Within this field of SWH, the system has been designed to take advantage of all the energy provided by the photovoltaic modules. This is not only to solve the problem of maintaining the maximum power point but also to take advantage of the energy available for any level of power supplied by the photovoltaic modules.
This article will show the foundations on which the design is based and how its different elements and subsystems are integrated, as well as the presentation of the results that demonstrate its technical viability.
2. Materials and Methods
This research presents a test device with an electronic system that is able to place the photovoltaic system at its maximum power point, even though the load is purely resistive, as is the case in resistances for electro-thermal conversion.
Given that the electricity produced by one or several photovoltaic modules behaves as a finite power source, it is necessary for the system to operate at the maximum power point, which is why an MPPT tracker is required. Without using inverters or batteries, which are more common in traditional solar photovoltaic installations, we have developed a low-cost electronic system capable of acting as an MPPT device.
Keeping a fixed reference voltage is the MPPT tracking method used. It is for that purpose that the electronic system core has a microcontroller board, which will keep a reference voltage so that the photovoltaic modules operate at the maximum power point.
The design of the electronic device is based on the charging and discharging of a capacitor. A simple circuit has been designed to function as a buffer between the PV module and the charging resistor.
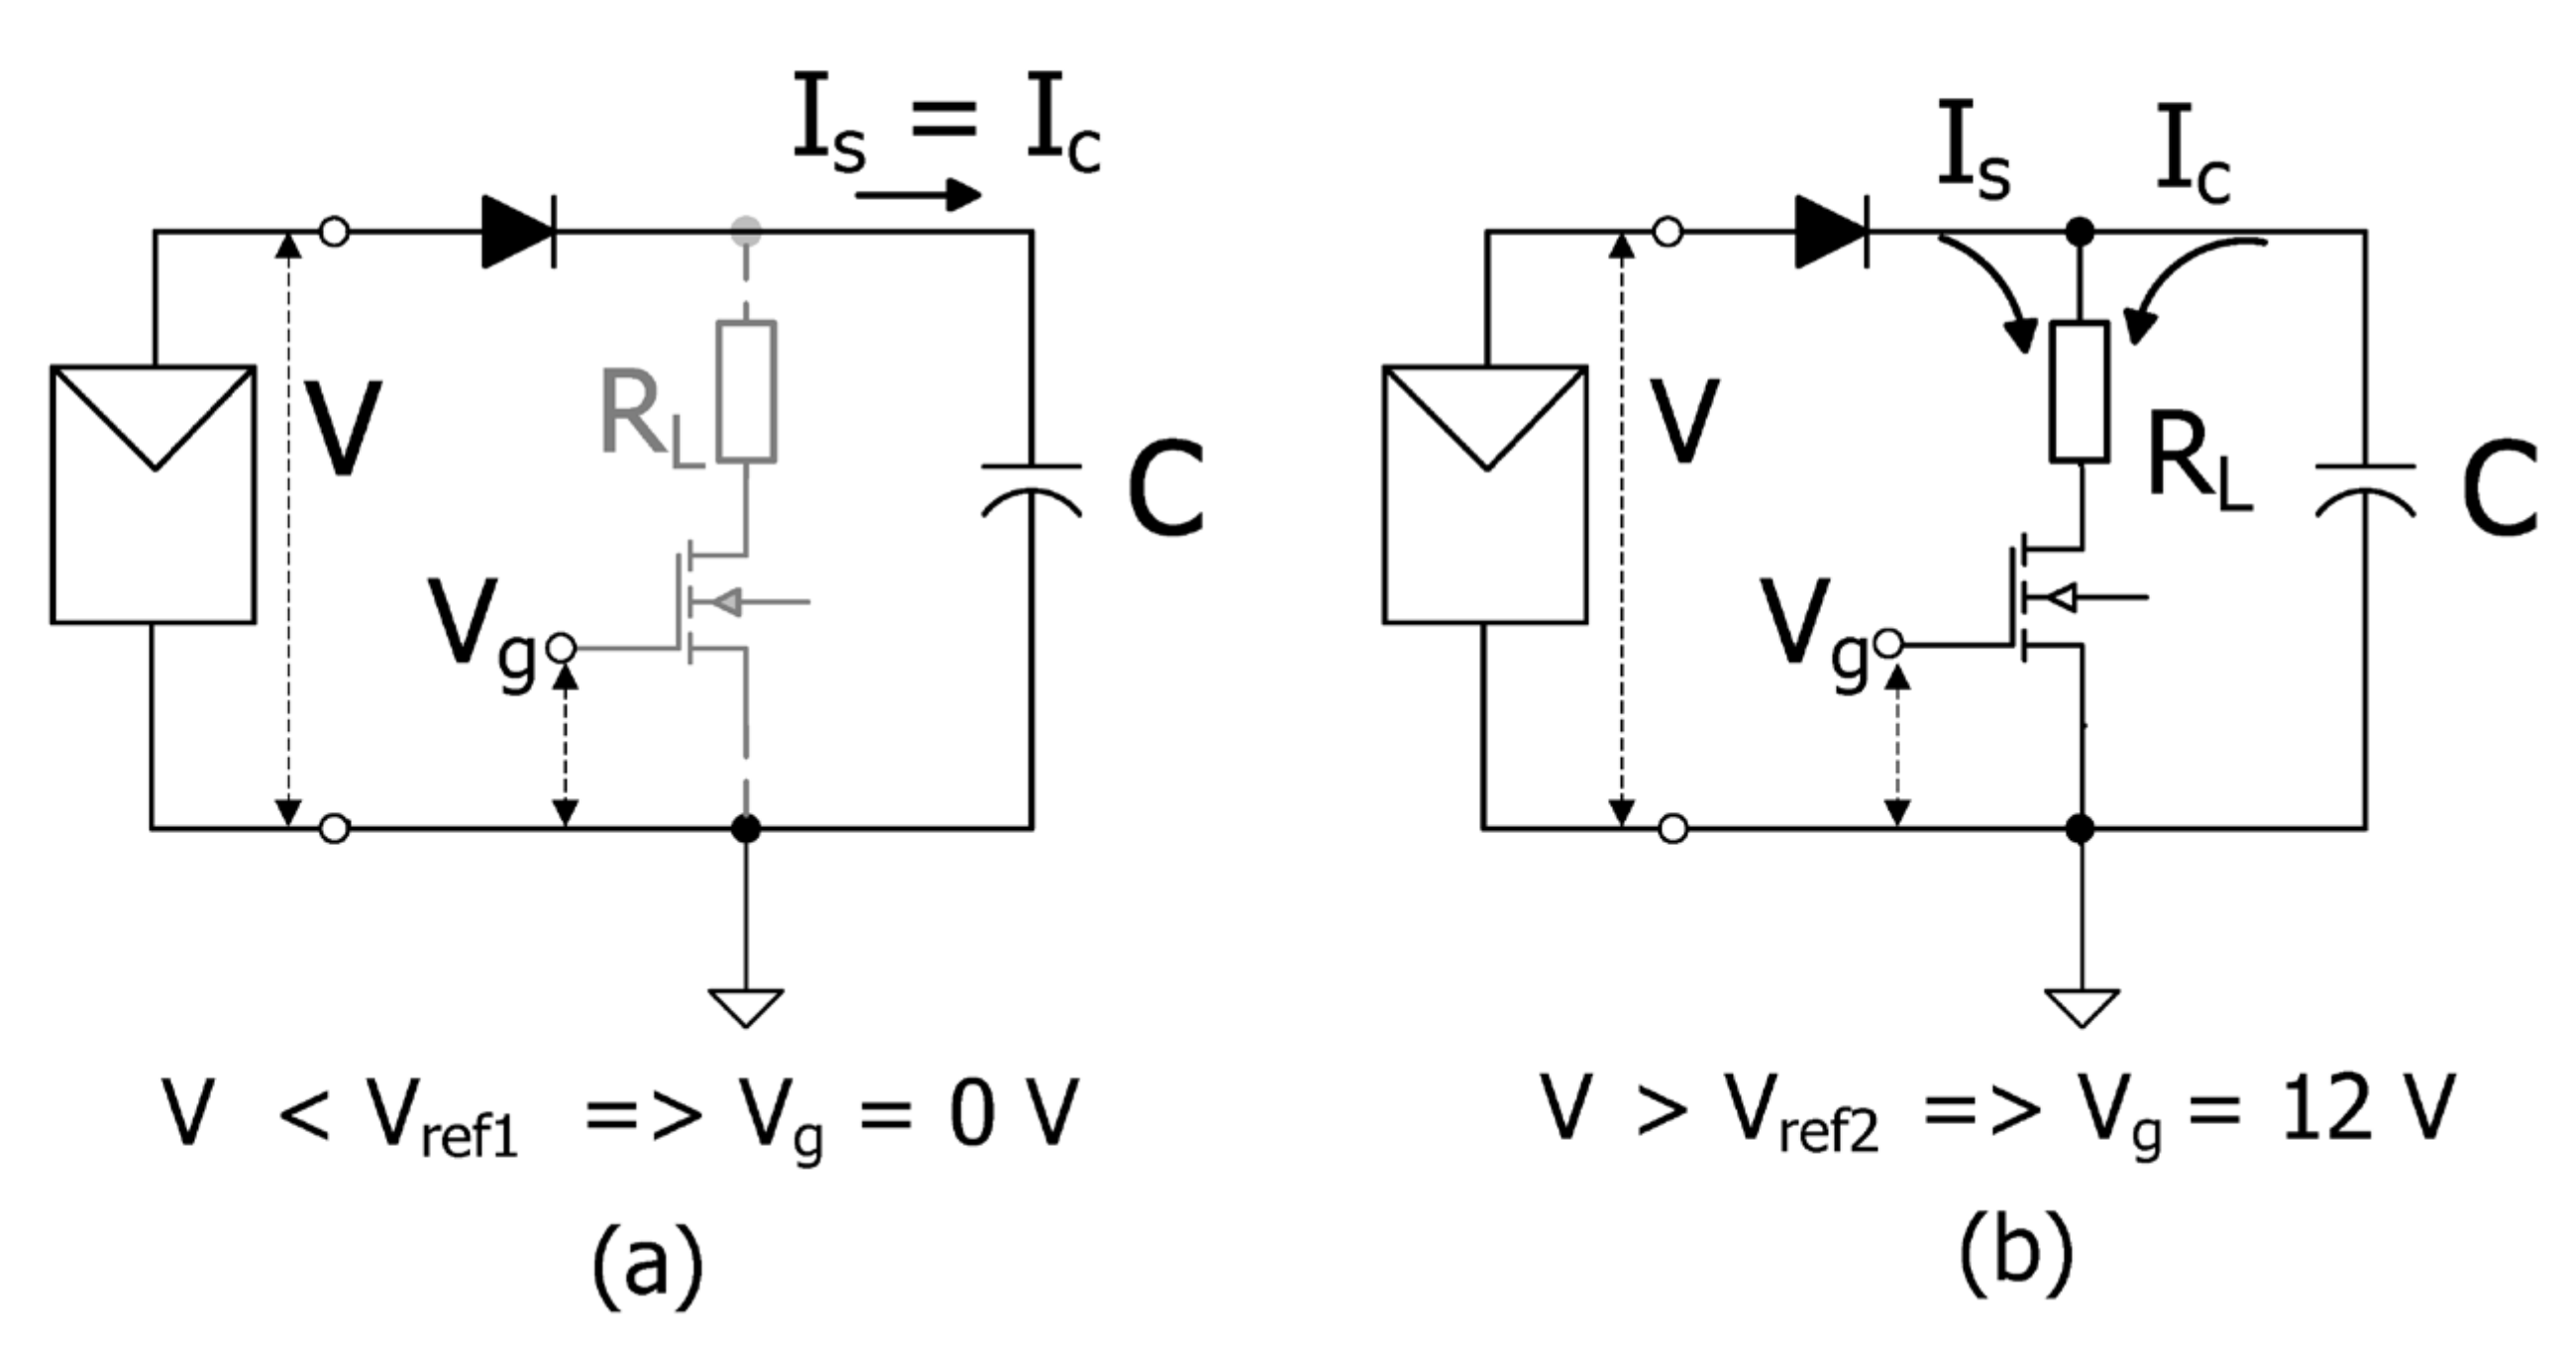
The system’s operation is based on triggering a metal-oxide-semiconductor field-effect transistor (MOSFET) over a thermal heating series resistor. The transistor acts as a switch that is able to open and close the circuit on the load resistance and can also function with different frequencies. This “on” and “off” mechanism produces the charge and discharge of a condenser in parallel with the charge resistor. The electrical configuration is shown in
Figure 4.
The MOSFET conducts or cuts the current depending on the gate voltage, Vg. This gate voltage is produced by the control system, and its value depends on the voltage of the photovoltaic modules.
When the voltage of the photovoltaic modules is inferior to the reference value, V
ref1, the gate voltage will be 0 V. At this point the transistor is not conducting electricity, and the photovoltaic modules’ intensity, I
S, will charge the capacitor, which can be seen in
Figure 4a. The capacitor’s charge curve is shown in
Figure 5, and the equation describing the capacitor charge is shown in (1).
When the voltage of the photovoltaic modules is higher than V
ref2, the gate voltage will be 12 V. Having arrived at this point, the transistor will conduct electricity and the capacitor will deliver a discharge intensity, I
C, over the charge resistance, R
L, which can be seen in
Figure 4b. The capacitor discharge curve is shown in
Figure 5, and the capacitor charge equation is shown in (2). The photovoltaic modules’ intensity I
S, as shown in
Figure 4b, needs to be added to the discharge capacitor current I
C.
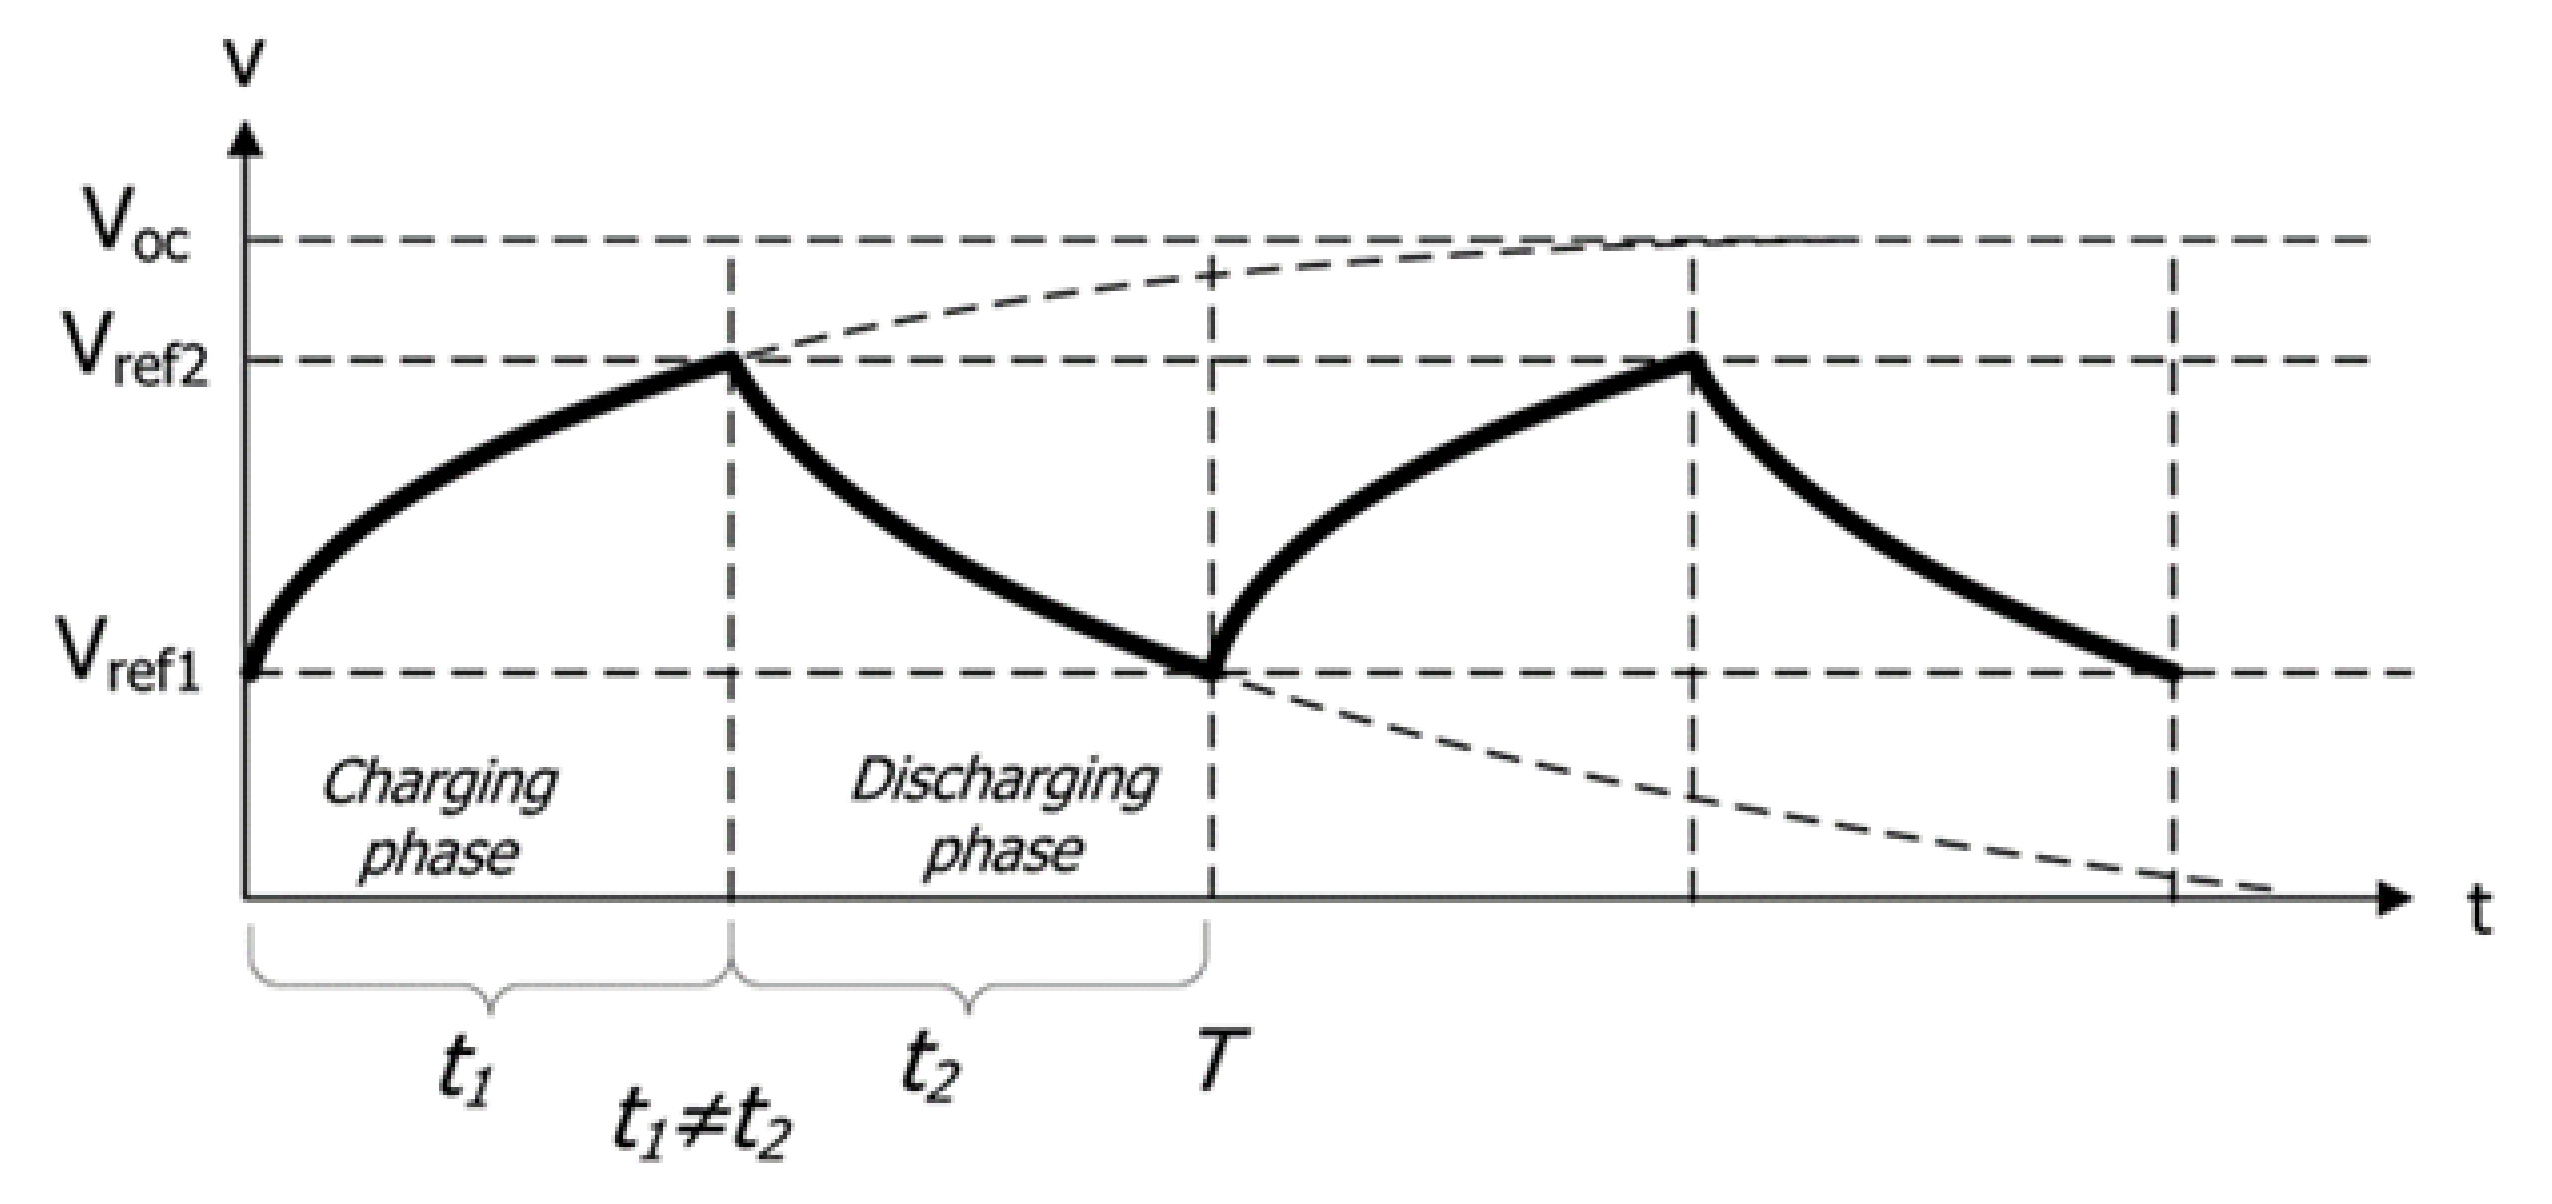
The charge and discharge equations depend on the initial voltage value Vref1 and Vref2, the time elapsed t, and the capacitor’s capacity C. It is worth mentioning how the condenser charge (Equation (1)) depends on RS, which is the internal resistance of the photovoltaic modules plus the electrical wiring, while the discharge (Equation (2)) depends on the load resistance RL. This difference causes different charge and discharge condenser times and, thus, also the so-called “on” and “off” periods.
Thus, there are two ways in which the system operates (on and off periods) that can be distinguished in
Figure 6, where the charge and voltage of the photovoltaic modules are shown.
A more detailed description is offered in
Figure 7. If the MOSFET is on, the voltage of the photovoltaic modules will drop to the intersection point between the system curve VI and the straight line whose slope is 1/R
L, R
L being the charge resistance. On the other hand, when the MOSFET is off, the system’s voltage will reach the system’s maximum voltage, that point being the intersection between the curve and the V axis.
The system needs to keep a voltage equivalent to the maximum power point. Thus, the system is made to oscillate between 2 voltages, Vref1 and Vref2. Vref2 is a voltage higher than the reference voltage, determined by the control system through a hardware configured value. Vref1 is a voltage lower than the reference voltage, determined by the control system through a hardware-configured value. The reference voltage, determined by the control system, is equivalent to the maximum power point’s voltage resulting from the grouping of photovoltaic modules.
When the device is started, the photovoltaic system voltage is at a maximum, and then the photovoltaic system’s voltage, V, is higher than V
ref1, resulting in the condenser being charged at that maximum voltage. When the system’s voltage is higher than V
ref2, the control system triggers the MOSFET gate, and the gate voltage V
g reaches a value near 12 V. The current generated by the photovoltaic system runs across the charge resistance. At the same time, the condenser starts discharging and that discharge current runs across the charge resistance, as shown in
Figure 7. While the current goes through the MOSFET, the condenser lowers its voltage in the same way the photovoltaic modules do.
When the voltage drops until it reaches Vref1, the MOSFET gate is set to “off” because the gate voltage Vg reaches 0 V. The result is that no current moves along the charge. The current generated by the photovoltaic system increases the condenser’s voltage (to a level equal to the voltage at the photovoltaic modules’ terminals). Therefore, while the MOSFET is off, the condenser increases its voltage in the same way the photovoltaic modules do. This voltage surge continues until it reaches Vref2. At that moment, the MOSFET gate is triggered, and the cycle repeats itself.
A cyclic process then takes place, where the system’s voltage oscillates between Vref1 and Vref2. When the voltage moves from Vref2 to Vref1, the MOSFET is on and transferring power, and the condenser discharge current goes through the charge (this discharge causes the charge current to be higher than the current delivered by the photovoltaic modules, but it is limited by the charge’s resistance value). When the voltage moves from Vref1 to Vref2, the current produced by the photovoltaic modules charges the condenser because the MOSFET is off and no current passes through the load resistance.
This on/off process around a specific point, also known as hysteresis, keeps the photovoltaic modules operating around a reference voltage given by the control system.
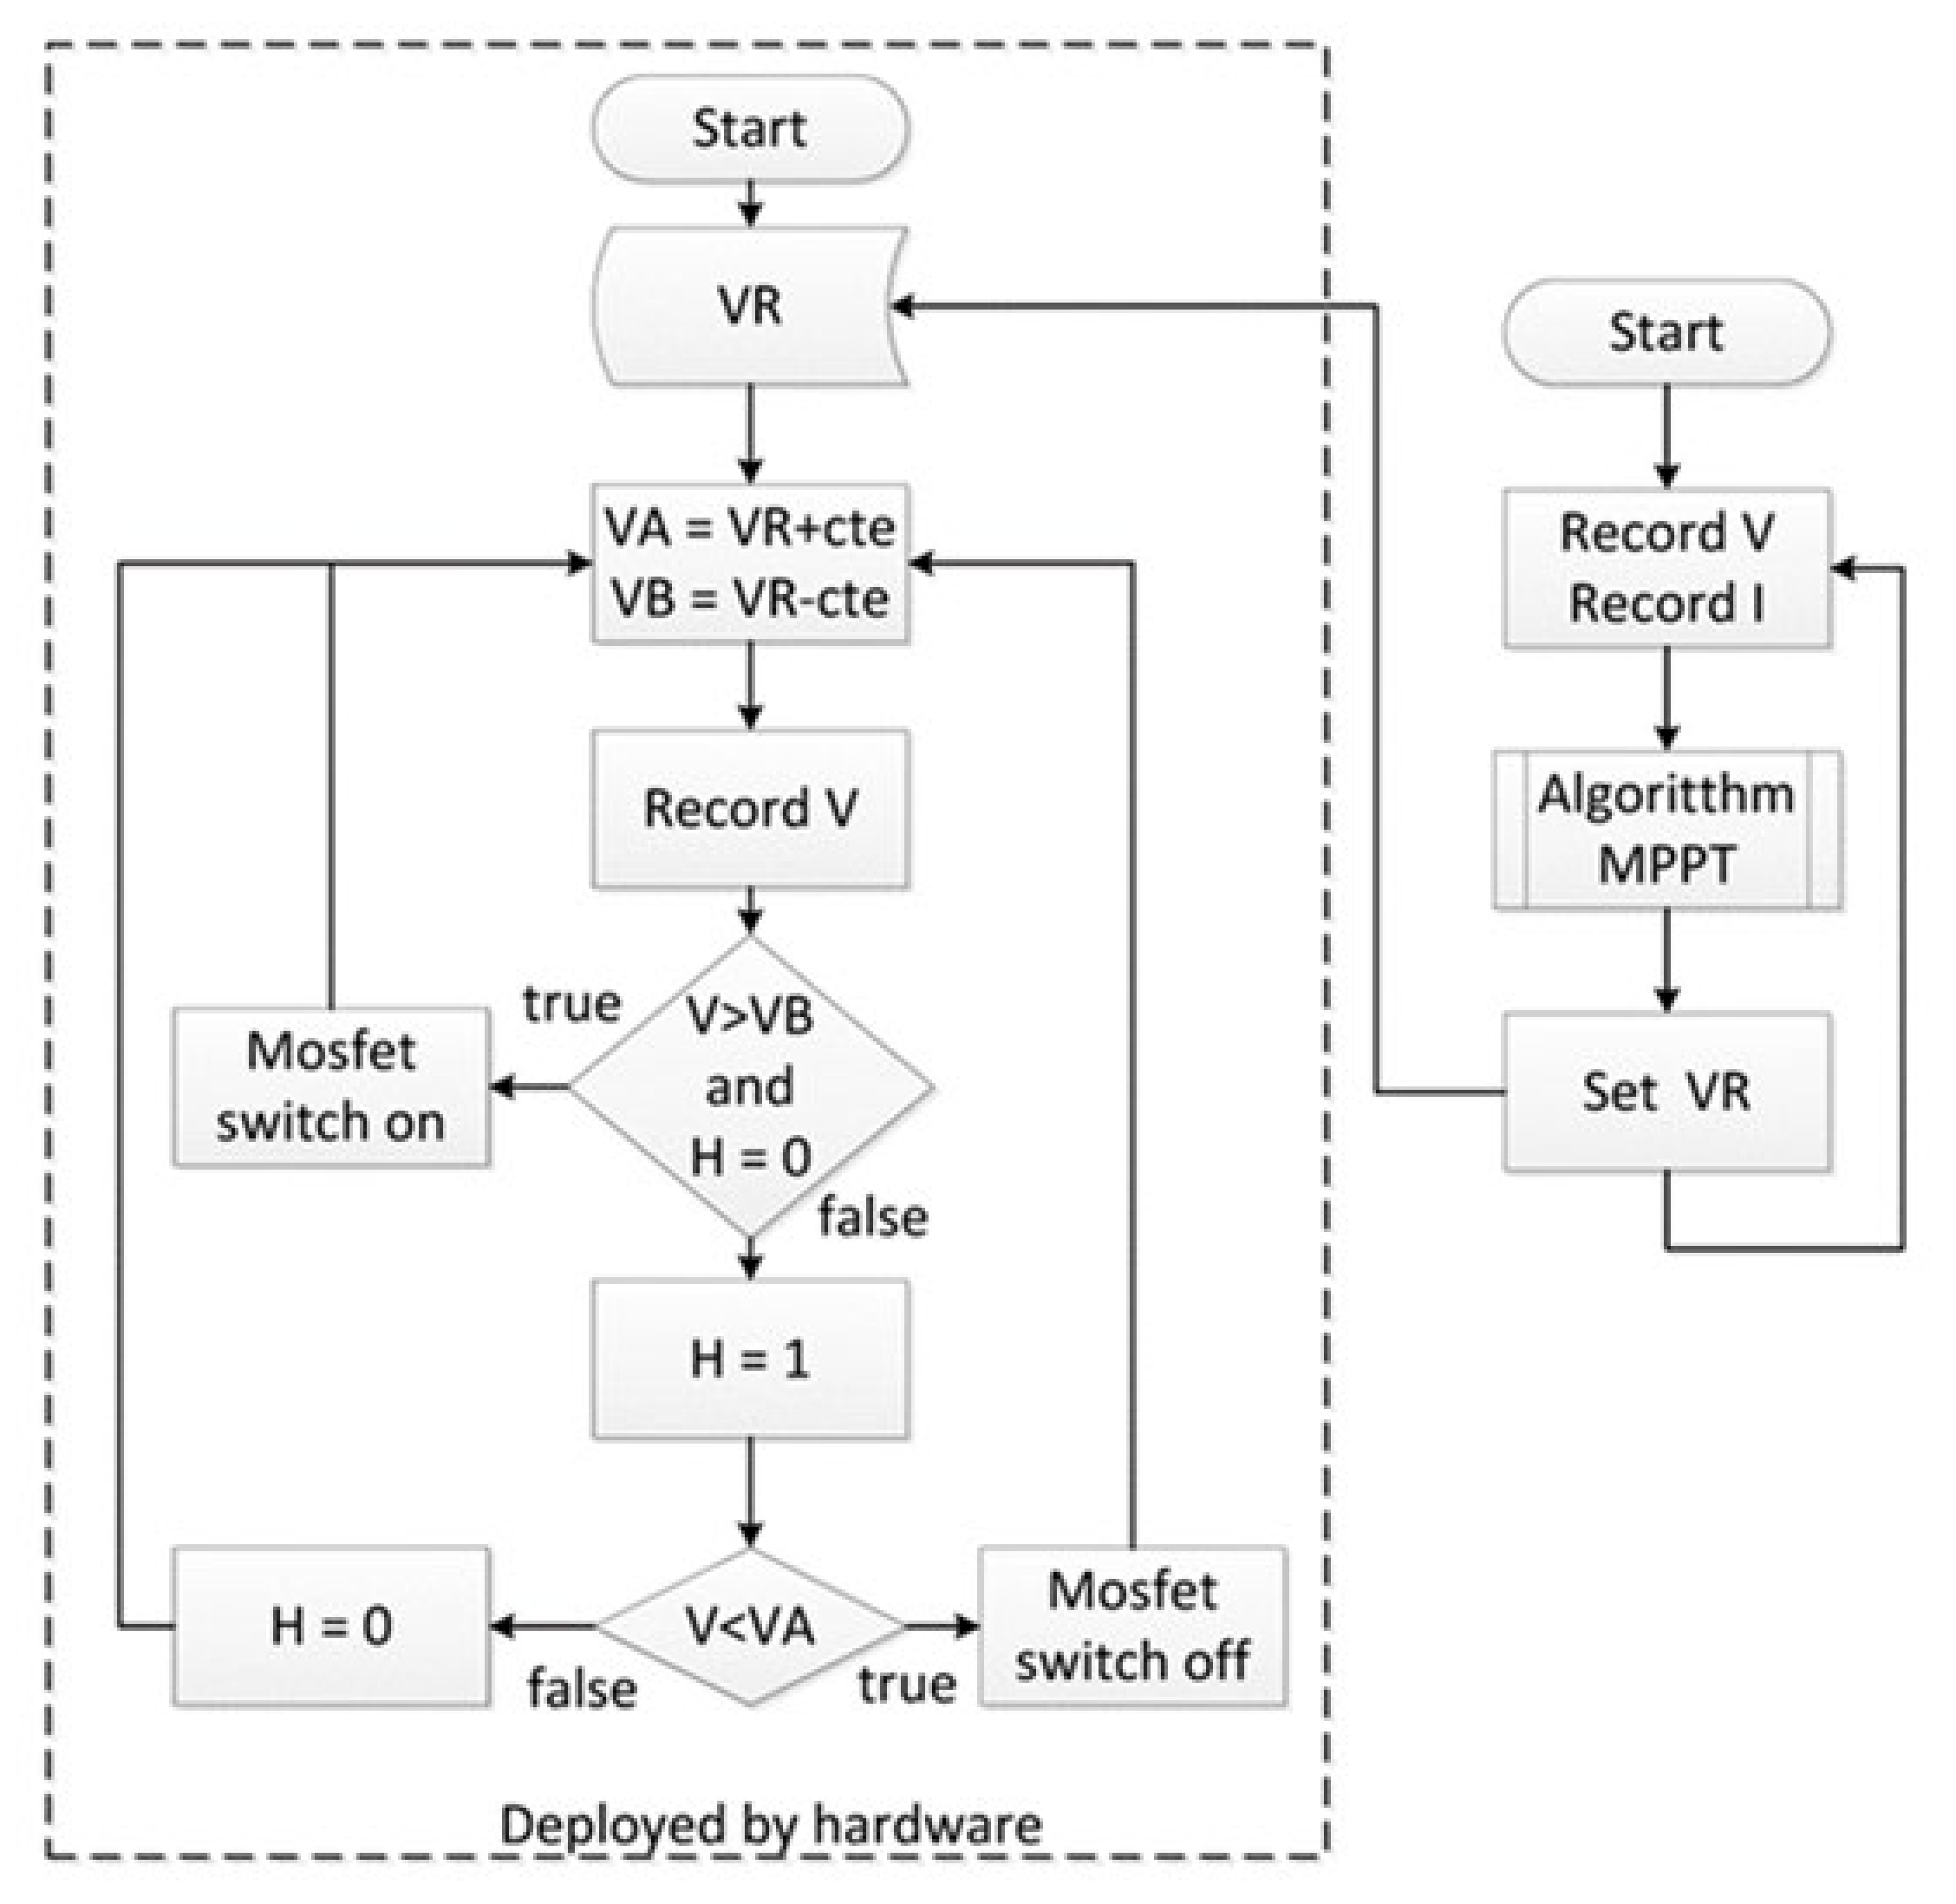
This reference voltage, around which the system oscillates, can be obtained by the system by analyzing the photovoltaic modules’ I-V curve, or, as in our case in hand, it can be a fixed reference voltage. Having a microcontroller in the control system, the required algorithm MPPT can be implemented in order to obtain the reference voltage.
In terms of designing the control blocks (see
Figure 8), there are two parts, differentiated by their implementation. On one hand, there is the control block implemented in the Arduino board and, thus, codified by software. On the other hand, there a control block implemented by hardware.
The Arduino board registers the photovoltaic system’s voltage and intensity in order to execute the MPPT algorithm and to be able to establish the reference voltage.
The hysteresis is implemented by hardware. That makes the photovoltaic system’s voltage oscillate around the reference voltage, as established by the control system.
This separation allows hysteresis at high frequencies and a swift response to the system’s voltage variations because it is not dependent on microcontrollers’ operating cycles. Another advantage is linked to the use of the control system to manage and store data as well as execute temperature control processes; all these benefits are achieved while maintaining the reference voltage.
In order to validate the experiment, a test pilot installation was built so that the obtained results could verify the correct operation of the power control system. The testing device is intended to heat water for domestic use in a 300 L capacity tank.
The system was designed to utilize the maximum amount of solar energy through the following conditions:
The system can operate all day if minimum solar exposure is available.
The system operates in isolation.
The tank holds sufficient capacity to absorb the energy produced by the solar photovoltaic modules on a high radiation day.
The system has been developed so that water consumption can be simulated in order to study the system’s heating capacity in different demand scenarios.
This study can help determine the layout of the solar photovoltaic modules and the definition of SWH installation parameters.
The installation is made of 5 photovoltaic modules connected in series, an experimental electronic control system, with monitoring and control devices, and a DHW tank.
Figure 9 shows pictures of the system, as built in the Hydraulic Engineering Laboratory at Rabanales University campus in Cordoba (Spain), with a latitude of 37.85 degrees North.
Figure 9b. The following elements were included: (1) an electronic system containing a micro-controller, analog electronic section, and capacitor, (2) a heatsink or radiator for diode and MOSFET, (3) the electronic system’s power source, (4) an external computer, used for the display and storage of the experimental measurements collected by the (5) power analyzer.
Table 1 shows the photovoltaic module’s technical characteristics, which, fitted as five identical modules connected in series, will provide the system with 1650 W maximum peak power.
Table 2 shows the tank/water heater electrical features.
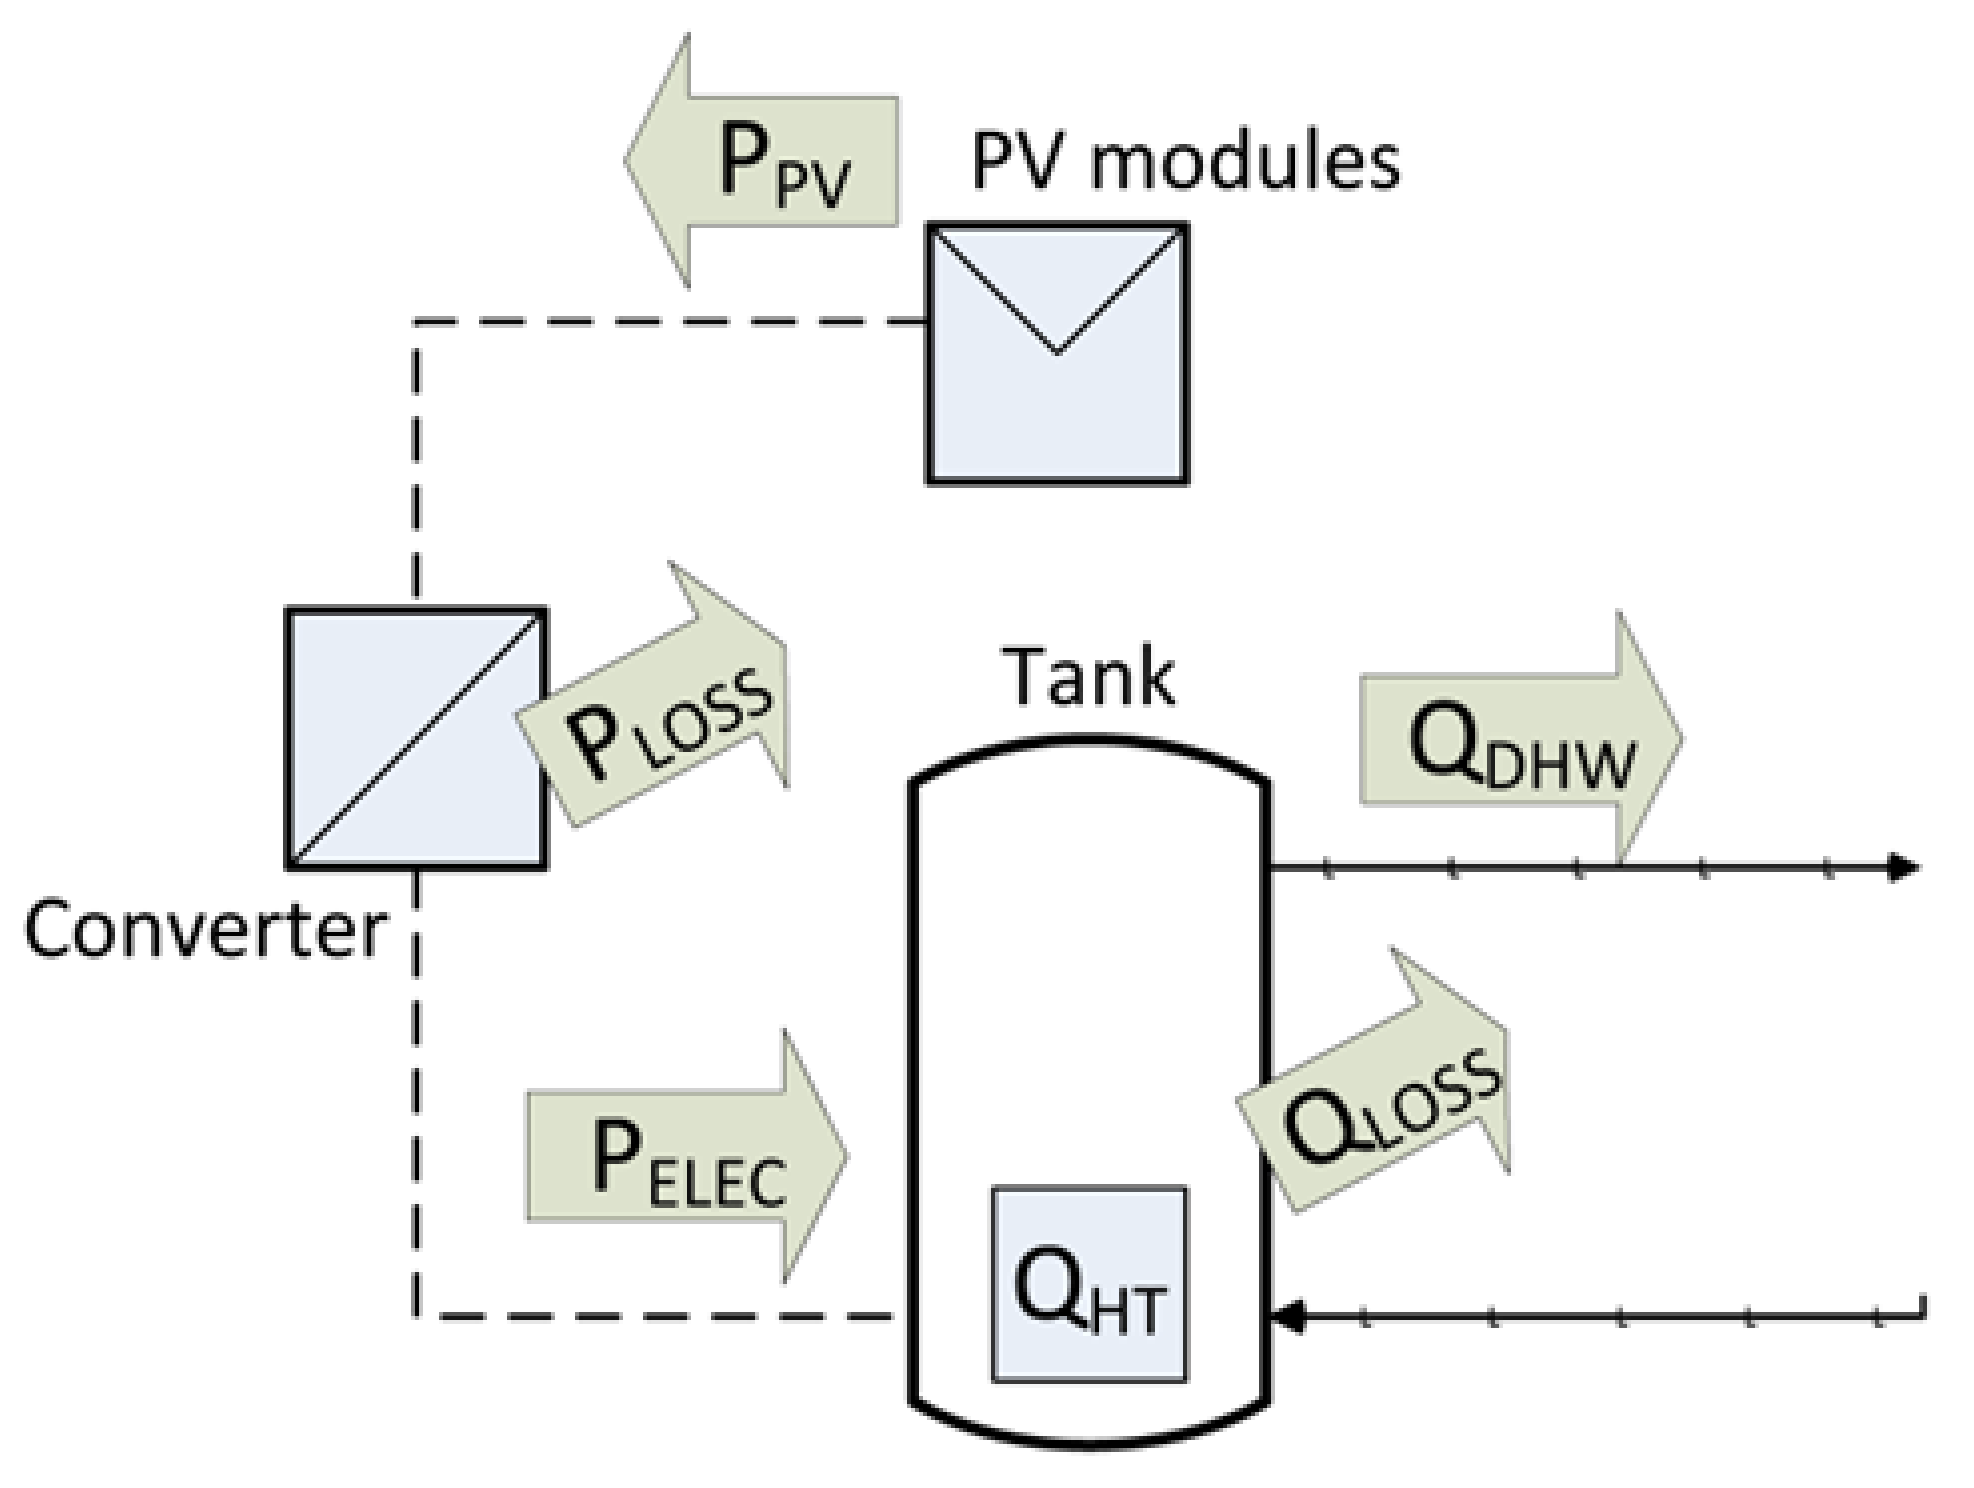
Figure 10 shows the energy flow within the system. The photovoltaic electric energy is adapted by the control system, and the impedance adaptation to power feeds the electrical resistance fitted inside the water tank. The system behaves as an isolated system, without connection to the power grid, and, thus, all the thermal energy is obtained from photovoltaic solar energy.
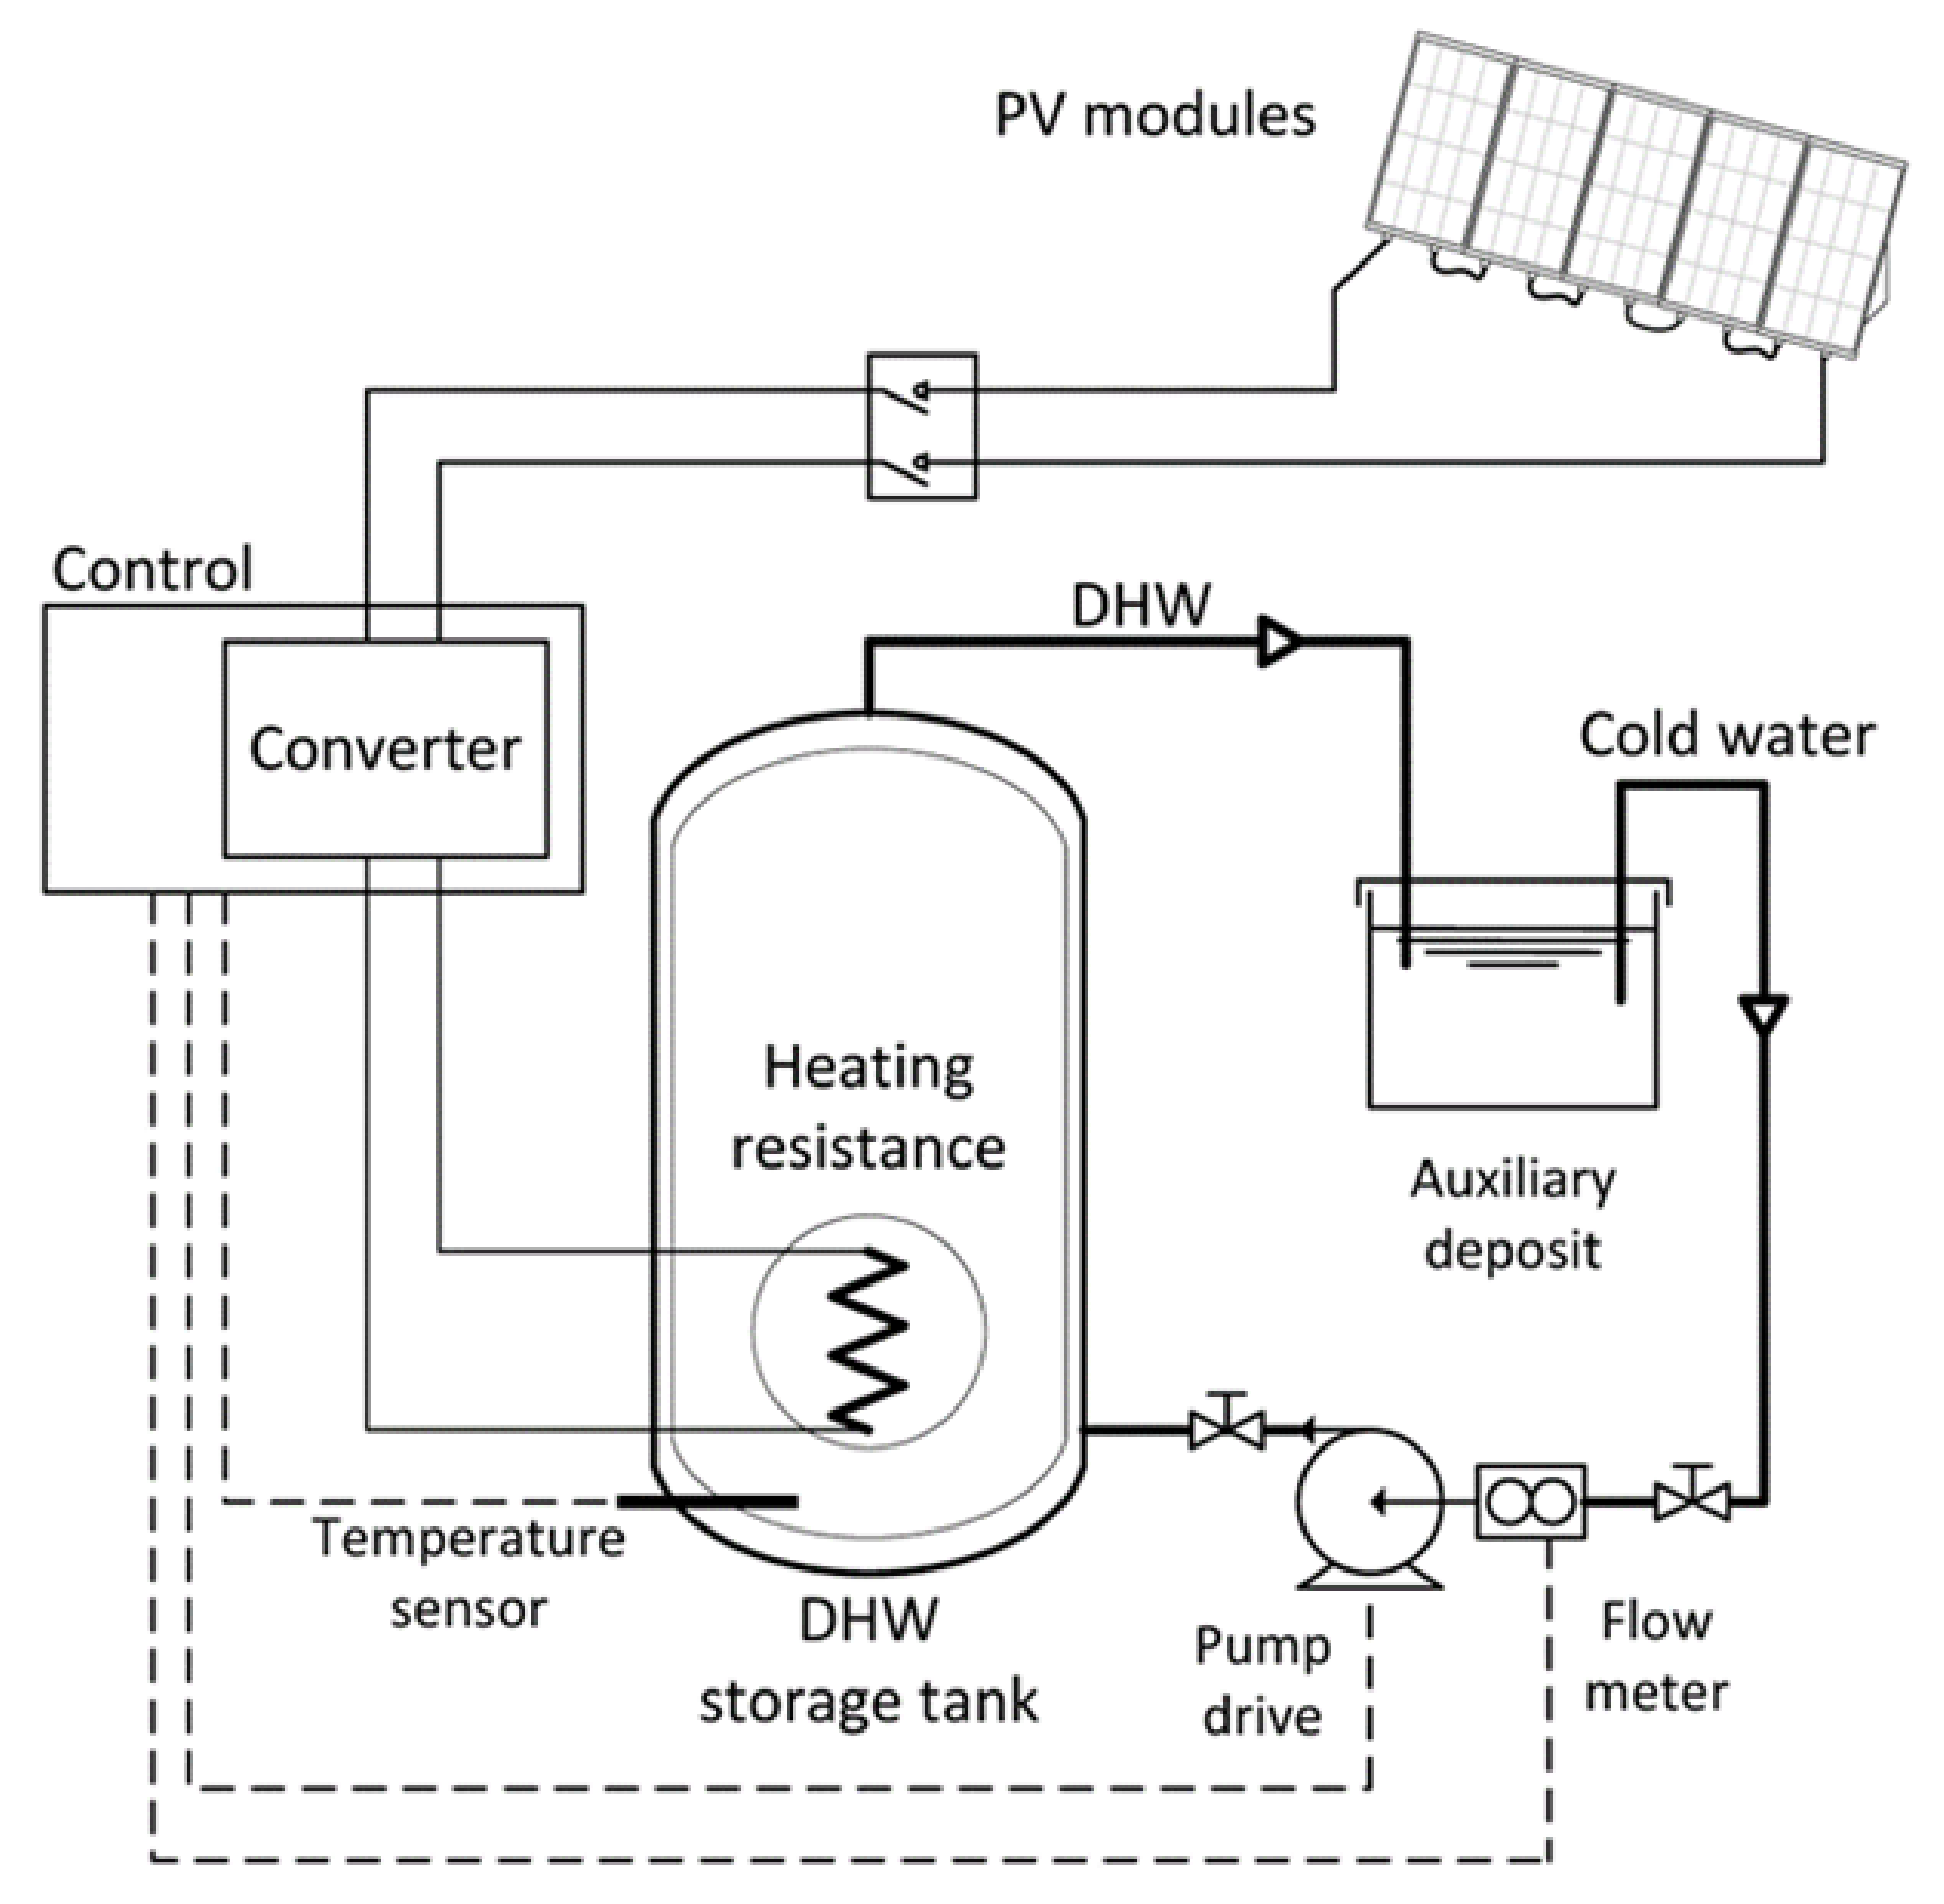
The installation’s layout is shown in
Figure 11, where the system components and their links can be seen. To recreate a water feeding network, an auxiliary recirculation water deposit with a 15,000 L capacity was connected to a recirculation pump so that there was no water consumption during the trials.
The selection of tank capacity was based on the choice of commercial tanks with a sufficiently low electrical resistance. This corresponds to a power of 3000 W, and this power is usually associated with a capacity of 300 L.
Even though there are commercial tanks in the market with capacities of 160, 200, 300, 500, and 750 L and above, the 300 L capacity tank is sufficient to absorb the photovoltaic modules’ energy at any irradiance level. This allows the performance of tests over a whole day, verifying the water heating’s thermal evolution and collecting data uniformly. Thus, the use of an auxiliary pump to empty the tank more than once daily for safety reasons is avoided; this could also interfere with the data collection.
This low electrical resistance is required for a performance factor. For different irradiances throughout the day, the photovoltaic panels have a curve that intersects with the load line at different P
PR points, as shown in
Figure 12. The voltage corresponding to these P
PR points must be lower than the voltage corresponding to the maximum power or P
Pmax points on each curve.
Another element that conditions the capacity of the tank is to have a water capacity large enough to absorb the energy produced by the photovoltaic panels in a day without having to recirculate the water in the tank.
Similarly, the configuration of the electrical connection of the panels responds to several considerations. Five panels were connected in series to achieve a nominal operating voltage close to the electrical network voltage. Likewise, the voltage value obtained must not exceed 220 V nominal from the mains voltage to prevent the electrical components of the system from operating outside their electrical limits.
Another aspect to consider is that this serial configuration means that all the voltages of the different maximum power points for different irradiances must be above the voltage of the P
PR points, as shown in
Figure 12. At maximum irradiance, the P
Pmax point voltage of the PV modules is very close to (but higher than) the P
PR point voltage at the intersection of the load line with the IV curve. If these requirements were not met, there would be situations of irradiation in which not all the available energy would be used.
This serial configuration also seeks to fulfill another feature. The maximum intensity (9 A) resulting from the combination of photovoltaic modules must not be higher than the intensity (13 A) that would circulate through the electric resistance of the tank if it is connected to the electric network. It must also be considered that commercial equipment is being used, which imposes certain operating parameters.
In summary, 5 modules are installed. Those allow a maximum power of 1650 W that, together with the 300 L tank, covers 85% of the annual sanitary hot water consumption of a residence with 6 people.
The system can reach water temperatures above 70 °C, as the specifications indicate Legionella prevention measures in the production of DHW. Since an auxiliary recirculation tank is used, the water’s temperature at the entry point varies between 13 and 25 °C, depending on the season of the year.
The daily average energy needed to heat a 300 L tank, with an increase of 40 °C, is 13.95 kWh/day.
The photovoltaic modules are configured in series as 5 mono-crystalline modules fitted on the building’s roof, facing directly south at an angle of 25°. This configuration in series aims to achieve a 1650 W peak and to present a maximum voltage in an open circuit of 230.95 V DC and a maximum short circuit current of 9.11 A. These electric parameters are close to those of an electric water tank connected to a standard 220/230 V AC power grid.
As the modules are in series, they are connected by electrical cables with only 2 threads into the electronic impedance adaptation system. The adaptor feeds a 16 Ω heating resistance located inside an insulated tank with a 300 L capacity. As stated before, the system is isolated because it is not connected to the power grid, and all the energy produced is obtained from the photovoltaic solar modules. The photovoltaic modules, the tank, and the heating resistance are commercially available models.
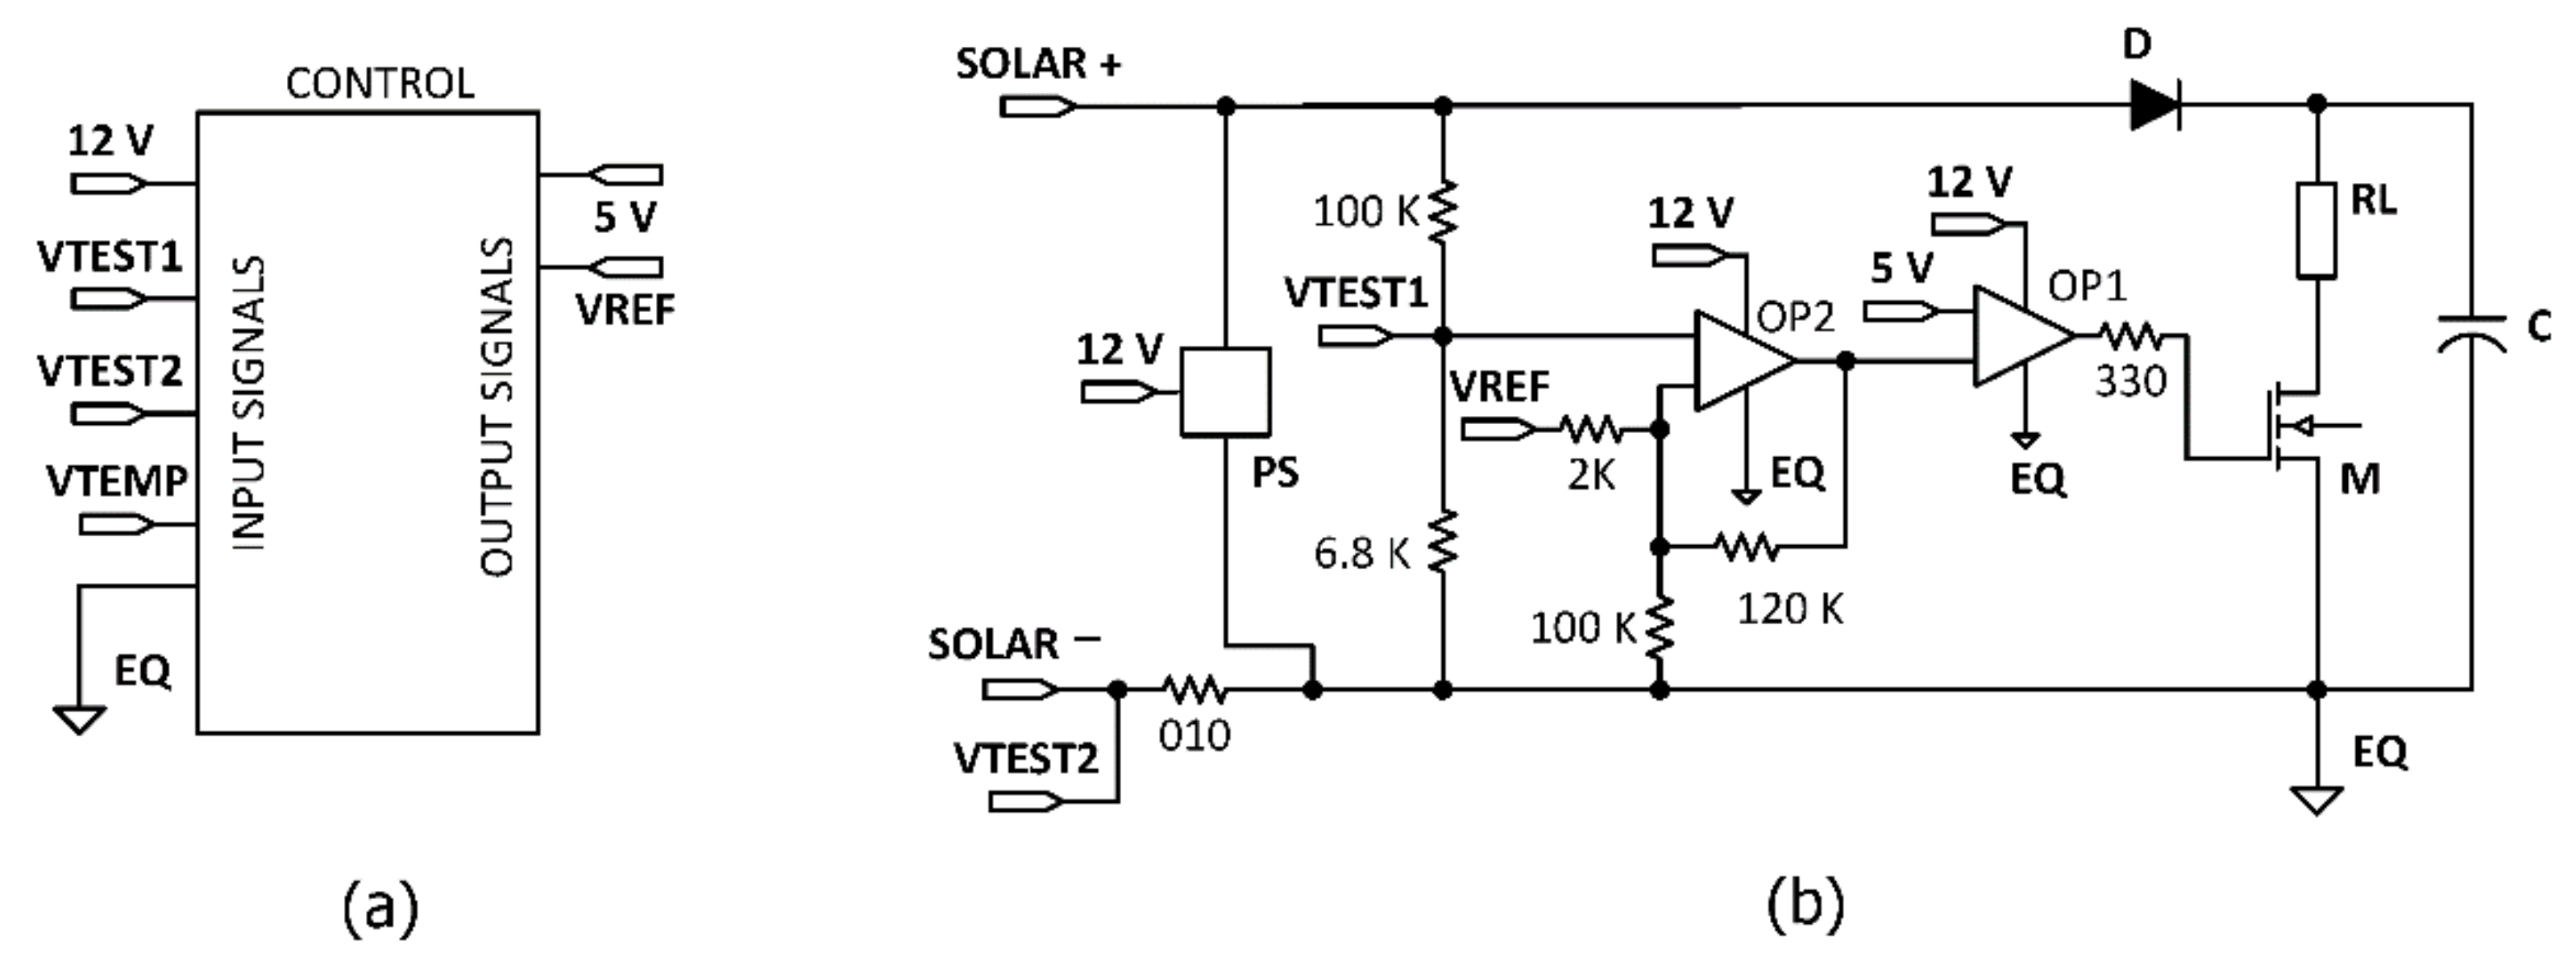
From an electronic point of view, it could be said that the electronic system, which can be seen in
Figure 13, is made of 2 subsystems, a power subsystem, and a control subsystem.
As shown in
Figure 13, the entry signals managed by the system are represented by: EQ-system’s equipotential voltage, VTEMP-temperature sensor’s voltage, VTEST1-adapted voltage from the group of photovoltaic panels, VTEST2-reference voltage with regard to the system’s current EQ, and 12 V DC to power the system. The exit signals are represented by the VREF as system’s control voltage and 5 V DC as the reference voltage for generating the MOSFET’s command signal. Finally, the solar label represents the output of the group of photovoltaic modules, and “PS” is the power supply responsible for generating 12 V DC.
The electronic power subsystem is made of a high-efficiency anti-circulation diode model STTH20R04, a 1000 µF capacitor, a MOSFET model FDL 100N50F, and a 17.6 Ω thermal resistance (in charge of transferring heat to the water in the tank). The electric current produced by the photovoltaic modules will run through these components.
The electronic system’s core is made of an open-source electronics platform belonging to the Arduino family. This platform has a micro-controller inside that can be programmed. The core is connected to a digital to analog converter (DAC) model, DAC 4725, through communications I2C (in order to generate the reference voltage) and an analog to digital converter (ADC) model, ADS1115 (to measure the photovoltaic modules’ current). Operational amplifiers (LM234) are also fitted to compare the photovoltaic modules’ real voltage and the reference voltage.
To set the solar system at MPPT, the operational amplifiers monitor the photovoltaic system voltage; they compare it with the reference voltage that is generated by the Arduino board and moves through the DAC. One of the operational amplifiers is configured as a Schmitt trigger (through resistances R1, R2, and R3) to achieve the required hysteresis. The second amplifier is configured as an inverter-tracker to transmit a trigger signal consistent with the MOSFET. The configuration as a Schmitt trigger causes hysteresis in the MOSFET trigger process, making sure that the current oscillates around the reference voltage.
This continuous comparison triggers the MOSFET. The sequence on/off ensures that the photovoltaic system maintains a voltage around the maximum power point so that all the available photovoltaic energy is used.
The control system, while generating the reference voltage, controls the tank’s temperature through a sensor, DS18B20, so that this temperature can be monitored and maintained; it can also stop the system if the safety temperature threshold is exceeded.
The electronic control system feeds directly from the photovoltaic modules through a commercial power source with a 100–230 V input margin and a stable output of 12 V DC. This electrical source can feed the electronic control board and gate voltage or the MOSFET trigger point. Thus, the system is independent of external electric energy sources.
The electronic system is located between the photovoltaic solar modules and the heating resistance; its role is to obtain the maximum amount of energy off the solar modules and, at the same time, to control the system’s temperature and monitor the required control data.
The test facility also has a water recirculation system to allow the input of cold water in the DHW tank and simulate water consumption and water renovation inside the tank. This recirculation system is fitted with a small water pump connected to the power grid since it is a system that simulates a real hydraulic network. In a real case scenario, the hydraulic network would provide the necessary water pressure without needing an external water pump.
In order to establish the specific experimental operating conditions, water circulation is established by starting the recirculation pump by a relay connected to the Arduino microcontroller fitted in the electronic system. This will allow the simulation of hot water consumption of the return to predetermined initial temperature conditions.
The electrical parameters will be measured by a POWER ANALYZER PCE-PA6000 measuring device. The current and voltage provided by the photovoltaic modules are measured by this device, which will record intensity and voltage values every 2 s in a standard computer. The tank’s temperature is recorded every minute by a DS18B20 probe, and it is transferred to the microcontroller for storage in a removable device or transmission to the cloud. Likewise, the control board can also transfer the data by Ethernet or WIFI, allowing access to the platform from the cloud.
The calculation of the thermal energy Q produced can be done directly by measuring the water temperature inside the tank and applying Equation (3)
m being the mass of water inside the tank; Ce, the water’s specific heat; and ∆T, the difference of temperature in the tank following the application of the energy produced by the photovoltaic modules.
The water temperature is measured by the DS18B20 probe; this is introduced inside the tank through the receptacle provided.
The energy loss of the water in the tank cannot be measured easily. Initially, it was considered negligible due to the fact that a conveniently isolated commercial tank is being used, although water loss estimations could be established.
The thermal energy produced can be compared with the electric energy produced by the photovoltaic modules so that the system’s yield can be established. By measuring the photovoltaic voltage obtained by the POWER ANALYZER PCE-PA6000 measuring de-vice at time intervals and integrating the curve in an established period of time, we can get the energy produced by the system in that period of time.
3. Results
We aim to verify the system’s feasibility by gathering the experimental results, both for its stable and efficient functioning as well as its heating capabilities. The trials were conducted under real solar exposure conditions.
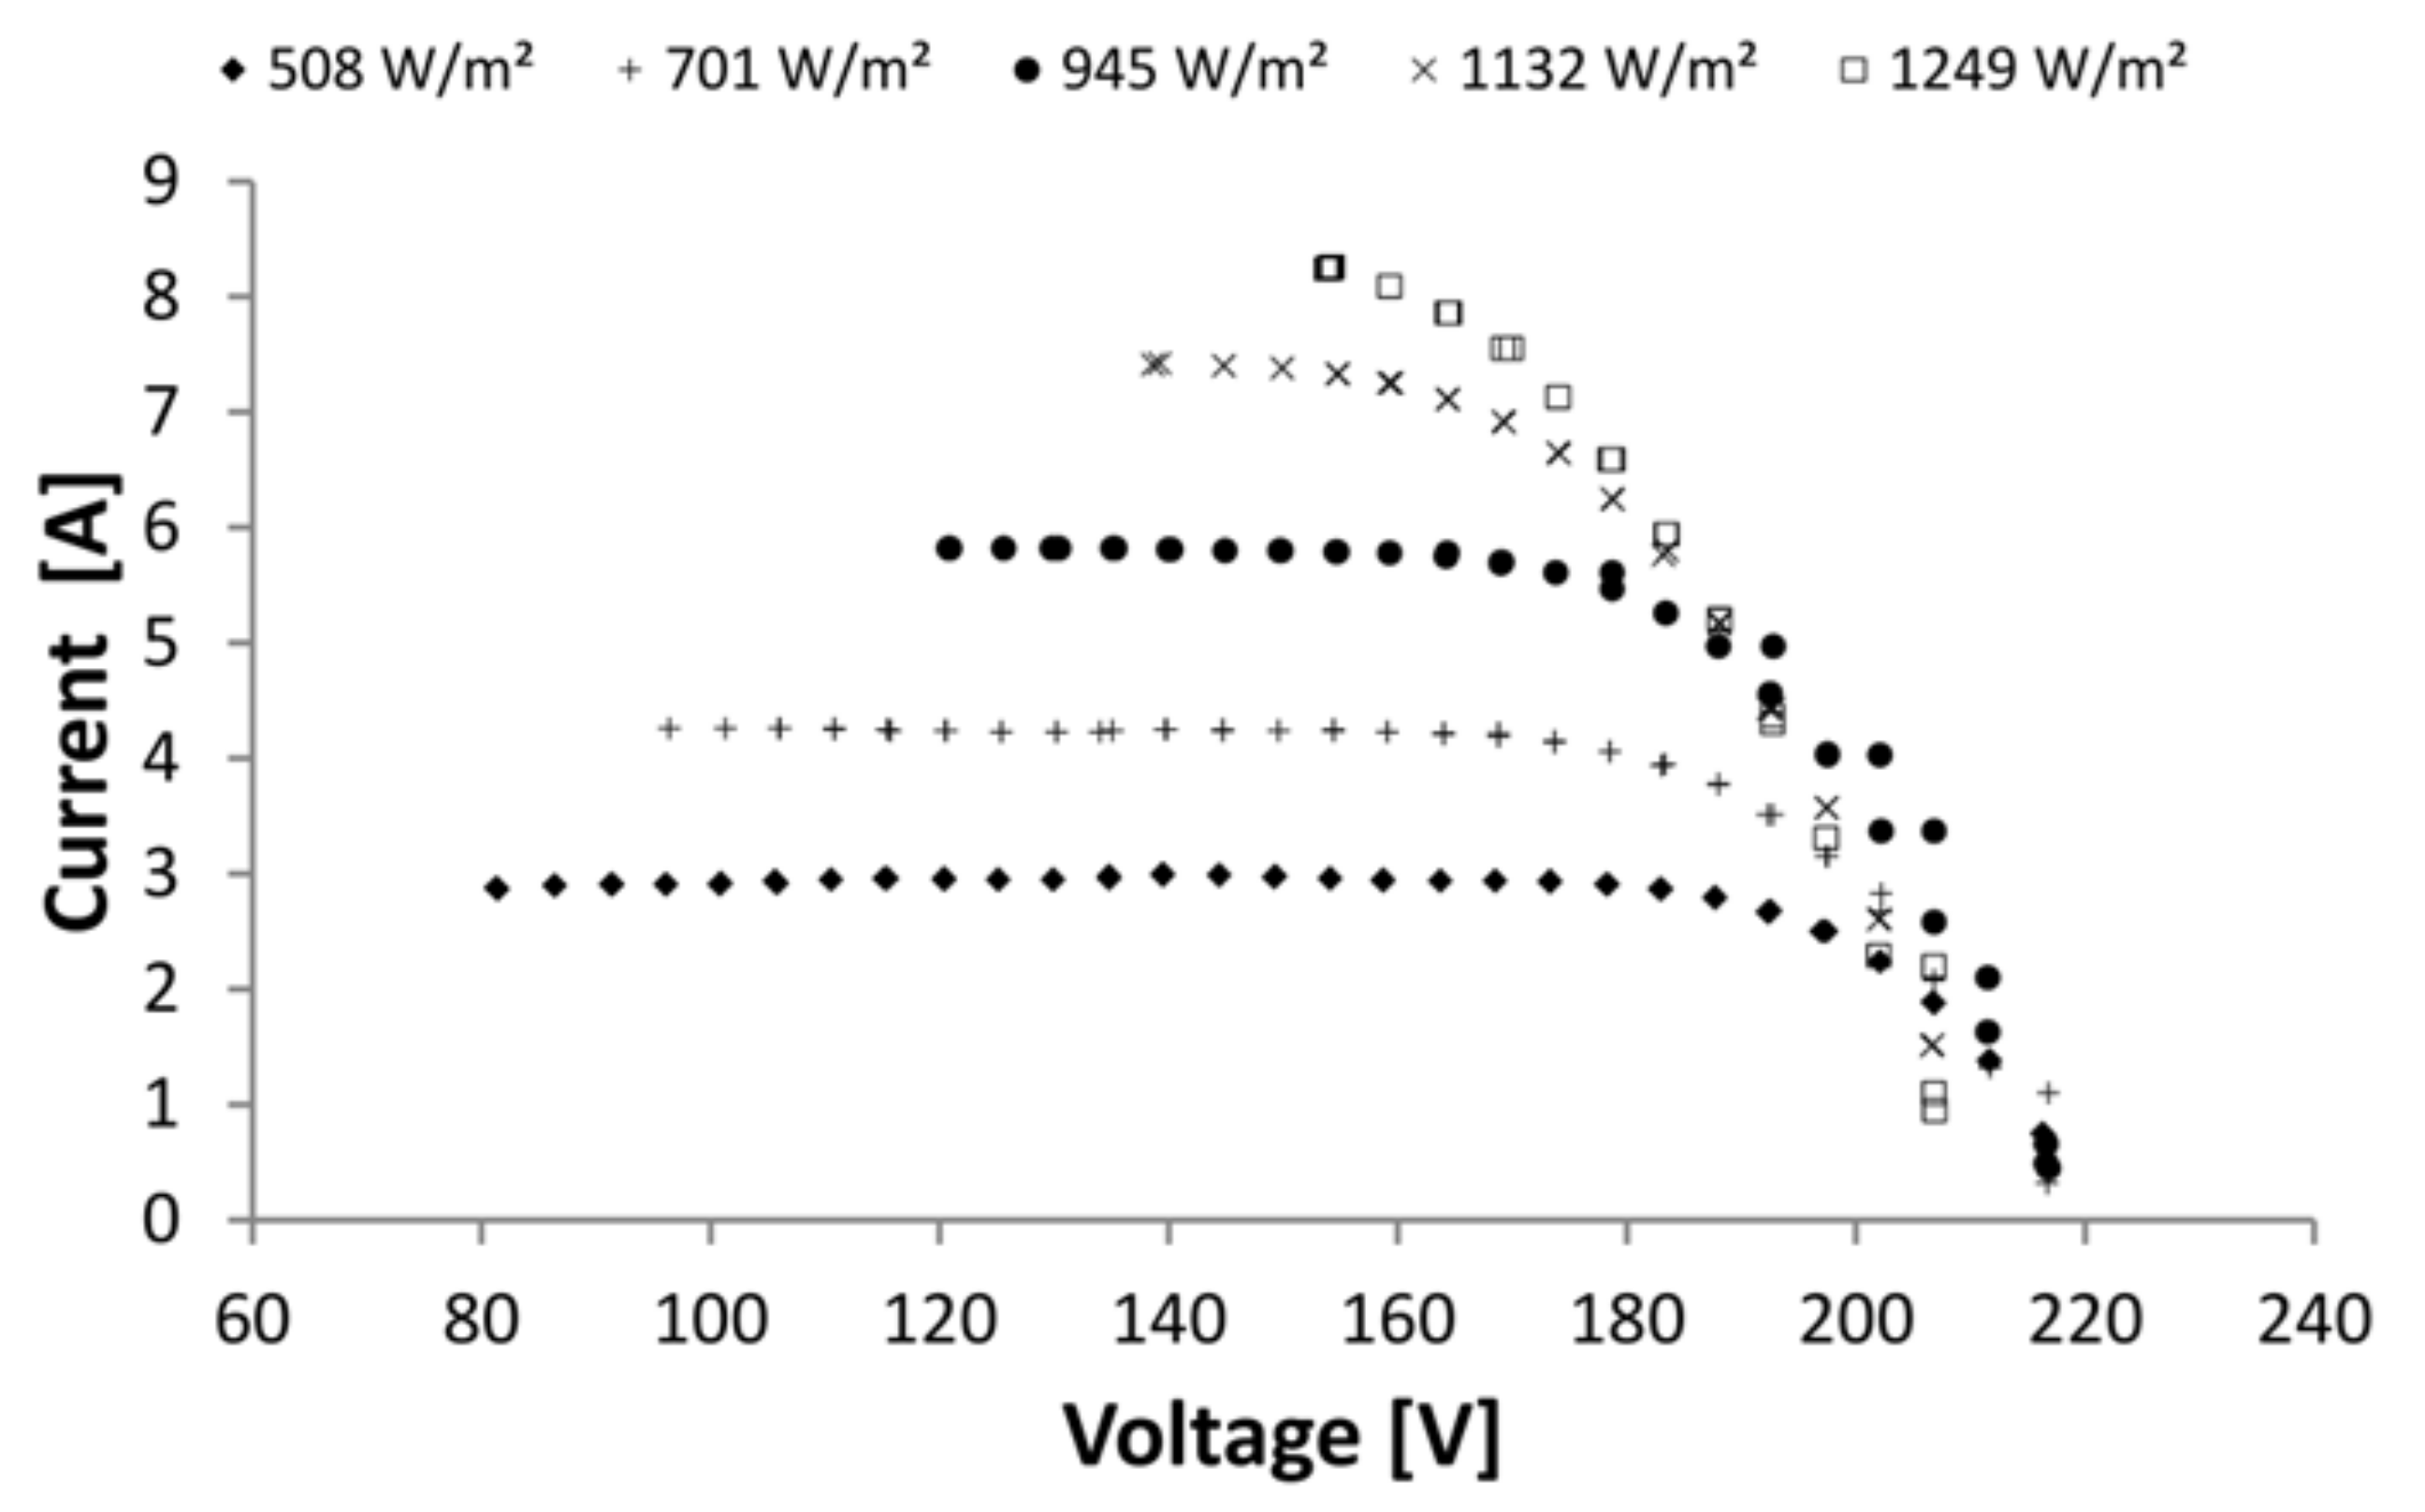
Figure 14 shows how the system is able to record and monitor the I-V curves. For this purpose, measurements were taken every 30 min on a clear day. The control system varies the reference or operating voltage, and it measures the intensity produced by the photovoltaic modules. This means that the modules’ operating point can be managed to achieve the maximum power for the different solar radiation levels during the day. In any case, the records are completely compatible with the system’s theoretical characteristics as far as the voltage and intensity are concerned.
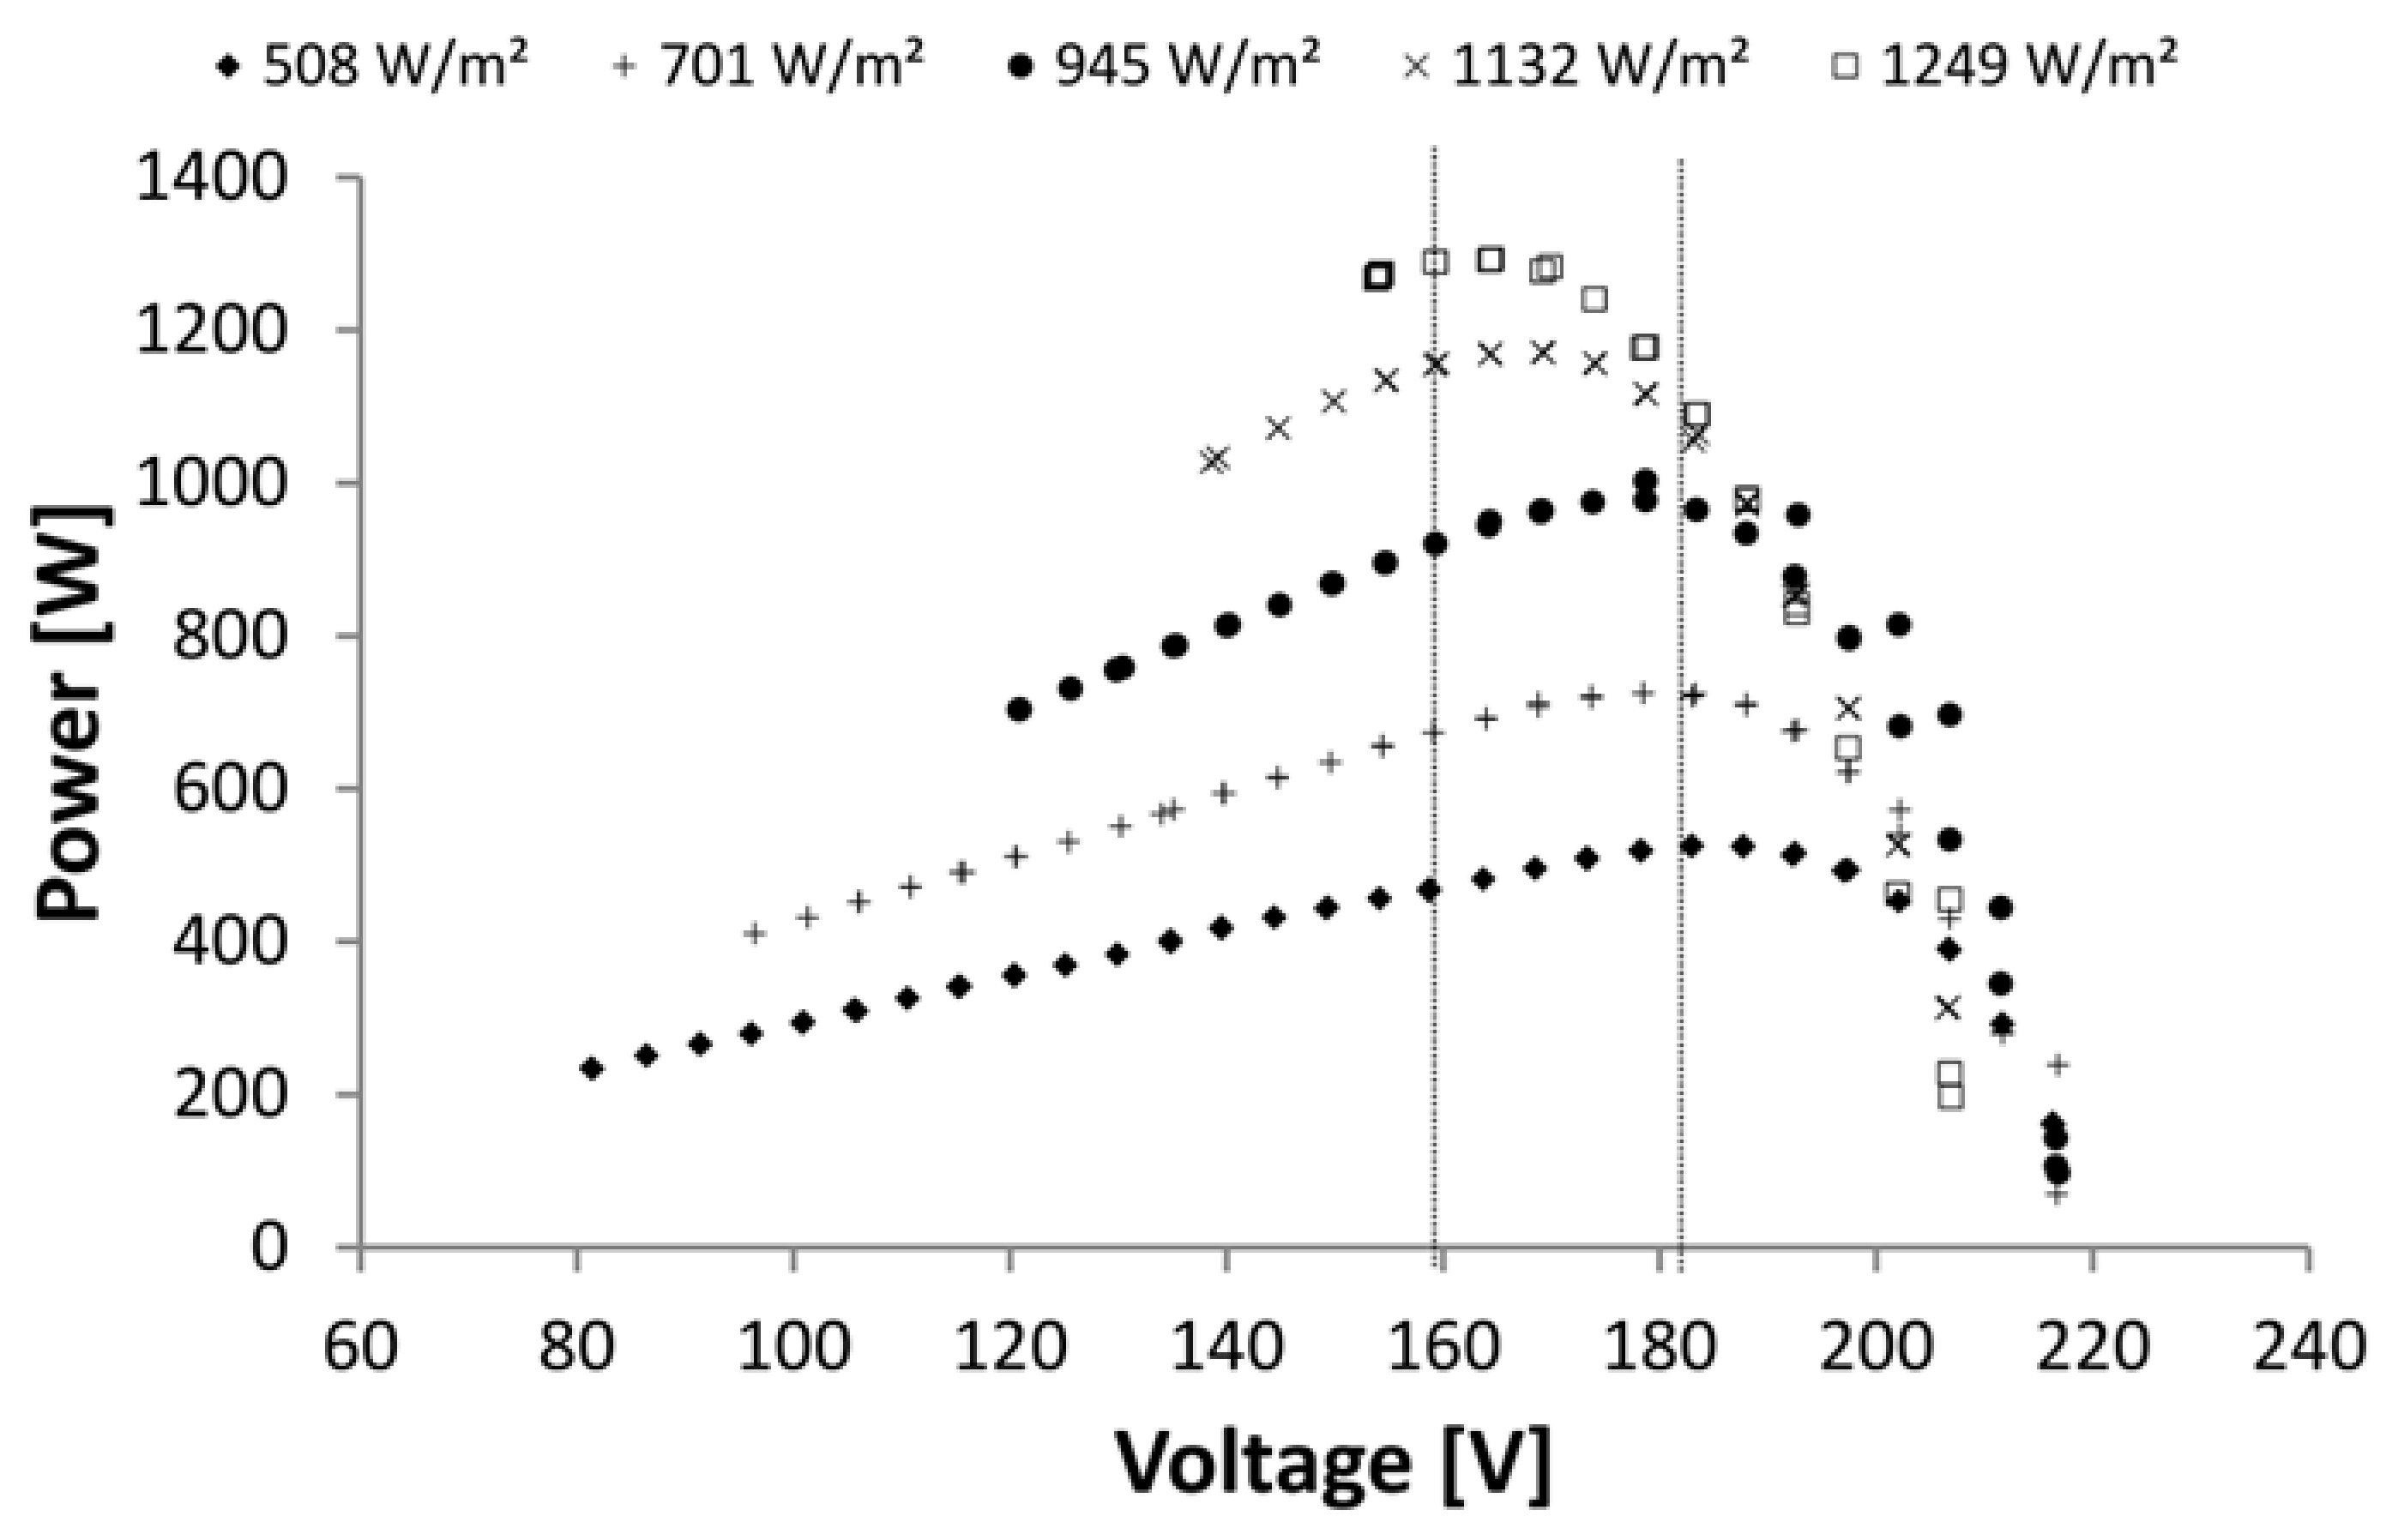
Figure 15 shows the curves linking the system’s power and the operating voltage. Each one of the curves refers to a different solar radiation level. It is noteworthy that the system’s maximum power zone is located in an approximate voltage scope, between 160 and 185 V, depending on the radiation. Given that the system is able to detect V-I curves, it is then able to reach and maintain the reference voltage to achieve maximum power. The voltage from the previously mentioned scope can be varied to adapt to the different radiation levels.
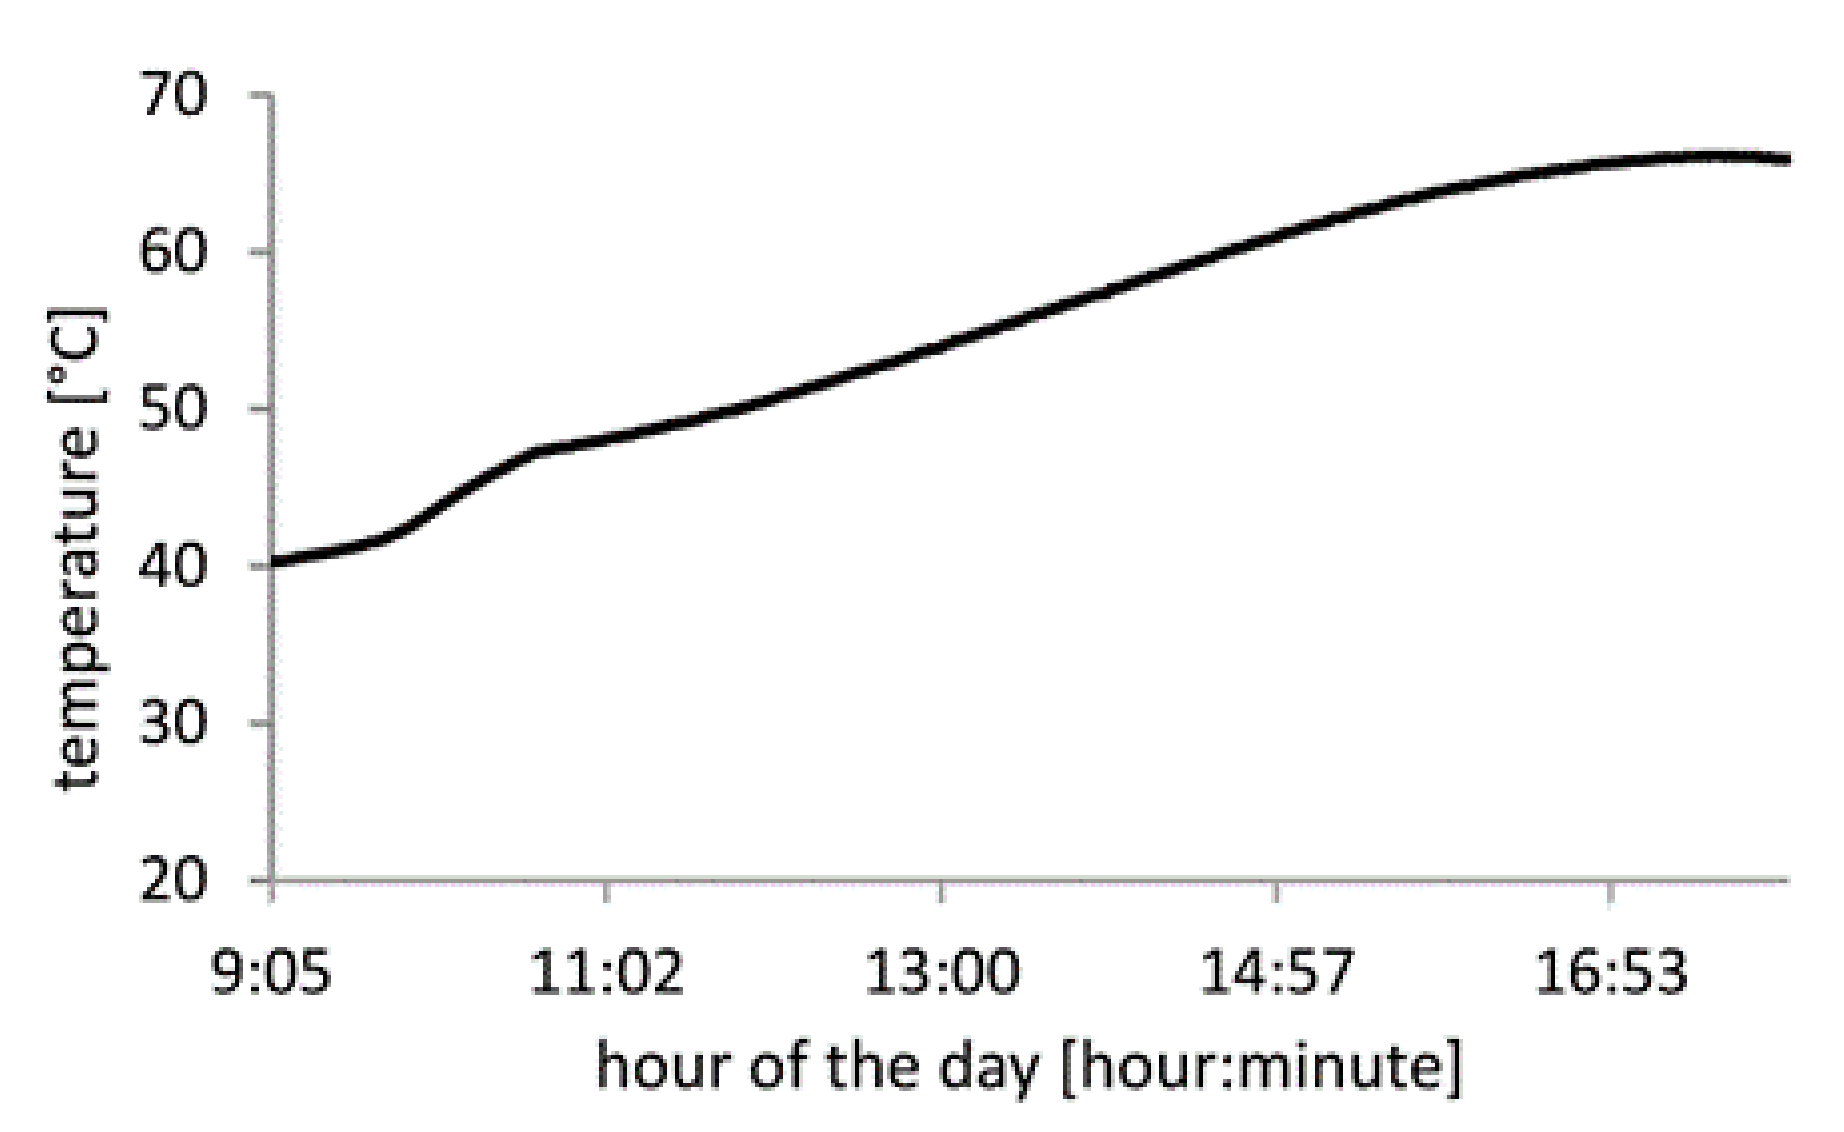
Figure 16 shows the water temperature’s evolution on a clear winter’s day. The data were collected once every minute. The diagram shows how the system can operate in temperatures between 60 and 70 °C, which are the required operational ranges for DHW systems.
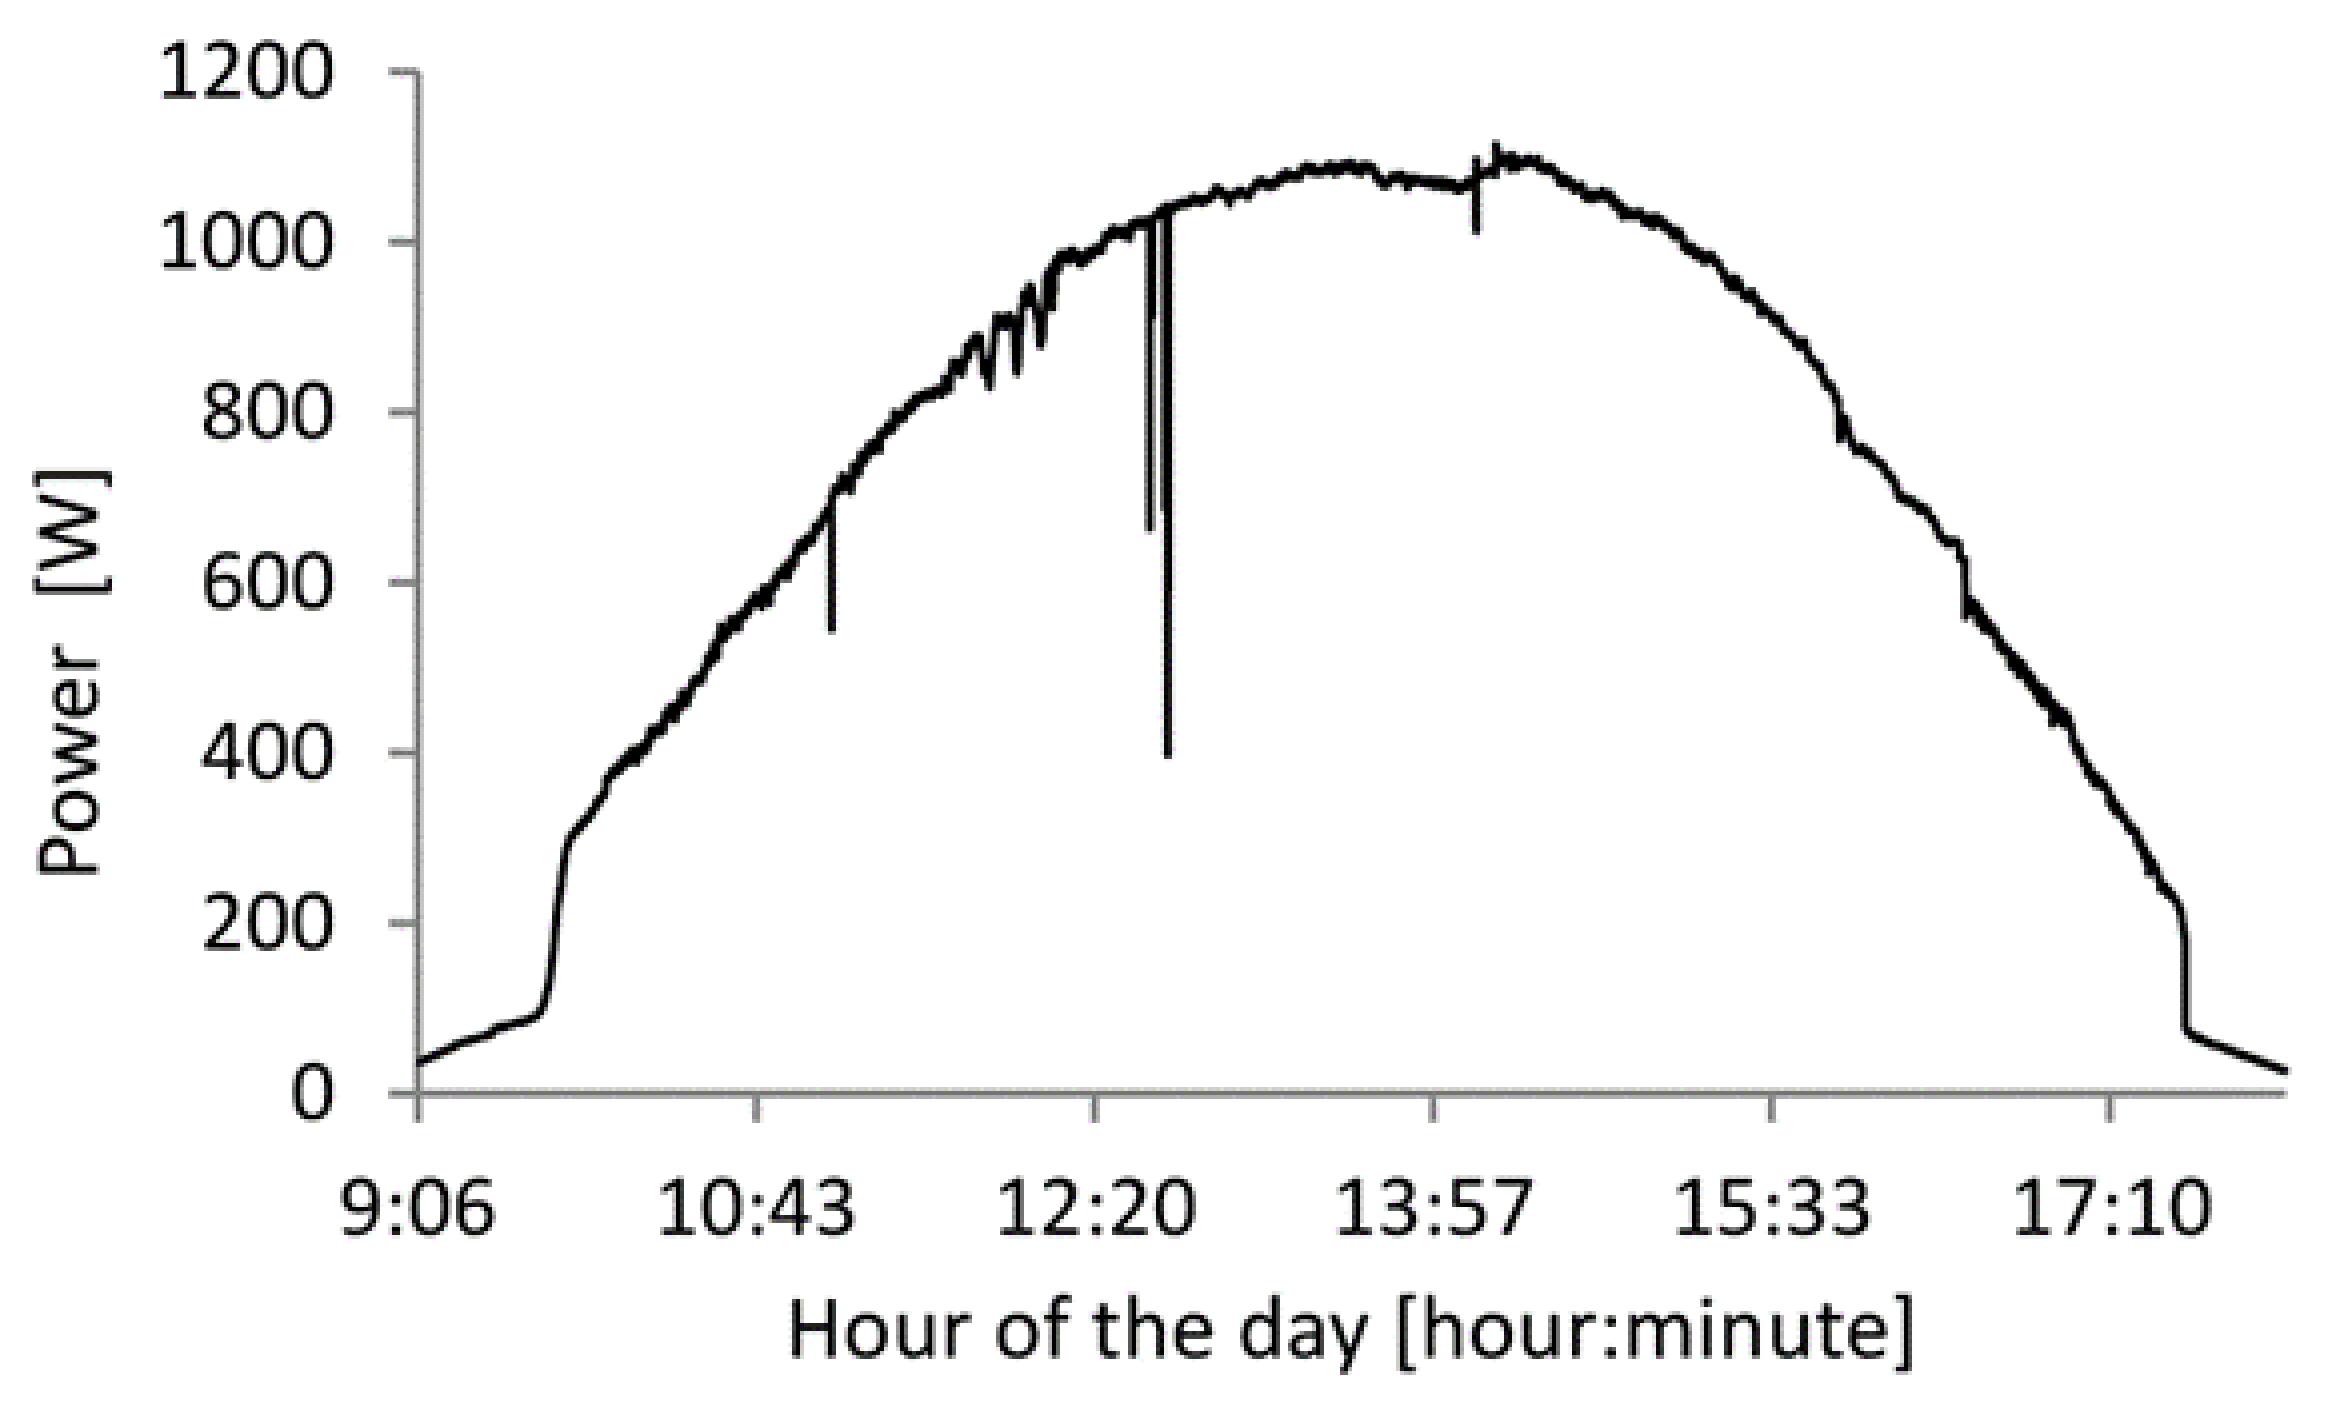
Figure 17 shows the curve indicating the solar power utilized by the system and its evolution over 1 day. The data was collected every 2 s. The curve shows how the system adapts to solar radiation, even though at the beginning and end of curve, distinctive jumps can be seen. These were caused by the disappearance and presence of shadows caused by nearby buildings as they exposed and covered the photovoltaic modules.
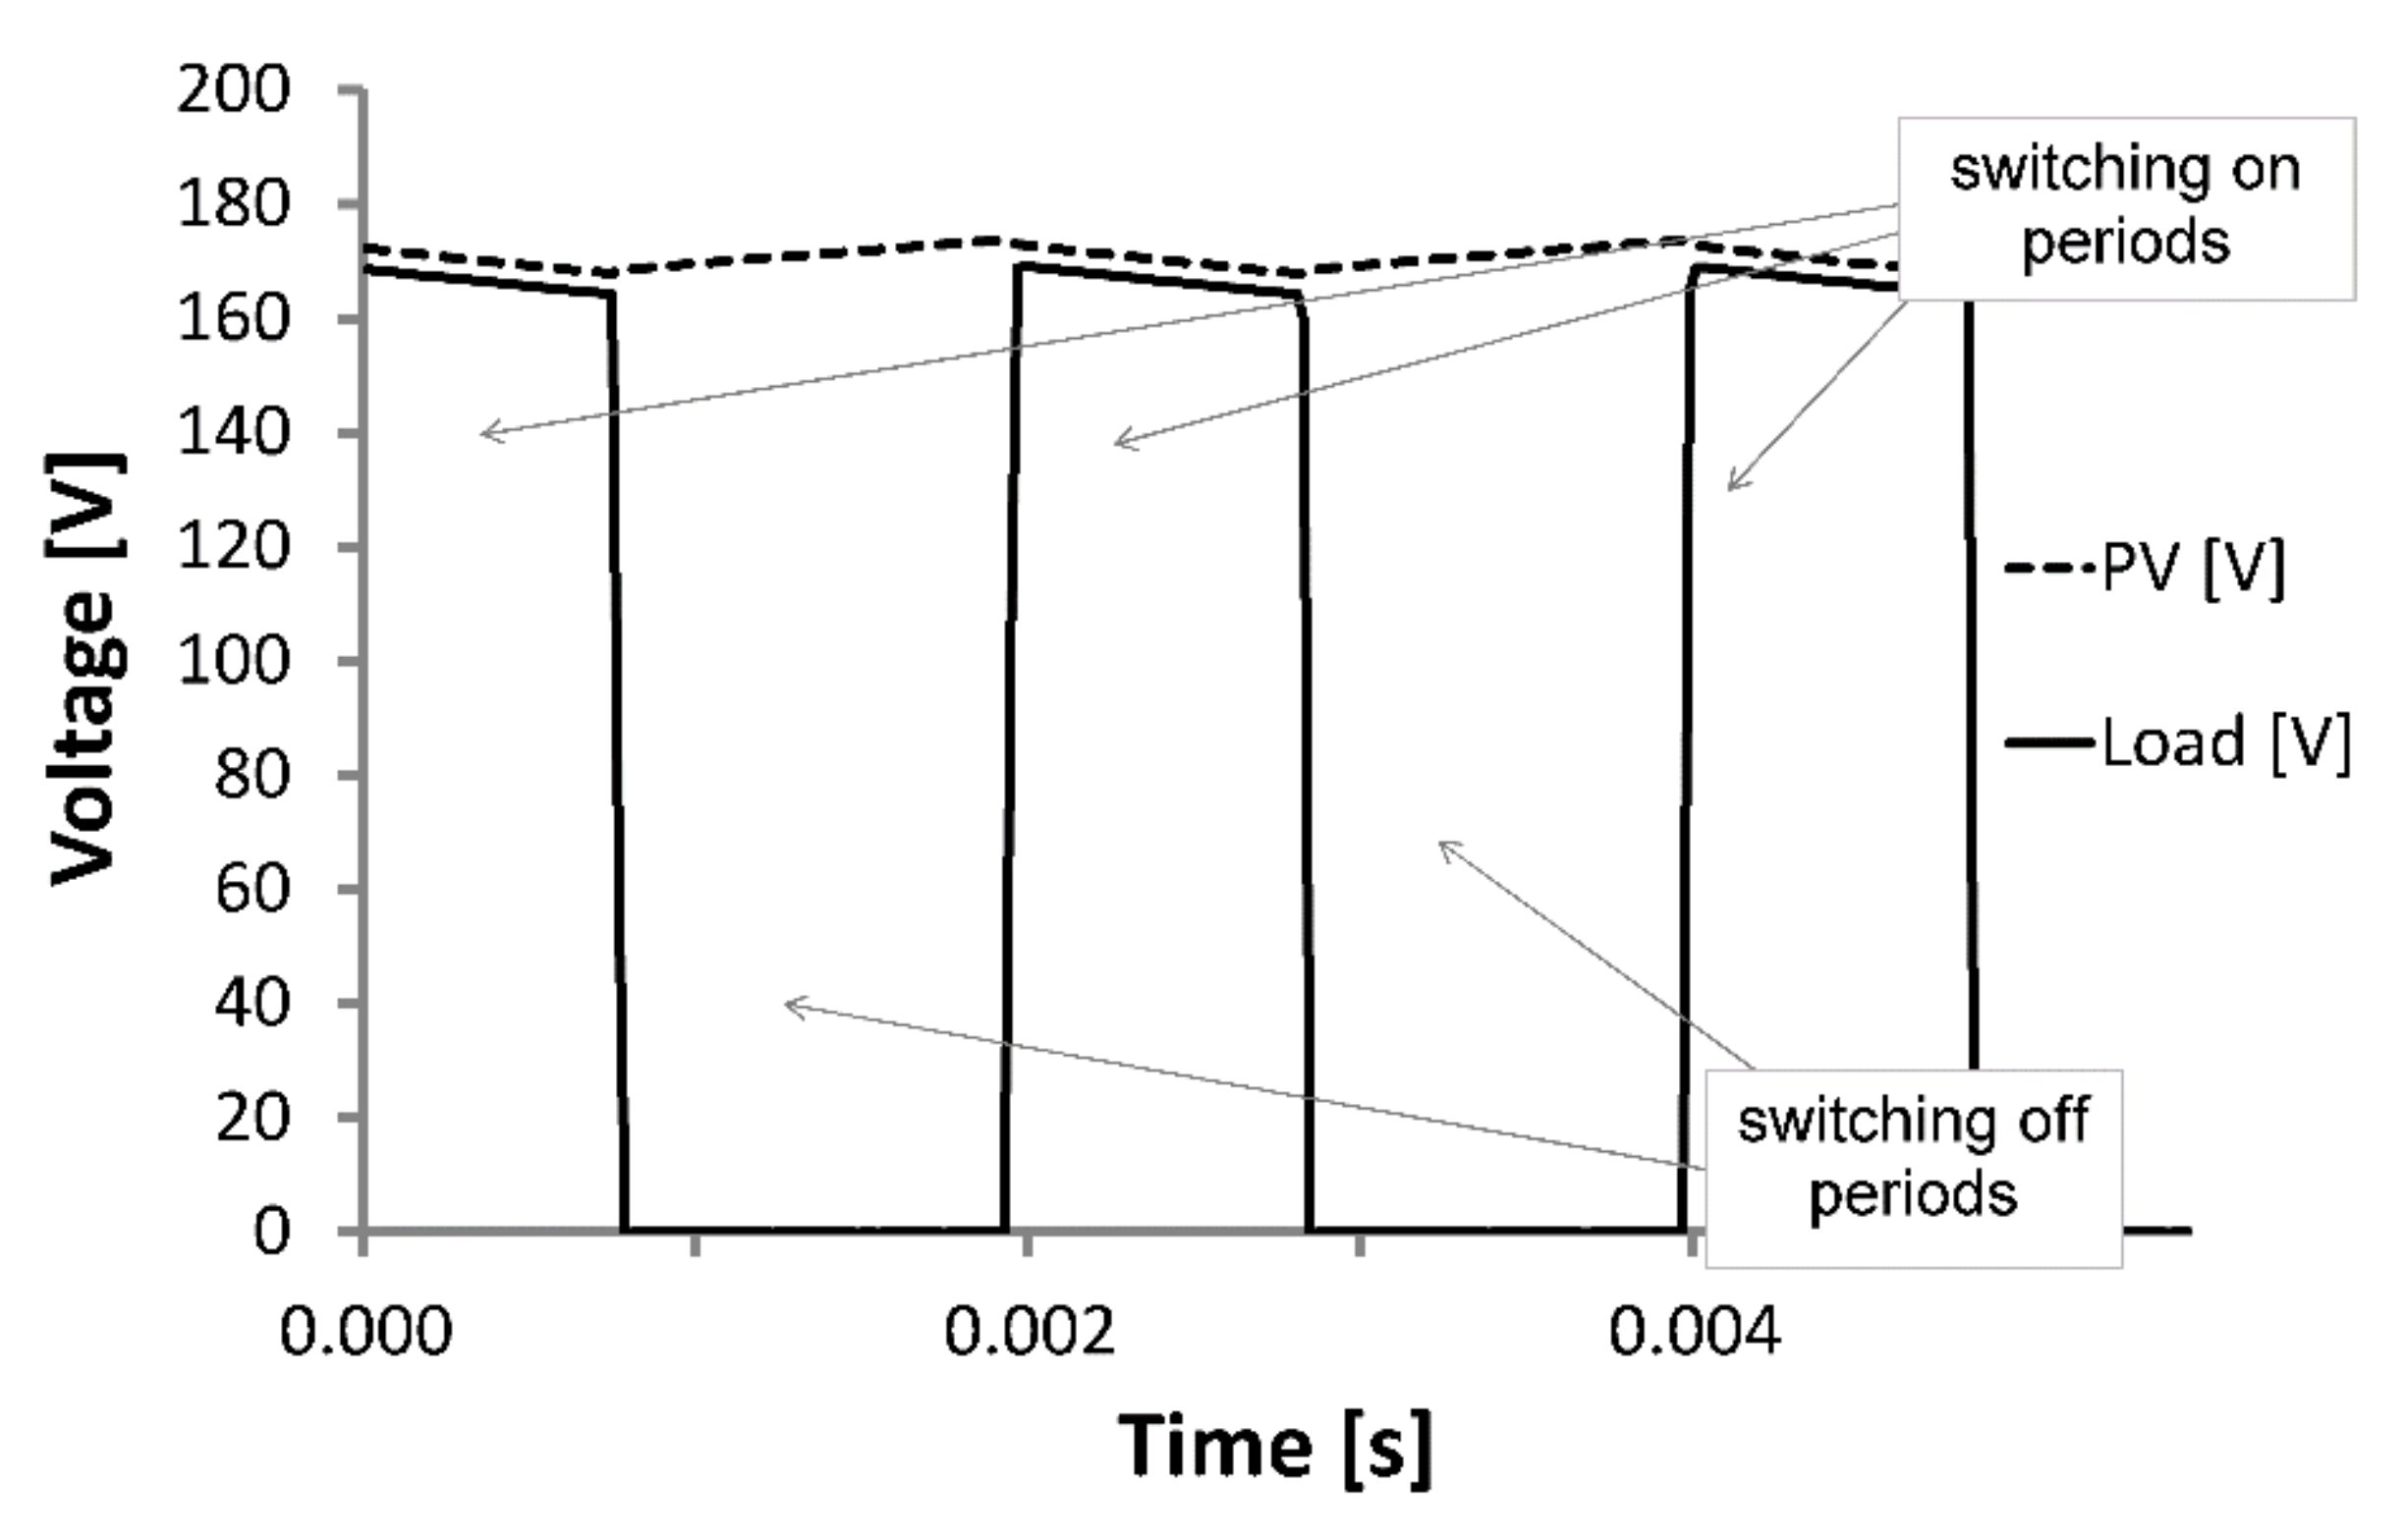
The performance of the electronic circuit was measured by a 4-channel oscilloscope, model DL850E. Measurements were taken simultaneously at the photovoltaic modules’ output (which behaves as an energy generator for the system) and at the heater resistance (which behaves as the system’s load).
The voltage and instantaneous intensity in the photovoltaic modules were measured, and, thus, the instantaneous power generated by the modules can be obtained. An oscilloscope was also used to measure, with the same time slots, the load’s voltage and instantaneous intensity, which provides the instantaneous power in the resistance.
These measurements are taken to compare input and output power and to obtain the electronic system’s performance.
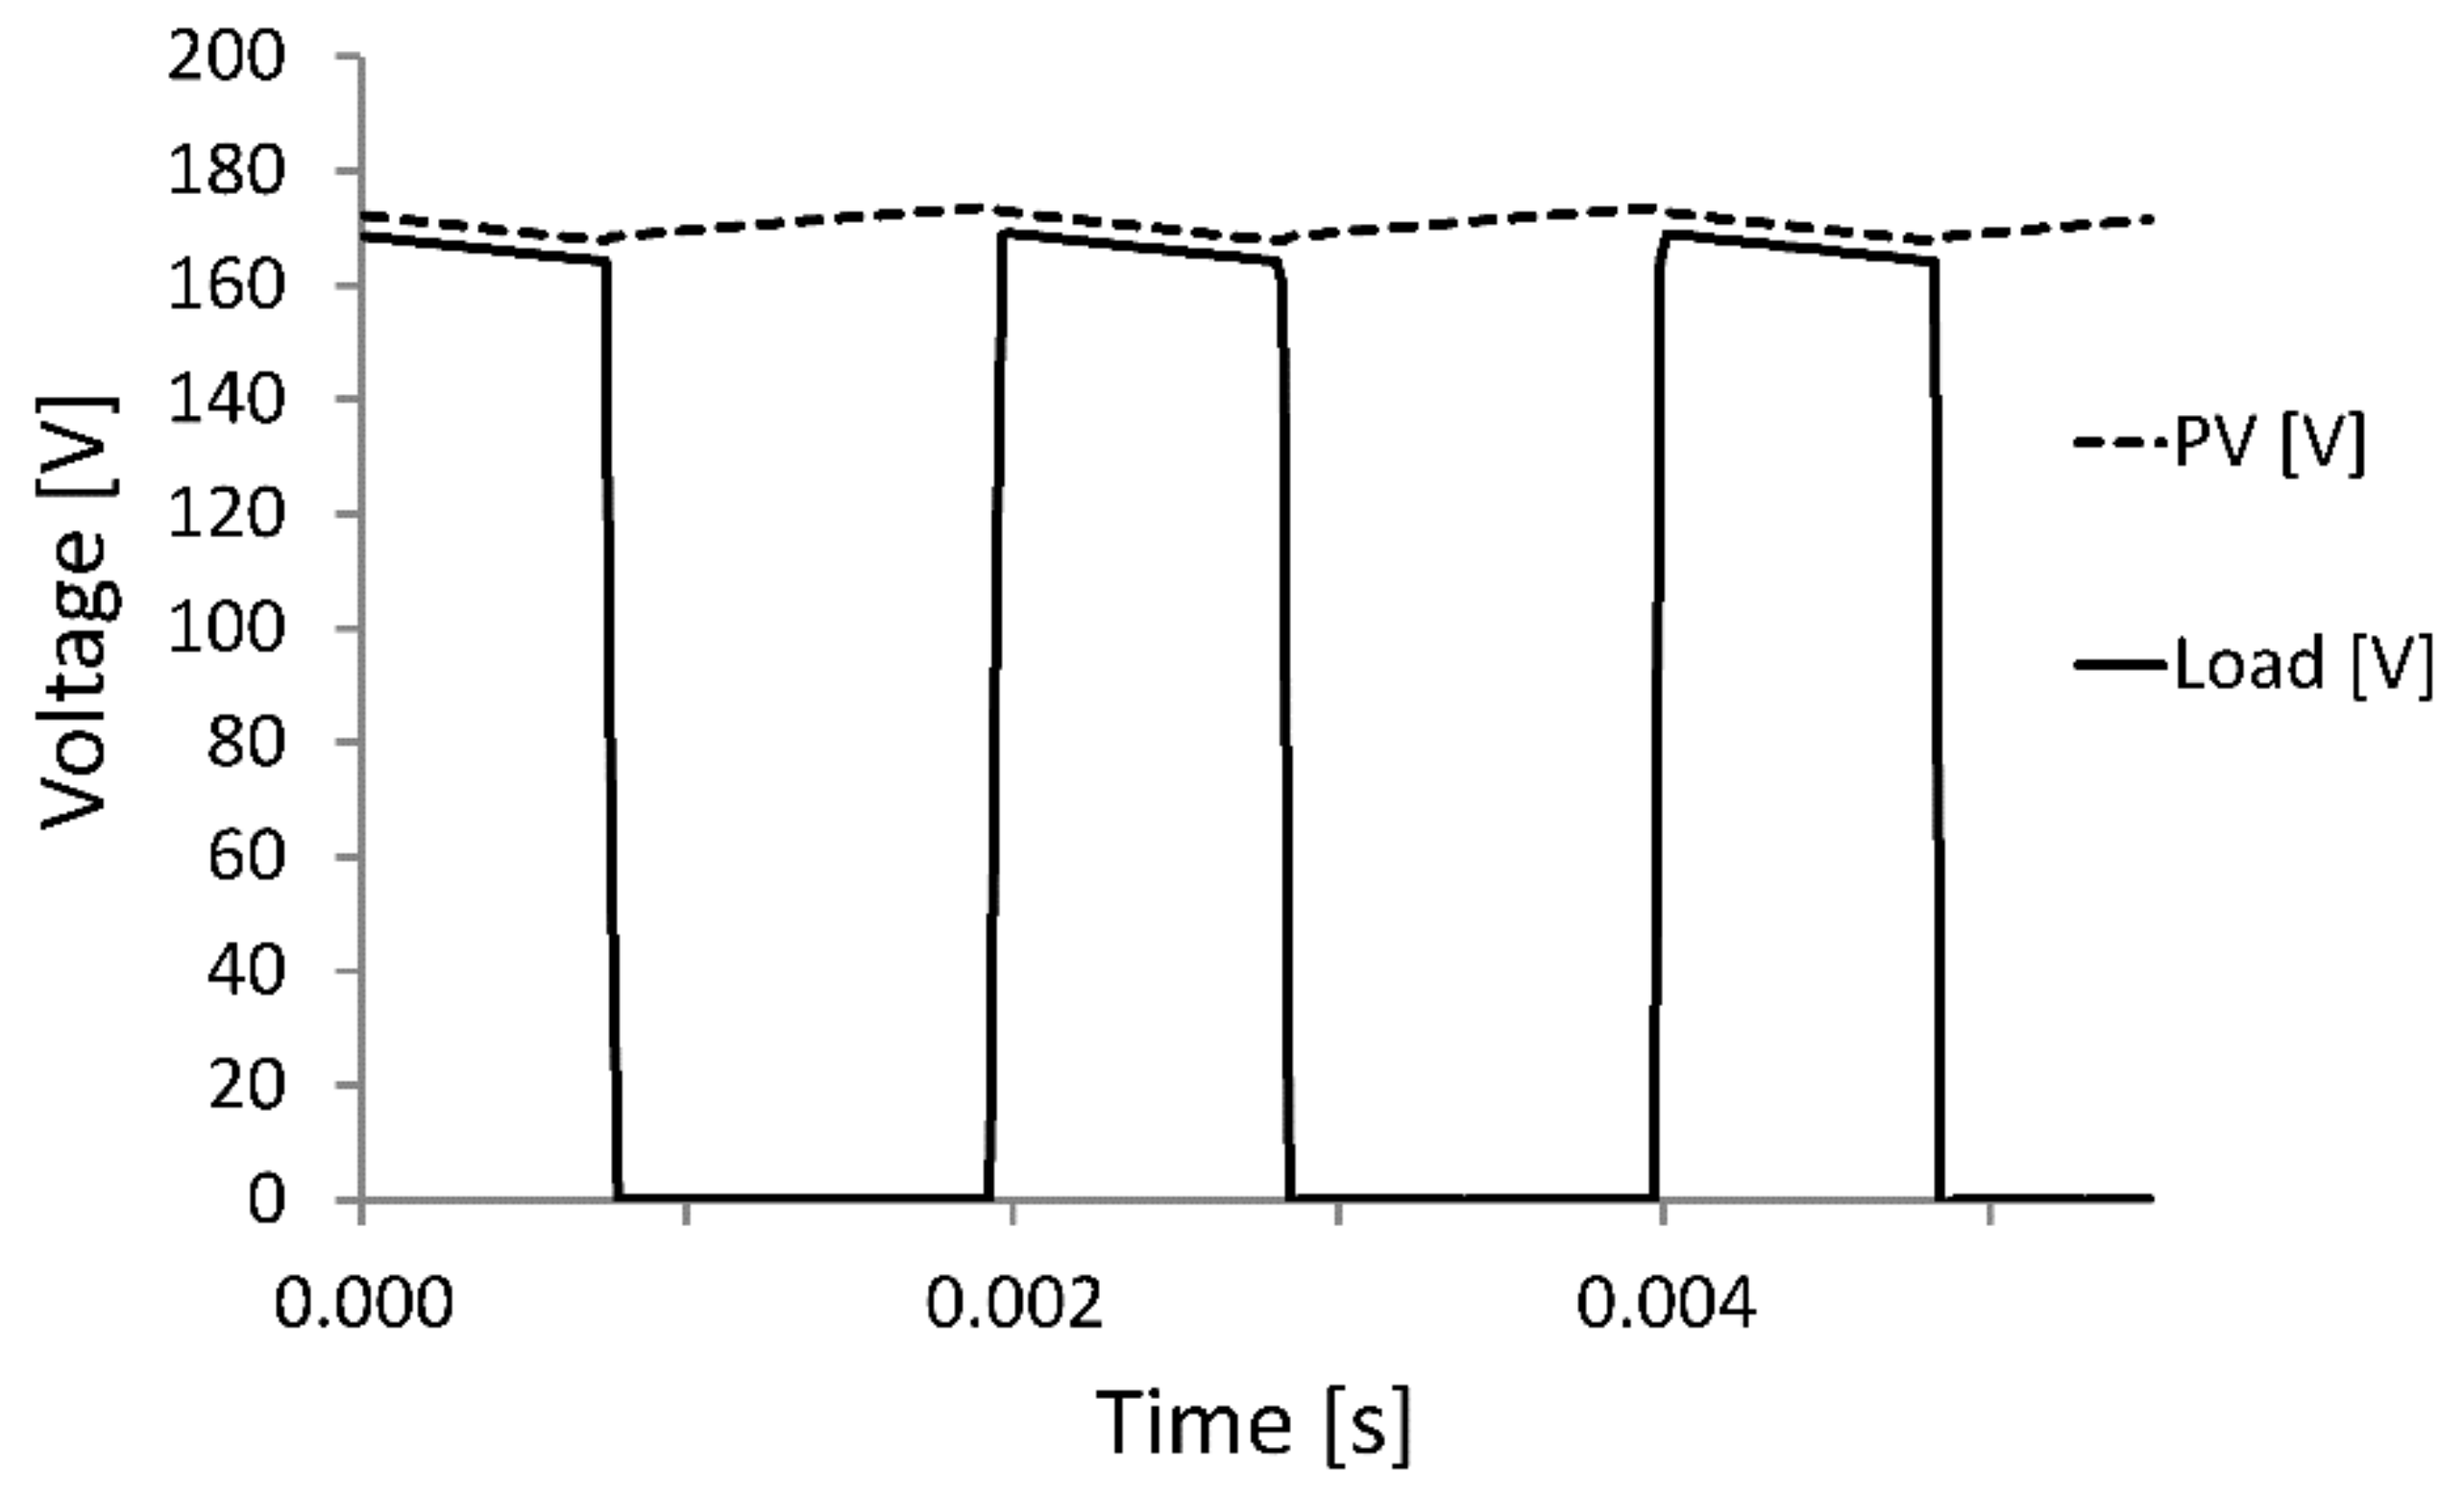
Figure 18 shows the comparison between PV voltage versus load voltage. While the voltage of the photovoltaic modules is basically constant, in the load, it becomes a pulse wave. The voltage levels are very similar, the output voltage being lower due to the voltage drop in the MOSFET and the rest of the electronic control system.
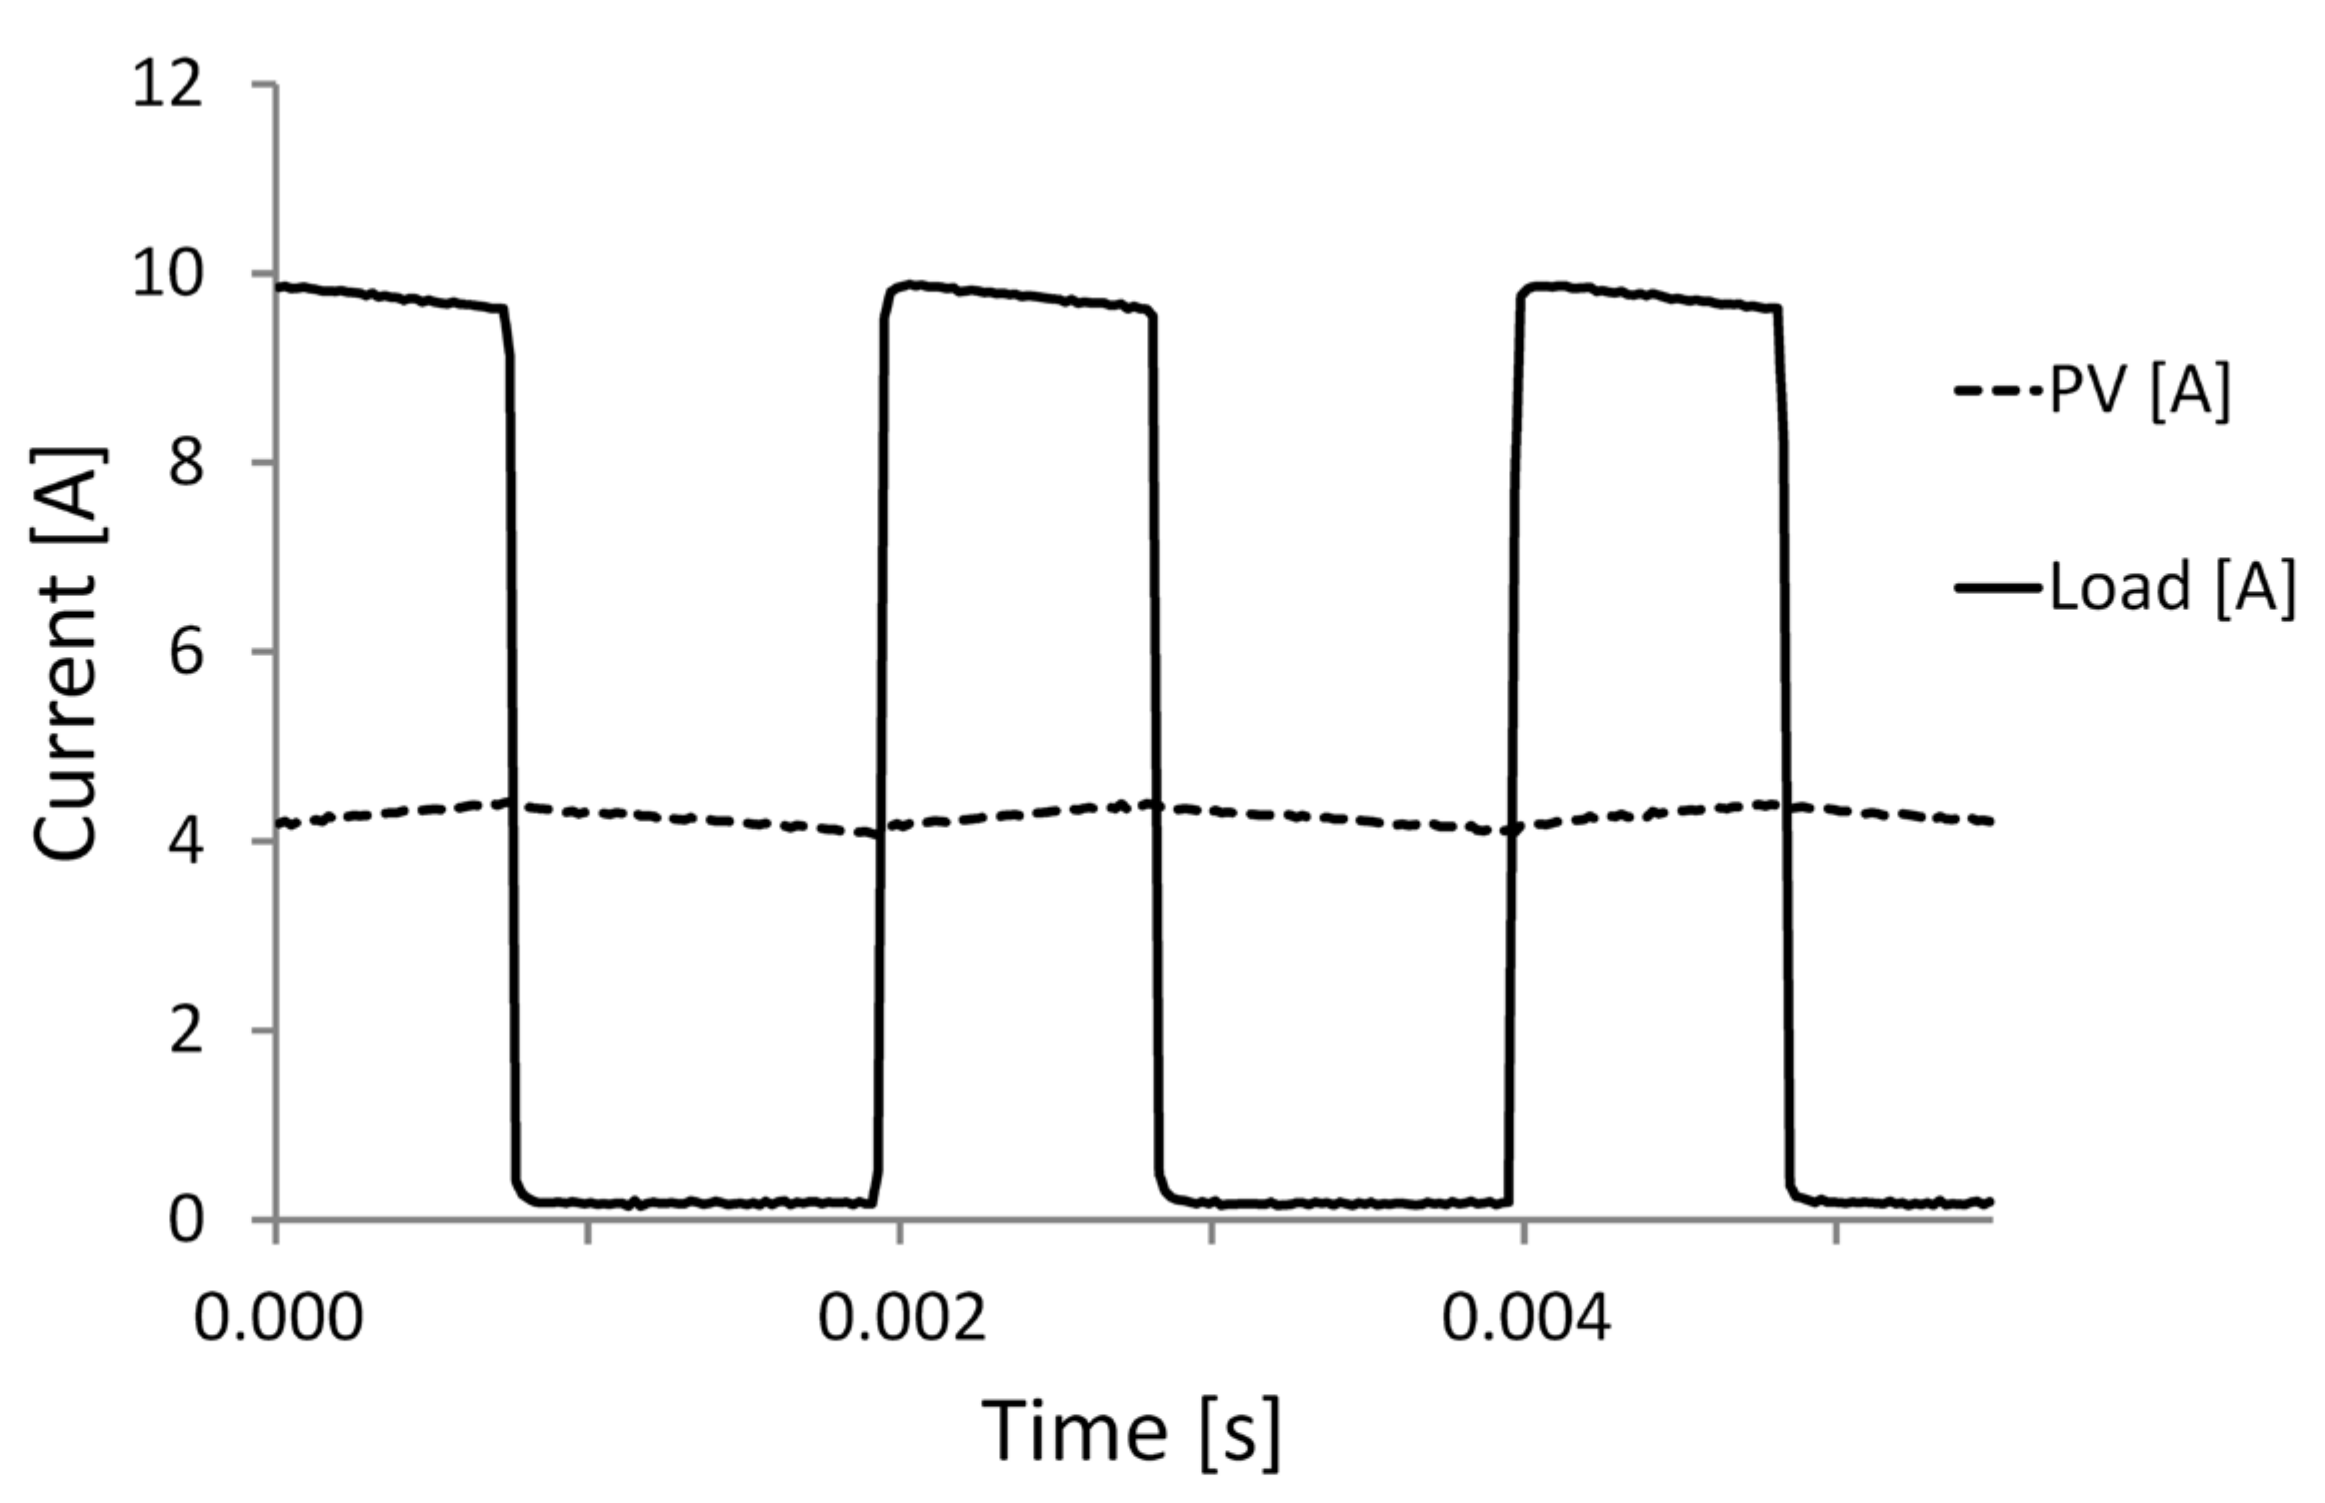
Figure 19 shows the comparison between PV current versus load current. The intensity is basically constant in the modules and is an intensity of load pulses. In this case, the maximum levels are higher in the load (more than double) than in all the photovoltaic modules.
Therefore,
Figure 20 compares the PV system power curve and the load power curve vs. time. While the power produced by the photovoltaic modules remains more or less constant, it acts as pulsating energy over the load.
Figure 20 also shows a striped area as the condenser’s charge energy and a grey area as the condenser’s discharge energy, which is transmitted over load resistance. When both curves were integrated over a period of time, a 95.09% performance level was observed.
The transformation of continuous power in the photovoltaic modules into a pulsating one in the load is what allows us to keep the MPPT in the photovoltaic modules, and, thus, the power available in the panels can be used in any solar irradiance condition. This pulse wave’s frequency is approximately 400 Hz, but this frequency is variable across the different levels of photovoltaic energy produced during the day. It is also variable with regard to the amplitude during “on” and “off” periods. These parameters depend on the energy supplied by the photovoltaic modules and the circuit condenser’s capacity from
Figure 4. The load resistance uses the pulse wave, and it converts it into heat.
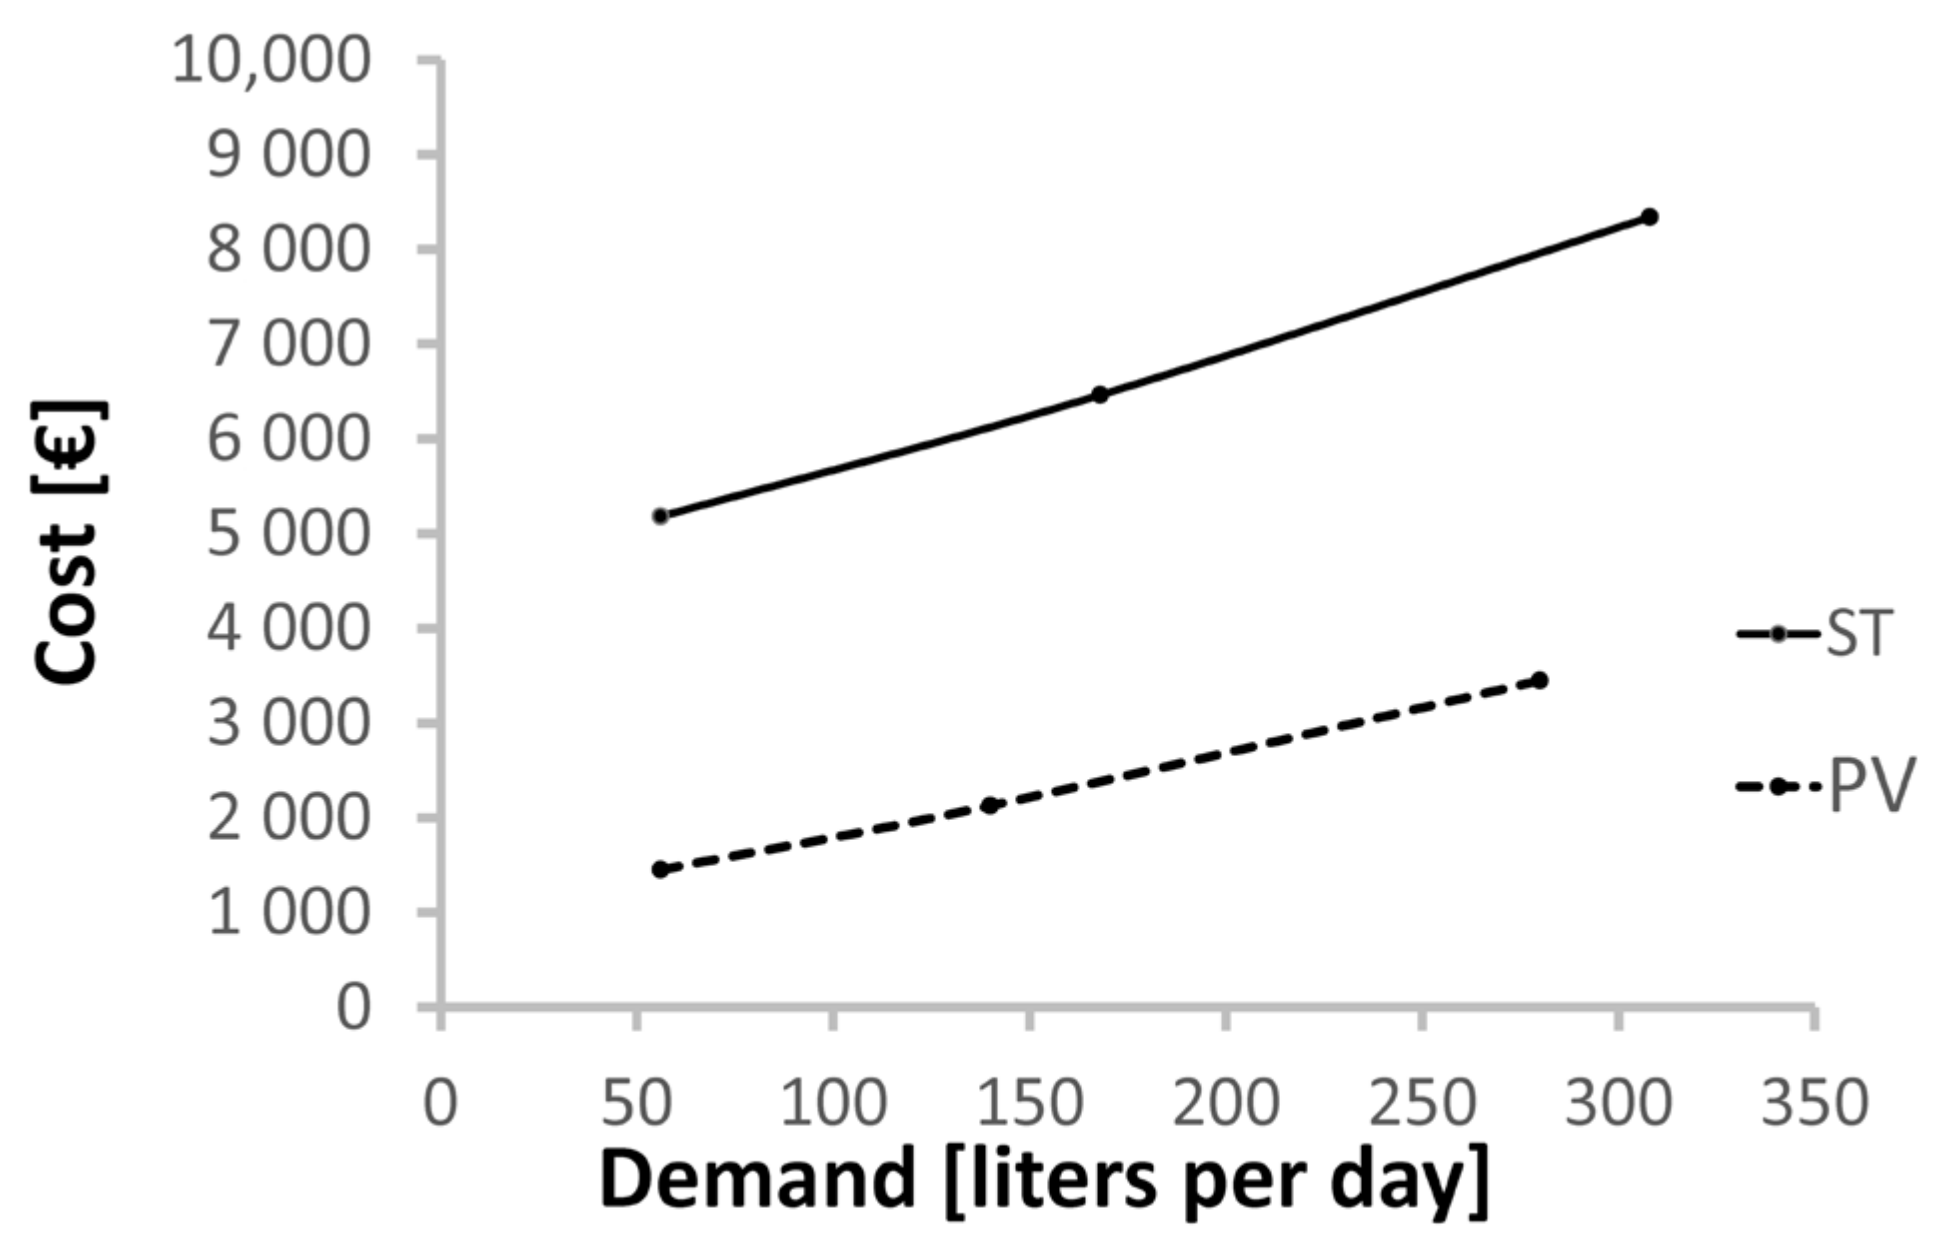
When making a comparison with systems of domestic hot water production based on solar thermal energy, it has been noticed that in terms of the cost for the same demand of DHW, solar photovoltaic systems are cheaper for any normal household demand, as shown in
Figure 21. The comparison is made for an annual coverage rate of 85% of demand. The location is Cordoba (Spain), with a latitude of 37.85 degrees North.
To construct this graph, the costs for each type of system solar energy (thermal and photovoltaic) were considered. In order to compare the life cycle costs of the two types of systems, three kinds of costs were considered: investment in materials, installation, and maintenance, which were calculated using market data.
The collectors of both systems are different, but while the tank and the supports of the panels are common elements to both installations, the hydraulic installation, recirculation pump, thermal fluid, and insulation are typical of solar thermal systems.
For the cost calculation of both systems, a lifetime of 15 years was considered, bearing in mind that in the case of the tank, the recirculating pump’s and thermal insulation’s lifetimes are 10 years.
It has also been taken into account that the solar thermal system has costs related to the panels and their structural fixation, the tank and its installation, the recirculation pump, and the hydraulic installation of insulated pipes for a standard distance of 20 m as well as operation and maintenance costs.
Besides the operational and maintenance costs, the thermal ACS installation needs periodic inspections (at least annually) to check the heat transmission fluid pressure and levels, corrosion, pump tightness and isolation, the hydraulic system’s valves and pipework, and, in general, all those parts susceptible to degradation due to the system’s normal functioning.
On the other hand, photovoltaic solar energy has a series of costs related to modules and their structural fixation, the tank and its installation, electrical wiring for a standard distance of 20 m, and the electronic device, but, in practice, there are no operation and maintenance costs. This is because there are no moving parts or elements subject to thermodynamic or hydraulic deterioration beyond the DHW tank.
The cost of the photovoltaic installation is lower than the equivalent solar thermal installation. The maintenance cost of the photovoltaic system is zero compared to the cost of 2%, as Lin et al. [
22] assumed, of the initial investment that the solar thermal entails. The simplicity of installation can be a decisive factor, not only at the economic level, but also to avoid problems that render the installation non-operational during certain periods of time.
The photovoltaic system is more resistant to temperature variations. The solar thermal installation can present problems of viability when faced with very high temperatures. At low temperatures, the freezing of hydronic fluids and energy losses can be a problem. However, although the photovoltaic installation can be affected by an increase in temperature, its integrity is not in danger. In the case of facing low temperatures, the photovoltaic installation will improve its performance.


