
The Applications and Complexity Analysis Based on Supply Chain Enterprises’ Green Behaviors under Evolutionary Game Framework


1
School of Business Administration, Shandong University of Finance and Economics, Jinan 250014, China
2
Research Center of Government Performance Evaluation, Shandong University of Finance and Economics, Jinan 250000, China
*
Author to whom correspondence should be addressed.
Sustainability 2021, 13(19), 10987; https://0-doi-org.brum.beds.ac.uk/10.3390/su131910987
Submission received: 15 August 2021
/
Revised: 25 September 2021
/
Accepted: 25 September 2021
/
Published: 3 October 2021
(This article belongs to the Special Issue Green and Sustainable Supply Chains)
Abstract
:Green behaviors adopted by supply chain companies are conducive to resource conservation and environmental protection and enhancing their core competitive advantages. By constructing a game model of green behavior of supply chain companies, this research deeply analyzes the main influencing factors of green behaviors adopted by supply chain companies. It uses dynamic evolution game analysis and simulation experiment methods to explore the path evolution direction and dynamic convergence process of green behavior strategy choices of these companies, so as to provide reference value for green behavior decision-making of supply chain enterprises. The research results show that the probability of supply chain enterprises choosing green behavior strategies is related to factors such as enterprise green investment income and costs, co-benefits, spillover benefits, greenness and output of raw materials or products, government green subsidy coefficients, and fines. Supply chain enterprises should reduce the cost of green investment, maximize the profit of green investment, and increase the greenness of raw materials or products; the government should increase the coefficient of green subsidies and encourage supply chain enterprises to actively participate in the collaborative management of the green supply chain.
1. Introduction
In recent years, the economic development has faced severe resource constraints, environmental pollution, and ecosystem degradation in China. For this reason, China has established a national strategy for green development such as “resource-saving and environment-friendly” enterprises [1]. As the concrete undertakers of social and economic development, enterprises are the main body of the green economy development [2], and more and more enterprises are beginning to pay attention to “environment-friendly” and “resource-friendly” green behaviors. As the main control method of green development planning, green behavior can inject “green power” into economic development. Therefore, it is an important driving force for enterprises to break through the dual dilemma of resource endowment and ecological environment and then achieve the transformation and upgrading of the economic and ecological development goals [3].
However, with the rapid development of science and technology, product life cycles are gradually shortening, and competition between enterprises has gradually evolved into competition between supply chains [4]. It is difficult for enterprises to only rely on their own resource endowments to deal with the fiercely competitive market environment, so they need to break through their inherent organizational boundaries and frameworks and embed in the supply chain relationship network. Supply chain enterprises build and manage green supply chains in collaboration with other enterprises in the network and adopt green behaviors to reduce the carbon emissions of the entire supply chain, which is conducive to achieving the goal of “carbon peak and carbon neutrality” [5]. In addition, the green behavior of supply chain enterprises can improve the utilization of enterprise resources, reduce unit product resource costs, and end governance and compliance costs, and the learning effect based on first-mover advantage is conducive to the formation of low-cost competitive advantages for enterprises [6].
Previous studies focused on a certain supply chain company, exploring the impact of supply chain partnership governance, information sharing, logistics capabilities, and customer channel preferences in a static environment on the behaviors of supply chain companies and their operational efficiency [7,8,9], or qualitatively analyzing the concept and countermeasures of supply chain relationship governance [10]. Regarding the supply chain as a whole, the results of the evolutionary game of green behavior of supply chain companies in a dynamic environment are relatively few, so it is difficult to effectively reflect the practice of supply chain companies in collaborative green supply chain management and clarify the influencing factors and effects of supply chain companies choosing to adopt green behaviors. In view of this, this paper discusses the supply chain enterprises’ green behavior and its main influencing factors based on a systematic and dynamic perspective and constructs an evolutionary game model between supply chain enterprises. In addition, this paper clarifies the evolutionary laws and changing trends of green behaviors of supply chain enterprises using dynamic evolutionary game analysis and simulation experiment methods, seeks the combination of the interests of supply chain companies, and ultimately provides a useful reference for supply chain enterprises to effectively carry out green supply chain collaborative management. The conclusions of this paper are mainly as follows. On the one hand, whether a supply chain enterprise adopts green behaviors is related to factors such as green investment costs, green investment income, government green subsidy coefficients, greenness and quantity of raw materials or products, co-benefits, spillover benefits, and government penalties. On the other hand, the evolutionary result of the decision-making behavior of supply chain enterprises may be either adopting green behaviors or not adopting green behaviors. The result of this evolution depends on the green investment profits of the supply chain enterprises, the government subsidy coefficient, the greenness of raw materials or products, and government fines. With the continuous changes of various parameters, initial values and time t, the system will eventually converge to 1 and reach the ideal evolutionary stable state, that is, x = 1 is the evolutionary stable point, so adopting the green behavior strategy is an evolutionary stable strategy; or, it converges to 0, and the system thus reaches the ideal evolutionary stable state, that is, x = 0 is the evolutionary stable point, so it is an evolutionary stable strategy not to adopt the green behavior strategy.
2. Literature Review
2.1. Supply Chain Enterprises and Network Forms
Relevant scholars believed that the supply chain, as a complex adaptive system, refers to a logistics process surrounding the core enterprise from the procurement of raw materials to the processing of intermediate products, the formation of final products, and the transfer of products to consumers, thereby realizing product value [11]. Some scholars also proposed that the supply chain behaves as a functional network, covering individuals or organizations such as suppliers, manufacturers, distributors, retailers, and consumers [12]. As an economic legal person in the Chinese context, an enterprise refers to a commodity producer, operator, or economic organization that relies on its fixed production and business premises, funds, equipment, and employees to engage in production, processing, and service activities. The purpose of the enterprise is to achieve maximum profitability [13]. To sum up, this paper combines the characteristics of supply chain and the concept of enterprises and believes that enterprises in the supply chain network that meet the basic attributes of enterprises, such as suppliers, manufacturers, distributors, and retailers can be collectively referred to as supply chain enterprises. Supply chain enterprises are linked to each other to build a learning system. Based on this learning system, supply chain enterprises can better share resources and information, thereby gaining more heterogeneous knowledge and enhancing the overall competitive advantage of the supply chain and the enterprises [14].
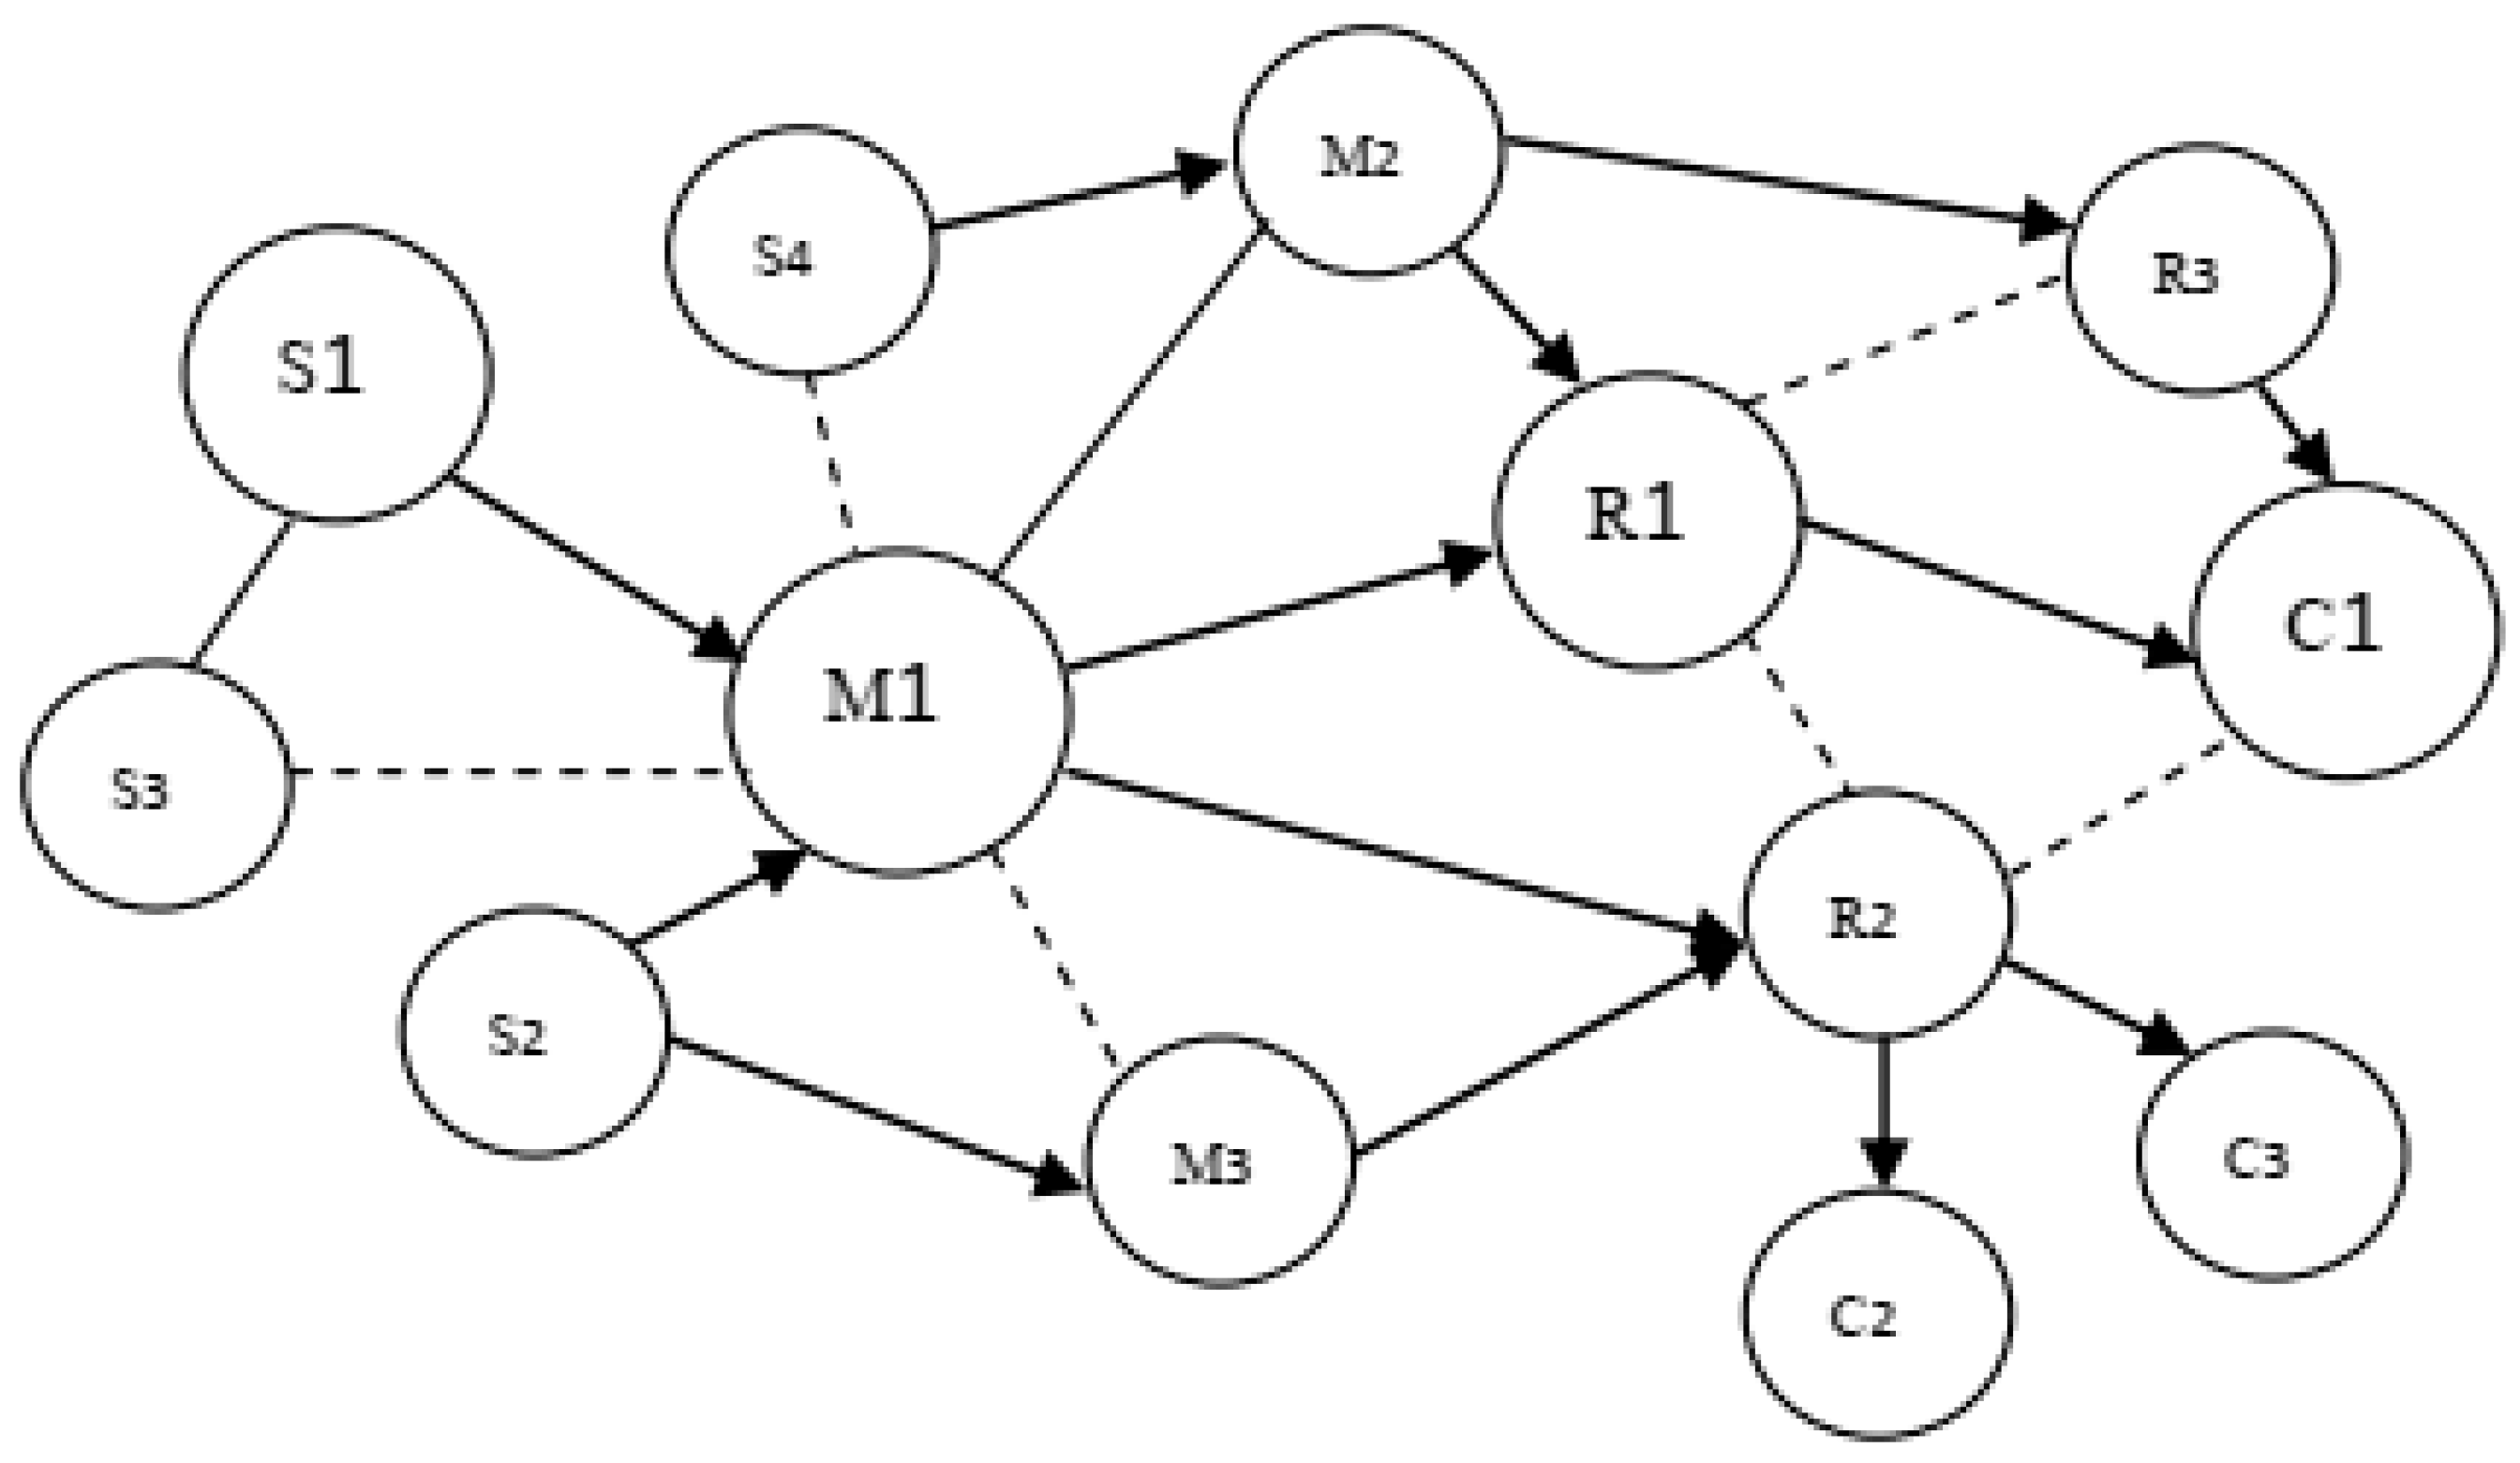
Supply chain network is a network structure between market system and vertical integration. Suppliers, manufacturers, distributors, and retailers are all network node enterprises, giving full play to their superior resources and capabilities, and sharing resources and information within the network. The economic behavior of a company is embedded in a certain social relationship network, and the company and the external social environment influence and interact with each other [15], so the behavioral decisions of supply chain enterprises will be affected by other corporate behaviors in the supply chain network or external environmental factors. The supply chain network diagram is shown in Figure 1. S stands for supplier, M stands for manufacturer, R stands for retailer, and C stands for consumer. Among them, the solid line represents the actual cooperative relationship between the two entities, and the dotted line represents the potential cooperative relationship between the two entities. Supply chain companies are in different positions within the network, and their control degree over resources and information in the network is different, so the behavioral decisions they make will also be different. In addition, the closeness centrality of supplier S3 in the entire supply chain network is the highest at 48, indicating that its behavior is the least controlled or influenced by other entities. Manufacturer M1 has the highest degree centrality of 5, indicating that it is at the center of the supply chain network. This paper mainly focuses on the supplier enterprises and manufacturer enterprises in the vertical network of the secondary supply chain and constructs an evolutionary game model in which the two adopt green behaviors and then implement the collaborative management of the green supply chain.
2.2. The Connotation of Green Behavior of Supply Chain Enterprises
At present, the academic circles have not formed a unified opinion on the concept of enterprise green behavior. Based on different research perspectives, many scholars believe that enterprise green behavior encompasses different elements and presents a process of differentiation. Based on the perspective of environmental economics, some scholars believe that enterprise green behavior is a corporate environmental behavior or pro-environmental behavior [16]. In order to overcome or alleviate resource and environmental constraints, improve their own competitive advantages, and consider the interests of society, economy, and environmental protection, the behavior of enterprises trying to minimize resource consumption and environmental pollution through green innovation and management is called green behavior [17]. In addition, some scholars believe that enterprise green behavior can be further divided into five dimensions based on the perspective of environmental economics, namely, environmentally-friendly R&D, life cycle analysis, environmental-based total quality management, green supply chain management, and the adoption of ISO14000 standards [18]. It can be seen that the green behavior of enterprises is a series of active plans adopted by enterprises to deal with resource and environmental problems, including green technological innovation, green production, and end governance [1]. Among them, green technology innovation refers to the enterprise’s goal of energy conservation and emission reduction throughout the entire innovation process by designing green products, researching and developing clean technologies, and saving materials and energy, thereby reducing the enterprise’s production costs and restraining the enterprise’s negative impact on the environment [19]. Green production refers to the behavior of enterprises that comprehensively inspect the consumption of production resources and their possible impact on the environment in advance and rely on clean production equipment, clean energy, and technology to manufacture and produce green products. The end treatment performance is the behavior of the enterprise to separate and dispose of the pollutants generated in the production process of the product and to recycle the production waste and other innocuous treatment [20].
Based on the perspective of organization and management theory, some scholars believe that enterprise green behavior encompasses processes such as green production, green marketing, and green management. Enterprise green behavior covers customer demand management, product management, and environmental accounting, and reflects the system management ideas of cross-functional and corporate boundary to a certain extent [21]. Some scholars are more inclined toward the support system of enterprise green strategy, focusing on enterprise knowledge management and stakeholders, and believe that enterprise green behavior includes environmental protection organization design, communication with stakeholders, and executive environmental commitments [22]. In addition, related scholars subdivide the green behavior of the enterprise from the perspective of internal process and system management and finally form four dimensions of internal environmental management, external green supply chain management, investment recovery, and environmental design.
To sum up, enterprise green behavior is a series of environmental protection behaviors taken by enterprises in response to the dual pressures of resources and the environment, such as the formulation and implementation of green strategies, the use of environmental protection technologies and alternative production technologies for green production, the use of environmentally friendly raw materials, and green packaging, recycling, and reuse of products. However, relevant scholars regard enterprise green behavior simply as a passive behavior under government deterrence based on the perspective of environmental economics, ignoring the subjective initiative of the enterprise. Based on the perspective of organization and management theory, some scholars have well explained the mechanism of resources, capabilities, managers, and strategic environment on enterprise green behavior; however, these research results ignore the enterprise’s dependence and reaction on the external environment and therefore they have not formed a comprehensive and systematic concept.
In addition, supply chain enterprises are different from ordinary enterprises, and their green behaviors not only stem from the internal driving force of the enterprise but are also affected by the external environment or other actors. This research is aimed at supply chain enterprises in the secondary supply chain and explores the influencing factors and evolutionary laws of their green behavior. As the core enterprise in the supply chain, the manufacturer’s green behaviors mainly include green procurement and supply, green design, green manufacturing, green logistics, and green marketing, which are discussed in the following: (1) Green procurement and supply refers to enterprises that involve environmental evaluation factors in raw materials and parts procurement management activities in order to ensure that production activities can continue to operate, through the procurement of environmentally friendly raw materials and parts and selection of high-quality green suppliers, in order to save resources and protect the environment, and enhance the enterprise’s green reputation procurement and supply methods. (2) Green design means that, in the process of product design, the manufacturer considers the possible negative impacts of the enterprise on the external environment during the entire life cycle and further extends the product life cycle by increasing recycling and reusing waste. Then, the manufacturer fundamentally solves the problem of environmental pollution or damage [23]. (3) Green manufacturing refers to the fact that the enterprise incorporates environmental factors into the original manufacturing mode of the product and effectively decomposes the entire production process of the product to ensure that the entire process of product design, production, packaging, transportation, sales, consumption, and recycling can meet environmentally friendly standards, improve the efficiency of resource use, and coordinate the economic and social benefits of the enterprise. (4) Green logistics refers to the behavior of enterprises that also incorporate environmental factors into product transportation, warehousing, and distribution links, and on the basis of improving logistics efficiency, reduce environmental pollution caused by logistics links so as to ensure the full use of logistics resources. (5) Green marketing is a marketing concept and a series of marketing activities based on the concept of sustainable development and the principle of environmental protection to meet consumers’ green demand for products. In the process of enterprise green marketing, not only the economic benefits of the enterprise, but also the promotion of the value of the transfer of consumers and other social benefits are considered. It can be seen that the green behavior of supply chain enterprises refers to a “package” of positive plans adopted by enterprises in order to better respond to resource and environmental constraints.
2.3. Driving Factors of Green Behavior of Supply Chain Enterprises
The green behavior of enterprises is the result of multiple factors. Relevant research results show that the factors that affect the generation of enterprise green behavior mainly include internal factors and external factors. Among them, internal factors cover the environmental awareness of enterprise executives, enterprise green awareness, enterprise resource capabilities, enterprise technical factors, employee perceptions of social responsibility, and green production atmosphere, which are discussed in the following: (1) Environmental awareness of enterprise executives: The environmental protection awareness of enterprise executives and their attitude toward green production are decisive for enterprises to adopt green behaviors, which can effectively promote the green production, the conversion of production resources, and technology development to greening [24]. The stronger the environmental awareness of enterprise executives is, the more they can encourage enterprises to adopt green behaviors and gain competitive advantage [1]. In addition, the support and commitment of enterprise executives also play an important role in driving enterprises to adopt green behaviors [25]. (2) Enterprise green awareness: Enterprise green cognition refers to the psychological experience by which enterprises have formed their perception and scientific knowledge of resource and environmental issues, due to their full understanding of resource and environmental issues, and their psychological experience when they undertake social responsibilities such as saving resources and protecting the environment [23]. Enterprise green cognition covers the enterprise perception of resource conservation and environmental-protection-related regulations, market pressure perception, perception of the role of green development on enterprise competitive advantages, and enterprise perception of social responsibilities such as resource conservation and environmental protection. To a certain extent, enterprise green perception determines the strength of enterprise green willingness, which in turn affects enterprise behavioral decisions [26]. (3) Enterprise resource capacity: Enterprise resource capacity is an important factor affecting the green behavior of enterprises [27]. The richer the resource endowment an enterprise has, the stronger is its ability to acquire, integrate, and use resources for green innovation, and the more it can encourage enterprises to adopt green behaviors and conduct green production, thereby gaining more competitive advantages. (4) Enterprise technical factors: There is a significant correlation between technical factors and green behaviors within the enterprise. Based on the theory of technological progress, related scholars have found that technological advancement can not only increase the marginal technological benefits of enterprises, but may also generate more profits, reduce the marginal cost of technology, and promote the realization of enterprise development. Based on the theory of market competition, some scholars have proposed that technological advancement is conducive to the green production of enterprises and the development of differentiated products, thereby forming their own core competitiveness [28]. (5) Employees’ perception of social responsibility: In the production process of the enterprise, employees feel the pressure and threat of environmental management firstly. Enterprise employees are willing to work in a green and healthy environment in consideration of social responsibility and their own health. Therefore, employees will put pressure on the enterprise to promote green production. In addition, social responsibility requires enterprises to correctly respond to external environmental pressures, form an enterprise culture related to environmental protection, change the attitude of employees, and encourage enterprises to adopt green behaviors [29]. (6) Green production atmosphere: The internal green production atmosphere of the enterprise mainly includes aspects such as social responsibility, enterprise culture, and brand image. The stronger the green production atmosphere of an enterprise is, the more it can stimulate the enthusiasm of the enterprise for green production.
The external factors mainly include government supervision, environmental regulations, expected profits of enterprises, pressure from upstream and downstream enterprises, environmental awareness of consumers, and other social public pressures, which are discussed in the following: (1) The intensity of government supervision or support: Relevant scholars believe that government supervision has a significant positive impact on the green behavior of enterprises [30,31]. The greater the intensity of government supervision is, the more likely companies are to engage in green production due to policy pressure. In addition, the government’s support policy for the enterprises’ green behaviors will also encourage enterprises to carry out green production. The higher the green subsidy coefficient given to enterprises by the government is, the more it can encourage enterprises to adopt green behavior [32]. (2) Environmental regulations: Regulatory tools such as pollution taxes and fees, pollution permit systems, green credits, ecological compensation mechanisms, and subsidies implemented in China are all aimed at encouraging enterprises to adopt green behaviors, reduce the cost of green behaviors, and take the path of sustainable development [33]. Environmental regulations are conducive to restraining enterprises’ polluting behaviors, forcing enterprises to conduct green production [34], stimulating enterprises to carry out green innovation, and achieving energy conservation and emission reduction [35]. In addition, external environmental pressure urges enterprises to continuously improve their environmental behaviors, actively respond to environmental pressures, and achieve economic performance through the pursuit of environmental performance, and ultimately form the internal capabilities of the enterprise green behavior [36]. (3) The expected return of the enterprise: The expected return of an enterprise is the key to influencing the decision-making of green behavior [21]. On the one hand, the pursuit of policy benefits is an important driving factor for enterprises to implement active environmental strategies and adopt green behaviors [37]. On the other hand, based on the cooperation expectations of other supply chain enterprises, the enterprise judges the cost and benefit of the green behavior, which can affect the enterprise green behavior decision [26]. In addition, the potential rewards that enterprises can obtain by adopting green behaviors will also prompt enterprises to take the initiative to adopt green behaviors, such as establishing enterprise image, maintaining brand and reputation, and so on [36]. (4) Pressure from upstream and downstream enterprises: The behavioral decisions of enterprises are influenced by the social network [38], so the green behavior of supply chain enterprises will inevitably be promoted by the upstream and downstream enterprises in the supply chain network [36]. (5) Consumers’ environmental awareness: The stronger the consumers’ environmental awareness is, the higher the environmental protection and conservation requirements of the enterprise’s products are, and the more it can force enterprises to carry out green production and innovation to meet consumers’ demand for green products to a certain extent. (6) Public pressure from other societies: The credit pressure required by the public for environmental protection, market pressure, and financial pressure from relevant financial institutions to carry out green credit certification of enterprises will all form an external driving force for the enterprise’s environmental behavior.
2.4. Research on Green Supply Chain Management
As the contradiction between economic development and environmental destruction continues to deepen, the green supply chain that takes into account economic and social benefits has received widespread attention. The existing studies mostly discuss the impact of corporate green supply chain management on corporate sustainable operations and environmental sustainability based on different theoretical perspectives. Szegedi et al. (2017) discussed the question about whether companies acting as members of more advanced chains show also better results in their green supply chain behavior in the automotive industry. They found that companies with a higher developed traditional supply chain have also a more developed green supply chain management system [39]. Kot et al. (2019) collected data from 613 SMEs and used SmartPLS-SEM to study the mediating effect of strategic supply chain management in the SMEs operating in distinctive economies of Canada, Iran, and Turkey on social and environmental sustainability [40]. Kot et al. (2019) examined the strategic supply chain management’s mediating effect of sustainable operations through environmental and social sustainability within the businesses operating in Canada, Iran, and Turkey, to attain a global perspective [41]. Urbański and Haque (2020) used the methods of Chi-Square test and structural equation modelling to discuss the consumers’ awareness and trust on greenwashed and sustainable products from the perspective of global consumers [42]. In addition, some scholars discussed the game issues related to green supply chain management. For example, Zhu and Dou (2011) established a three-stage game model by considering products’ green degree and government subsidies [43]. Jian et al. (2019) established a green supply chain game model in which manufacturers considered both profit and environmental objectives and explored the operation and cooperation strategies of different objectives at the supply chain level [44].
To sum up, although previous research results have discussed the factors that influence the green behavior of enterprises and their differential effects on the green behavior based on internal and external levels, they have ignored the complexity of the interaction between internal and external factors and their influence mechanism on enterprise green behavior. In addition, although existing studies have analyzed the game issues in supply chain management based on different perspectives, they have not fully considered the dynamic characteristics of supply chain and have not explored the synergistic effect of multiple factors on the green behavior of supply chain companies, the game relationship, and interaction of green behavior of supply chain companies. In view of this, this paper focuses on the secondary supply chain and discusses the main influencing factors and effects of green behaviors adopted by supply chain enterprises by constructing an evolutionary game model between supply chain enterprises. It also clarifies the evolutionary laws and changes in the trend of green behaviors of supply chain enterprises, so as to provide a theoretical reference for supply chain enterprises to implement green supply chain collaborative management more effectively.
3. Evolutionary Game Analysis of Enterprises’ Green Behaviors
3.1. Model Building
Assuming that supply chain enterprises have independent decision-making powers on whether to adopt green behaviors, each enterprise has a vertical cooperative relationship, and its strategic space is (take, not take). Supply chain enterprises choose to adopt green behavior strategies, indicating that enterprises are willing to invest in more research and development funds for the design, production, and packaging of green products. In the secondary supply chain, if both supplier S and manufacturer M adopt green behavior strategies, it can produce certain green supply chain synergies. If neither the supplier S nor the manufacturer M adopts a green behavior strategy, they can only obtain ordinary profits. In addition, in the supply chain enterprise group, it is assumed that the probability of the supplier group adopting the green behavior strategy is x (0 ≤ x ≤ 1), and the probability of not adopting the green behavior strategy is (1 − x); the probability of the manufacturer group adopting the green behavior strategy is y (0 ≤ y ≤ 1), and the probability of not adopting the green behavior strategy is (1 − y). The total income of supply chain enterprises adopting green behavior strategies is the sum of the enterprises’ ordinary income and green income.
(1) Supplier S adopts a green behavior strategy, and manufacturer M also adopts a green behavior strategy, which means that there is a green supply chain collaborative management relationship between supplier S and manufacturer M. Supplier S and manufacturer M choose to adopt green behaviors and need to pay a certain amount of additional green investment costs, respectively, CGS (CGS > 0) and CGM (CGM > 0), so as to obtain additional green investment income, respectively, RGS (RGS) > 0) and RGM (RGM > 0); the final green profits obtained by supplier S and manufacturer M are (RGS − CGS) and (RGM − CGM), respectively, and (RGS − CGS) > 0, (RGM − CGM) > 0. In addition, in order to encourage supply chain enterprises to adopt green behaviors and promote energy conservation and emission reduction, the government often grants certain subsidies to supply chain enterprises’ green behaviors. Among them, product greenness is used to describe the toxic and hazardous substance content of the product, the recycle-ability of product parts, the level of energy consumption, and the number of materials used, and it reflects the degree of energy conservation and environmental protection of green products. Green behavior is adopted for supplier S; the total amount of green raw materials provided is QS; and the government determines the unit raw material subsidy coefficient kS based on the greenness of raw materials gS, so the government green subsidy obtained by supplier S is kS*gS*QS. For manufacturer M taking green actions, the total amount of green products provided is QM, and the government determines the unit product subsidy coefficient kM based on the product’s green degree gM, so the government green subsidy obtained by manufacturer M is kM*gM*QM. In addition, when supplier S and manufacturer M take green actions at the same time, the synergistic benefits that can be obtained are TS (TS > 0) and TM (TM > 0), respectively.
(2) Supplier S adopts a green behavior strategy, and manufacturer M does not adopt a green behavior strategy, which means that there is no green supply chain collaborative management relationship between supplier S and manufacturer M. When supplier S adopts a green behavior strategy, on the one hand, it can obtain a green profit of (RGS − CGS), and (RGS − CGS) > 0. On the other hand, supplier S can also receive green subsidies kS*gS*QS from the government. Manufacturer M can only obtain ordinary profit (RM − CM) because it has not taken green actions, and RM − CM > 0. In addition, manufacturer M can “free ride” and obtain the positive external effects generated by supplier S’s green behavior, that is, the spillover benefit is ΠM (ΠM > 0), and at the same time, it needs to accept the cash penalty GM from the government (GM > 0).
(3) Manufacturer M adopts a green behavior strategy, and supplier S does not adopt a green behavior strategy, which means that there is no green supply chain collaborative management relationship between manufacturer M and supplier S. When manufacturer M adopts a green behavior strategy, on the one hand, it can obtain a green profit of (RGM − CGM), and (RGM − CGM) > 0. On the other hand, manufacturer M can also obtain green subsidies kM*gM*QM from the government. Supplier S can only obtain ordinary profit (RS − CS) because it has not taken green actions, and RS − CS > 0. In addition, supplier S can “free ride” and obtain the positive external effect of manufacturer M’s green behavior, that is, the spillover benefit is ΠS (ΠS > 0), and at the same time, it needs to accept the cash penalty GS (GS > 0) from the government.
(4) Supplier S does not adopt a green behavior strategy, and manufacturer M also does not adopt a green behavior strategy, which means that there is no green supply chain collaborative management relationship between supplier S and manufacturer M. Therefore, the only profits that the supplier S and the manufacturer M can obtain are (RS-CS) and (RM − CM), respectively, and RS − CS > 0, RM − CM > 0. In addition, supplier S and manufacturer M have to accept cash punishments GS and GM from the government because they have not taken green actions.
In summary, the profit matrix of green actions taken by supplier S and manufacturer M is shown in Table 1.
3.2. Model Solution
According to the above-constructed profit matrix between supplier S and manufacturer M, if the probability of manufacturer M choosing a green behavior strategy is y, the expected return of supplier S choosing a green behavior strategy is US1, and the expected return of supplier S not adopting green behavior strategy is US2.
Therefore, the average expected return of supplier S is US:
when the expected return of the supplier S that adopts green behavior strategy and that which does not adopt green behavior strategy is equal, the game equilibrium is achieved, that is, US1 = US2.
After sorting out, we obtain the formula:
(2) In the same way, according to the revenue matrix between supplier S and manufacturer M, if the probability of supplier S choosing the green behavior strategy is x, the expected return of manufacturer M choosing the green behavior strategy is UM1, and the expected benefit of manufacturer M not adopting the green behavior strategy is UM2.
Therefore, the average expected return of manufacturer M is UM:
When the expected return of the manufacturer M that adopts green behavior strategy and that which does not adopt green behavior strategy is equal, the game equilibrium is achieved, that is, UM1 = UM2.
After sorting out, we obtain the formula:
3.3. Model Analysis
In order to strengthen the management of the green supply chain, the enterprise cooperates with other supply chain node enterprises to adopt green behaviors, thereby enhancing the core competitive advantage. This paper will further analyze the influencing factors of green behaviors adopted by supply chain enterprises in order to clarify the theoretical and practical significance of the parameters of the game model.
(1) The probability of supplier S choosing the green behavior strategy is x*. It can be seen that the value of x* is related to the values of the eight parameters of CGM, GM, QM, RGM, TM, ΠM, gM, and kM according to the formula: .
When other parameters are established, for the numerator of x* value: ① The greater the green investment income (RGM) obtained by manufacturer M from taking green actions, the greater the possibility of supplier S taking green actions. ② The greater the green investment cost (CGM) invested by manufacturer M for adopting green behaviors is, the less likely it is for supplier S to adopt green behaviors. ③ The more serious the government punishment (GM) that manufacturer M suffers for not taking green behaviors is, the more likely it is that supplier S will adopt green behaviors. ④ The greater the green investment profit (RGM − CGM) of manufacturer M is, the more likely it is that supplier S will adopt green behavior. ⑤ The higher the product greenness (gM) of manufacturer M is, the more likely it is that supplier S will adopt green behavior. ⑥ The higher the government subsidy coefficient (kM) that manufacturer M can obtain per unit product is, the more likely it is for supplier S to take green behavior. ⑦ The more green product subsidies (gMkMQM) that manufacturer M can obtain, the more likely it is for supplier S to take green behavior. Similarly, when other parameters are established, for the denominator of the x* value: ① When the spillover benefit (ΠM) obtained by manufacturer M from not taking green behaviors is greater, the possibility of supplier S taking green behaviors is smaller. ② The greater the synergy (TM) obtained by manufacturer M due to green behavior, the greater the possibility that supplier S will adopt green behavior. ③ Seeing the difference (ΠM − TM) between the spillover benefit (ΠM) obtained by manufacturer M from not taking green behavior and the synergy benefit (TM) obtained by taking green behavior (ΠM − TM), the possibility of supplier S taking green behavior is the smaller.
To sum up, the probability that supplier S chooses the green behavior strategy and does not choose the green behavior strategy is affected by the values of many parameters of the manufacturer M. Among them, when the synergistic benefits obtained by manufacturer M by adopting green behaviors are significantly greater than the spillover benefits obtained by not adopting green behaviors, the greater is the possibility that supplier S chooses a green behavior strategy and conducts green supply chain collaborative management with the manufacturer as this difference increases.
(2) The probability that the manufacturer M chooses the green behavior strategy is y*. It can be seen that the value of y* is related to the values of the eight parameters such as CGS, GS, QS, RGS, TS, ΠS, gS, and kS, according to the formula: .
When other parameters are established, for the numerator of the y* value: ① The greater the green investment income (RGS) obtained by supplier S from adopting green behaviors, the greater the possibility that manufacturer M will adopt green behaviors. ② The greater the green investment cost (CGS) invested by supplier S for adopting green actions is, the less likely it is for manufacturer M to adopt green actions. ③ The more severe the government punishment (GS) that supplier S suffers for not taking green actions is, the more likely it is for manufacturer M to take green actions. ④ The greater the green investment profit (RGS − CGS) of supplier S is, the more likely it is for manufacturer M to adopt green behavior. ⑤ The higher the greenness (gS) of the raw materials of supplier S is, the more likely it is for manufacturer M to take green actions. ⑥ The higher the government subsidy coefficient (kS) that supplier S can obtain per unit of raw material is, the more likely it is for manufacturer M to take green behavior. ⑦ The more green raw material subsidies (gSkSQS) that supplier S can obtain, the more likely it is for manufacturer M to take green behavior. Similarly, when other parameters are established, for the denominator of the x* value: ① When the spillover benefit (ΠS) obtained by supplier S due to non-green behavior is greater, the possibility of manufacturer M adopting green behavior is greater. ② The greater the synergy (TS) obtained by supplier S as a result of green behavior, the greater the possibility that manufacturer M will adopt green behavior. ③ When the difference (ΠS − TS) between the spillover benefit (ΠS) obtained by supplier S by not taking green behavior and the synergistic benefit (TS) obtained by adopting green behavior (ΠS − TS) is greater, the possibility of manufacturer M taking green behavior is smaller.
In summary, the probability that manufacturer M chooses the green behavior strategy and does not choose the green behavior strategy is affected by the values of many parameters of the supplier S. Among them, when the synergistic benefits obtained by supplier S by adopting green behaviors are significantly greater than the spillover benefits obtained by not adopting green behaviors, the possibility of manufacturer M choosing a green behavior strategy and conducting green supply chain collaborative management with suppliers is greater as this difference increases.3.4. Equilibrium Stability Analysis of Enterprises’ Green Behaviors.
The evolution analysis of the green behavior of the supplier S and the manufacturer M, respectively, are as shown below. The replication dynamic differential equation of supplier S’s choice of green behavior strategy is as follows:
Let , obtain three critical values: .
The replication dynamic differential equation of manufacturer M’s choice of green behavior strategy is as follows:
Let , obtain three critical values: .
In summary, this paper has five equilibrium points A(0, 0), B(1, 0), C(0, 1), D(1, 1)
and E(, according to the formulas such as and . The Jacobi matrix J is as follows:
The above differential equations form a group dynamic system. Based on the construction of the Jacobi matrix, this paper further explores the local stability of each equilibrium point according to the change of the determinant of the Jacobi matrix and the sign of the trace under different conditions.
(1) When ,, and , the system has five equilibrium points, including three unstable points, a locally asymptotically stable point, and a saddle point. When the equilibrium point of the system is A (0, 0), the Jacobi matrix of the system is as follows:
The two characteristic roots λ1 and λ2 are both negative real parts. Therefore, the point A (0, 0) is a locally asymptotically stable point, that is, the strategy combination (not take, not take) is a system evolutionary stable strategy. The practical significance of this evolutionary stabilization strategy is that when the sum of the green investment profits of supplier S and manufacturer M, government fines, and government green subsidies is less than zero, both supplier S and manufacturer M will gradually choose not to take a green behaviors strategy. With the continuous expansion of the green investment profit range of supplier S and manufacturer M, the greater becomes the possibility that both parties will choose not to adopt green behavior strategies. In addition, the determinant of the Jacobi matrix corresponding to each equilibrium point and the sign of the trace are shown in Table 2.
(2) When , , and , the system has five equilibrium points, including three unstable points, a locally asymptotically stable point, and a saddle point. When the equilibrium point of the system is B (1, 0), the Jacobi matrix of the system is as follows:
The two characteristic roots λ1 and λ2 are both negative real parts. Therefore, the point B (1, 0) is a locally asymptotically stable point, that is, the strategy combination (take, not take) is a system evolutionary stable strategy. The practical significance of this evolutionary stabilization strategy is as follows. When supplier S’s green investment profit is greater than zero, the sum of manufacturer M’s green investment profit, government fines, and government green subsidies is less than zero, and the synergy benefit is less than the overflow benefit, supplier S will gradually choose green behavior strategy, and manufacturer M will gradually choose not to adopt green behavior strategy. In addition, the determinant of the Jacobi matrix corresponding to each equilibrium point and the sign of the trace are shown in Table 3.
(3) When , , and , the system has five equilibrium points, including three unstable points, a locally asymptotically stable point, and a saddle point. When the equilibrium point of the system is C (0,1), the Jacobi matrix of the system is as follows:
The two characteristic roots λ1 and λ2 are both negative real parts. Therefore, the point C (0, 1) is a locally asymptotically stable point, that is, the strategy combination (not take, take) is a system evolutionary stable strategy. The practical significance of this evolutionary stabilization strategy is as follows: When manufacturer M’s green investment profit is greater than zero, the sum of supplier S’s green investment profit, government fines, and government green subsidies is less than zero, and the synergy benefit is less than the overflow benefit, supplier S will gradually choose not to adopt a green behavior strategy, and manufacturer M will gradually choose to adopt a green behavior strategy. In addition, the determinant of the Jacobi matrix corresponding to each equilibrium point and the sign of the trace are shown in Table 4.
(4) When , , and , the system has five equilibrium points, including three unstable points, a locally asymptotically stable point, and a saddle point. When the equilibrium point of the system is D (1, 1), the Jacobi matrix of the system is as follows:
The two characteristic roots λ1 and λ2 are both negative real parts. Therefore, the point D (1, 1) is a locally asymptotically stable point, that is, the (take, take) strategy combination is a system evolutionary stable strategy. The practical significance of this evolutionary stabilization strategy is as follows. When the sum of the green investment profits of supplier S and manufacturer M, government fines, and government green subsidies is greater than zero and the spillover benefit is less than the synergistic benefit, both supplier S and manufacturer M will gradually choose to adopt green behavior strategies. In addition, the determinant of the Jacobi matrix corresponding to each equilibrium point and the sign of the trace are shown in Table 5.
(5) When and , this paper substitutes the equilibrium point E (x0, y0) into the Jacobi matrix, and the Jacobi matrix of this system is as follows:
Among them, and . Therefore, the equilibrium point E (x0, y0) is not the asymptotically stable point of the system, but the saddle point of the system.
From the local stability analysis of the above evolutionary game, the following inferences can be drawn: ① When y = y0 (0 ≤ y0 ≤ 1), there is always F(x) = 0, that is, no matter how the value of x is within the defined range, the system eventually will reach an evolutionary stable state. When the proportion of manufacturers adopting green behavior strategies is y0, no matter which strategy the supplier chooses or how likely it is to adopt a certain strategy, there is no difference in the benefits. When x = x0 (0 ≤ x0 ≤ 1), there will always be F(y) = 0, that is, no matter how the value of y is within the defined range, the system will eventually reach an evolutionary stable state. When the proportion of suppliers adopting green behavior strategies is y0, no matter which strategy the manufacturer chooses or how likely it is to adopt a certain strategy, there is no difference in its benefits. ② When y > y0, , at this time, x = 0 and x = 1 are two possible stable points. When x = 0, ; and when x = 1, . Therefore, the evolutionary game will reach a stable state, and x = 1 is the only possible stable point; that is, the strategy of supplier selection will gradually shift from not adopting green behavior to adopting green behavior, and adopting green behavior strategy will eventually become the evolutionary stability of the supplier strategy. In the same way, when y < y0, x = 0 is the only possible stable point; that is, the strategy of supplier selection gradually shifts from adopting green behavior to not adopting green behavior, and the strategy of not adopting green behavior will eventually become the evolution of the supplier stable strategy. ③ When x > x0, , at this time, y = 0 and y = 1 are two possible stable points. When y = 0, ; and when y = 1, . Therefore, the evolutionary game will reach a stable state, and y = 1 is the only possible stable point; that is, the strategy selected by the manufacturer gradually shifts from not adopting green behavior to adopting green behavior, and adopting a green behavior strategy will eventually become the evolutionary stability of the manufacturer strategy. Similarly, when x < x0, y = 0 is the only possible stable point; that is, the strategy selected by the manufacturer gradually shifts from adopting green behavior to not adopting green behavior, and the strategy of not adopting green behavior will eventually become the evolutionary stability of the manufacturer strategy.
3.4. Game Simulation Experiment of Enterprise Green Behavior
In order not to lose simplicity and generality, this paper sets the green investment return rate of supplier enterprise S as rGS, then the green investment return is RGS = (1 + rGS)CGS; the return rate of ordinary raw materials is rS, then, ordinary raw materials’ income is RS = (1 + rS)CS. Similarly, this paper sets the green investment yield of manufacturer M as rGM, then, the green investment yield is RGM = (1 + rGM)CGM; the general product yield is rM, then, the general product yield is RM = (1 + rM)CM. On this basis, the new replicated dynamic differential equations F(x) and F(y) of this research are obtained. The initial value settings of the parameters are shown in Table 6.
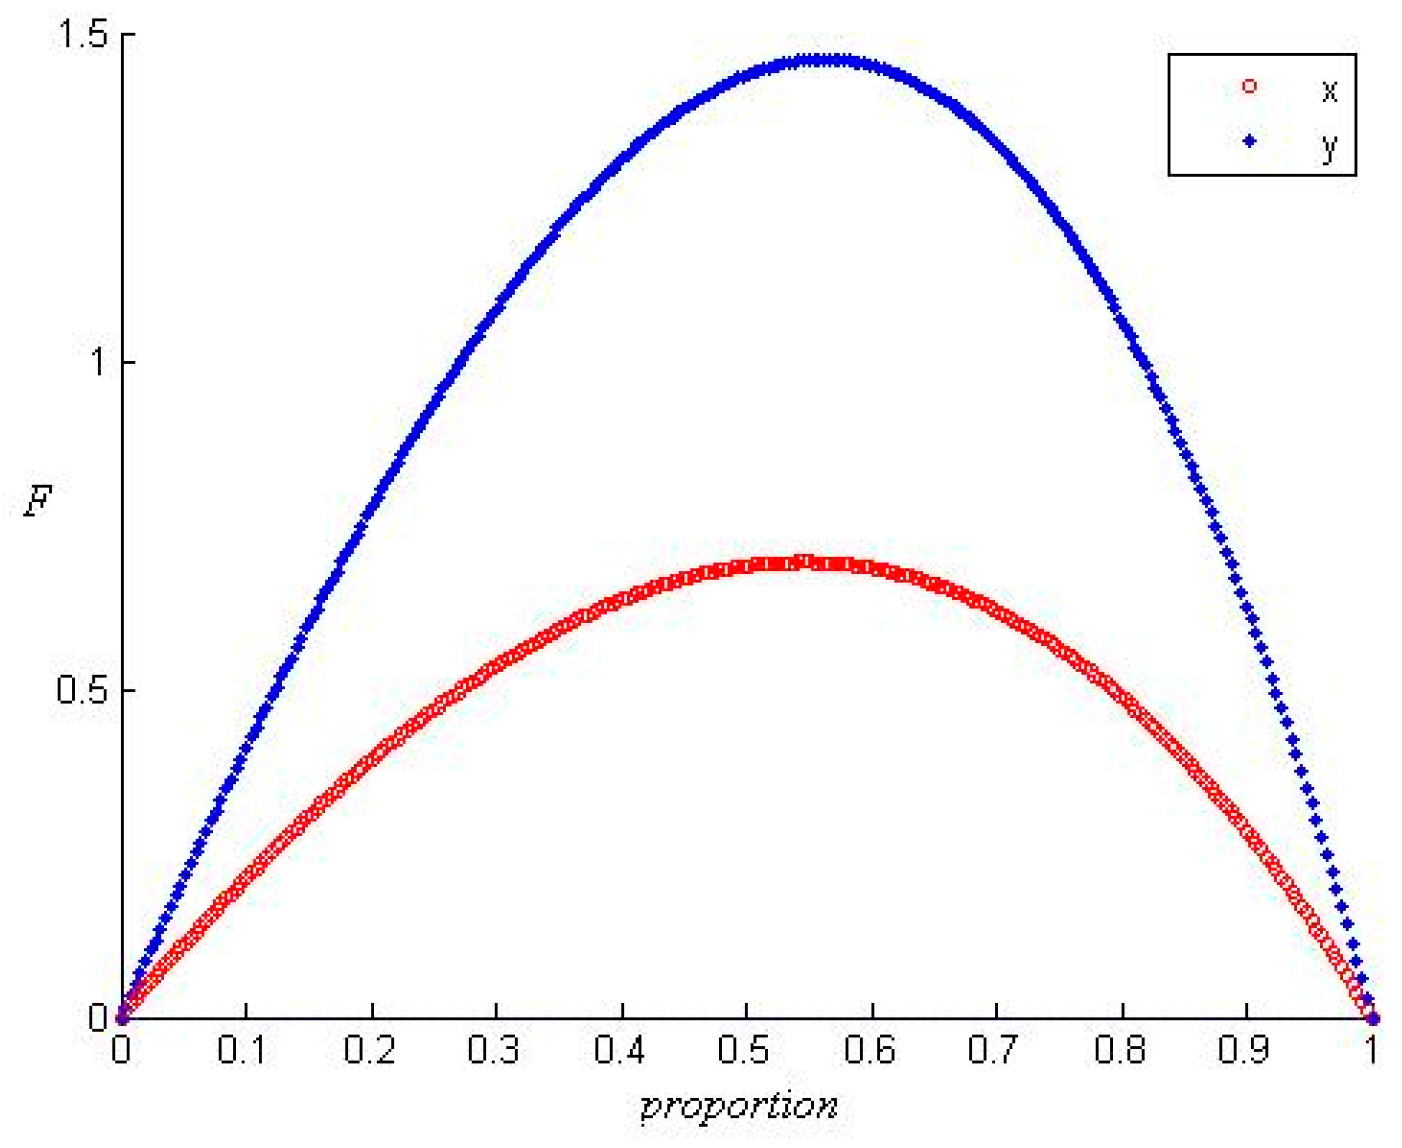
Based on the initial values of the above parameters, this paper uses MATLAB simulation software to simulate the green behavior strategies of supply chain enterprises. As shown in Figure 2, the proportion of green actions taken by the supplier enterprise S and the manufacturer enterprise M will eventually converge to 1, and the system will reach an ideal evolutionary stable state. In addition, in comparison, the manufacturer M will reach the ideal steady state with a faster convergence rate. The larger the value of x is, the more supplier companies choose to adopt green behavior strategies, and manufacturers often adjust their strategies quickly and also adopt green behaviors. In the same way, the larger the value of y is, the more manufacturers choose to adopt green behaviors. At this time, the suppliers will also pay attention to changes in the industry or the market, change their strategies in time, and adopt green behaviors. Generally speaking, when the other party’s behavioral strategy is established, the manufacturer’s response time to the external complex and changeable environment is relatively short, so it has strong sensitivity.
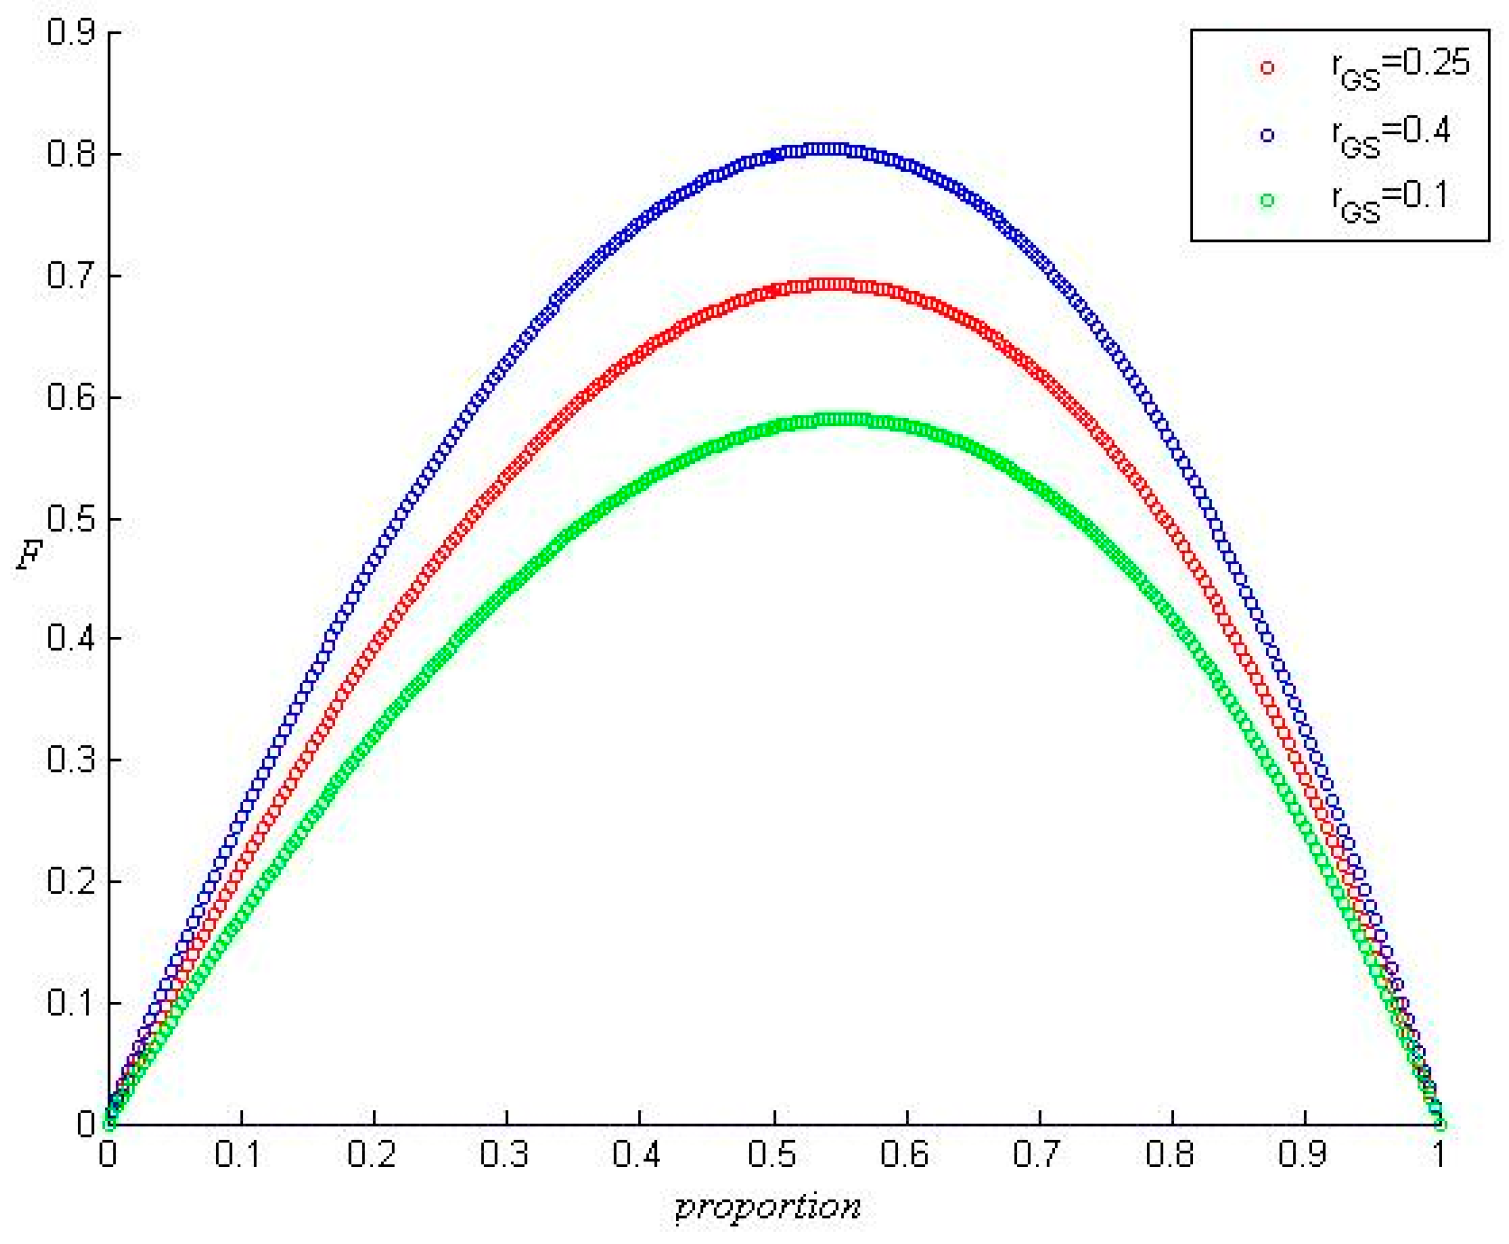
As shown in Figure 3, the initial value of the green investment return rate rGS of the supplier S is set from 0.25 to 0.1 and 0.4, respectively, and different simulation experimental results are obtained. When the green investment return rate of supplier S decreases, that is, rGS = 0.1, the proportion of suppliers choosing to adopt green behavior strategies decreases, and the sensitivity to changes in the external environment is also reduced. However, when the green investment return rate of supplier S increases, that is, rGS = 0.4, the proportion of suppliers choosing to adopt green behavior strategies increases, and the sensitivity to changes in the external environment also increases. It can be seen that the higher the green investment yield of supplier S, the greater the proportion of supplies that choose to adopt green behavior strategies; that is, when suppliers perceive that they can obtain more profits by increasing green investment, the more likely it is that they will choose a green behavior strategy.
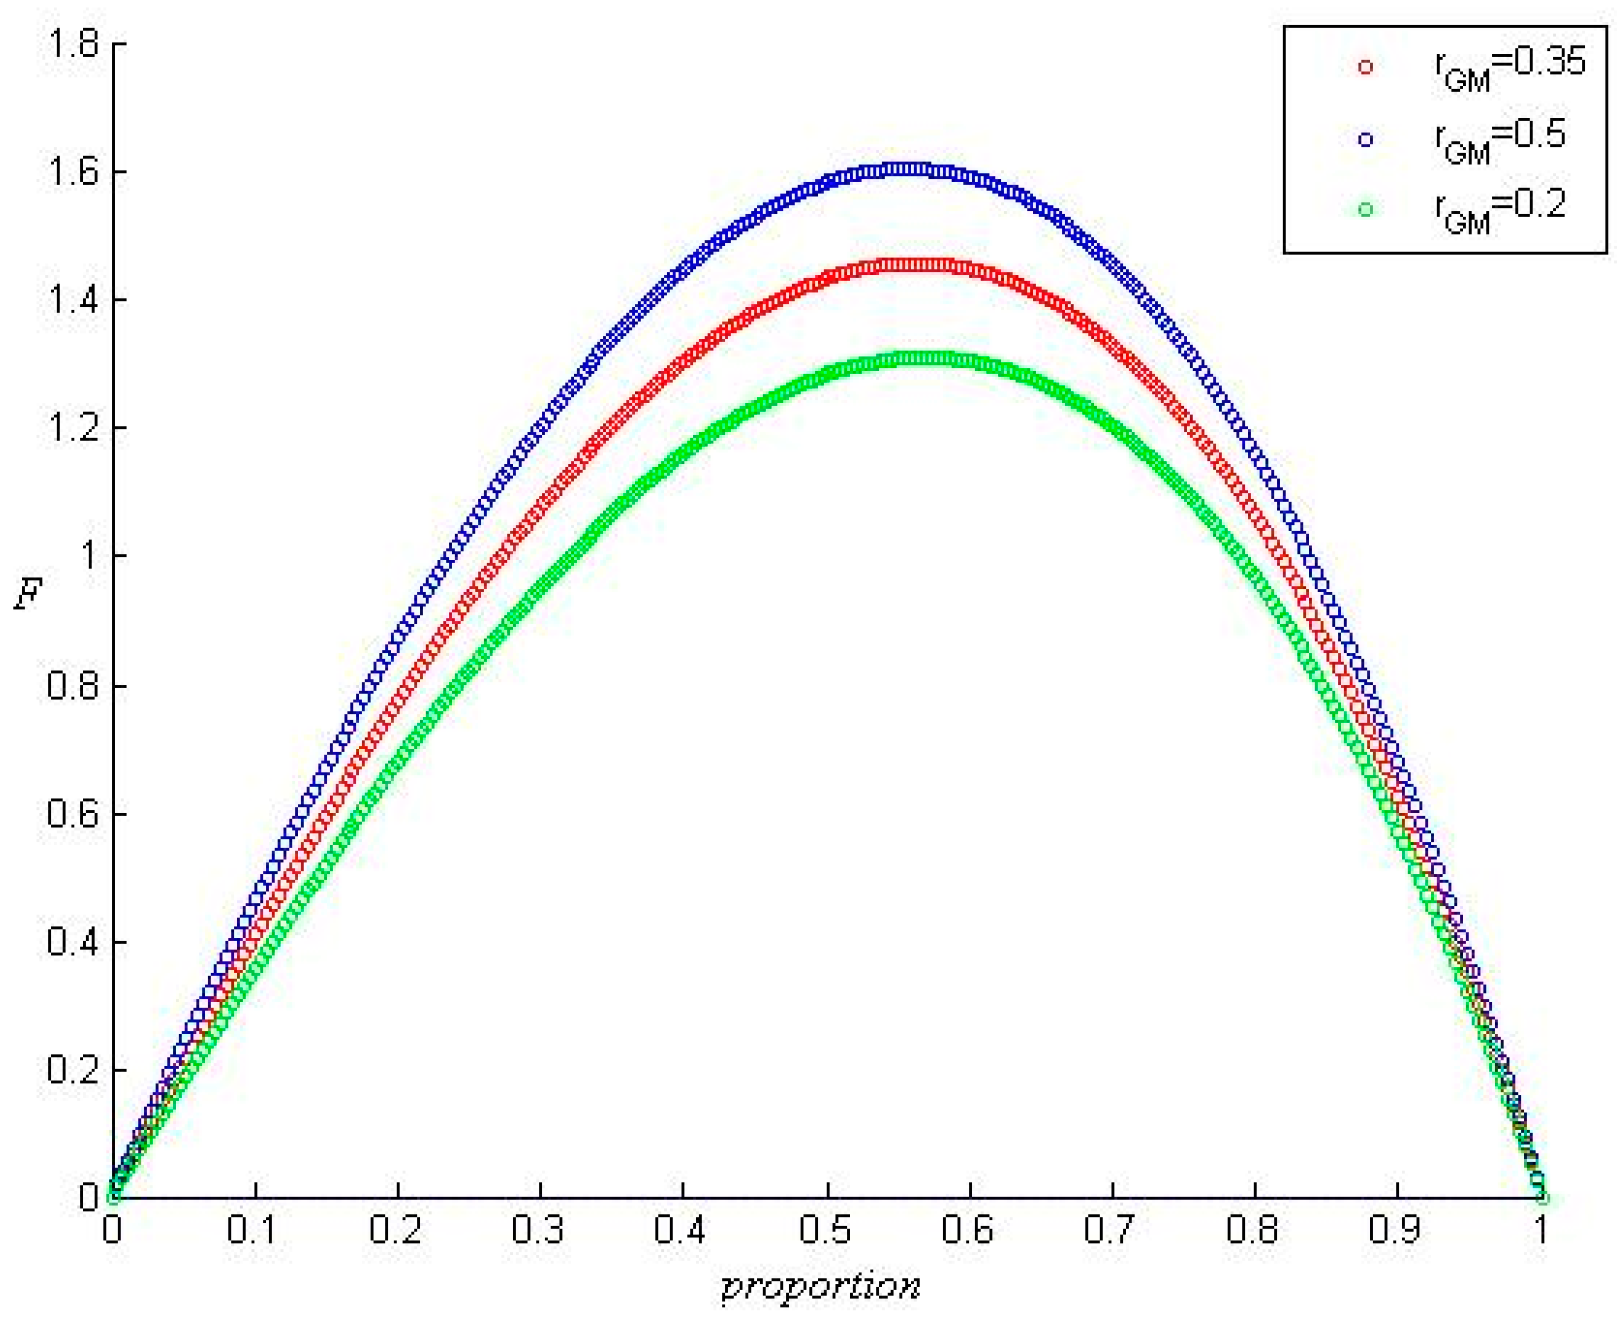
Similarly, as shown in Figure 4, the initial value of the green investment return rate rGM of manufacturer M is set from 0.35 to 0.2 and 0.5, respectively, and different simulation results are obtained. When the green investment yield of manufacturer M decreases, that is, rGM = 0.2, the proportion of manufacturers who choose to adopt green behavior strategies decreases, and their sensitivity to changes in the external environment also decreases. However, when the green investment yield of manufacturer M increases, that is, rGM = 0.5, the proportion of manufacturers choosing to adopt green behavior strategies increases, and their sensitivity to changes in the external environment also increases. It can be seen that the higher the green investment yield of the manufacturer, the greater the number of manufacturers choosing to adopt green behavior strategies; that is, when the manufacturer perceives that it can obtain more profits by increasing green investment, the more likely it is to choose a green behavior strategy.
4. Conclusions and Enlightenment
Based on the dynamic evolution game method, this paper clarified the path evolution direction and law of the green behavior strategy selection of supply chain enterprises. The conclusions of this paper mainly include the following two aspects.
On the one hand, whether a supply chain enterprise adopts green behaviors is related to factors such as green investment costs, green investment income, government green subsidy coefficients, greenness and quantity of raw materials or products, co-benefits, spillover benefits, and government penalties. The higher the green investment profit of a supply chain enterprise is, the more likely it is for the enterprise to choose a green behavior strategy; the higher the government subsidy coefficient is, the more likely it is for the enterprise to choose a green behavior strategy. The greater the synergistic benefits an enterprise obtains from adopting green behaviors are, the more likely it is for the enterprise to choose green behavior strategies. The more government fines and the greater the spillover benefits are, the more likely it is for enterprises to choose green behavior strategies.
On the other hand, the evolutionary result of the decision-making behavior of supply chain enterprises may be either adopting green behaviors or not adopting green behaviors. The result of this evolution depends on the green investment profits of the supply chain enterprises, the government subsidy coefficient, the greenness of raw materials or products, and government fines. With the continuous changes of various parameters, initial values and time t, the system will eventually converge to 1 and reach the ideal evolutionary stable state, that is, x = 1 is the evolutionary stable point, so adopting the green behavior strategy is an evolutionary stable strategy; or, it converges to 0, and the system thus reaches the ideal evolutionary stable state, that is, x = 0 is the evolutionary stable point, so it is an evolutionary stable strategy not to adopt the green behavior strategy.
Therefore, while other factors remain unchanged, supply chain enterprises should increase green investment income, reduce green investment costs, and maximize green investment profits, thereby increasing the possibility of adopting green behaviors. In addition, supply chain enterprises should increase the synergistic benefits obtained by adopting green behaviors and reduce the spillover benefits obtained by not adopting green behaviors, thereby increasing the probability of supply chain enterprises adopting green behaviors.
In summary, this paper explored the evolution direction and law of the green behavior of supply chain enterprises by constructing a game model for the evolution of supply chain enterprises’ green behaviors. On this basis, it analyzed the local stability of each equilibrium point and provided a reference for the supply chain enterprise green behavior decision-making. However, this paper still has limitations and deficiencies. For example, this paper only explored the green behavior of vertical supply chain enterprises in the secondary supply chain and has not explored the impact that the interaction between horizontal supply chain enterprises may have on the green behavior decisions of supply chain enterprises. Future research can build horizontal and the evolutionary game model of the green behavior of supply chain enterprises in the vertical two levels and provide a comprehensive and in-depth analysis of the influencing factors and evolutionary laws of the green behavior of supply chain enterprises. In addition, the actual supply chain network is a complex system that covers multiple participants. Therefore, subsequent research can further broaden the scope of supply chain network and refine the supply chain network structure when reconstructing the evolutionary game model of green behavior of supply chain enterprises, in order to explore the green behavior of multiple participants (suppliers, manufacturers, and retailers), and increase the enthusiasm of multiple participants to participate in the collaborative management of the green supply chain.
Author Contributions
The authors both contributed to this work. Conceptualization, H.Z. and X.S.; methodology, H.Z.; software, H.Z.; validation, H.Z.; formal analysis, H.Z.; investigation, H.Z.; resources, H.Z.; data curation, H.Z.; writing—original draft preparation, H.Z.; writing—review and editing, H.Z.; visualization, H.Z.; supervision, X.S.; project administration, X.S.; funding acquisition, X.S. All authors have read and agreed to the published version of the manuscript.
Funding
This research was funded by the General Projects of the National Social Science Fund (Research on industrial chain synergy mechanism of new type agricultural operators under high quality development target (19BGL150) and Shandong social science planning and research youth project (20DGLJ09).
Institutional Review Board Statement
Not applicable.
Data Availability Statement
No data used in this article.
Conflicts of Interest
The authors declare no conflict of interest.
References
- Zou, Z.Y.; Xin, P.Z.; Chao, Y.F.; Zhu, X.F. Research on the influence of executive green cognition and corporate green behavior on its green performance: Based on data of Shandong light industry enterprises. East China Econ. Manag. 2019, 12, 35–41. [Google Scholar]
- Wang, X.; Qin, S.S.; Wang, K. The exploration of corporate green technology innovation drive green development. J. Tech. Econ. Manag. 2014, 8, 26–29. [Google Scholar]
- Yang, X.R.; Li, J.Z. Research on the influence of individual network’s structural characteristics on enterprise green behavior. Econ. Probl. 2019, 12, 68–74. [Google Scholar]
- Xiao, H.J. Shared value, business ecosphere and the transformation of competitive paradigms for business. Reform 2015, 7, 129–141. [Google Scholar]
- Lan, Z.R.; Sun, Z.Q.; Cai, L.L. Evolutionary game of green-innovation investment in supply chains under low-carbon development. Sci. Technol. Manag. Res. 2019, 16, 257–263. [Google Scholar]
- Christmann, P. Effects of ‘best practices’ of environmental management on cost advantage: The role of complementary assets. Acad. Manag. J. 2000, 4, 663–680. [Google Scholar]
- Liu, H.M.; Wang, Y.; Li, H.J. The impcat of partnership and logistics capability on supply chain integration. Chin. J. Manag. Sci. 2016, 12, 148–157. [Google Scholar]
- Xue, M. The influence of supply chain partner characteristics on supply chain financing in perspective of network capacity variance: Intermediary role of relational capital. Manag. Rev. 2018, 6, 238–250. [Google Scholar]
- Reza, P.M.; Abbas, S. The impact of customers’ channel preference on pricing decisions in a dual channel supply chain with a dominant retailer. J. Ind. Prod. Eng. 2021, 31, 1–19. [Google Scholar] [CrossRef]
- He, M.K.; Wang, W.J. International reference and China’s strategies for the development of modern supply chain. Reform 2018, 1, 22–35. [Google Scholar]
- Surana, A.; Kumara, S. Supply-chain networks: A complex adaptive systems perspective. Int. J. Prod. Res. 2005, 20, 4235–4265. [Google Scholar] [CrossRef]
- Sheng, S.Y. Research on the construction of supply chain information resource sharing model based on block chain Technology. Inf. Sci. 2021, 7, 162–168. [Google Scholar]
- Zhou, K.D. Business Economics; China Outlook Press: Beijing, China, 1987. [Google Scholar]
- Feng, C.L.; Zhang, M.Y.; Liu, H.T.; Zhang, H.Z.; He, M.H. Research on the relationship between supply chain knowledge sharing and firm performance: The mediating and moderating effect of supply chain agility and environmental dynamics. Manag. Rev. 2015, 11, 181–191. [Google Scholar]
- Burt, R.S. Structural Holes: The Social Structure of Competition; Harvard University Press: Cambridge, MA, USA, 1992. [Google Scholar]
- Wang, Y.L.; Jiang, H. Research on the theoretical context and evolution logic of enterprise environmental behavior. Foreign Econ. Manag. 2012, 8, 26–34. [Google Scholar]
- Yang, S.; Cai, L. An evolutionary game model of green behavior decision making based on the cumulative prospect theory. J. Anhui Jianzhu Univ. 2019, 5, 79–85. [Google Scholar]
- Sarkis, J. Evaluating environmentally conscious business practices. Eur. J. Oper. Res. 1998, 1, 159–174. [Google Scholar] [CrossRef]
- Yang, D.; Chai, H.M. A review of driving factors of green technology innovation and its effect on firm’s performance. China Popul. Resour. Environ. 2015, 11, 132–136. [Google Scholar]
- Li, G.P. Environmental regulation, R & D investment and enterprises’ green technological innovation capability. Sci. Sci. Manag. S T 2018, 11, 61–73. [Google Scholar]
- Berry, M.A.; Rondinelli, D.A. Proactive corporate environmental management: A new industrial revolution. Acad. Manag. Exec. 1998, 2, 38–50. [Google Scholar] [CrossRef] [Green Version]
- Henriques, I.; Sadorsky, P. The relationship between environmental commitment and managerial perceptions of stakeholder importance. Acad. Manag. J. 1999, 1, 87–99. [Google Scholar]
- He, A.Z.; Du, J.; Chen, M.L. The mechanism on the impact of retailers’ green perception and emotion on green behavior. China Soft Sci. 2013, 4, 117–127. [Google Scholar]
- Sharma, S. Managerial interpretations and organizational context as predictors of corporate choice of environmental strategy. Acad. Manag. J. 2000, 4, 681–697. [Google Scholar]
- Lesley, S. When case studies are not enough: The influence of corporate culture and employee attitudes on the success of cleaner production initiatives. J. Clean. Prod. 2000, 5, 353–359. [Google Scholar]
- Xie, X.B.; Wu, Y.; Feng, Z.L.; Hao, Z.T. Investigation of green behavior of resource-based enterprise in China. China Popul. Resour. Environ. 2015, 6, 5–11. [Google Scholar]
- Wang, F.; Wang, A.Q. New progress of enterprise environmental behavior research. Econ. Perspect. 2012, 1, 124–129. [Google Scholar]
- Chen, Y.S.; Lai, S.B.; Wen, C.T. The influence of green innovation performance on corporate advantage in Taiwan. J. Bus. Ethics 2006, 4, 331–339. [Google Scholar] [CrossRef]
- Zhang, N.; Zhang, J.; Tian, H.R. Social responsibility characters on employee green behavior: Mechanism model based on ethical decision making. Hum. Resour. Dev. China 2021, 3, 33–47. [Google Scholar]
- Hart, R. Growth, environment and innovation: A model with production vintages and environmentally oriented research. J. Environ. Econ. Manag. 2004, 3, 1078–1098. [Google Scholar] [CrossRef]
- Shi, H.; Peng, S.Z.; Liu, Y.; Zhong, P. Barriers to the implementation of cleaner production in Chinese SMEs: Government, industry and expert stakeholders’ perspectives. J. Clean. Prod. 2008, 7, 842–852. [Google Scholar] [CrossRef]
- Ervin, D.; Wu, J.J.; Khanna, M.; Jones, C.; Wirkkala, T. Motivations and barriers to corporate environmental management. Bus. Strategy Environ. 2013, 6, 390–409. [Google Scholar] [CrossRef]
- Ma, Z.L.; Hu, Y.L. “Profit-driving nature or market incentives” Investigation on green behaviors of heavy pollution enterprises. Ecol. Econ. 2019, 9, 164–169. [Google Scholar]
- Shao, L.M.; Gao, Y.Q.; Wang, S. Environmental regulation and green behavior choice of resource-based enterprises ‘reverse transformation’ or ‘regulation capture’. J. Hohai Univ. (Philos. Soc. Sci.) 2018, 6, 62–93. [Google Scholar]
- Gasbarro, F.; Rizzi, F.; Frey, M. The mutual influence of environmental management systems and the EU ETS: Findings for the Italian pulp and paper industry. Eur. Manag. J. 2013, 1, 16–26. [Google Scholar] [CrossRef]
- Yan, L.; Li, J.Y.; Xie, X.B. Research on the formation process of green strategy of resource based enterprises: Based on the case of Hubei Xingfa group. Sci. Technol. Prog. Policy 2014, 10, 95–100. [Google Scholar]
- Hu, Y.L.; Zheng, W. Research on the Impact of Environmental Regulation on Enterprise Performance; Economic Management Press: Beijing, China, 2018. [Google Scholar]
- Li, Y.Q.; Xie, L.S. Social network analysis in organizational management research: Current status and future directions. Chin. J. Manag. 2013, 1, 146–154. [Google Scholar]
- Szegedi, Z.; Gabriel, M.; Papp, I. Green supply chain awareness in the hungarian automotive industry. Pol. J. Manag. Stud. 2017, 1, 259–268. [Google Scholar] [CrossRef]
- Kot, S.; Haque, A.U.; Kozlovski, E. Mediating effect of strategic supply chain management on social and environmental sustainability: Evidence from SMEs of Canada, Iran, and Turkey. Int. J. Supply Chain. Manag. 2019, 6, 105–117. [Google Scholar]
- Kot, S.; Haque, A.U.; Kozlovski, E. Strategic SCM’s Mediating Effect on the Sustainable Operations: Multinational Perspective. Organizacija 2019, 3, 219–235. [Google Scholar] [CrossRef] [Green Version]
- Urbański, M.; Ul Haque, A. Are you environmentally conscious enough to differentiate between greenwashed and sustainable items? A global consumers perspective. Sustainability 2020, 12, 1–25. [Google Scholar]
- Zhu, Q.H.; Dou, Y.J. A game model for green supply chain management based on government subsidies. J. Manag. Sci. China 2011, 6, 86–95. [Google Scholar]
- Jian, J.; Guo, Y.; Jiang, L.; An, Y.; Su, J. A multi-objective optimization model for green supply chain considering environmental benefits. Sustainability 2019, 21, 5911. [Google Scholar] [CrossRef] [Green Version]
Figure 1.
Supply chain network diagram.

Figure 2.
Initial simulation results.

Figure 3.
Analysis of simulation experiment results (1).

Figure 4.
Analysis of simulation experiment results (2).


Table 1.
The profit matrix of green behavior of supply chain enterprises.
| Supplier S | |||
|---|---|---|---|
| Take (x) | Not Take (1 − x) | ||
| Manufacturer M | take (y) | RGM − CGM + RM − CM + kM × gM × QM + TM, RGS − CGS + RS − CS + kS × gS × QS + TS | RGM − CGM + RM−CM + kM × gM × QM, RS − CS − GS + ΠS |
| not take (1 − y) | RM − CM − GM + ΠM, RGS − CGS + RS − CS + kS × gS × QS | RM − CGM − CM, RS − CGS − CS | |
Table 2.
Analysis of the local stability of the equilibrium point.
| Equilibrium Point | Symbols of Jacobi Matrix Determinant | Symbols of Jacobi Matrix Traces | Local Stability |
|---|---|---|---|
| A (0, 0) | + | − | ESS |
| B (1, 0) | + | + | Unstable |
| C (0, 1) | − | ± | Unstable |
| D (1, 1) | + | + | Unstable |
| E (x0, y0) | − | 0 | Saddle point |
Table 3.
Analysis of the local stability of the equilibrium point.
| Equilibrium Point | Symbols of Jacobi Matrix Determinant | Symbols of Jacobi Matrix Traces | Local Stability |
|---|---|---|---|
| A (0, 0) | − | ± | Unstable |
| B (1, 0) | + | − | ESS |
| C (0, 1) | + | + | Unstable |
| D (1, 1) | − | ± | Unstable |
| E (x0, y0) | − | 0 | Saddle point |
Table 4.
Analysis of the local stability of the equilibrium point.
| Equilibrium Point | Symbols of Jacobi Matrix Determinant | Symbols of Jacobi Matrix Traces | Local Stability |
|---|---|---|---|
| A (0, 0) | − | ± | Unstable |
| B (1, 0) | + | + | Unstable |
| C (0, 1) | + | − | ESS |
| D (1, 1) | − | ± | Unstable |
| E (x0, y0) | − | 0 | Saddle point |
Table 5.
Analysis of the local stability of the equilibrium point.
| Equilibrium Point | Symbols of Jacobi Matrix Determinant | Symbols of Jacobi Matrix Traces | Local Stability |
|---|---|---|---|
| A (0, 0) | + | + | Unstable |
| B (1, 0) | − | ± | Unstable |
| C (0, 1) | − | ± | Unstable |
| D (1, 1) | + | − | ESS |
| E (x0, y0) | − | 0 | Saddle point |
Table 6.
Initial values of parameters and implications.
| Parameter Name | Initial Value | Parameter Implication of M | Parameter Name | Parameter Implication | Parameter Implication of S |
|---|---|---|---|---|---|
| rGM | 0.35 | Green investment yield | rGS | 0.25 | Green investment rate of return |
| rM | 0.2 | Ordinary product yield | rS | 0.1 | Ordinary raw material rate of return |
| CGM | 4 | Green investment cost | CGS | 3 | Green investment cost |
| CM | 2 | Ordinary production cost | CS | 1 | Ordinary production cost |
| kM | 0.3 | Government unit product subsidy coefficient | kS | 0.2 | Government unit raw material subsidy coefficient |
| gM | 0.7 | Product green degree | gS | 0.5 | Raw material greenness |
| QM | 4 | Total production of products | QS | 5 | Total amount of raw materials provided |
| TM | 4 | Synergy benefits obtained | TS | 3 | Synergy benefits obtained |
| ΠM | 1 | Spillover benefits obtained | ΠS | 2 | Spillover benefits obtained |
| GM | 2 | Government punishment accepted | GS | 1 | Government punishment accepted |
Publisher’s Note: MDPI stays neutral with regard to jurisdictional claims in published maps and institutional affiliations. |
© 2021 by the authors. Licensee MDPI, Basel, Switzerland. This article is an open access article distributed under the terms and conditions of the Creative Commons Attribution (CC BY) license (https://creativecommons.org/licenses/by/4.0/).
Share and Cite
MDPI and ACS Style
Zhang, H.; Su, X. The Applications and Complexity Analysis Based on Supply Chain Enterprises’ Green Behaviors under Evolutionary Game Framework. Sustainability 2021, 13, 10987. https://0-doi-org.brum.beds.ac.uk/10.3390/su131910987
AMA Style
Zhang H, Su X. The Applications and Complexity Analysis Based on Supply Chain Enterprises’ Green Behaviors under Evolutionary Game Framework. Sustainability. 2021; 13(19):10987. https://0-doi-org.brum.beds.ac.uk/10.3390/su131910987
Chicago/Turabian StyleZhang, Hui, and Xin Su. 2021. "The Applications and Complexity Analysis Based on Supply Chain Enterprises’ Green Behaviors under Evolutionary Game Framework" Sustainability 13, no. 19: 10987. https://0-doi-org.brum.beds.ac.uk/10.3390/su131910987
Note that from the first issue of 2016, this journal uses article numbers instead of page numbers. See further details here.