Article

Number of Times Recycled and Its Effect on the Recyclability, Fluidity and Tensile Properties of Polypropylene Injection Molded Parts

College of Engineering and Science, Feng Chia University, Taichung 40724, Taiwan
*
Author to whom correspondence should be addressed.
Sustainability 2021, 13(19), 11085; https://0-doi-org.brum.beds.ac.uk/10.3390/su131911085
Submission received: 1 September 2021 / Revised: 1 October 2021 / Accepted: 5 October 2021 / Published: 7 October 2021
(This article belongs to the Special Issue Renewable Energy Technologies and Environmental Impact Assessment)

Abstract

:
The ease with which modern plastics can be injection molded makes them very suitable for the production of many different products and, today, plastics are often used as substitutes for metal. Polypropylene (PP) is one of the most widely used thermoplastics globally since it is very useful, cost-effective and flexible for molding. However, the amount of harm to the environment caused by plastic waste has become phenomenal and the recycling of plastics has become a serious aspect of environmental protection. PP, as the most commonly used plastic material, was selected for use in this study. It has a melt flow index of 15 g/min and its recyclability, fluidity, and physical properties, as well as manufacturing conditions, were explored in relation to the number of times the material could be recycled (TR). A cavity pressure sensor was used to measure the viscosity index of the recycled plastic after multiple cycles of plasticizing and injection, part molding, scrap-recycling, and crushing. A paperclip-shaped test specimen was used to determine PP fluidity and crystallinity of specimens with different TRs. Tensile tests were used to detect differences in the tensile strength between specimens made from Raw-PP and recycled PP. The results showed that PP that had been recycled several times had a higher melt flow index, material fluidity, melting peak area, crystallinity, crystallization rate, and crystallization temperature. Repeated injection and recycling of the material had reduced the length of the molecular chains and broadened the molecular weight distribution. This improved the fluidity and increased crystallinity. The increase in fluidity made cavity filling easier, reducing the cavity pressure as well as the viscosity index. The results of this study showed that the recycling of the PP could improve the physical properties of the products to a degree and also went some way to further the benefits of a circular economy. The recycling of injection-molded PP material can be added to renewable energy technologies and used in environmental impact assessment.

1. Introduction

The advancement of science and technology has led to the rapid development of human social and economic activities. With the abundance of material life, people’s lifestyles have also evolved towards mass production, mass consumption, and mass disposal, which has caused the influence of the living process on the environment to exceed its natural resilience. Among the issues, waste plastics has attracted more and more attention [1,2,3,4,5]. The primary problem is that most plastics are not biodegradable, and there is not enough experience in recycled material molding. The improper disposal of waste plastic, as well as vast littering, causes serious environmental contamination [6,7,8,9]. Polypropylene (PP) is the most abundant polymer worldwide, with an estimated accumulation rate of 25 million tons per year, and the applications of PP are wide-ranging, in everyday products, packing, transportation, catering, etc. [10,11,12,13,14,15,16,17,18]. The management of waste plastic is a vital issue that must be addressed on a global scale through policy and proper waste management. After some careful research [19,20,21,22], the blending of raw and reprocessed PP has become routine and the process usually involves adding 10% to 30% recycled material to raw components to avoid any serious changes in the mechanical properties or process ability of the product. These reprocessed PP blends have the same properties and are very similar to virgin PP; the only clear change is a decrease in the molecular weight caused by the repetitive melt processing operations. A comparison of the isothermal crystallization behavior of virgin PP and the PP blends also shows deviations from that of the virgin material. The higher degree of crystallinity also increased tensile properties and the PP blends showed only slight changes from that of the virgin material. These results indicate that the potential for the manufacture of products with consistent mechanical performance from recycled PP is promising. However, many studies have shown that a recycling approach cannot reduce plastic dependency, or solve the issues related to its use in a comprehensive way that is acceptable to all stakeholders.
According to the literature, for most plastic materials that are repeatedly injected and recycled, the flow characteristics and mechanical properties of the material will be affected. The purpose of this study is to grasp the change of PP properties and rheological behavior and investigate the variation of the melt flow length to part thickness ratio (L/t; melt flow length ratio abbreviated here as MIFr) with the number of times that the material was recycled (times recycled, TRs) for injection molding. On the other hand, in current research, few studies have investigated materials recycled two or more times. Therefore, Equation (1) will be introduced in the study to examine the melt flow behavior and MIFr. Equation (1) was used to characterize PP with different TRs in injection molding. The MIFr must be determined, in the equation, “L” is the total melt flow length, and “t” is the average thickness (1 is the location of the cold slug well, 2 is the gate location, 3 is the gate location and 4 is the cavity-geometric, etc.; Figure 1) [23,24,25]. MIFr (L/t) can be used to determine the gate location and to balance the melt filling within the cavity, and can also be applied to measure the PP and different TRs in melt-fluidity and material characterize.
L / t = L 1 / t 1 + L 2 / t 2 + L 3 / t 3 + L 4 / t 4
On the other hand, current researchers are also discussing the ecological and economic impacts of recycling in additive production. Their papers discuss the possibility of using waste material created using the mixed-regrind material technology for recycling and subsequent product manufacturing through injection production. However, in recent research, few studies have investigated materials recycled two or more times and the resulting changes in material and physical properties. It has not been proposed to use recycled materials for injection molding, which can be used to research renewable energy technology and environmental impact assessment. Therefore, in this study, the raw material used was polypropylene (abbreviated here as Raw-PP), and the using PP was recycled various numbers of times (number of times recycled used were ≥1; abbreviated here as Tr-PP), and an injection molding machine was used to observe changes in the material melt flow behavior, crystallization, and mechanical properties. Additionally, a 1 mm thick and 6 mm wide paperclip-shape test specimen and mold were constructed in this study for observation of flow characteristics. A tensile test was also conducted to study the tensile properties of the Raw-PP and Tr-PP material by varying several processing parameters (i.e., melt temperature, back pressure, and screw speed) to evaluate the changes in the tensile strength (The ASTM-D638 standard tensile test part was used in this experiment).

2. Experimental Method and Related Information

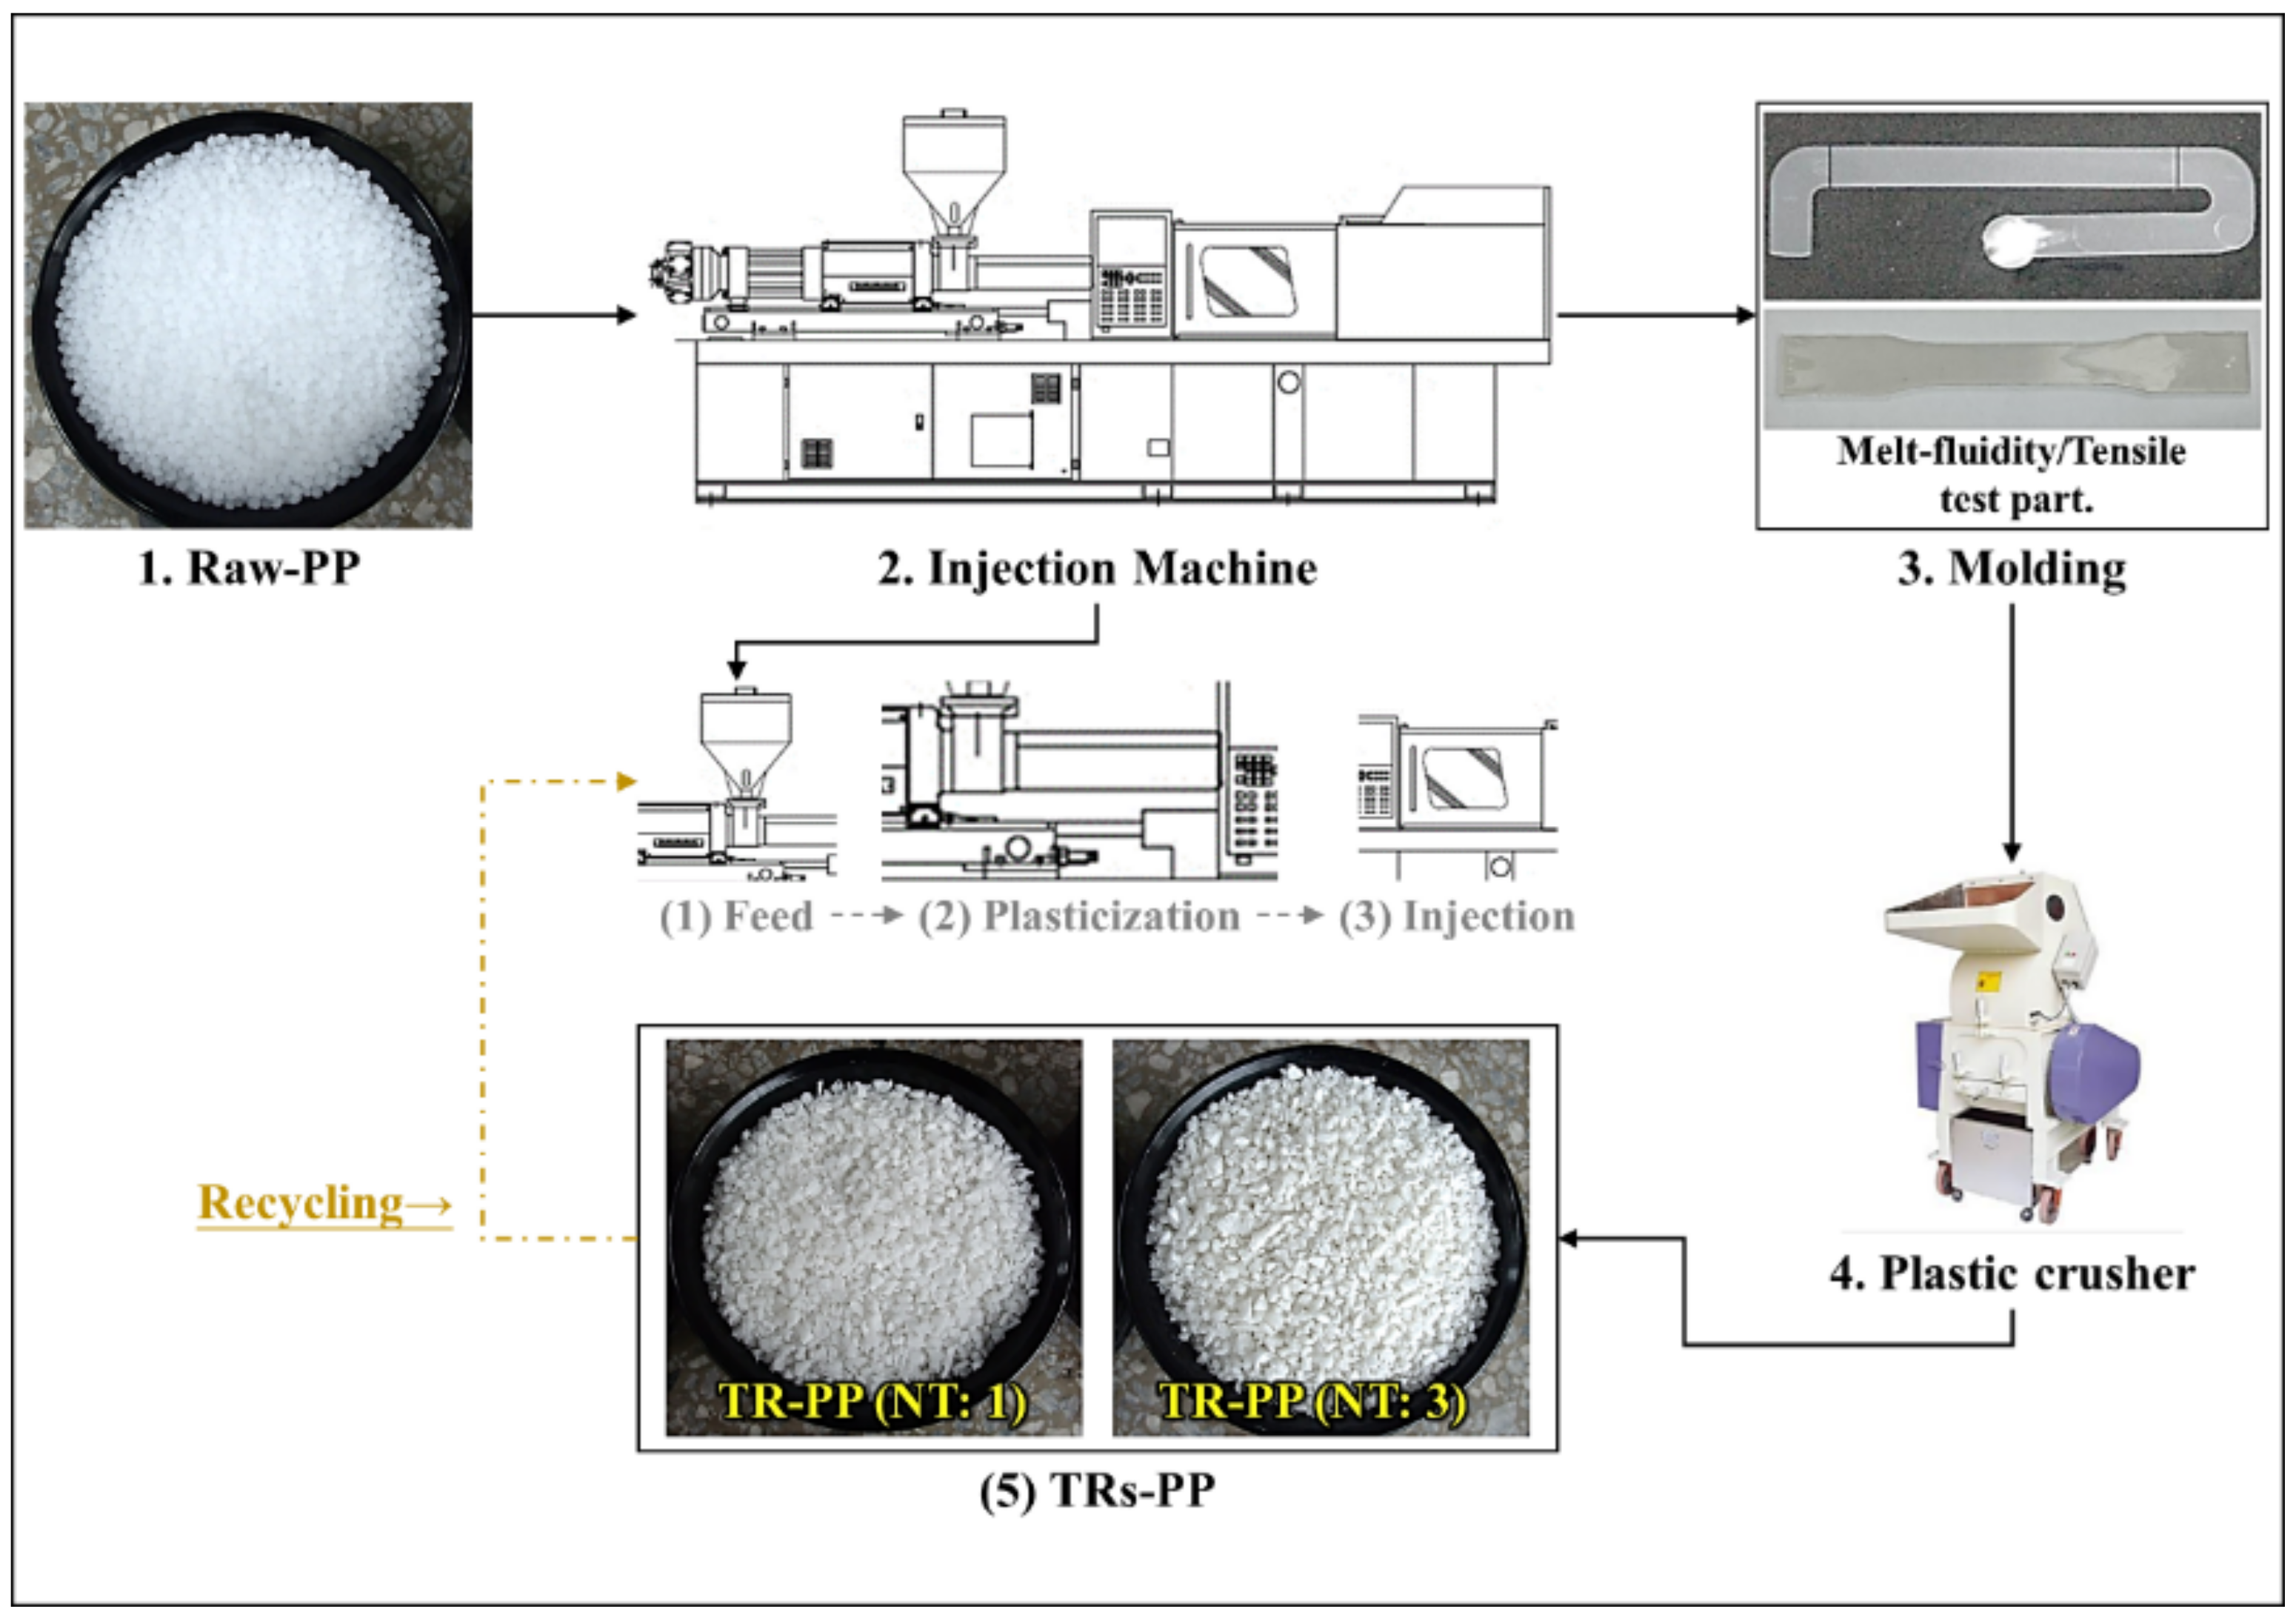
2.1. Material Preparation

The polypropylene raw material (Raw-PP) used in this study was PP-6331 manufactured by Lee-Chang-Yung Chemical Co Ltd. The density of PP-6331 is 0.903 g/cc and it has a melt flow index of 15 g/10 min at 230 °C. It was recycled up to five times, the process of plasticization, injection, part molding, and crushing (Tr-PP) being repeated each time, see Figure 2. The Raw-PP (pellets) and Tr-PP (granules) were dried for 4 h at 80 °C before use. It can be seen from Figure 2 that the material loses its original gloss after being reused, it is rougher in appearance and also shows color changes.

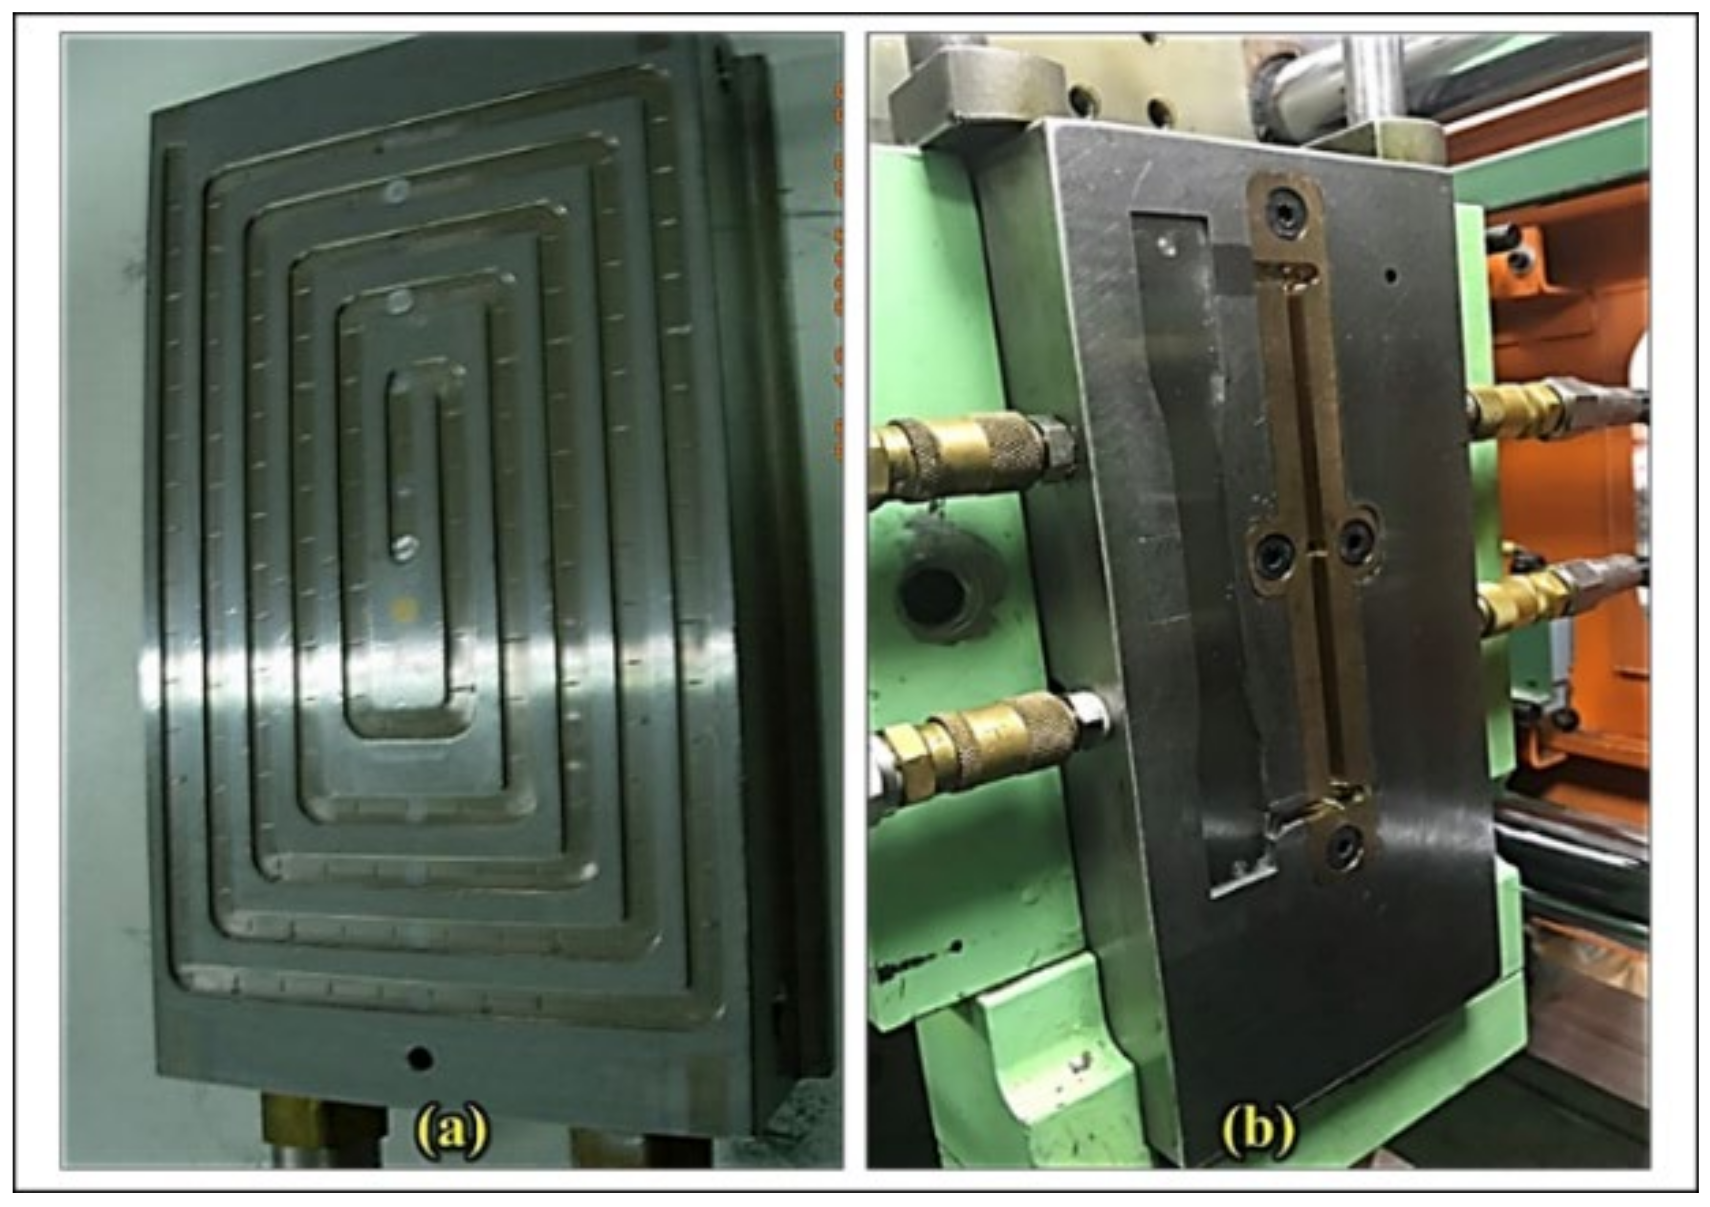
2.2. Molding Equipment

The injection molding machine used in these experiments was a CLF-60TX from the Chuan-Lih-Fa Machinery Works Co Ltd. Table 1 shows the injection parameters. The total mold clamp force is 60 tons and it has an ECO STAR 22 kW servo system. An accurate injection control and procedure monitoring system ensures stable molding conditions, plasticizing quality, and screw position control. An injection rate of 115 cm3/s from a rotating single cylinder was used and the injection quantity was the theoretical shot volume multiplied by the polystyrene plastic coefficient of 0.91). The maximum system pressure was 170 bar, and the injection pressure was 2951 kg/cm2. The melt temperature value was set by the barrel heater bands and the temperature profile along the barrel was 210 °C.
To observe and determine the flow-ability of the PP (both Raw and Tr) a paperclip shape injection mold was designed and used, see Figure 3a. The molded specimen was 6 mm wide × 1 mm thick and the total mold length was 1780 mm. PP recycled a different number of times was used to measure the melt flow characteristics (flow length ratios). The amount of melt used was determined by a fixed screw position of 10 mm. The melt flow length was measured directly, and the ratio of the melt flow length to the sample thickness was calculated using Equation (1). In addition, to observe the tensile strength of Raw-PP and Tr-PP material, as specified under ASTM-D638, a standard tensile test-part was used in this experiment and the size design using Type I (length overall is 165 mm, width overall is 19 mm, the width of the narrow section is 13 mm), the appearance of the mold-cavity is shown in Figure 3b.

2.3. Characterization

Tests of the material melt-fluidity and tensile properties of specimens molded using Raw-PP and Tr-PP that had undergone between one and five recycling processes were carried out. For each, 20 samples were tested under identical conditions, and the average value of the last 15 (samples size of 15) was used for analysis. Equation (1) was used to calculate the melt flow-length-ratio variations to determine the fluidity of the raw and recycled materials in the flow-length test mold. For these experiments, a melt temperature of 210 °C, a back pressure of 5 bar, and a screw speed was 100 rpm were selected as the molding standards. In addition, the correlation of the melt flow index (MFI) on the tensile strength and melt-pressure viscosity index of Raw-PP and material that had been recycled 1 and 3 times was also investigated. The correlated processing parameters of the tensile samples during the Raw-PP and Tr-PP injection molding process are shown in Table 2.
In the parameter table set, the back pressure and melt temperature with respect to the tensile strength and melt viscosity index were also investigated. The details of the material characteristics and fluidity testing were as follows:
i.
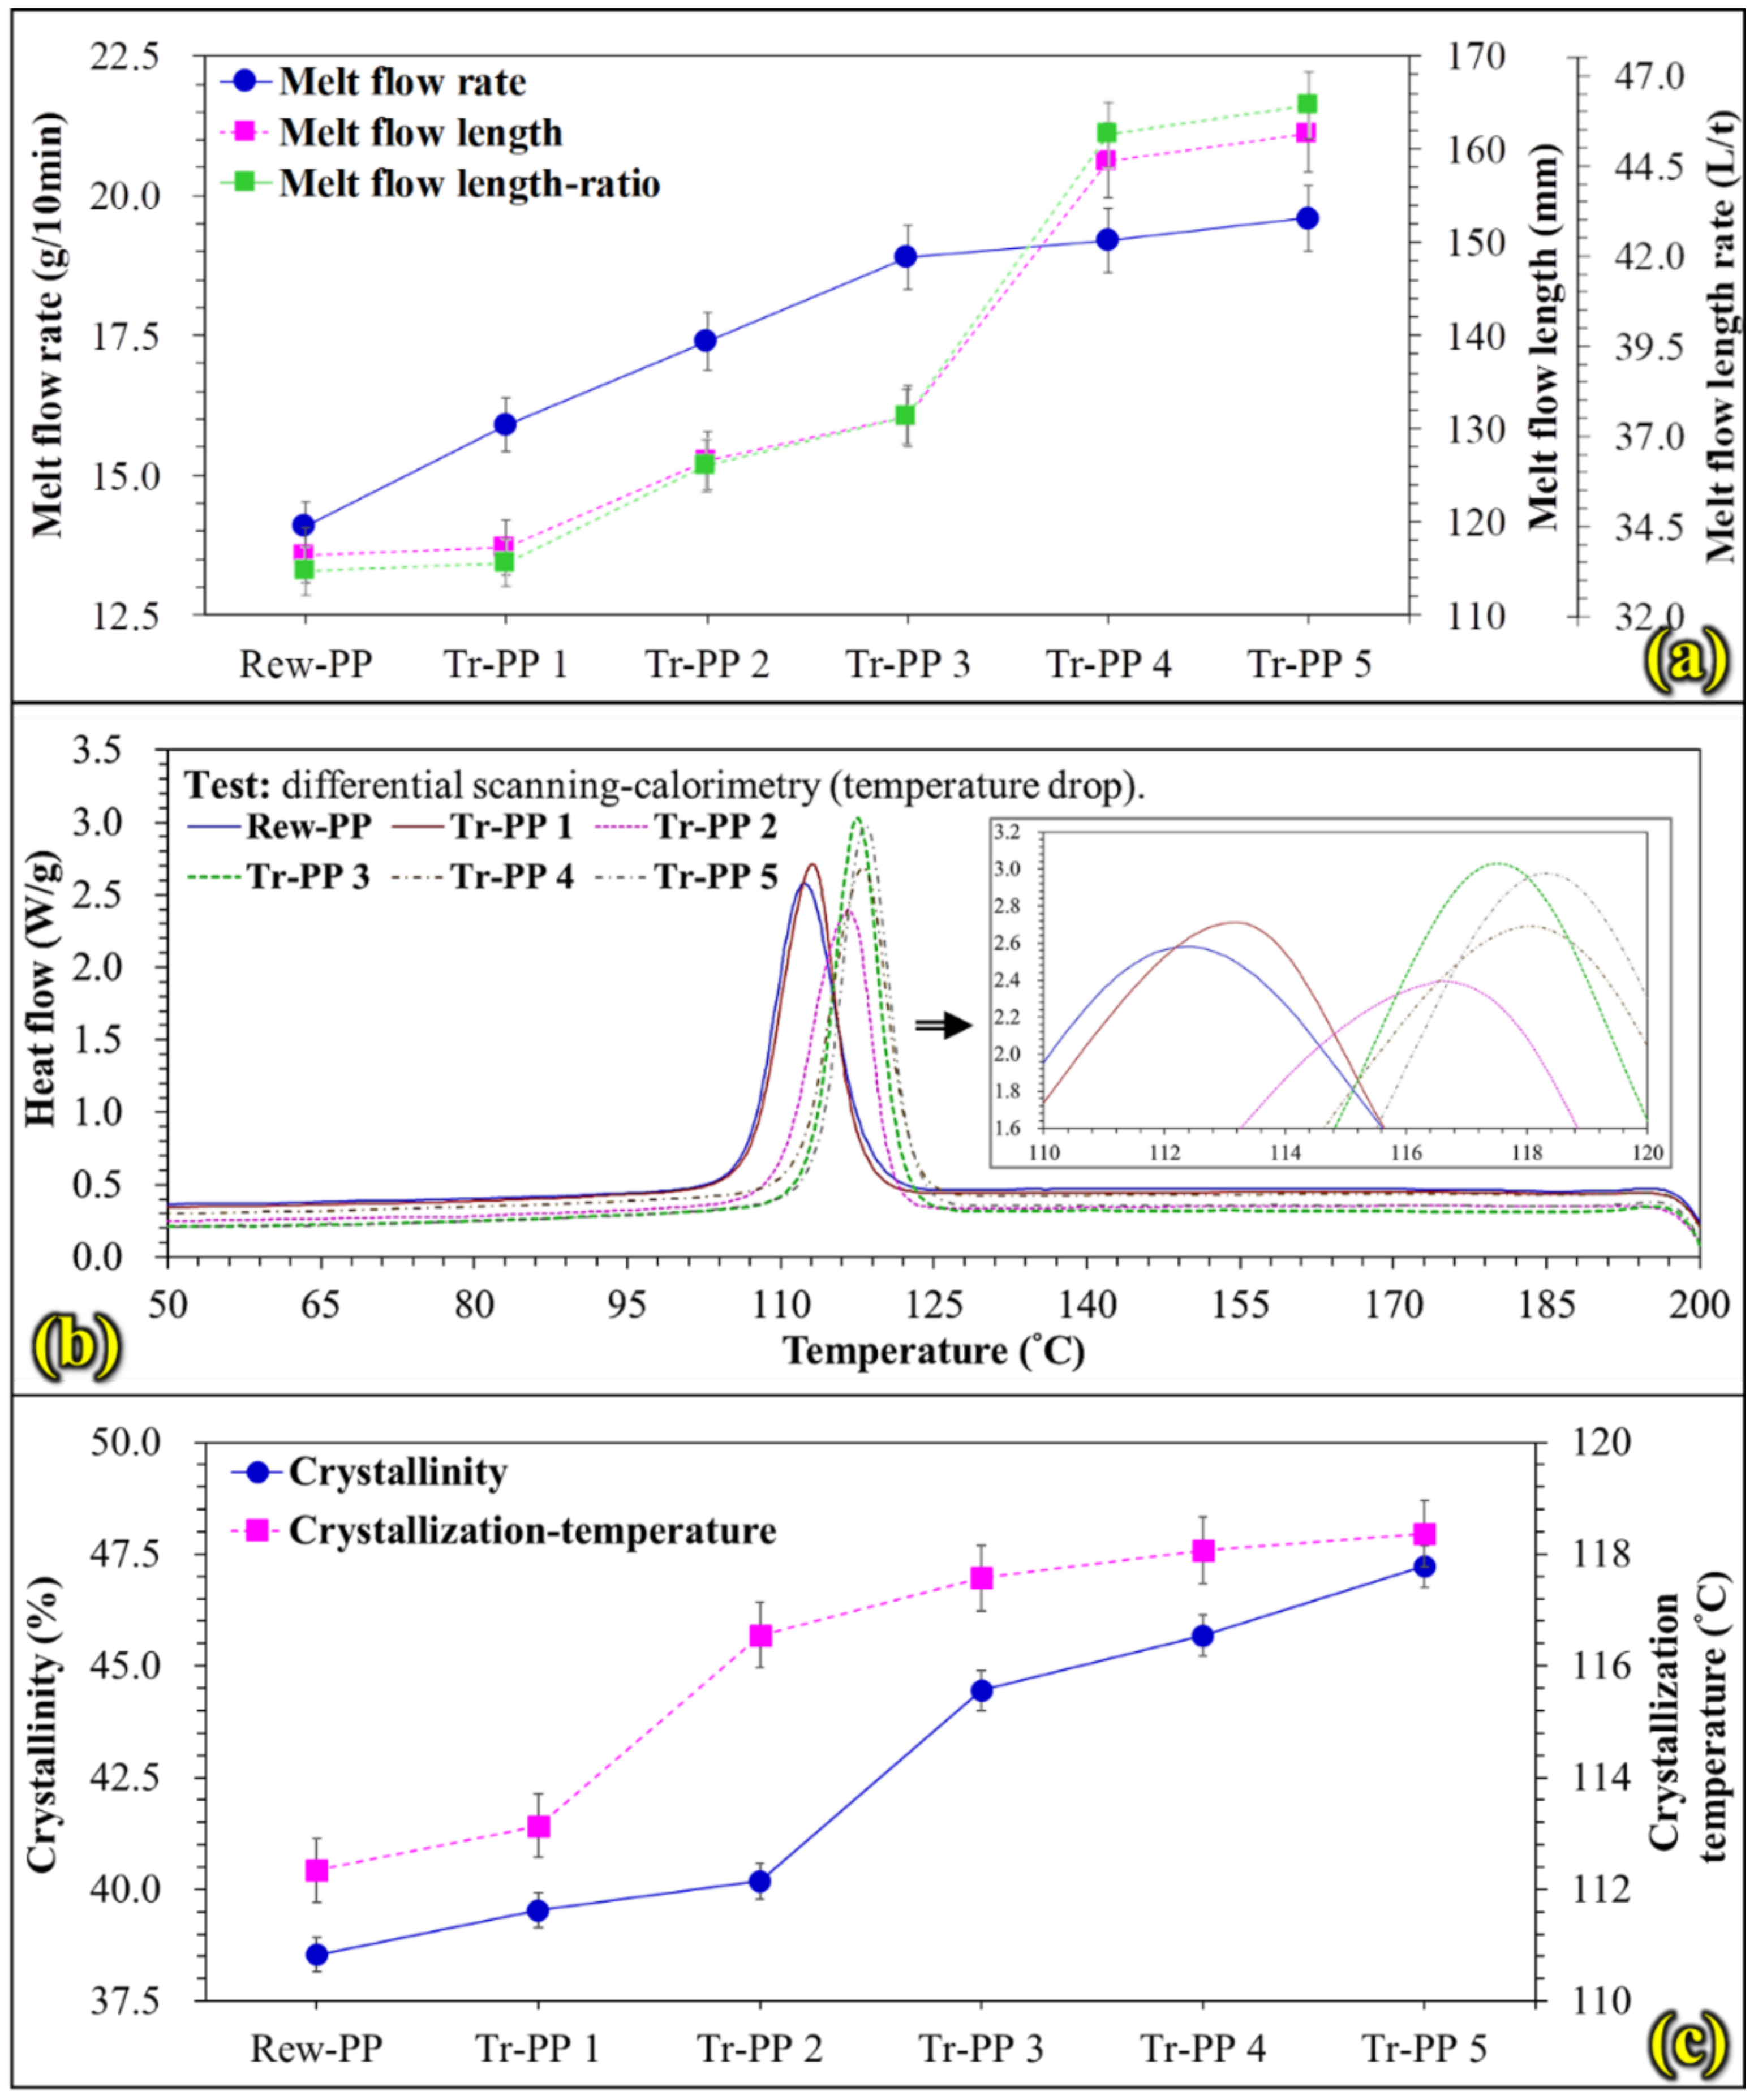
The material/melt flow index (abbreviated here as MFI) was conducted using a melt-index tester (basic model XNR-400C) with YOUTE Co Ltd; with a temperature range of 210 °C and a measured time of 10 min. The measurement of MFI is generally measured according to the method specified in ASTM D1238. Used to detect the crystallinity change-value on the Raw-PP and different Tr-PP.
ii.
The crystallinity experiments were performed using a DSC differential scanning calorimeter, model MDSC2920, from the TA Instrument Co Ltd. It has a temperature range of ≥200 °C and a heating rate of 10 °C, and a part loading volume of <20 mg and was used to detect the crystallinity change-values between the Raw-PP and different Tr-PPs. Therefore, Equation (2) will be introduced in the study to calculate the crystallinity [14]. Equation (2) was used to characterize PP with different TRs and the crystallinity must be determined, in the equation, “ΔHfi” is the melting enthalpy of the sample, “ΔHf” is the melting enthalpy of fully crystallized, and according to Equation (2), we can obtain “θ” as the crystallinity (%). The crystallinity of 100% PP used in this study is 37.6% and the melting enthalpy of 77.8 J/g.
θ = Δ H f i Δ H f × 100 %
iii.
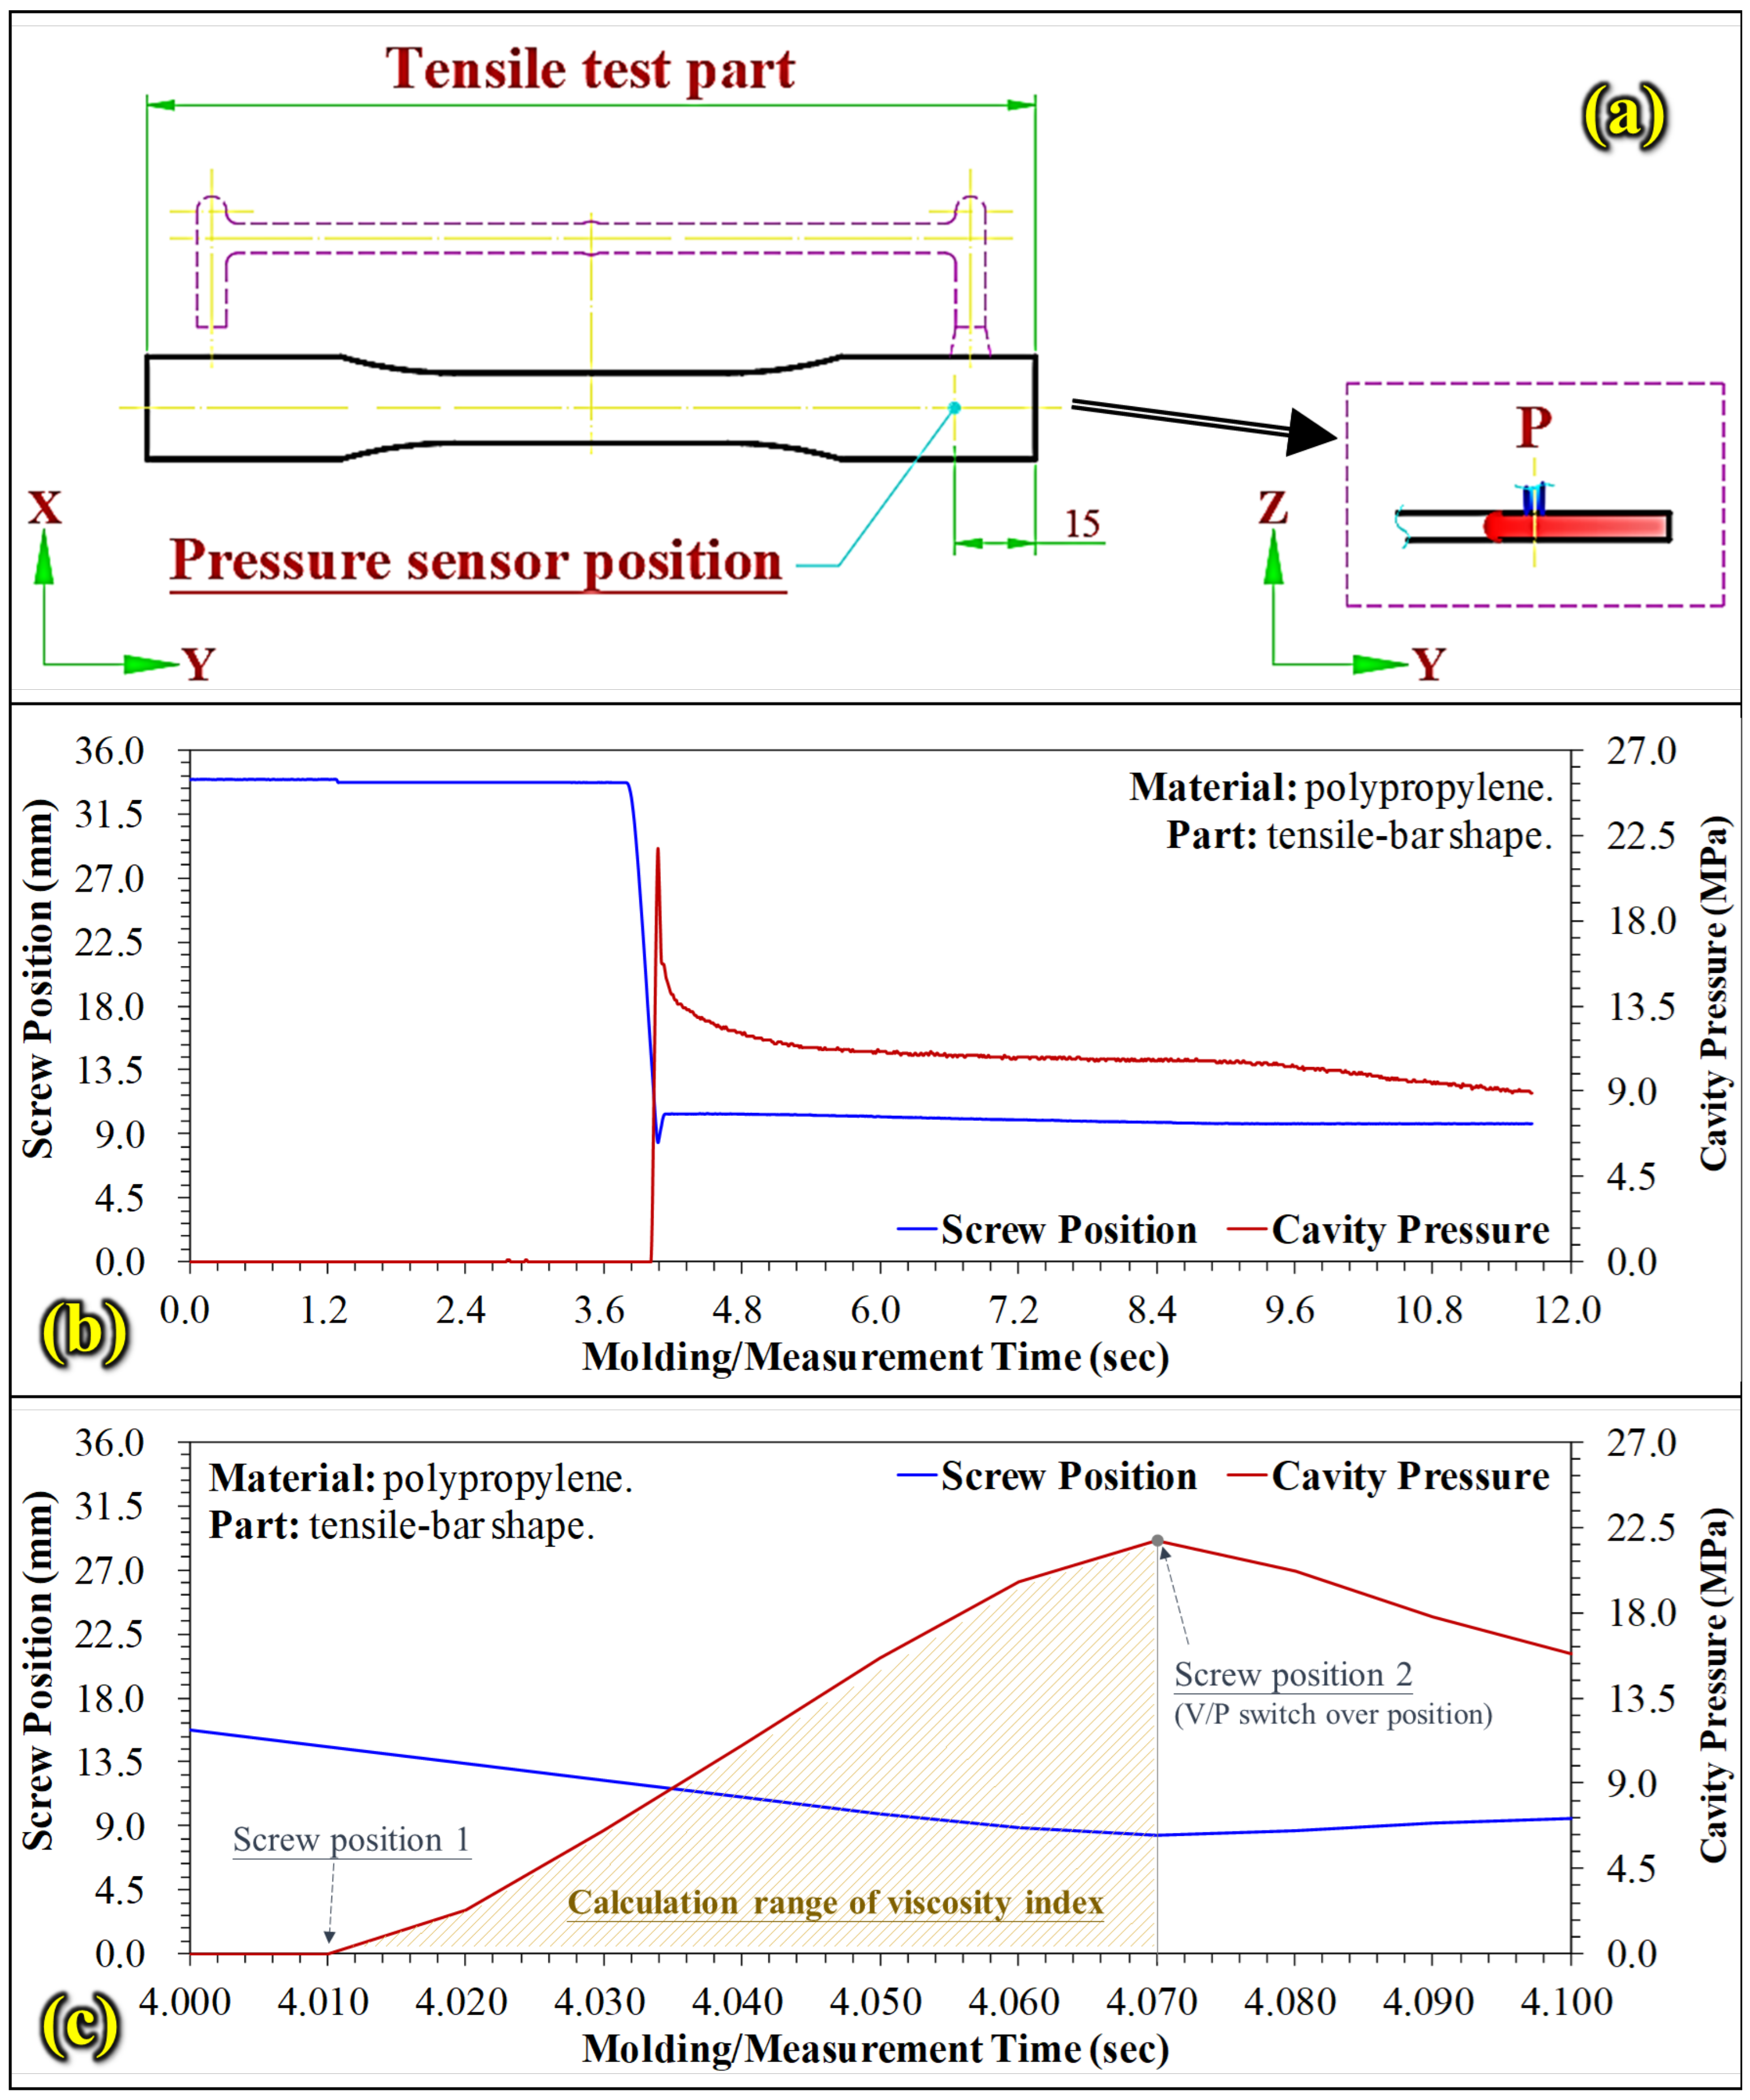
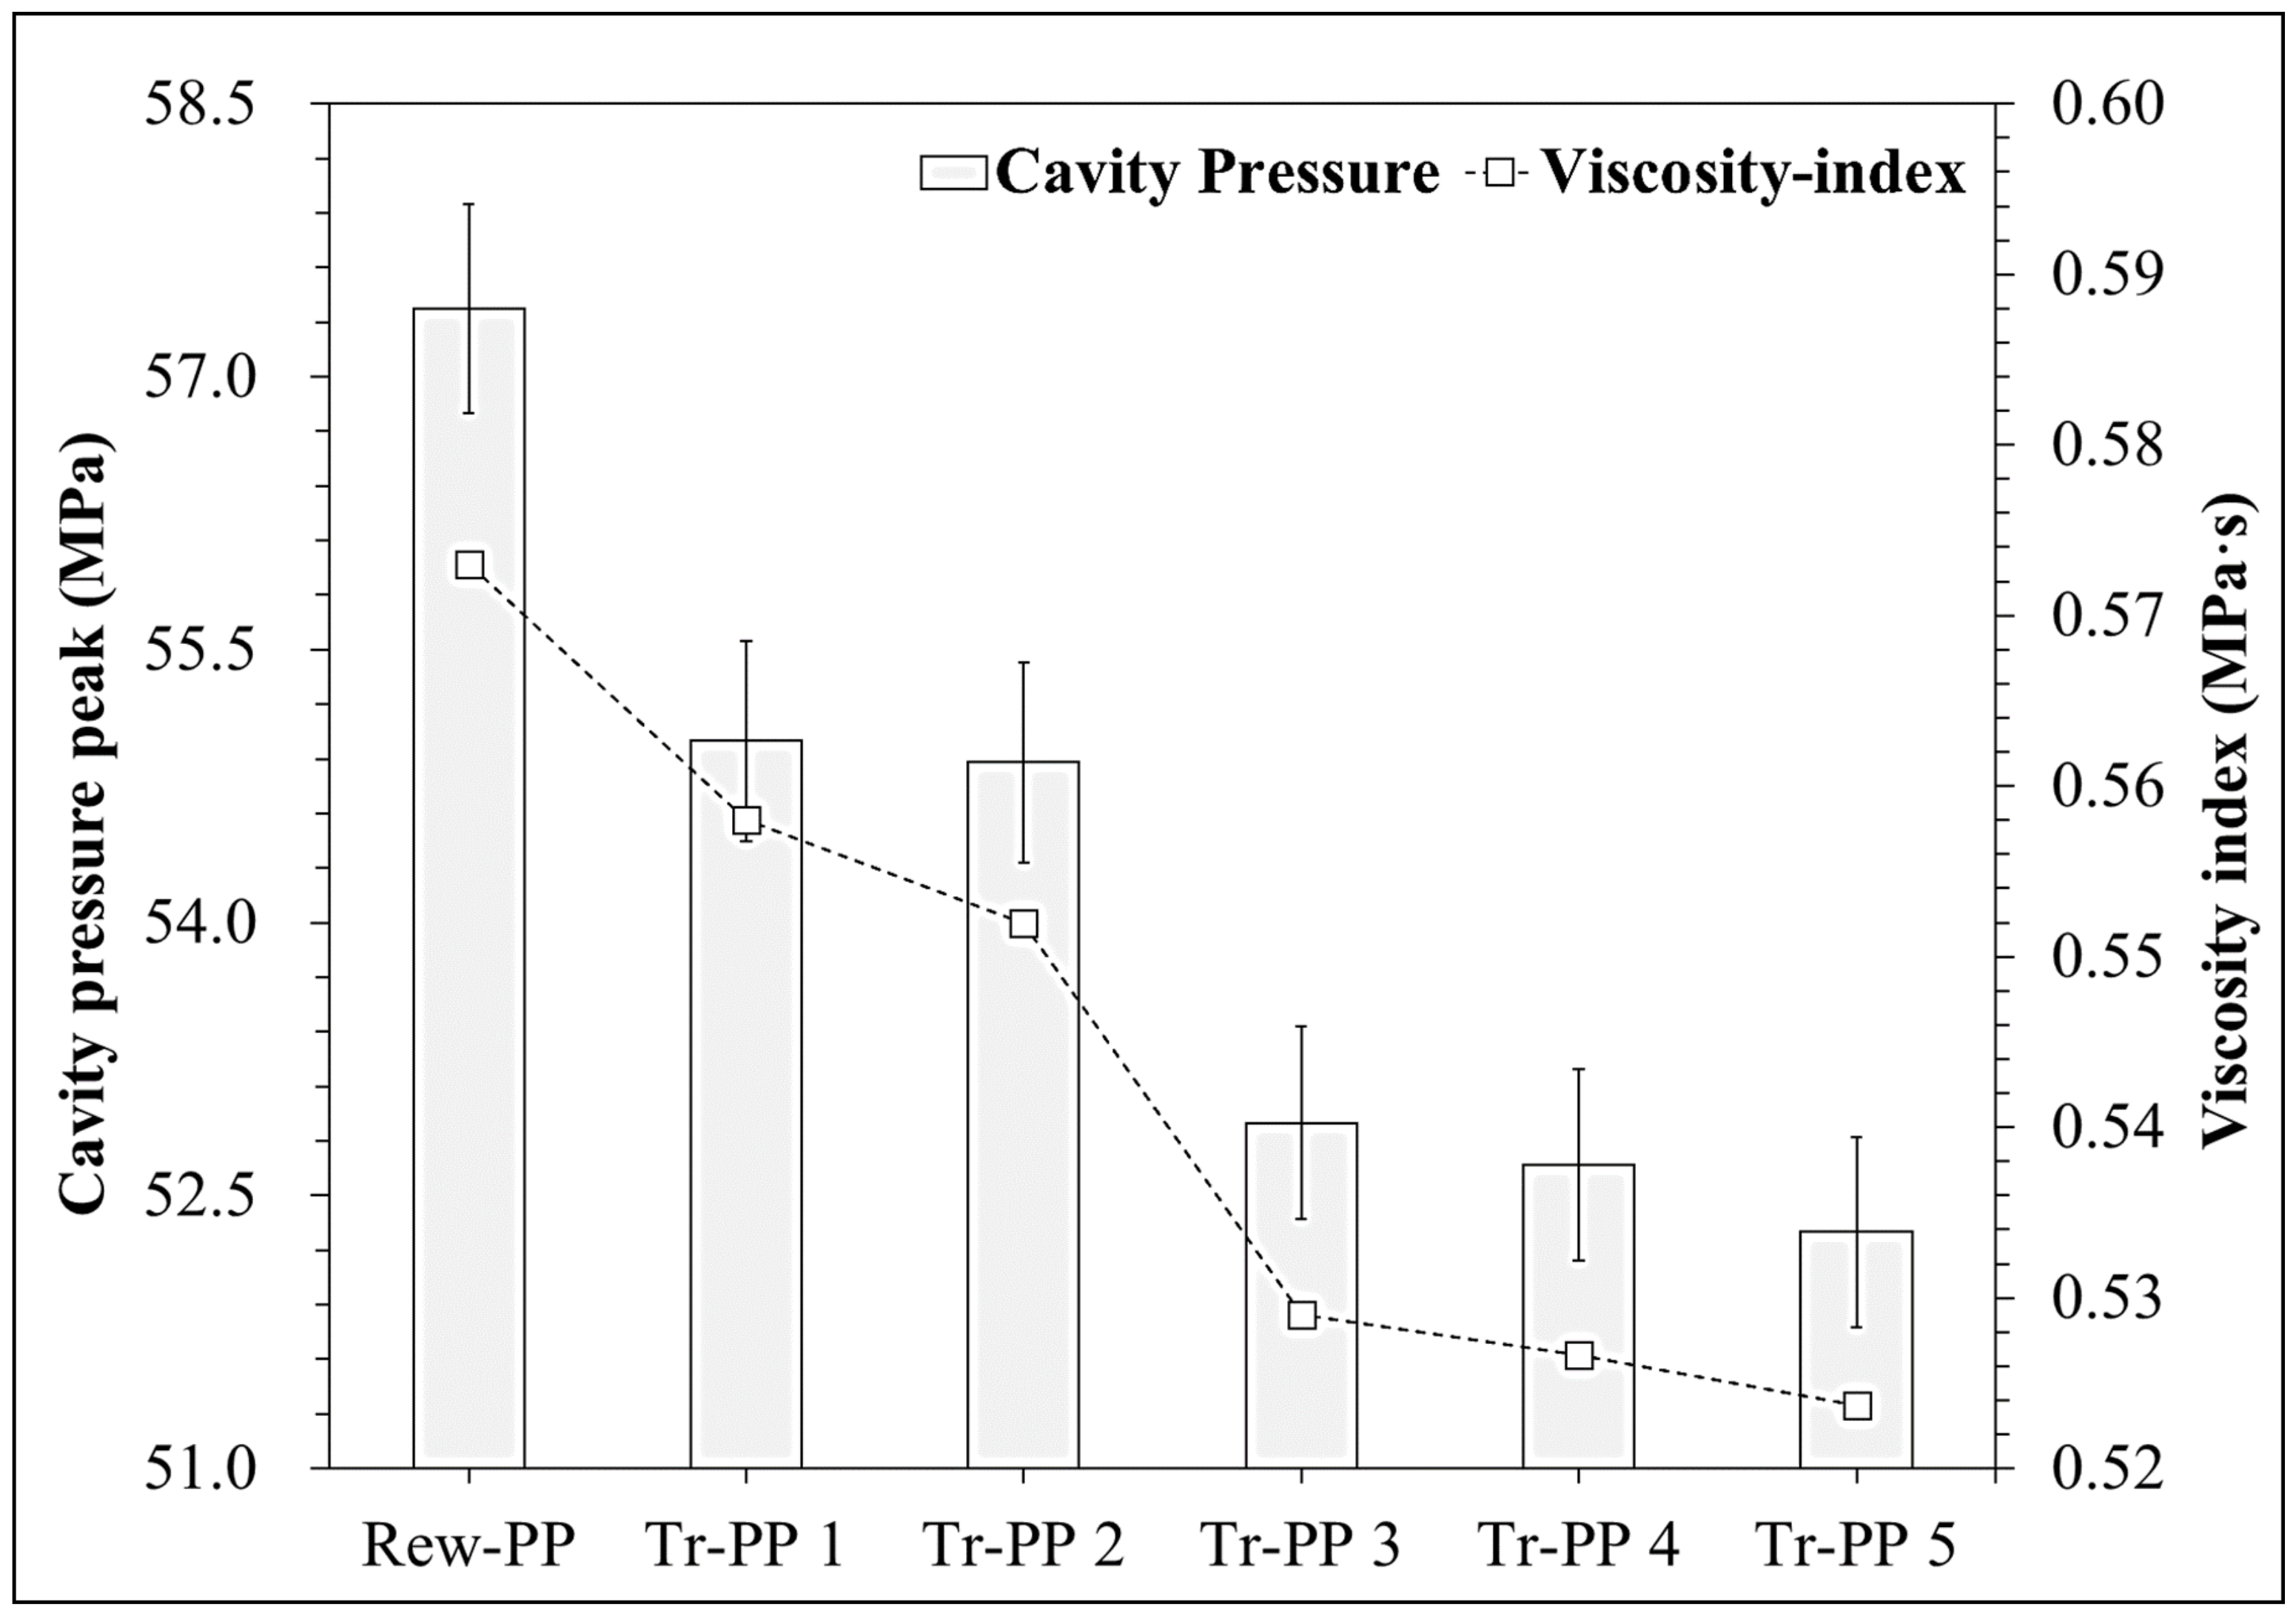
The mold cavity melt-pressure experiment was conducted using cavity-pressure-sensors from the Japan FUTABA Corporation. The sensors were embedded at a site close to the gate position see Figure 4a and were used to detect the mold cavity melt-pressure profiles for Raw-PP and different Tr-PPs. The sensors detected the maximum pressure during the filling stage and constant conditions during the injection process allowed changes in material flow to be easily measured. Figure 4b shows pressure profiles detected by a sensor during the filling stage of the injection molding process [26]. The mold cavity melt-pressure was also examined with a sensing system. The pressure peaks were measured at maximum pressure, and Equation (3) was used to calculate the change in the material viscosity index, see Figure 4c.
V I I n j e c t i o n = S c r e w   p o s i t i o n 2 S c r e w   p o s i t i o n 1 P M e l t t d t
Equation (3) was used to detect the melt viscosity index variations on the Raw-PP and different Tr-PP. The material viscosity index was obtained by integrating the screw position displacement with the pressure in the mold cavity. In the equation, Screw position 2, is the V/P switchover point [27,28,29,30].

3. Results and Discussion

Raw-PP was used to mold specimens which were then crushed and recycled between one and five times. The material is identified as Tr-PP 1 through Tr-PP 5. The material fluidity was measured as well as changes in the crystallinity of the five different recycled plastics which were then compared with that of the Raw-PP. The results are displayed in Figure 5a. It can be clearly observed that the melt flow rate becomes larger as the TRs increase, which means the molecular weight of the PP decreases as the TRs increase.
Substantial shear forces are generated during plasticizing, filling, crushing, and all the multiple recycling processes. These forces damage the molecular chains of the material and this decreases the average molecular weight and the wider MW distribution improves fluidity. An examination of Figure 5a reveals that for TRs ≥ 4, the melt flow index (MFI) of the material has slowed down enough to become stable. This implies that the molecular weight reduction has reached saturation by the time the material has been recycled four times. Figure 5b is a DSC cooling graph of PP samples with different TRs. An exothermic peak can be clearly seen with an apex that is the crystallization temperature (Tc). It can also be seen that the crystallization temperature of the melt increases with an increase in TR, so that as the TR number goes up, the molecular weight of the polymer decreases, and its crystallization rate goes up. Figure 5c is a graph showing the change of crystallinity and crystallization temperature for different TRs. Furthermore, Figure 6 shows that as the TR number increases, the mold cavity peak pressure decreases because the MFI has increased. This decrease in pressure not only facilitates melting but also makes filling easier to achieve because the required driving pressure is lower and in any case for a TRs ≥ 3, pressure is stabilized. This trend was consistent with that of fluidity, as displayed in Figure 5a. The screw position displacement during the filling stage was integrated with mold cavity pressure to calculate the viscosity index. The results revealed that the gradual increase in material fluidity clearly facilitated the filling of the mold during the injection. The area below the pressure curve was calculated using Equation (3). The trend of the viscosity index was consistent with those in Figure 5a and Figure 6.
Calculations using Equation (3) also indicated the fluidity of Tr-PP in the mold cavity, which can serve as a reference for further experiments. Changes in tensile strength for different numbers of TRs were also investigated. Figure 7 shows the relationships between crystallinity, viscosity index, and tensile strength. It can be seen that more recycling increased the crystallization temperature and this increased the tensile strength of the finished product. However, a comparison of Figure 5a and Figure 7, showed that for TRs ≥ 4 the material fluidity stabilized and after this, the tensile strength decreased. Clearly, the upper limit for recycling should be three to maximize fluidity as well as the physical properties of the finished product. The authors of [14] have also shown that the isothermal crystallization behavior of Raw-PP and recycled PP and the crystallization behavior of recycled material deviates. The higher degree of crystallinity increases tensile properties, and the tensile properties of recycled PP show only a slight change compared to those of Raw-PP; this experimental data is similar to the trend, and it is found that the tensile strength of the recycled PP has increased.
Raw-PP, Tr-PP 1, and Tr-PP 3 were selected for a study of the effects of TRs and the manufacturing process conditions on tensile strength. The results (Figure 8a) revealed that lower screw speeds resulted in higher tensile strength because there was less damage to molecular chains in the material. Higher molecular densities gave more tensile strength. However, faster screw speeds resulted in lower tensile strength because more molecular chains broke and so back pressure and melt temperature changes were introduced to see if this affected tensile strength. It was found that back pressure increased tensile strength (Figure 8b). Back pressure pushes the material to the metering area of the feed tube during the melting and plasticizing processes causing more even heating and increased molecular density. This increased material density in both raw and recycled material and the tensile strength increased accordingly. In addition, an increase in melt temperature increased material fluidity which loosened the molecular chains, and thermal motion between the molecules disorganized the arrangement of the molecular chains which reduced tensile strength (Figure 8c). The viscosity index was also calculated using the mold cavity pressure and screw position displacement during the filling process, see Figure 9. It can be seen that as the screw speed accelerated, damage to molecular chains increases and the material density decreased, this raised the fluidity and the viscosity index of the material. Back pressure and melt temperature changes increased material fluidity due to more even heating and increased the viscosity index.

4. Conclusions

The properties of injection-molded specimens (Tr-PP) which had been made from polypropylene that had been recycled between one and five times were investigated. Fluidity was measured and the viscosity index was calculated using mold cavity pressure data. The physical properties and tensile strength of the finished specimens were compared to those made from virgin (Raw-PP) polypropylene. The results of the investigation of injection molded specimens using Raw-PP and Tr-PP were investigated under different manufacturing conditions. The results are as follows:
i.
The MFI of the material increased with more TRs. For TRs ≥ 4, MI was stable. In addition, the crystallinity and crystallization rate increased with an increased number of TRs because of increased melting enthalpy and melting peak area. More molecular chains broke and this reduced intermolecular distance and resulted in a sharper peak shape with a narrower width, implying a narrower distribution of crystal grains of smaller size.
ii.
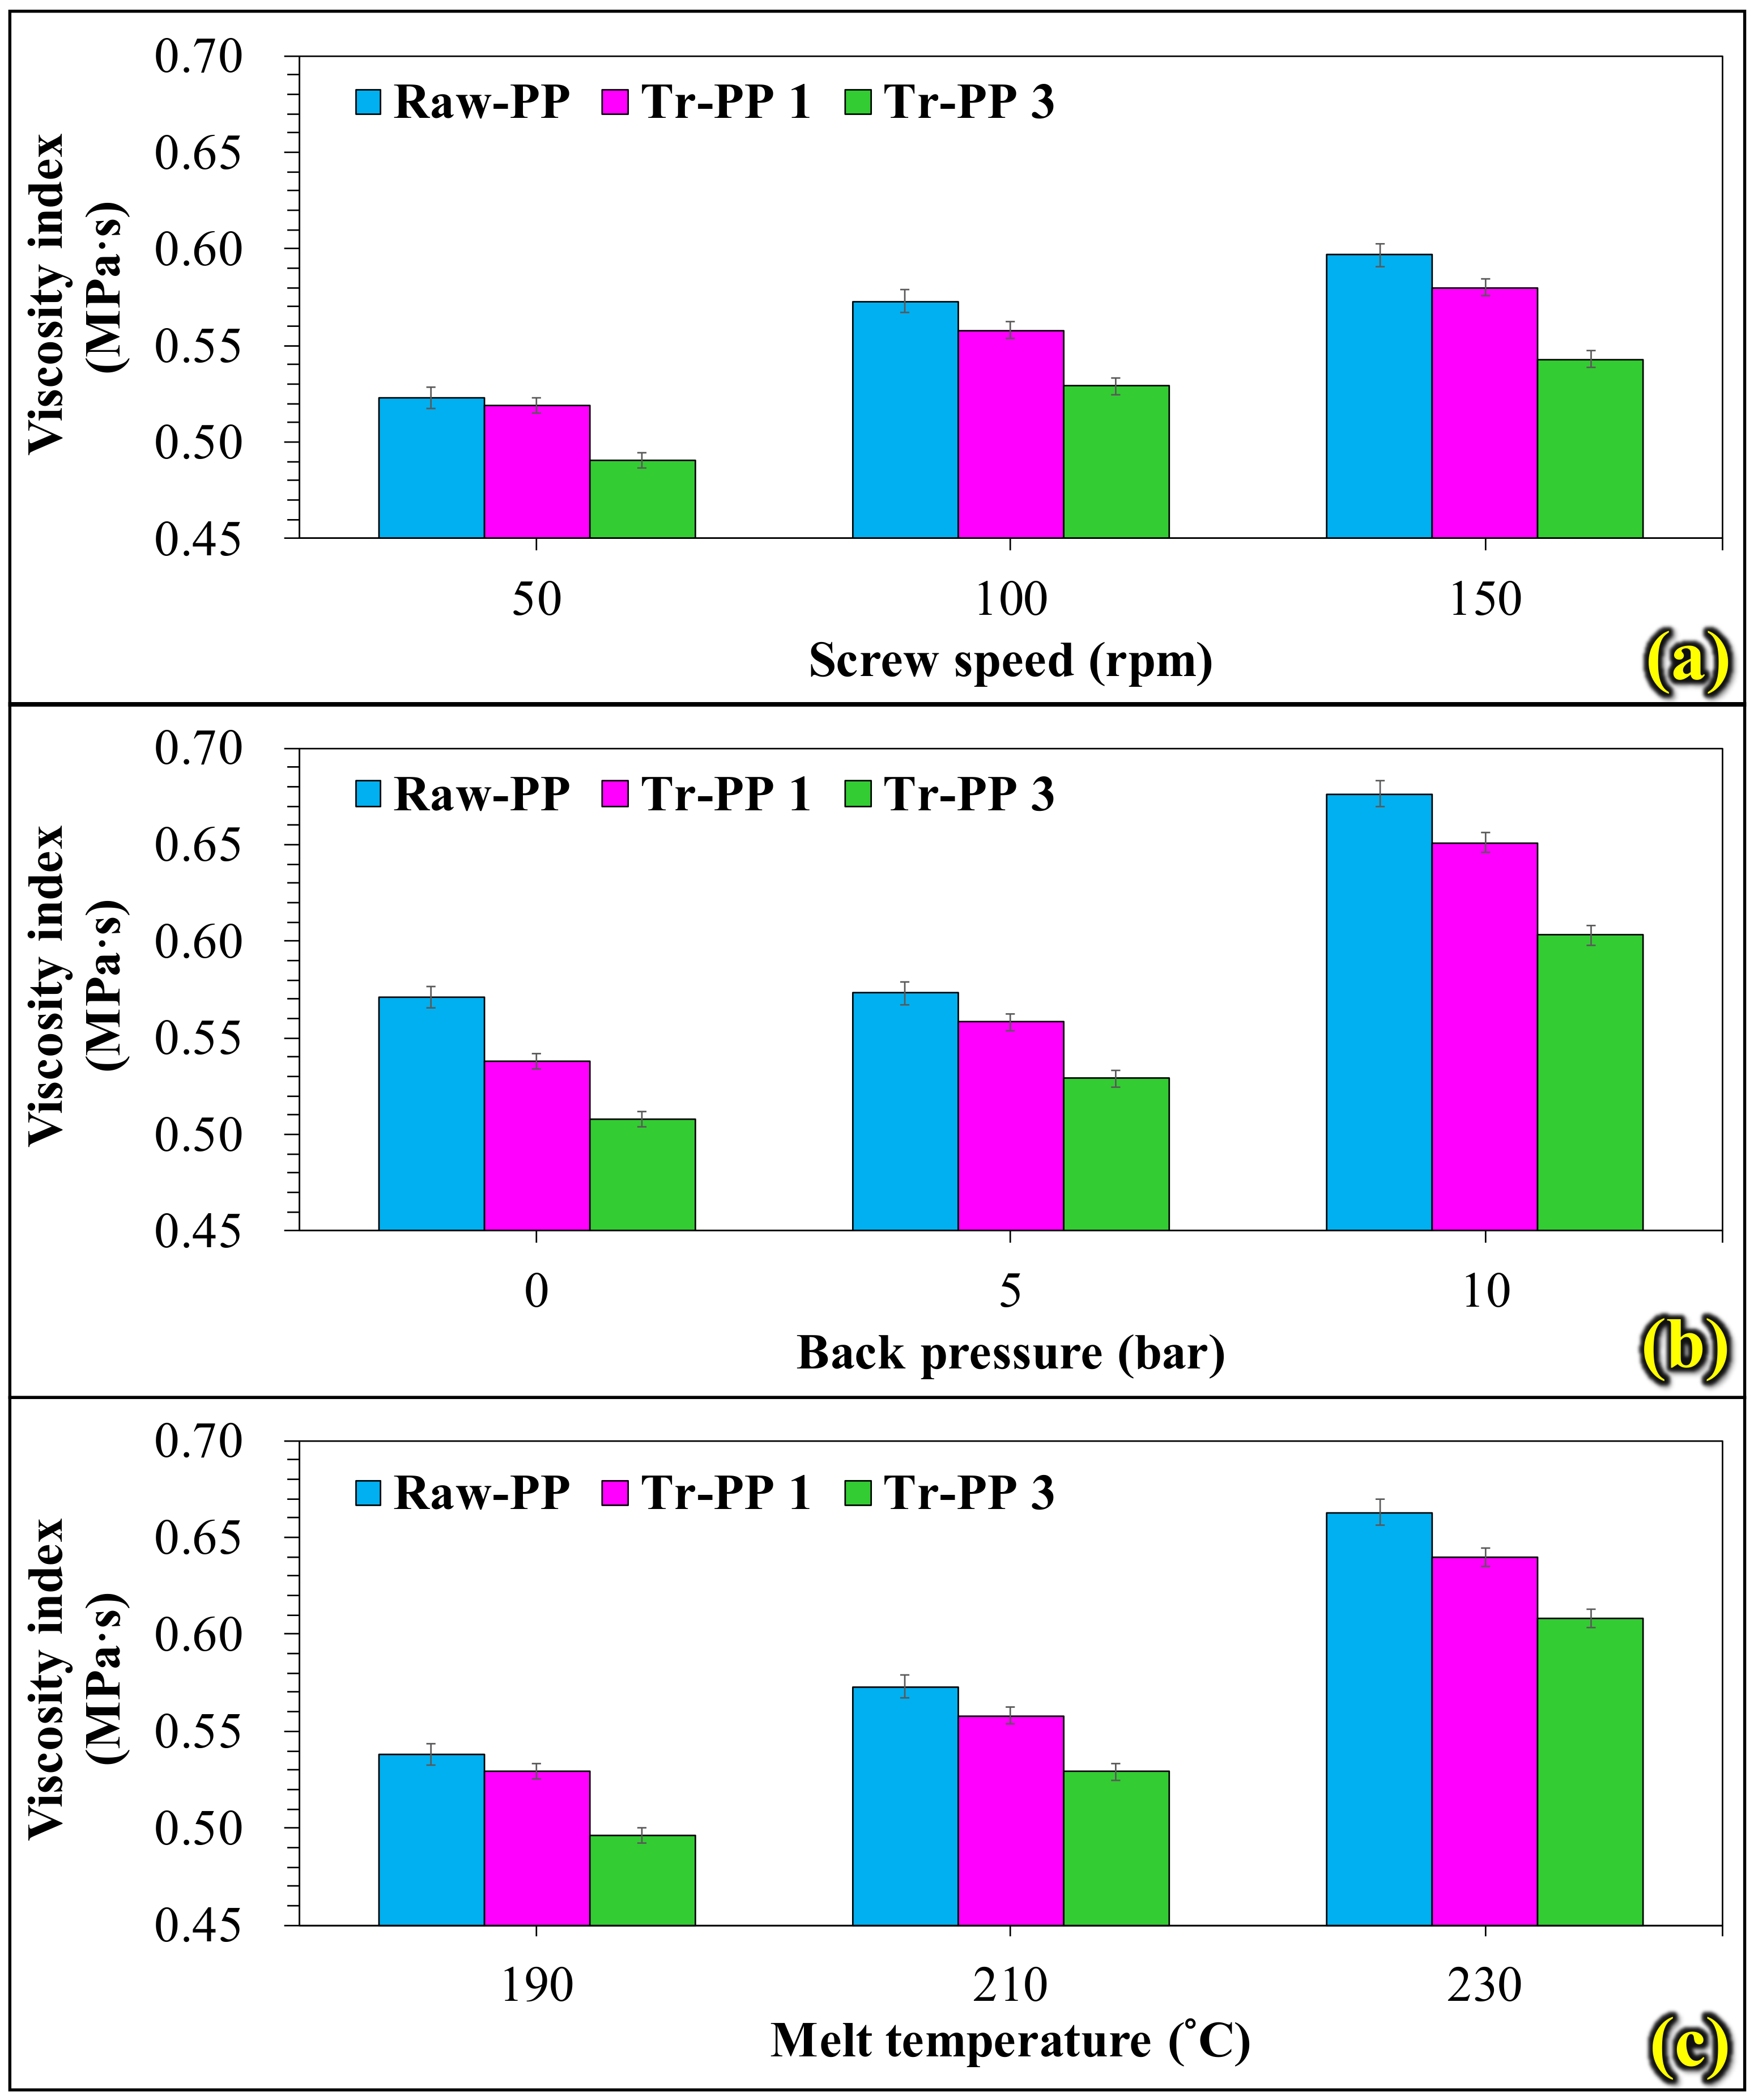
Pressure changes in the mold cavity were measured by a sensor, and the viscosity index was calculated by integrating the screw position displacement during the filling process with the mold cavity pressure. As the number of TRs increased, the mold cavity peak value and the viscosity index gradually decreased due to increased material fluidity. This trend was consistent with that for MFI.
iii.
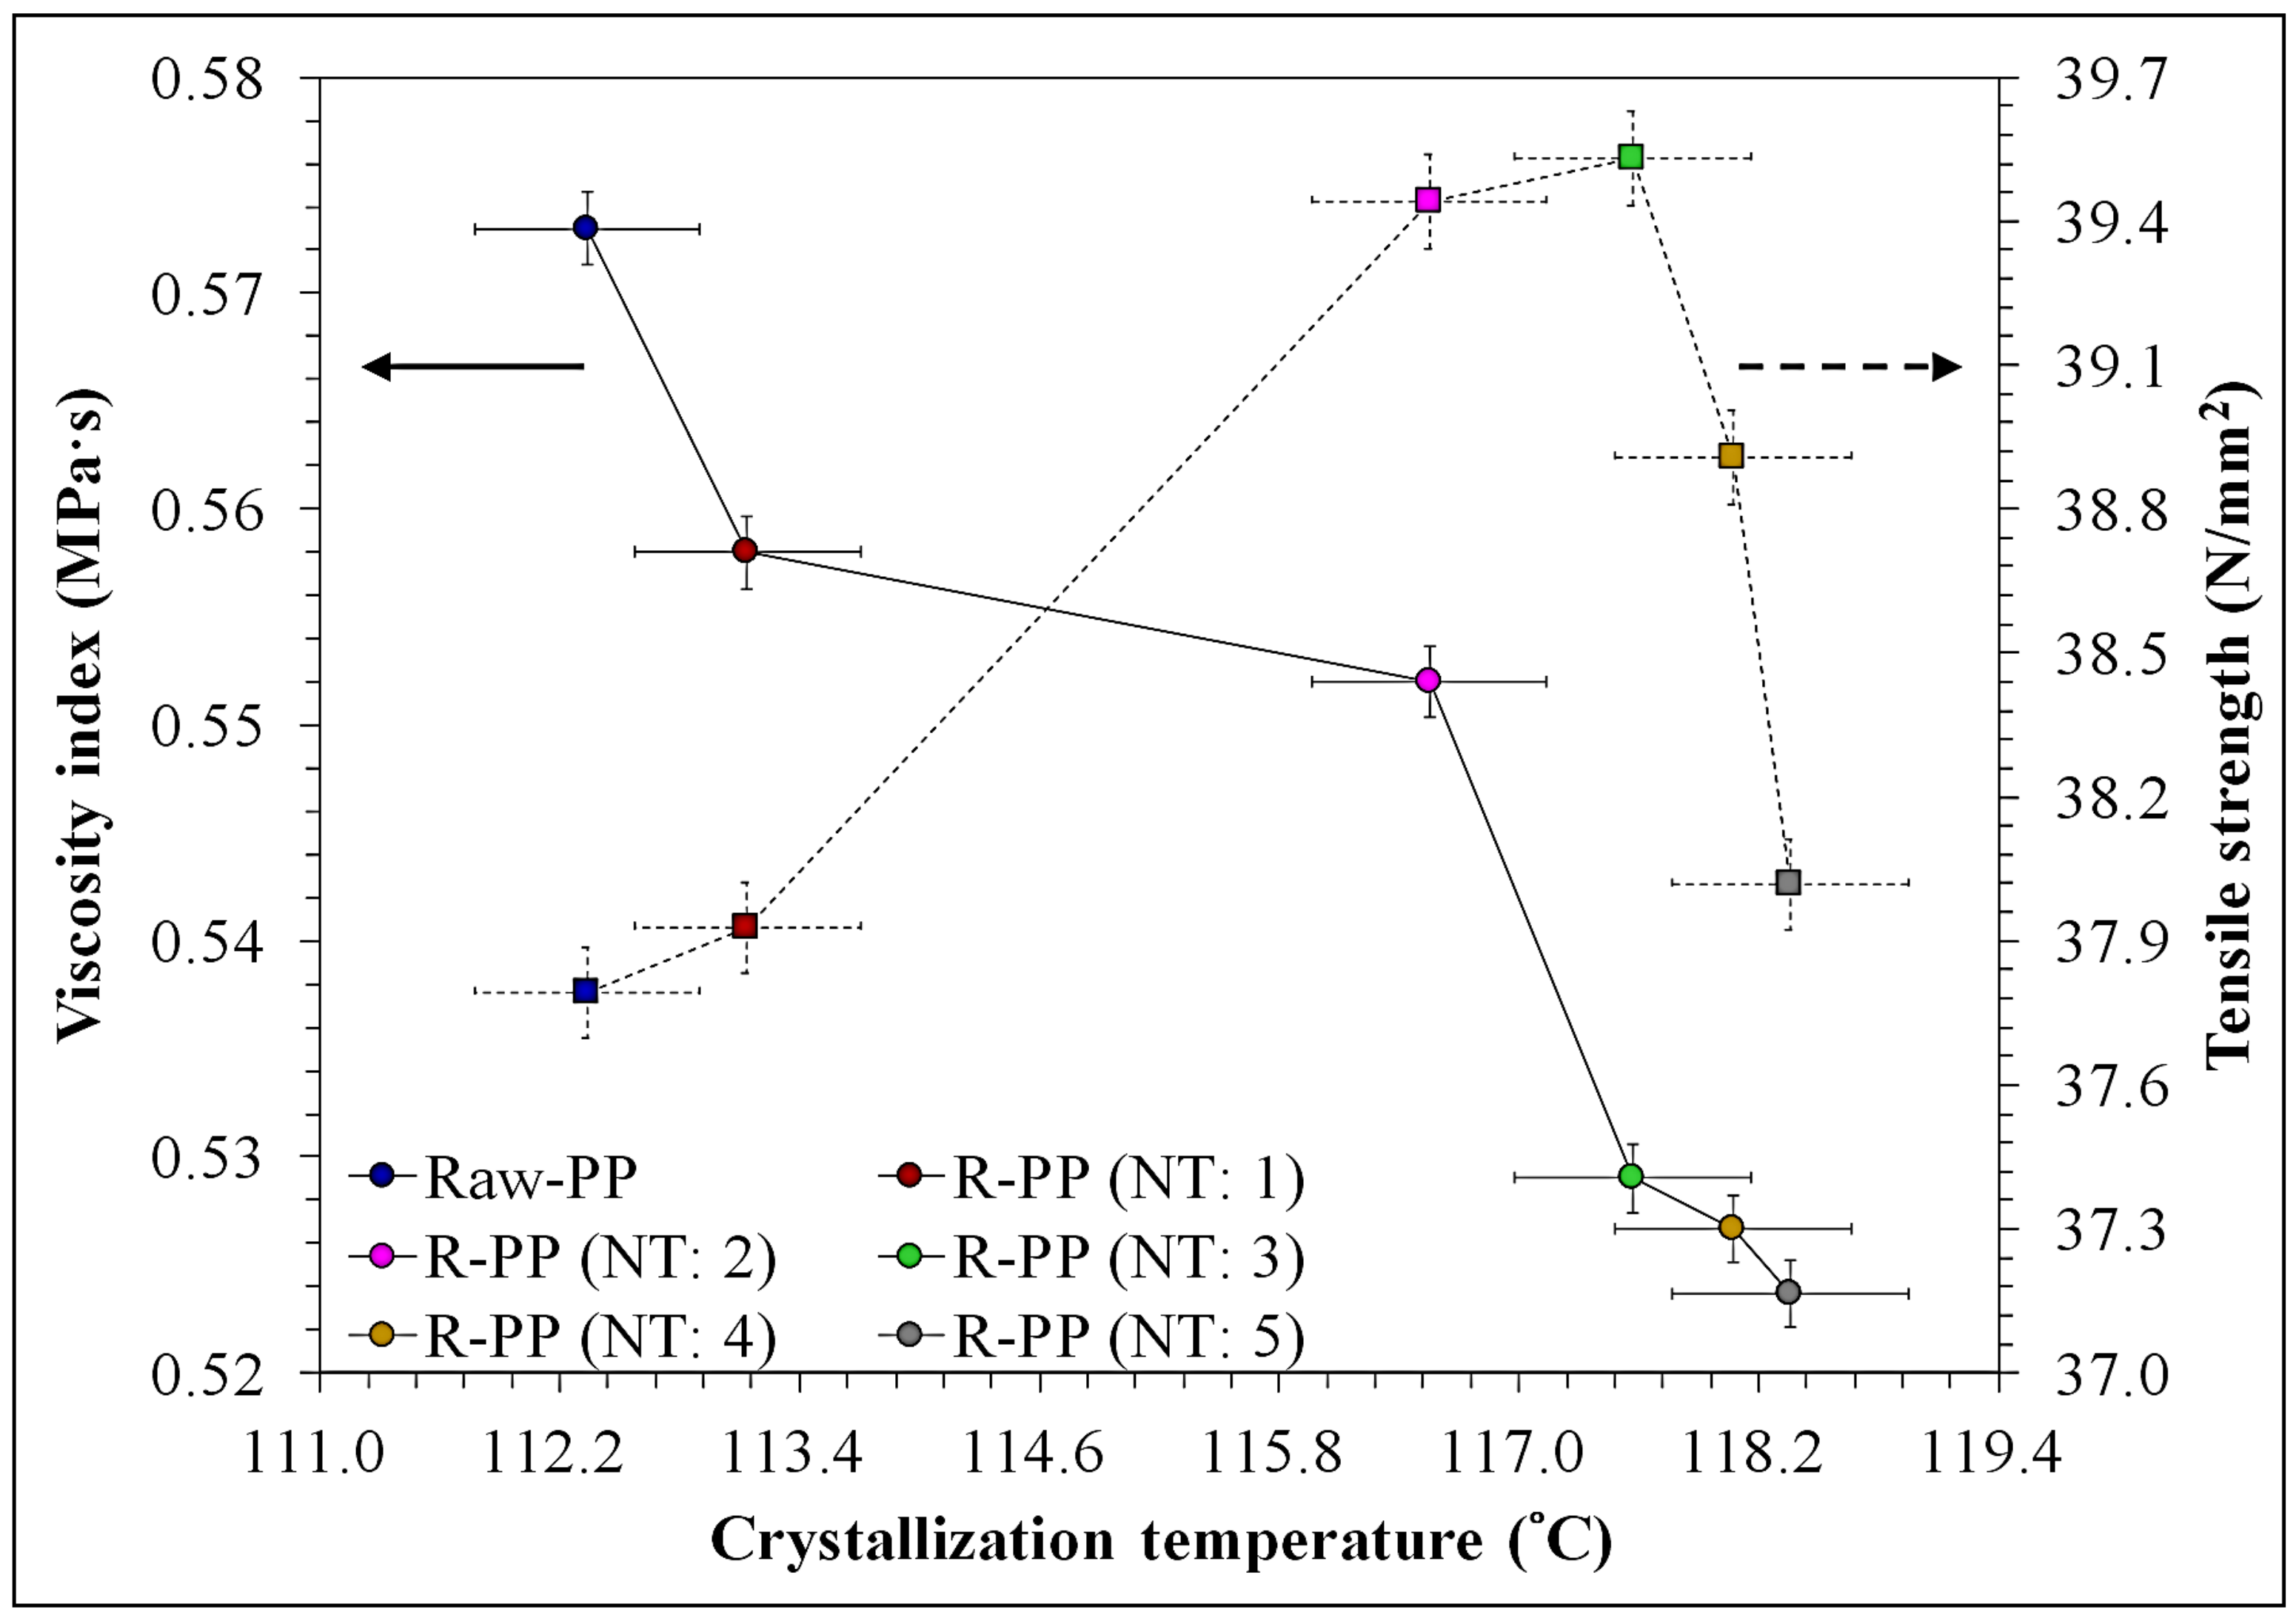
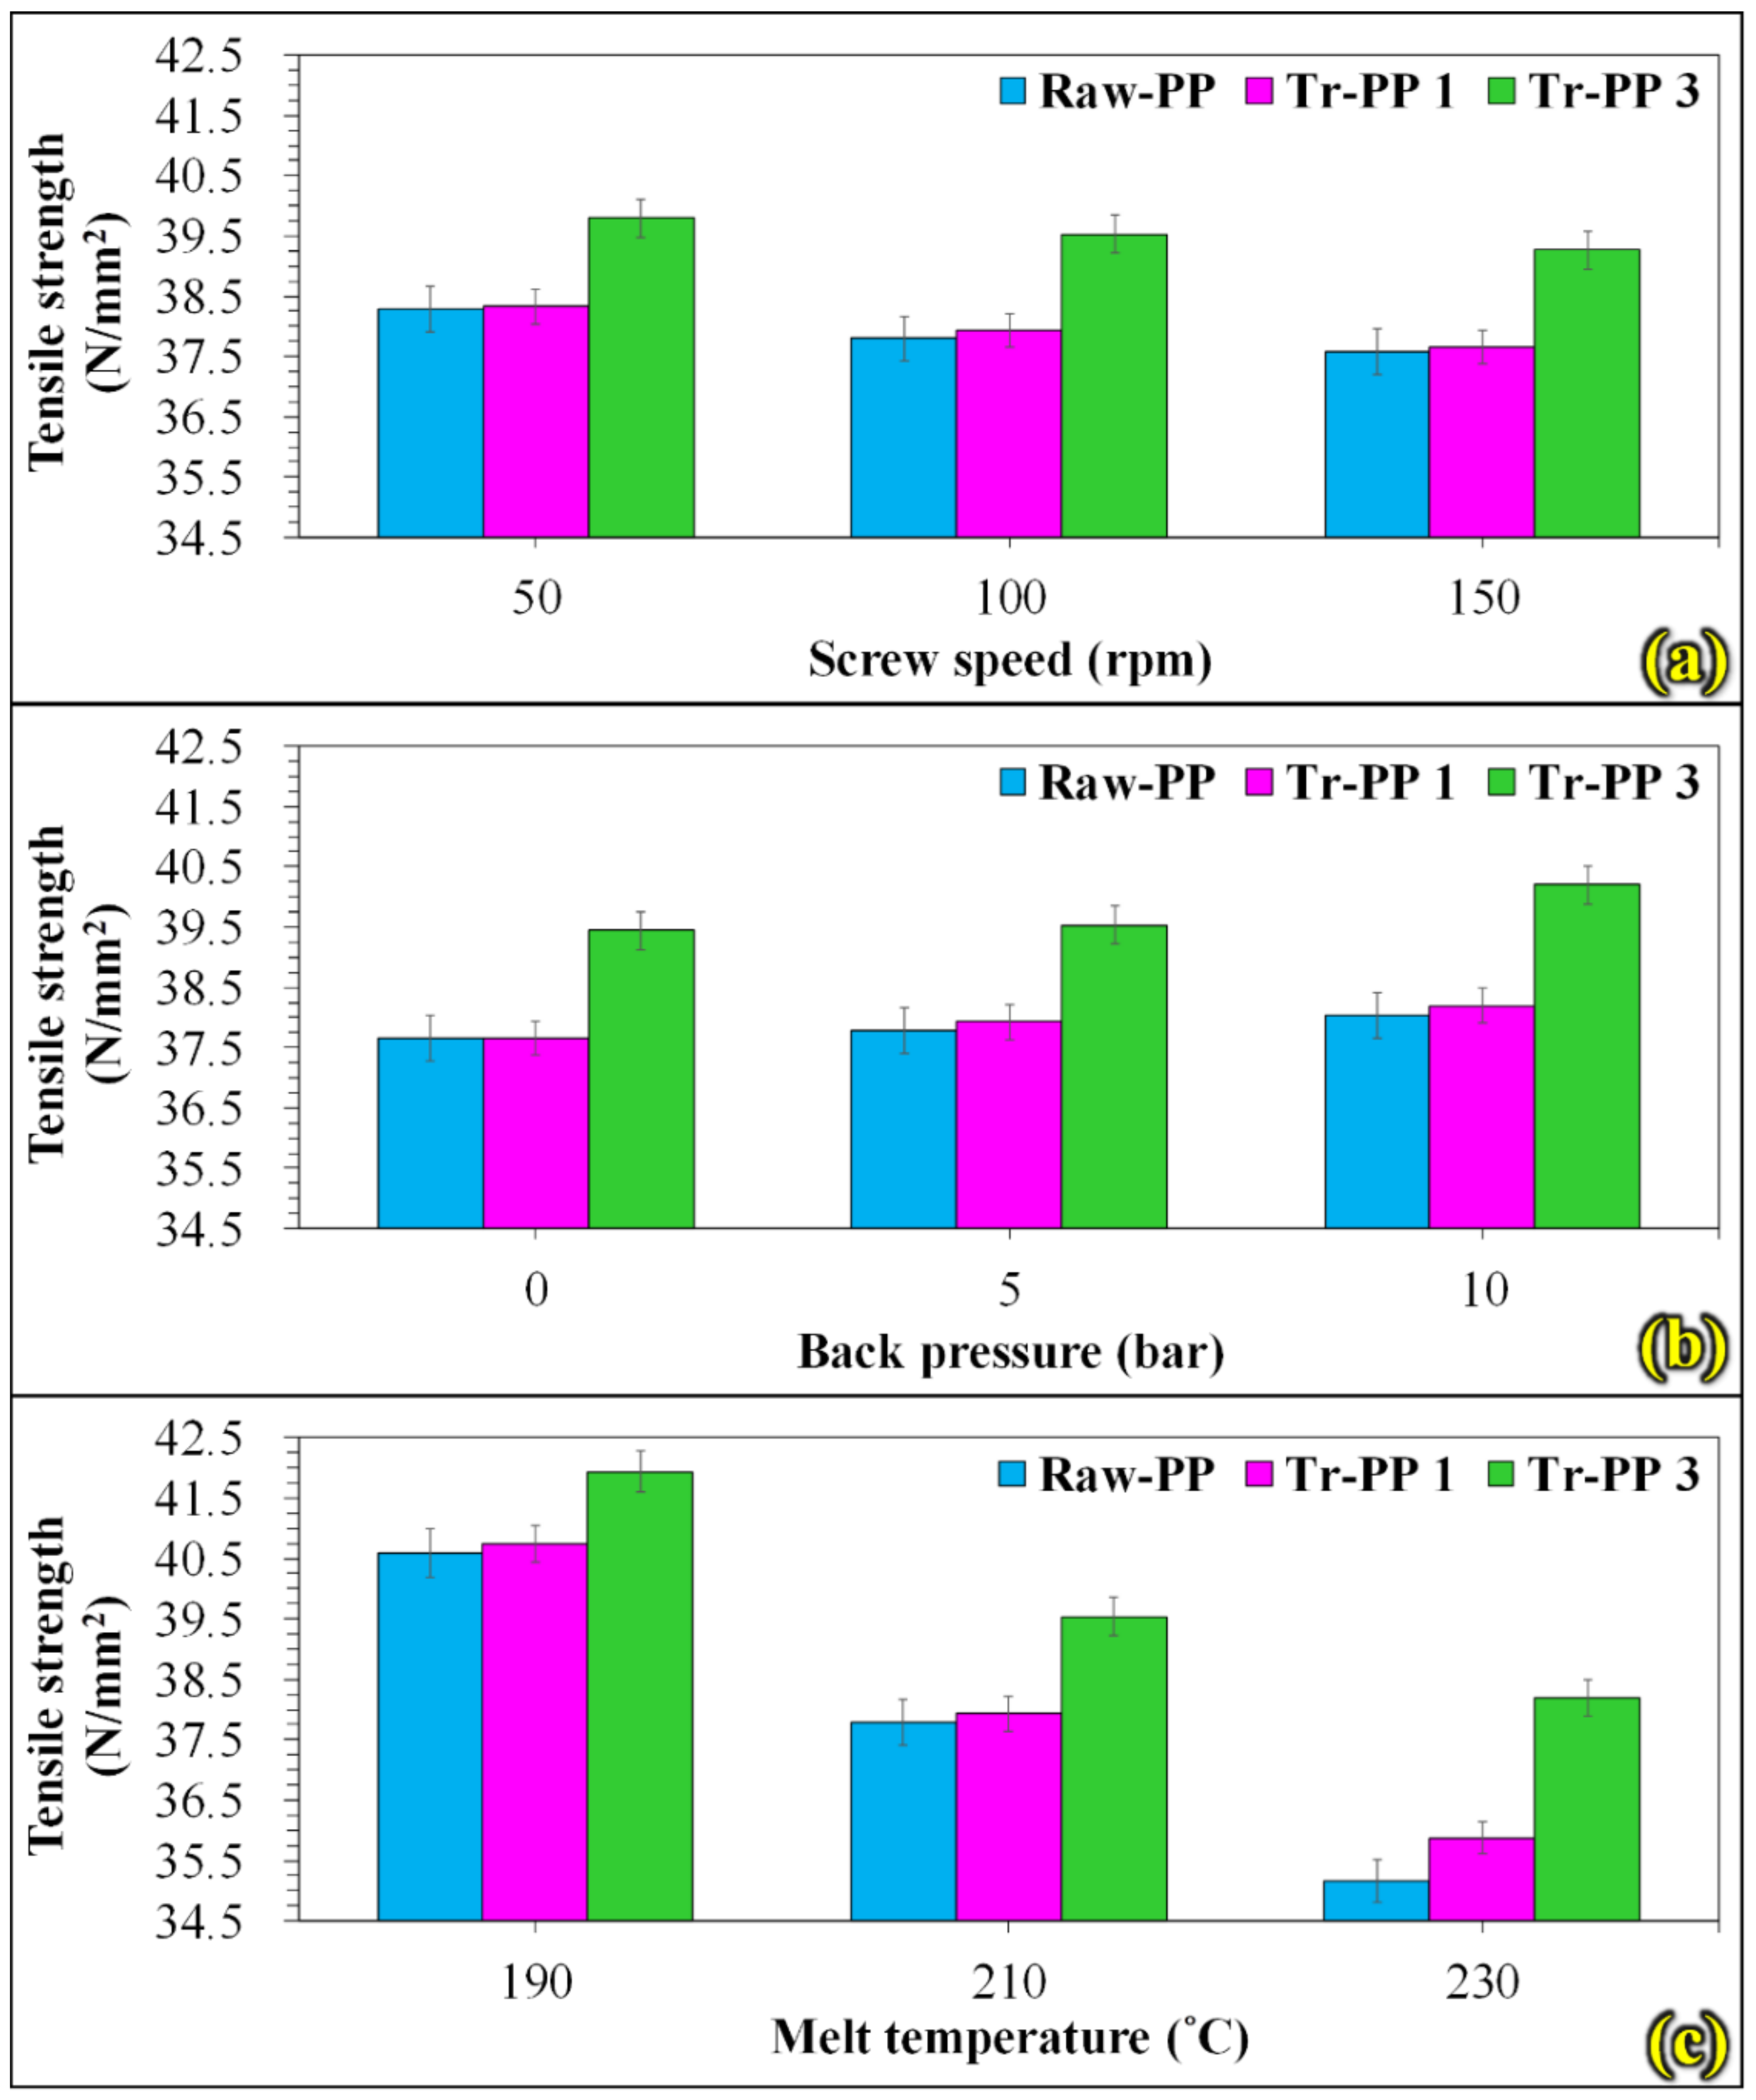
The crystallinity and crystallization rate increased with the number of TRs, resulting in increased tensile strength. The reduction in crystallinity corrugation spacing enhanced the tensile strength. Changes in the viscosity index and in the tensile strength revealed that the screw speed and the melt temperature (plasticization parameters) could cause substantial cracking which reduces the strength of the material. However, an increase in back pressure could improve tensile strength.
iv.
The recyclability of the PP could be determined from the setting of the TRs and can provide the physical properties of materials under multiple recycling, and related product manufacturing, so as to achieve the benefits of circular economy and digital transformation of recycled material injection molding, and which can be used to manufacture civilian products and thin/short parts that require recycled materials and geometric products.

Author Contributions

Conceptualization, P.-W.H., H.-S.P.; data curation, P.-W.H.; investigation, P.-W.H., H.-S.P.; methodology, P.-W.H., H.-S.P.; project administration, P.-W.H.; supervision, H.-S.P.; validation, P.-W.H., H.-S.P.; writing—original draft, P.-W.H.; writing—review and editing, H.-S.P. Both authors have read and agreed to the published version of the manuscript.

Funding

This research received no external funding.

Institutional Review Board Statement

Not applicable.

Informed Consent Statement

Not applicable.

Data Availability Statement

The data presented in this study are available on request from the corresponding author.

Conflicts of Interest

The authors declare no conflict of interest.

References

  1. Van der-Wal, H.; Huerta, E.; Torres, A. Estrategia Integral de Producción, Generación de Ingresos y Conservación de la Biodiversidad en Huertos Familiares en Tabasco. 2011. Available online: https://www.ecosur.mx/ecoconsulta/busqueda/detalles.php?id=13090&bdi=0 (accessed on 15 August 2021).
  2. Barnes, D.K.A.; Galgani, F.; Thompson, R.C.; Barlaz, M. Accumulation and fragmentation of plastic debris in global environments. Philos. Trans. R. Soc. B Biol. Sci. 2009, 364, 1985–1998. [Google Scholar] [CrossRef] [Green Version]
  3. Buenrostro, O.; Bocco, G. Solid waste management in municipalities in Mexico: Goals and perspectives. Resour. Conserv. Recycl. 2003, 39, 251–263. [Google Scholar] [CrossRef]
  4. Thompson, R.C.; Moore, C.J.; Saal, F.S.V.; Swan, S. the environment and human health: Current consensus and future trends. Philos. Trans. R. Soc. B Biol. Sci. 2009, 364, 2153–2166. [Google Scholar] [CrossRef] [PubMed]
  5. Richard, C.; Thompson, S.H.; Swan, C.J.; Moore, C.J.; vom Saal, F.S. Our plastic age. Philos. Trans. R. Soc. B Biol. Sci. 2009, 364, 1973–1976. [Google Scholar]
  6. Machado, A.A.D.S.; Kloas, W.; Zarfl, C.; Hempel, S.; Rillig, M.C. Microplastics as an emerging threat to terrestrial ecosystems. Global. Chang. Biol. 2017, 24, 1405–1416. [Google Scholar] [CrossRef] [PubMed] [Green Version]
  7. Chen, Y.; An, Y.J. Current research trends on plastic pollution and ecological impacts on the soil ecosystem: A review. Environ. Pollut. 2018, 240, 387–395. [Google Scholar]
  8. Hodson, M.E.; Duffus-Hodson, C.A.; Clark, A.; Prendergast-Miller, M.; Thorpe, K. Plastic Bag Derived-Microplastics as a Vector for Metal Exposure in Terrestrial Invertebrates. Environ. Sci. Technol. 2017, 51, 4714–4721. [Google Scholar] [CrossRef] [Green Version]
  9. Lwanga, E.H.; Mendoza-Vega, J.; Quej, V.K.; Chi, J.D.L.A.; Del Cid, L.S.; Chi, C.; Escalona-Segura, G.; Gertsen, H.; Salánki, T.; Van Der Ploeg, M.; et al. Field evidence for transfer of plastic debris along a terrestrial food chain. Sci. Rep. 2017, 7, 1–7. [Google Scholar]
  10. Gopinath, K.P.; Nagarajan, V.M.; Krishnan, A.; Malolan, R. A critical review on the influence of energy, environmental and economic factors on various processes used to handle and recycle plastic wastes: Development of a comprehensive index. J. Clean. Prod. 2020, 274, 123031. [Google Scholar] [CrossRef]
  11. Aurrekoetxea, J.; Sarrionandia, M.; Urrutibeascoa, I.; Maspoch, M.L. Effects of recycling on the microstructure and the mechanical properties of isotactic polypropylene. J. Mater. Sci. 2001, 36, 2607–2613. [Google Scholar] [CrossRef]
  12. Liu, Y.; Kennard, C.H.; Truss, R.W.; Calos, N.J. Characterization of stress-whitening of tensile yielded isotactic polypropylene. J. Polym. 1997, 38, 2797–2805. [Google Scholar] [CrossRef]
  13. Tiganis, B.E.; Shanks, R.A.; Long, Y. Effects of processing on the microstructure, melting behavior, and equilibrium melting temperature of polypropylene. J. Appl. Polym. Sci. 1996, 59, 663–671. [Google Scholar] [CrossRef]
  14. Aumnate, C.; Rudolph, N.; Sarmadi, M. Recycling of Polypropylene/Polyethylene Blends: Effect of Chain Structure on the Crystallization Behaviors. J. Polym. 2019, 11, 1456. [Google Scholar] [CrossRef] [Green Version]
  15. Spicker, C.; Rudolph, N.; Kühnert, I.; Aumnate, C. The use of rheological behavior to monitor the processing and service life properties of recycled polypropylene. Food Packag. Shelf. Life 2019, 19, 174–183. [Google Scholar] [CrossRef]
  16. Mofokeng, T.G.; Ray, S.S.; Ojijo, V. Influence of Selectively Localised Nanoclay Particles on Non-Isothermal Crystallisation and Degradation Behaviour of PP/LDPE Blend Composites. J. Polym. 2018, 10, 245. [Google Scholar] [CrossRef] [Green Version]
  17. Eagan, J.M.; Xu, J.; Di Girolamo, R.; Thurber, C.M.; Macosko, C.W.; LaPointe, A.M.; Bates, F.S.; Coates, G.W. Combining polyethylene and polypropylene: Enhanced performance with PE/iPP multiblock polymers. Science 2017, 355, 814–816. [Google Scholar] [CrossRef] [Green Version]
  18. Yao, S.; Tominaga, A.; Fujikawa, Y.; Sekiguchi, H.; Takatori, E. Inner Structure and Mechanical Properties of Recycled Polypropylene. Nihon Reoroji Gakkaishi 2013, 41, 173178. [Google Scholar] [CrossRef] [Green Version]
  19. Mantia, F.; Mistretta, M.; Titone, V. Rheological, Mechanical and Morphological Characterization of Monopolymer Blends Made by Virgin and Photo-Oxidized Polypropylene. J. Recycl. 2021, 6, 51. [Google Scholar] [CrossRef]
  20. La Mantia, F.P.; Mistretta, M.C.; Titone, V. An Additive Model to Predict the Rheological and Mechanical Properties of Polypropylene Blends Made by Virgin and Reprocessed Components. J. Recycl. 2021, 6, 2. [Google Scholar] [CrossRef]
  21. Marrone, M.; La Mantia, F.P. Monopolymers Blends of Virgin and Recycled Polypropylene. Polym. Recycl. 1996, 2, 9–17. [Google Scholar]
  22. Valenza, A.; La Mantia, F.P. Recycle of Polymer Waste: Part. 2 Stress degraded polypropylene. Polym. Deg. Stab. 1998, 20, 63. [Google Scholar] [CrossRef]
  23. Güldaş, A.; Uluer, O.; Özdemir, A. The Numerical Analysis of a Mold Cavity Filling Using the Finite Control Volume Method and Comparison to the Experimental Results. Polym. Plast. Technol. Eng. 2009, 48, 389–396. [Google Scholar] [CrossRef]
  24. Park, K. A Study on Flow Simulation and Deformation Analysis for Injection-Molded Plastic Parts Using Three-Dimensional Solid Elements. Polym. Plast. Technol. Eng. 2007, 43, 1569–1585. [Google Scholar] [CrossRef]
  25. Benitez-Rangel, J.P.; Domínguez-González, A.; Herrera-Ruiz, G.; Delgado-Rosas, M. Filling Process in Injection Mold: A Review. Polym. Plast. Technol. Eng. 2007, 46, 721–727. [Google Scholar] [CrossRef]
  26. Chen, Y.-S.; Wu, K.-T.; Tsai, M.-H.; Hwang, S.-J.; Lee, H.-H.; Peng, H.-S.; Chu, H.-Y. Adaptive process control of the changeover point for injection molding process. J. Low Freq. Noise Vib. Act. Control. 2021, 40, 383–394. [Google Scholar] [CrossRef] [Green Version]
  27. Chen, J.-Y.; Yang, K.-J.; Huang, M.-S. Online quality monitoring of molten resin in injection molding. Int. J. Heat Mass Transf. 2018, 122, 681–693. [Google Scholar] [CrossRef]
  28. Schiffers, R.; Kruppa, S.; Moser, S. The right changeover point for each shot. J. Kunststoffe. 2014, 11, 26–29. [Google Scholar]
  29. Gornik, C. Viscosity Measuring Methods for Feedstocks Directly on Injection Molding Machines. Mater. Sci. Forum. 2008, 591, 174–178. [Google Scholar] [CrossRef]
  30. Kamal, M.R.; Varela, A.E.; Patterson, W.I. Control of part weight in injection molding of amorphous thermoplastics. Polym. Eng. Sci. 2004, 39, 940–952. [Google Scholar] [CrossRef]
Figure 1. Schematic defining melt flow length ratios.
Sustainability 13 11085 g001
Figure 2. Process and diagram of PP production and recycling.
Sustainability 13 11085 g002
Figure 3. (a) Mold used measure fluidity; (b) Mold used to make tensile tests specimens.
Sustainability 13 11085 g003
Figure 4. Pressure sensor position and viscosity index calculation. (a) Tensile test part and position of a cavity pressure sensor; (b) cavity pressure measurement; (c) calculation of the viscosity index.
Sustainability 13 11085 g004
Figure 5. Effect of the number of TRs on the melt flow characteristic and crystallinity; (a) melt flow rate and melt flow length; (b) differential scanning calorimetry; (c) variation in crystallinity.
Sustainability 13 11085 g005
Figure 6. Effects of number of TRs on cavity pressure and viscosity index.
Sustainability 13 11085 g006
Figure 7. Effects of the number of TRs on crystallization temperature (X-axis), viscosity index (solid), and tensile strength (dashed) (Y-axis).
Sustainability 13 11085 g007
Figure 8. Effect of processing parameters on tensile strength for Raw-PP and Tr-PP tensile test parts; (a) screw speed; (b) back pressure; (c) melt temperature.
Sustainability 13 11085 g008
Figure 9. Effect of processing parameters on viscosity index for Raw-PP and Tr-PP tensile test parts; (a) screw speed; (b) back pressure; (c) melt temperature.
Sustainability 13 11085 g009
Table 1. Basic parameter setting for the manufacturing of the injection-molded different test parts.
ParameterFluidity TestTensile Test
Barrel heating-film temperature (melt temperature)210 °C210 °C
Mold heating, water temperature (mold temperature)60 °C60 °C
Maximum system pressure170  bar170  bar
Screw speed100 rpm100 rpm
Back pressure5 bar5 bar
Plasticizing time10 s10 s
Injection pressure100%100%
Injection speed70 mm/s70 mm/s
Injection time1.5 s1.5 s
Packing pressure switching point0 mm5 mm
Packing pressure0%20%
Packing time0 s10 s
Cooling time10 s20 s
Table 2. Processing parameters and random order of treatment of the injection-molded PP and Tr-PP tensile test parts.
Exp.Screw Speed (rpm)Back Pressure (bar)Melt Temperature (°C)
1505210
21005210
31505210
41000210
510010210
61005190
71005230
81005210
91005210
Publisher’s Note: MDPI stays neutral with regard to jurisdictional claims in published maps and institutional affiliations.

