Article

Environmental Impacts Associated with Intensive Production in Pig Farms in Mexico through Life Cycle Assessment

by
Mario Rafael Giraldi-Díaz
1,
Eduardo Castillo-González
2,
Lorena De Medina-Salas
1,*,
Raúl Velásquez-De la Cruz
1 and
Héctor Daniel Huerta-Silva
1
1
Facultad de Ciencias Químicas, Universidad Veracruzana, Circuito Gonzalo Aguirre Beltrán, Zona Universitaria, Xalapa 91040, Veracruz, Mexico
2
Facultad de Ingeniería Civil, Universidad Veracruzana, Circuito Gonzalo Aguirre Beltrán, Zona Universitaria, Xalapa 91040, Veracruz, Mexico
*
Author to whom correspondence should be addressed.
Sustainability 2021, 13(20), 11248; https://0-doi-org.brum.beds.ac.uk/10.3390/su132011248
Submission received: 14 September 2021 / Revised: 4 October 2021 / Accepted: 7 October 2021 / Published: 12 October 2021

Abstract

:
In this research, environmental impacts associated with the intensive production of pigs on a farm in Mexico were determined through the application of life cycle assessment methodology. The research was focused on the following stages of the product system: (i) pig rearing and growth phases; (ii) production operations in the pig-house; (iii) the supply of feed. The life cycle inventory database was mainly made up of data collected in field visits to local farms. The functional unit was defined as one finished swine weighing 124 kg. The results for the selected impact categories of carbon, water, and energy footprints were 538.62 kg CO2eq, 21.34 m3, and 1773.79 MJ, respectively. The greatest impact was generated in the final stages of pig fattening, mainly due to the large quantity of feed supplied. The impacts caused by operation of the pig farm were less significant, their contribution in all cases was less than a third of the total quantified values. The energy conversion of pig slurry improves the environmental performance of the product system by reducing the carbon footprint.

1. Introduction

The increase in world population and economic development, as well as changes in diet and better quality of life have made pork become a staple food worldwide [1,2]; pork represented 38% of the total animal meat consumed in the world in 2018 [3]. World per-capita consumption of pork grew from 34.1 kg in 2016 to 44.6 kg in 2018 [3,4], which corresponded to 4.7% of the per-capita calories consumed within a conventional diet [5]. As for the world production of pork, it was 110,109 Mt in 2019, with a sustained average annual growth of 2.45% in the last 60 years [6]. The main producer in 2019 was China, while Mexico was the 13th with a production of 1.6 Mt [6].
The pig sector is a complex system that includes the maintenance of facilities for intensive breeding, fuel consumption, electricity and water, transportation of the required inputs, as well as the supply of feed from agricultural products that involves the use of fertilizers and pesticides [7,8]. It has been reported that the main environmental impacts are focused in the feed supply chain, which is made up of corn, soybeans, wheat, barley, among other agricultural products. In addition to the pig meat production processes, animal waste, such as slurry, is also the cause of contamination when deposited in water and soil, as well as air emissions that generate bad odors and negative social and aesthetic effects [9,10]. At a global level, it has been reported that intensive pig rearing generates around 10% of GHG emissions from livestock, which corresponds to second place in this sector [11], while its energy consumption represented 31% of consumption in the agro-livestock sector [12,13]. Within the main productions of animal meat for human consumption, pork shows one of the largest volumes of fresh water necessary to assimilate the load of pollutants derived from its production system [14]; commercially, pork represents a contribution of 3.25% of globally exported virtual water [15].
In the reviewed literature, several authors studied GHG emissions, water consumption, and energy from pig production using life cycle analysis [16,17]. Dolman et al. [18], Cherubini et al. [19], and Noya et al. [20] included feed production, cultivation, transport, use of fertilizers, pesticides, pig rearing, and farm management; they reported that more than 80% of the associated impacts were attributed to feed production and transportation. Comparative studies of different production systems have been carried out in the same region. Mackenzie et al. [21], Gonzáles-García et al. [22], Djekic et al. [23], and Lamnatou et al. [24] indicated that there are slight variations in the results of the selected impact categories attributed to feed formulation, while Monteiro et al. [25] and Anestis et al. [26] mentioned that it is possible to reduce environmental impacts by producing resources locally or by modifying feed formulation. In studies by Wiedemann et al. [27] and McAuliffe et al. [28], the pig production chain was analyzed from an energy perspective, and their results showed that 65% of environmental impacts were due to energy consumption from feed production and the remaining 35% from pig farming. They mentioned the use of alternative systems for manure management, producing biogas to reduce energy consumption, and thereby reduce subsequent environmental impacts such as water pollution and GHG emissions.
According to the aforementioned, this research aimed to study the main activities and processes that are carried out in an intensive pig production farm in Mexico; which included the compilation and quantification of the process flows involved and their supply chain in order to identify the stages that contribute to the environmental impacts associated with carbon, water, and energy footprints.

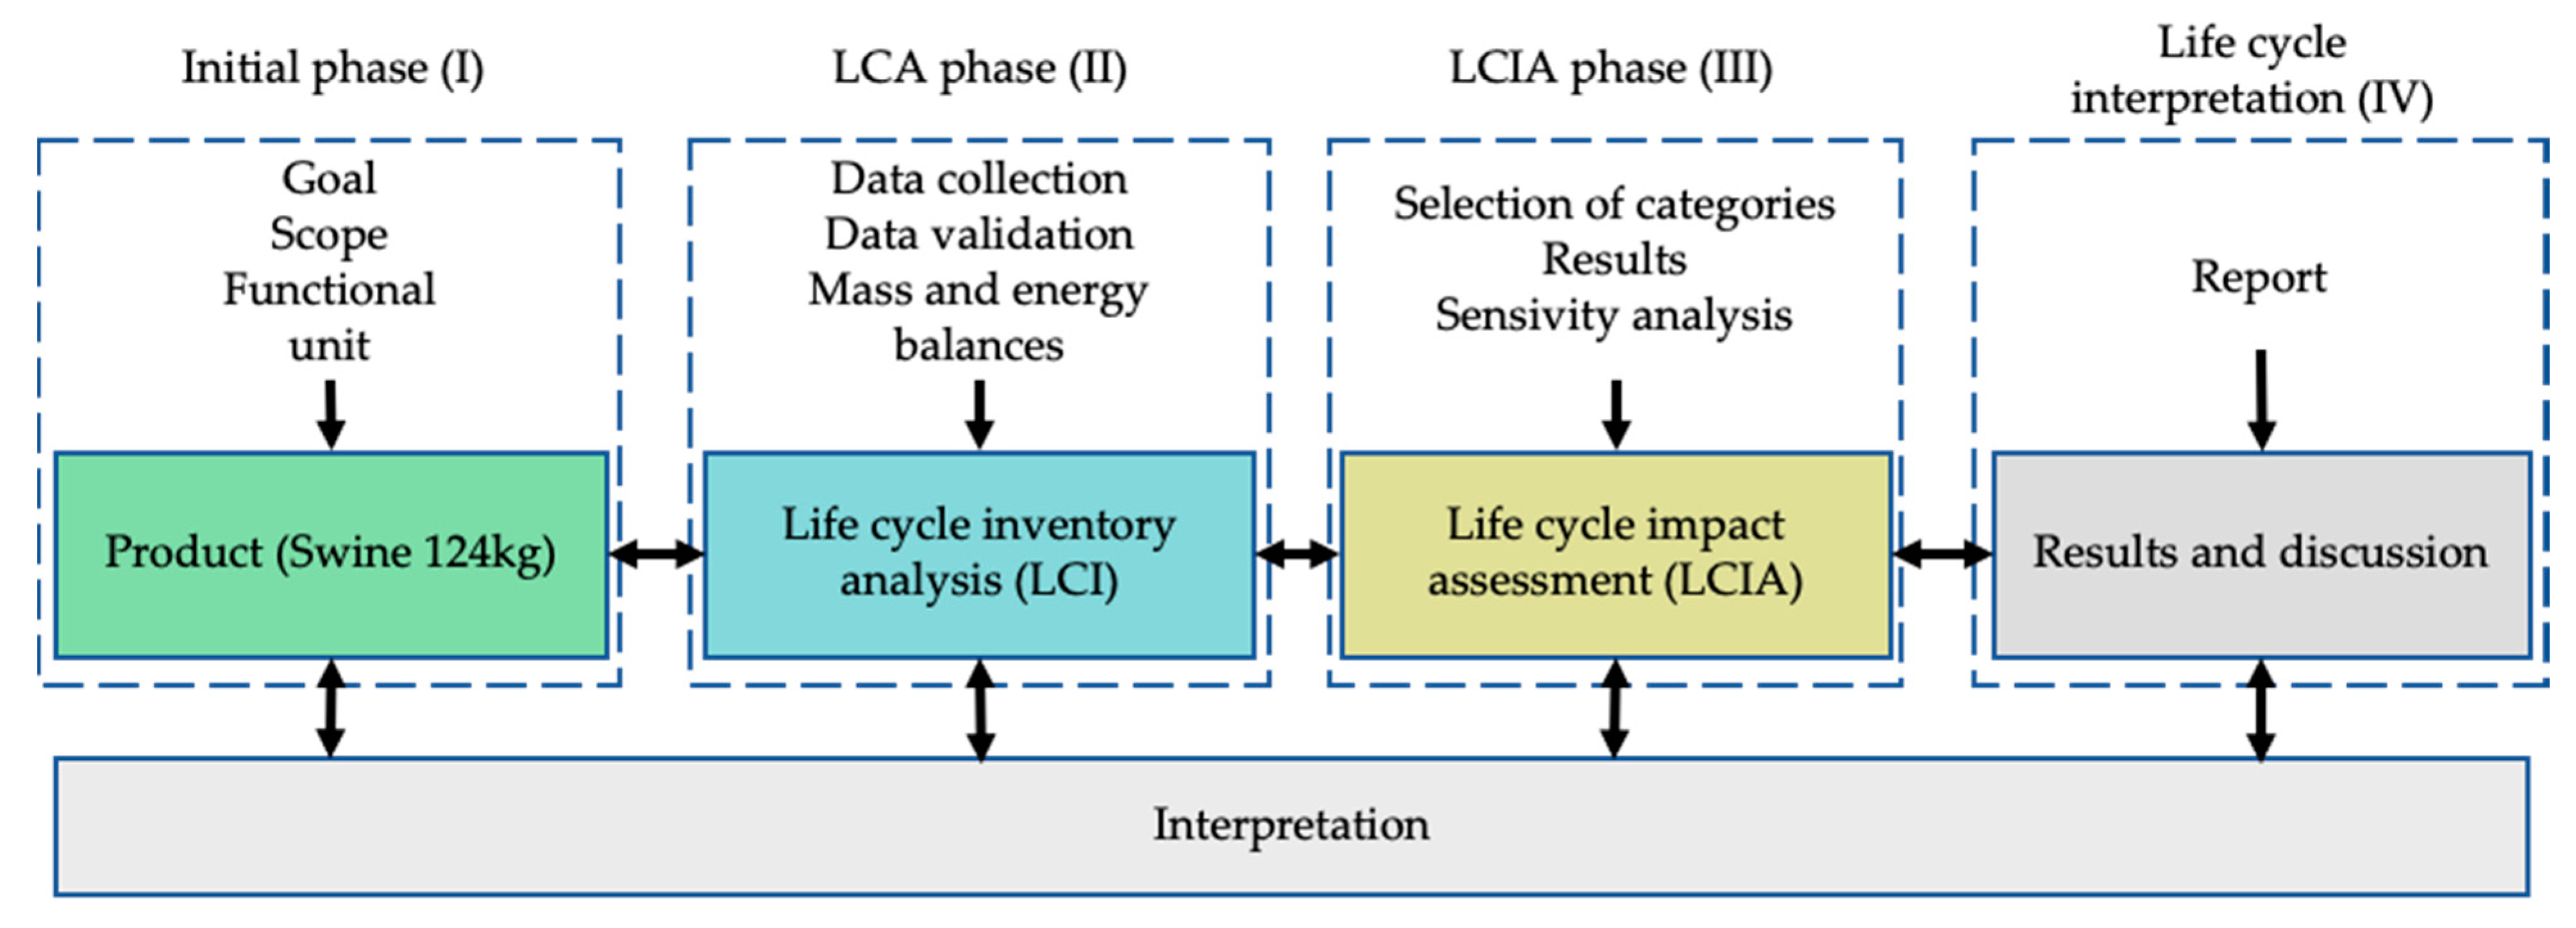
2. Materials and Methods

The methodology used for this work was based on ISO 14040: 2006 and ISO 14044: 2006 [29,30], which included the phases shown in Figure 1: definition of objectives and scope, life cycle inventory (LCI), evaluation of life cycle impact, and life cycle interpretation.

2.1. Definition of Objectives and Scope

In this first phase, it is necessary to describe everything related to the product system; the objectives and scope of the study are established, and they must be coherent and concrete as to allow the development of the following stages of the life cycle analysis. It is necessary to include geographic information of the study area as well as the temporal delimitation for data collection [31,32]. Subsequently, the functional unit used to relate and quantify the flows of matter and energy that represents the functionality of the product system is defined in such a way that environmental impacts are associated with them, which allows the comparison of two or more different systems.
The limits of the product system are established as well as the activities, processes, and operations involved, and a detailed description of each of them is made. The input and output flows that correspond to each stage of the product system are indicated, including the extraction of raw materials, the manufacture of inputs, the transformation processes to make the final product, the supply of energy, effluents, emissions and waste generated, among others. Similarly, the products and co-products evaluated in the LCA study are also mentioned [33,34].

2.2. Life Cycle Inventory

In this stage, product system data are obtained through fieldwork and related studies. With the data collected, matter and energy calculations are carried out to determine the magnitudes of the flows defined in the first phase of the LCA. Detailed information is essential at every stage of the product system. Once the values obtained have been quantified and validated, they constitute the life cycle inventory database (LCI database) [35]. If required, load assignments will be applied for the distribution of environmental impacts associated with the production stages with more than one output. There are different allocation procedures available that must be in accordance with the provisions of ISO 14044 [29] for these cases.

2.3. Impact Assessment

The purpose of the Life Cycle Impact Assessment (LCIA) is to relate LCI data with potential environmental loads resulting from the product system through procedures established from specialized literature. Table 1 describes the categories used in this research: carbon footprint (CF), water footprint (WF), and energy footprint (EF). To quantify the environmental impacts from GHG emissions, ReCiPe methodology (v. 1.01) [35] was used, which is based on ISO 14067: 2018 [36] standard. In addition, the method of vulnerability assessment and water accounting (WAVE) [37] was used to quantify the water footprint, in accordance with procedure provided in ISO 14046: 2014 [38] standard.
As for the energy footprint, this was based on the accumulated energy demand (CED) methodology, which made it possible to account for the different renewable and non-renewable primary energy sources used in the product system [39,40,41,42]. For the quantification of the energy flows, energy conversion, efficiency, and the plant factors were used, spanning from generation to final energy consumption, mainly in the electric power production processes. In the case of fossil fuels and the electrical power consumed in the current LCA, they are mainly supplied from local production by state companies [43]. The energy balance of primary energy in Mexico is predominantly from fossil sources, which strongly conditions the result of the carbon footprint in the supply of electrical power [44,45,46]. Data were collected from local and international references [47,48,49,50].

2.4. Life Cycle Interpretation

Life cycle interpretation relates and analyzes the results of the LCI and LCIA with the objectives and scope proposed in the initial phase. Limitations and recommendations are presented from the results obtained; a sensitivity analysis can also be included.

3. LCA from Intensive Pig Production on Farms

3.1. Objectives and Scope

The objective of this research was to quantify the environmental impacts associated with carbon, water, and energy footprints from an intensive production system for live-weight pigs. The functional unit was defined as the production of a 124 kg live-weight pig for commercialization. An analysis of the life cycle from “cradle to gate” was carried out; starting at feed production, input transport, as well as the intensive rearing in pig-houses, up to obtaining a finished pig, with the previously established weight, for sale. The materials and inputs for each stage of the product system were identified; with this information, through material and energy balances, the following flows were identified: intermediate, of products, by-products, and residuals to treatment and those flows released to the environment as gas emissions and liquid or solid effluents. Capital goods were considered, among which the use of machinery for land preparation and supply transportation were included; others were excluded, such as the construction of facilities. Because these contributions do not represent significant results, the literature has reported that, in the case of intensive conventional livestock production, the use of fossil energy, as well as for the impacts from GHG emissions, these inputs are considerably amortized [51,52,53,54,55,56,57].

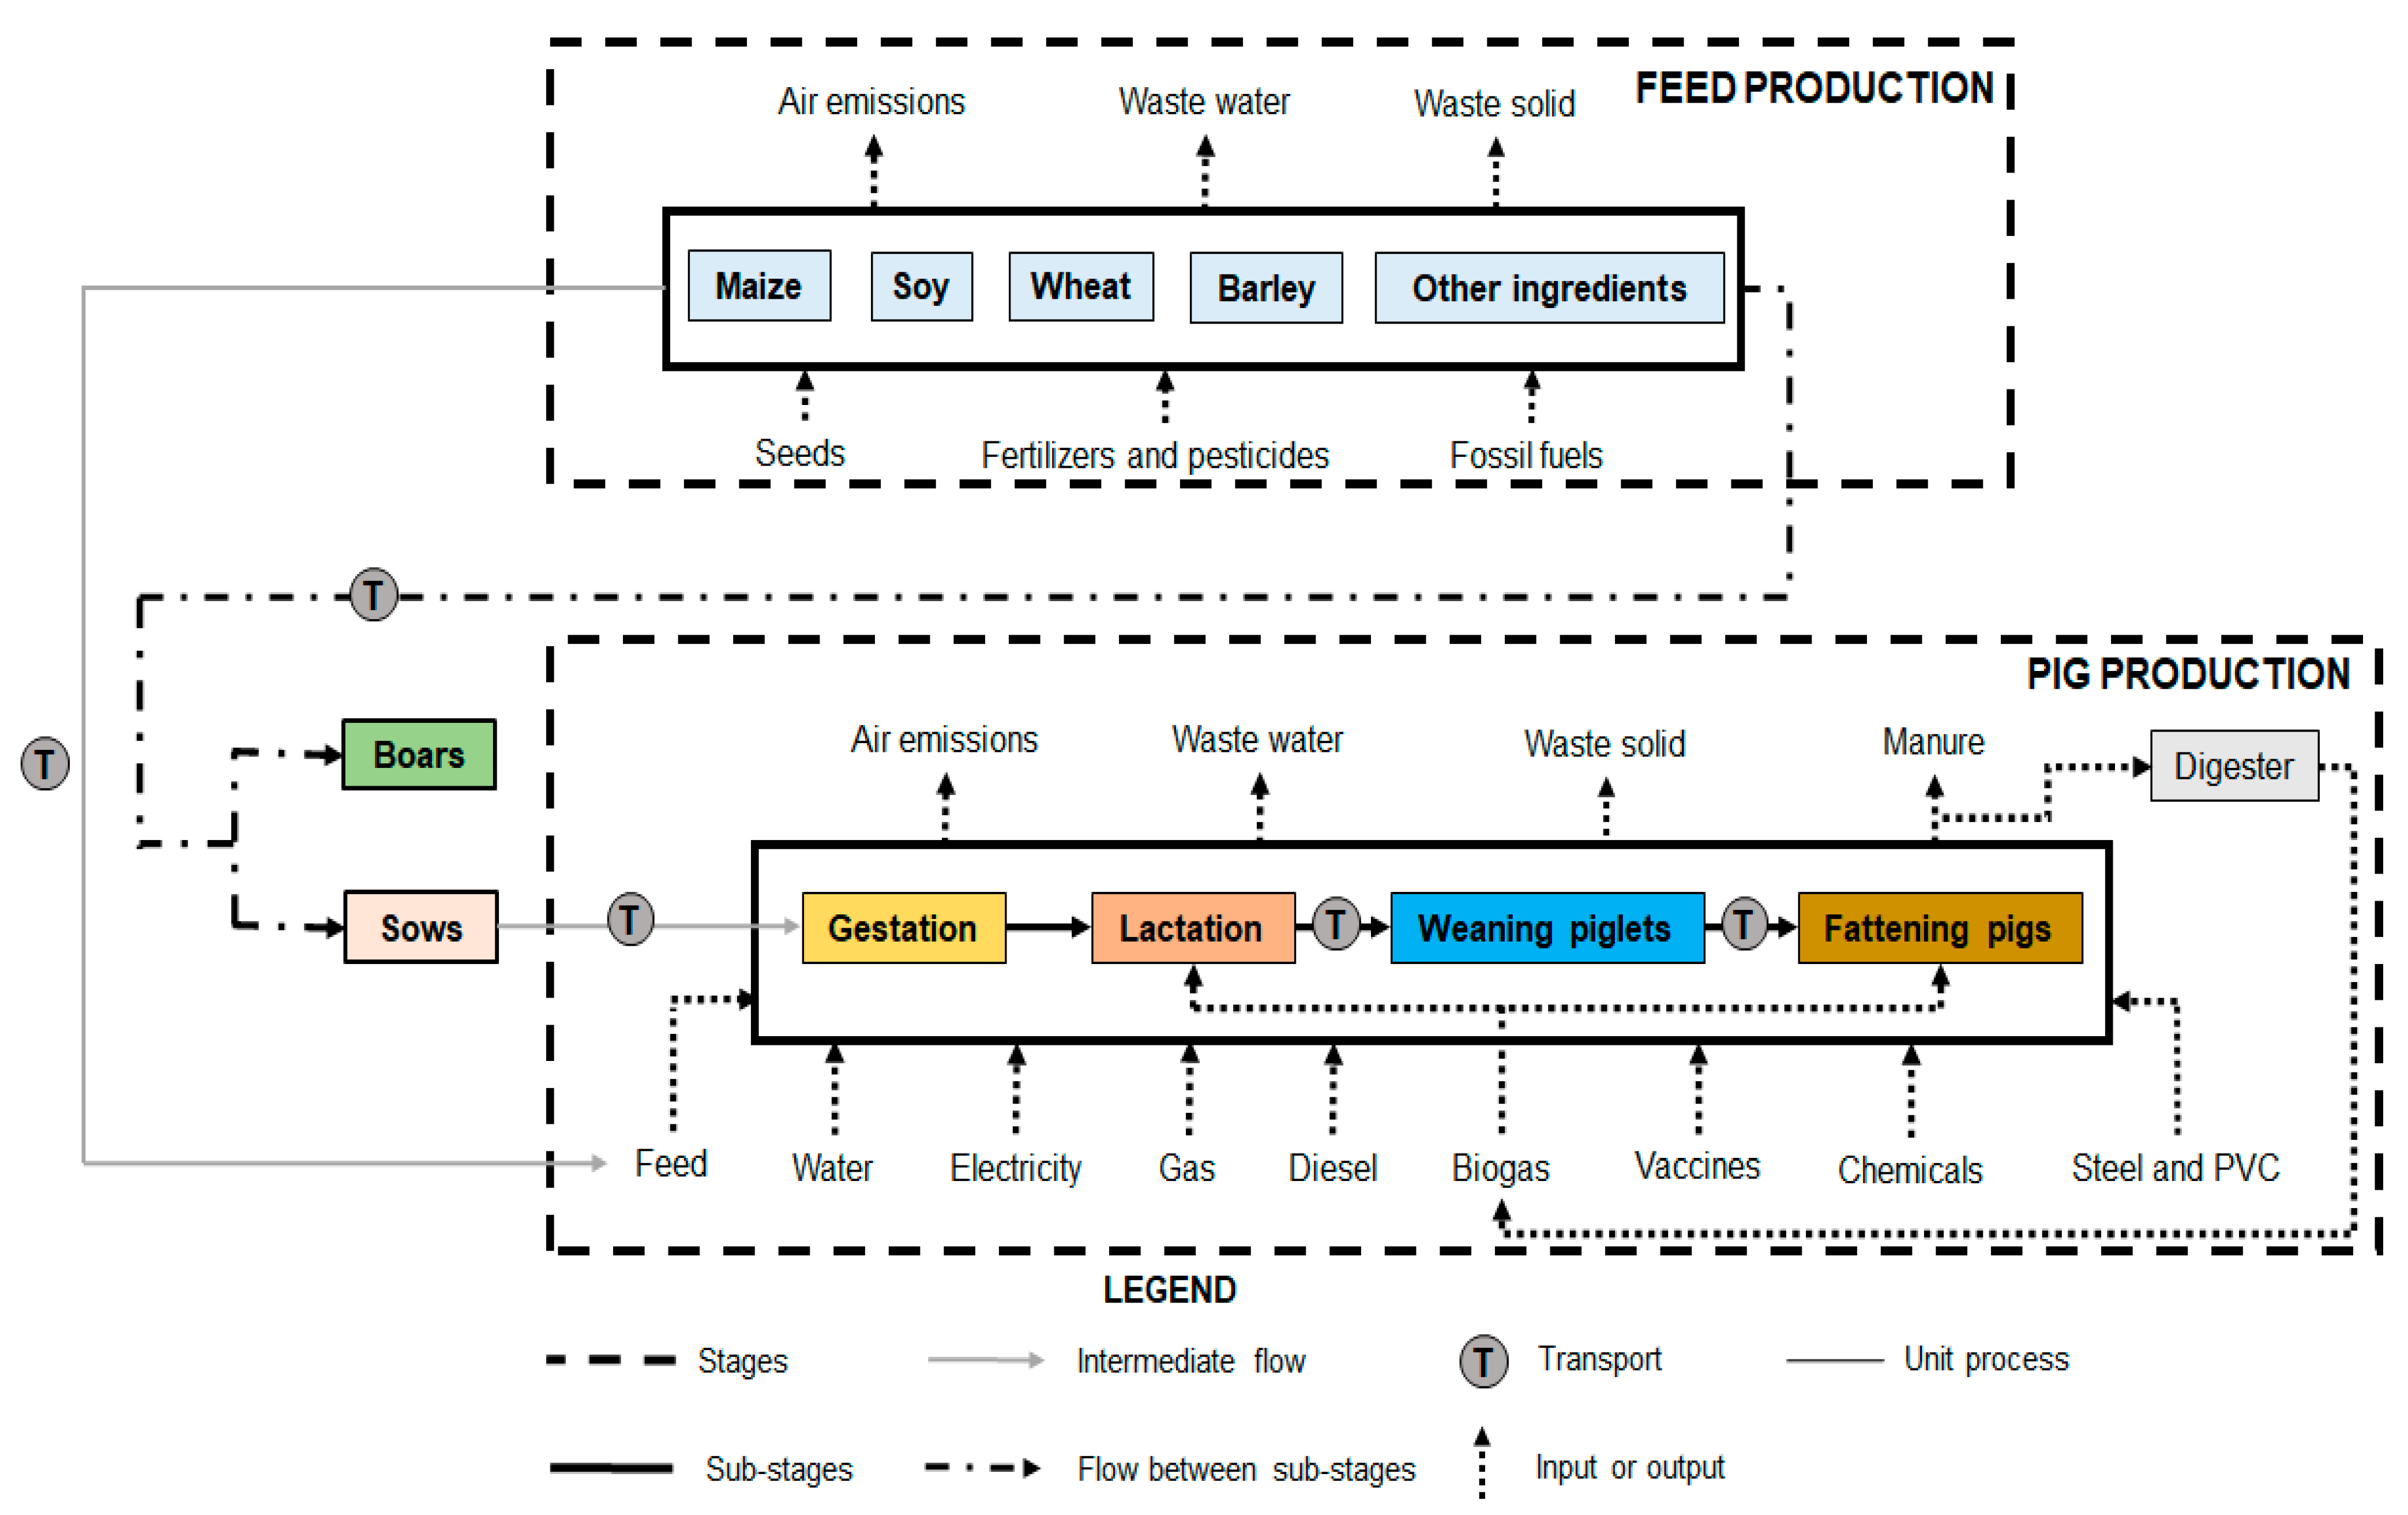
3.2. System Boundary Description

The pork industry in Mexico has three production systems: technified system (intensive), semi-technified (semi-intensive) and artisanal or backyard (extensive). The type of pig farm and its management depend mainly on the characteristics of the place, the type of food supplied, and the degree of technification in each of the stages of the production cycle [58]. For this study, an intensive system was considered, which uses a technified process, genetic control of pigs, feeding with adequate nutritional requirements for each stage, rigorous sanitary measures and suitable infrastructure. As for the raising of the pigs, they are kept in closed high-density pig-housing, with scheduled management and daily information gathering. The study area was a series of intensive production pig farms located in the Mexican Altiplano, where there is a semi-dry climate with a temperature range of 3.6 °C to 21.6 °C and an annual average of 12.6 °C [59]. The current stages studied within the intensive pig production process are shown in Figure 2, and the description of each stage of the product system is shown in the section below.

3.2.1. Reproduction

This phase consists of three main stages: (i) boar-house, (ii) acclimatization, and (iii) insemination. In the first stage, stud pigs are acquired externally in a nucleus farm, which is in charge of producing animals with the required genetic quality. Once they have reached proper maturity, they are transferred to the boar-house of the productive system. By the age of 5 and 6 months, they are to be quarantined and trained for 2 to 4 months. Their first reproductive cycle occurs at the first year of age, and they have a productive life of up to 3 to 4 years, after which they are replaced. In the acclimatization stage, gilts are chosen at birth due to their genetic makeup, herd quality, and profitability; they must have an average of 2.2 to 2.4 farrows per year. Gilts are placed in individual pens at the age of 5 months, which is the moment when their reproductive management begins. The sow acclimatization period lasts 2 months. Estrus sows that have completed quarantine and acclimatization are artificially inseminated, this period lasts from 7 to 14 days [60].

3.2.2. Gestation

This phase consists of sows that have just been inseminated or those that have begun their gestation period, which lasts about 114 days. The sows are housed in individual pens where they gain weight quickly; therefore, a balanced diet is necessary. They are also supervised on a daily basis, as they require careful management throughout their pregnancies. To keep the sows healthy, facilities are constantly cleaned, removing any excreted residue [61].

3.2.3. Piglet Breeding

This consists of two stages: (i) lactation and (ii) weaning. The first stage, once the piglets are born, will see them transferred to a warm area; this is where they have the first care, and they are vaccinated and dewormed. Later, they are taken back to the dam for lactation; this period can last 7 to 28 days. The main feed for the piglet is milk along with additional portions of nutrients and medicines. Sows have a lifespan of around 6 farrowings [61]. In the second stage, weaning, one can find the piglets that have completed their lactation period; they are regularly arranged in pens with some type of heating. This phase is critical in its management and nutrition for a good survival performance. Here, piglets consume water and balanced feed with good digestibility; this period lasts around 2 months [62].

3.2.4. Fattening

At this stage, the hogs are in the growth, development, and completion phase. This growth phase lasts 3.5 to 4 months. Hogs gain weight rapidly, due to a huge supply of balanced feed. The generation of animal waste is also abundant, which requires a greater amount of cleaning supplies and waste management. In order to keep mortality low, rigorous sanitary control is carried out. When the baconer (a pig weighing between 83 and 101 kg) reaches a weight of about 124 kg, its departure from the pig-house is prepared after a quality review [63,64].

3.3. Life Cycle Inventory

The information was primarily collected through field interviews with personnel specialized in the swine production at the pig farm [60,61,62,63]. The field work consisted of: (i) verification of the stages that make up the pigs’ productive cycle (Section 3.2); (ii) knowledge of the daily activities in the pig house; (iii) supply identification from the product system, such as feed, water, and energy consumption, among others; (iv) feeding in the different rearing stages; (v) management of the waste generated. Questionnaires were prepared for application to operational agents, within the production process, for this purpose. The data collected were based on the measurement of the time of use of machinery, consumption of fossil fuels, electrical energy, supplied water, as well as the amount of chemical products used for the health care of the pigs. Secondary data were complemented with information from the literature, such as local sources of primary energy, external transport, feed produced outside the region of analysis, and manufacture of agrochemical supplies. Subsequently, the material and energy balances were carried out to determine all the flows that make up the product system, as well as the allocation criteria for the identified co-products. The following sections describe specific information for the structure of the current LCI.

3.3.1. Energy Supply

The energy consumptions in the studied farms are mainly electric power and LP gas. Electric energy is used mainly for the following: electric fences, gear motors, ventilation systems, centrifugal and submersible pumps, pressure washers, alarms, lighting, and services in facilities, among others. In the case of the ventilation system, it is done in two ways; the first is manual, this uses elevators that, when activated, open or close curtains that have access to the outside of the pens. The second is automated ventilation, it consists of the use of helical fans, which are placed within the stages that require greater temperature control, such as lactation and weaning. For heating, LP gas is used to produce hot air transferred through pipes to pig pens.
The following factors were used for the quantification of energy flows: energy conversion, energy efficiency, and energy losses from production to final energy consumption, mainly for the generation of electrical power. The data were compiled from technical reports found in the balance sheets of the national energy sector, as shown in Table 2.
Local and international references were used for the energy required for the manufacture of basic supplies and fuels, such as LP gas and diesel for heating and local transportation, as well as for the manufacture of agrochemical supplies, which is shown in Table 3.

3.3.2. Pig Balance

In the different stages of pig development, from gestation to final product, losses were recorded due to different causes, mainly: premature death at birth, diseases, or crushing during transport between pigpens. Likewise, the outflows for minority sales of pigs in early stages of growth were included in the pig balance, which provide little economic benefit, however it is a commercial activity present in the farms analyzed. Table 4 shows the pig balance based on the calculation to produce 100 finished swine weighing 124 kg. The pig balance data were used to quantify mass allocation according to the co-products generated in the product system [60]. Regarding enteric gases, the Tier-1 method was used with the methane emission factors reported in the literature [66,67,68].

3.3.3. Food Balance

At each stage of the pigs’ growth, the type of feed supplied was quantified, which was formulated according to age. For the distribution of balanced feed within the farm, it is transported from the container silos to the pig pens through loading vehicles. While worm-type geared motors are used inside the pens, automatically programmed to bring the feed to the feeders. Table 5 shows the proportion of each feed that was used in the current LCA. According to information collected from the farms studied, most of the food supply is imported, mainly from the USA, while only part of it is of regional origin [69]. For the current LCA, corn as the main product in intensive pig feeding was quantified from local production with our own field data [60,61,62,63], while the rest of the food supplies were obtained from Ecoinvent database (v. 3.7.1) [70].

3.3.4. Water Use

Submersible pumps are used to extract the water from deep wells. Then, the water is stored in cisterns from where it is transported to the farms with the use of centrifugal pumps. Inside the pig pens, the water is provided to the pigs continuously by means of stainless steel nipples. The highest water consumption is in the fattening stages, followed by pig maternity; while the boars-house shows the lowest using up. On the other hand, the pens are washed daily with the use of kärcher-type pressure washers that use water with the necessary dose of disinfectant to keep the rearing spaces clean and sanitized. The wastewater generated is dislodged through a sewerage system that transfers the pig slurry to treatment lagoons [61,62].

3.3.5. Transport

The transport of supplies and pigs was a recurring operation in the product system. The transport of feed was considered to include routes in the range of 200 to 2600 km from the crop regions to where the pig farms were located. Within the facilities, feed is transported from the storage silos to the different pigpens; this transfer is carried out daily. Transportation of supplies required for farm operations was also included. External transport, due to the supply of food and goods, to the farms represented practically all of this activity, since transport within the farms only contributed 0.2% of the total. In the case of the means of transport used, this was mainly by road, in double-trailer trucks, and by rail.

3.3.6. Foreground Data Collection for the LCI

In addition to what has been described, various supplies were accounted for in the inventory of daily operations of the pig farm, such as sharps, syringes, latex gloves, containers, and plastic bags, among others. Table 6 shows a summary from the foreground data collection; these include the main flows of mass and energy supplies that were recurrent in the pig-house operations and auxiliary facilities inside the pig farm. The amounts shown were referenced to the functional unit of a produced 124 kg swine.

3.4. Life Cycle Impact Assessment

Table 7 shows the environmental impacts associated with the product system of intensive pig production per impact category.

4. Results and Discussion

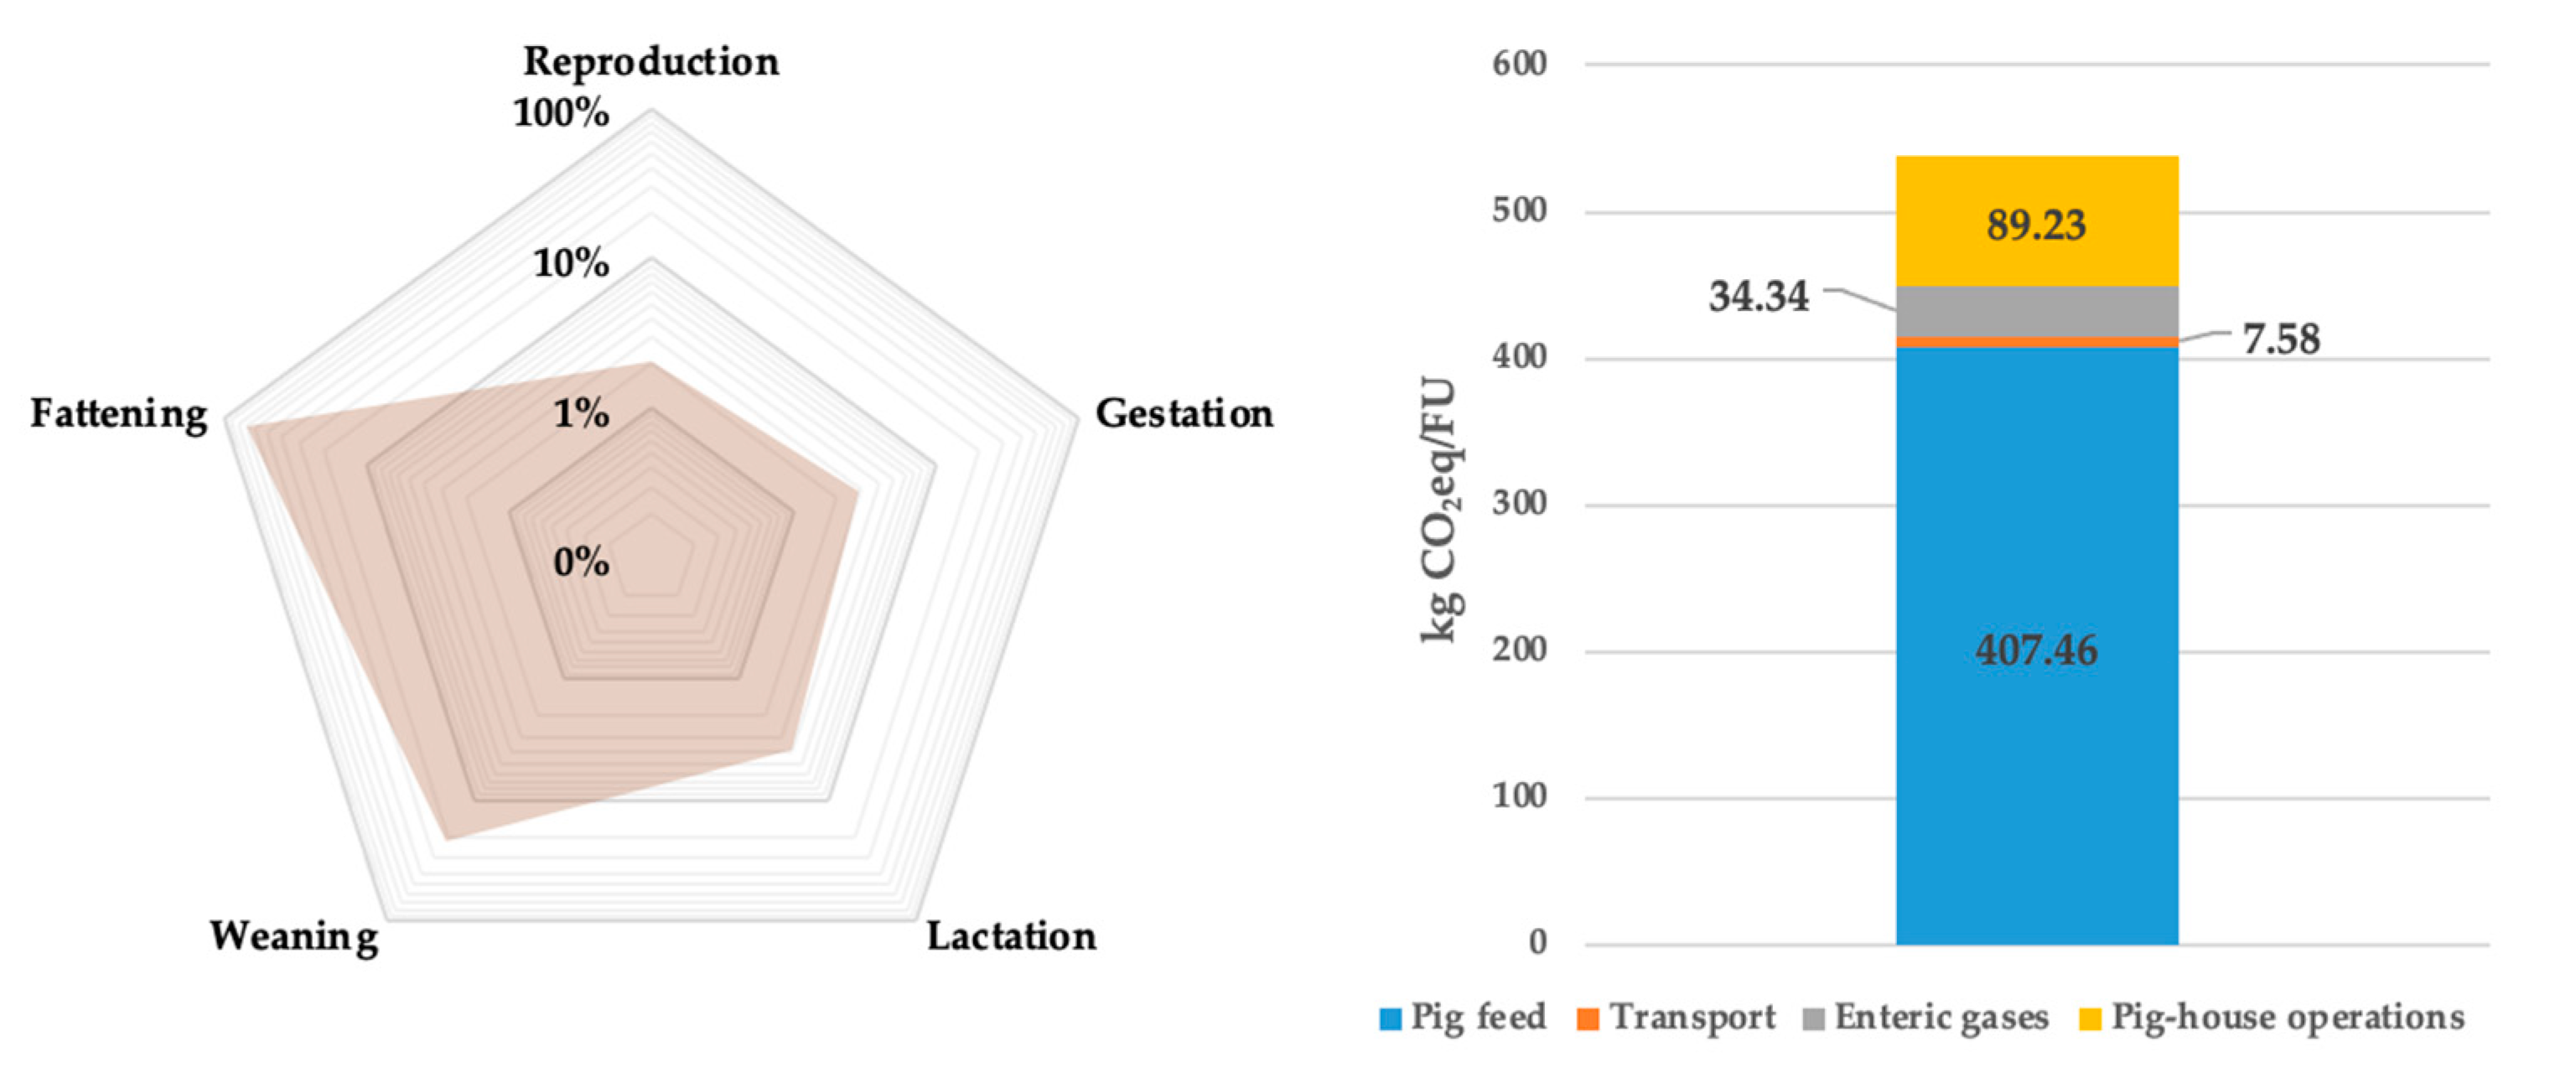
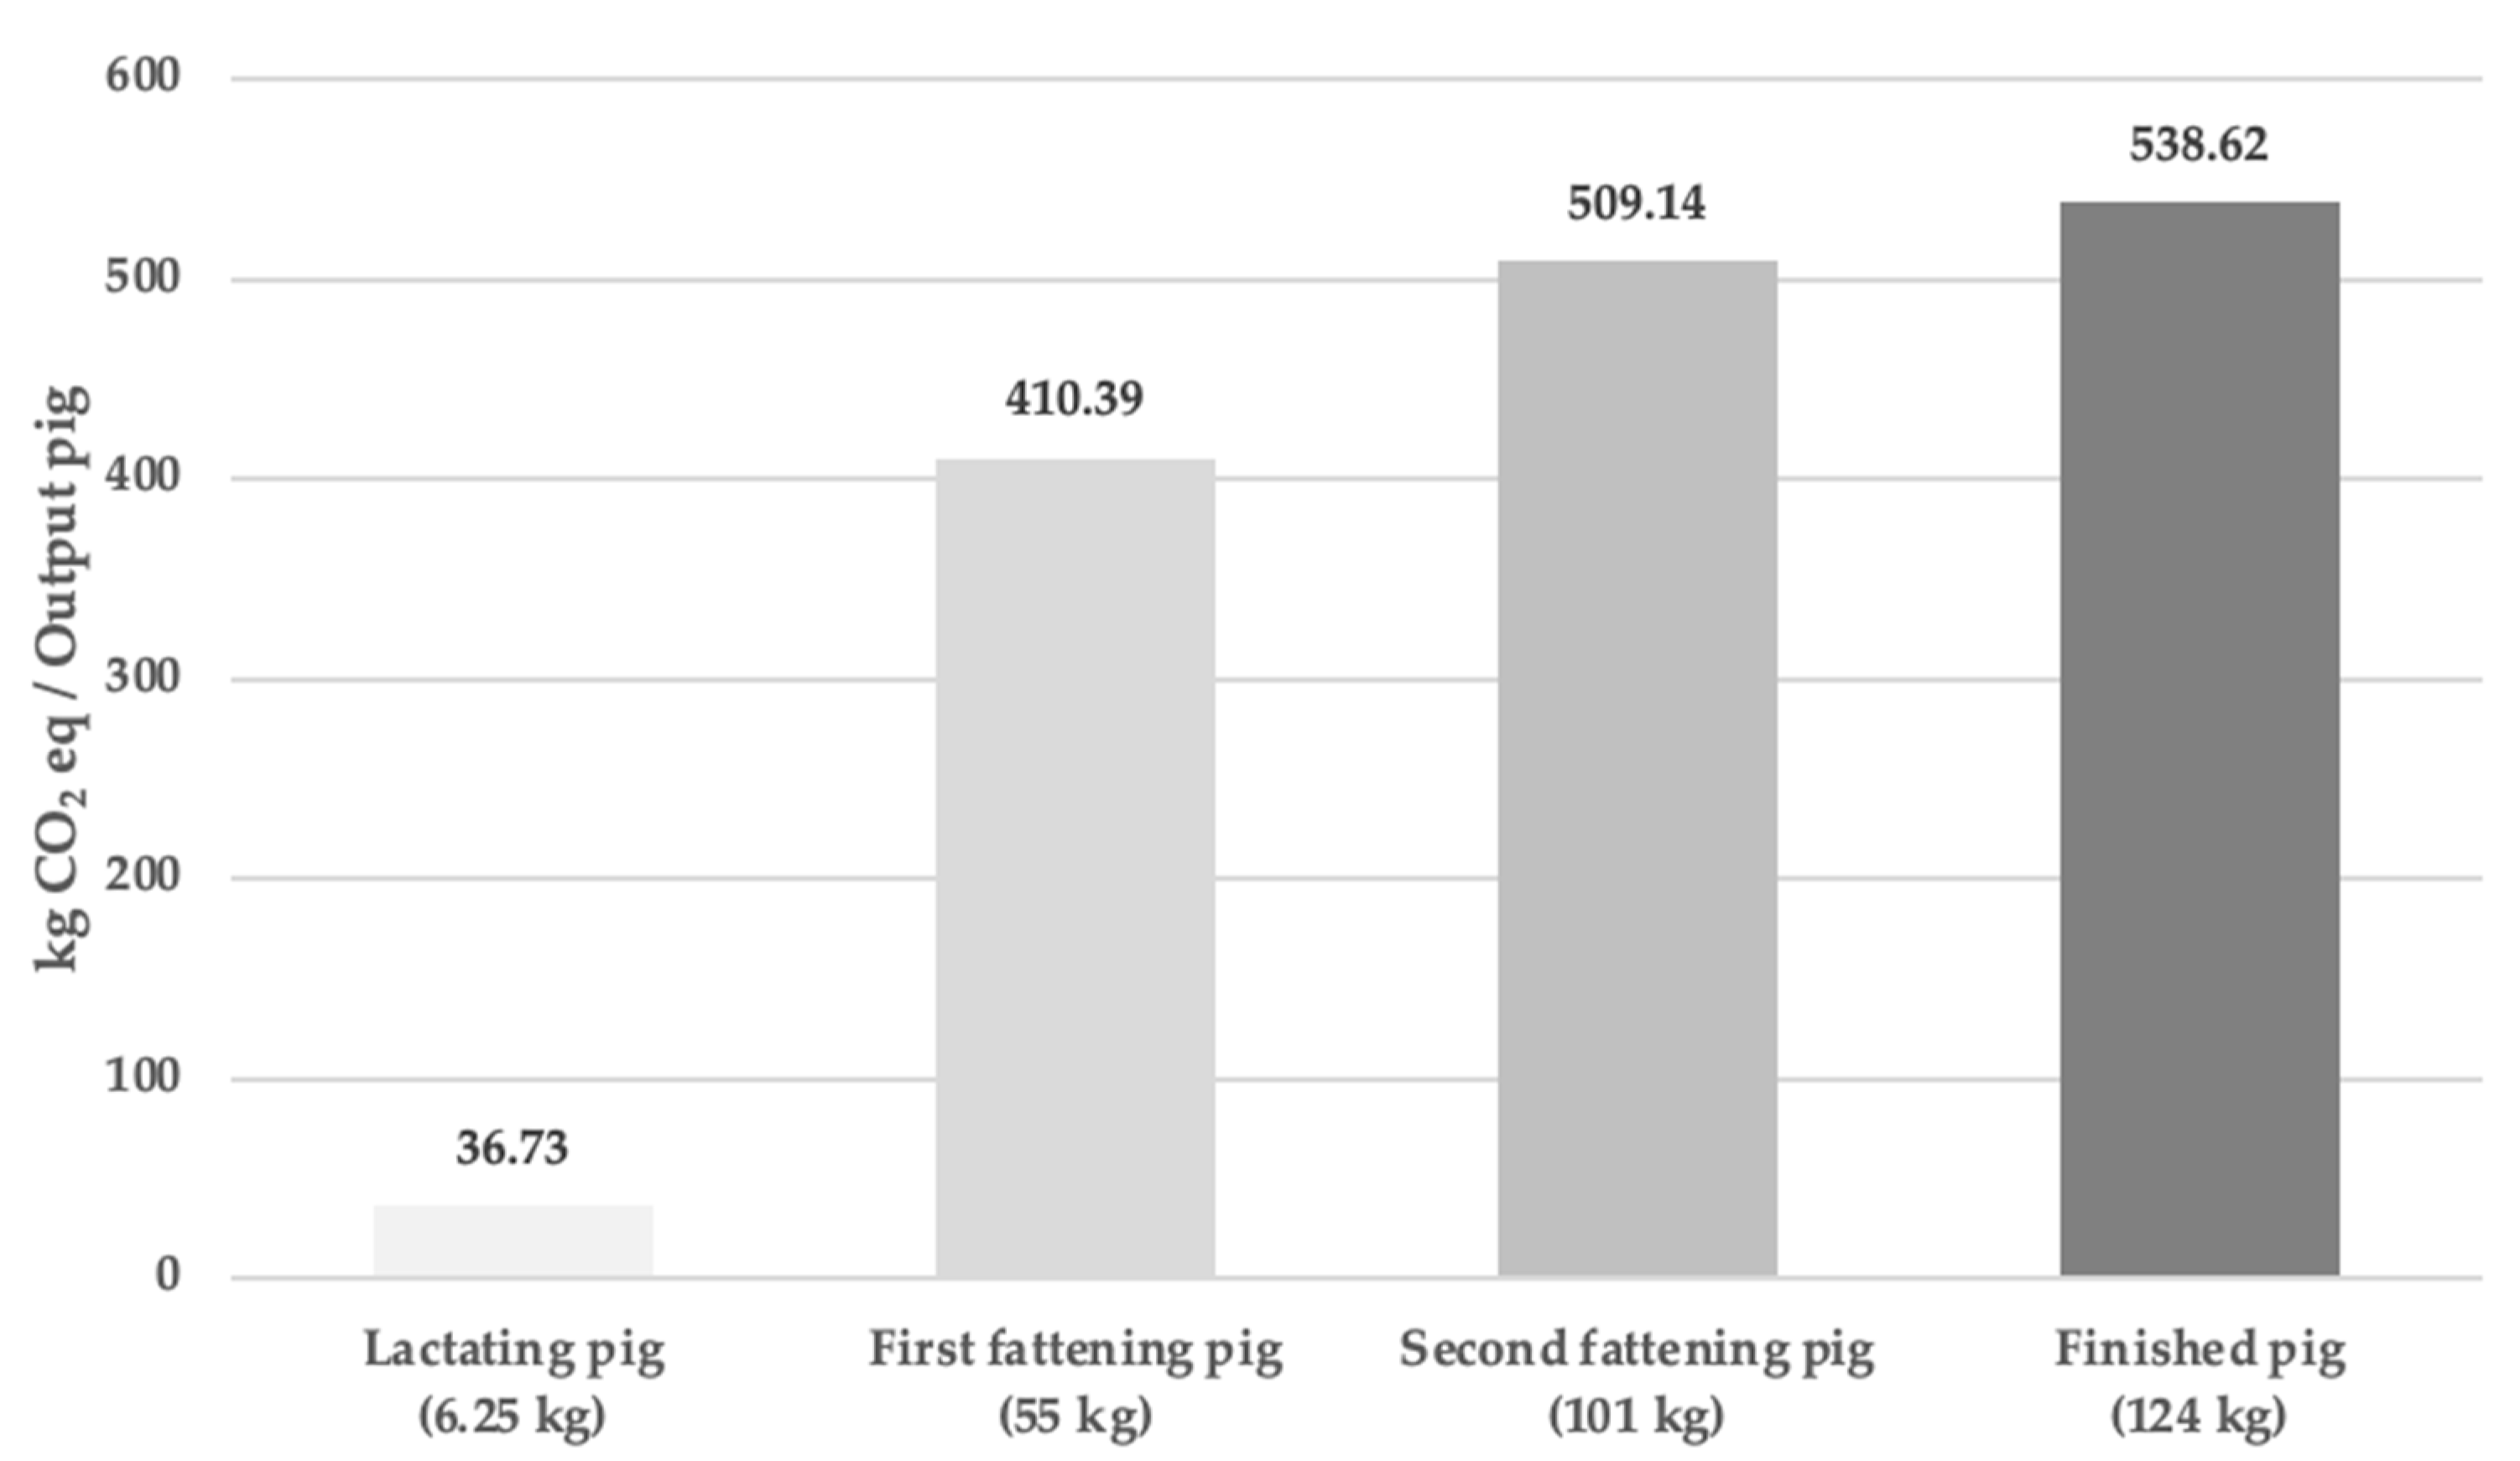
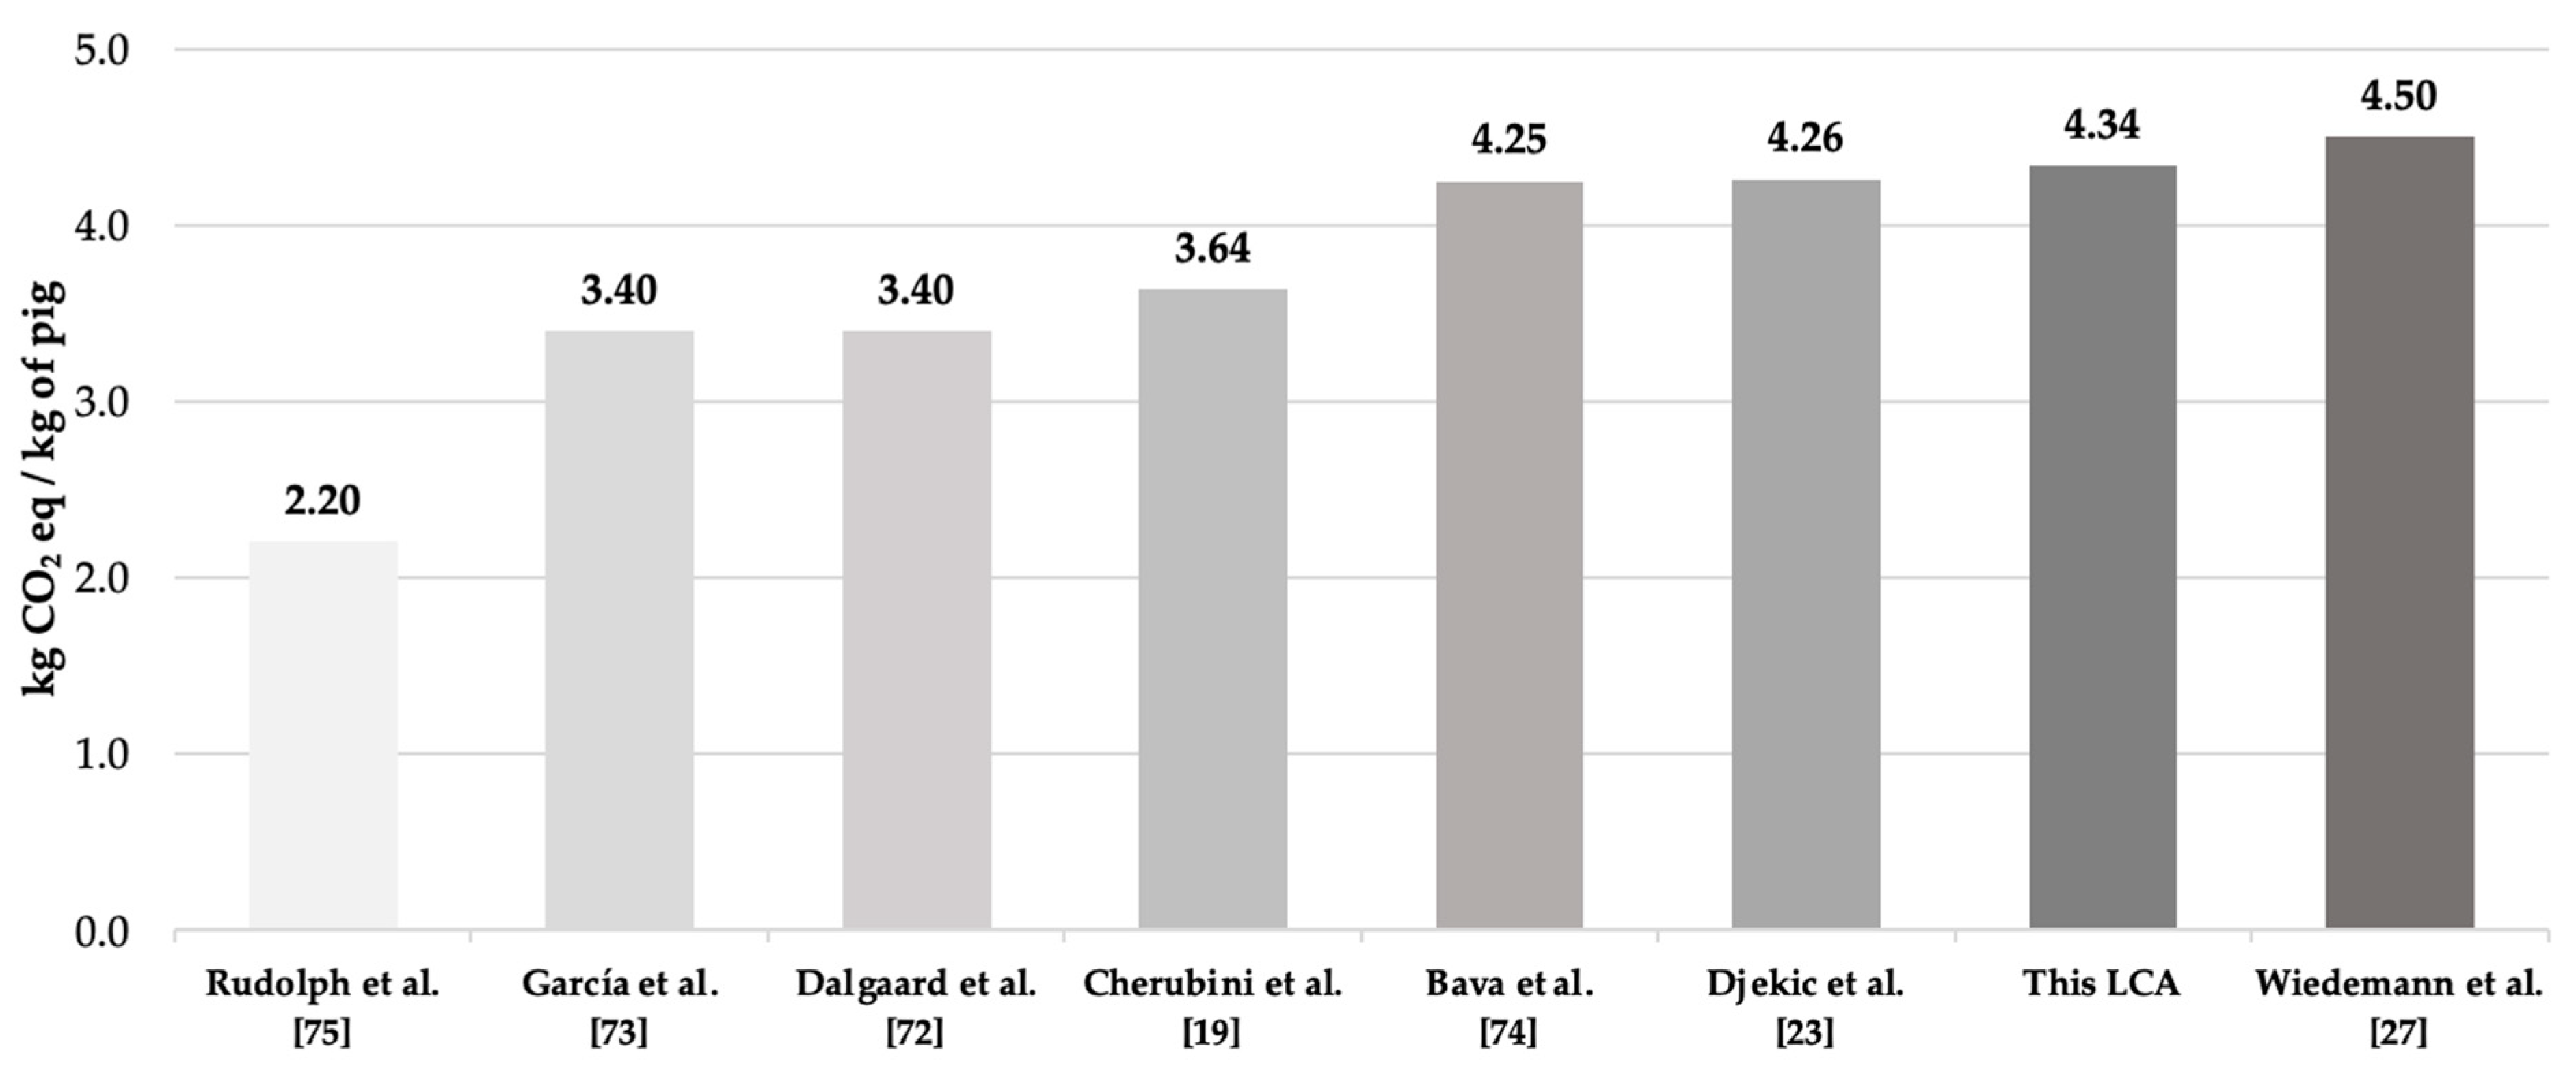
4.1. Carbon Footprint

Figure 3 shows the composition of the results regarding carbon footprint. The shared percentage of 69.5% of the GHG came from the two phases of pig fattening, which is mainly related to the production and supply of feed. This is corroborated by what is shown in the bar on the right; for all growth phases, 407 kg CO2eq of the 538 kg CO2eq came from feed production, and that is to say, it had a share of 75% of the system of the product. These results are consistent with what was reported in the literature [18,20,21,22,71,72,73] which showed that feed accounted for more than half of GHG emissions in intensive pig production. It is important to highlight that the fattening phase represented the highest consumption of supplies in the pig-house. There was also a greater demand for operations and maintenance since the pigs are in a period of rapid weight gain; they go from 32 kg in the weaning stage to 124 kg as finished swine. The piglet weaning stage was the second largest contributor to the carbon footprint, with a share of 21.63% of total emissions. In the studies by Cherubini et al. [19] and Noya et al. [20], this stage was also reported as second for GHG generators.
As for operations carried out in pig-house; this had a share of 16.5%, which was related to the consumption of fossil fuels for heating and electricity supply. In the case of the generation of enteric gases, they contributed just over 6% of the carbon footprint; this value is within the ranges reported in other studies, 4.2 to 21.6% [27,74,75]. While the transportation of supplies contributed 1.4%, which was associated, for the most part, with the use of fossil fuels for the transfer of feed from the production regions to the farm. The results of the carbon footprint for the case of the product and co-products that are commercially profitable for the farm are shown in Figure 4. Each result indicates the total GHG emissions, per pig in live weight, as appropriate at the time of its output from the product system. As might be expected, the less intensive rearing the pig had, the less carbon footprint impact it generated; this is mainly due to the shorter time that the pig had to be fed and the lower consumption of supplies and services.
The result indicated in Table 7 of the carbon footprint, for one finished swine of 124 kg, is equivalent to 4.34 kg CO2eq per kg of live weight pig; this magnitude is comparable to other similar studies, as shown in Figure 5. Here, one can observe that the range of the results is from 2.2 to 4.5 kg CO2eq/kg of pig, the value shown in the current LCA is within the range of reported results. In the research in which the feed was supplied mostly from places far from the farm or was imported from other countries [72,76], this resulted in an increase in the environmental impact from the fattening phases; in other cases, the food supply was mixed, with a part of the food supplied locally [19], which probably moderated the impact on the carbon footprint. The composition of the food also had effects on the magnitude of the reported impacts. In the studies where it was documented that the food was mostly corn, carbon footprint values were reported in the range of 3.64 to 4.26 [19,23,74], values close to those shown in the current LCA. Semi-intensive rearing systems, or those that indicated the use of ecological methods in some production phases, obtained on average around 35% less impact than conventional systems [73,75]. Other causes for the variation of results were due to factors such as the variability of the final weights of the swine at the farm gate reported in the studies, which impacts the amount of days to raise the pig [19,73,74].

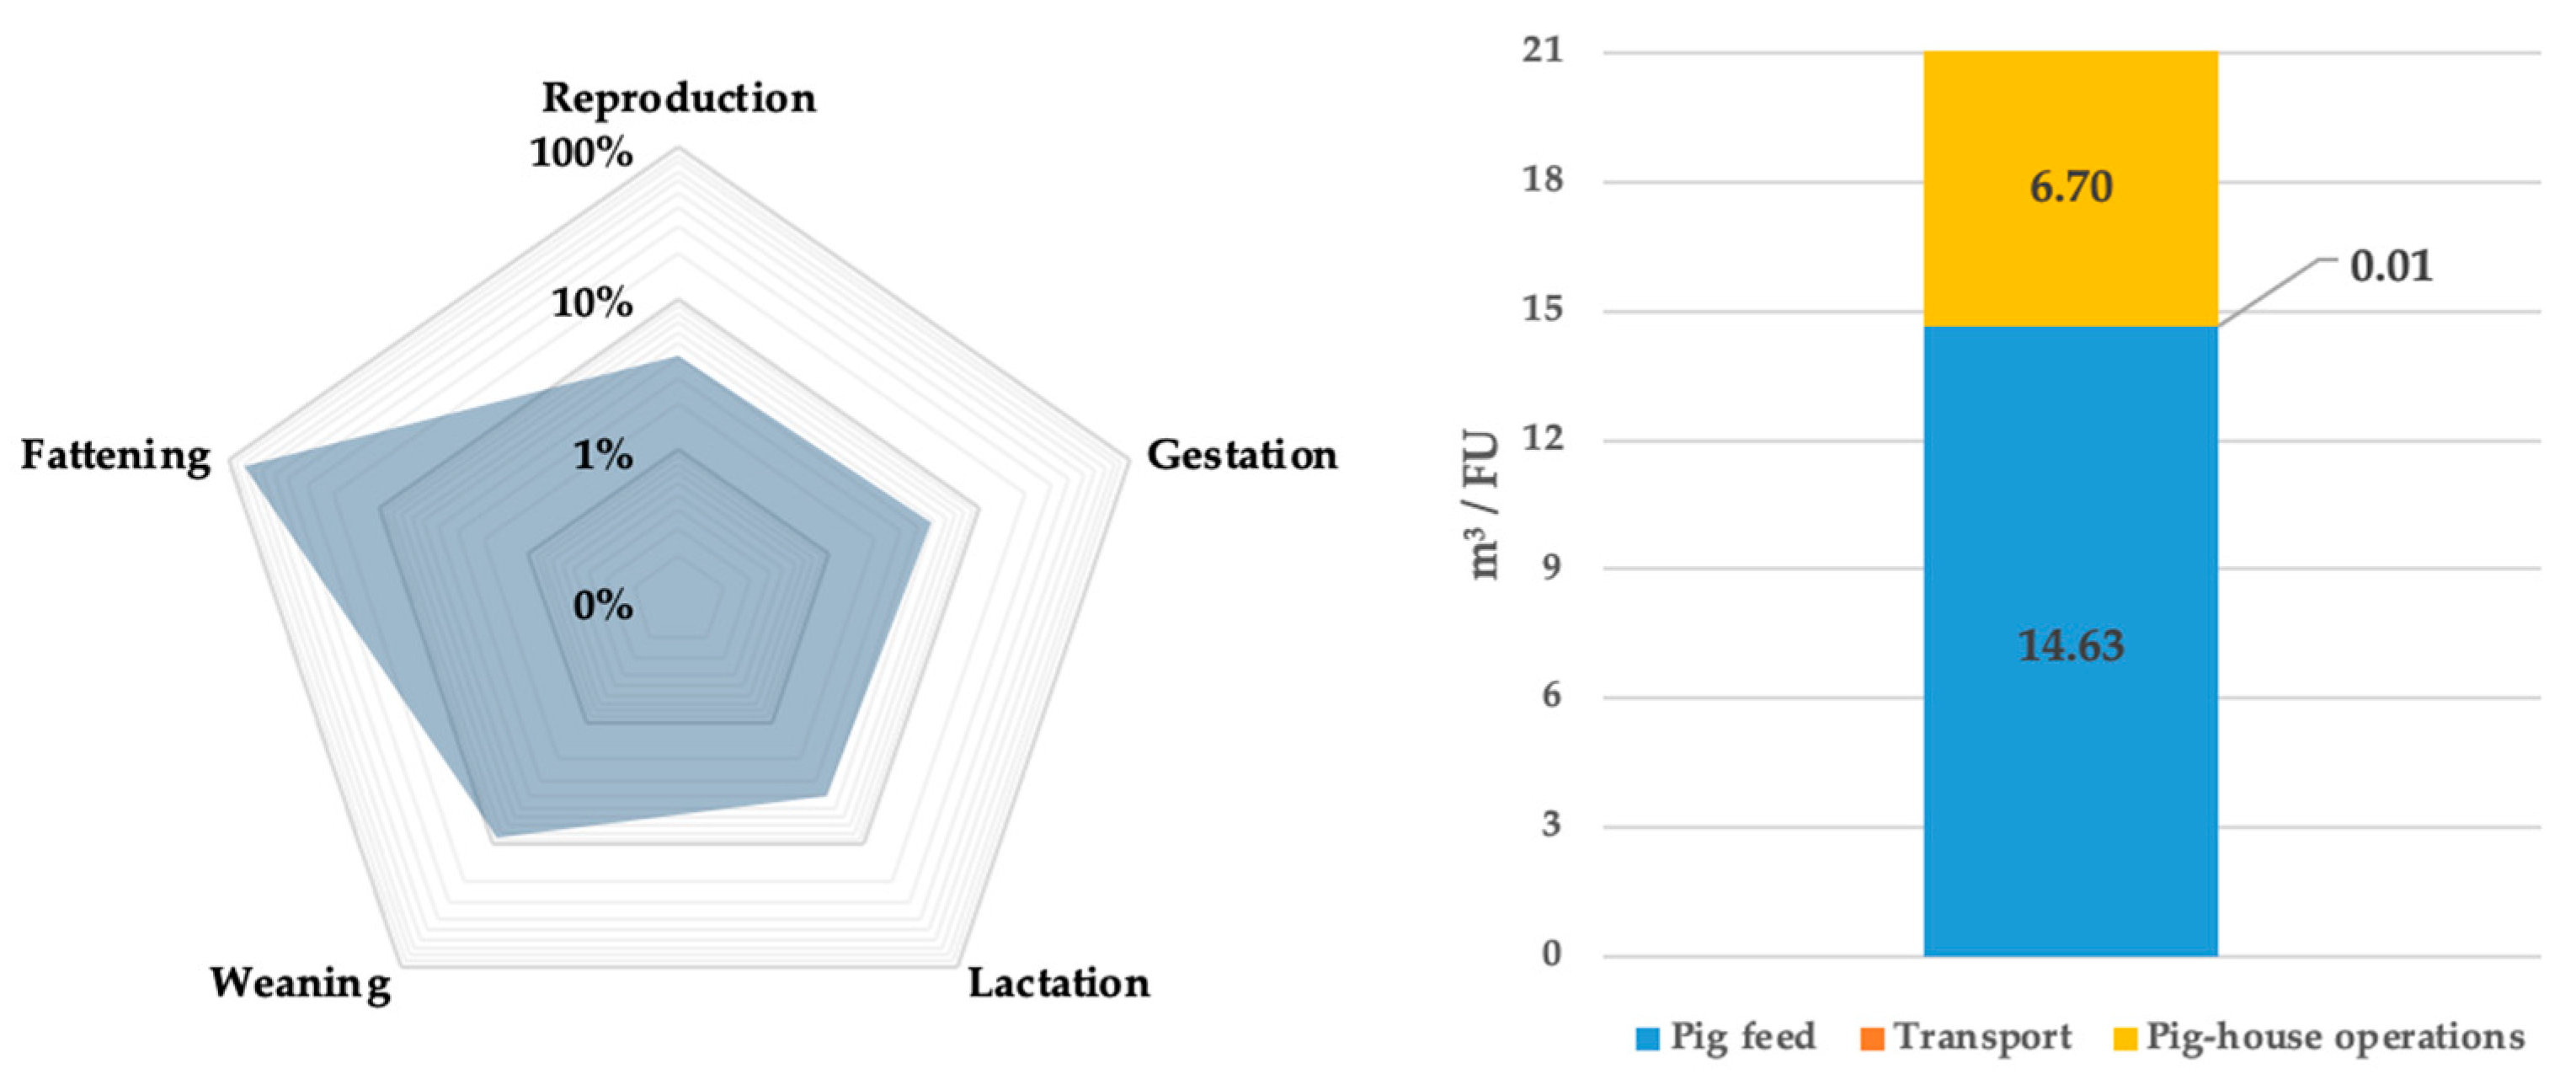
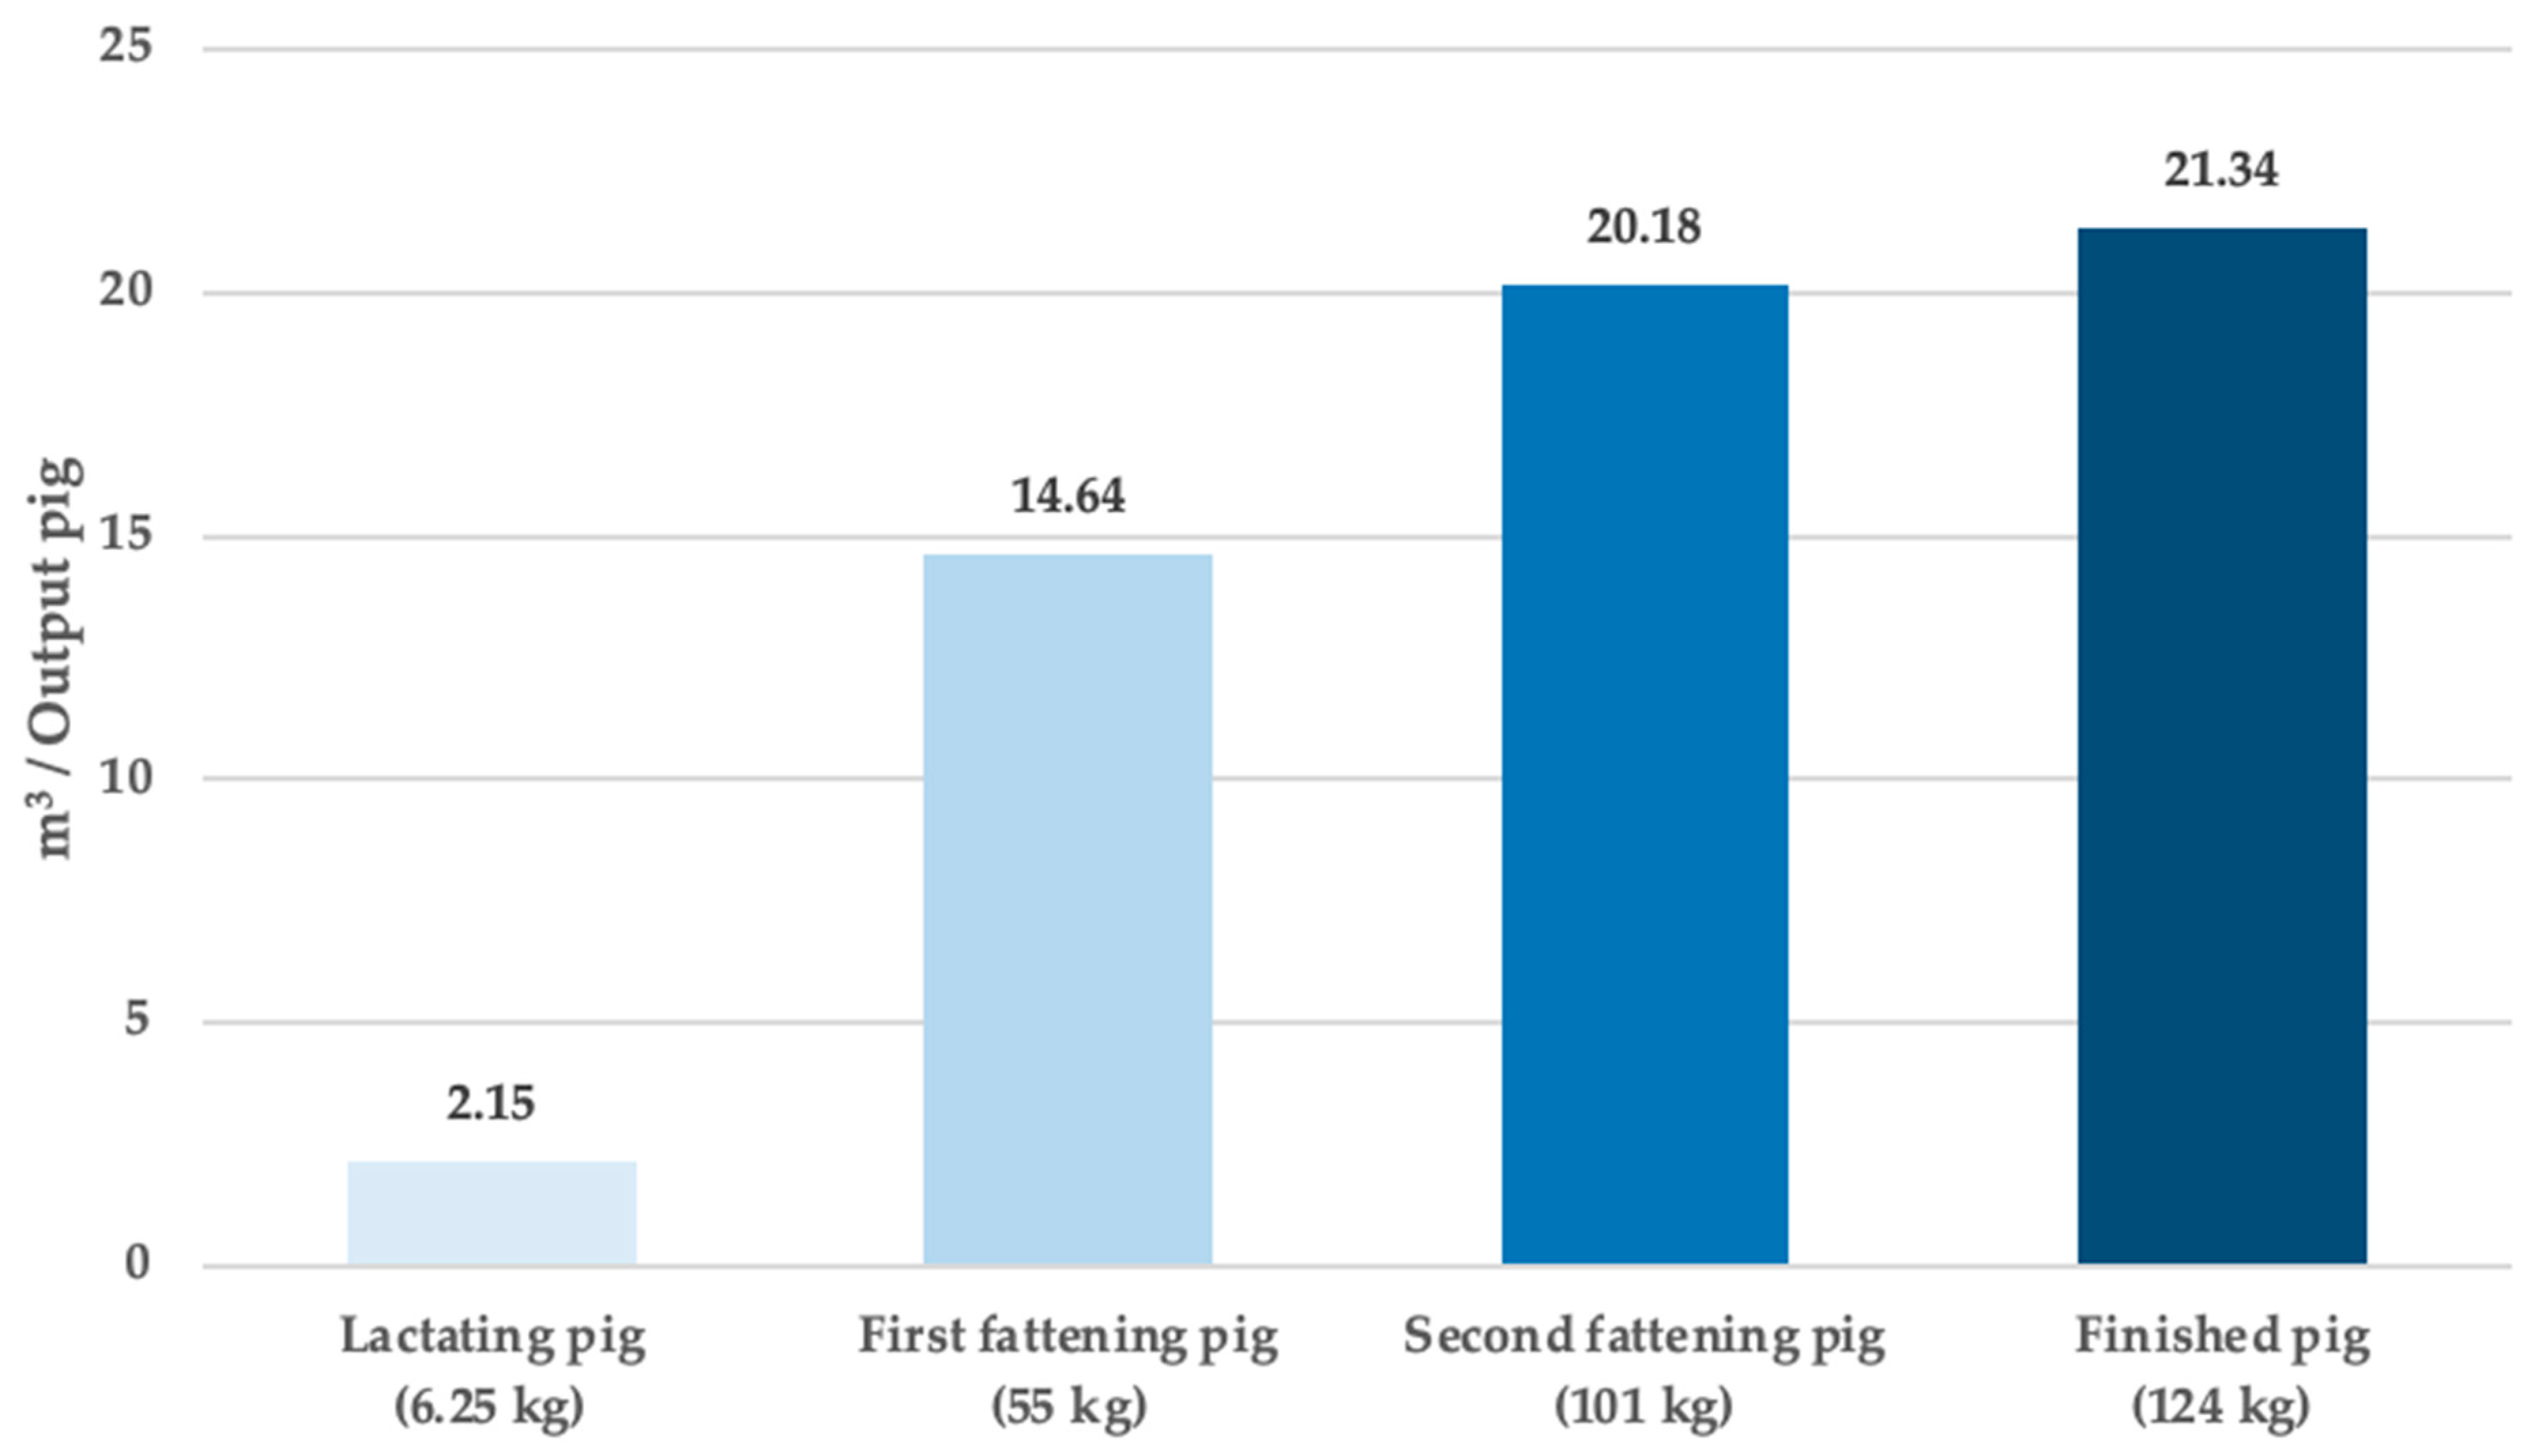
4.2. Water Footprint

The value of the water footprint was 21.34 m3; its source per production stage is shown in Figure 6. The graphic shows 78% of the impact came from the fattening phases, while weaning is far behind as the second contributor, with a share of 9%. The main reason for this is due to the large amount of feed supplied at the final stages of growth and fattening, around 254 kg of feed per pig in these stages. This is directly related to the supply of water for the agricultural phase in feed production, as shown in the bar on the right; it indicates that 69% of the water footprint was used for this purpose, while this impact was less for the transport of supplies and operations in the pig-house. In the case of the operations carried out within the pig-house, it took up a share of 31% of the water footprint, linked to direct consumption by pigs and supply for cleaning tasks. Transportation in the product system was not significant in this environmental impact.
Figure 7 shows the water footprint for each co-product generated on the farm. The gradual increase in impact is observed as the pig spends more time in the growing phase. This leads to, first and foremost, more days of feeding, and secondly, more feed supplied as the pig gains weight. Nevertheless, when the impacts of the water footprint per kg of pork are considered, the result was reversed, the meat from the piglet doubles the result obtained from that of the finished swine. Although they are short periods of growth in the piglets, there are considerable direct and indirect water consumptions via the feed by the pig itself, plus the operational consumptions by washing the pens that do not present reductions in water use, proportional by weight with respect to the finished pigs. This is consistent with that reported by Bai, X. et al. [77]. In the studies consulted on the water footprint in intensive pig production [20,22,77,78,79,80,81], the reported results show a wide range of values (0.01–26.3 m3/kg of pig), but this is mainly due to the different methods used in the quantification of the impact indicator. However, they agree that the feed supplied in the pig growth phases contribute the greatest impact to the water footprint, although with variable contribution values. The values reported by the feed supply in pig production are as high as 90% [77,78], while other studies show slightly lower results with a range of 70 to 80% [20,82]. These contributions are similar to the results shown in the current LCA. It is possible that these variations are a consequence of the water sourcing of irrigation or rainfed in feed production, as the latter would cause a reduction in the water footprint [83].

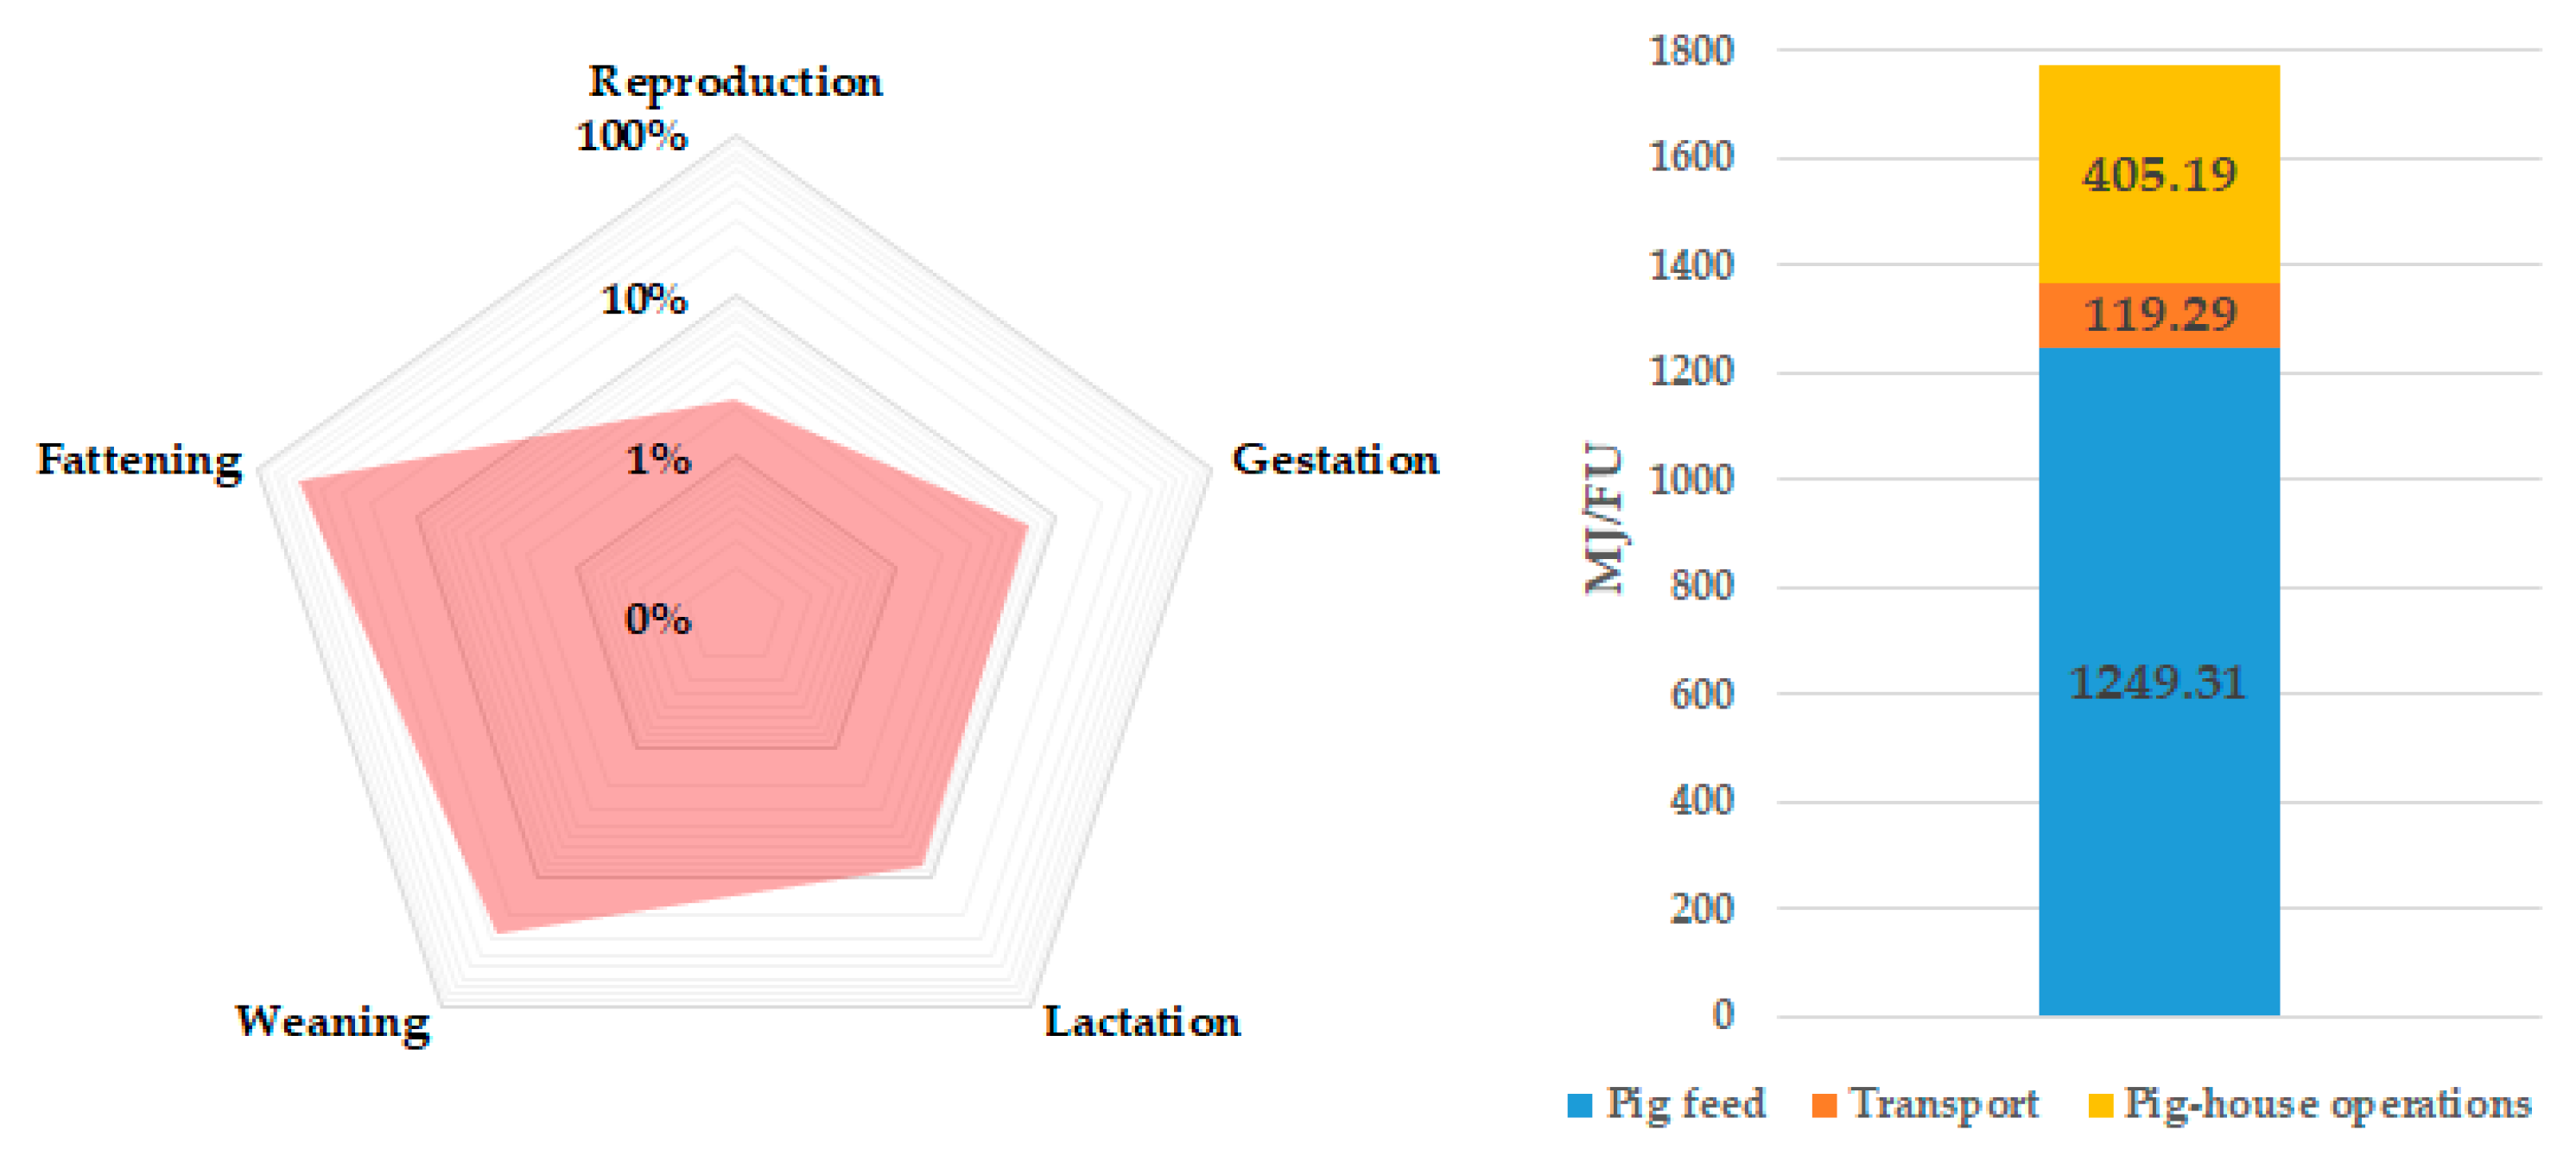
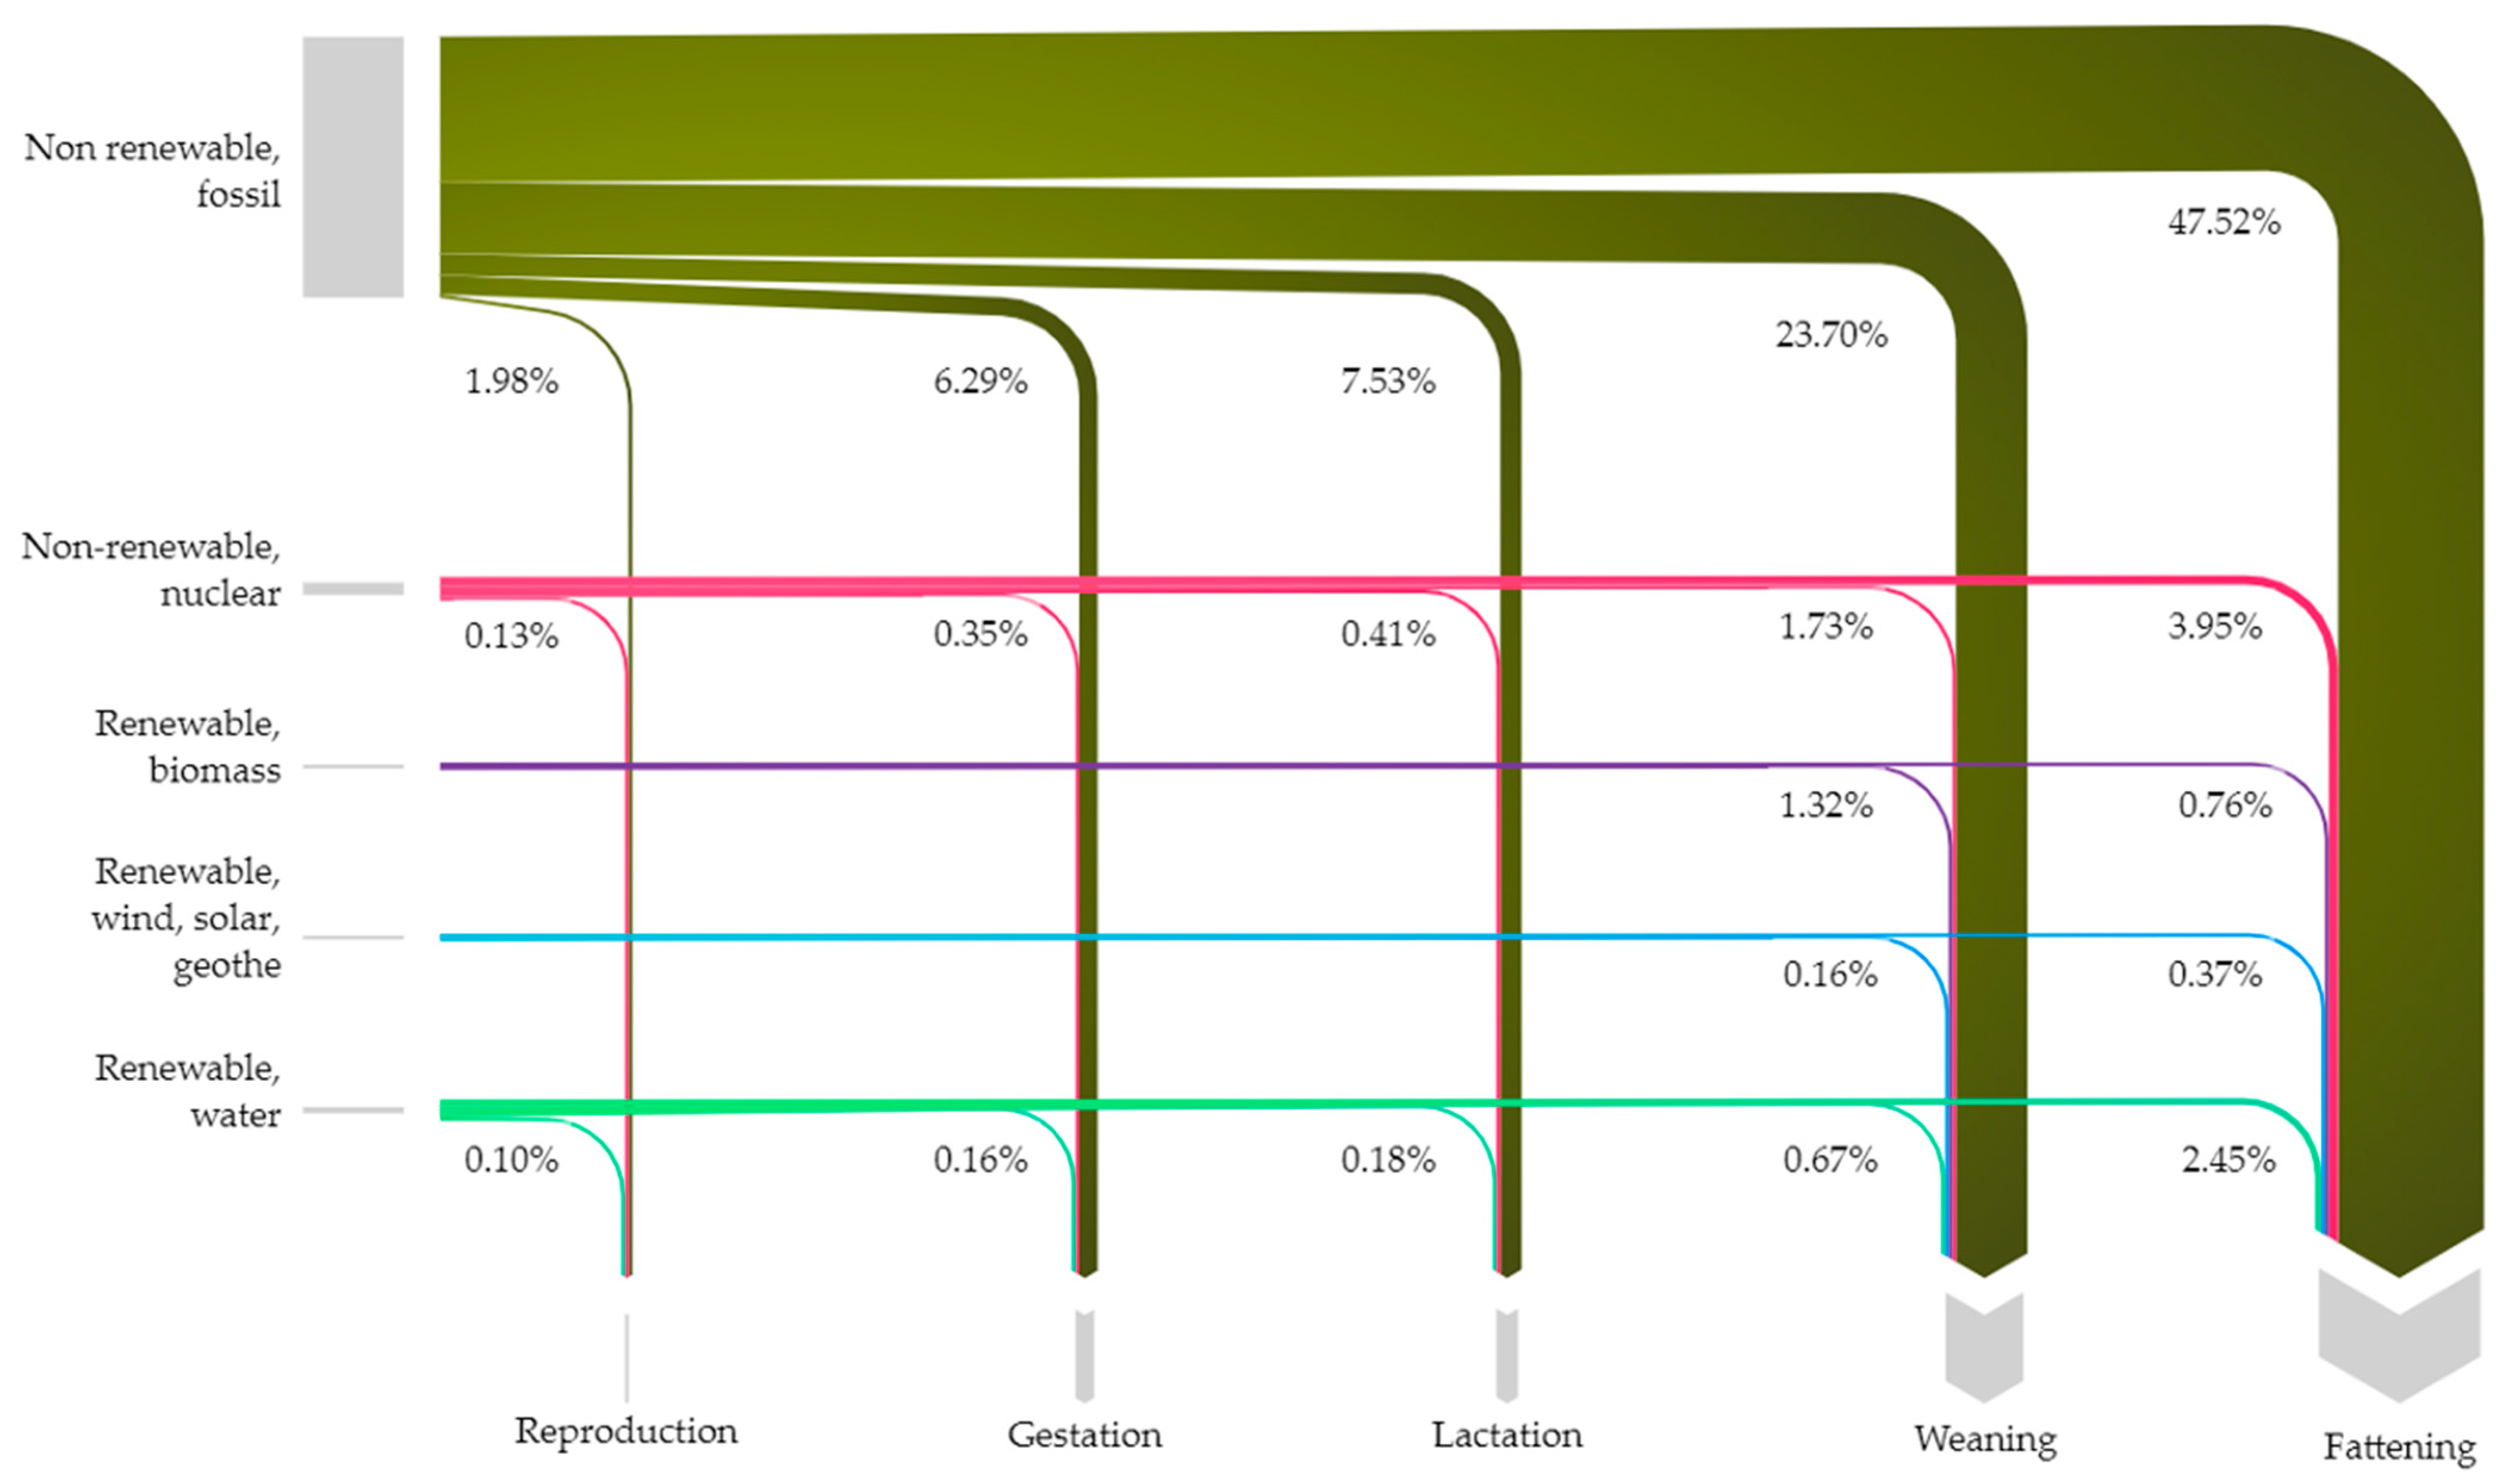
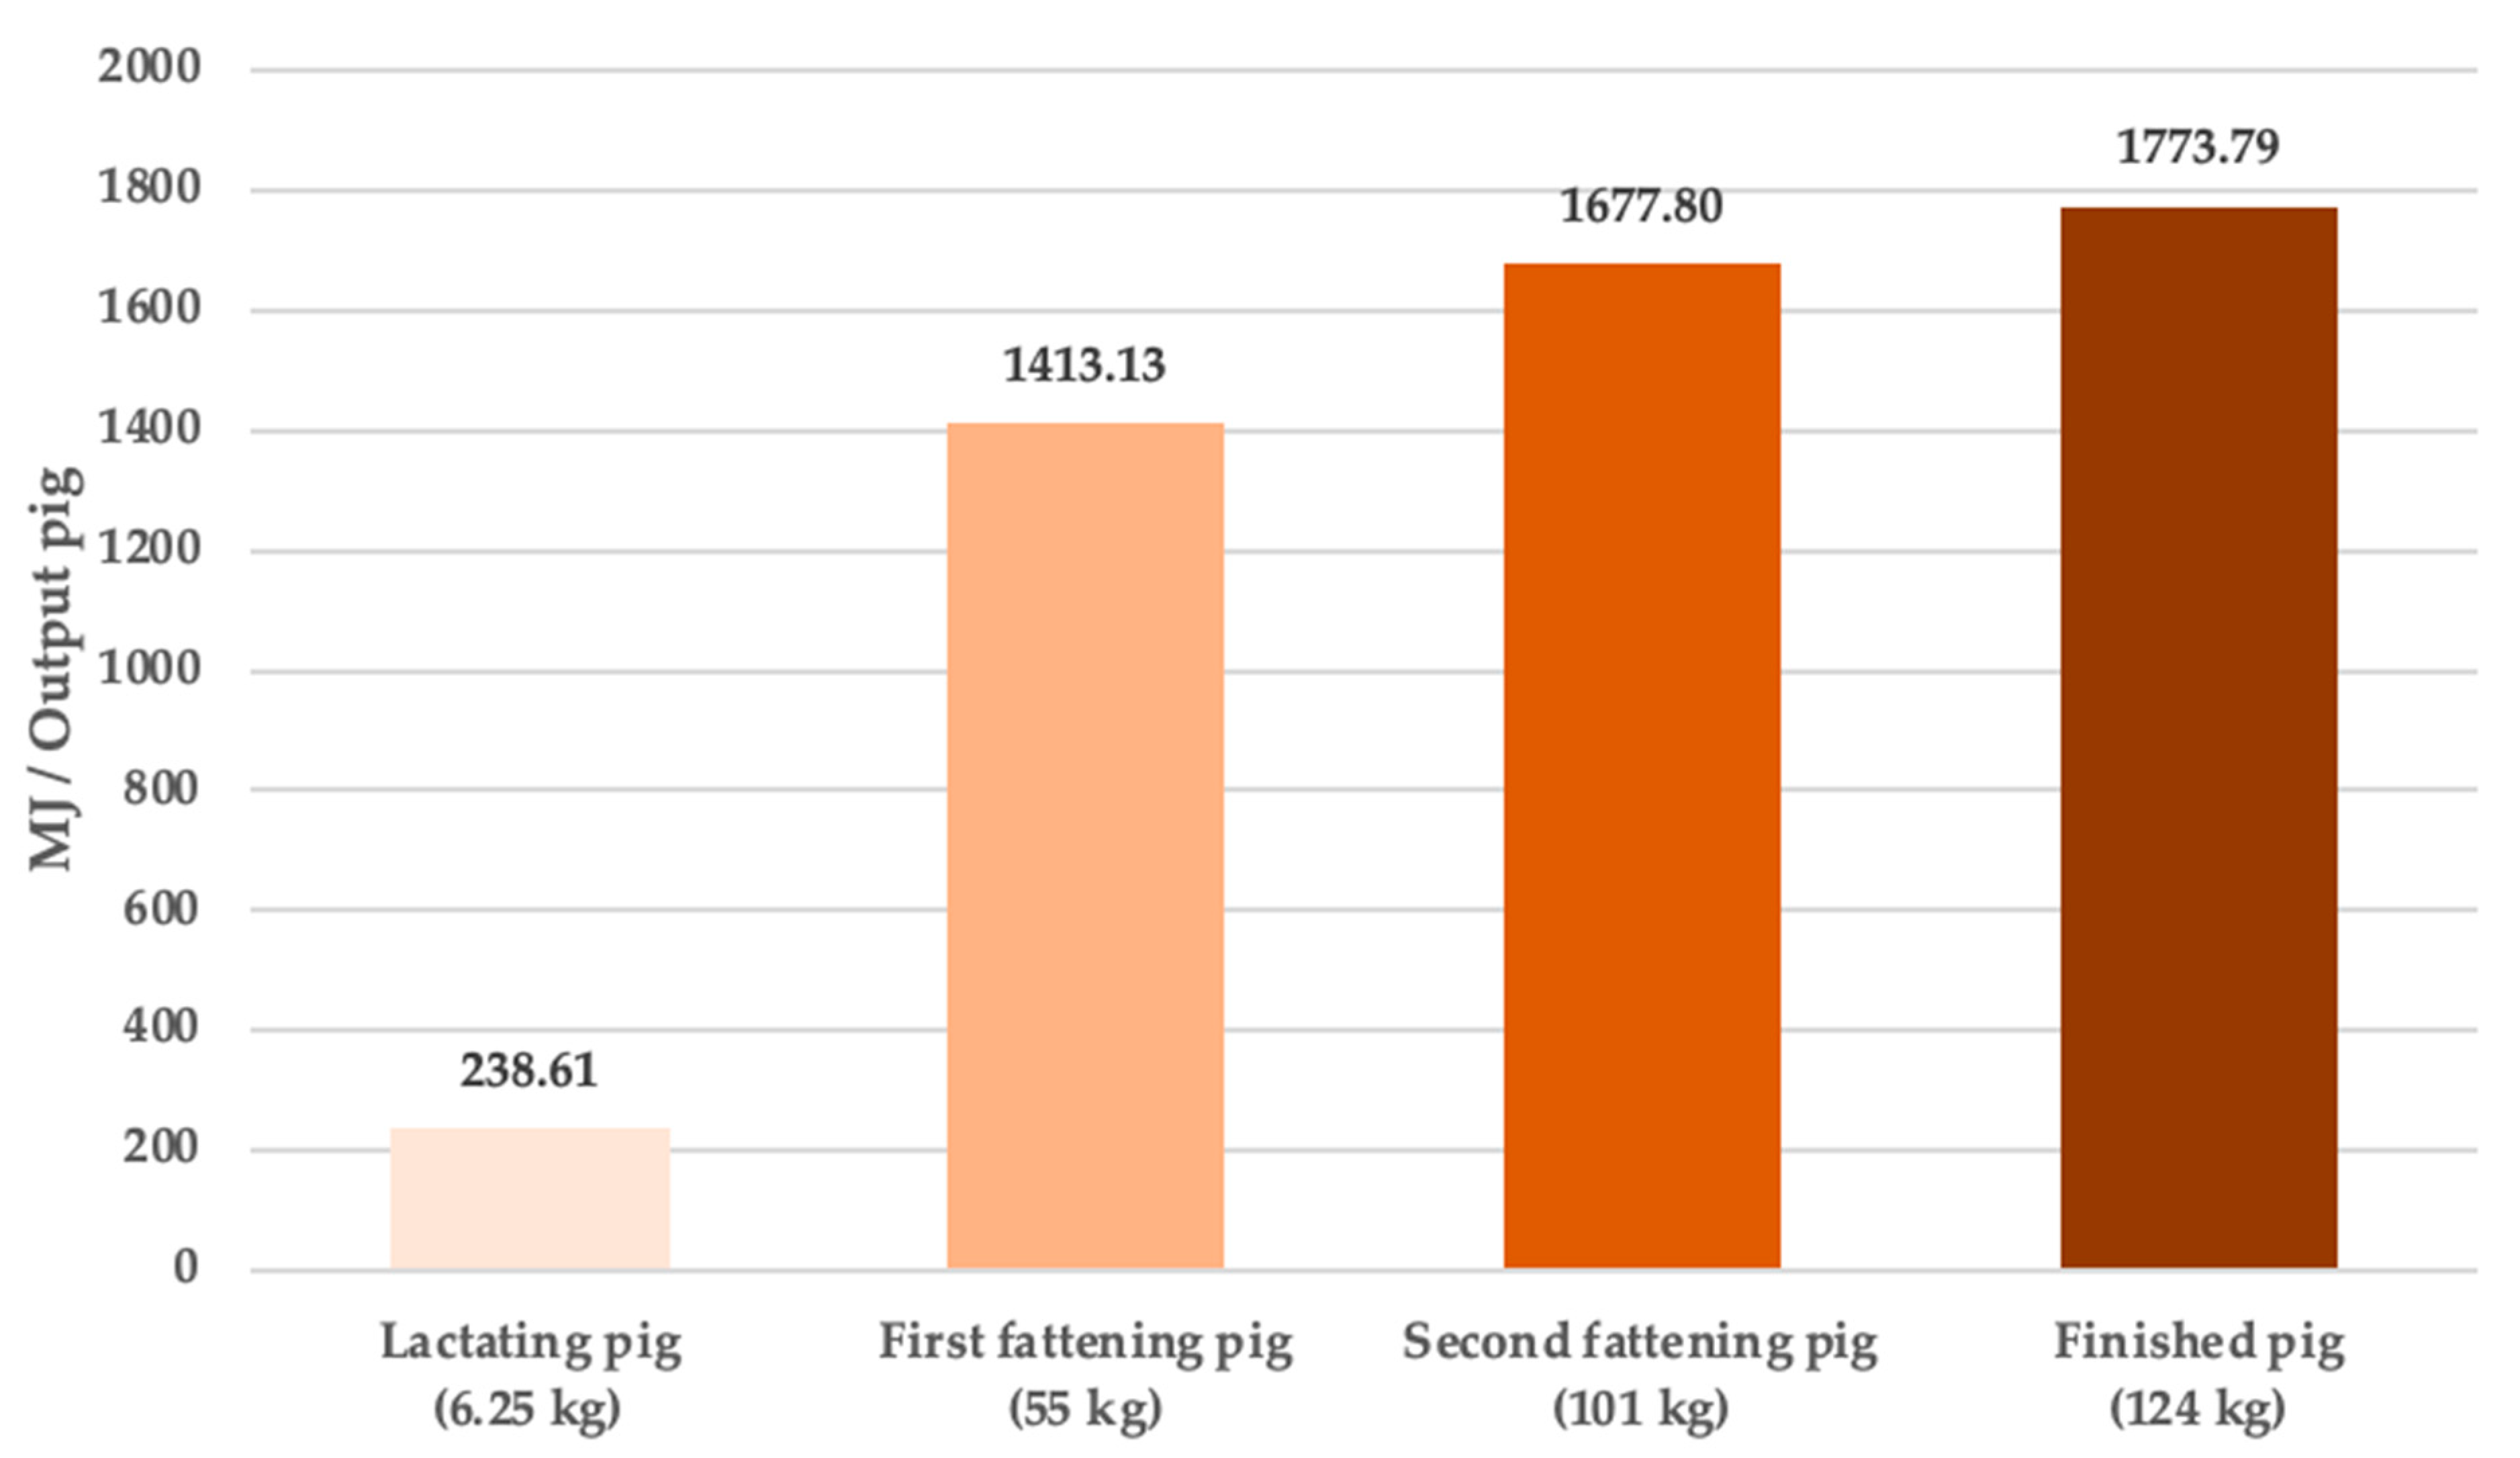
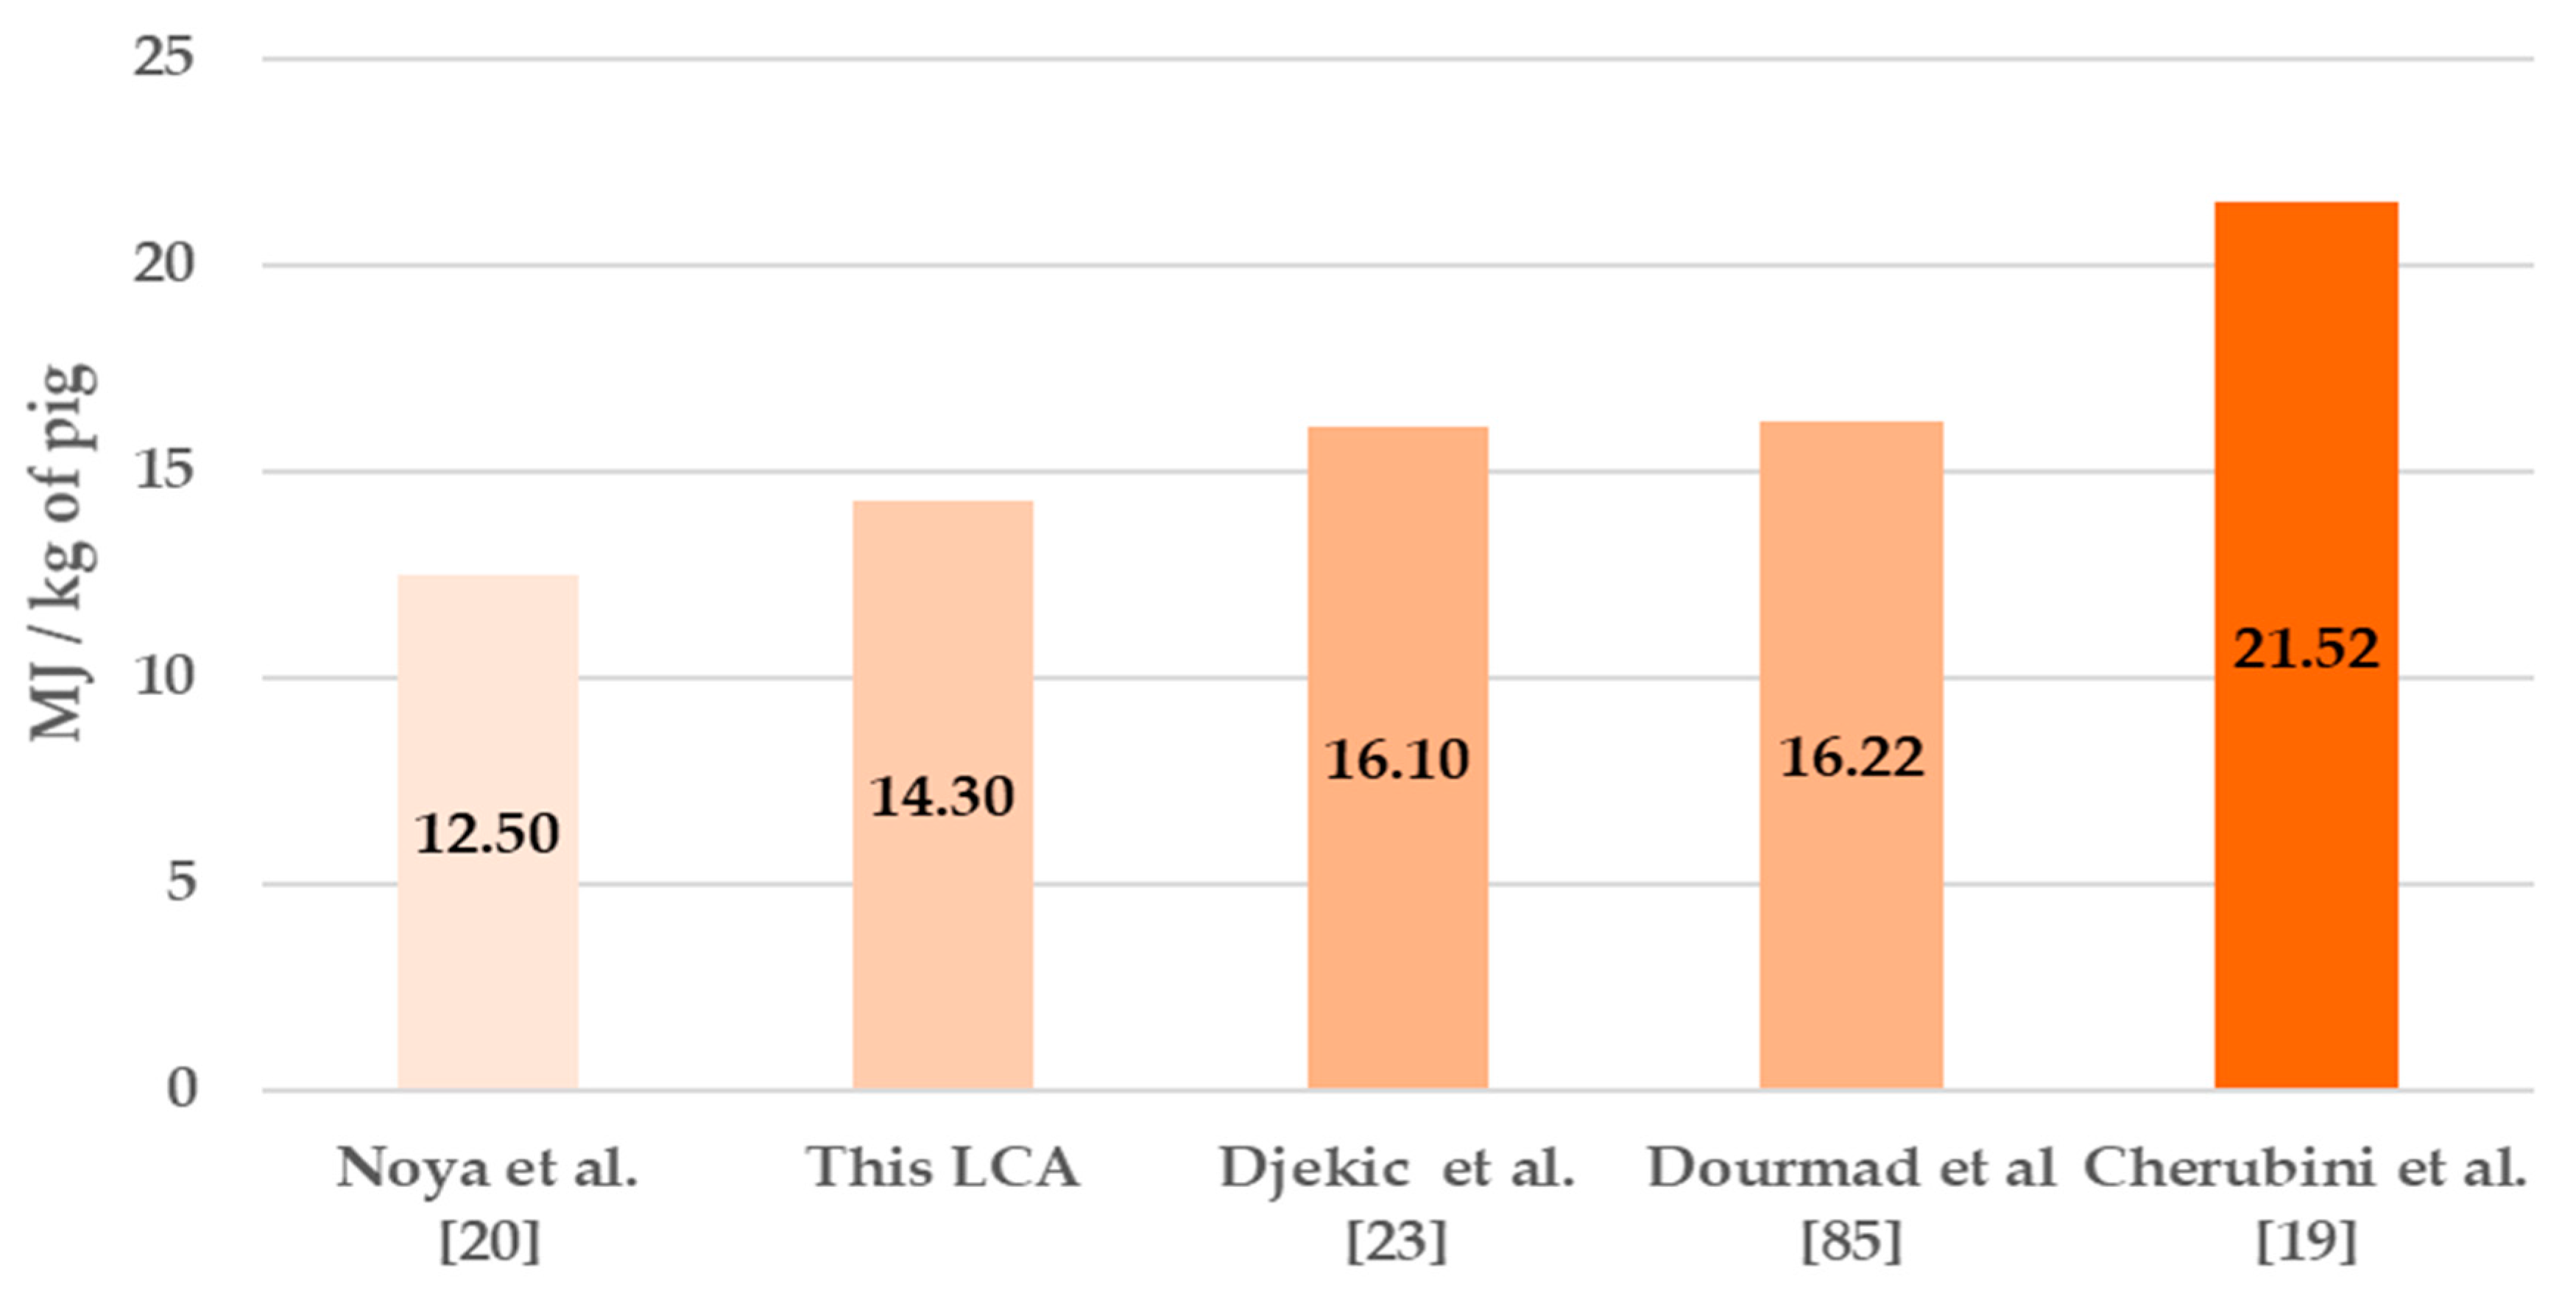
4.3. Energy Footprint

The result of the energy footprint was 1773.79 MJ per kg of each 124 kg swine, Figure 8 shows more information related to this. As shown in the two previous impact categories, the fattening phase used the highest amount of energy, with a share of 55%, followed by the weaning phase with 28%, while the remaining 17% was distributed in the other phases of production. This coincides with other studies that show the fattening phase as the main energy consumer in intensive pig rearing [20,23,74,84]. The highest primary energy supply was due to the consumption of pig feed (with a 70% share), which included agricultural activities, the manufacture of fertilizers and agrochemical products. The management of the farms had a contribution of 23%, due to the electrical power supplied to the facilities and to the heating of the pens. The transportation of commodities accounted for the remaining 7%, which was related to the fossil fuels consumed. These results were consistent with those mentioned in similar studies [19,27,85], they reported results within the following percentage ranges of supplied energy: 60 to 80% for food production, 20 to 40% from farm activities, and the rest accounted for the transport of goods.
Figure 9 shows the primary supply sources that contribute to the energy footprint. Fossil primary sources contributed with 87%, and, by far, these were the largest supplier of energy in all stages of production, highlighting the fattening phase with 47.5%. Nuclear energy followed, with a share of 6.6%, and this had its origin in the supply of electrical energy, where the nuclear source is part of the energy mix for its generation, as shown in Table 2. Solar, geothermal, photovoltaic, and hydro energy had the same origin from the electricity sector. Energy from biomass stands out with a share of 2.2%, a proportion of which comes from the management of pig slurry. However, the raw slurries generated are still partially used for treatment, so only about 1% of those are processed. The farm has a small energy management system for this pig slurry waste, consisting mainly of a biodigester and a motor-generator, which produces electricity (1.44 kWh/FU) used for self-consumption in the facilities.
Figure 10 shows the energy footprint of the co-products and product generated for sale on the farm. As reported in the previous cases of the carbon and water footprints, the resulting impact increased along with the growth of the pig. Therefore, this was related to the number of development days and the amount of feed and fuel required, which explains the increasing values shown in each pig output. It should be explained that these co-produced pigs leave the product system due to a specific market demand for their appreciated meat characteristics, although their sales are low compared to the final swine.
Energy footprint results have been reported in literature; some of them are shown in Figure 11. The energy result of the present study is within the range of values shown (12.50 to 21.52 MJ/kg of pig). The differences were mainly due to: (i) the different management systems in each farm that was studied; (ii) the production of feed supplies; (iii) sources of energy for operating activities, such as electricity or heating.

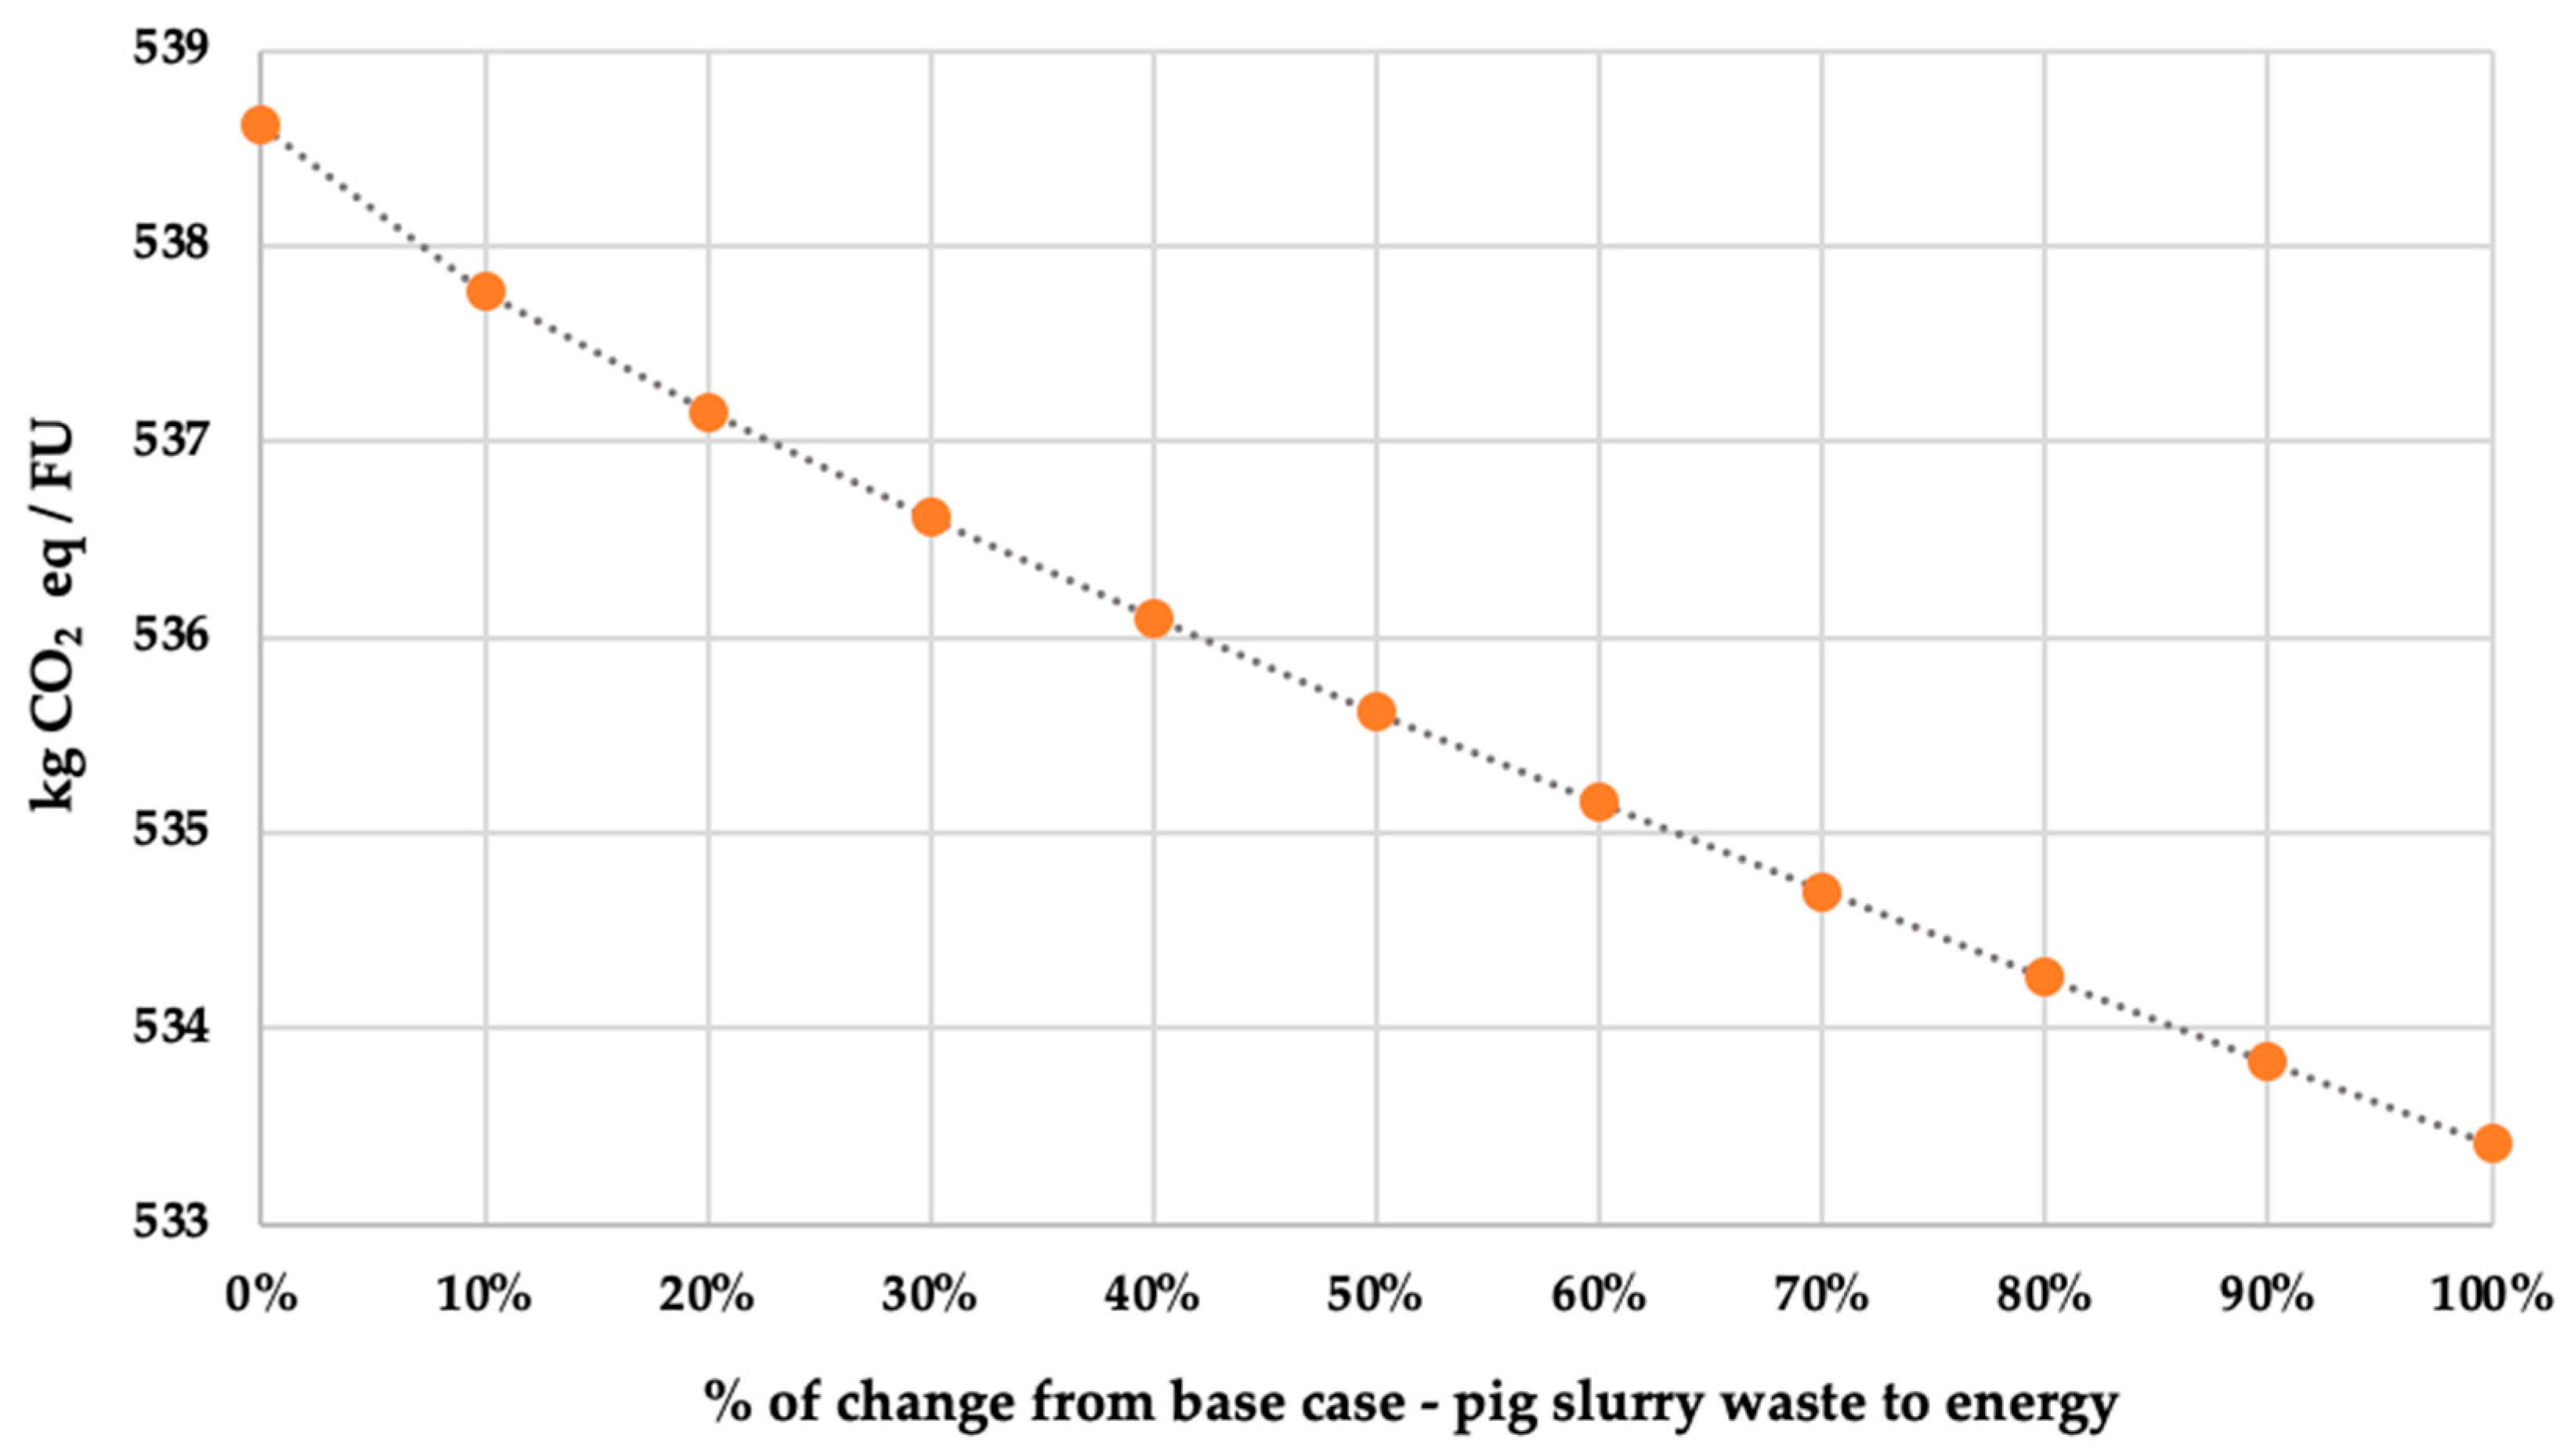
5. Analysis of Sensitivity

In the previous Section 4.3, the result of a high energy consumption in the intensive rearing of pigs (1773.79 MJ/one swine-124 kg) was shown. Therefore, it is relevant to reduce the external energy supply in the operations of the farm, which is possible by increasing the current conversion of energy from the pig slurry. In the product system, about 1% of the pig manure is processed for its conversion into energy for self-consumption in the operations and services of the pig pens. In this context, the analysis of the reduction in the energy footprint was proposed by turning more pig manure into energy. This would not only reduce energy supply costs, but also improve environmental performance per pig produced.
Figure 12 shows the sensitivity analysis of the carbon footprint in relation to energy from pig waste. The analysis was carried out considering the base case of current use as 1% of the pig slurry; the amount of waste was progressively increased for its energy conversion and subsequent use in the farm facilities. A decreasing trend in the carbon footprint was observed with the use of energy coming from waste, and Figure 8 shows a 50% increase from the base case, in the conversion of waste-to-energy. This resulted in a reduction of little more than half a percentage point in the carbon footprint. While a 100% increase, that is to say doubling the amount of waste managed from the base case, reduced carbon footprint emissions by around 1%. Although this decrease is marginal, this demonstrated the improvement of environmental performance in the pig production system is possible with adequate waste management, in this case with a reduction of waste. In the literature, there are studies that coincide with the environmental benefits of the use of pig slurry waste, mainly in relation to their energy conversion [27,86,87,88,89,90,91].

6. Conclusions

In this research, environmental impacts associated with the production of pigs weighing 124 kg in live weight were quantified through carbon, water, and energy footprint indicators. This LCA sought to verify the environmental performance of an intensive pig-rearing farm in Mexico. The LCI database was made up of information collected from local production farms and raw material suppliers in the region. The results showed that the fattening phase generated the greatest environmental impact, and in all cases, it was above 70% of the reported magnitudes, while the remainder came from the pig’s early growth stages. The main cause of this result was related to the number of days destined to reach the final weight required, as well as the high amounts of feed supply that the pig required as it gained weight. Therefore, it is not surprising that feed production resulted in substantially high values in the three impact indicators, with share ranges from 69 to 75%, which were consistent with the literature consulted.
Lower magnitudes of environmental impact were obtained from production operations in the pig-house. As a result, the following stood out: enteric gas emissions in the case of the carbon footprint; the consumption of water for the hygienic maintenance of pigpens in the case of the water footprint. While the transport of feed supplies and the transfer of pigs inside the farm had some relevance in the result of the energy footprint. In the case of the use of pig slurry for energy conversion, the change was marginal, which leads to a reduced participation of renewable biomass energy sources. However, with better management of these wastes, the pig industry can have great potential for energy cogeneration, not only using the surplus of this for direct consumption in the farms, but through synergies of energy supply to nearby areas, such as other industries and public buildings. This would lead to lower consumption of fossil fuels and, consequently, to a reduction in GHG emissions (as noted in Section 5) for the economic sectors involved.
Finally, the findings from the current LCA, coinciding with the analyzed studies, reaffirm that the environmental performance of pig production is influenced by: the supply of food, the mortality balance of pigs in the rearing process, the technification of farms, as well as the generation of enteric emissions and those from pig manure management.

Author Contributions

Conceptualization, M.R.G.-D., E.C.-G. and L.D.M.-S.; methodology, E.C.-G.; formal analysis, L.D.M.-S.; writing—original draft preparation, M.R.G.-D.; writing—review and editing, M.R.G.-D., E.C.-G. and L.D.M.-S.; resources, E.C.-G.; validation, L.D.M.-S.; supervision, M.R.G.-D.; data curation, R.V.-D.l.C. and H.D.H.-S.; project administration, M.R.G.-D.; investigation R.V.-D.l.C. and H.D.H.-S. All authors have read and agreed to the published version of the manuscript.

Funding

Not applicable.

Conflicts of Interest

The authors declare no conflict of interest.

References

  1. Jadwiga, S. The development of the pork market in the world in terms of globalization. J. Agribus. Rural Dev. 2017, 4, 843–850. [Google Scholar]
  2. Alba, R.; Barrera, E.L.; Sarduy, V.A.; Pérez, G.M.; Hermida, G.O.; Dewulf, J. Life Cycle Assessment for the Cuban pig production: Case study in Sancti Spiritus. J. Clean. Prod. 2019, 219, 99–109. [Google Scholar]
  3. FAO. Food Outlook—Biannual Report on Global Food Markets—November 2020; Food and Agriculture Organization of the United Nations: Rome, Italy, 2020; p. 107. ISBN 978-92-5-133590-1. [Google Scholar]
  4. Gonzáles, N.; Marquès, M.; Nadal, M.; Domingo, J.L. Meat consumption: Which are the current global risks? A review of recent (2010–2020) evidences. Food Res. Int. 2020, 137, 109341. [Google Scholar] [CrossRef]
  5. FAO. The State of Food Security and Nutrition in the World 2020. Transforming Food Systems for Affordable Healthy Diets; Food and Agriculture Organization of the United Nations: Rome, Italy, 2020; ISBN 978-92-5-132901-6. [Google Scholar]
  6. Food and Agriculture Organization of the United Nations. Livestock Primary. Available online: http://www.fao.org/faostat/en/#data/QL (accessed on 8 May 2021).
  7. Dennehy, C.; Lawlor, P.G.; Jiang, Y.; Gardiner, G.E.; Xie, S.; Nghiem, L.D.; Zhan, X. Greenhouse gas emissions from different pig manure management techniques: A critical analysis. Front. Environ. Sci. Eng. 2017, 11, 11. [Google Scholar] [CrossRef]
  8. Pezas, G.; Mackenzie, S.G.; Wallace, M.; Kyriazakis, I. Environmental impacts of housing conditions and manure management in European pig production systems through a life cycle perspective: A case study in Denmark. J. Clean. Prod. 2020, 253, 120005. [Google Scholar] [CrossRef]
  9. Lesur, L. Manual de Porcicultura, 1st ed.; Trillas: Mexico City, Mexico, 2013; p. 80. ISBN 978-968-24-6884-1. [Google Scholar]
  10. Owusu-Twum, M.Y.; Sharara, M.A. Sludge management in anaerobic swine lagoons: A review. J. Environ. Manag. 2020, 271, 110949. [Google Scholar] [CrossRef]
  11. Changing Markets Foundation. Growing the Good, the Case for Low-Carbon Transition in the Food Sector. Available online: https://changingmarkets.org/wp-content/uploads/2018/10/Growing-the-Good-report-v3.pdf (accessed on 11 May 2021).
  12. USDA. Livestock and Poultry: World Markets and Trade. Foreign Agricultural Service; United States Department of Agriculture: Washington, DC, USA, 2021.
  13. Mujkić, Z.; Gashi, S.; Hamidović, Š. Consumer Impact on Supply Chain Sustainability. Procedia Manuf. 2019, 38, 1167–1173. [Google Scholar] [CrossRef]
  14. FAO. The State of Food and Agriculture 2020. Overcoming Water Challenges in Agriculture; FAO: Rome, Italy, 2020; Volume 210, ISBN 978–92-5-133441-6. [Google Scholar]
  15. Ibidhi, R.; Ben Salem, H. Water footprint of livestock products and production systems: A review. Anim. Prod. Sci. 2020, 60, 1369–1380. [Google Scholar] [CrossRef]
  16. Silvetti, F.; Cáceres, D. La expansión de monocultivos de exportación en Argentina y Costa Rica: Conflictos Socioambientales y Lucha Campesina por la Justicia Ambiental. Mundo Agrar. Rev. De Estud. Rural. 2015, 16. [Google Scholar]
  17. Crivelli, C. Análisis del Ciclo de Vida de Dos Sistemas de Manejo Para la Producción de Piña en México. Master’s Thesis, Universitat Politècnica de Catalunya, Departament d’Enginyeria Civil i Ambiental, Barcelona, Spain, June 2017. [Google Scholar]
  18. Dolman, M.A.; Vrolijk, H.C.J.; de Boer, I.J.M. Exploring variation in economic, environmental, and societal performance among Dutch fattening pig farms. Livest. Sci. 2012, 149, 143–154. [Google Scholar] [CrossRef]
  19. Cherubini, E.; Zanghelini, G.M.; Augusto, R.; Alvarenga, F.; Franco, D.; Soares, S.R. Life cycle assessment of swine production in Brazil: A comparison of four manure management systems. J. Clean. Prod. 2014, 30, 68–77. [Google Scholar] [CrossRef]
  20. Noya, I.; Villanueva–Rey, P.; González-García, S.; Fernández, M.D.; Rodríguez, M.R.; Moreira, M.T. Life Cycle Assessment of pig production: A case study in Galicia. J. Clean. Prod. 2017, 142, 4327–4338. [Google Scholar] [CrossRef]
  21. Mackenzie, S.; Leinonen, I.; Ferguson, N.; Kyriazakis, I. Accounting for uncertainty in the quantification of the environmental impacts of Canadian pig farming systems. Anim. Sci. J. 2015, 93, 3130–3143. [Google Scholar] [CrossRef] [Green Version]
  22. González-García, S.; Belo, S.; Cláudia Dias, A.; Várzea Rodrigues, J.; Roberto de la Costa, R.; Ferreira, A.; Pinto de Andrade, L.; Arroja, L. Life cycle assessment of pigmeat production: Portuguese case study and proposal of improvement options. J. Clean. Prod. 2015, 100, 126–139. [Google Scholar] [CrossRef]
  23. Djekic, I.; Radovic, C.; Lukic, M.; Stanisic, N.; Lilic, S. Assessment of the environmental life cycle in the production of pork products. Sci. Pro. Sect. 2015, 17, 469–476. [Google Scholar]
  24. Lamnatou, C.; Ezcurra-Ciaurriz, X.; Chemisana, D.; Plá-Aragonés, L.M. Environmental assessment of a pork-production system in North-East of Spain focusing on life-cycle swine nutrition. J. Clean. Prod. 2016, 137, 105–115. [Google Scholar] [CrossRef] [Green Version]
  25. Monteiro, A.N.; Wilfart, A.; Utzeri, V.J.; Lukač, N.B.; Tomažin, U.; Nanni, L.; Cándek–Potokar, M.; Fontanesi, L.; Garcia-Launay, F. Environmental impacts of pig production systems using European local breeds: The contribution of carbon sequestration and emissions from grazing. J. Clean. Prod. 2019, 237, 117843. [Google Scholar] [CrossRef]
  26. Anestis, V.; Papanastasiou, D.K.; Bartzanas, T.; Giannenas, I.; Skoufos, I.; Kittas, C. Effect of a dietary modification for fattening pigs on the environmental performance of commercial pig production in Greece. Sustain. Prod. Consum. 2020, 22, 162–176. [Google Scholar] [CrossRef]
  27. Wiedemann, S.G.; McGahan, E.J.; Murphy, C.M. Environmental impacts and resource use from Australian pork production determined using life cycle assessment. Energy, water, and land occupation. Anim. Prod. Sci. 2018, 58, 1153–1163. [Google Scholar] [CrossRef]
  28. McAuliffe, G.A.; Chapman, D.V.; Sage, C.L. A thematic review of life cycle assessment (LCA) applied to pig production. Environ. Impact Eval. Rev. 2016, 56, 15–22. [Google Scholar] [CrossRef]
  29. International Organization for Standardization.SO 14044 Environmental Management-Life Cycle Assessment-Requirements and Guidelines. Available online: https://www.iso.org/obp/ui/#iso:std:iso:14044:ed-1:v1:es (accessed on 31 July 2021).
  30. International Organization for Standardization. ISO 14040 Environmental Management-Life Cycle Assessment-Principles and Framework. Available online: https://www.iso.org/obp/ui#iso:std:iso:14040:ed-2:v1:es (accessed on 31 July 2021).
  31. Antón Vallejo, M.A. Utilización del Análisis del Ciclo de Vida en la Evaluación del Impacto Ambiental del Cultivo Bajo Invernadero Mediterráneo. Ph.D. Thesis, Universitat Politècnica de Catalunya, Barcelona, Spain, March 2004. [Google Scholar]
  32. Sánchez, O.J.; Cardona, C.A.; Sánchez, D.L. Análisis de ciclo de vida y su aplicación a la producción de bioetanol: Una aproximación cualitativa. Rev. Univ. EAFIT 2007, 43, 59–79. [Google Scholar]
  33. Curran, M.A. Life Cycle Assessment Handbook: A Guide for Environmentally Sustainable Products; John Wiley & Sons: Hoboken, NJ, USA, 2012; p. 9781118099728. [Google Scholar]
  34. Schrijvers, D.; Loubet, P.; Sonnemann, G. Archetypes of Goal and Scope Definitions for Consistent Allocation in LCA. Sustainability 2020, 12, 5587. [Google Scholar] [CrossRef]
  35. Huijbregts, M.A.J.; Steinmann, Z.J.N.; Elshout, P.M.F. ReCiPe2016: A harmonized life cycle impact assessment method at midpoint and endpoint level. Int. J. Life Cycle Assess. 2017, 22, 138–147. [Google Scholar] [CrossRef]
  36. International Organization for Standardization. ISO 14067 Greenhouse Gases—Carbon Footprint of Products—Requirements and Guidelines for Quantification. Available online: https://www.iso.org/obp/ui#iso:std:iso:14067:ed-1:v1:es (accessed on 9 May 2021).
  37. Berger, M.; Van Der Ent, R.; Eisner, S.; Bach, V.; Finkbeiner, M. Water Accounting and Vulnerability Evaluation (WAVE): Considering Atmospheric Evaporation Recycling and the Risk of Freshwater Depletion in Water Footprinting. Environ. Sci. Technol. 2014, 48, 4521–4528. [Google Scholar] [CrossRef]
  38. International Organization for Standardization. ISO 14046 Environmental Management—Water Footprint—Principles, Requirements and Guidelines. Available online: https://www.iso.org/obp/ui#iso:std:iso:14046:ed-1:v1:es (accessed on 9 May 2021).
  39. Huijbregts, M.A.J.; Rombouts, L.J.A.; Hellweg, S.; Frischknecht, R.; Hendriks, A.J.; Van De Meent, D.; Ragas, A.M.J.; Reijnders, L.; Struijs, J. Is Cumulative Fossil Energy Demand a Useful Indicator for the Environmental Performance of Products? Environ. Sci. Technol. 2006, 40, 641–648. [Google Scholar] [CrossRef] [Green Version]
  40. Huijbregts, M.A.J.; Hellweg, S.; Frischknecht, R.; Hendriks, H.W.M.; Hungerbuhler, K.; Hendriks, A.J. Cumulative Energy Demand as Predictor for the Environmental Burden of Commodity Production. Environ. Sci. Technol. 2010, 44, 2189–2196. [Google Scholar] [CrossRef] [Green Version]
  41. Puig, R.; Fullana, I.P.P.; Baquero, G.; Riba, J.-R.; Gala, A.B. A Cumulative Energy Demand indicator (CED), life cycle based, for industrial waste management decision making. Waste Manag. 2013, 33, 2789–2797. [Google Scholar] [CrossRef]
  42. Frischknecht, R.; Wyss, F.; Knöpfel, S.B.; Lützkendorf, T.; Balouktsi, M. Cumulative energy demand in LCA: The energy harvested approach. Int. J. Life Cycle Assess. 2015, 20, 957–969. [Google Scholar] [CrossRef]
  43. Torres, R.C. Energy transition: An obstacle or stimulus to development. Economía UNAM 2020, 17, 46–65. [Google Scholar]
  44. Buira, D.; Tovilla, J.; Farbes, J.; Jones, R.; Haley, B.; Gastelum, D. A whole-economy Deep Decarbonization Pathway for Mexico. Energy Strategy Rev. 2021, 33, 100578. [Google Scholar] [CrossRef]
  45. Martínez-Quintana, M.A.; Martín-del-Campo, C.; Cruz-Mendoza, G. A power optimization model for the long-term planning scenarios: Case study of Mexico’s power system decarbonization. Can. J. Chem. Eng. 2021, 99, 884–897. [Google Scholar] [CrossRef]
  46. McDonald-Buller, E.C.; McGaughey, G.R.; Shah, T.; Grant, J.; Kimura, Y.; Yarwood, G. Mexico’s electricity grid and fuel mix: Implications of a fifteen-year planning horizon on emissions and air quality. Environ. Res. Lett. 2021, 16, 74050. [Google Scholar] [CrossRef]
  47. Secretaría de Energía. Balance Nacional de Energía. 2019. Available online: https://www.gob.mx/cms/uploads/attachment/file/618408/20210218_BNE.pdf (accessed on 30 July 2021).
  48. Secretaría de Energía. Programa de Desarrollo del Sistema Eléctrico Nacional 2021–2035. Available online: https://www.gob.mx/sener/articulos/programa-para-el-desarrollo-del-sistema-electrico-nacional (accessed on 30 July 2021).
  49. International Energy Agency. Electricity Information 2019; OECD Publishing: Paris, France, 2019. [Google Scholar]
  50. International Energy Agency. World Energy Balances 2019; OECD Publishing: Paris, France, 2019. [Google Scholar]
  51. Frischknecht, R.; Althaus, H.J.; Bauer, C.; Doka, G.; Heck, T.; Jungbluth, N.; Kellenberger, D.; Nemecek, T. The environmental relevance of capital goods in life cycle assessments of products and services. Int. J. Life Cycle Assess. 2007, 12, 7–17. [Google Scholar]
  52. Roma, R.; Corrado, S.; De Boni, A.; Forleo, M.B.; Fantin, V.; Moretti, M.; Palmieri, N.; De Camillis, C.; Vitali, A. Life Cycle Assessment in the Agri-Food Sector; Springer: Cham, Switzerland, 2015; Chapter 5; pp. 251–332. ISBN 978-3-319-35441-5. [Google Scholar]
  53. Clune, S.; Crossin, E.; Verghese, K. Systematic review of greenhouse gas emissions for different fresh food categories. J. Clean. Prod. 2017, 140, 766–783. [Google Scholar] [CrossRef] [Green Version]
  54. FAO. Environmental Performance of Pig Supply Chains: Guidelines for Assessment (Version 1). Livestock Environmental Assessment and Performance Partnership; Food and Agriculture Organization: Rome, Italy, 2018; p. 175. ISBN 978-92-5-130377-1. [Google Scholar]
  55. Asem-Hiablie, S.; Battagliese, T.; Stackhouse-Lawson, K.R.; Rotz, C.A. A life cycle assessment of the environmental impacts of a beef system in the USA. Int. J. Life Cycle. 2019, 24, 441–455. [Google Scholar] [CrossRef] [Green Version]
  56. Del Borghi, A.; Moreschi, L.; Gallo, M. Life cycle assessment in the food industry. In The Interaction of Food Industry and Environment; Academic Press: Cambridge, MA, USA, 2020; p. 9780128175156. [Google Scholar]
  57. Hospido, A.; Davis, J.; Berlin, J. A review of methodological issues affecting LCA of novel food products. Int. J. LCA 2010, 15, 44–52. [Google Scholar] [CrossRef]
  58. Pérez-Espejo, R.H.; Constantino-Toto, R.M.; Davila Ibanez, H.R. Water, food and welfare. In Water Footprint as a Complementary Approach to Water Management in Mexico; Springer Briefs in Environment, Security, Development and Peace: Cham, Switzerland, 2016; Volume 23, ISBN 978-3-319-28822-2. [Google Scholar]
  59. SMN, Sistema Meteorológico Nacional. Normales Climatológicas por Estado. Available online: https://smn.conagua.gob.mx/es/informacion-climatologica-por-estado? (accessed on 25 September 2021).
  60. Ortega, F.; Pérez, O.; Bello, I.P.; Fieldwork in the Pork Farm Sector, Veracruz, México. Personal communication, 2020.
  61. Arcos, M.A.; De Jesús, E.; Torres, F.; Fieldwork in the Pork Farm Sector, Veracruz, México. Personal communication, 2020.
  62. Hernández, M.A.; Ramírez, J.C.; Rodríguez, J.E.; Fieldwork in the Pork Farm Sector, Veracruz, México. Personal communication, 2020.
  63. Vázquez, C.A.; González, J.S.; Martínez, S.L.; Serrano, V.R.; Fieldwork in the Pork Farm Sector, Veracruz, México. Personal communication, 2020.
  64. U.S. Department of Agriculture. Swine Industry Manual. FAD PRep Foreign Animal Disease Preparedness & Response Plan. National Animal Health Emergency Management System. Available online: https://www.aphis.usda.gov/animal_health/surveillance_toolbox/docs/fadprep_swine_industry_manual.pdf (accessed on 30 June 2021).
  65. Secretaría de Energía. Sistema de Información de Energía. Available online: http://sie.energia.gob.mx (accessed on 18 April 2020).
  66. Hatfield, J.; Johnson, D.; Lassey, K.R.; Aparecida-de-Lima, M.; Romanovskaya, A. 2006 IPCC Guidelines for National Greenhouse Gas Inventories; IGES: Hayama, Japan, 2006; p. 10. [Google Scholar]
  67. FAO. Environmental Performance of Large Ruminant Supply Chains: Guidelines for Assessment. Livestock Environmental Assessment and Performance Partnership; FAO: Rome, Italy, 2016; pp. 29–91. ISBN 978-92-5-109523-2. [Google Scholar]
  68. Jørgensen, H.; Knudsen, K.E.B.; Theil, P.K. Enteric Methane Emission from Pigs. Planet Earth 2011—Global Warming Challenges and Opportunities for Policy and Practice; InTech Europe: Rijeka, Croatia, 2011; ISBN 978-953-307-733-8. [Google Scholar]
  69. Rivera, L.F. Análisis de Ciclo de Vida de la Valorización del Residuo Rastrojo de Maíz. Bachelor’s Thesis, Universidad Veracruzana, Veracruz, Mexico.
  70. Ecoinvent. The Ecoinvent Database. Available online: https://www.ecoinvent.org/database/database.html (accessed on 1 June 2021).
  71. Villavicencio, G.M.R.; Lorga, D.S.A.; Paulino, F.M.; Martínez, C.F.E.; Martínez, C.A.R.; Matus, G.J.; Gómez, T.G. Life cycle assessment of pig production—A case study in Mexican farm. In Proceedings of the 35th International Scientific Conference on Economic and Social Development—“Sustainability from an Economic and Social Perspective”, Lisbon, Portugal, 15–16 November 2018. [Google Scholar]
  72. Dalgaard, R.; Halberg, N.; Hermansen, J.E. Danish Pork Production an Environmental Assessment. DJF Anim. Sci. 2007, 82, 1–34. [Google Scholar]
  73. García-Gudiño, J.; Monteiro, A.; Espagnol, S.; Blanco-Penedo, I.; Garcia-Launay, F. Life Cycle Assessment of Iberian Traditional Pig Production System in Spain. Sustainability 2020, 12, 627. [Google Scholar] [CrossRef] [Green Version]
  74. Bava, L.; Zucali, M.; Sandrucci, A.; Tamburini, A. Environmental impact of the typical heavy pig production in Italy. J. Clean. Prod. 2017, 140, 685–691. [Google Scholar] [CrossRef]
  75. Rudolph, G.; Hörtenhuber, S.; Bochicchio, D.; Butler, G.; Brandhofer, R.; Dippel, S.; Dourmad, J.Y.; Edwards, S.; Früh, B.; Meier, M.; et al. Effect of three husbandry systems on environmental impact of organic pigs. Sustainability 2018, 10, 3796. [Google Scholar] [CrossRef] [Green Version]
  76. Kebreab, E.; Liedke, A.; Caro, D.; Deimling, S.; Binder, M.; Finkbeiner, M. Environmental impact of using specialty feed ingredients in swine poultry production: A life cycle assessment. J. Anim. Sci. 2016, 94, 2664–2681. [Google Scholar] [CrossRef]
  77. Bai, X.; Ren, X.; Khanna, N.Z.; Zhang, G.; Zhou, N.; Bai, Y.; Hu, M. A comparative study of a full value-chain water footprint assessment using two international standards at a large-scale hog farm in China. J. Clean. Prod. 2018, 176, 557–565. [Google Scholar] [CrossRef]
  78. Ulrich, R.K.; Boles, E.; Leh, M.; Sandefur, H.; Thoma, G. A Cradle to Farm Gate Life Cycle Analysis of Water Use in US Pork Production. Available online: https://porkcheckoff.org/wp-content/uploads/2021/02/11-133-MATLOCK-UofArk.pdf (accessed on 28 June 2021).
  79. De Miguel, Á.; Hoekstra, A.Y.; García-Calvo, E. Sustainability of the water footprint of the Spanish pork industry. Ecol. Indic. 2015, 57, 465–474. [Google Scholar] [CrossRef]
  80. Wang, X.; Dadouma, A.; Chen, Y.; Sui, P.; Gao, W.; Jia, L. Sustainability evaluation of the large-scale pig farming system in North China: An emergy analysis based on life cycle assessment. J. Clean. Prod. 2015, 102, 144–164. [Google Scholar] [CrossRef]
  81. Vanham, D.; Bidoglio, G. A review on the indicator water footprint for the EU28. Ecol. Indic. 2013, 26, 61–75. [Google Scholar] [CrossRef]
  82. Soleimani, T.; Gilbert, H. Evaluating environmental impacts of selection for residual feed intake in pigs. Animal 2020, 14, 2598–2608. [Google Scholar] [CrossRef]
  83. Haque, M.A.; Liu, Z. Environmental Footprint Assessment of Representative Swine Diets in the USA. In Proceedings of the 2019 ASABE Annual International Meeting. American Society of Agricultural and Biological Engineers, Boston, MA, USA, 7–10 July 2019. [Google Scholar]
  84. Launay, F.G.; Rouillon, V.; Faure, J.; Fonseca, A. Life Cycle Assessment of pig production systems of the Noir de Bigorre chain. Arch. Zootec. 2018, 1, 21–25. [Google Scholar]
  85. Dourmad, J.Y.; Ryschawy, J.; Trousson, T.; Bonneau, M.; Gonzàlez, J.; Houwers, H.W.J.; Morgensen, L. Evaluating environmental impacts of contrasting pig farming systems with life cycle assessment. Animal 2014, 8, 2027–2037. [Google Scholar] [CrossRef] [Green Version]
  86. Liang, J.B.; Suzuki, S.; Kawamura, A.; Habasaki, A.; Kato, T. Opportunities and challenges of converting biogas from pig farms into renewable energy in developing countries in Asia—A Malaysian experience. Aust. J. Exp. Agric. 2008, 48, 54–59. [Google Scholar] [CrossRef]
  87. Prapaspongsa, T.; Christensen, P.; Schmidt, J.H.; Thrane, M. LCA of comprehensive pig manure management incorporating integrated technology systems. J. Clean. Prod. 2010, 18, 1413–1422. [Google Scholar] [CrossRef]
  88. Lijó, L.; González-García, S.; Bacenetti, J.; Fiala, M.; Feijoo, G.; Lema, J.M.; Moreira, M.T. Life Cycle Assessment of electricity production in Italy from anaerobic co-digestion of pig slurry and energy crops. Renew. Energy 2014, 68, 625–635. [Google Scholar] [CrossRef] [Green Version]
  89. Theofanous, E.; Kythreotou, N.; Panayiotou, G.; Florides, G.; Vyrides, I. Energy production from piggery waste using anaerobic digestion: Current status and potential in Cyprus. Renew. Energy 2014, 71, 263–270. [Google Scholar] [CrossRef]
  90. Esteves, E.M.M.; Herrera, A.M.N.; Esteves, V.P.P.; Morgado, C.D.R.V. Life cycle assessment of manure biogas production: A review. J. Clean. Prod. 2019, 219, 411–423. [Google Scholar] [CrossRef]
  91. Wang, Y.; Zhang, Y.; Li, J.; Lin, J.G.; Zhang, N.; Cao, W. Biogas energy generated from livestock manure in China: Current situation and future trends. J. Environ. Manag. 2021, 297, 1–9. [Google Scholar] [CrossRef]
Figure 1. Stages that make up the LCA procedure.
Sustainability 13 11248 g001
Figure 2. Currents stages of intensive production of pigs.
Sustainability 13 11248 g002
Figure 3. Components of the carbon footprint in intensive pig farming.
Sustainability 13 11248 g003
Figure 4. Comparative carbon footprint of products and co-products from the intensive pig farm.
Sustainability 13 11248 g004
Figure 5. Carbon footprint of intensive pig farming from selected case studies.
Sustainability 13 11248 g005
Figure 6. Components of the water footprint in intensive pig farming.
Sustainability 13 11248 g006
Figure 7. Comparative water footprint of products and co-products from the intensive pig farm.
Sustainability 13 11248 g007
Figure 8. Components of the energy footprint in intensive pig farming.
Sustainability 13 11248 g008
Figure 9. Supply by primary energy source for intensive pig production in the current LCA.
Sustainability 13 11248 g009
Figure 10. Comparative energy footprint of products and co-products from the intensive pig farm.
Sustainability 13 11248 g010
Figure 11. Energy footprint of intensive pig farming from selected case studies.
Sustainability 13 11248 g011
Figure 12. Change in the carbon footprint regarding energy conversion from pig slurry waste.
Sustainability 13 11248 g012
Table 1. Impact categories used in the current LCA.
CategoryDescriptionUnit
Carbon footprintThis impact category focuses on global warming as the “single criterion” that displays the greenhouse gas emissions associated with the life cycle. It expresses the capacity to absorb infrared radiation of a unit of mass of pollutant compared to the same unit of mass of CO2.kg CO2eq
Water footprintThis indicator shows impacts related to water supply for any anthropic system. It refers to the environmental stress caused by consumed water that will no longer be available to humans or ecosystems.m3
Energy footprintThe energy footprint accounts for the primary energy consumed in the processes involving the supplied raw materials, as well as the manufacturing, distribution, use and final disposal of the product system. This category of impact represents the depletion of energy resources associated with the life cycle.MJ
Source: prepared by the authors with information from [35,37,38,39,40,41,42].
Table 2. Characterization of the electrical power generation at the national level a.
Type of EnergyPrimary Fuel SuppliedNet Calorific Value Conversion FactorPrimary Energy Share bEnergy EfficiencySelf-Consumption cElectric Power Generation Share
%%%%
Natural gas15.4 × 109m338.13MJ/m342.4343.30.9444.72
Coal5.8 × 109kg19.43MJ/kg15.9041.17.7914.81
Fuel oil5.6 × 109L40.23MJ/L16.1337.17.2913.91
Diesel790.5 × 106L38.12MJ/L2.1736.64.411.90
Uranium35.6 × 103kg3.29GJ/g8.4334.62.763.30
Hydro-energy 6.7891.90.8914.21
Geothermal 8.1316.75.551.90
Wind 0.0299.60.050.04
Solar (photovoltaic) 0.00399.21.000.006
Notes: a A factor of 16.6% of losses from the distribution in the electrical grid was included. b The total primary energy was 1.38778 × 10¹² MJ. c Proportion of energy generated for self-consumption from production plants. Source: own elaboration with information from [47,48,49,50].
Table 3. Energy consumption for manufacturing supplies used in the current LCA.
SuppliesEnergy Consumption by Source (%)
CokeDieselFuel OilLP GasNatural GasBiomassElectricity
Petrochemical fuels 90.91 9.09
Cardboard-2.817.500.8866.41-22.39
Fertilizers and pesticides-13.37--21.45-65.18
Iron & steel-materials23.640.260.33-68.05-7.72
Plastic-20.784.700.2256.46-17.94
Source: own elaboration with information from [47,48,49,50,65].
Table 4. Pig balance to produce one hundred swine weighing 124 kg.
EtapaPig in ProcessPig out for SalePig MortalityDays per Phase
Insemination213--115
Gestation162-51
Lactation120162628
Transport to weaning117---
Weaning first115-249
Weaning second113-2
Transport to fattening111-2-
Fattening first10812119
Fattening second10062
Source: own elaboration with information from [60,61,62,63].
Table 5. Share (%) of feed supplied by pig production stage.
Kind of FeedBoarsSows inGrowing Pigs in
AcclimatizationInseminationGestationLactationWeaningFattening
First PhaseSecond PhaseFirst PhaseSecond Phase
Animal fat---0.7-3.15.70.5-
Barley32.314.5-5.232.3-6.2--
Corn30.485.585.544.830.326.938.570.079.3
Milk powder-----14.7---
Molasses1.1--1.01.13.71.7--
Rape3.2--5.73.2----
Soy14.4-14.55.214.534.029.129.620.7
Sunflower4.3--7.84.3----
Wheat14.3--29.614.317.718.7--
Source: own elaboration with information from [60,61,62,63].
Table 6. Foreground data collection from product system.
Production PhasesSuppliesAmount per Functional Unit
Boars-houseCleaning chemicals8.8 × 10−3kg
Electricity32.4 × 10−3kWh
LP Gas101.0 × 10−3MJ
Metal utensils32.1 × 10−6kg
Pig feed104.0 × 10−3kg
Plastic materials205.0 × 10−6kg
Transporting supplies241.0 × 10−3kgkm
Water supply4.6 × 10−3m3
Insemination and gestationCleaning chemicals242.8 × 10−3kg
Electricity3.6 × 100kWh
LP Gas6.0 × 100MJ
Metal utensils709.0 × 10−6kg
Pig feed24.8 × 100kg
Plastic materials8.1 × 10−3kg
Transporting supplies46.9 × 100kgkm
Water supply558.7 × 10−3m3
LactationCleaning chemicals199.0 × 10−3kg
Electricity963.0 × 10−3kWh
LP Gas1.4 × 100MJ
Metal utensils495.0 × 10−6kg
Pig feed12.3 × 100kg
Plastic materials3.1 × 10−3kg
Transporting supplies16.4 × 100kgkm
Water supply197.0 × 10−3m3
WeaningCleaning chemicals187.5 × 10−3kg
Electricity3.1 × 100kWh
LP Gas36.1 × 100MJ
Metal utensils550.0 × 10−6kg
Pig feed35.0 × 100kg
Plastic materials2.9 × 10−3kg
Transporting supplies62.0 × 100kgkm
Water supply591.0 × 10−3m3
FatteningCleaning chemicals299.0 × 10−3kg
Electricity6.3 × 100kWh
LP Gas10.0 × 100MJ
Metal utensils701.0 × 10−6kg
Pig feed255.0 × 100kg
Plastic materials6.1 × 10−3kg
Transporting supplies652.0 × 10−0kgkm
Water supply3.2 × 100m3
Source: own elaboration with information from [60,61,62,63].
Table 7. Environmental impacts per impact category.
Intensive Pig Farming
(FU = 1 swine of 124 kg)
Carbon Footprint
(kg CO2 eq)
Water Footprint
(m3)
Energy Footprint
(MJ)
538.021.341773.0
Publisher’s Note: MDPI stays neutral with regard to jurisdictional claims in published maps and institutional affiliations.

