
Barriers and Enablers for the Integration of Industry 4.0 and Sustainability in Supply Chains of MSMEs

 , and
, and
Abstract
:1. Introduction
- RQ1:
- What are the main barriers and enablers to integrate I4.0 and sustainability in supply chains from a MSME perspective?
- RQ2:
- What are the causalities and dependencies between these barriers and enablers and the hierarchical levels among them?
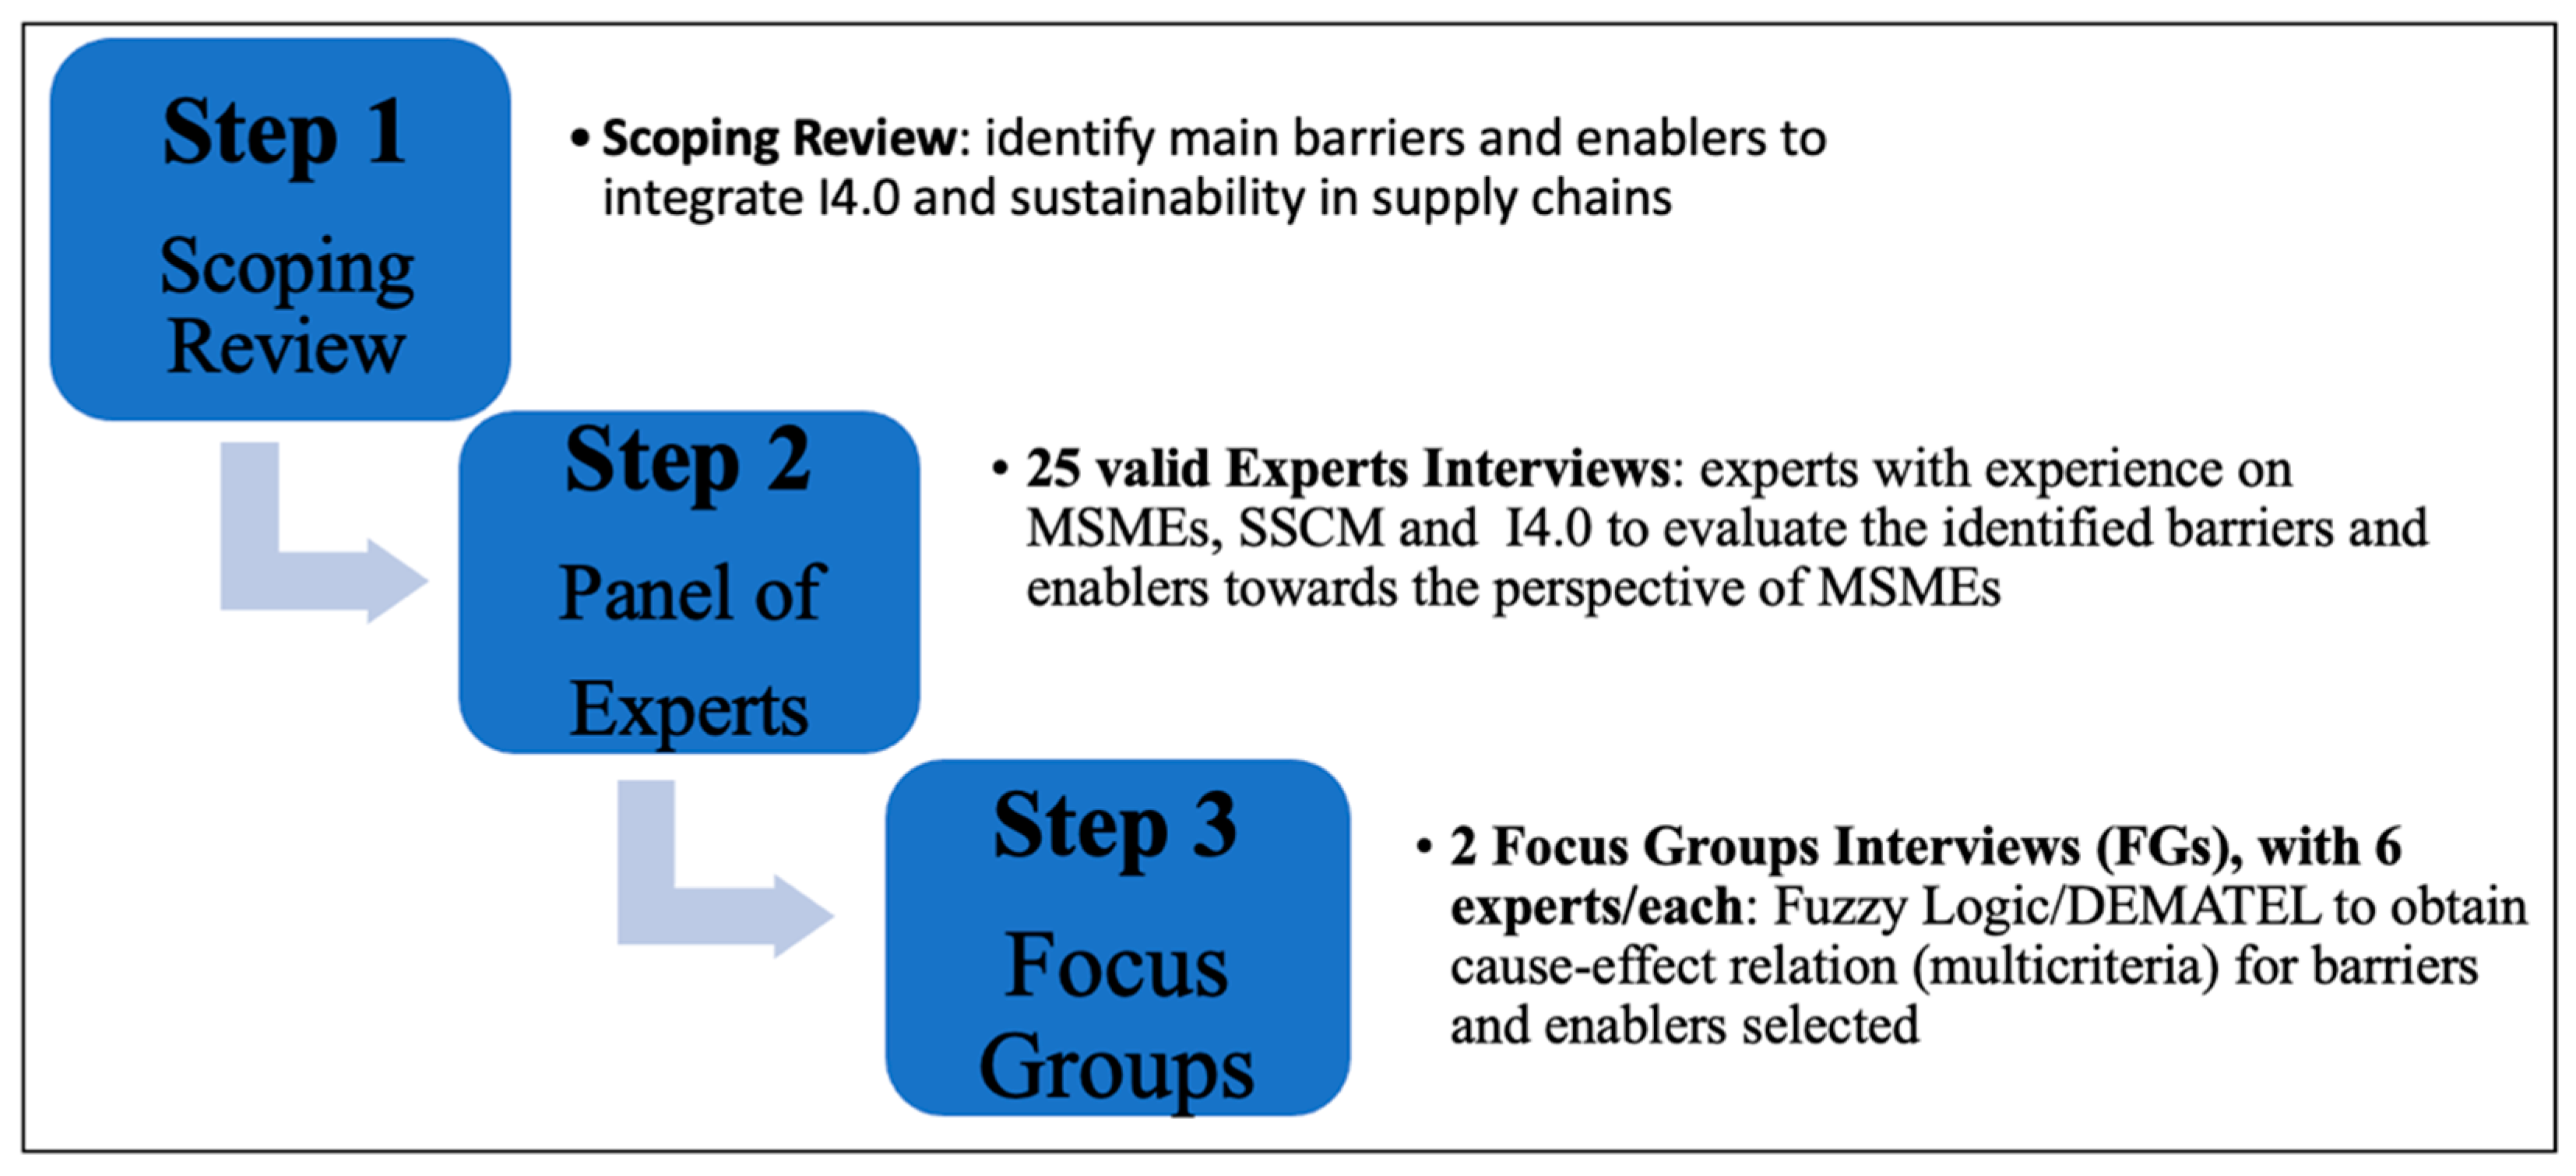
2. Materials and Methods
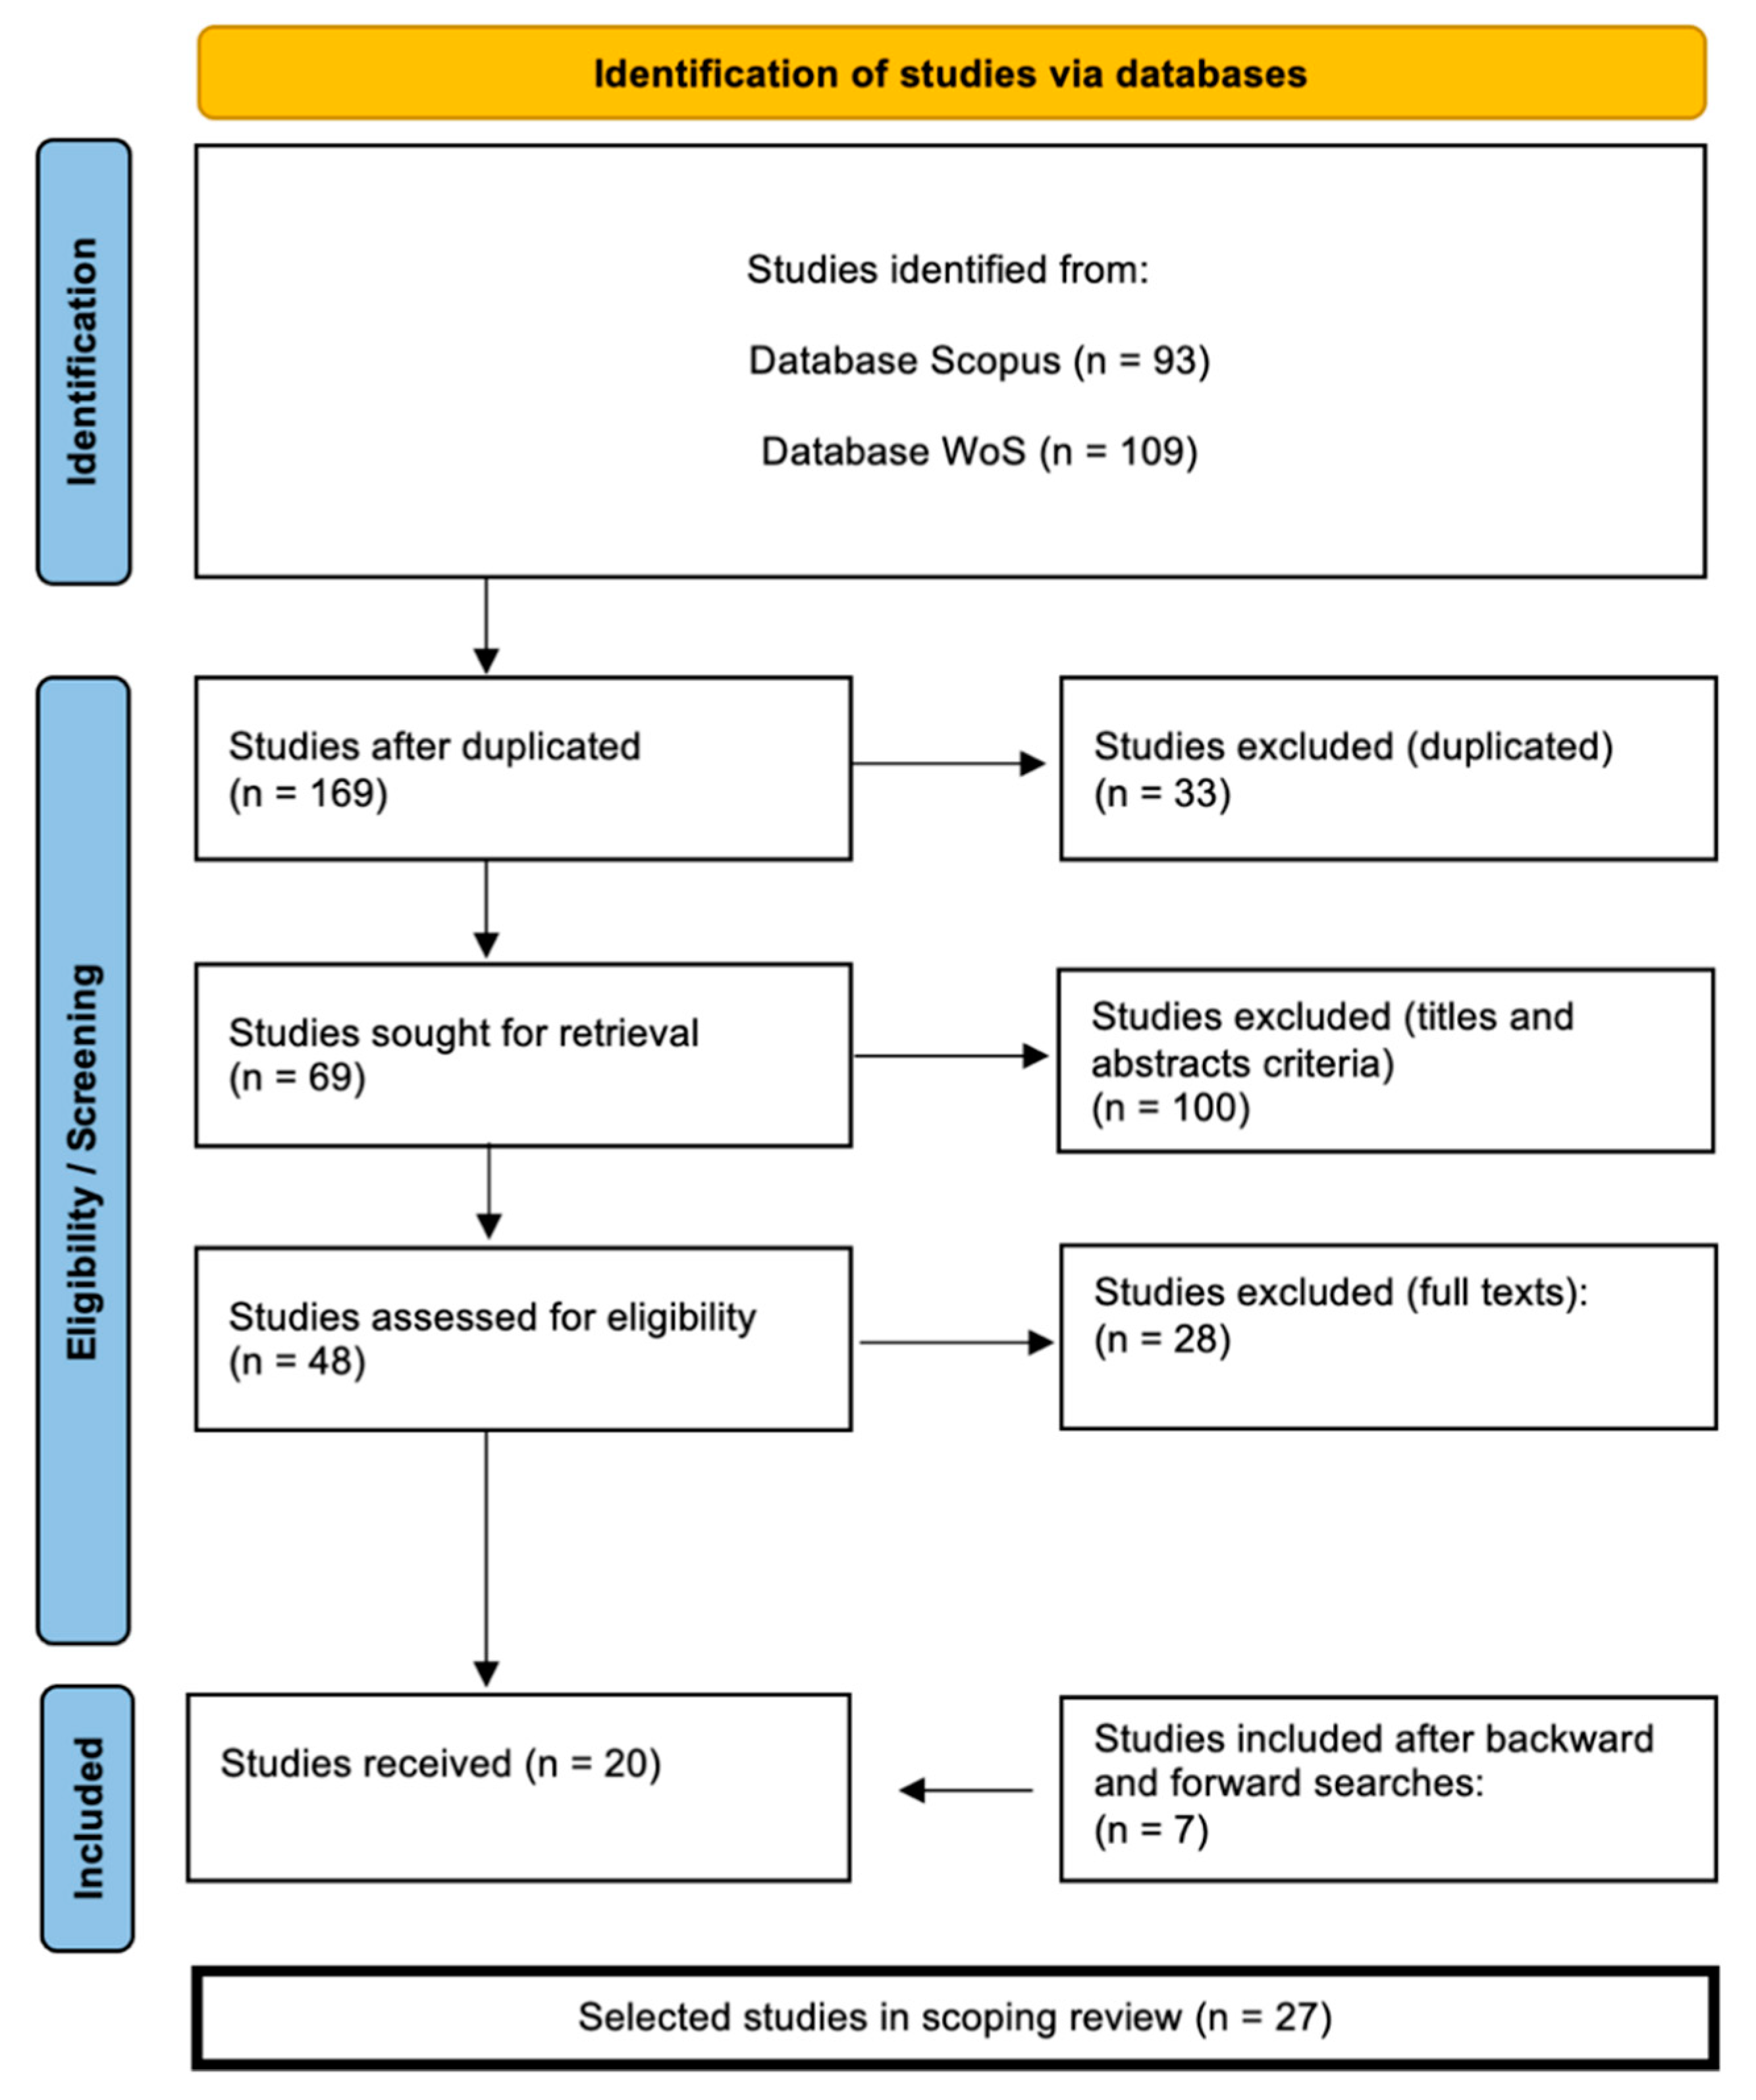
2.1. Scoping Review
2.2. Panel of Experts
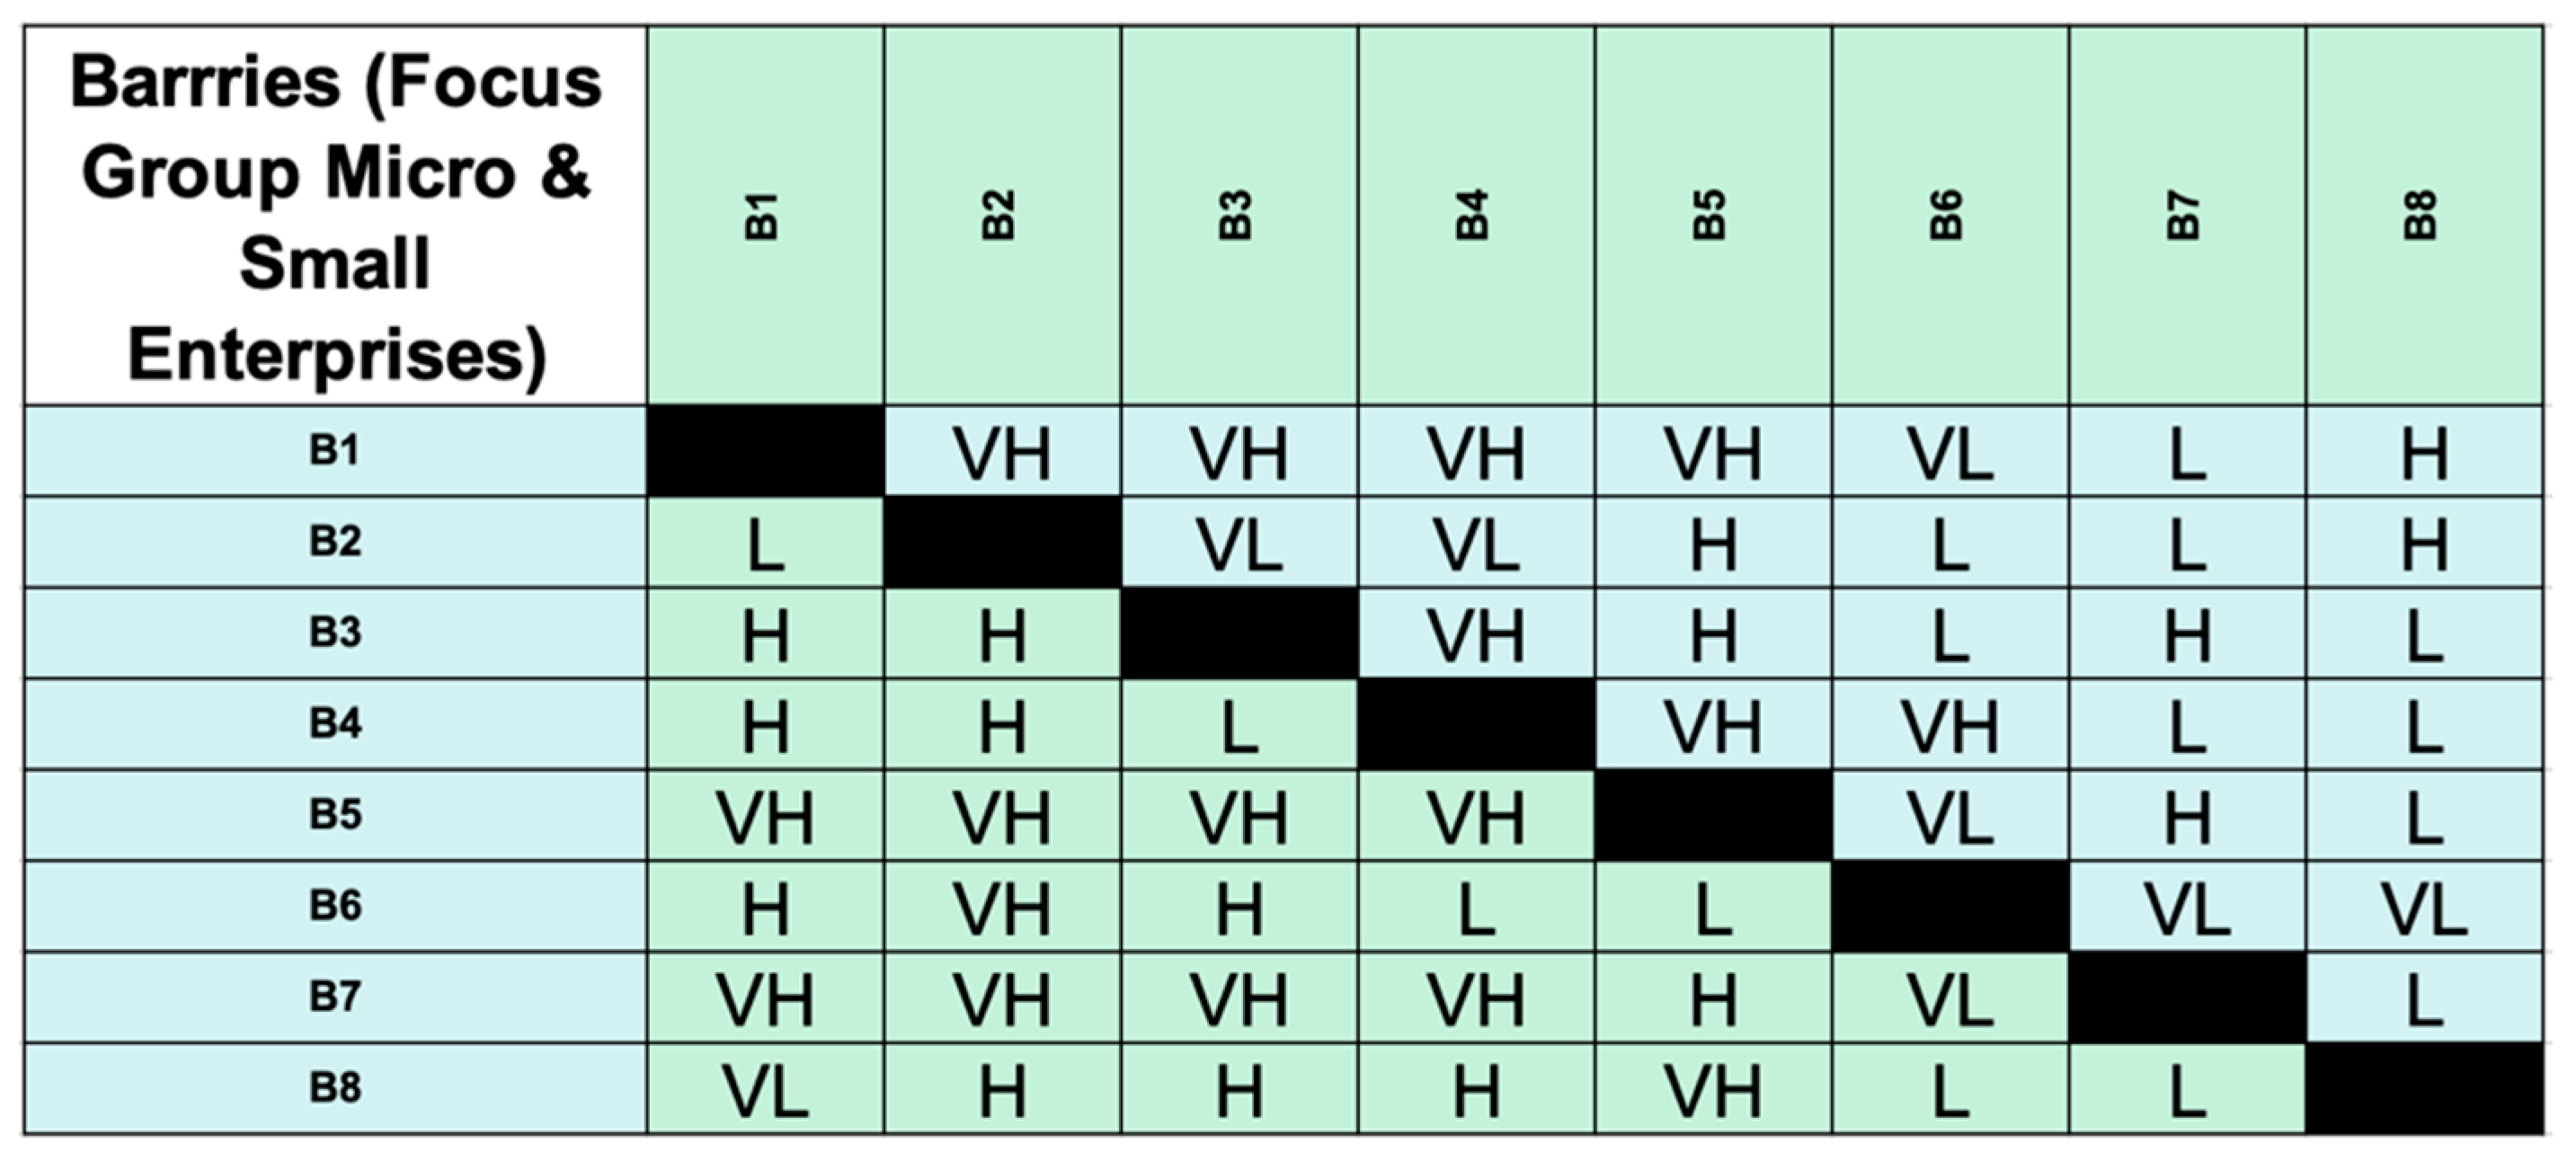
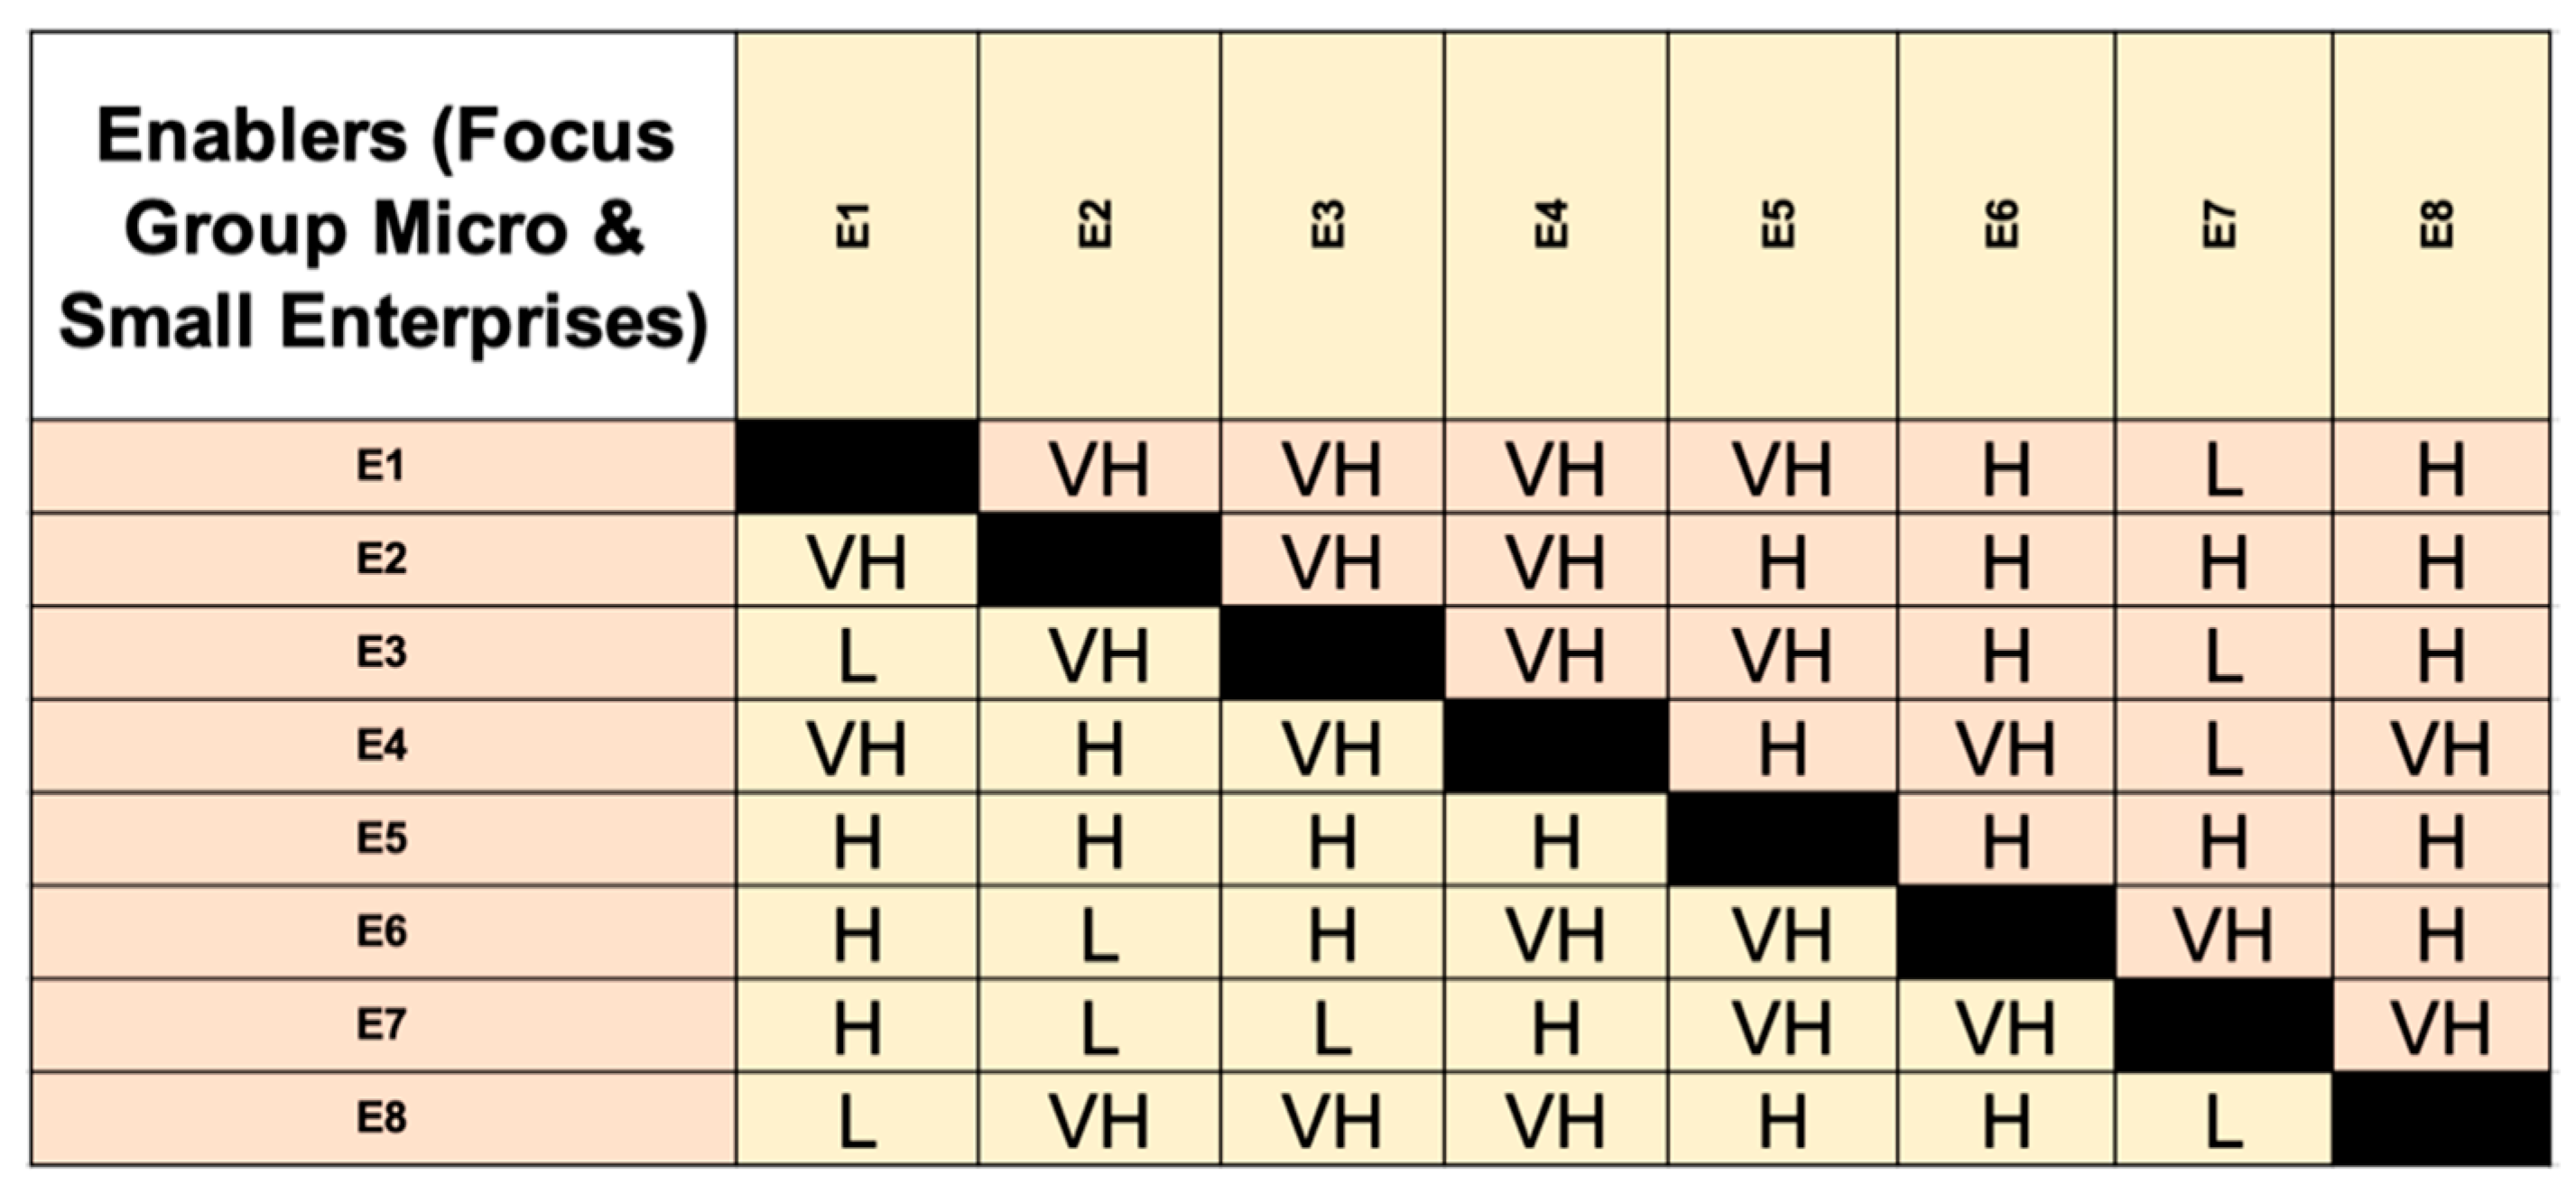
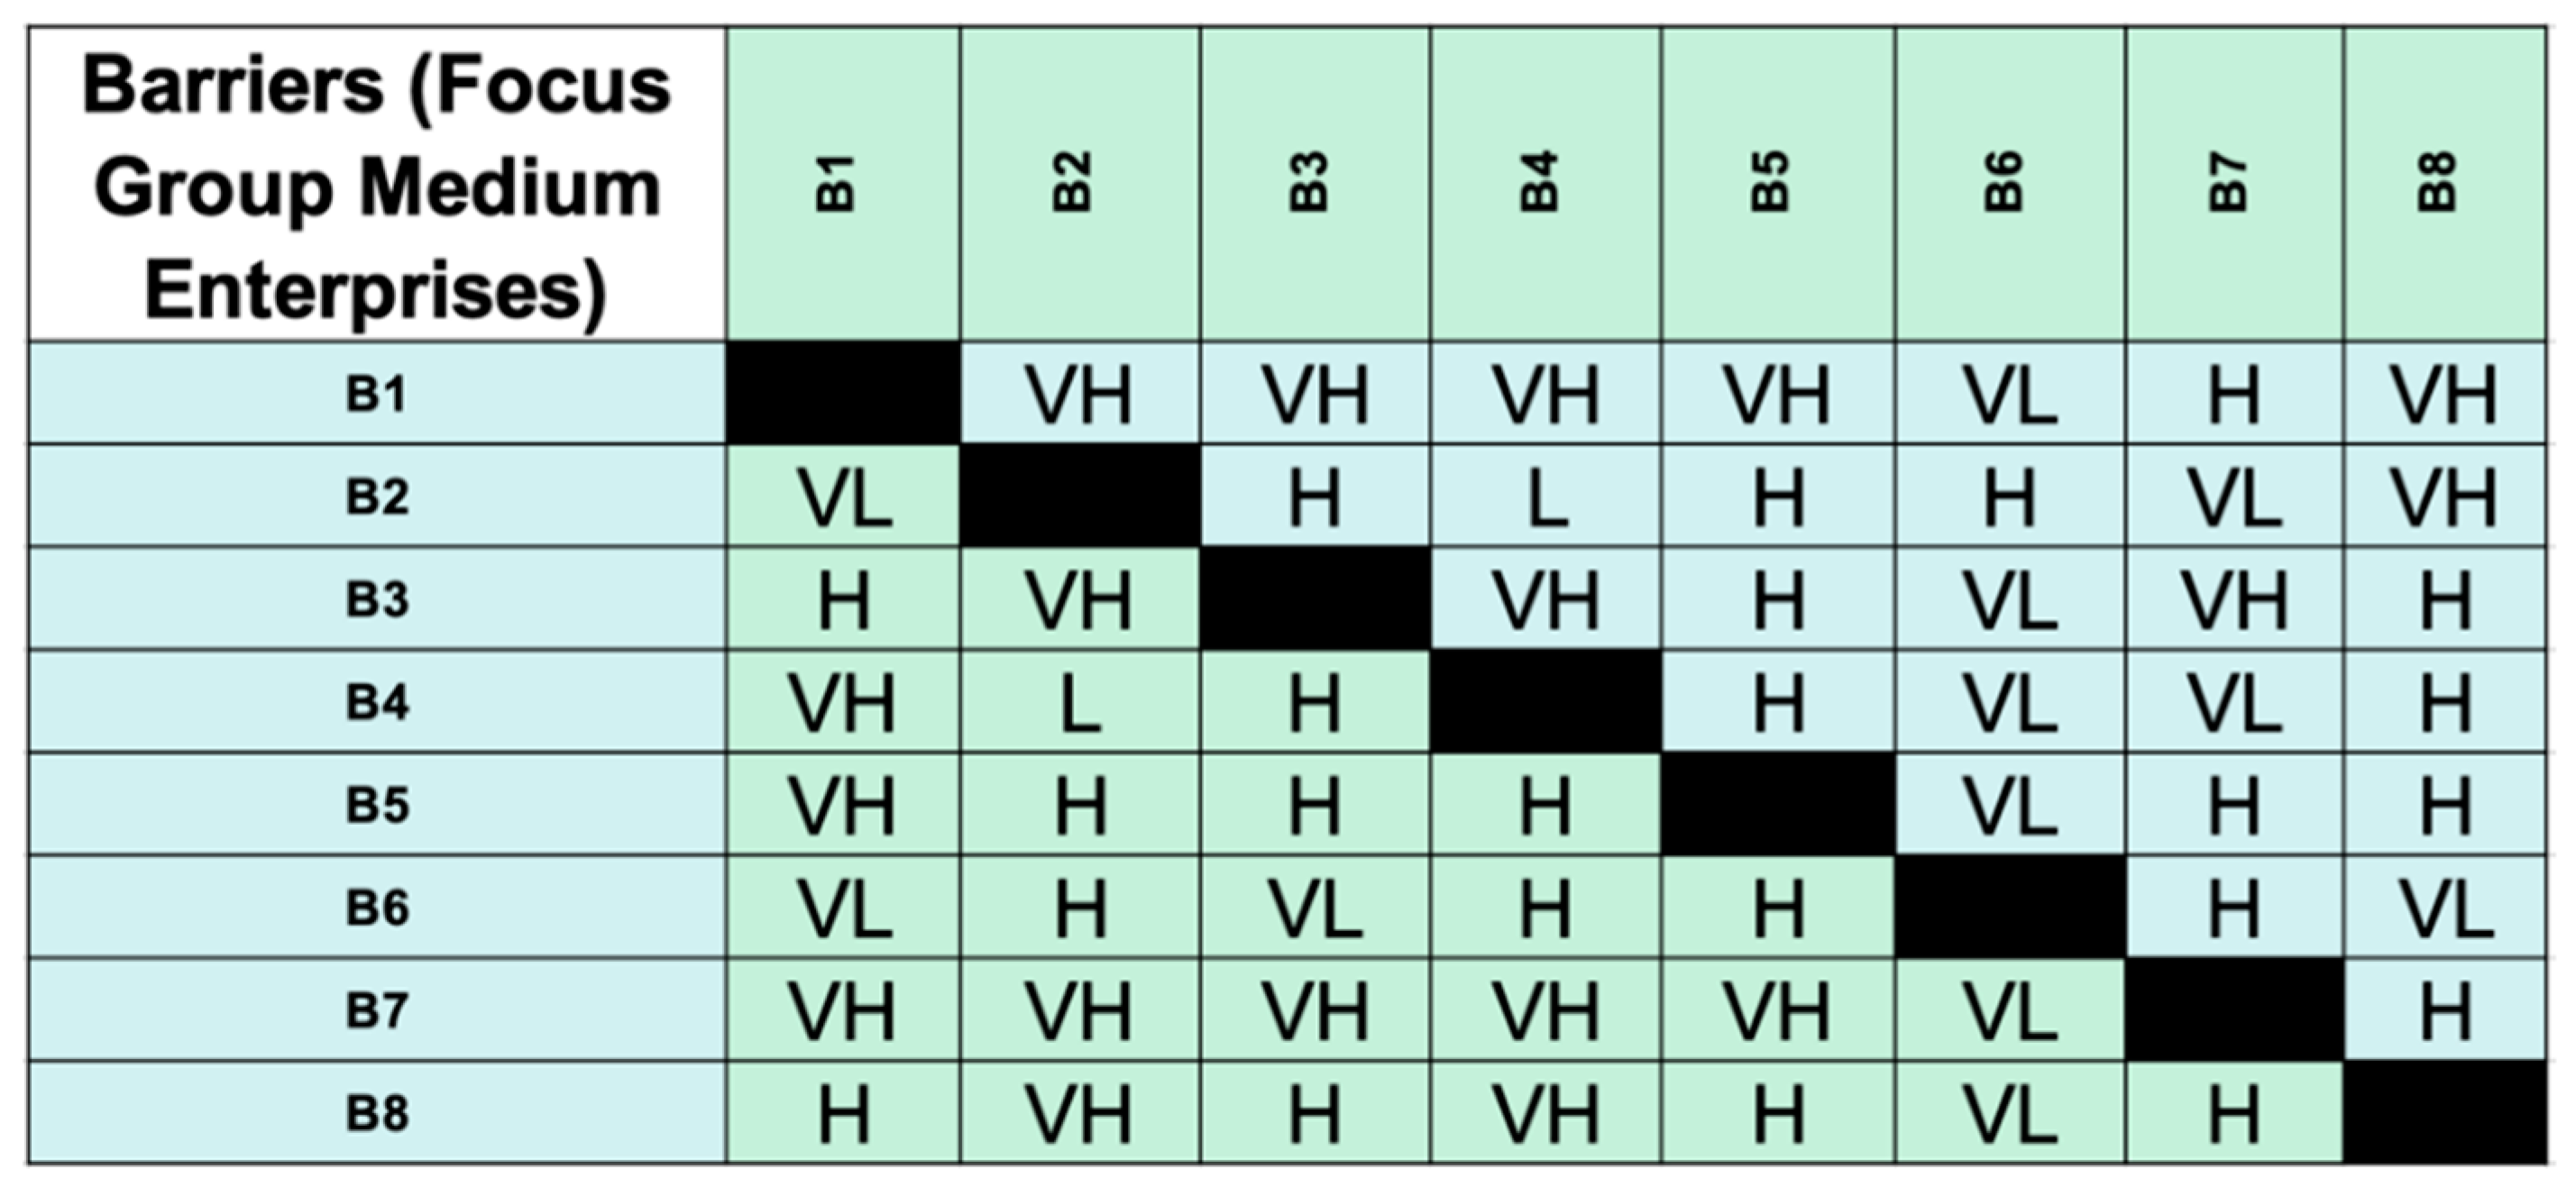
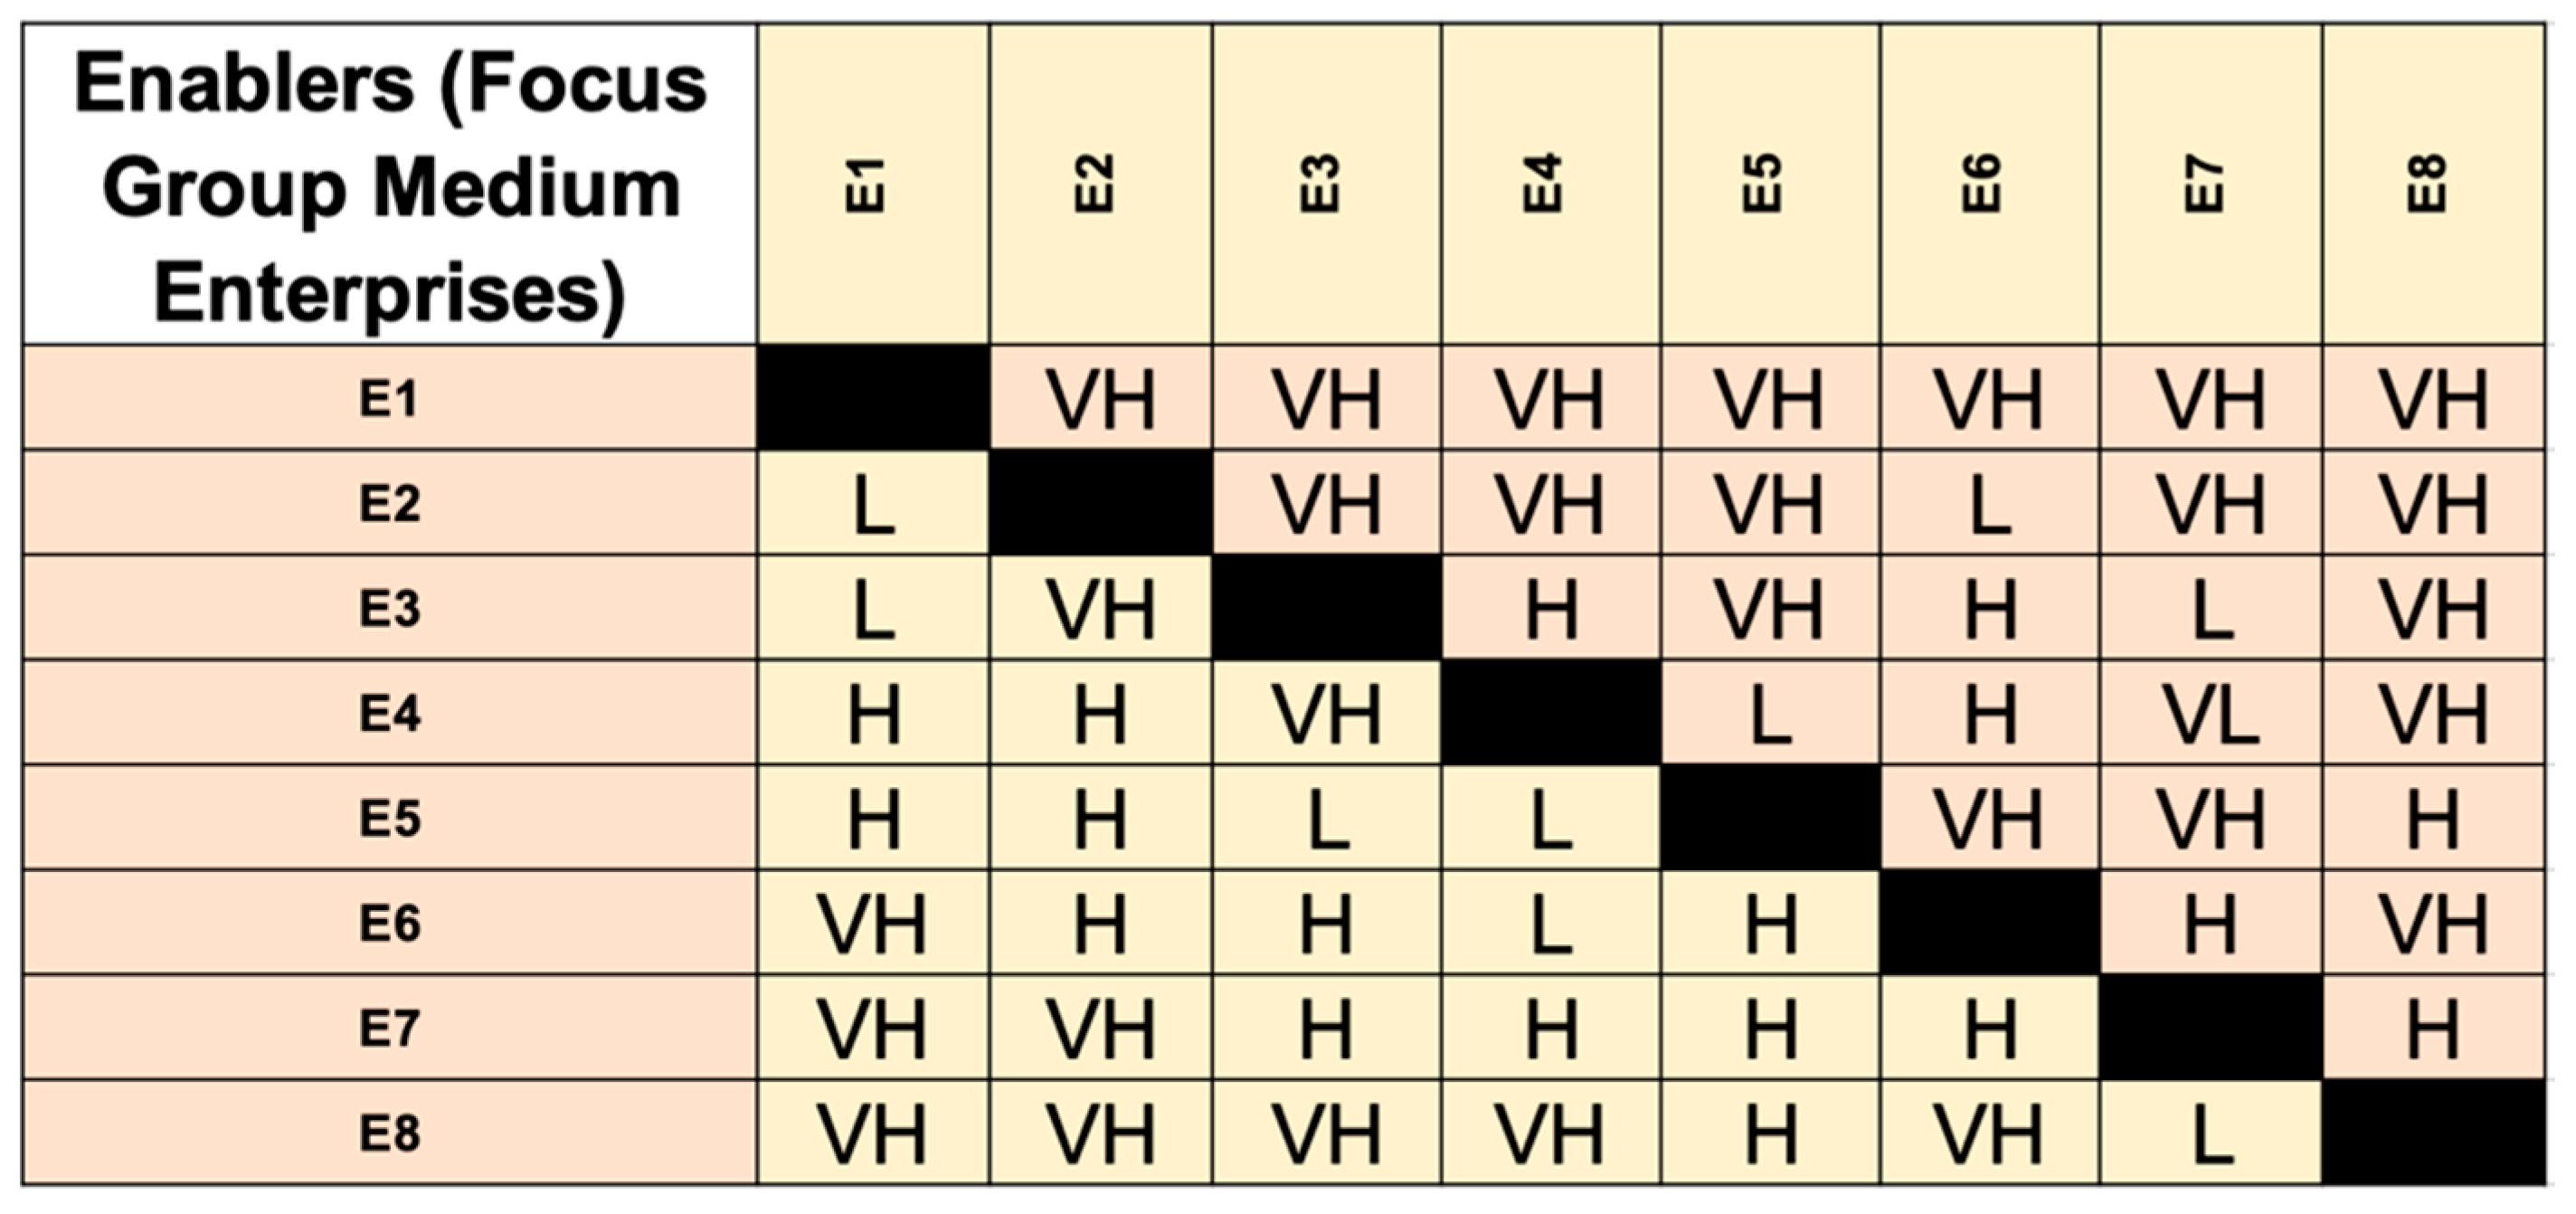
2.3. Focus Group
- (i)
- Create the correspondence of linguistic terms and values (see Table 2);
- (ii)
- Aggregate results and obtain a fuzzy pairwise direct-relation matrix (X);
- (iii)
- Normalize the direct-relation matrix and calculate the total relation matrix (T);
- (iv)
- Determine row and column sums from T;
- (v)
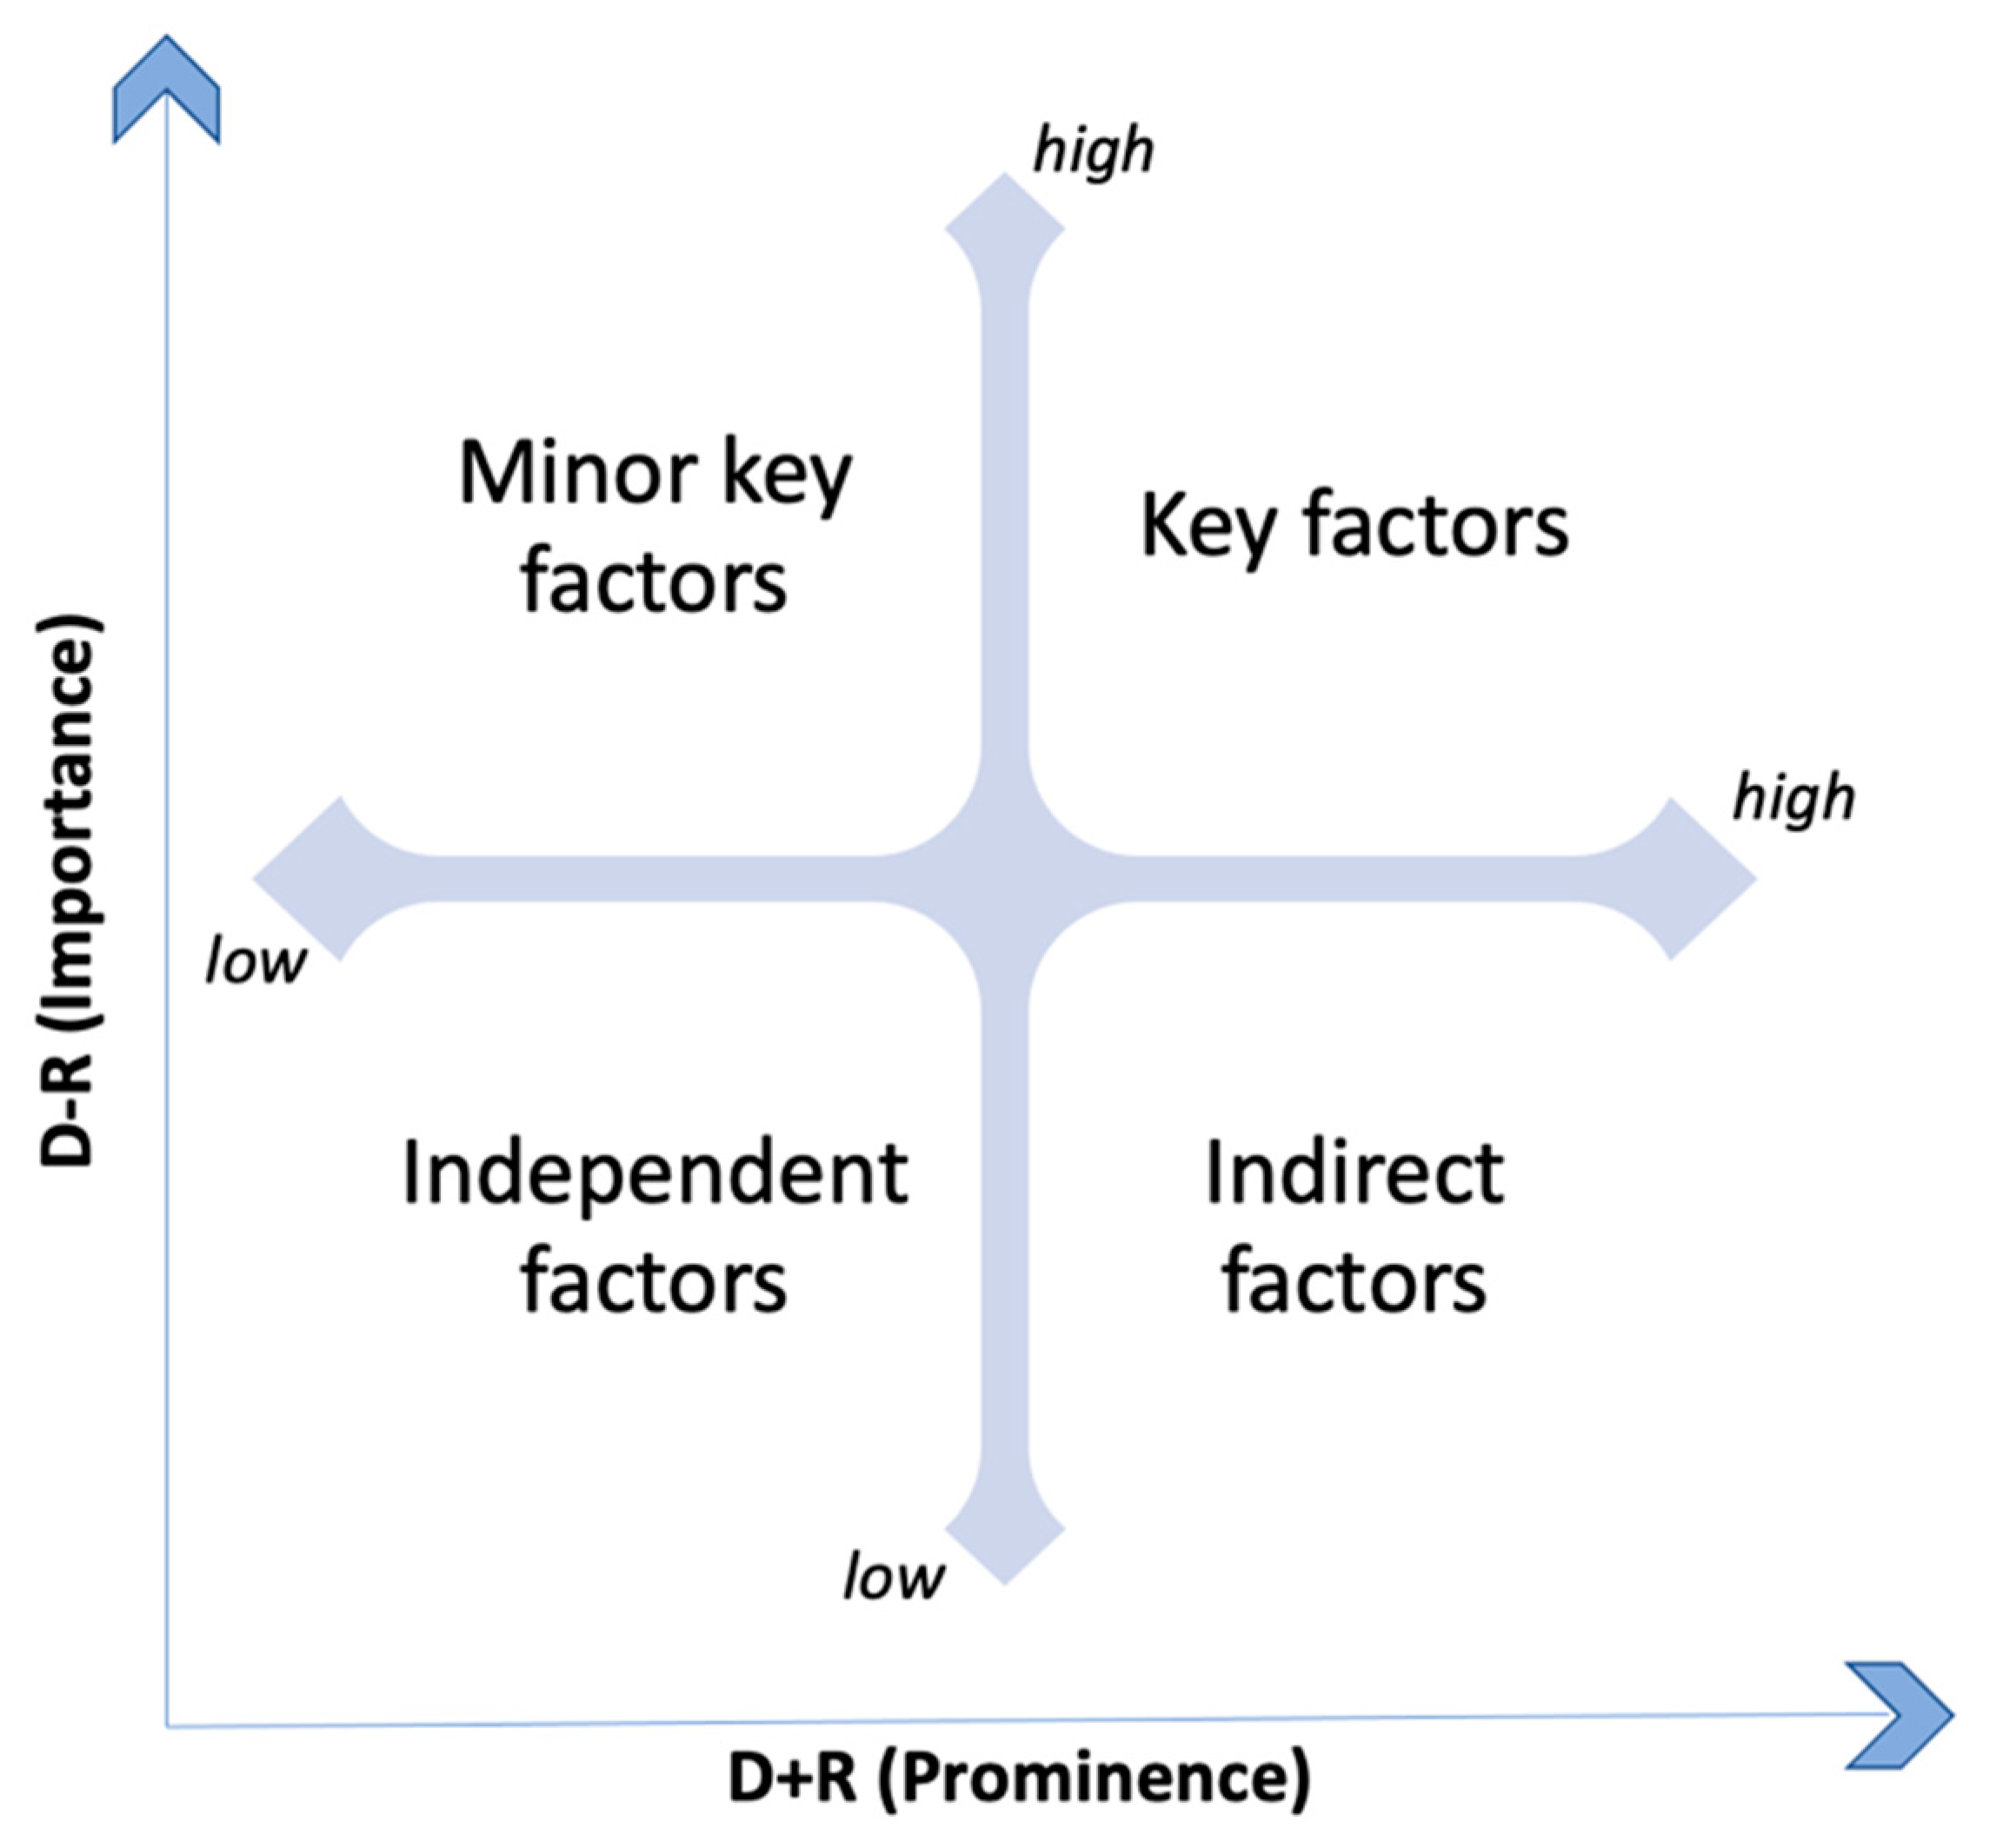
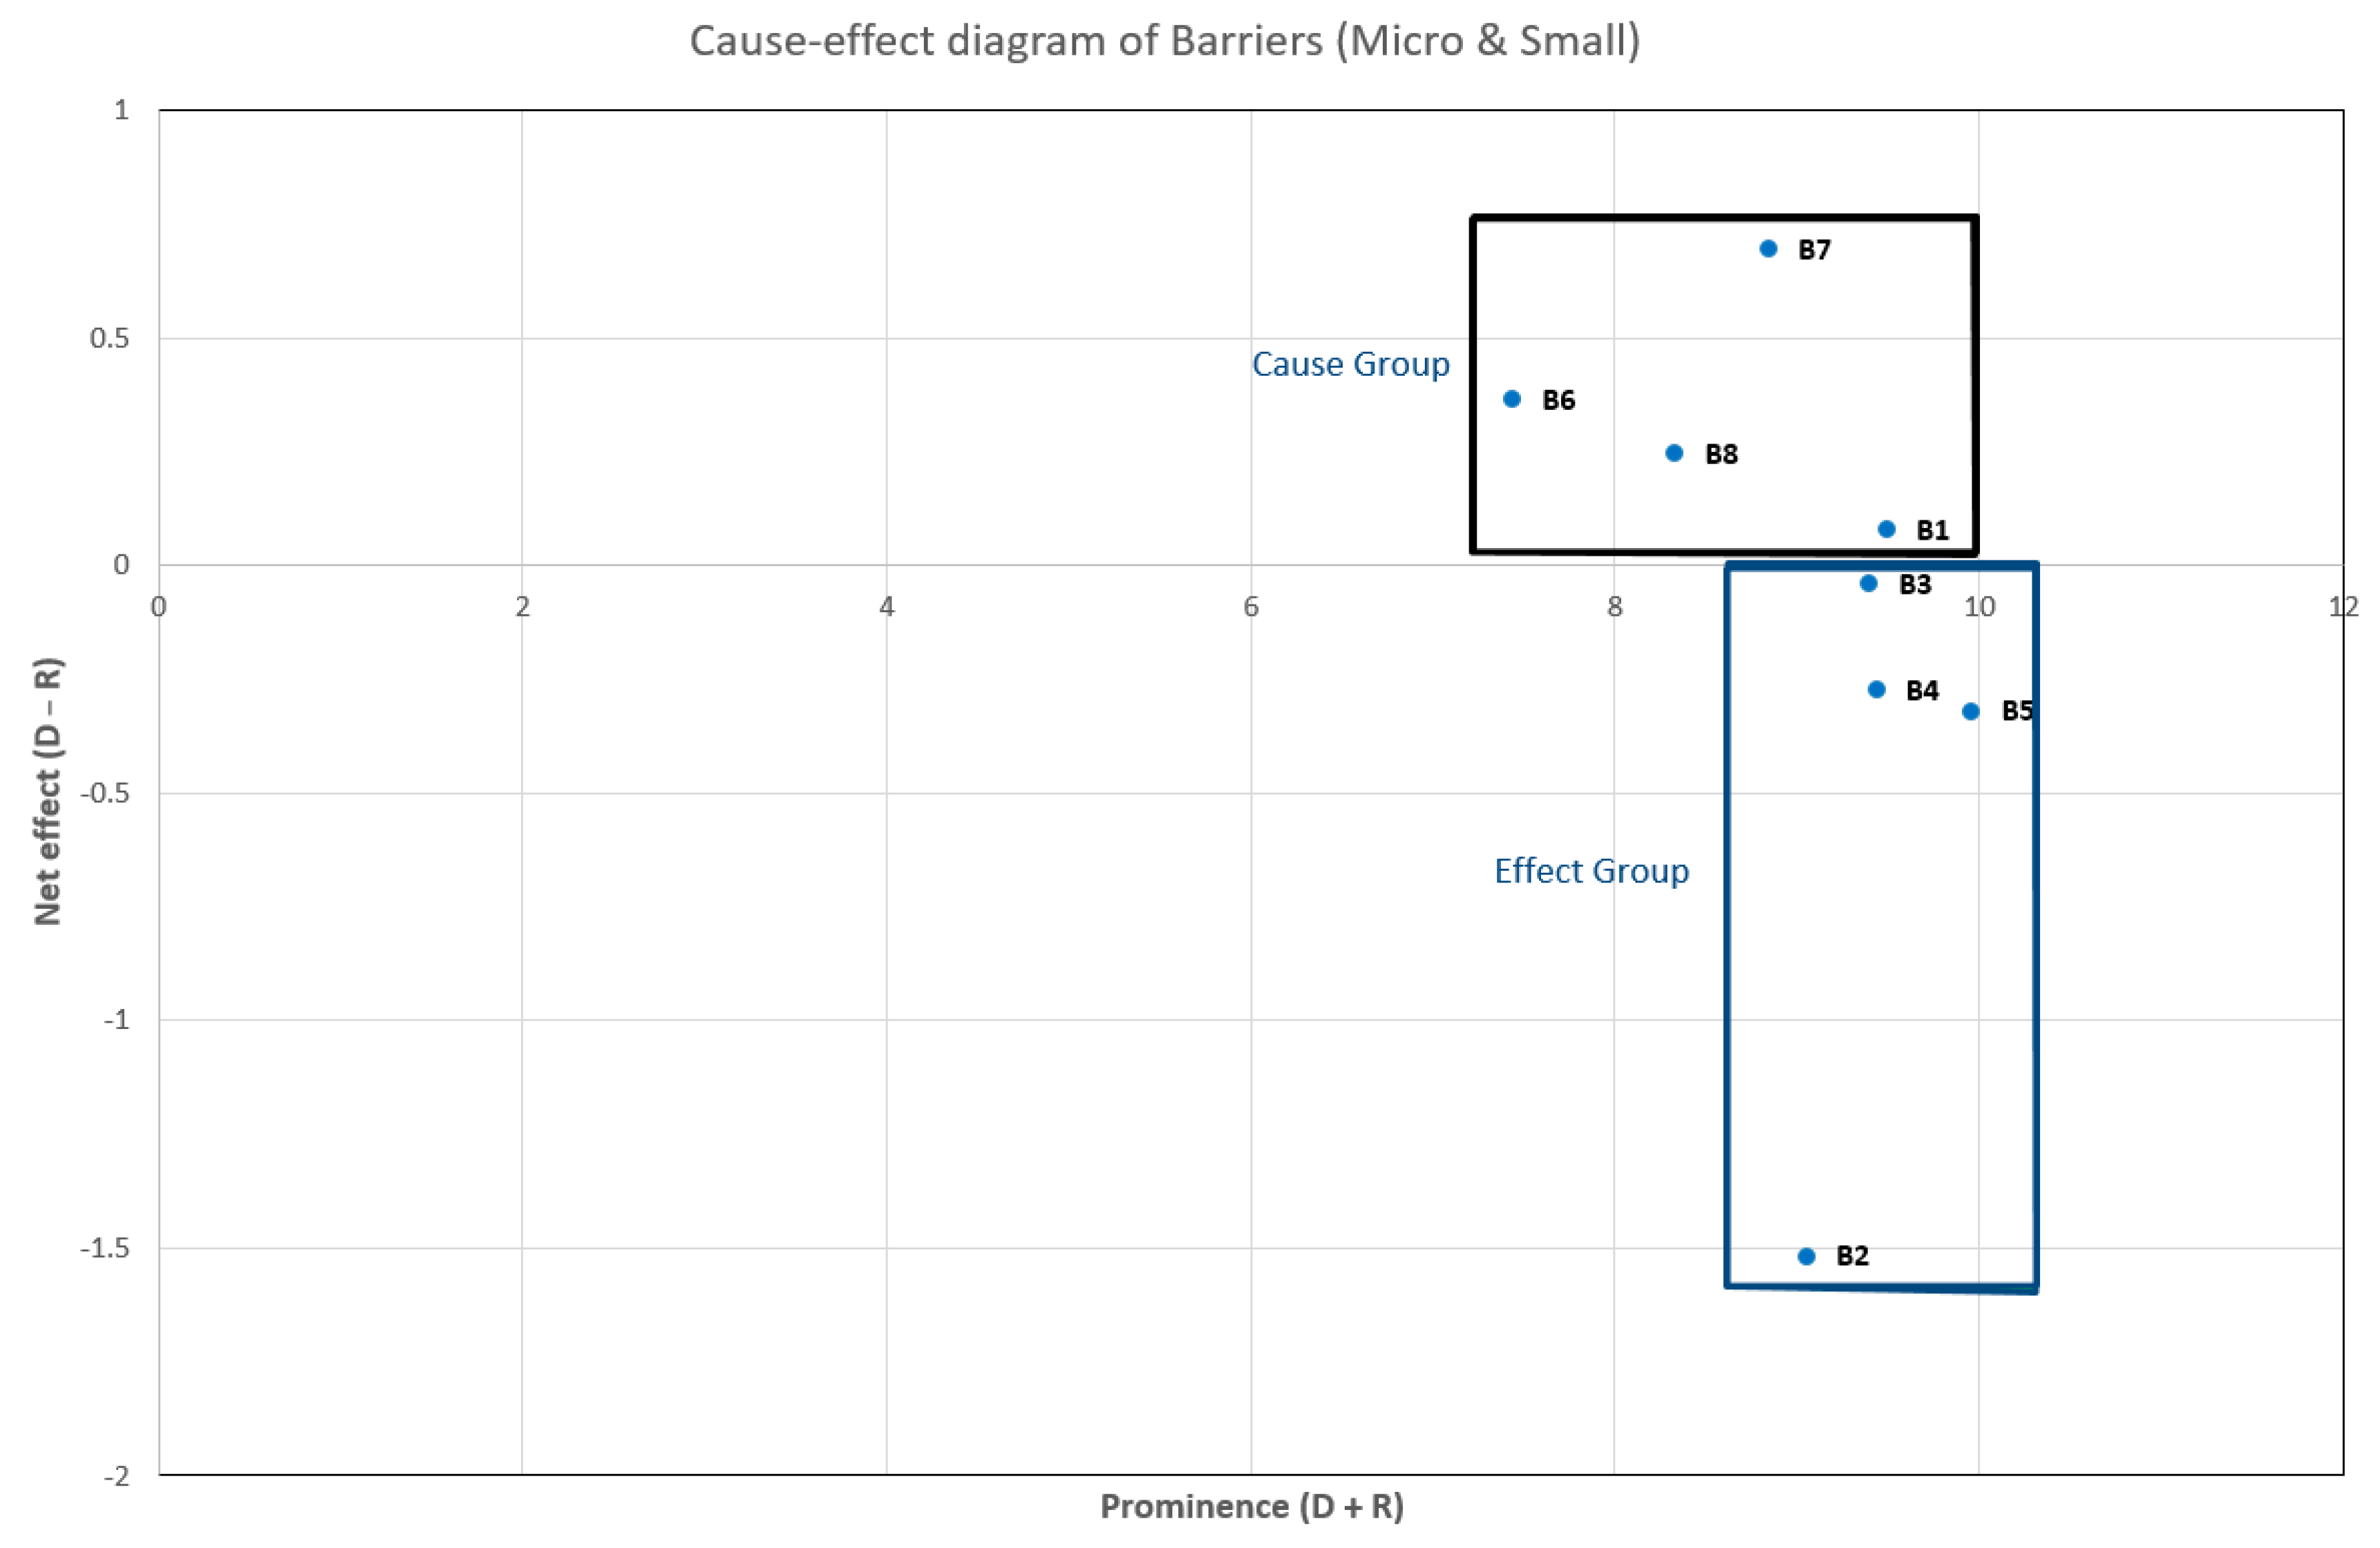
- Determine the overall prominence and net effect values of factors (D + R and D − R);
- (vi)
- Formulate the DEMATEL cause-effect diagrams. Each step incorporates multiple mathematical evaluations. The prominence and net effect values of each factor are fuzzy-DEMATEL analysis outputs [55].
3. Results
4. Discussion
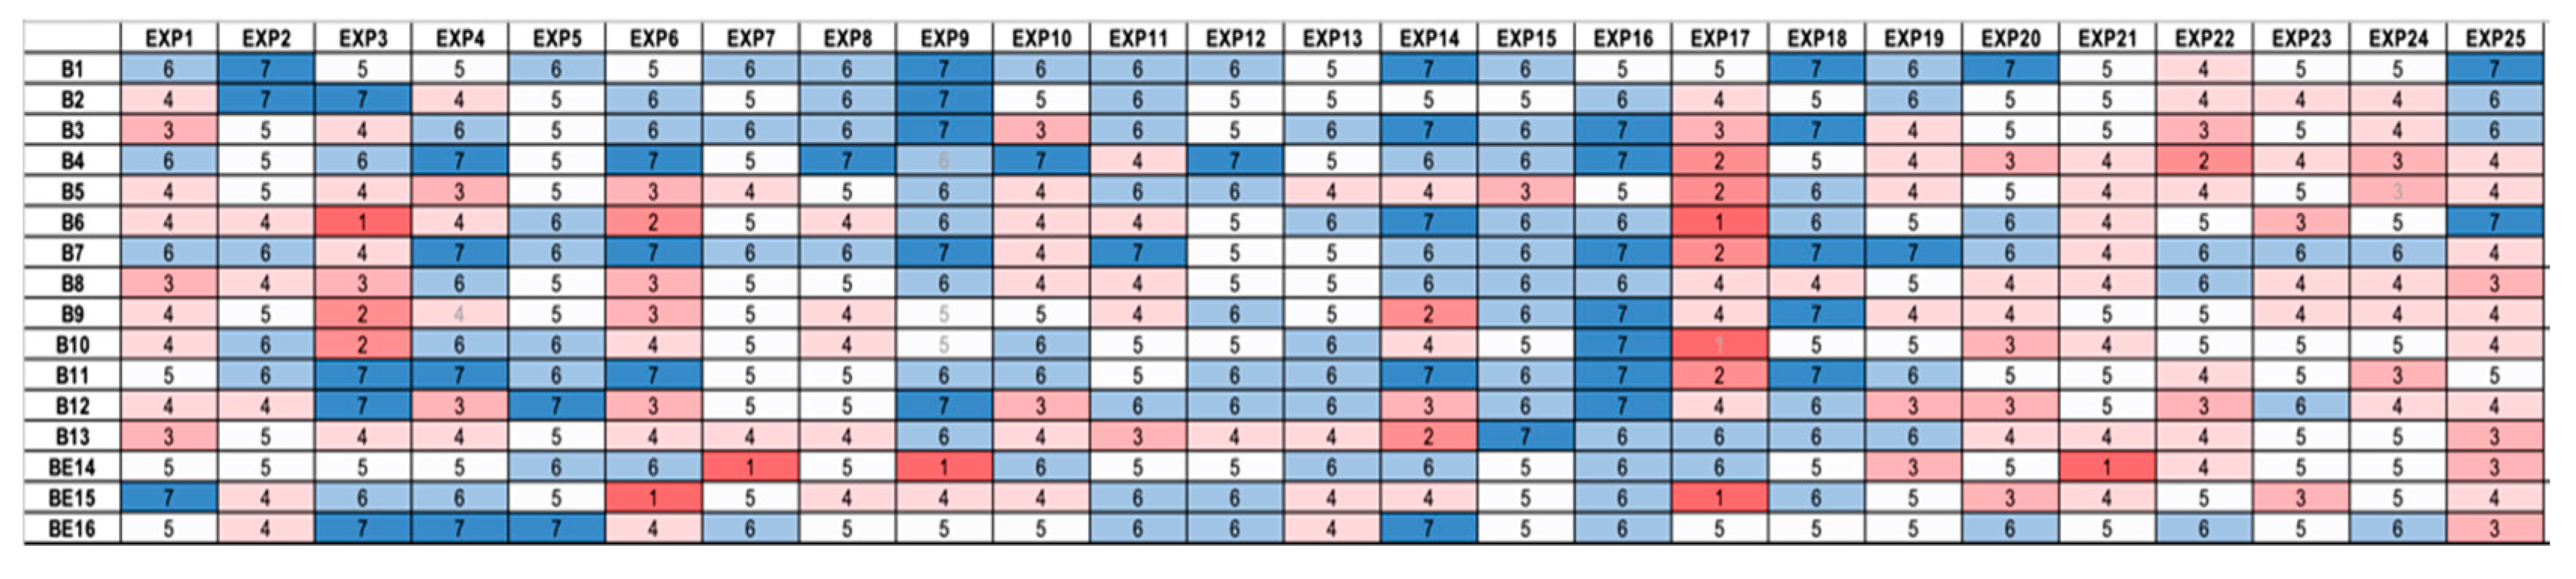
4.1. Consensual Rating of Verbal Scales
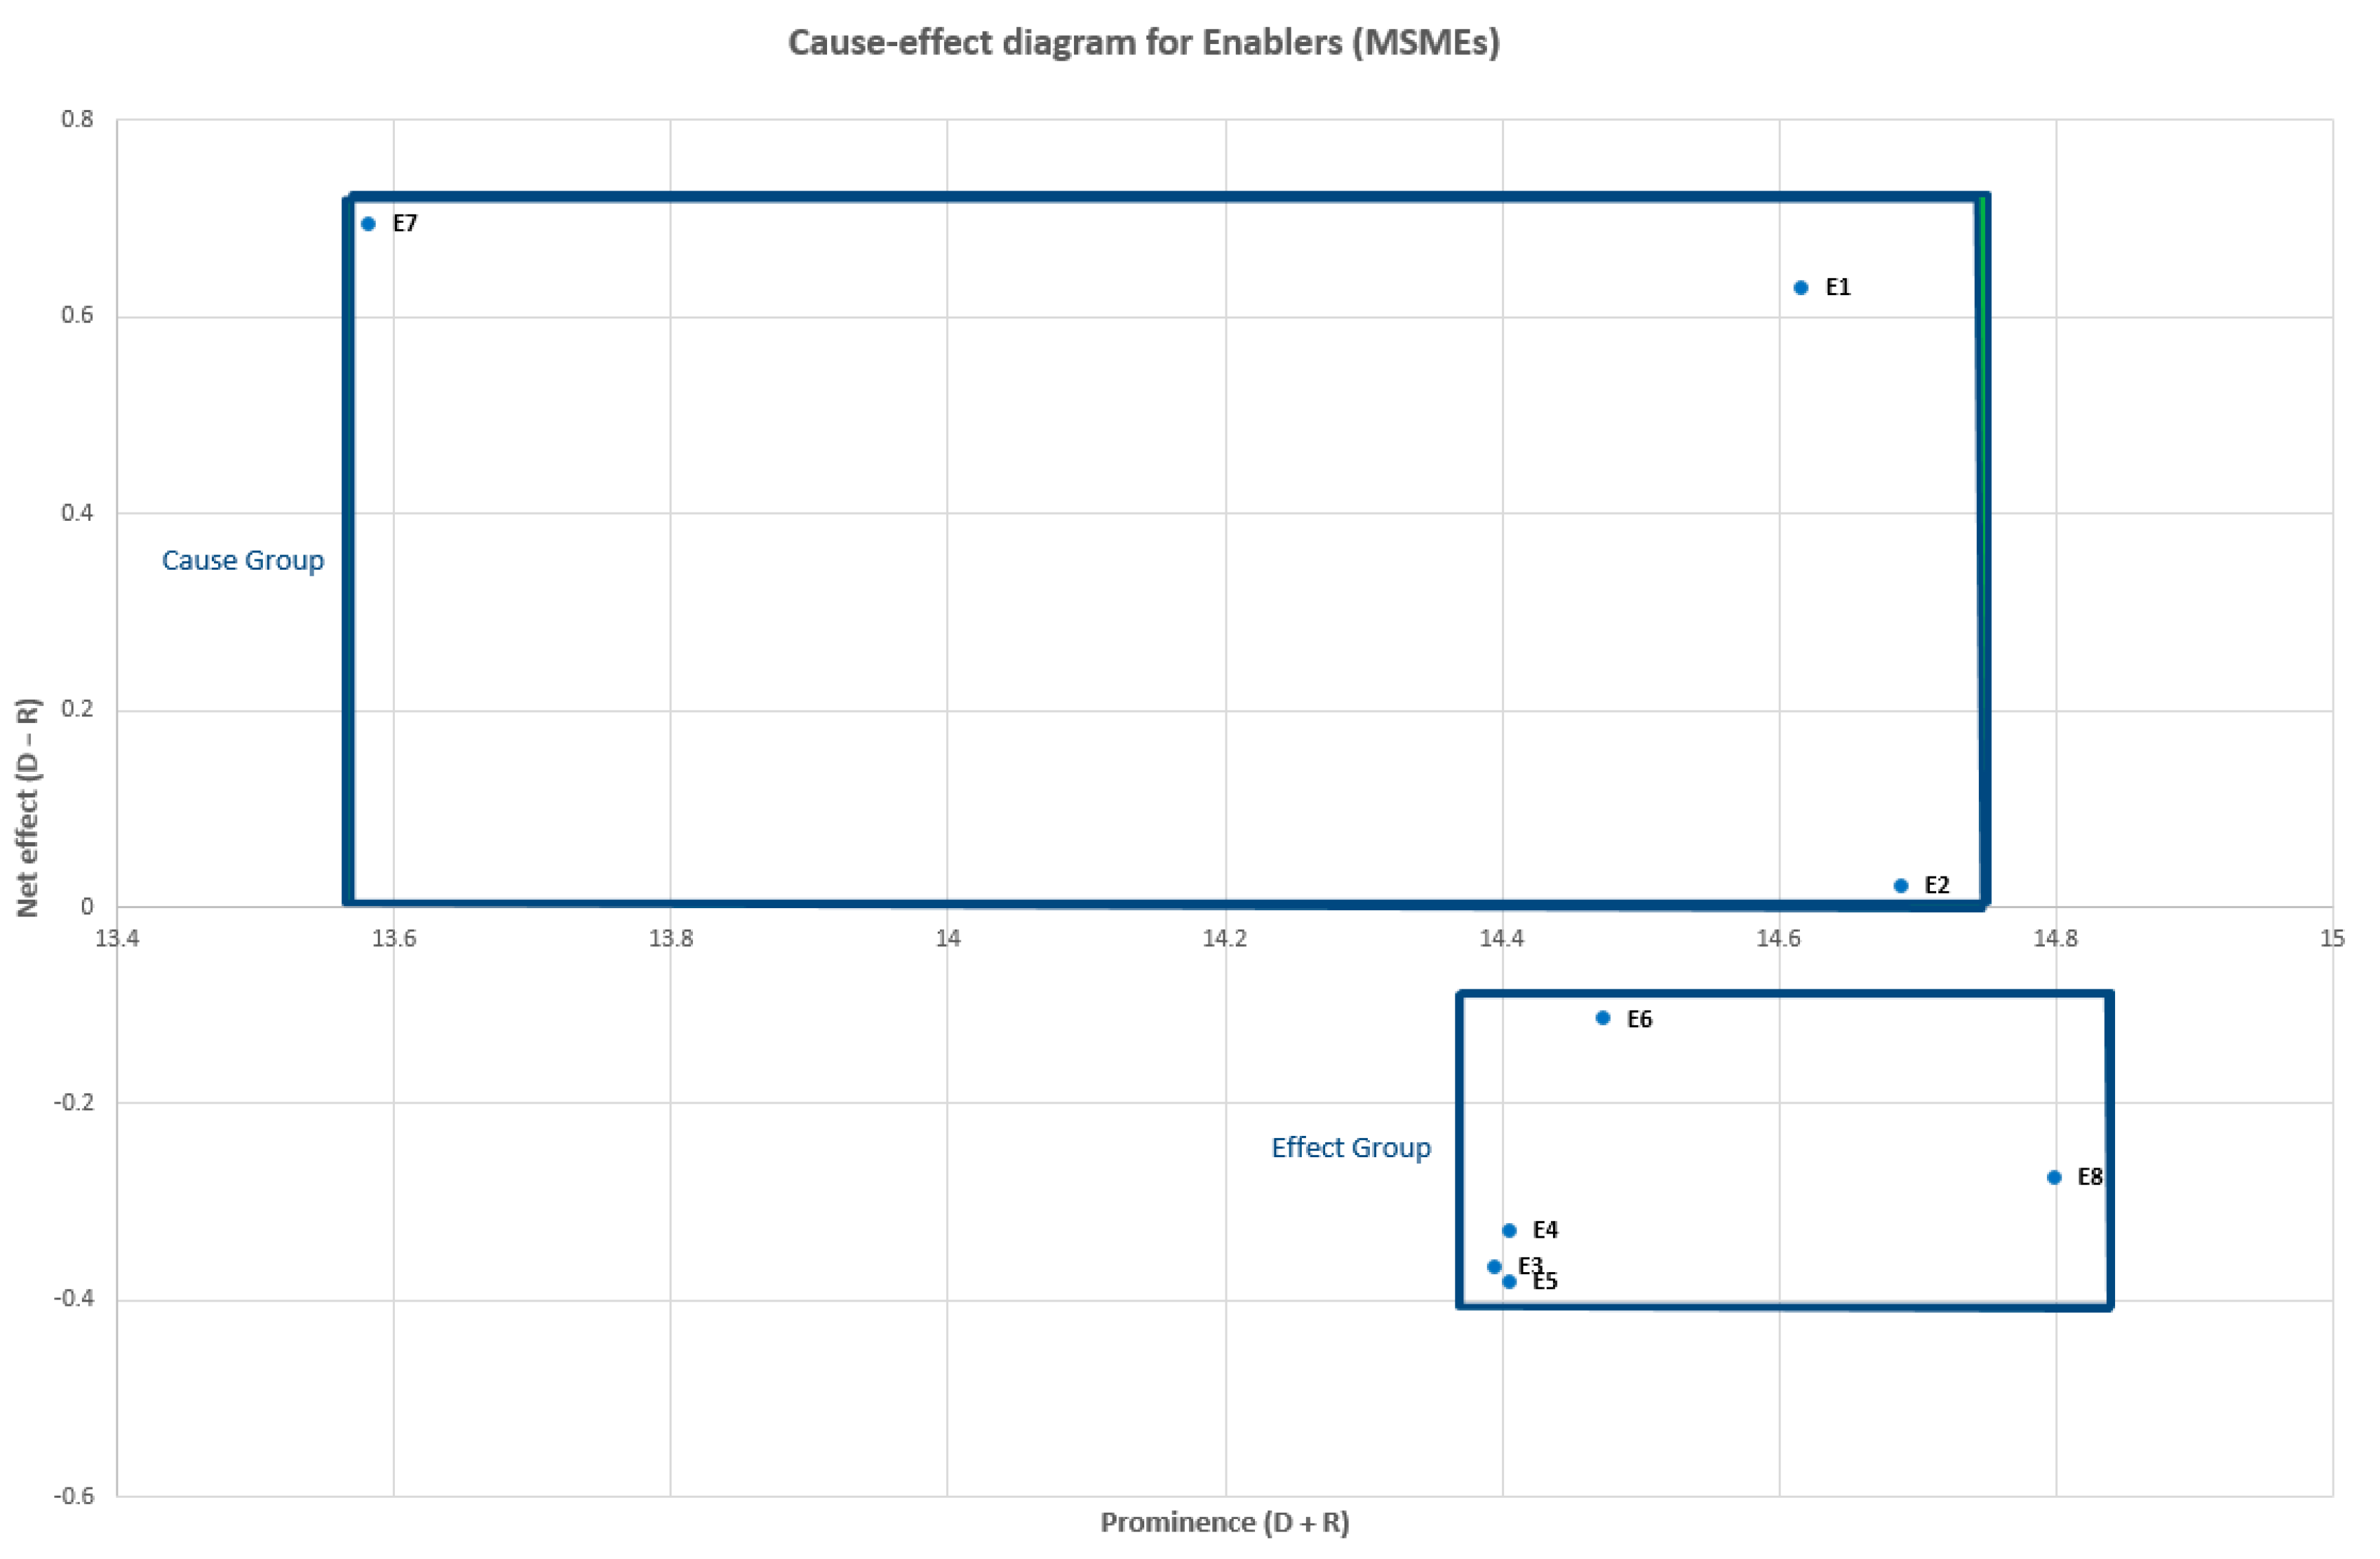
4.2. Prominence (D + R), Importance (D − R), and DEMATEL Map Discussion
5. Conclusions and Future Research
Author Contributions
Funding
Institutional Review Board Statement
Informed Consent Statement
Acknowledgments
Conflicts of Interest
Appendix A
- Barrier: Resistant force that makes it difficult to carry out activities [55].
- Enabler: Also characterized as an inducer, a critical success factor. Critical success factors can be understood as organizational actions necessary to ensure success and competitiveness, supporting a company’s organizational change processes [59].
- Industry 4.0 (I4.0): Trend towards digitization and automation of the manufacturing environment [60], confluence of technologies from a variety of digital technologies [61], new stage or paradigm of industrial production, focusing on the results of transformation process [62]. It aims to link disruptive technologies to manufacturing systems, combining intelligent operations and supply chain management (OSCM) [1].
- I4.0 Technologies: IoT (Internet of Things); CPS (Cyber Physical Systems); BDA (Big Data Analytics); Cybersecurity; Cloud Computing; AM (Additive Manufacturing)/3DP (3D Printing), AR (Augmented Reality)/VR (Virtual Reality); Advanced Robotics; Blockchain.
- Sustainable supply chain: Management of materials, information, and capital flows, as well as cooperation between companies along the supply chain, having goals from all three dimensions of sustainable development (economic, environmental, and social) [63].
- Developing countries: Very heterogeneous concept, the designations “developed” and “developing” are intended for statistical convenience and do not necessarily express a judgment about the stage reached by a particular country or region in the development process. Generally speaking, there are countries with a Human Development Index (HDI) between 0.555 and 0.799 [64,65,66].
- Micro enterprise: Annual turnover equal to or less than R$360,000.00 (US$72,000.00—parity US$ 1 = R$5), also characterized as companies with up to 9 (nine) employees [67].
- Small company: Annual revenue equal to or less than R$4,800,000.00 and more than R$360,000.00 (less than US$ 960,000.00 and more than US$72,000.00—parity US$ 1 = R$5), also characterized as companies with 10 to 49 employees (services and commerce) and between 20 and 99 employees (industry) [67].
- Medium company: Annual turnover equal to or less than R$ 20,000,000.00 and greater than R$4,800,000.00 (less than US$ 5,000,000.00 and more than US$960,000.00—parity US$1 = R$5) also characterized as companies with 50 to 99 employees (services and commerce) and between 100 and 499 employees (industry) [67].
- Do you accept to participate as a volunteer in this research?
- Please enter your e-mail address if you would like to receive the survey results: _______________________
- What is your accumulated time (in years) of experience with or in MSMEs?_________
- What size of company is your accumulated experience with or in MSMEs?
- What is your knowledge/experience with I4.0 technologies?
- What is your knowledge/experience with sustainability in supply chains?
- Cybersecurity issues
- Cost of improvement & OSCM economic condition
- Lack of support from regulatory authority/poor legislation
- Lack of commitment from top management
- Interoperability issues
- Employability
- Lack of technical expertise
- Alternative resources and energy needs
- Design challenges to reuse and recovery products
- Organizational barriers, Capacity constraints
- Resistance to change/change management practices and adopting innovation for society
- Data management and storage issues
- Inequalities of opportunities and digitalization risks
- Internal innovation process
- Open innovation
- Change management
- Dynamic capabilities
- Innovative business models and service design
- Customer and supplier integration
- Support of unconventional partners
- Governmental and institutional pressures
- Collaborative networks
- Innovative business models and service design techniques
- Re-designing and decentralized structure
- Strategic alignment
- I4.0 readiness
- Adoption of smart factory components
- Data-centered solutions
- Consistent data flow
- Modular design
- Information transparency and data security
- Sustainable philosophy
- Focus on renewable natural resources
- Interdisciplinary and holistic integration
- Sharing economy
- Life cycle thinking and circular processes
- Knowledge sharing
- Effective communication
- Individual incentive schemes
- Employee’s empowerment
- Experimentation
- Education and training focused on soft and technical skills
- Transformational leadership
- Top management commitment)
Appendix B
- Do you accept to participate as a volunteer in this research complement?
- Cultural aspects
- Sub-utilization of academic knowledge/universities
- Lack of investment in R&D
- (a)
- Is it really a BARRIER for the implementation of Industry 4.0 technologies (I4.0) in sustainable supply chains of micro, small and medium enterprises (MSMEs)?
- (b)
- Indicate the degree of importance of each extra barrier for MSMEs?
- Do you consider ‘Cultural aspects/characteristics’ a barrier to the implementation of Industry 4.0 (I4.0) technologies in sustainable supply chains for micro, small and medium enterprises (MSMEs)?
- If you consider ‘Cultural aspects’ a barrier, please indicate how important it is to MSMEs. NOTE: If you don’t CONSIDER (marked ‘NO’ in the previous question, mark the option NONE):
- Do you consider ‘Sub-utilization of academic knowledge/universities’ a barrier to the implementation of Industry 4.0 (I4.0) technologies in sustainable supply chains of micro, small and medium-sized companies (MSMEs)?
- If you consider ‘Sub-utilization of academic knowledge/universities’ a barrier, please indicate how important it is to MSMEs. NOTE: If ‘NO’ CONSIDERS (you checked no in the previous question, check the option NONE):
- Do you consider ‘Lack of investment in R&D (Lack of investment in R&D)’ a barrier to the implementation of Industry 4.0 (I4.0) technologies in sustainable supply chains of micro, small and medium enterprises (MSMEs)?
- If you consider ‘Lack of investment in R&D (Lack of investment in R&D)’ a barrier, indicate how important it is for MSMEs. NOTE: If you don’t CONSIDER (marked ‘NO’ in the previous question, mark the option NONE):
- Better management of Certifications, Standards and Regulations
- Valuing R&D/Research Centers
- (a)
- Is it really an ENABLER for the implementation of Industry 4.0 technologies (I4.0) in sustainable supply chains of micro, small and medium enterprises (MSMEs)?
- (b)
- Indicate the degree of importance of each extra facilitator to MSMEs?
- Do you consider ‘Better Management of Certifications, Standards and Regulations’ an enabler for the implementation of Industry 4.0 (I4.0) technologies in sustainable supply chains of micro, small and medium enterprises (MPMEs)?
- If you consider ‘Better Management of Certifications, Standards and Regulations’ an enabler, please indicate how important it is to MSMEs. NOTE: If you don’t CONSIDER (marked ‘NO’ in the previous question, mark the option NONE):
- Do you consider ‘Valuing R&D/Research Centers’ an enabler for the implementation of Industry 4.0 (I4.0) technologies in sustainable supply chains of micro, small and medium enterprises (MSMEs)?
- If you consider ‘Valuing R&D/Research Centers’ an enabler, please indicate how important it is to MSMEs. NOTE: If you don’t CONSIDER (marked ‘NO’ in the previous question, mark the option NONE):
Appendix C
Appendix D


References
- Caiado, R.; Scavarda, L.F.; Gavião, L.O.; Ivson, P.; Nascimento, D.L.D.M.; Garza-Reyes, J.A. A fuzzy rule-based industry 4.0 maturity model for operations and supply chain management. Int. J. Prod. Econ. 2021, 231, 107883. [Google Scholar] [CrossRef]
- Elkington, J. Towards the Sustainable Corporation: Win-Win-Win Business Strategies for Sustainable Development. Calif. Manag. Rev. 1994, 36, 90–100. [Google Scholar] [CrossRef]
- Magon, R.B.; Thomé, A.M.T.; Ferrer, A.L.C.; Scavarda, L.F. Sustainability and performance in operations management research. J. Clean. Prod. 2018, 190, 104–117. [Google Scholar] [CrossRef]
- Daú, G.; Scavarda, A.; Scavarda, L.F.; Portugal, V.J.T. The Healthcare Sustainable Supply Chain 4.0: The Circular Economy Transition Conceptual Framework with the Corporate Social Responsibility Mirror. Sustainability 2019, 11, 3259. [Google Scholar] [CrossRef] [Green Version]
- De, D.; Chowdhury, S.; Dey, P.K.; Ghosh, S.K. Impact of Lean and Sustainability Oriented Innovation on Sustainability Performance of Small and Medium Sized Enterprises: A Data Envelopment Analysis-based framework. Int. J. Prod. Econ. 2020, 219, 416–430. [Google Scholar] [CrossRef]
- Silvestre, B.S.; Silva, M.E.; Cormack, A.; Thomé, A.M.T. Supply chain sustainability trajectories: Learning through sustainability initiatives. Int. J. Oper. Prod. Manag. 2020, 40, 1301–1337. [Google Scholar] [CrossRef]
- Bonn, I.; Fisher, J. Sustainability: The missing ingredient in strategy. J. Bus. Strat. 2011, 32, 5–14. [Google Scholar] [CrossRef]
- Nascimento, D.L.M.; Alencastro, V.; Quelhas, O.L.G.; Caiado, R.G.G.; Garza-Reyes, J.A.; Rocha-Lona, L.; Tortorella, G. Exploring Industry 4.0 technologies to enable circular economy practices in a manufacturing context: A business model proposa. J. Manuf. Technol. Manag. 2019, 30, 607–627. [Google Scholar] [CrossRef]
- Agrawal, V.V.; Atasu, A.; Van Wassenhove, L.N. New Opportunities for Operations Management Research in Sustainability. Manuf. Serv. Oper. Manag. 2019, 21, 1–12. [Google Scholar] [CrossRef]
- Azevedo, B.D.; Scavarda, L.F.; Caiado, R.G.G.; Fuss, M. Improving urban household solid waste management in developing countries based on the German experience. Waste Manag. 2021, 120, 772–783. [Google Scholar] [CrossRef]
- Scavarda, A.; Daú, G.; Scavarda, L.F.; Caiado, R.G.G. An Analysis of the Corporate Social Responsibility and the Industry 4.0 with Focus on the Youth Generation: A Sustainable Human Resource Management Framework. Sustainability 2019, 11, 5130. [Google Scholar] [CrossRef] [Green Version]
- Scavarda, A.; Daú, G.; Scavarda, L.F.; Azevedo, B.D.; Korzenowski, A.L. Social and ecological approaches in urban interfaces: A sharing economy management framework. Sci. Total. Environ. 2020, 713, 134407. [Google Scholar] [CrossRef]
- Gupta, H.; Kusi-Sarpong, S.; Rezaei, J. Barriers and overcoming strategies to supply chain sustainability innovation. Resour. Conserv. Recycl. 2020, 161, 104819. [Google Scholar] [CrossRef]
- Fawcett, S.E.; Magnan, G.M.; McCarter, M.W. Benefits, barriers, and bridges to effective supply chain management. Supply Chain Manag. Int. J. 2008, 13, 35–48. [Google Scholar] [CrossRef] [Green Version]
- Birkel, H.S.; Veile, J.W.; Müller, J.M.; Hartmann, E.; Voigt, K.-I. Development of a Risk Framework for Industry 4.0 in the Context of Sustainability for Established Manufacturers. Sustainability 2019, 11, 384. [Google Scholar] [CrossRef] [Green Version]
- Khanzode, A.; Sarma, P.; Mangla, S.K.; Yuan, H. Modeling the Industry 4.0 adoption for sustainable production in Micro, Small & Medium Enterprises. J. Clean. Prod. 2021, 279, 123489. [Google Scholar] [CrossRef]
- Mue, N.E.; Mulongo, N.Y.; Kholopane, P.A. Analysis of the status-quo of industrial 4.0 in the SMMEs: A critical review. IEOM Society International. In Proceedings of the International Conference on Industrial Engineering and Operations Management, Washington, DC, USA, 27–29 September 2018. [Google Scholar]
- Müller, J.M.; Voigt, K.-I. Sustainable Industrial Value Creation in SMEs: A Comparison between Industry 4.0 and Made in China 2025. Int. J. Precis. Eng. Manuf. Technol. 2018, 5, 659–670. [Google Scholar] [CrossRef] [Green Version]
- Jové-Llopis, E.; Segarra-Blasco, A. Eco-Efficiency Actions and Firm Growth in European SMEs. Sustainability 2018, 10, 281. [Google Scholar] [CrossRef] [Green Version]
- Martínez-Olvera, C.; Mora-Vargas, J. A Comprehensive Framework for the Analysis of Industry 4.0 Value Domains. Sustainability 2019, 11, 2960. [Google Scholar] [CrossRef] [Green Version]
- Urban, B.; Naidoo, R. Business sustainability: Empirical evidence on operational skills in SMEs in South Africa. J. Small Bus. Enterp. Dev. 2012, 19, 146–163. [Google Scholar] [CrossRef]
- Luthra, S.; Kumar, A.; Zavadskas, E.K.; Mangla, S.K.; Garza-Reyes, J.A. Industry 4.0 as an enabler of sustainability diffusion in supply chain: An analysis of influential strength of drivers in an emerging economy. Int. J. Prod. Res. 2020, 58, 1505–1521. [Google Scholar] [CrossRef]
- Jamwal, A.; Agrawal, R.; Sharma, M.; Kumar, V.; Kumar, S. Developing A sustainability framework for Industry 4.0. Sci. Direct Procedia CIRP 2021, 98, 430–435. [Google Scholar] [CrossRef]
- Yazdi, P.G.; Azizi, A.; Hashemipour, M. A Hybrid Methodology for Validation of Optimization Solutions Effects on Manufacturing Sustainability with Time Study and Simulation Approach for SMEs. Sustainability 2019, 11, 1454. [Google Scholar] [CrossRef] [Green Version]
- Bag, S.; Telukdarie, A.; Pretorius, J.H.C.; Gupta, S. Industry 4.0 and supply chain sustainability: Framework and future research directions. Benchmark. Int. J. 2018, 28, 1410–1450. [Google Scholar] [CrossRef]
- Michna, A.; Kmieciak, R. Open-Mindedness Culture, Knowledge-Sharing, Financial Performance, and Industry 4.0 in SMEs. Sustainability 2020, 12, 9041. [Google Scholar] [CrossRef]
- Creswell, J.W.; Creswell, J.D. Research Design: Qualitative, Quantitative, and Mixed Methods Approaches, 5th ed.; SAGE: Los Angeles, CA, USA, 2018. [Google Scholar]
- Arksey, H.; O’Malley, L. Scoping studies: Towards a methodological framework. Int. J. Soc. Res. Methodol. 2005, 8, 19–32. [Google Scholar] [CrossRef] [Green Version]
- Peters, M.D.J.; Godfrey, C.M.; Khalil, H.; McInerney, P.; Parker, D.; Soares, C.B. Guidance for conducting systematic scoping reviews. Int. J. Evid. Based Healthc. 2015, 13, 141–146. [Google Scholar] [CrossRef] [Green Version]
- Munn, Z.; Peters, M.D.J.; Stern, C.; Tufanaru, C.; McArthur, A.; Aromataris, E. Systematic review or scoping review? Guidance for authors when choosing between a systematic or scoping review approach. BMC Med. Res. Methodol. 2018, 18, 143. [Google Scholar] [CrossRef]
- Saroha, M.; Garg, D.; Luthra, S. Identification and analysis of circular supply chain management practices for sustainability: A fuzzy-DEMATEL approach. Int. J. Prod. Perform. Manag. 2021. [Google Scholar] [CrossRef]
- Thomé, A.M.T.; Scavarda, L.F.; Scavarda, A.J. Conducting systematic literature review in operations management. Prod. Plan. Control. 2016, 27, 408–420. [Google Scholar] [CrossRef]
- Thomé, A.M.T.; Ceryno, P.S.; Scavarda, A.; Remmen, A. Sustainable infrastructure: A review and a research agenda. J. Environ. Manag. 2016, 184, 143–156. [Google Scholar] [CrossRef] [PubMed]
- Mongeon, P.; Paul-Hus, A. The journal coverage of Web of Science and Scopus: A comparative analysis. Scientometrics 2016, 106, 213–228. [Google Scholar] [CrossRef]
- Kreuter, T.; Scavarda, L.F.; Thomé, A.M.T.; Hellingrath, B.; Seeling, M.X. Empirical and theoretical perspectives in sales and operations planning. Rev. Manag. Sci. 2021. [Google Scholar] [CrossRef]
- Moher, D.; Liberati, A.; Tetzlaff, J.; Altman, D.G. PRISMA Group. Preferred Reporting Items for Systematic Reviews and Meta-Analyses: The PRISMA Statement. Ann. Intern. Med. 2009, 151, 264–269. [Google Scholar] [CrossRef] [PubMed] [Green Version]
- Page, M.J.; McKenzie, J.E.; Bossuyt, P.M.; Boutron, I.; Hoffmann, T.C.; Mulrow, C.D.; Shamseer, L.; Tetzlaff, J.M.; Akl, E.A.; Brennan, S.E.; et al. The PRISMA 2020 statement: An updated guideline for reporting systematic reviews. BMJ 2021. [Google Scholar] [CrossRef]
- Ceryno, P.; Scavarda, L.F.; Klingebiel, K.; Yuzgulec, G. Supply Chain Risk Management: A Content Analysis Approach. International J. Ind. Eng. Manag. 2013, 4, 141–150. Available online: www.iim.ftn.uns.ac.rs/ijiem_journal.php (accessed on 1 May 2021).
- Flynn, B.B.; Sakakibara, S.; Schroeder, R.G.; Bates, K.A.; Flynn, E. Empirical research methods in operations management. J. Oper. Manag. 1990, 9, 250–284. [Google Scholar] [CrossRef]
- Jassbi, J.; Mohamadnejad, F.; Nasrollahzadeh, H. A Fuzzy DEMATEL framework for modeling cause and effect relationships of strategy map. Expert Syst. Appl. 2011, 38, 5967–5973. [Google Scholar] [CrossRef]
- Azevedo, B.D.; Scavarda, L.F.; Caiado, R. Urban solid waste management in developing countries from the sustainable supply chain management perspective: A case study of Brazil’s largest slum. J. Clean. Prod. 2019, 233, 1377–1386. [Google Scholar] [CrossRef]
- Kull, T.J.; Kotlar, J.; Spring, M. Small and Medium Enterprise Research in Supply Chain Management: The Case for Single-Respondent Research Designs. J. Supply Chain Manag. 2018, 54, 23–34. [Google Scholar] [CrossRef]
- Flynn, B.; Pagell, M.; Fugate, B. Survey Research Design in Supply Chain Management: The Need for Evolution in Our Expectations. J. Supply Chain Manag. 2018, 54, 1–15. [Google Scholar] [CrossRef] [Green Version]
- Nemoto, T.; Beglar, D. Developing Likert-scale questionnaires. In JALT2013 Conference Proceedings, Hyogo, Japan, 25–29 October 2013; Sonda, N., Krause, A., Eds.; JALT: Tokyo, Japan, 2014. [Google Scholar]
- Massey, O.T. A proposed model for the analysis and interpretation of focus groups in evaluation research. Evaluation Program Plan. 2011, 34, 21–28. [Google Scholar] [CrossRef]
- Stokes, D.; Bergin, R. Methodology or “methodolatry”? An evaluation of focus groups and depth interviews. Qual. Mark. Res. 2006, 9, 26–37. [Google Scholar] [CrossRef] [Green Version]
- Han, Y.; Deng, Y. An enhanced fuzzy evidential DEMATEL method with its application to identify critical success factors. Soft Comput. 2018, 22, 5073–5090. [Google Scholar] [CrossRef]
- Lin, C.J.; Wu, W.W. A fuzzy extension of the DEMATEL method for group decision making. Eur. J. Oper. Res. 2004, 156. [Google Scholar]
- Bhatia, M.S.; Jakhar, S.K.; Mangla, S.K.; Gangwani, K.K. Critical factors to environment management in a closed loop supply chain. J. Clean. Prod. 2020, 225, 120239. [Google Scholar] [CrossRef]
- Zadeh, L. Fuzzy sets. Inf. Control. 1965, 8, 338–353. [Google Scholar] [CrossRef] [Green Version]
- Haleem, A.; Khan, S.; Khan, M.I. Traceability implementation in food supply chain: A grey-DEMATEL approach. Inf. Process. Agric. 2019, 6, 335–348. [Google Scholar] [CrossRef]
- Sufiyan, M.; Haleem, A.; Khan, S.; Khan, M.I. Evaluating food supply chain performance using hybrid fuzzy MCDM technique. Sustain. Prod. Consum. 2019, 20, 40–57. [Google Scholar] [CrossRef]
- Raj, A.; Dwivedi, G.; Sharma, A.; de Sousa Jabbour, A.B.L.; Rajak, S. Barriers to the adoption of industry 4.0 technologies in the manufacturing sector: An inter-country comparative perspective. Int. J. Prod. Econ. 2020, 224, 107546. [Google Scholar] [CrossRef]
- Khan, S.; Haleem, A. Strategies to Implement Circular Economy Practices: A Fuzzy DEMATEL Approach. J. Ind. Integr. Manag. 2020, 5, 253–269. [Google Scholar] [CrossRef]
- Kouhizadeh, M.; Saberi, S.; Sarkis, J. Blockchain technology and the sustainable supply chain: Theoretically exploring adoption barriers. Int. J. Prod. Econ. 2021, 231, 107831. [Google Scholar] [CrossRef]
- Mamikhani, J.; Tofighi, S.; Sadeghifar, J.; Heydari, M.; Jenab, V.H. Prioritizing the Compensation Mechanisms for Nurses Working in Emergency Department of Hospital Using Fuzzy DEMATEL Technique: A Survey from Iran. Glob. J. Health Sci. 2014, 6, 86–93. [Google Scholar] [CrossRef]
- Bai, C.; Sarkis, J. A grey-based DEMATEL model for evaluating business process management critical success factors. Int. J. Prod. Econ. 2013, 146, 281–292. [Google Scholar] [CrossRef]
- Sousa, R.; Voss, C.A. Contingency research in operations management practices. J. Oper. Manag. 2008, 26, 697–713. [Google Scholar] [CrossRef] [Green Version]
- Rockart, J.F. Chief executives define their own data needs. Harv. Bus. Rev. 1979, 57, 81–93. [Google Scholar] [PubMed]
- Oesterreich, T.D.; Teuteberg, F. Understanding the implications of digitisation and automation in the context of Industry 4.0: A triangulation approach and elements of a research agenda for the construction industry. Comput. Ind. 2016, 83, 121–139. [Google Scholar] [CrossRef]
- Koh, L.; Orzes, G.; Jia, F.J. The fourth industrial revolution (Industry 4.0): Technologies disruption on operations and supply chain management. Int. J. Oper. Prod. Manag. 2019, 39, 817–828. [Google Scholar] [CrossRef]
- Weking, J.; Stöcker, M.; Kowalkiewicz, M.; Böhm, M.; Krcmar, H. Leveraging industry 4.0—A business model pattern framework. Int. J. Prod. Econ. 2020, 25, 107588. [Google Scholar] [CrossRef]
- Seuring, S.; Müller, M. From a literature review to a conceptual framework for sustainable supply chain management. J. Clean. Prod. 2008, 16, 1699–1710. [Google Scholar] [CrossRef]
- The World Bank. How Does the World Bank Classify Countries? Available online: https://datahelpdesk.worldbank.org/knowledgebase/articles/378834-how-does-the-world-bank-classify-countries (accessed on 1 May 2021).
- United Nations Development Programme. Human Development Reports. 2020. Available online: http://hdr.undp.org/en (accessed on 1 May 2021).
- United Nations. World Economic Situation and Prospects. 2020. Available online: https://unctad.org/system/files/official-document/wesp2020_en.pdf (accessed on 1 May 2021).
- Sebrae. Confira as Diferenças Entre Micro Empresa, Pequena Empresa e MEI. Available online: https://www.sebrae.com.br/sites/PortalSebrae/artigos/entenda-as-diferencas-entre-microempresa-pequena-empresa-e-mei,03f5438af1c92410VgnVCM100000b272010aRCRD (accessed on 1 May 2021).
- Fu, X.; Zhu, Q.; Sarkis, J. Evaluating green supplier development programs at a telecommunications systems provider. Int. J. Prod. Econ. 2012, 140, 357–367. [Google Scholar] [CrossRef]


| Experience | Weights | ||||
|---|---|---|---|---|---|
| SSCM | 33.33% | ||||
| I4.0 | 33.33% | ||||
| MPMEs | 33.33% | ||||
| SSCM | I4.0 | MPMEs | |||
| Level 3 (10+ years) | 3 | Level 3 (6+ years) | 3 | Level 3 (21+ years) | 3 |
| Level 2 (5–9 years) | 2 | Level 2 (3–5 years) | 2 | Level 2 (11–20 years) | 2 |
| Level 1 (up to 4 years) | 1 | Level 1 (up to 2 years) | 1 | Level 1 (up to 10 years) | 1 |
| Linguistic Term | Crisp Value | Fuzzy Number |
|---|---|---|
| Very high influence (VH) | 4 | (0.75, 1.0, 1.00) |
| High influence (H) | 3 | (0.50, 0.75, 1.00) |
| Low influence (L) | 2 | (0.25, 0.50, 0.75) |
| Very low influence (VL) | 1 | (0.00, 0.25, 0.50) |
| No influence (N) | 0 | (0.00, 0.00, 0.25) |
| Barrier (B) or Barrier-Extra (BE) (Total = 16) | Enabler (E) or Enabler-Extra (EE) (Total = 33) |
|---|---|
| B1—Cybersecurity issues/B2—Cost of improvement & OSCM economic condition/B3—Lack of support from regulatory authority/poor legislation/B4—Lack of commitment from top management/B5—Interoperability issues/B6—Employability/B7—Lack of technical expertise/B8—Alternative resources and energy needs/B9—Design challenges to reuse and recovery products/B10—Organizational barriers, Capacity constraints/B11—Resistance to change/change management practices and adopting innovation/for society/B12—Data management and storage issues/B13—Inequalities of opportunities and digitalization risks/BE14—Cultural aspects/BE15—Sub-utilization of academic knowledge/universities/BE16—Lack of investment in R&D | E1—Internal innovation process/E2—Open innovation/E3—Change management/E4—Dynamic capabilities/E5—Innovative business models and service design/E6—Customer and supplier integration/E7—Support of unconventional partners/E8—Governmental and institutional pressures/E9—Collaborative networks/E10 -Innovative business models and service design techniques/E11—Re-designing and decentralized structure/E12—Strategic alignment/E13—I4.0 readiness/E14—Adoption of smart factory solutions/E15—Data-centered solutions/E16—Consistent data flow/E17—Modular design/E18—Information transparency and data security/E19—Sustainable philosophy/E20—Focus on renewable natural resources/E21—Interdisciplinary and holistic integration/E22—Sharing economy/E23—Life cycle thinking and circular processes/E24—Knowledge sharing/E25—Effective communication/E26—Individual incentive schemes/E27—Employee’s empowerment/E28—Experimentation/E29—Education and training focused on soft and technical skills/E30—Transformational leadership/E31—Top management commitment/EE32—Better management of Certifications, Standards and Regulations/EE33—Valuing R&D and Research Centers |
| Classification | Selected | Categories |
|---|---|---|
| B1 | Lack of technical expertise | People |
| B2 | Cybersecurity issues | Technology |
| B3 | Resistance to change/change management practices and adopting innovation for society | Innovation |
| B4 | Lack of investment in R&D | Institutional |
| B5 | Cost of improvement & OSCM economic condition | OSCM related topics |
| B6 | Lack of support from regulatory authority/poor legislation | Legal |
| B7 | Lack of commitment from top management | Organization |
| B8 | Alternative resources and energy needs | Sustainability |
| Classification | Selected | Categories |
|---|---|---|
| E1 | Top management commitment + Strategic alignment | Organization |
| E2 | Employees’ empowerment + Knowledge sharing + Effective communication | People |
| E3 | Internal innovation process | Innovation |
| E4 | Data-centered solutions + Consistent data flow | Technology |
| E5 | Interdisciplinary and holistic integration + Life cycle thinking and circular processes | Sustainability |
| E6 | Customer and supplier integration | OSCM related topics |
| E7 | Governmental and institutional pressures | Legal |
| E8 | Valuing R&D/Research Centers | Institutional |
| Barrier | Di + Ri | Di − Ri | Cause(C)/Effect(E) |
|---|---|---|---|
| B1—Lack of technical expertise | 9.490042 | 0.079289 | C |
| B2—Cybersecurity issues | 9.04908 | −1.515973 | E |
| B3—Resistance to change/change management practices and adopting innovation for society | 9.392564 | −0.040761 | E |
| B4—Lack of investment in R&D | 9.430682 | −0.271205 | E |
| B5—Cost of improvement & OSCM economic condition | 9.956615 | −0.38204 | E |
| B6—Lack of support from regulatory authority/poor legislation | 7.432845 | 0.367826 | C |
| B7—Lack of commitment from top management | 8.840327 | 0.698012 | C |
| B8—Alternative resources and energy needs | 8.327192 | 0.245782 | C |
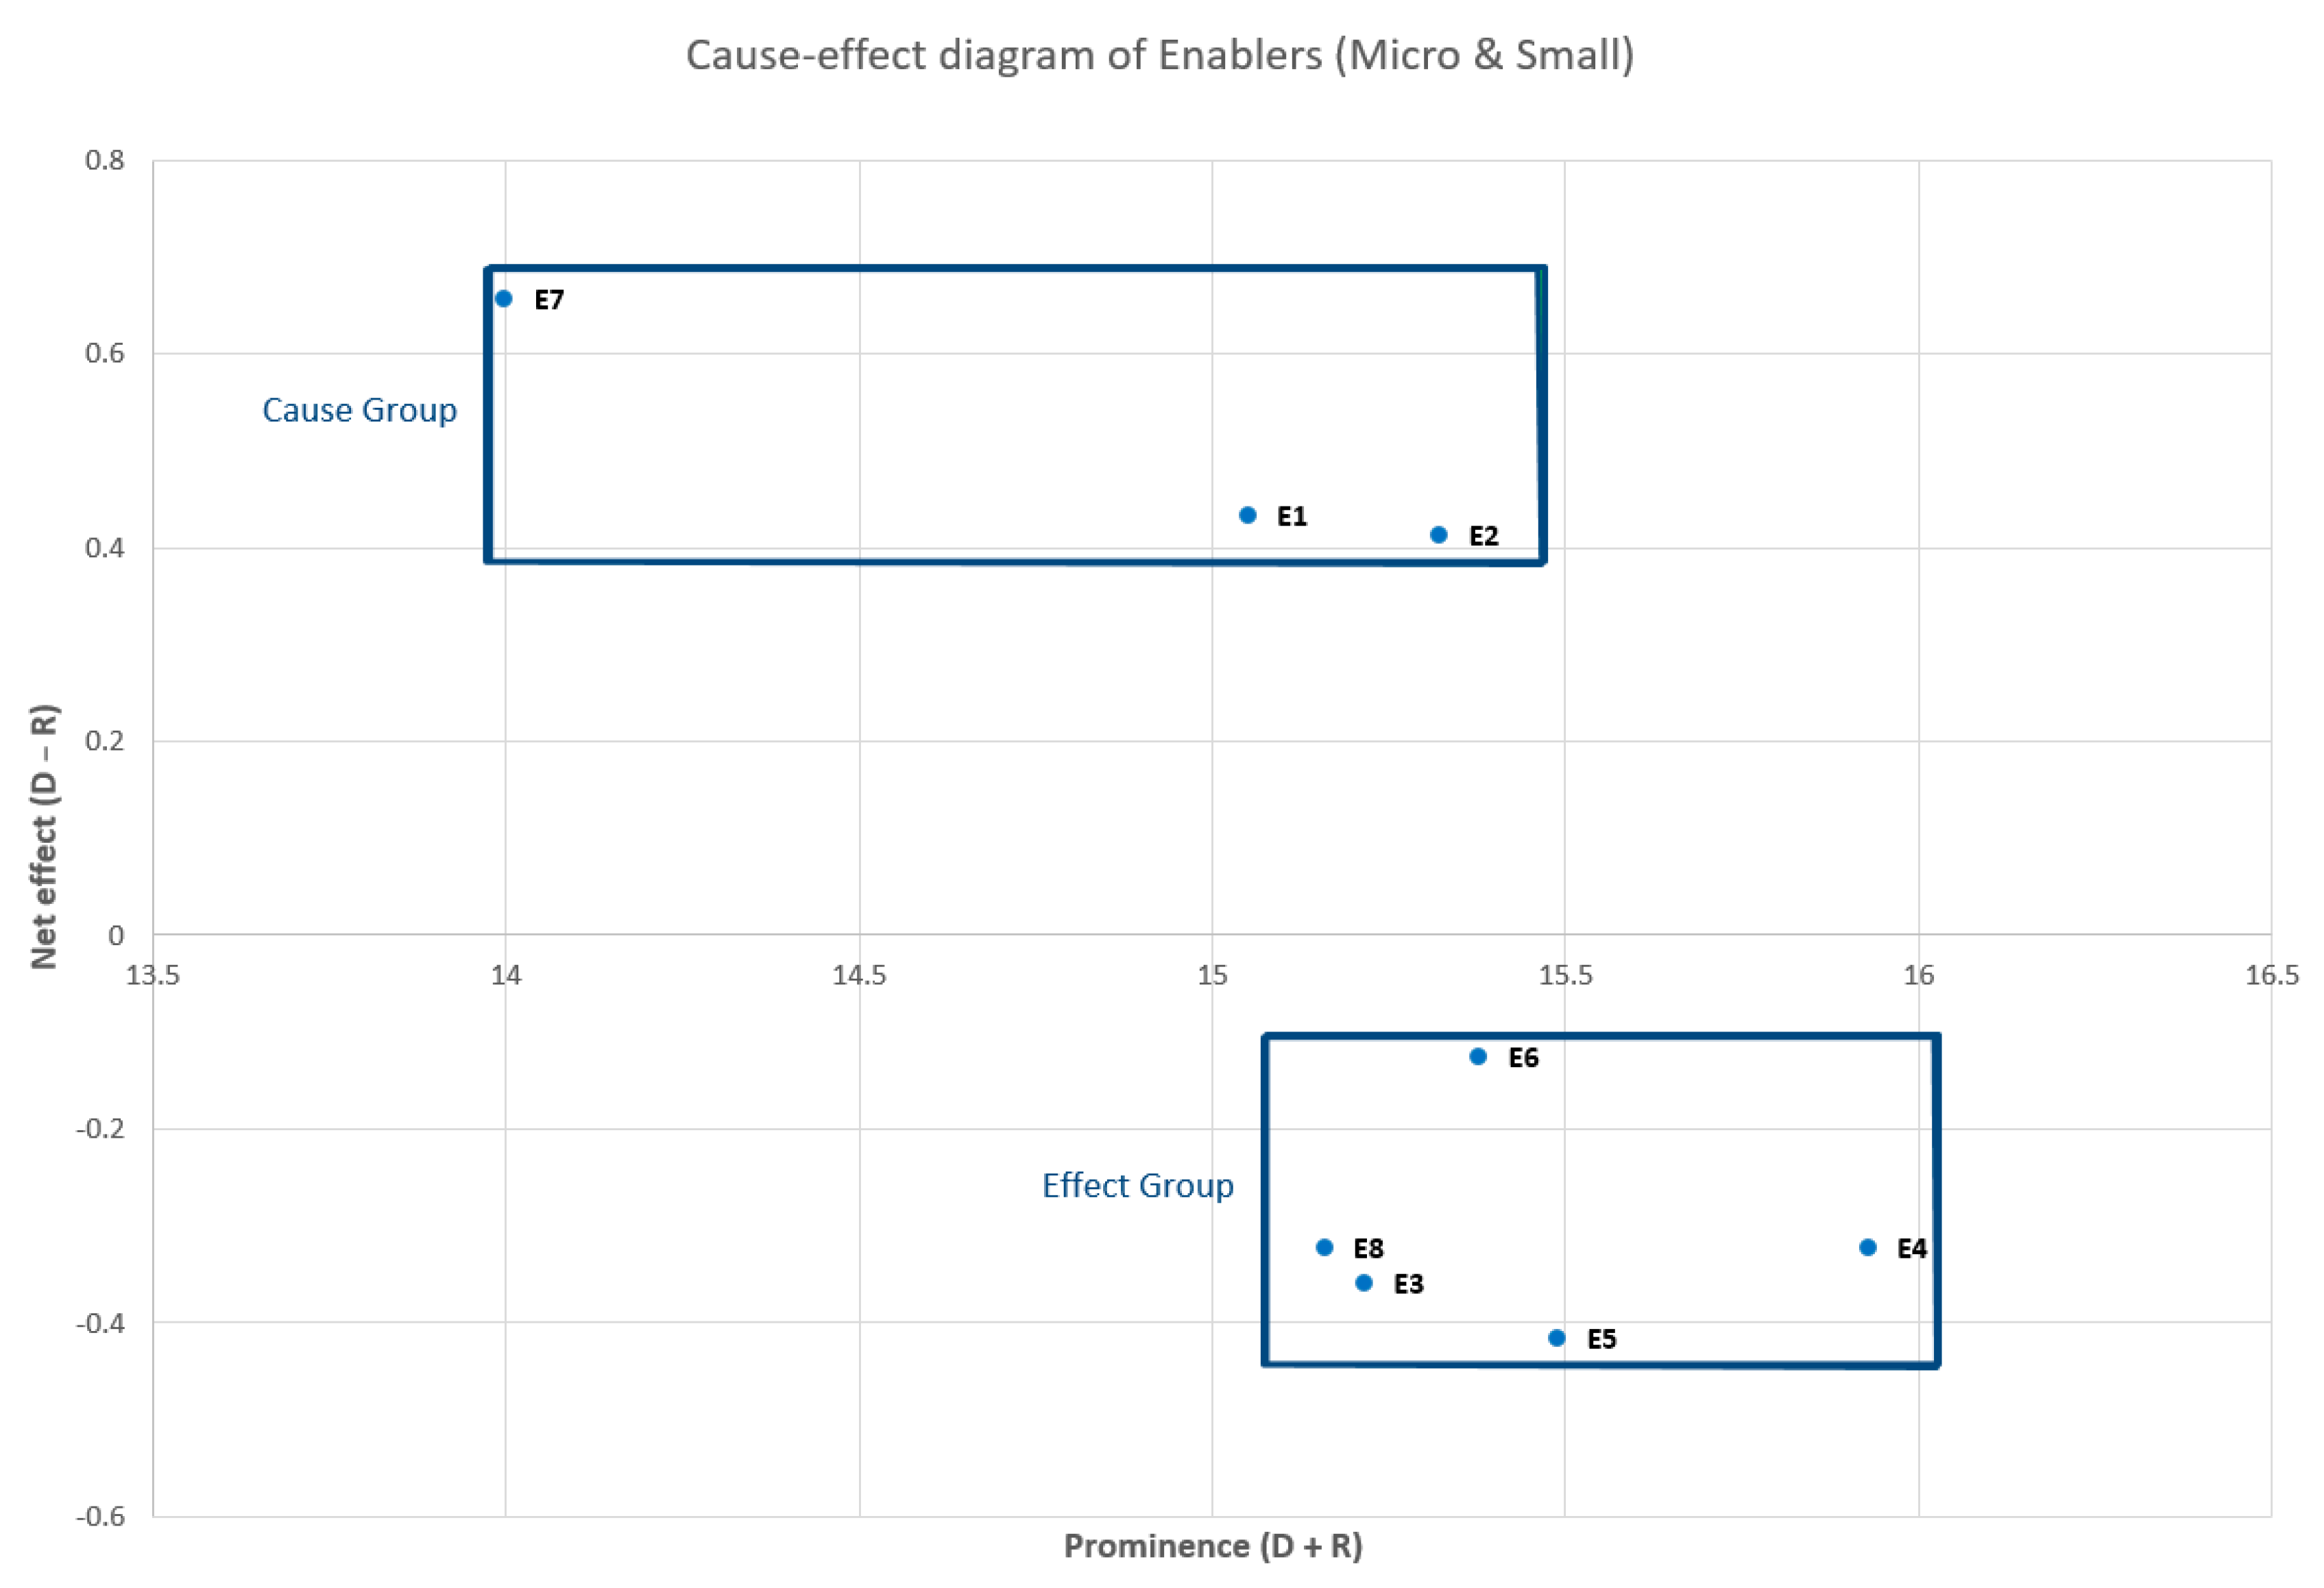
| Enabler | Di + Ri | Di − Ri | Cause(C)/Effect(E) |
|---|---|---|---|
| E1—Top management commitment + Strategic alignment | 15.04984 | 0.43318 | C |
| E2—Employee’s empowerment + Knowledge sharing + Effective communication | 15.3215 | 0.41254 | C |
| E3—Internal innovation process | 15.21509 | −0.359365 | E |
| E4—Data-centered solutions + Consistent data flow | 15.92757 | −0.322837 | E |
| E5—Interdisciplinary and holistic integration + Life cycle thinking and circular processes | 15.48851 | −0.415236 | E |
| E6—Customer and supplier integration | 15.37755 | −0.124541 | E |
| E7—Governmental and institutional pressures | 13.99828 | 0.657049 | C |
| E8—Valuing R&D/Research Centers | 15.15782 | −0.322529 | E |
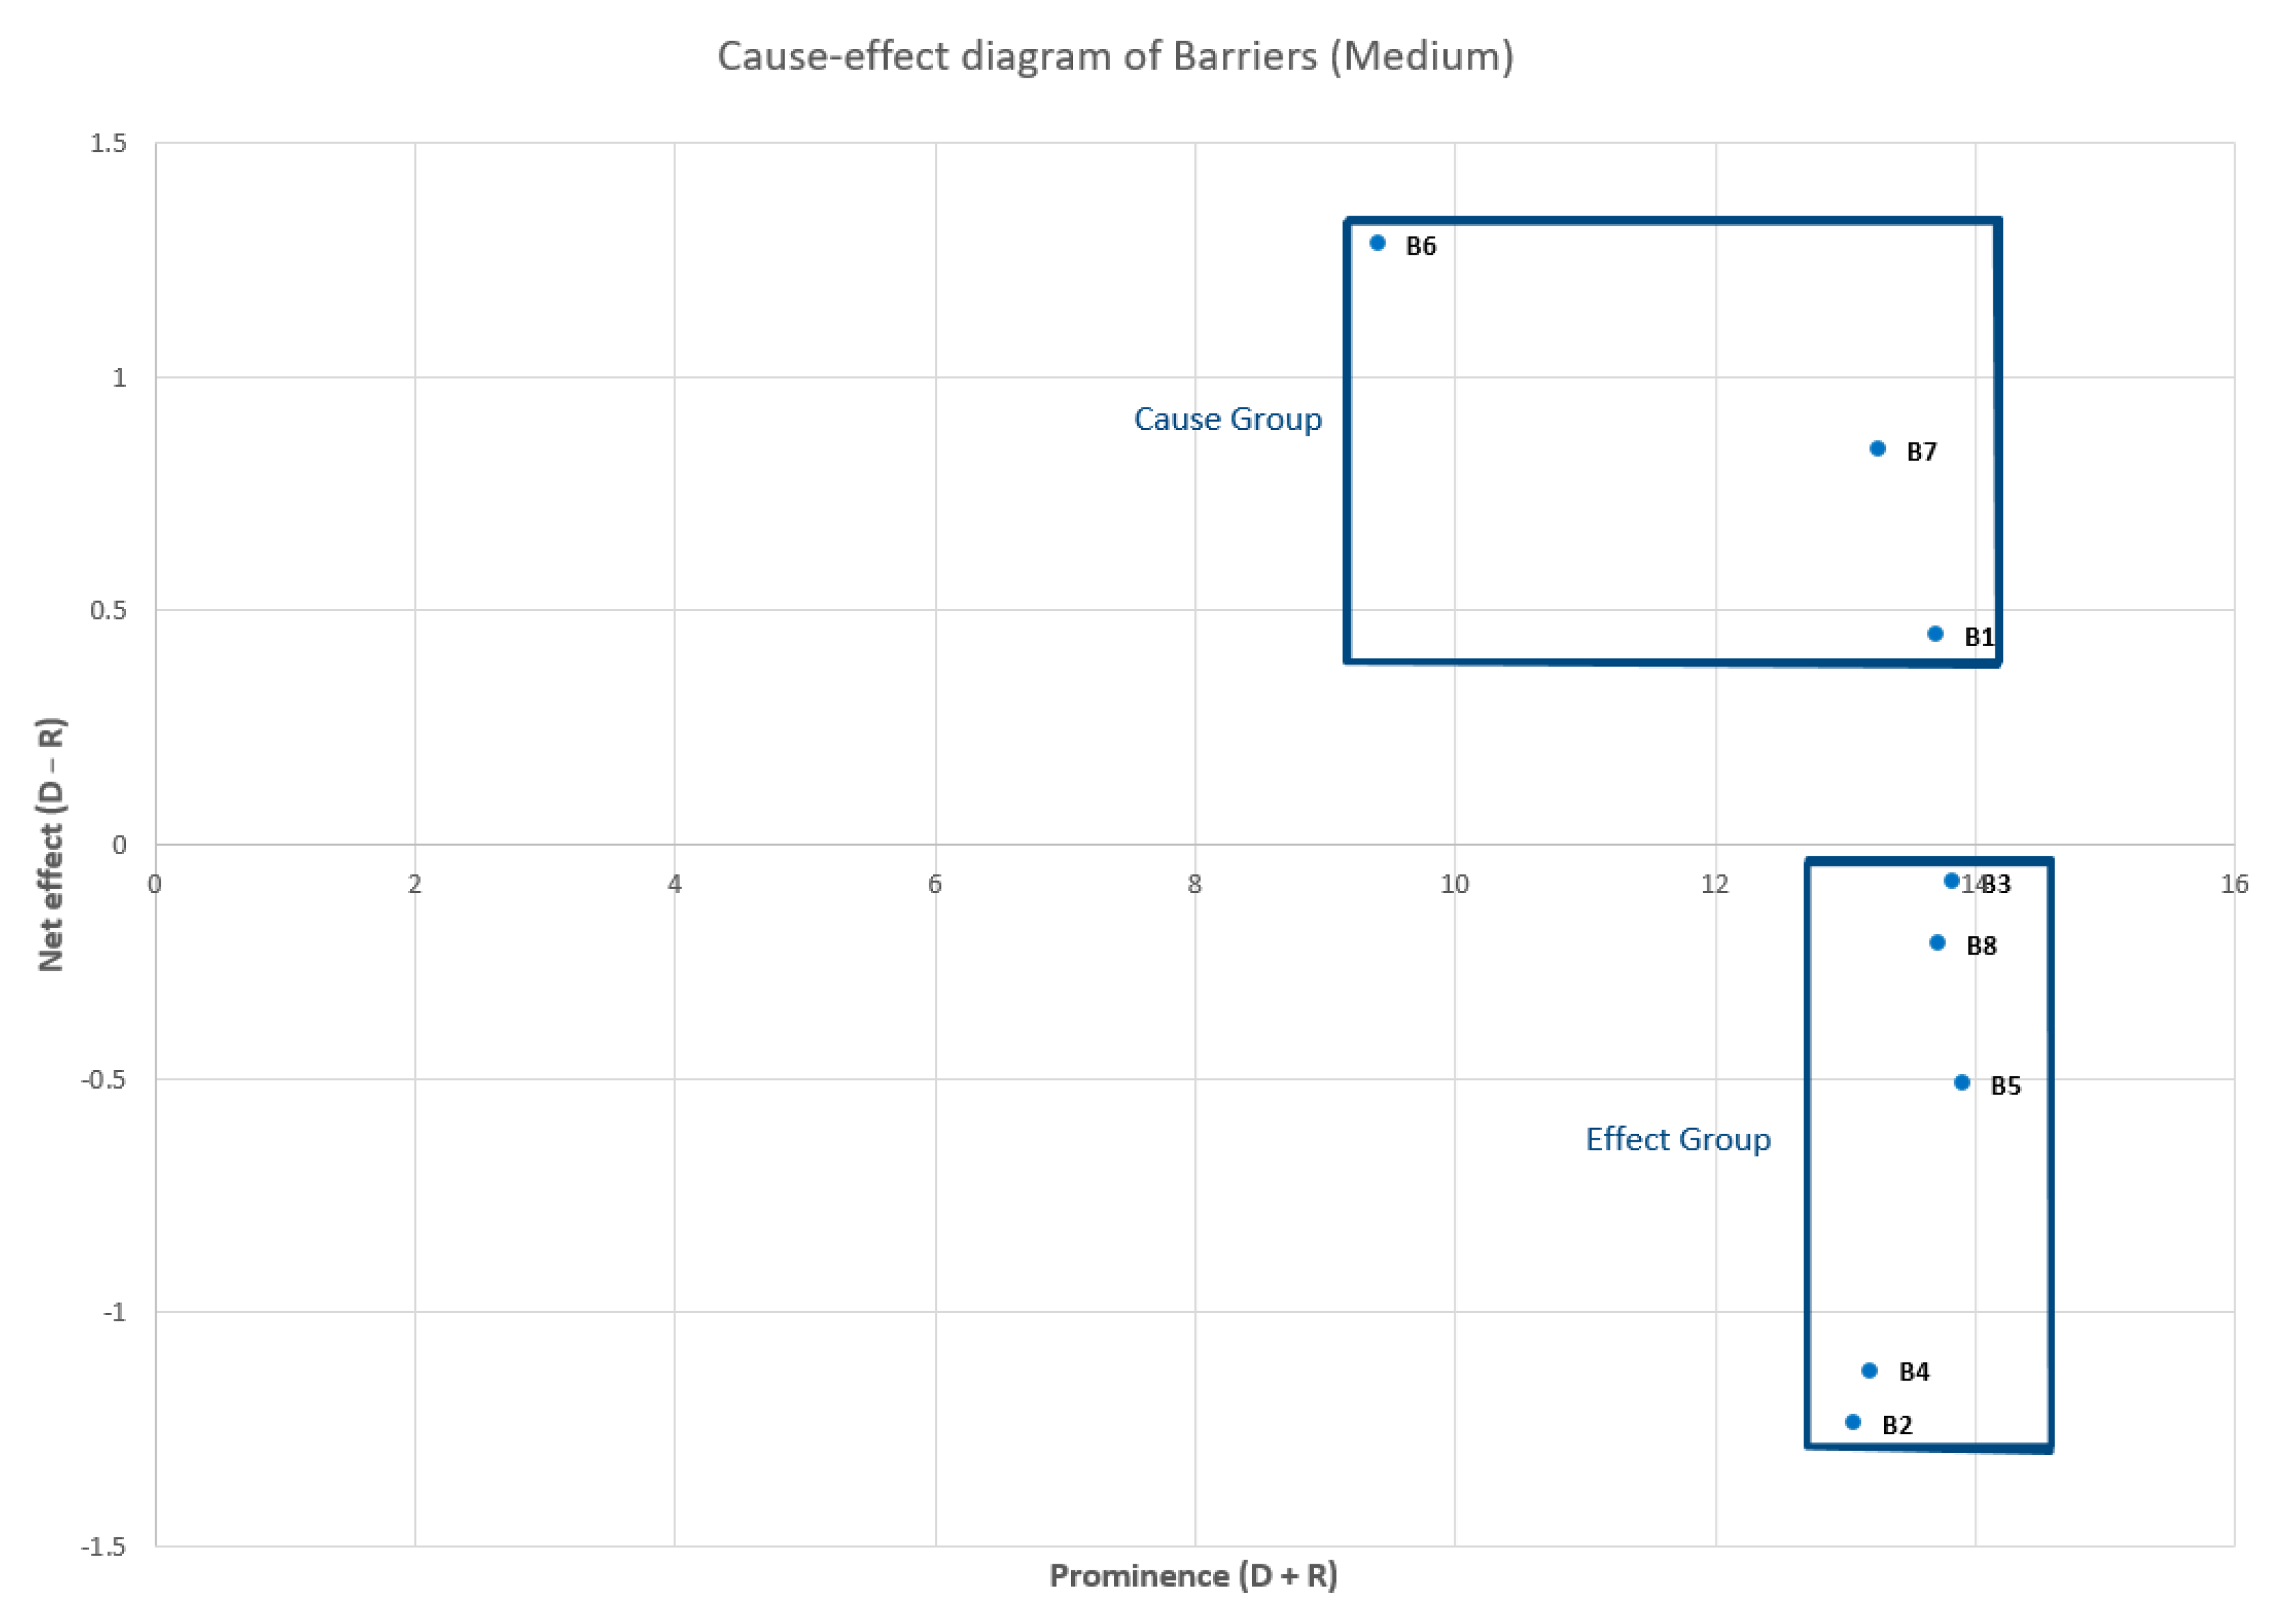
| Barrier | Di + Ri | Di − Ri | Cause(C)/Effect(E) |
|---|---|---|---|
| B1—Lack of technical expertise | 13.7021 | 0.4476 | C |
| B2—Cybersecurity issues | 13.068 | −1.2377 | E |
| B3—Resistance to change/change management practices and adopting innovation for society | 13.8261 | −0.0799 | E |
| B4—Lack of investment in R&D | 13.1995 | −1.1248 | E |
| B5—Cost of improvement & OSCM economic condition | 13.9027 | −0.5104 | E |
| B6—Lack of support from regulatory authority/poor legislation | 9.40544 | 1.28372 | C |
| B7—Lack of commitment from top management | 13.2573 | 0.84586 | C |
| B8—Alternative resources and energy needs | 13.7163 | −0.2106 | E |
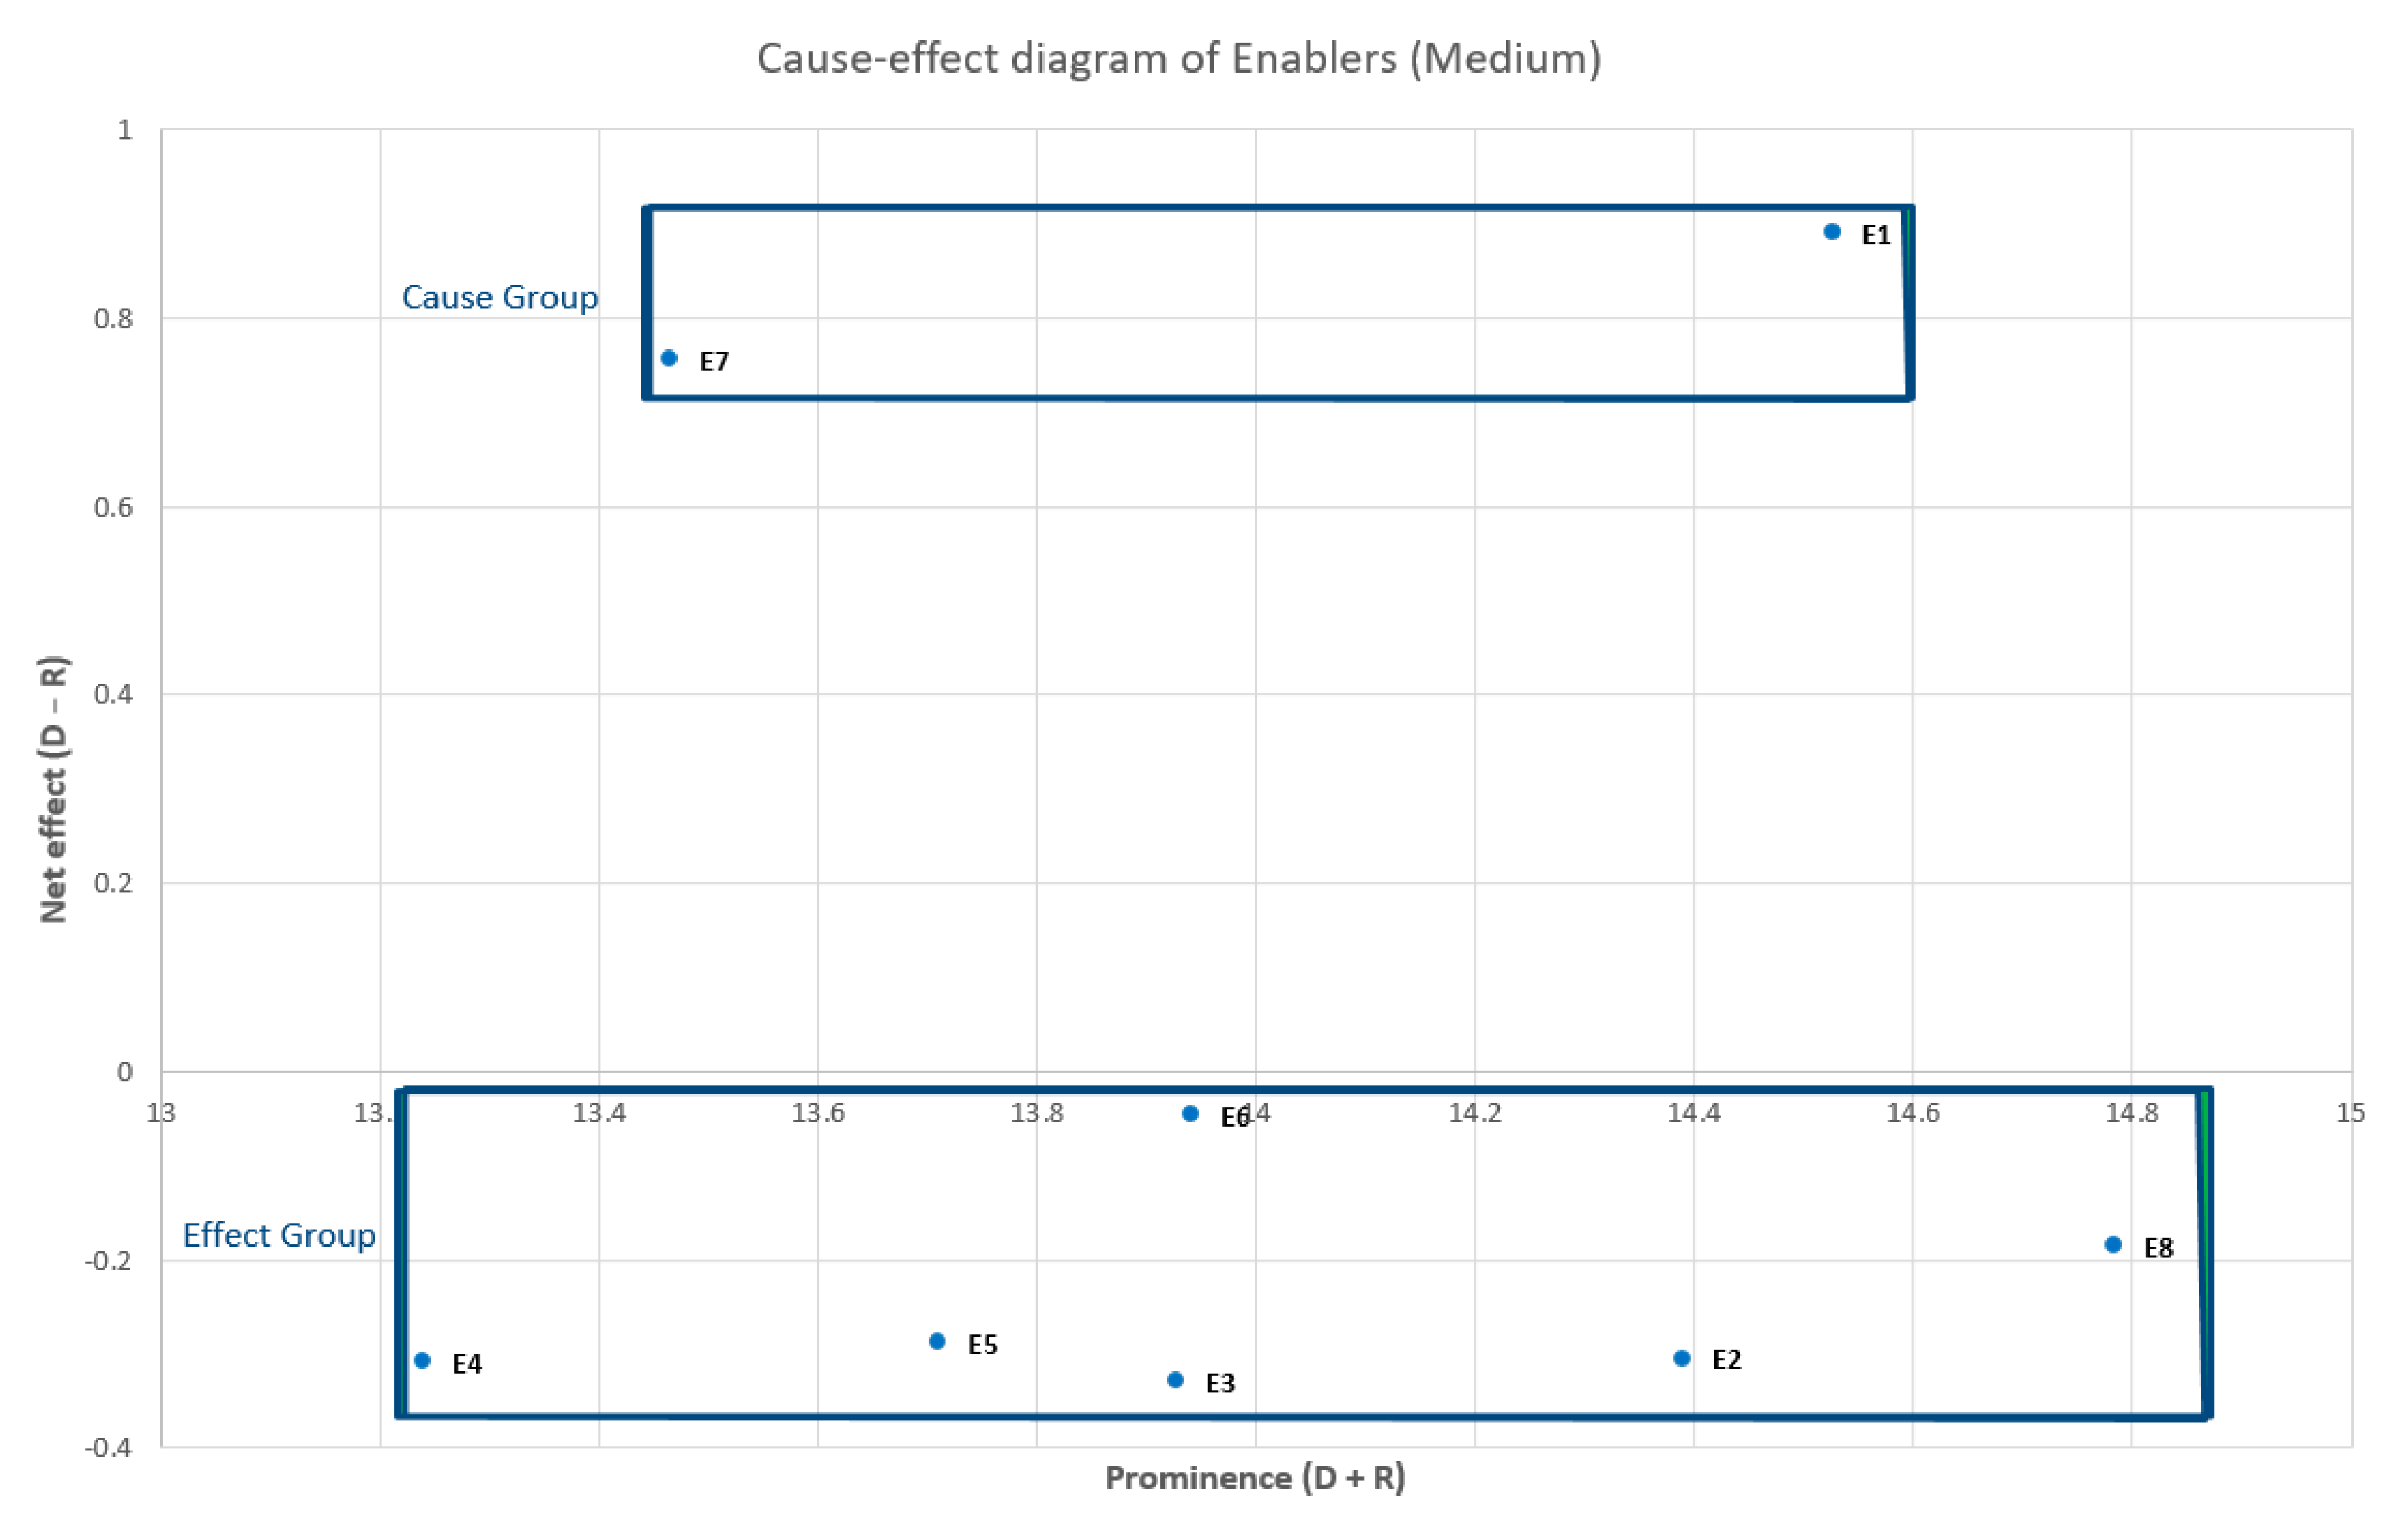
| Enabler | Di + Ri | Di − Ri | Cause(C)/Effect(E) |
|---|---|---|---|
| E1—Top management commitment + Strategic alignment | 14.5263 | 0.89105 | C |
| E2—Employee’s empowerment + Knowledge sharing + Effective communication | 14.3895 | −0.3045 | E |
| E3—Internal innovation process | 13.9268 | −0.329 | E |
| E4—Data-centered solutions + Consistent data flow | 13.2389 | −0.3082 | E |
| E5—Interdisciplinary and holistic integration + Life cycle thinking and circular processes | 13.71 | −0.2877 | E |
| E6—Customer and supplier integration | 13.9409 | −0.0458 | E |
| E7—Governmental and institutional pressures | 13.4648 | 0.75641 | C |
| E8—Valuing R&D/Research Centers | 14.7837 | −0.1847 | E |
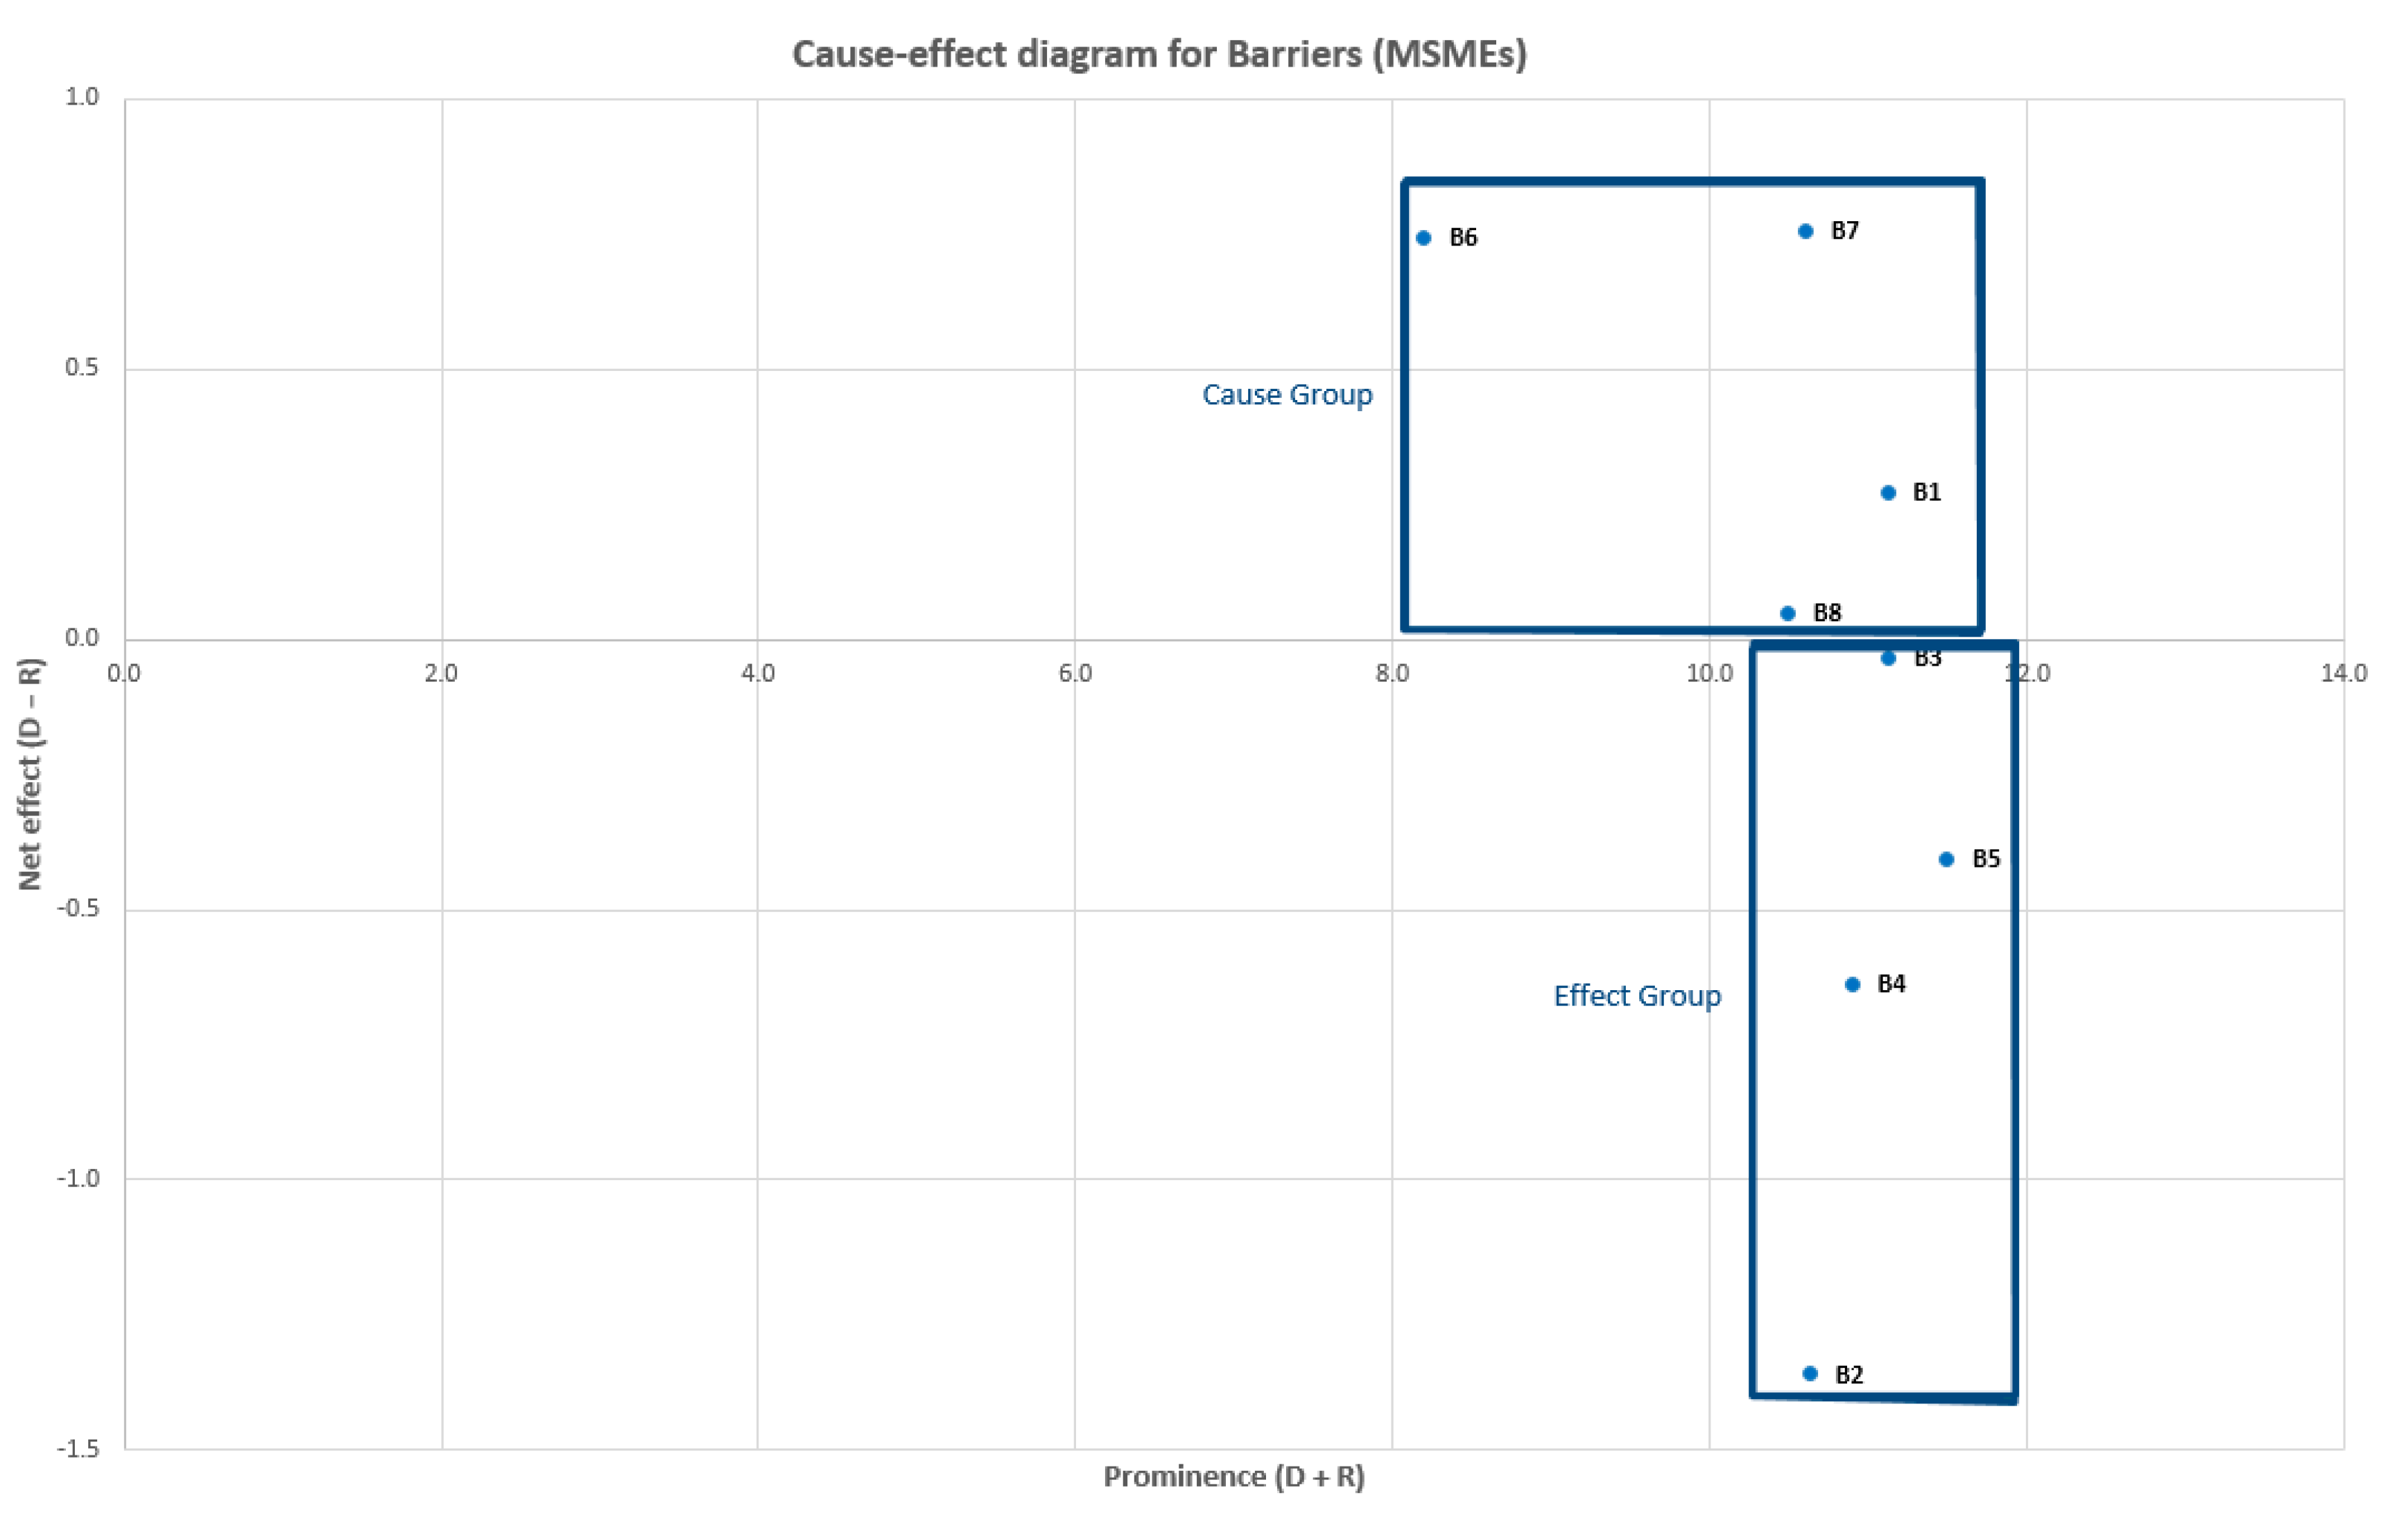
| Barrier | Di + Ri | Di − Ri | Cause(C)/Effect(E) |
|---|---|---|---|
| B1—Lack of technical expertise | 11.1200 | 0.2702 | C |
| B2—Cybersecurity issues | 10.6307 | −1.3595 | E |
| B3—Resistance to change/change management practices and adopting innovation for society | 11.1267 | −0.0358 | E |
| B4—Lack of investment in R&D | 10.8968 | −0.6373 | E |
| B5—Cost of improvement & OSCM economic condition | 11.4957 | −0.4074 | E |
| B6—Lack of support from regulatory authority/poor legislation | 8.1971 | 0.7427 | C |
| B7—Lack of commitment from top management | 10.6034 | 0.7560 | C |
| B8—Alternative resources and energy needs | 10.4919 | 0.0471 | C |
| Enabler | Di + Ri | Di − Ri | Cause(C)/Effect(E) |
|---|---|---|---|
| E1—Top management commitment + Strategic alignment | 14.61628 | 0.630341 | C |
| E2—Employee’s empowerment + Knowledge sharing + Effective communication | 14.68787 | 0.02143 | C |
| E3—Internal innovation process | 14.39422 | −0.365395 | E |
| E4—Data-centered solutions + Consistent data flow | 14.40495 | −0.328144 | E |
| E5—Interdisciplinary and holistic integration + Life cycle thinking and circular processes | 14.40467 | −0.379746 | E |
| E6—Customer and supplier integration | 14.47304 | −0.113201 | E |
| E7—Governmental and institutional pressures | 13.58132 | 0.69578 | C |
| E8—Valuing R&D/Research Centers | 14.79827 | −0.274152 | E |
| Barriers | MSEs | MEs | MSMEs (Combined) |
|---|---|---|---|
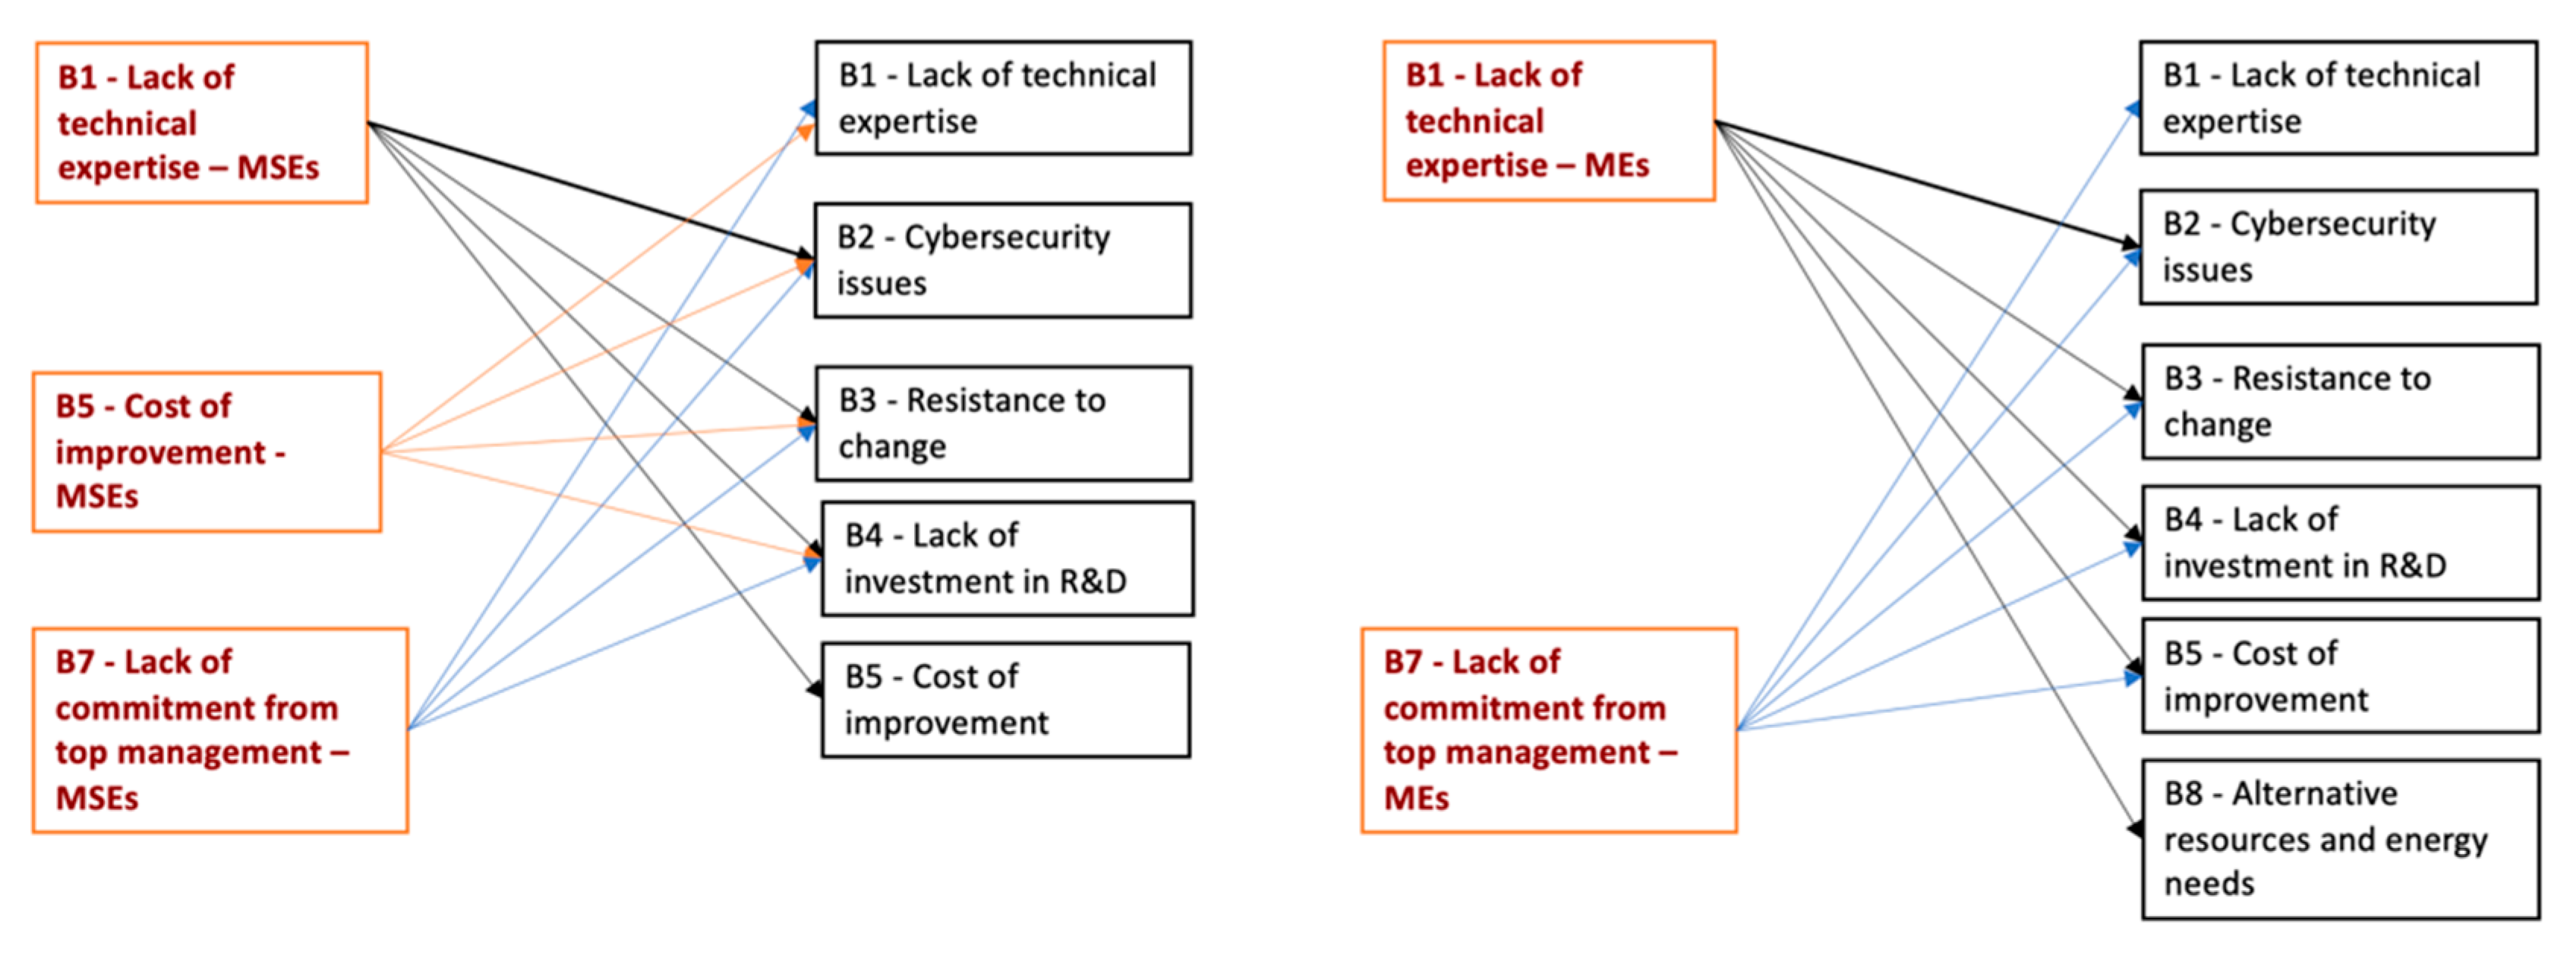
| Key barriers | B1, B6, B7, B8 | B1, B6, B7 | B1, B6, B7, B8 |
| Minor key barriers | none | none | none |
| Indirect barriers | B2, B3, B4, B5 | B2, B3, B4, B5, B4, B8 | B2, B3, B4, B5 |
| Independent barriers | none | none | none |
| Enablers | MSEs | MEs | MSMEs (Combined) |
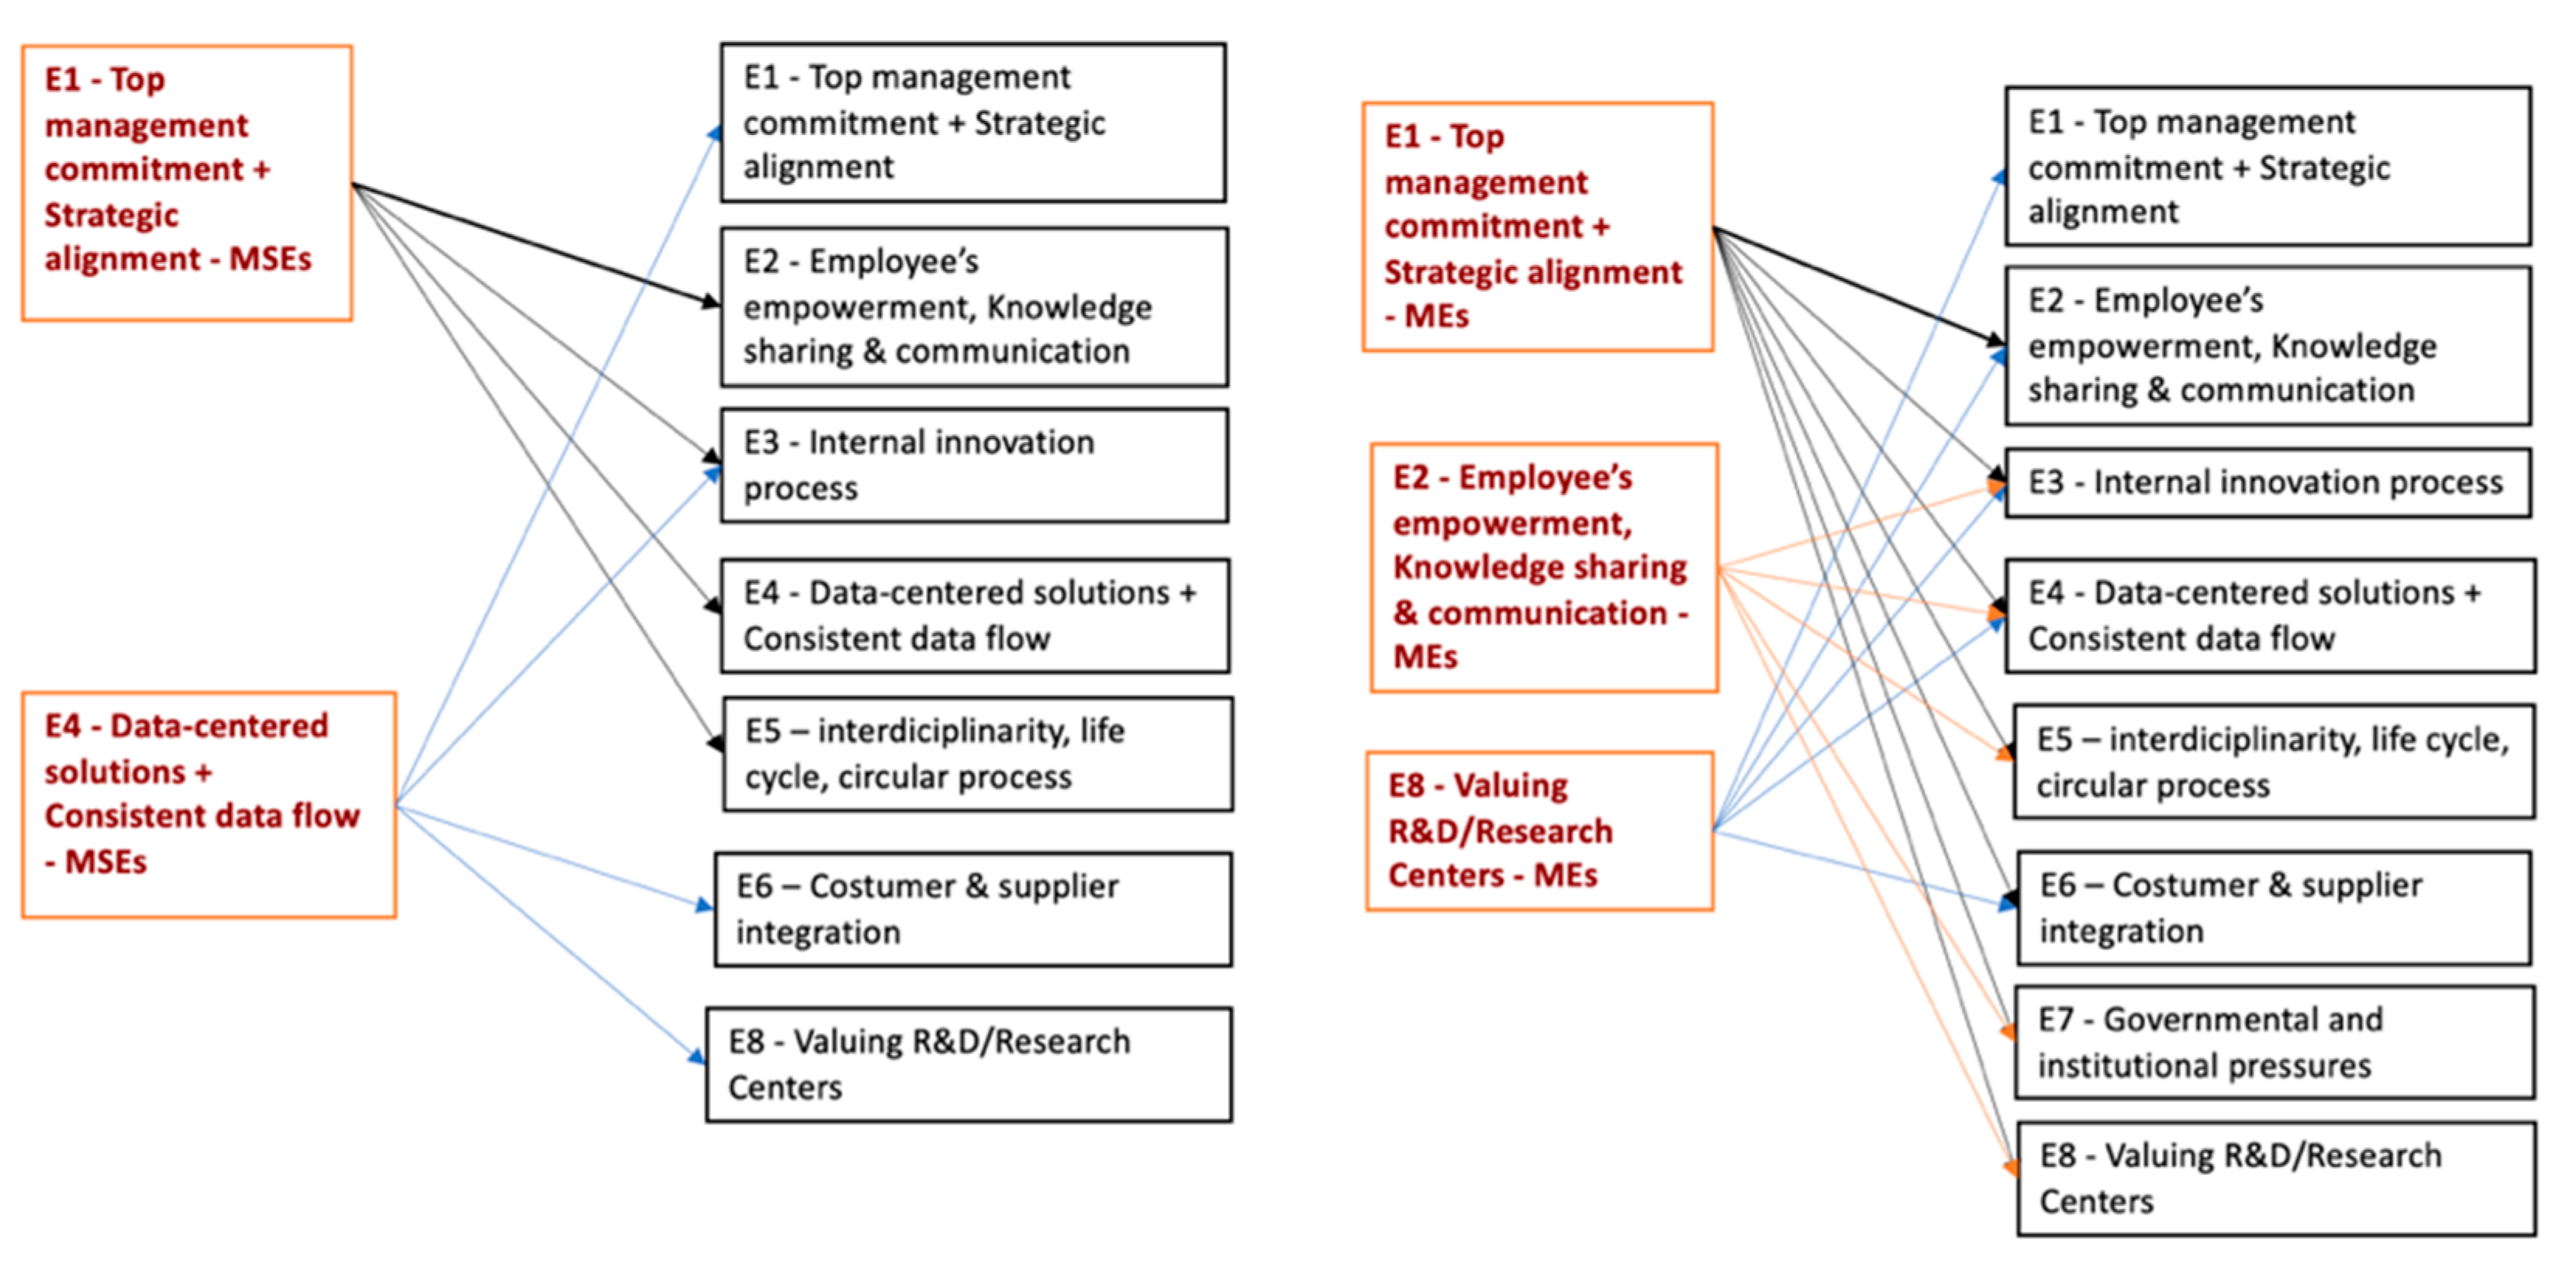
| Key enablers | E1, E2 | E1 | E1, E2 |
| Minor key enablers | E7 | E7 | E7 |
| Indirect enablers | E3, E4, E5, E6, E8 | E2, E8 | E3, E4, E5, E6, E8 |
| Independent enablers | none | E3, E4, E5, E6 | none |
| Factor | MSEs | MEs | MSMEs (Combined) |
|---|---|---|---|
| Barrier | B5 > B1 > B4 | B5 > B3 > B8 | B5 > B3 > B1 |
| Enablers | E4 > E5 > E6 | E8 > E1 > E2 | E8 > E2 > E1 |
| Factor | MSEs | MEs | MSMEs (Combined) |
|---|---|---|---|
| Barrier | B7 > B6 > B8 | B6 > B7 > B1 | B7 > B6 > B1 |
| Enablers | E7 > E1 > E2 | E1 > E7 | E7 > E1 > E2 |
Publisher’s Note: MDPI stays neutral with regard to jurisdictional claims in published maps and institutional affiliations. |
© 2021 by the authors. Licensee MDPI, Basel, Switzerland. This article is an open access article distributed under the terms and conditions of the Creative Commons Attribution (CC BY) license (https://creativecommons.org/licenses/by/4.0/).
Share and Cite
Machado, E.; Scavarda, L.F.; Caiado, R.G.G.; Thomé, A.M.T. Barriers and Enablers for the Integration of Industry 4.0 and Sustainability in Supply Chains of MSMEs. Sustainability 2021, 13, 11664. https://0-doi-org.brum.beds.ac.uk/10.3390/su132111664
Machado E, Scavarda LF, Caiado RGG, Thomé AMT. Barriers and Enablers for the Integration of Industry 4.0 and Sustainability in Supply Chains of MSMEs. Sustainability. 2021; 13(21):11664. https://0-doi-org.brum.beds.ac.uk/10.3390/su132111664
Chicago/Turabian StyleMachado, Eduardo, Luiz Felipe Scavarda, Rodrigo Goyannes Gusmão Caiado, and Antonio Márcio Tavares Thomé. 2021. "Barriers and Enablers for the Integration of Industry 4.0 and Sustainability in Supply Chains of MSMEs" Sustainability 13, no. 21: 11664. https://0-doi-org.brum.beds.ac.uk/10.3390/su132111664