
An Investigation of Railway Fastener Detection Using Image Processing and Augmented Deep Learning


Abstract
:1. Introduction
2. Research Methodology
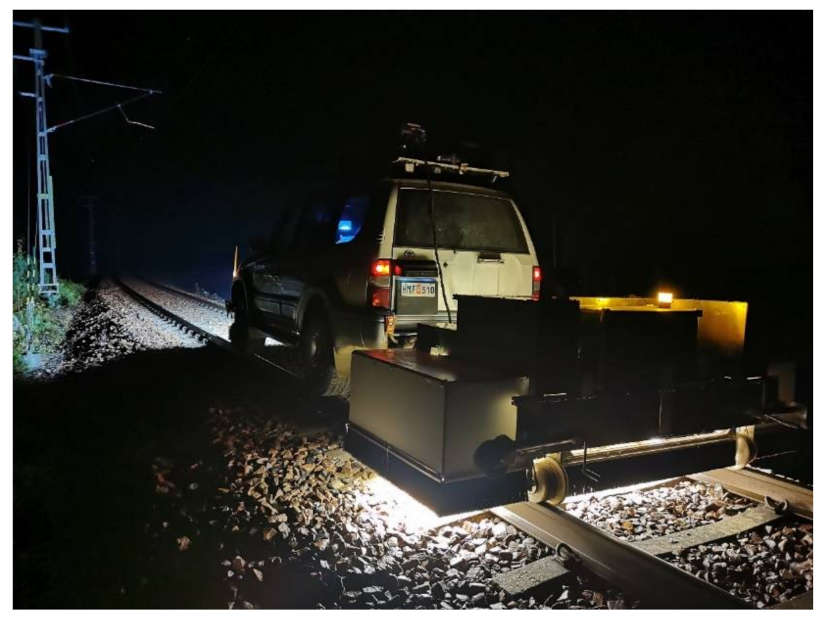
2.1. Raw Data
2.2. Image Processing
- The raw images were merged to form a concatenated long image of the railway track line as depicted in Figure 3a. The image is converted to gray-scale image.
- The binary image was filtered using adaptive noise removal filtering to de-noise the image and improve the accuracy of the positioning result.
- The binary matrix was summed both horizontally (along the sleeper direction) and vertically (along the rail direction) to create a column vector and a row vector. The column vector was used to position the fasteners and the row vector was used to position the rail. Moving average filters was then used on these vectors to smooth them in the same way (refer to Figure 3c).
- The filtered vectors were converted to binary vectors by thresholding it to 75% of its maximum value. The centre position of the sleepers was extracted by finding the peaks and the width of the same within the binary column vector as shown in Figure 3d. Similarly, the centre of the rail was identified from the binary row vector.
- The centre position of both sleeper and rail was used to cut the concatenated images, such that the sleeper and rail was centred within a single frame and each frame contained one sleeper with two fasteners (refer to Figure 4).
2.3. Deep Learning
2.3.1. CNN
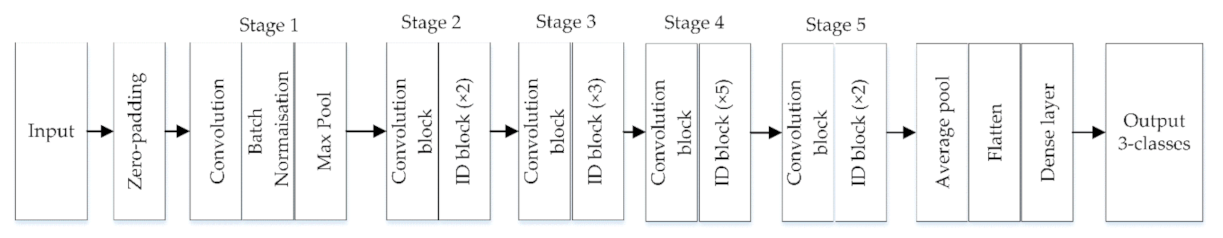
2.3.2. ResNet-50
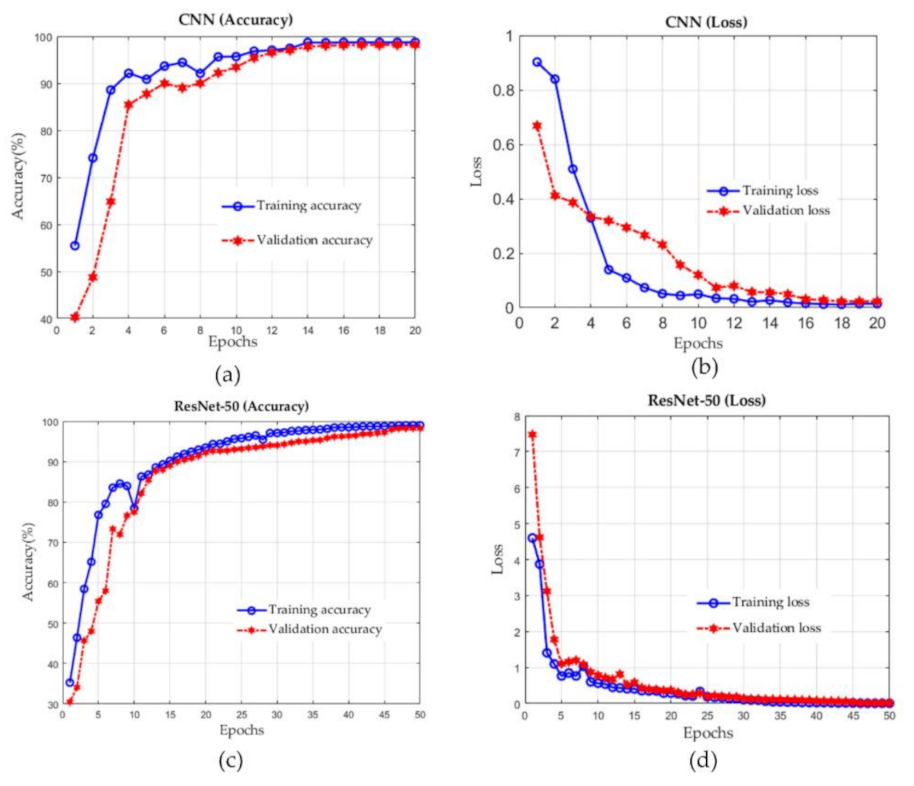
2.3.3. Training, Validation and Testing
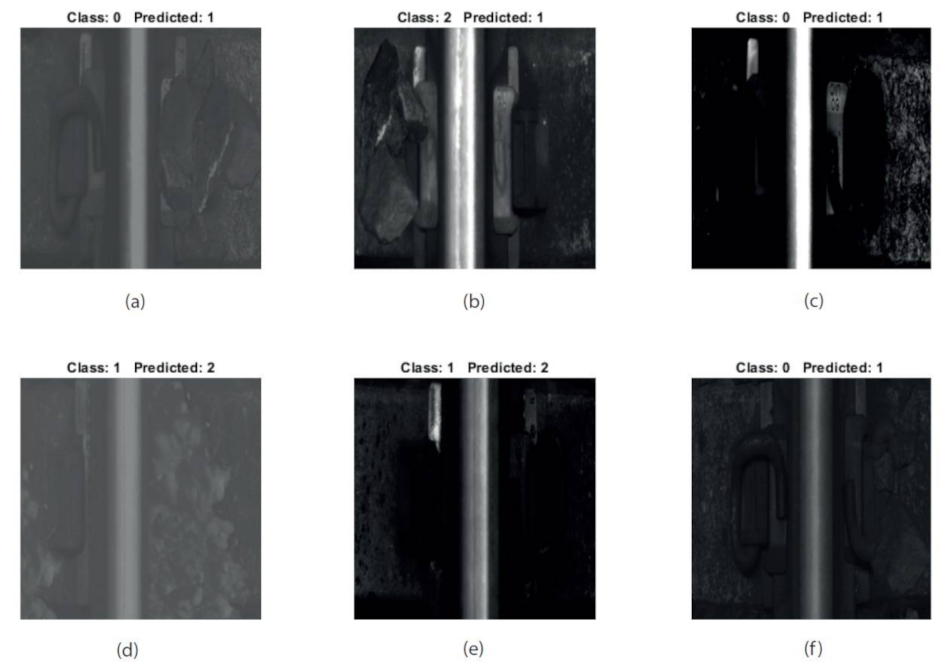
3. Results
4. Conclusions and Future Work
Author Contributions
Funding
Institutional Review Board Statement
Informed Consent Statement
Data Availability Statement
Acknowledgments
Conflicts of Interest
References
- Whiteing, T.; Menaz, B. Thematic Research Summary: Rail Transport. Transport Research Knowledge Centre—European Commission. 2009. Available online: http://www.eurosfaire.prd.fr/7pc/doc/1257761907_trs_rail_transport_2009.pdf (accessed on 16 February 2021).
- Trafikverket. Prognosis of Swedish Goods Flow for the Year 2050 (Prognos Över Svenska Godsströmmar år 2050: Underlagsrapport. Publikationsnummer); Technical Report; Trafikverket: Borlänge, Sweden, 2012; Volume 112. [Google Scholar]
- European Commission. Roadmap to a Single European Transport Area—Towards a Competitive and Resource Efficient Transport System. 2011. Available online: https://ec.europa.eu/transport/themes/european-strategies/white-paper-2011_en (accessed on 17 February 2021).
- Castillo-Mingorance, J.M.; Sol-Sánchez, M.; Moreno-Navarro, F.; Rubio-Gámez, M.C. A critical review of sensors for the continuous monitoring of smart and sustainable railway infrastructures. Sustainability 2020, 12, 9428. [Google Scholar] [CrossRef]
- Patra, A.P.; Kumar, U.; Kraik, P.-O.L. Availability target of the railway infrastructure: An analysis. In Proceedings of the 2010 Annual Reliability and Maintainability Symposium (RAMS), Wellington, New Zealand, 2–4 December 2010; pp. 1–6. [Google Scholar] [CrossRef] [Green Version]
- Chandran, P.; Thierry, F.; Odelius, J.; Famurewa, S.; Lind, H.; Rantatalo, M. Supervised Machine Learning Approach for Detecting Missing Clamps in Rail Fastening System from Differential Eddy Current Measurements. Appl. Sci. 2021, 11, 4018. [Google Scholar] [CrossRef]
- Aytekin, C.; Rezaeitabar, Y.; Dogru, S.; Ulusoy, I. Railway Fastener Inspection by Real-Time Machine Vision. IEEE Trans. Syst. Man Cybern. Syst. 2015, 45, 1101–1107. [Google Scholar] [CrossRef]
- Feng, H.; Jiang, Z.; Xie, F.; Yang, P.; Shi, J.; Chen, L. Automatic Fastener Classification and Defect Detection in Vision-Based Railway Inspection Systems. IEEE Trans. Instrum. Meas. 2014, 63, 877–888. [Google Scholar] [CrossRef]
- Dai, P.; Du, X.; Wang, S.; Gu, Z.; Ma, Y. Rail fastener automatic recognition method in complex background. In Proceedings of the Tenth International Conference on Digital Image Processing (ICDIP 2018), Shanghai, China, 11–14 May 2018; Volume 10806, p. 1080625. [Google Scholar] [CrossRef]
- Wei, X.; Wei, D.; Suo, D.; Jia, L.; Li, Y. Multi-Target Defect Identification for Railway Track Line Based on Image Processing and Improved YOLOv3 Model. IEEE Access 2020, 8, 61973–61988. [Google Scholar] [CrossRef]
- Marino, F.; Distante, A.; Mazzeo, P.L.; Stella, E. A Real-Time Visual Inspection System for Railway Maintenance: Automatic Hexagonal-Headed Bolts Detection. IEEE Trans. Syst. Man Cybern. Part C Appl. Rev. 2007, 37, 418–428. [Google Scholar] [CrossRef]
- Stella, E.; Mazzeo, P.; Nitti, M.; Cicirelli, G.; Distante, A.; D’Orazio, T. Visual recognition of missing fastening elements for railroad maintenance. In Proceedings of the IEEE 5th International Conference on Intelligent Transportation Systems, Singapore, 6 September 2003; pp. 94–99. [Google Scholar] [CrossRef]
- Yang, J.; Tao, W.; Liu, M.; Zhang, Y.; Zhang, H.; Zhao, H. An Efficient Direction Field-Based Method for the Detection of Fasteners on High-Speed Railways. Sensors 2011, 11, 7364–7381. [Google Scholar] [CrossRef] [PubMed] [Green Version]
- De Ruvo, P.; Distante, A.; Stella, E.; Marino, F. A GPU-based vision system for real time detection of fastening elements in railway inspection. In Proceedings of the 2009 16th IEEE International Conference on Image Processing (ICIP), Cairo, Egypt, 7–10 November 2009; pp. 2333–2336. [Google Scholar] [CrossRef]
- Xia, Y.; Xie, F.; Jiang, Z. Broken Railway Fastener Detection Based on Adaboost Algorithm. In Proceedings of the 2010 International Conference on Optoelectronics and Image Processing, Haikou, China, 13 January 2011; Volume 1, pp. 313–316. [Google Scholar] [CrossRef]
- Li, Y.; Otto, C.; Haas, N.; Fujiki, Y.; Pankanti, S. Component-based track inspection using machine-vision technology. In Proceedings of the 1st ACM International Conference on Multimedia Retrieval, Trento, Italy, 18–20 April 2011; pp. 1–8. [Google Scholar] [CrossRef]
- Fan, H.; Cosman, P.C.; Hou, Y.; Li, B. High-Speed Railway Fastener Detection Based on a Line Local Binary Pattern. IEEE Signal Process. Lett. 2018, 25, 788–792. [Google Scholar] [CrossRef]
- Singh, M.; Singh, S.; Jaiswal, J.; Hempshall, J. Autonomous Rail Track Inspection using Vision Based System. In Proceedings of the 2006 IEEE International Conference on Computational Intelligence for Homeland Security and Personal Safety, Alexandria, VA, USA, 16–17 October 2006; pp. 56–59. [Google Scholar] [CrossRef]
- Mazzeo, P.; Ancona, N.; Stella, E.; Distante, A. Visual recognition of hexagonal headed bolts by comparing ICA to wavelets. In Proceedings of the 2003 IEEE International Symposium on Intelligent Control ISIC-03, Houston, TX, USA, 8 October 2003; pp. 636–641. [Google Scholar] [CrossRef]
- Mandriota, C.; Nitti, M.; Ancona, N.; Stella, E.; Distante, A. Filter-based feature selection for rail defect detection. Mach. Vis. Appl. 2004, 15, 179–185. [Google Scholar] [CrossRef]
- Li, Y.; Trinh, H.; Haas, N.; Otto, C.; Pankanti, S. Rail Component Detection, Optimization, and Assessment for Automatic Rail Track Inspection. IEEE Trans. Intell. Transp. Syst. 2013, 15, 760–770. [Google Scholar] [CrossRef]
- Wang, T.; Yang, F.; Tsui, K.-L. Real-Time Detection of Railway Track Component via One-Stage Deep Learning Networks. Sensors 2020, 20, 4325. [Google Scholar] [CrossRef] [PubMed]
- Wei, X.; Yang, Z.; Liu, Y.; Wei, D.; Jia, L.; Li, Y. Railway track fastener defect detection based on image processing and deep learning techniques: A comparative study. Eng. Appl. Artif. Intell. 2019, 80, 66–81. [Google Scholar] [CrossRef]
- Liu, J.; Huang, Y.; Zou, Q.; Tian, M.; Wang, S.; Zhao, X.; Dai, P.; Ren, S. Learning Visual Similarity for Inspecting Defective Railway Fasteners. IEEE Sens. J. 2019, 19, 6844–6857. [Google Scholar] [CrossRef]
- Song, Q.; Guo, Y.; Yang, L.; Jiang, J.; Liu, C.; Hu, M. High-speed railway fastener detection and localization system. arXiv 2019, arXiv:1907.01141. [Google Scholar]
- Otsu, N. A Threshold Selection Method from Gray-Level Histograms. IEEE Trans. Syst. Man Cybern. 1979, 9, 62–66. [Google Scholar] [CrossRef] [Green Version]
- Chauhan, R.; Ghanshala, K.K.; Joshi, R. Convolutional Neural Network (CNN) for Image Detection and Recognition. In Proceedings of the 2018 First International Conference on Secure Cyber Computing and Communication (ICSCCC), Jalandhar, India, 15–17 December 2018; pp. 278–282. [Google Scholar] [CrossRef]
- Yuan, Z.; Zhu, S.; Zhai, W. Damage Detection of Rail Fastening System Through Deep Learning and Vehicle-Track Coupled Dynamics. In Advances in Dynamics of Vehicles on Roads and Tracks; Springer: Singapore, 2020; pp. 148–153. [Google Scholar] [CrossRef]
- Albawi, S.; Mohammed, T.A.; Al-Zawi, S. Understanding of a convolutional neural network. In Proceedings of the 2017 International Conference on Engineering and Technology (ICET), Antalya, Turkey, 21–23 August 2017; pp. 1–6. [Google Scholar] [CrossRef]
- Zeiler, M.D.; Fergus, R. Visualizing and Understanding Convolutional Networks. In Proceedings of the European Conference on Computer Vision, Zurich, Switzerland, 6–12 September 2014; pp. 818–833. [Google Scholar] [CrossRef] [Green Version]
- He, K.; Zhang, X.; Ren, S.; Sun, J. Identity Mappings in Deep Residual Networks. In Proceedings of the European Conference on Computer Vision, Amsterdam, The Netherlands, 8–16 October 2016; pp. 630–645. [Google Scholar] [CrossRef] [Green Version]
- He, K.; Zhang, X.; Ren, S.; Sun, J. Deep Residual Learning for Image Recognition. In Proceedings of the IEEE Conference on Computer Vision and Pattern Recognition, Las Vegas, NV, USA, 26 June–1 July 2016; pp. 770–778. Available online: https://openaccess.thecvf.com/content_cvpr_2016/papers/He_Deep_Residual_Learning_CVPR_2016_paper.pdf (accessed on 2 September 2021).
- Chandran, P.; Rantatalo, M.; Odelius, J.; Lind, H.; Famurewa, S.M. Train-based differential eddy current sensor system for rail fastener detection. Meas. Sci. Technol. 2019, 30, 125105. [Google Scholar] [CrossRef]


| Parameters | CNN | ResNet-50 |
|---|---|---|
| Training Accuracy (%) | 98.73 | 99.02 |
| Training Loss | 0.015 | 0.0086 |
| Validation Accuracy (%) | 98.18 | 98.24 |
| Validation Loss | 0.024 | 0.0205 |
| Total Parameters | 11,169,347 | 23,643,011 |
| Trainable Parameters | 11,169,347 | 23,589,891 |
| Number of Epochs | 20 | 50 |
| Average Training Time per Epoch (seconds) | 127 | 1039 |
| Average Training Time per Sample (milliseconds) | 63 | 509 |
| Parameters | CNN | ResNet-50 |
|---|---|---|
| Accuracy (%) | 94 | 94.4 |
| Loss | 0.56 | 0.47 |
| Precision | 94 | 95 |
| Recall | 94 | 94 |
| Time for testing (seconds) | 8 | 87 |
| Time per sample (milliseconds) | 16 | 190 |
Publisher’s Note: MDPI stays neutral with regard to jurisdictional claims in published maps and institutional affiliations. |
© 2021 by the authors. Licensee MDPI, Basel, Switzerland. This article is an open access article distributed under the terms and conditions of the Creative Commons Attribution (CC BY) license (https://creativecommons.org/licenses/by/4.0/).
Share and Cite
Chandran, P.; Asber, J.; Thiery, F.; Odelius, J.; Rantatalo, M. An Investigation of Railway Fastener Detection Using Image Processing and Augmented Deep Learning. Sustainability 2021, 13, 12051. https://0-doi-org.brum.beds.ac.uk/10.3390/su132112051
Chandran P, Asber J, Thiery F, Odelius J, Rantatalo M. An Investigation of Railway Fastener Detection Using Image Processing and Augmented Deep Learning. Sustainability. 2021; 13(21):12051. https://0-doi-org.brum.beds.ac.uk/10.3390/su132112051
Chicago/Turabian StyleChandran, Praneeth, Johnny Asber, Florian Thiery, Johan Odelius, and Matti Rantatalo. 2021. "An Investigation of Railway Fastener Detection Using Image Processing and Augmented Deep Learning" Sustainability 13, no. 21: 12051. https://0-doi-org.brum.beds.ac.uk/10.3390/su132112051