1. Introduction
Intersections are among the most critical locations in the road transport network resulting in a risk of death and serious injury [
1]. Intersection-related crashes account for approximately 20–45% of all reported crashes in both developed and developing countries, such as the United States, Norway, Japan, Singapore, and Thailand [
2,
3,
4,
5,
6]. Most of them are attributable to inattention or illegal maneuvers through complicated traffic situations.
The factors contributing to intersection-related crashes are diverse and complex. Many factors, such as intersection types, control, and geometry, have different impacts on crash types and their frequency and severity [
7]. For example, four-legged intersections have up to four times the number of crashes as T-intersections. Signalized intersections have higher percentages of rear-end collisions than stop-controlled intersections. On the other hand, the stop-controlled intersections have more angle crashes than signal-controlled intersections [
8].
Moreover, the road hierarchy—which categorizes roads according to their functions and capacities, such as arterials, collectors, and local roads—can be a significant factor contributing to crash severity risk at intersections [
9,
10]. A poorly designed intersection of two functionally classified roads may force road users into conflict situations due to insufficient sight distance, inefficient intersection control, or unintentional road users [
7].
Traditionally, safety analysis has been undertaken based on statistical analyses of historical crash data. However, such data might be incomplete, unavailable, or under-reported, contain limited behavioral information, or omit important crash-related factors [
11,
12]. This limitation makes it impossible to evaluate an intersection and compare intersection safety under different circumstances.
Traffic conflict analysis has been advocated as an alternative proactive approach to assess traffic safety at intersections [
13,
14]. Recently, with the advanced developments in surrogate safety measures and video analytic tools, traffic conflict analysis has become a more applicable and less laborious task for intersection safety assessment.
This study aimed to develop a method to assess the safety performance of intersections using video-based traffic conflict analysis. The study applied traffic conflict techniques and video analytics to compare the risk of conflict among different classes of intersections. The study presents case studies to demonstrate the usefulness of video-based traffic conflict analysis and the analysis of conflict risk classified by vehicle types and conflict types at intersections.
The remainder of this paper unfolds in different sections.
Section 2 reviews concepts and past studies related to traffic conflict analysis.
Section 3 illustrates the methodology used.
Section 4 describes the results and provides a detailed discussion on the results.
Section 5 concludes the study findings and highlights further recommendations.
2. Literature Review
The review of the literature is presented in three parts.
Section 2.1 provides the concept of traffic conflict analysis at an intersection.
Section 2.2 reviews the definition of time-to-collision, which is a surrogate safety measure of intersection conflict.
Section 2.3 explores the applications of video analytics on traffic conflict analysis.
2.1. Traffic Conflict Analysis at Intersections
A roadway intersection is the area where two or more roads join or cross at-grade. It is where conflicting movements are concentrated and result in high-risk crashes. Various primary conflicting movements can be found at at-grade intersections, such as cross-traffic conflicts, opposing turning conflicts, same-direction conflicts, and lane-change conflicts [
15].
An intersection conflict is any potential crash situation at an intersection. Such a conflict is typically known as an evasive action conflict. It is described as a traffic incident involving the interaction of two or more vehicles where drivers take evasive action to avoid a collision from the same or different intersection approaches [
12,
16]. Another category of intersection conflict is a traffic violation conflict. This occurs when a driver invades an intersection area illegally [
17].
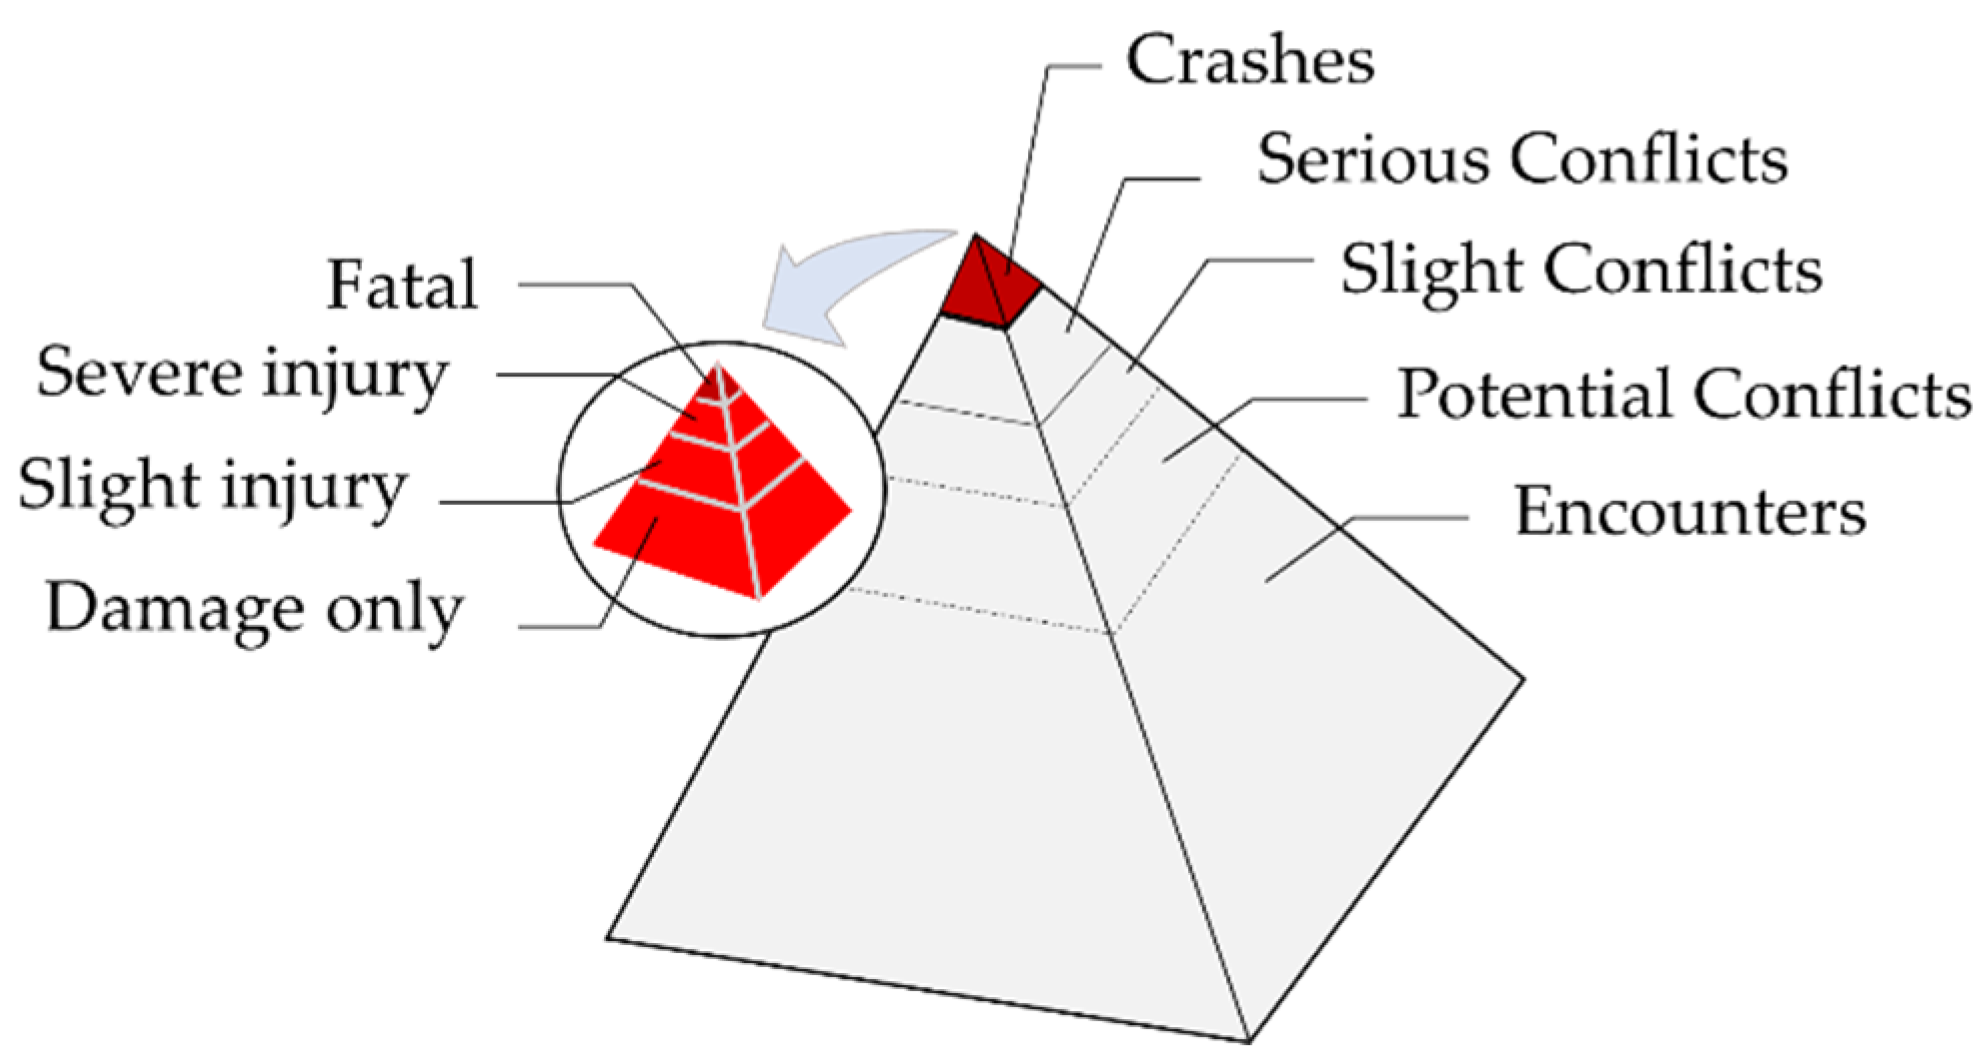
Safety research studies have suggested that crash rates are related to the number of conflicts at an intersection. To characterize the difference between conflicts and crashes, the concept of a ‘safety pyramid’ has been employed to represent the variation in severity hierarchy, as shown in
Figure 1 [
18,
19]. The position of each layer of the safety pyramid corresponds to the riskiness and closeness to crash of an event. The top portion of the pyramid presents the crash occurrence for the most severe crashes, which are very rare, to the least severe crashes (property damage only), which are more likely. The lower portion presents the near-crash events, which are more frequent than crashes. It is divided into severe conflicts, slight conflicts, and possible conflicts. The more severe the conflicts are, the higher the crash risk is.
Traffic conflict technique (TCT) has been developed and widely adopted to evaluate crash potential and operational deficiencies at intersections in many countries over the last few decades [
20]. TCT represents an efficient approach to enable a proactive strategy. There are two approaches to monitor traffic conflicts: detailed descriptions of direct field observations and analysis from video recordings [
21].
At an intersection, a traffic conflict is an observable event in which two or more road users are predicted to approach each other at the same time in the same intersection area such that there is a risk of collision [
22]. The analysis of intersection traffic conflict is related to monitoring and measuring the frequency and severity of traffic conflicts to diagnose safety problems at an intersection [
14]. The objective of traffic conflict analysis is to identify potential risks and safety problems of existing intersection design.
In many research studies, surrogate safety measures (SSMs), also called non-crash measures, have been of interest to analyze traffic conflicts [
13,
19,
23]. The basic concept of surrogate safety is to examine vehicle movements and to identify all risky events involving a near-crash. SSMs serve as near-crash indicators to physically measure conflicts from the temporal or spatial proximity of road users. They can present the degree of severity and the frequency of events that are related to safety [
18].
Surrogate safety measures can be useful to summarize the complicated dynamic interactions between road users in a simple measurable manner [
24,
25,
26] by assuming that the closer vehicles are to each other, the nearer they are to a collision. In the literature, over 30 temporal or spatial proximal indicators have been proposed as surrogate safety measures, such as post-encroachment time (PET), time-to-collision (TTC), time-to-accident (TA), headway, proportion of stopping distance, deceleration rates, jerks, and lateral position [
23]. Among the commonly used indicators, TTC is presented in this study.
2.2. Time-to-Collision
Time-to-collision (TTC) is the time until a collision between the vehicles would occur if they kept their present course at their present rates. TTC is more informative and frequently used in practice than other indicators. Several applications, such as advanced driver-assistance systems, have used TTC as an important warning criterion. The two most used TTC indicators are TTC minimum, which is the minimum TTC value calculated in an event, and time-to-accident (TA), which is the TTC value calculated at the moment an involved road user takes evasive action. Both indicators use a threshold value to differentiate between a severe and a non-severe event. Suitability for collision type of TTC include crossing, rear-end collision, turning/weaving, hit objects/parked vehicle, and hit pedestrian [
23].
TTC values correspond to conflict severities; lower TTC values correspond to higher conflict severities [
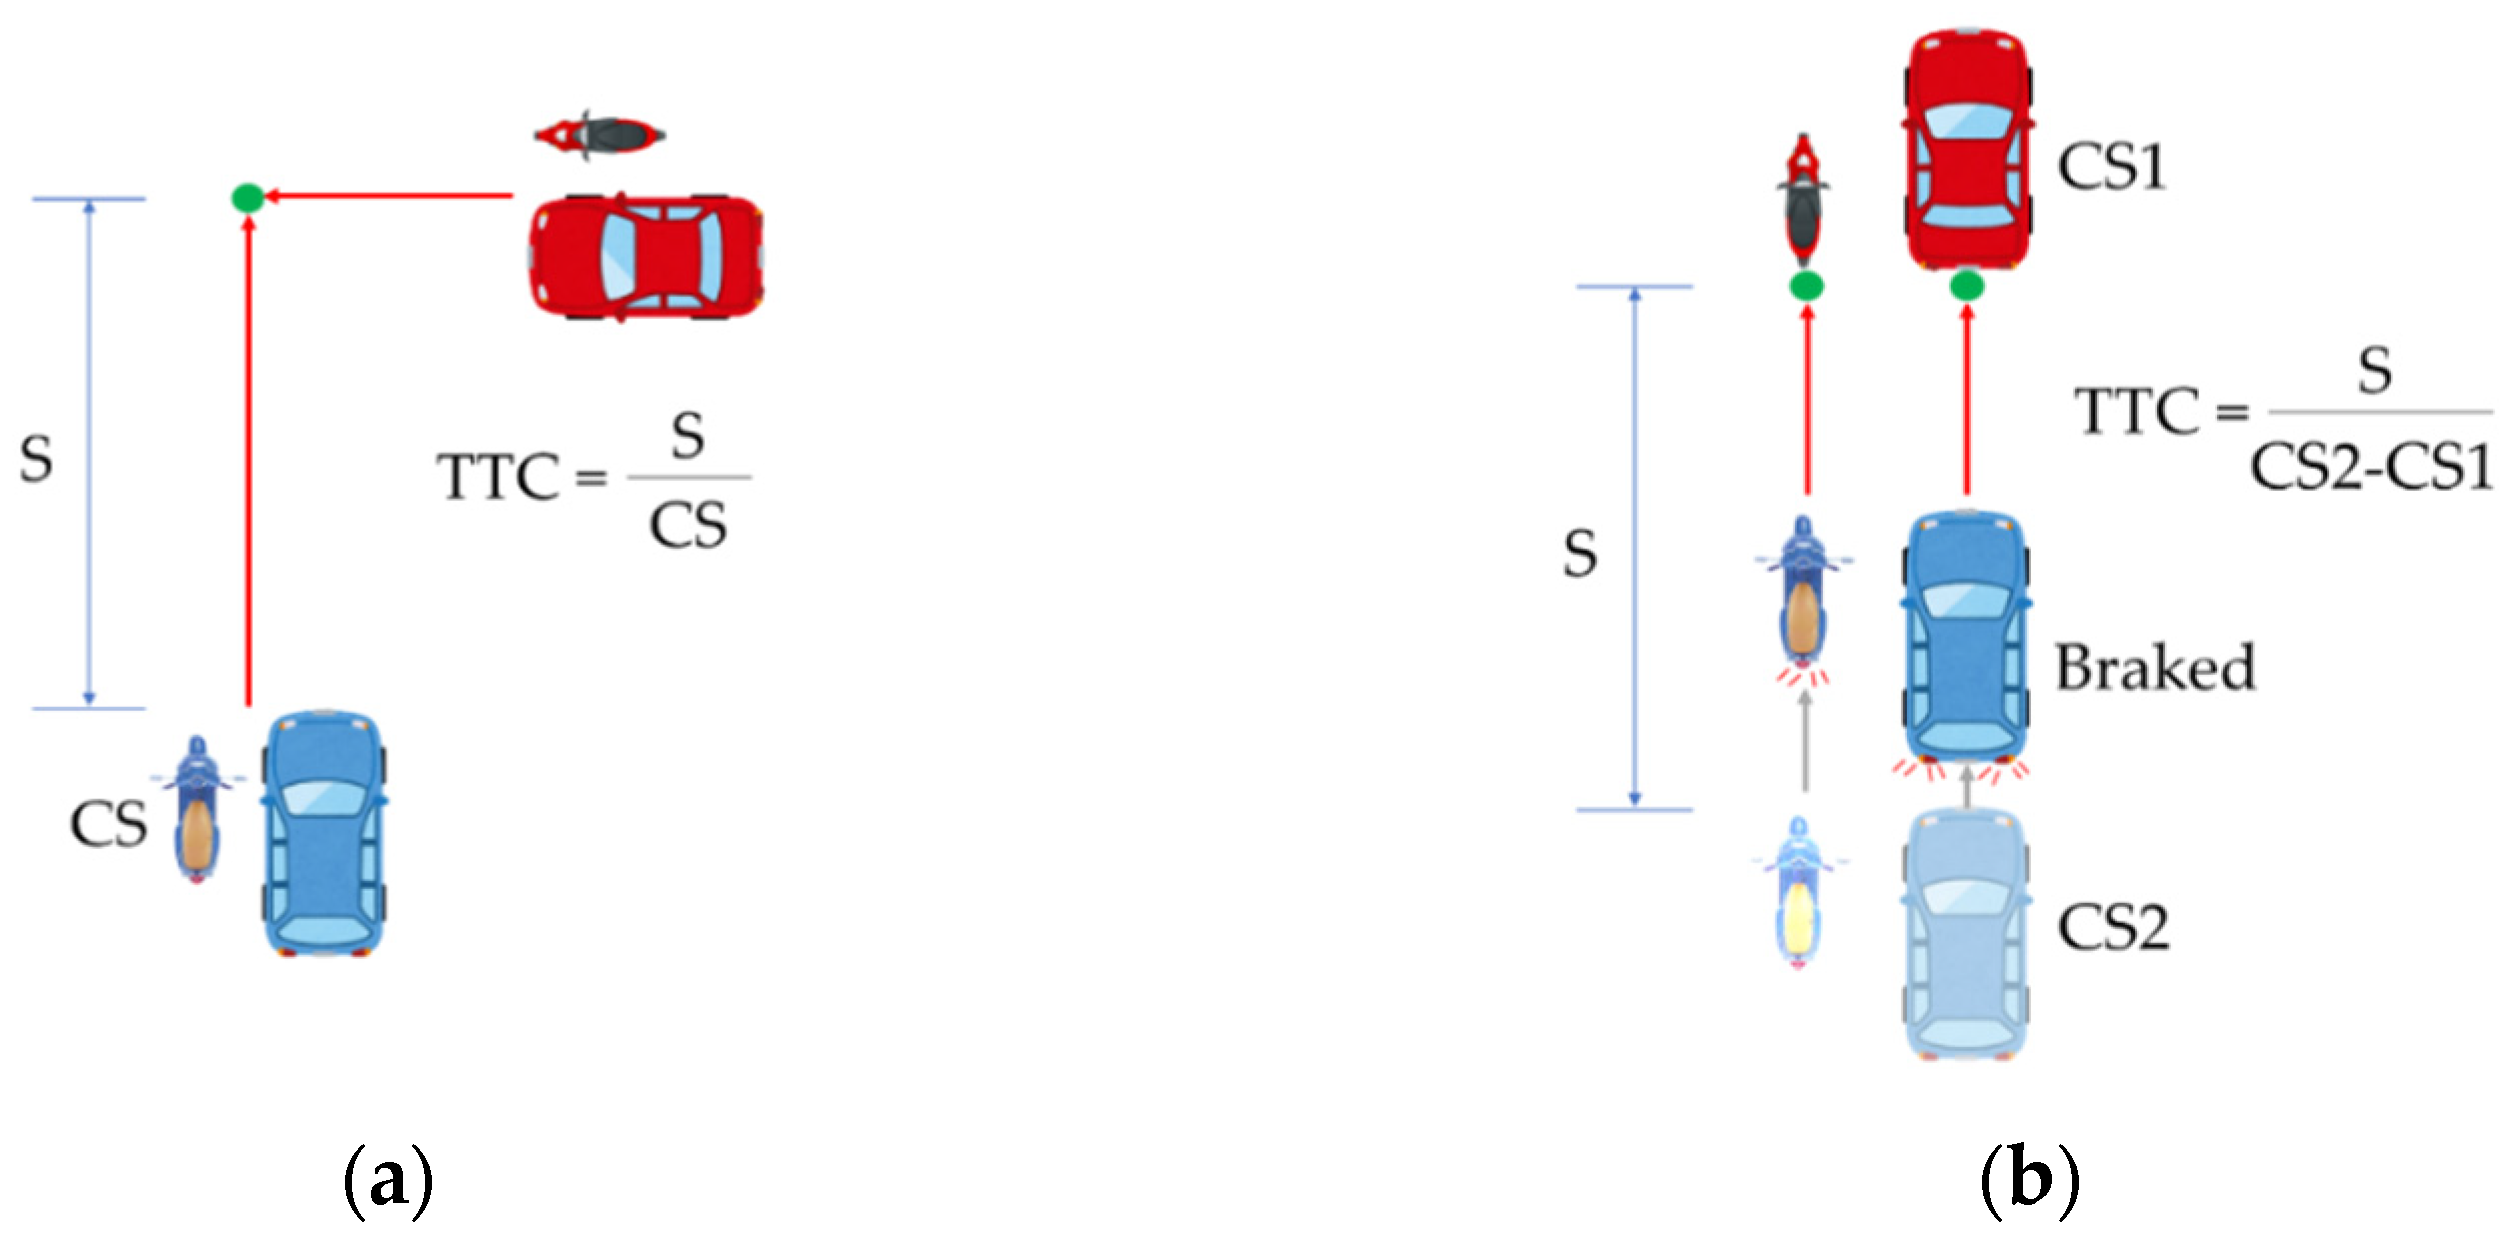
21]. TTC can be calculated by Equation (1).
where S = the conflict distance, which is the relative distance from the position of vehicle taking the evasive action (evasive action point) to the potential conflict point, and CS = the conflict speed, which is the speed of the relevant vehicle while taking the evasive action. The concept of TTC for crossing and rear-end collision at an intersection is shown in
Figure 2.
2.3. Video-Based Traffic Conflict Analytics
Video camera systems have been widely deployed to track vehicles frame by frame and monitor traffic flows at intersections [
27,
28]. Video analytics, which is a technology that uses artificial intelligence to automatically analyze video, has proven to be a tremendous help in smart and sustainable transport systems. It applies computer vision and deep learning to video streams to detect temporal and spatial events of traffic flows. Some applications of video analytics in real-time video streams include vehicle detection, vehicle classification, recognition, and tracking of license plates [
13].
To analyze traffic data from video camera systems, computer vision techniques and object detection frameworks, such as Regional-based Convolutional Neural Networks (R-CNN) [
29], You Only Look Once (YOLO) [
30], and Single-Shot Multi-Box Detector (SSD) [
31] are adapted for vehicle detection. Among object detection systems, YOLO is presented in this study. The YOLO algorithm is an extremely fast and accurate real-time object detection system. It detects objects by using a single neural network to predict multiple bounding boxes and associated class probabilities from an image. It then trains on multiple full images to improve detection accuracy. YOLO can finally learn generalizable representations of objects [
32,
33].
In recent years, video cameras have been applied to traffic conflict analysis in different stages of road safety management. Samara et al. (2020) [
34] applied video analytics and connected cameras to identify risk locations with a high-concentration conflict rate on a road network. Chiu et al. [
35] applied computer vision and image processing methods to diagnose safety issues by observing characteristics of traffic flow, including vehicle types, speed, acceleration, and trajectories, and calculating conflict severity based on TTC and invasion rate of safety space. Lynn et al. (2019) [
13] used an automated video analytics tool to evaluate the surrogate safety measures of low-cost treatment at pedestrian crossings at intersections. The application of a video camera system is still evolving for traffic conflict monitoring and analysis. It requires close attention to technical knowledge, such as selection of cameras, video quality adjustment, and positioning of cameras [
36,
37].
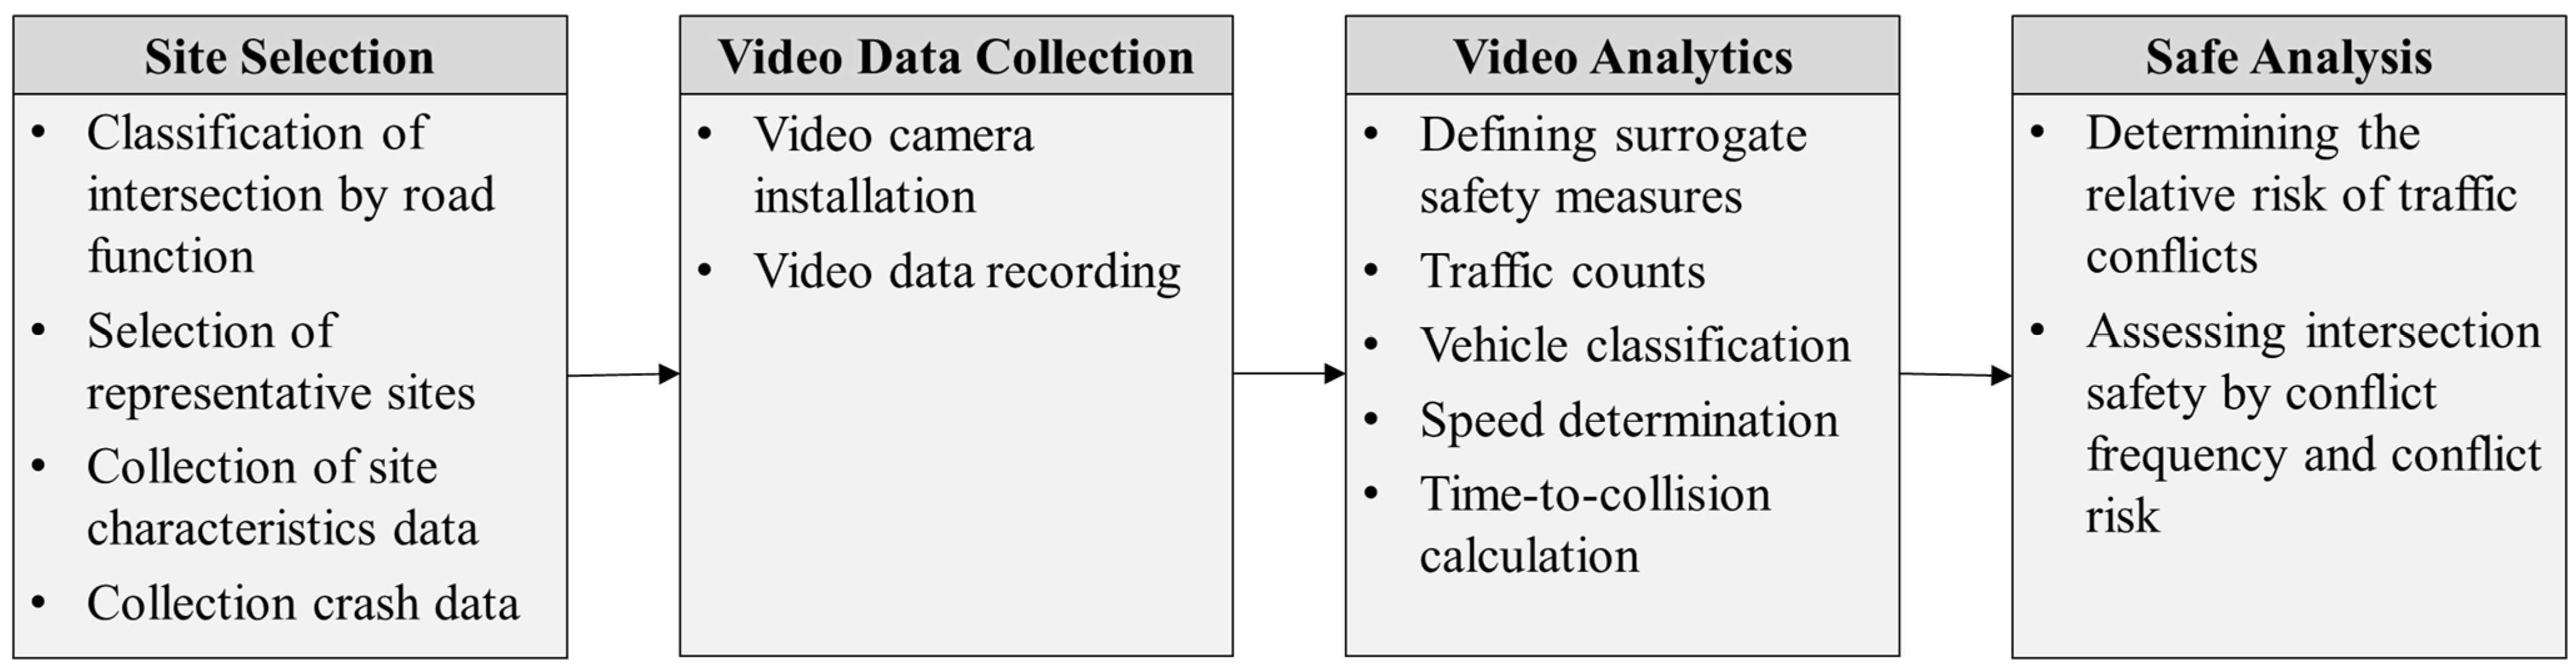
3. Methodology
The research methodology is presented in four stages, as shown in
Figure 3: (1) selection of intersection sites; (2) video data collection; (3) video analytics development; and (4) safety analysis of intersections.
3.1. Site Selection
This study focused on assessing the safety of at-grade intersections under different road functional classifications using video-based traffic conflict analysis. The selection of intersections depends on varying road geometry, functional classes, type of control, crash history, and the feasibility of installing video cameras for proper field of view at intersections.
Typically, roadways can be classified by their functions into four classes: freeways, arterials, collectors, and local roads, according to the type of service [
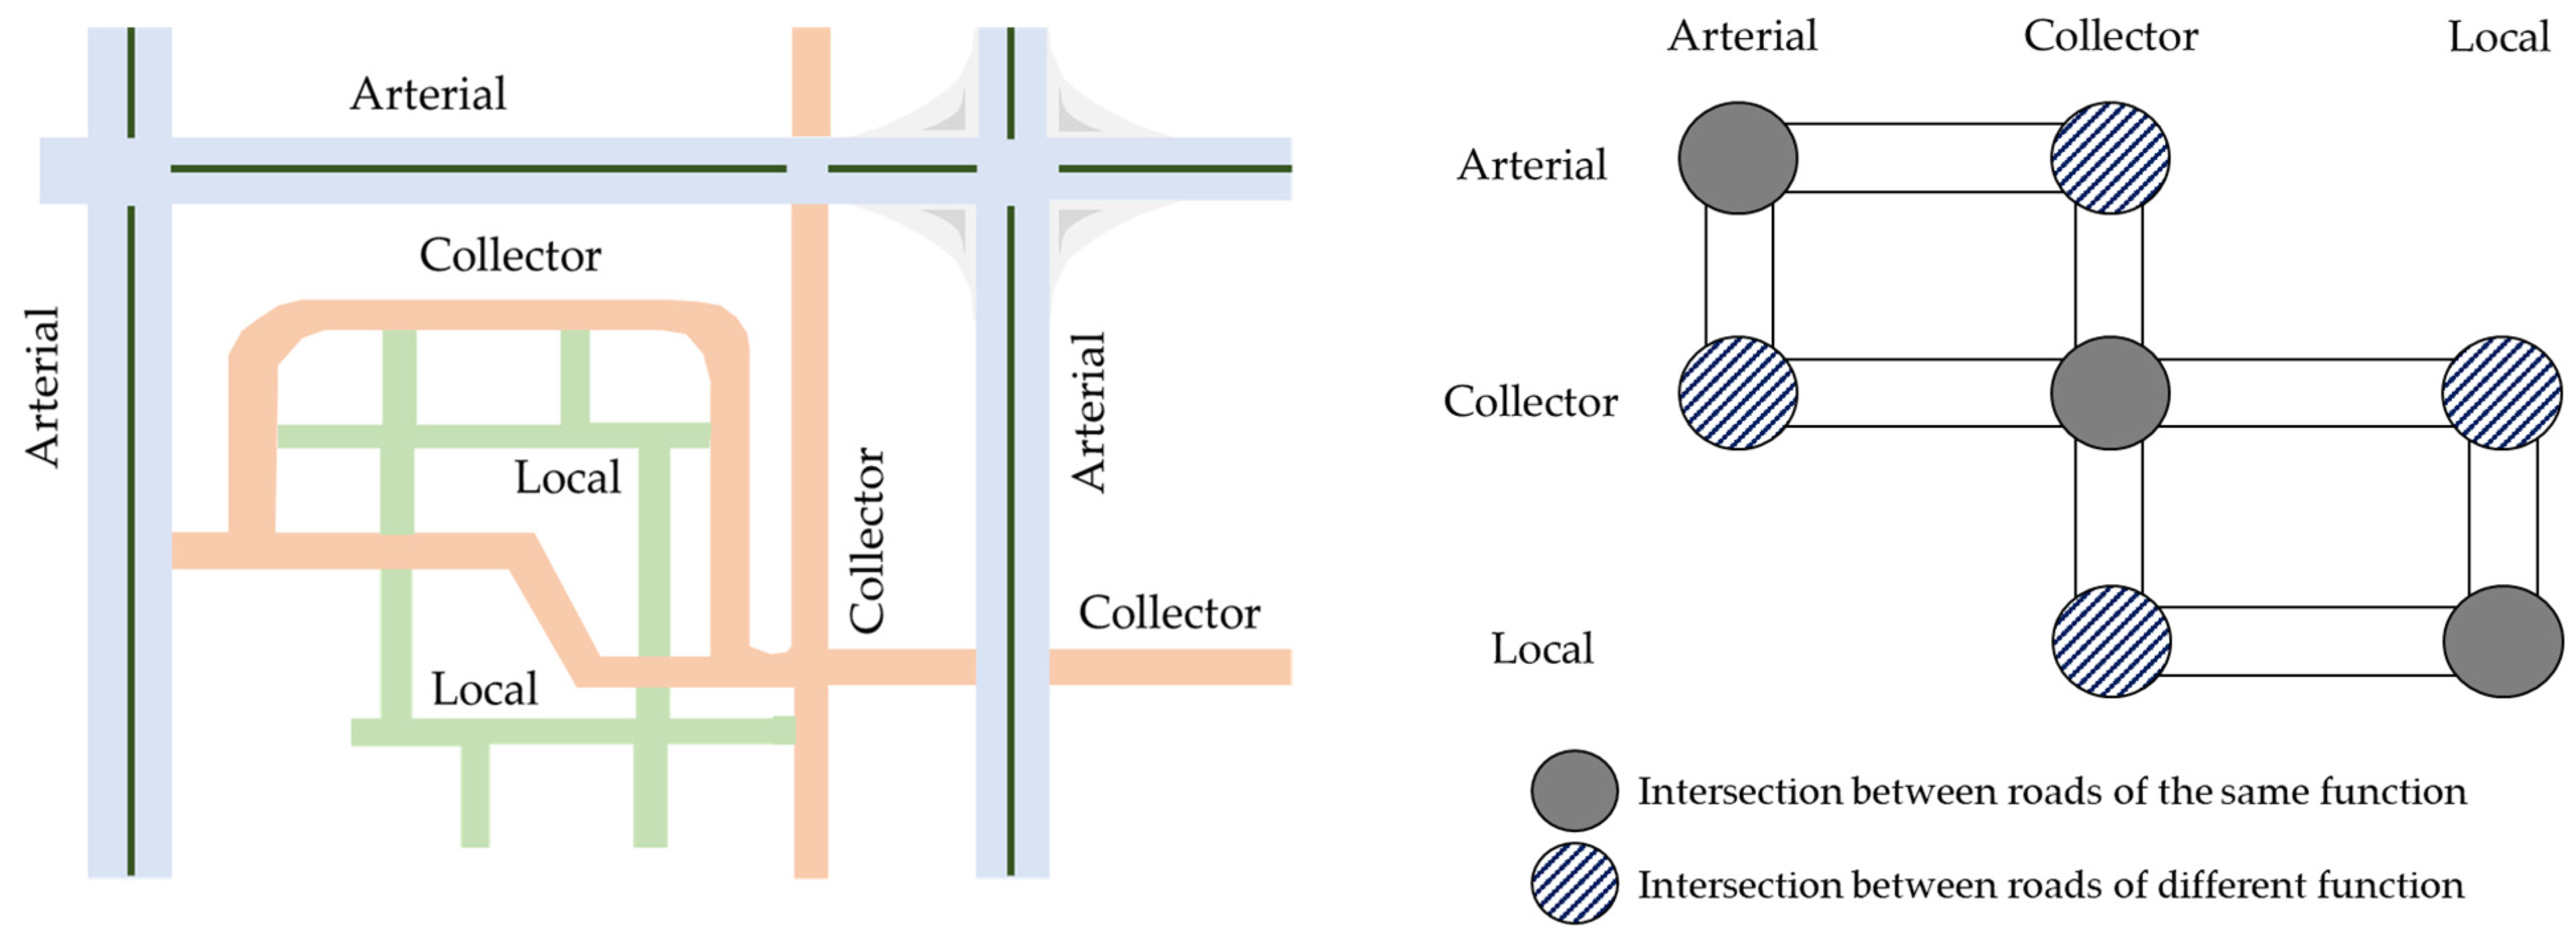
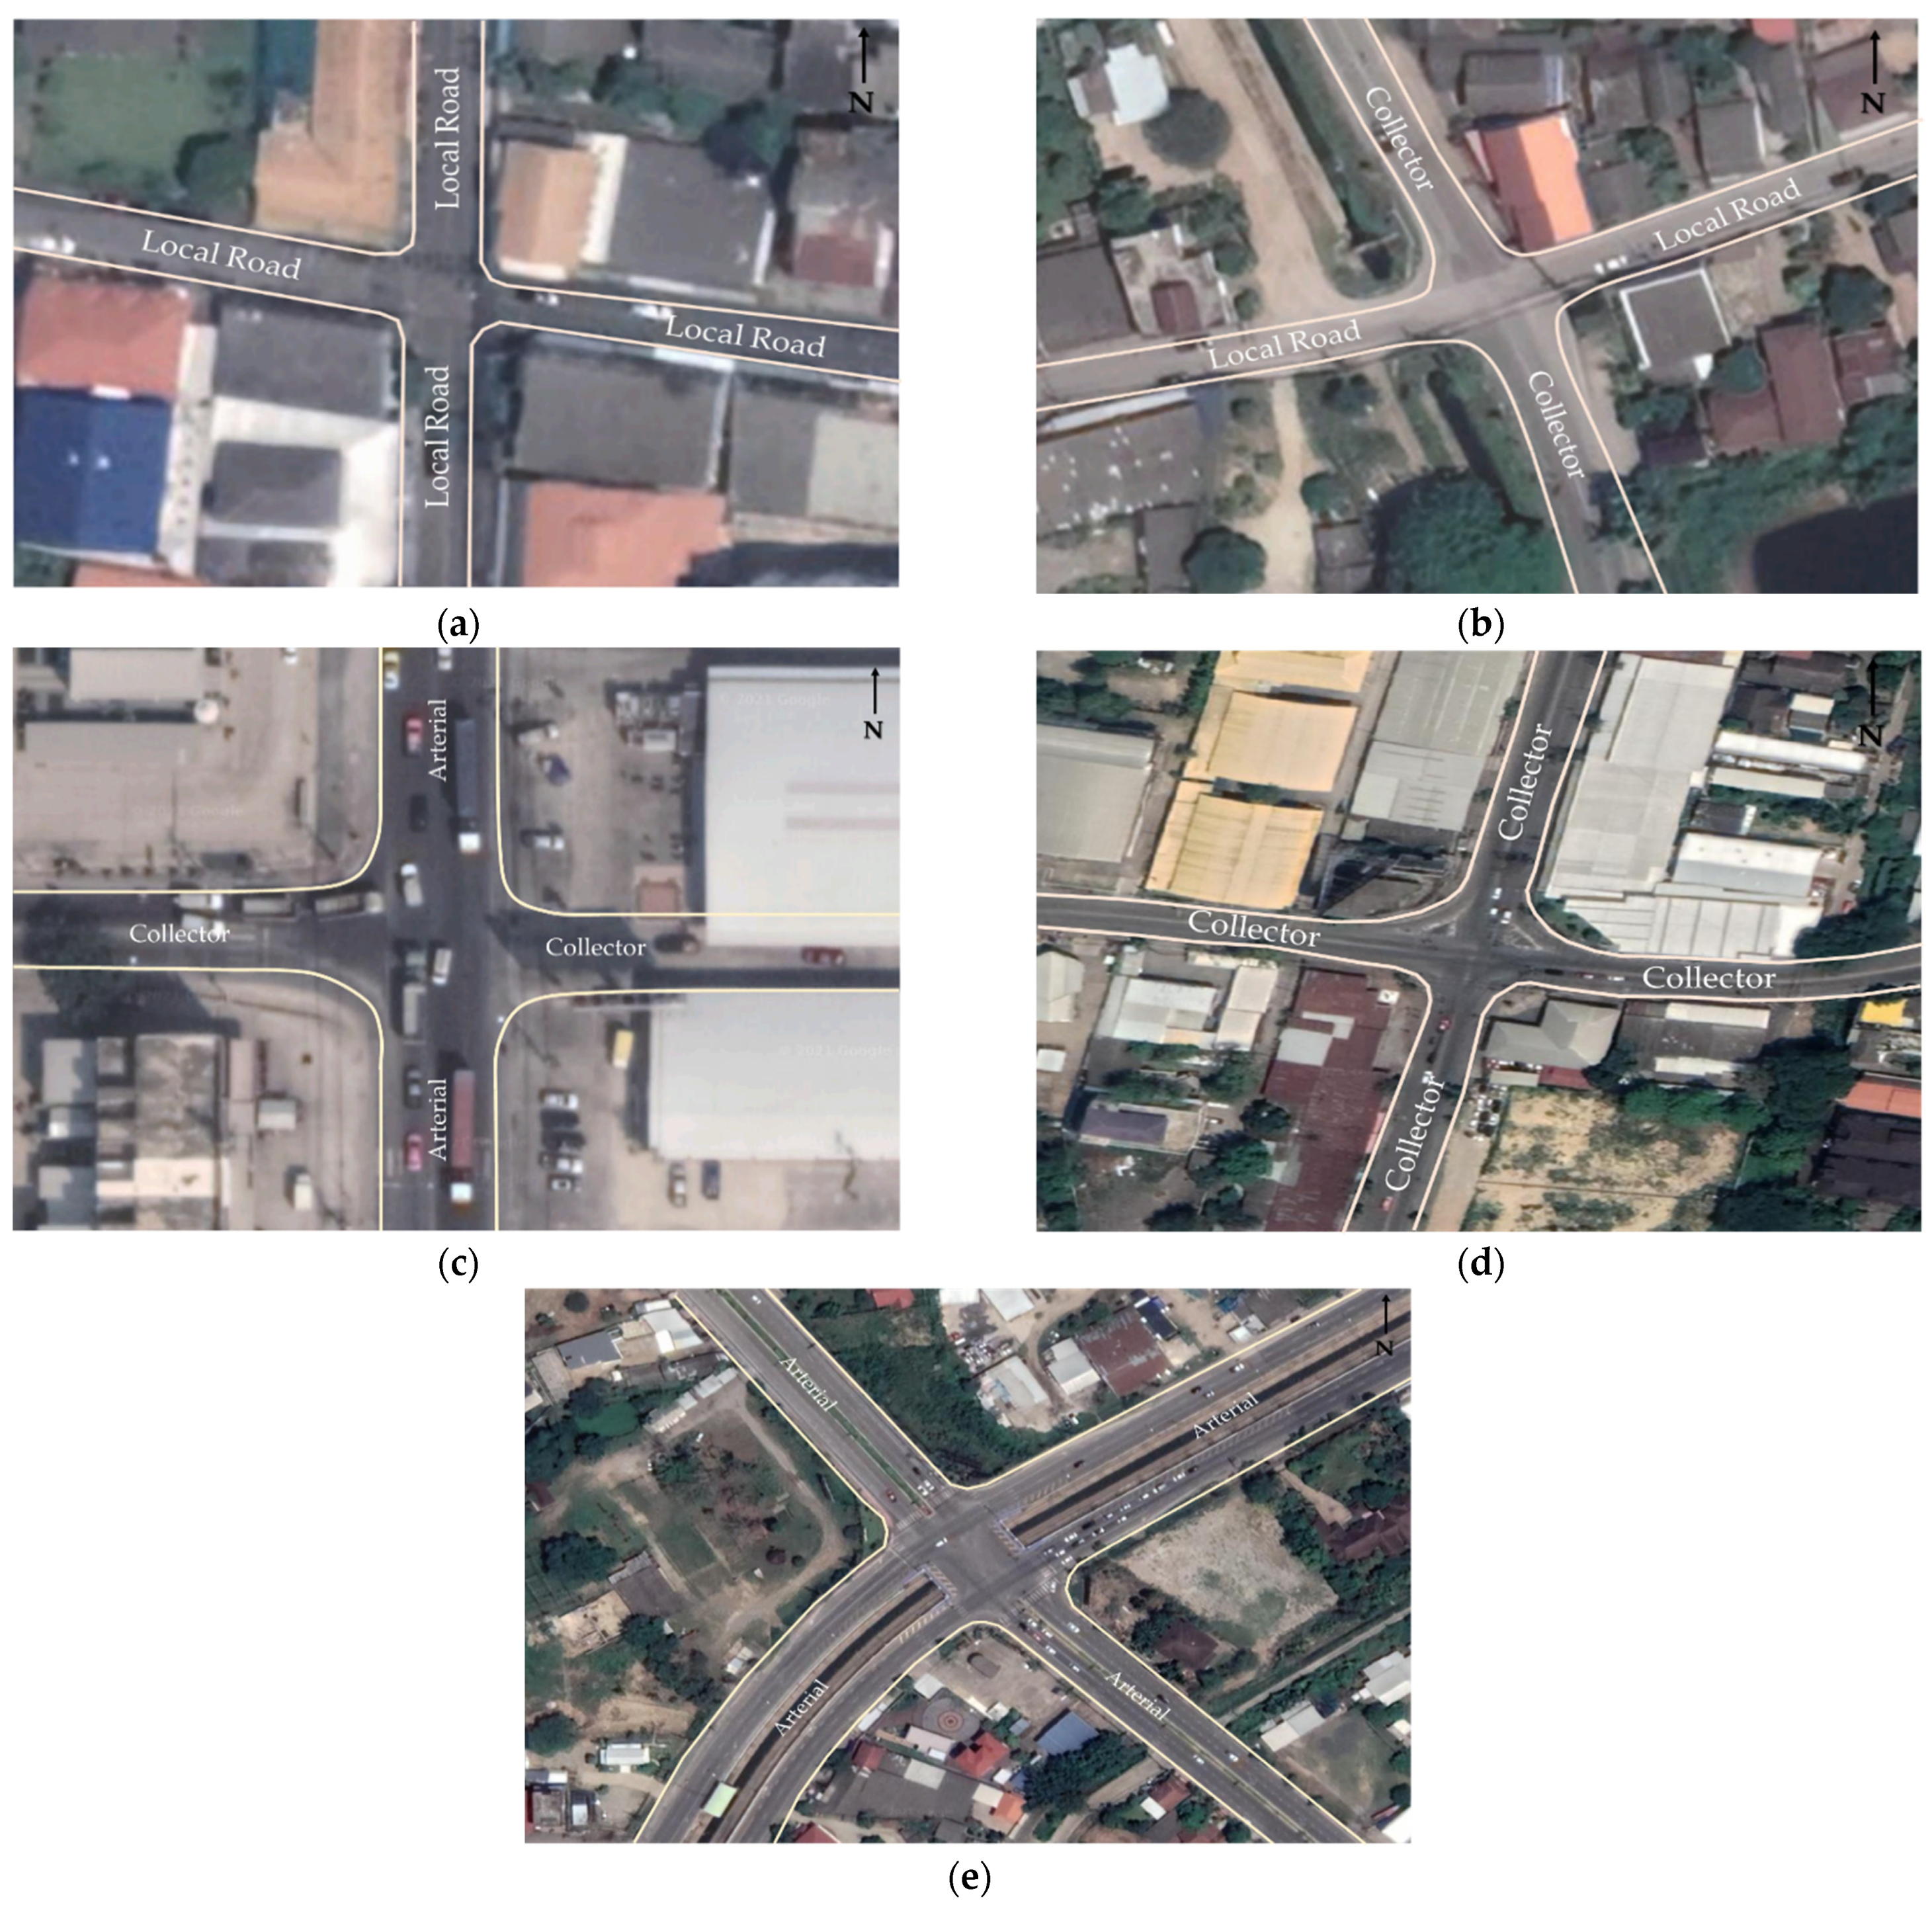
9]. In this study, five at-grade intersection classes according to roadway functional classification on a road network in Thailand were taken into consideration, as illustrated in
Figure 4. The left figure shows a road hierarchy in a road network, while the right figure shows intersection classes in accordance with a road hierarchy. These intersection classes are as follows:
Local-road/Local-road—The intersection of two two-lane local roads intersecting with stop control or without any control.
Local-road/Collector—The intersection of a two-lane collector and a two-lane local road with through/stop and local road stopping.
Collector/Arterial—The intersection of a collector (minor road) and an arterial (major road) with through/stop and collector stopping.
Collector/Collector—The intersection of two collectors with signal control.
Arterial/Arterial—The intersections of two arterials with signal control.
Figure 5 illustrates the layout of intersection sites with respect to these five intersection classes. Each intersection class differs in roadway geometry, traffic condition, and type of control. For each intersection class, three intersection sites with comparable geometries and configurations in Thailand were selected as case studies. A total of 15 intersection sites were examined.
Table 1 summarizes the basic statistical data, including intersection type, crash data, traffic volume, proportion of vehicle types, and vehicle speed associated with all intersection sites.
3.2. Video Data Collection
Performing observations of traffic conflict in the field is a difficult task, which requires full attention throughout the study period. Thus, it is always recommended to complement field observations with video recording due to its flexibility and reliability.
To efficiently monitor traffic conflicts, it is recommended that the video cameras be positioned as high as possible to get a top view to address the occlusion problem. Nevertheless, for conflict detection at urban intersections, the video cameras are usually installed at the roadside poles and from all directions to cover the entire intersection without occluding serious vehicle situations due to the low vertical and lateral viewing angles [
38,
39,
40].
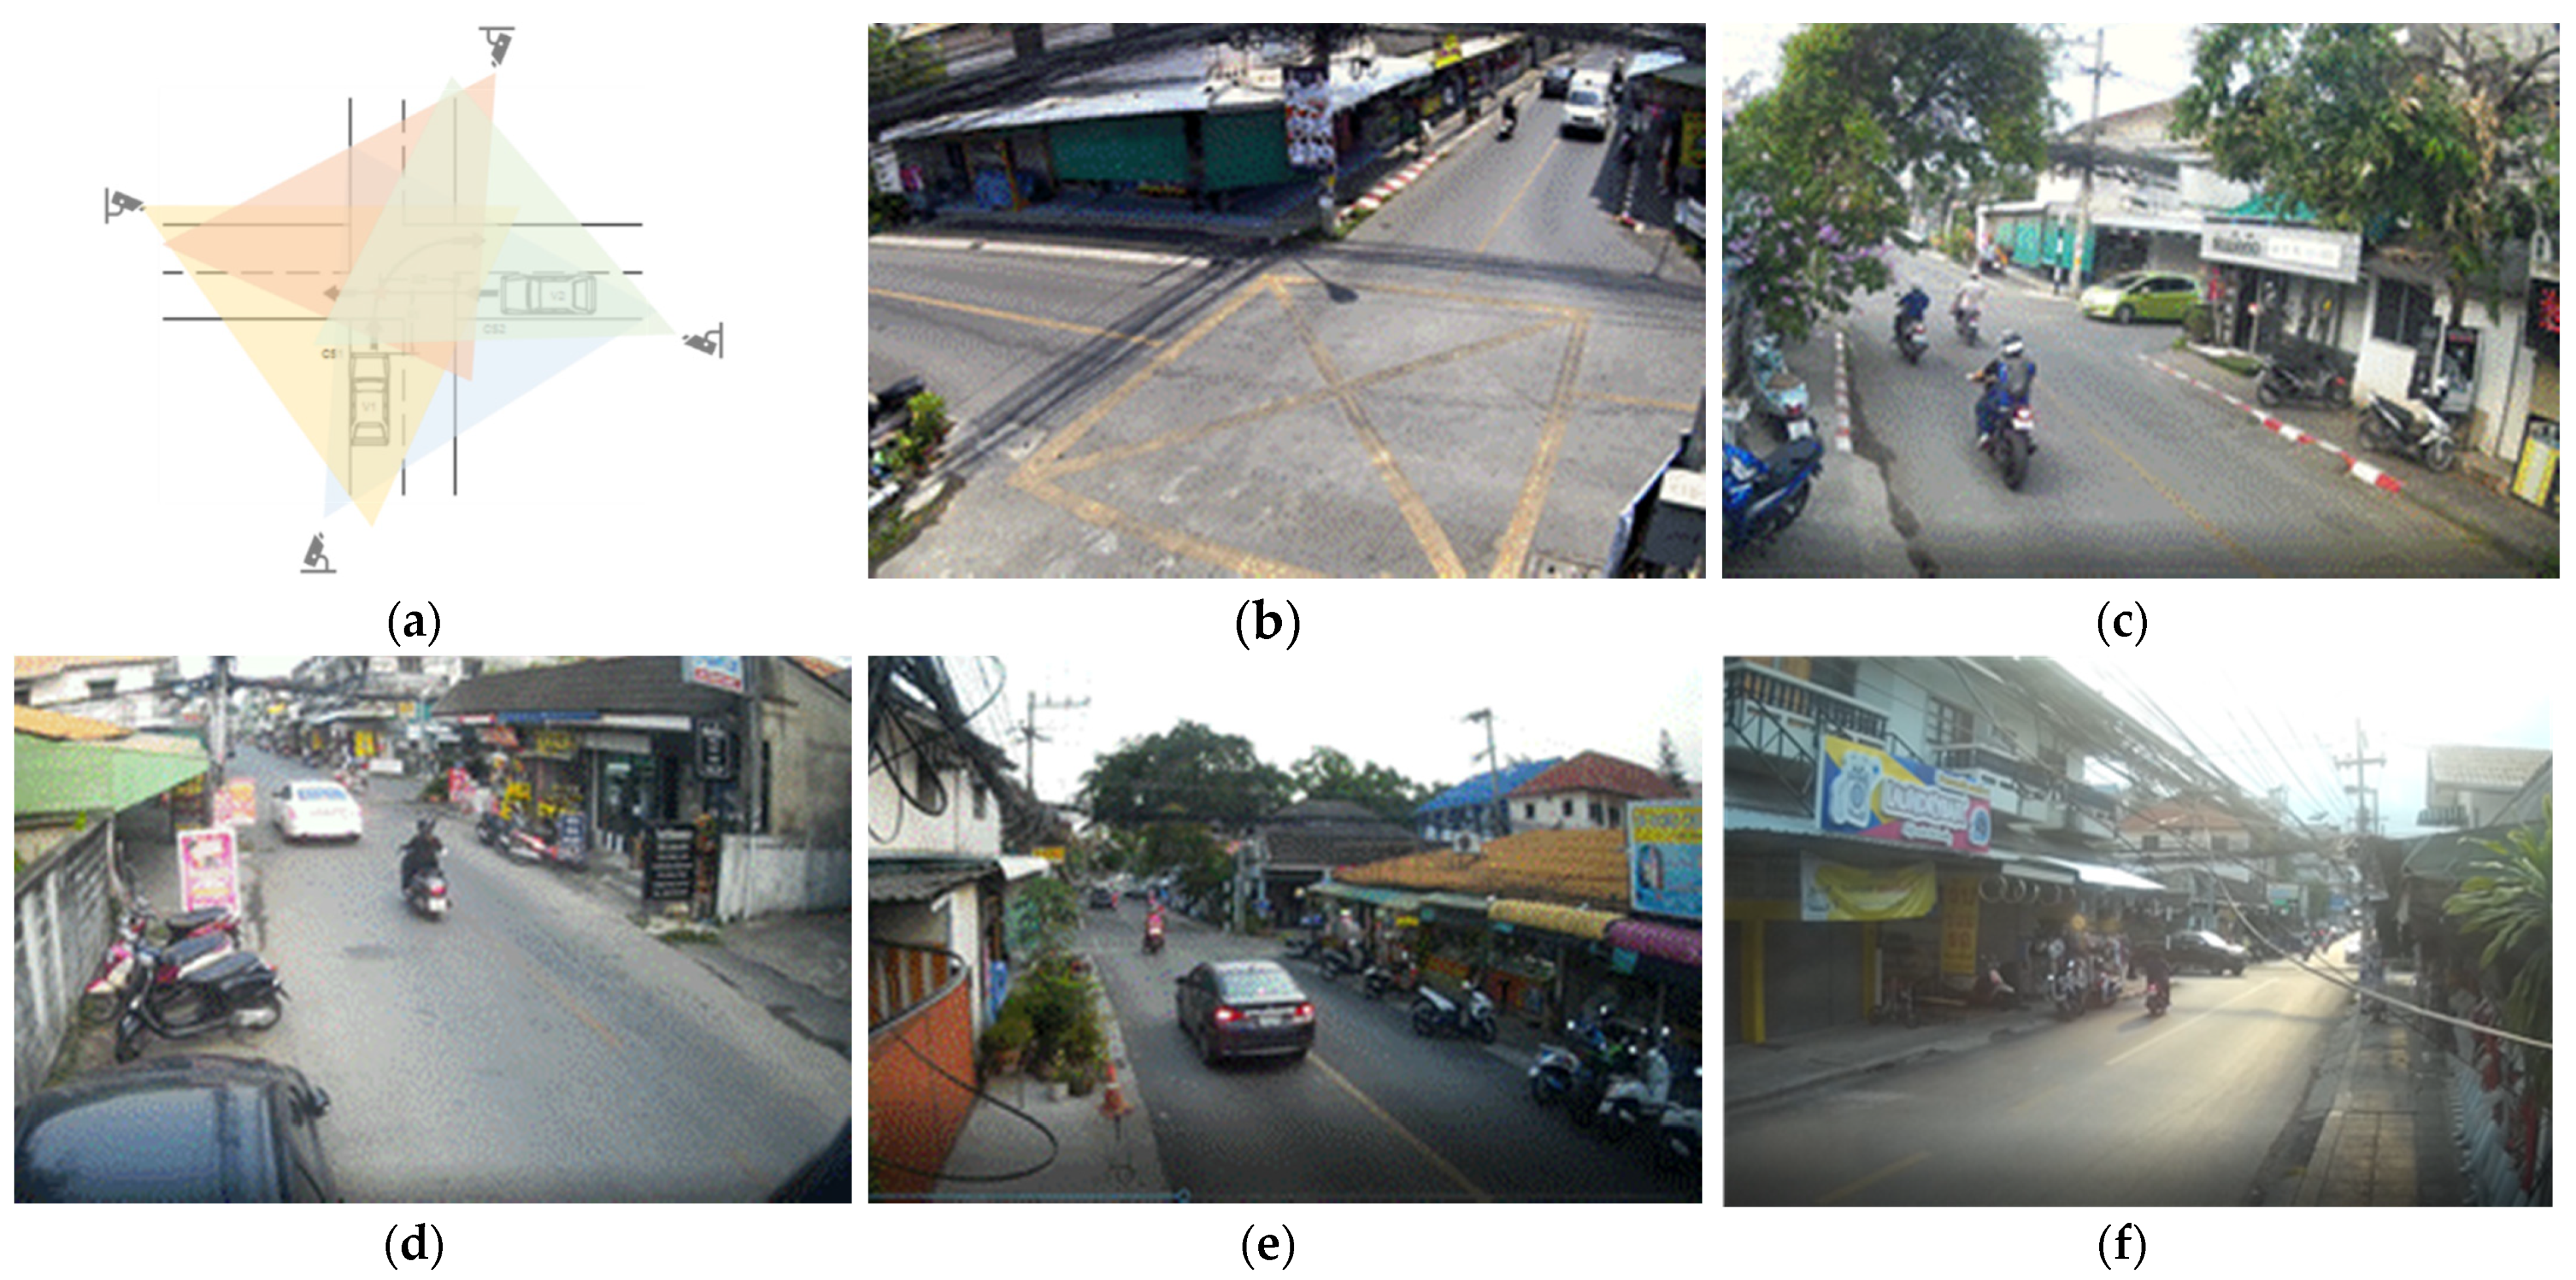
In this study, video camera systems were deployed at the selected intersections to record vehicular traffic movement that generates crash risk exposure. Video cameras were installed at each of the intersection approaches, in addition to the closed-circuit television (CCTV) at the intersection area, as illustrated in
Figure 6. All video cameras were positioned at a minimum of four meters height and were faced towards the intersection area five meters away from the intersection for measuring distance and detecting the speed of conflict. The study set up the video cameras and recorded the traffic at the intersection for at least 12 h from 7:00 a.m. to 7:00 p.m. from March to May 2021 for monitoring the number of expected vehicle conflicts by vehicle types and conflict types.
3.3. Video Analytics
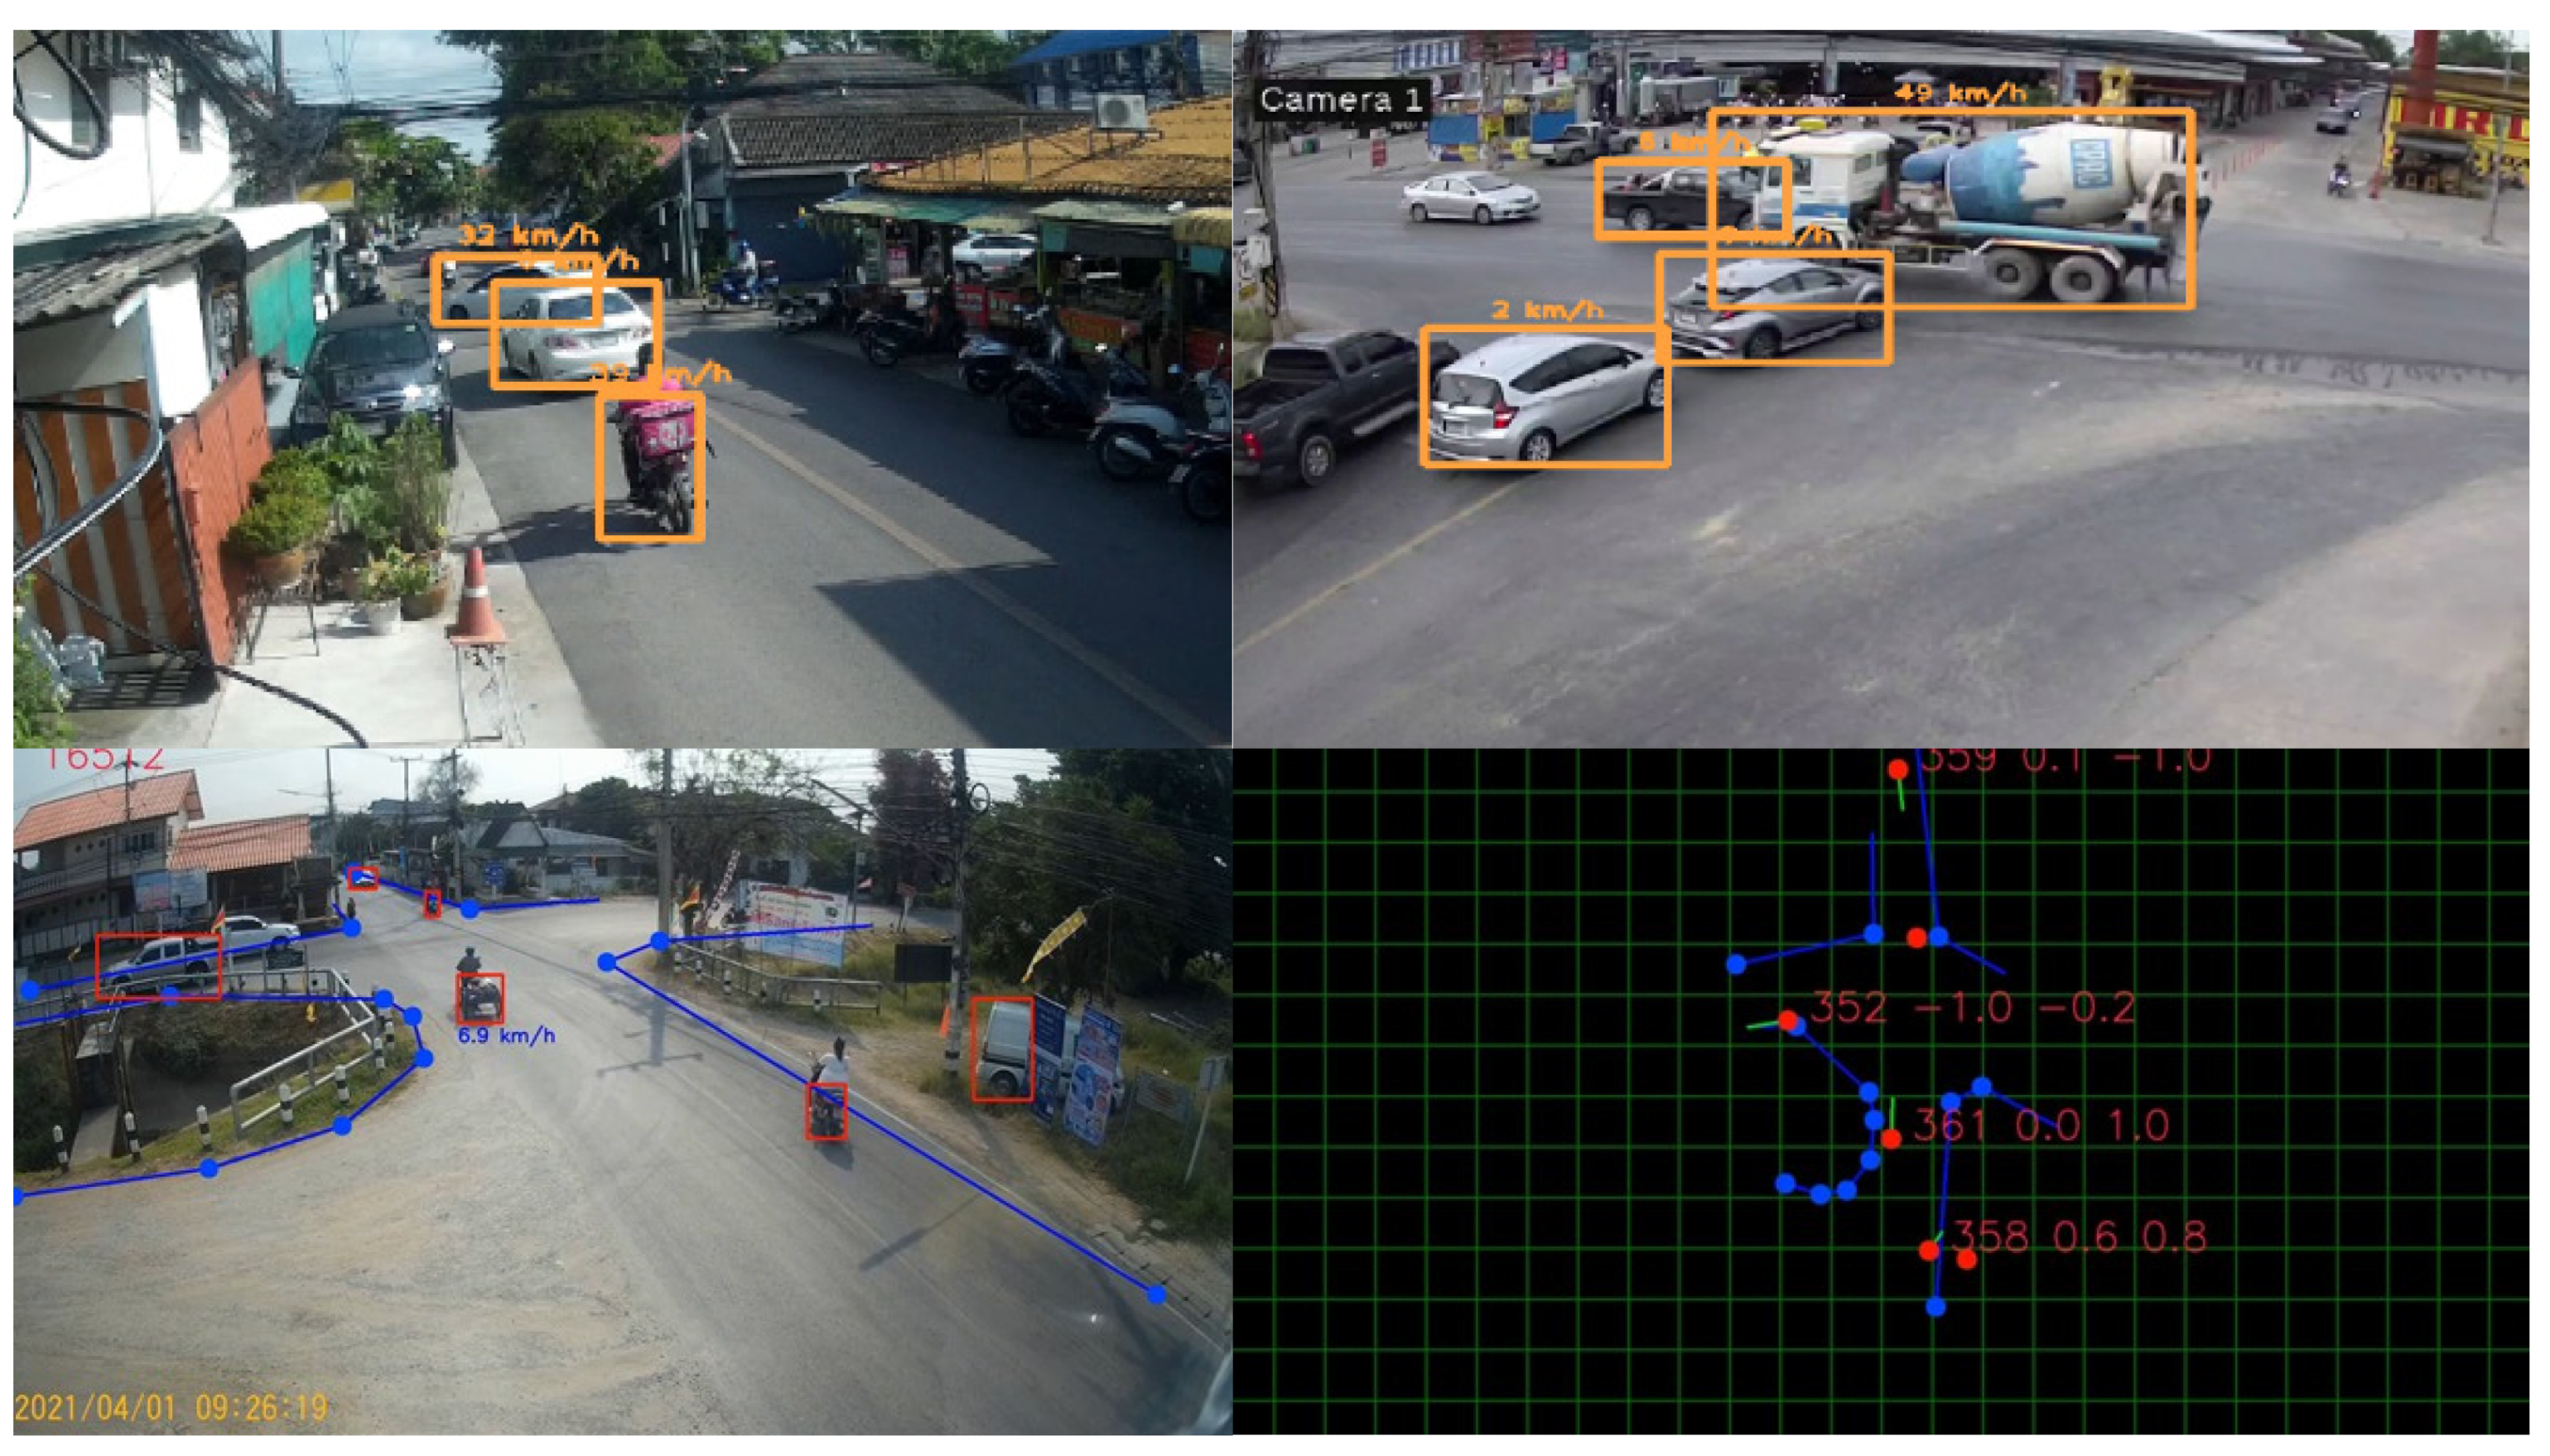
After recording videos at intersection sites, video data were then processed using computer software. The study used the YOLO algorithm for vehicle detection. It is capable of processing more than 25 frames per second with a resolution of 960 × 480 pixels. It detects the vehicles by providing definition with a bounding box output and learning classification for detecting different types of vehicles (e.g., motorcycles, cars, trucks, etc.). The system is based on an Intel Core-i7 platform that operates at 2.2 GHz and is equipped with 16GB SRAM and NVIDIA GTX1080 of GPU.
The YOLO algorithm processes data on a vehicle moving in a video with respect to its basic characteristics of shape and position and generates frame-by-frame detection and tracking of all vehicles in an intersection. Data from cameras were processed to detect and classify vehicles into three types (i.e., motorcycles, cars, and trucks). The deep learning algorithms were trained on over 1000 sample images. After 3000 iterations of training, the detection and classification accuracy were 94% and 97%, respectively.
In addition, the study determined and calculated the object’s motion vector in intersection areas to solve the occlusion problem commonly discovered in the video stream. The software mapped the points in the video corresponding to coordinates in the intersection area. It tracked vehicles in the video to generate trajectories, position, and speed profiles of vehicles. For every possible traffic conflict, the software detected the evasive action point of vehicles and defined the potential conflict points to estimate conflicting speed and time-to-collision (TTC) of individual conflicts.
Figure 7 presents the vehicle detection and vehicle tracking systems developed for this study.
3.4. Safety Analysis
There are many approaches to measure intersection safety, including crash data, behavioral observation, and conflicts. This study analyzed an intersection to determine its relative level of safety based on conflicts. The study performed a traffic conflict study to count the number of conflicts and applied a traffic conflict technique to assess the conflict risk. In this study, the risk of conflict was viewed by two measures.
The first dimension is the time-to-collision (TTC). TTC is related to the probability of a crash. Lower TTC value corresponds to higher chance of collision (crash likelihood). The study by Sayed and Zein [
14] recommended the threshold of TTC values at 1.0, 1.5, and 2.0 s for the measure of safety with a high, moderate, and low risk, respectively. Vuong (2017) [
41] applied the 85th percentile of TTC as the cut-off between serious and non-serious conflicts.
Another dimension is the speed of the relevant vehicle. Vehicle speed is related to the risk of human injury and death when involving a crash. Higher speed corresponds to higher chance of injury (crash severity) [
42,
43,
44]. According to the principles of sustainable safety, vision zero, and safe system approach, the safe speed is introduced for road design. The speed of the vehicle directly affects the probability of a fatality or serious injury involving a collision. The safe speed varies according to collision configurations, such as up to only 30 km/h in a vulnerable-road-user-related collision, up to 50 km/h in a side collision between vehicles at an intersection, and up to 70 km/h in a head-on collision [
1,
45,
46]. It is recommended that speeds at different probabilities of a fatality or serious injury are chosen to represent different levels of collision severity [
13,
47,
48].
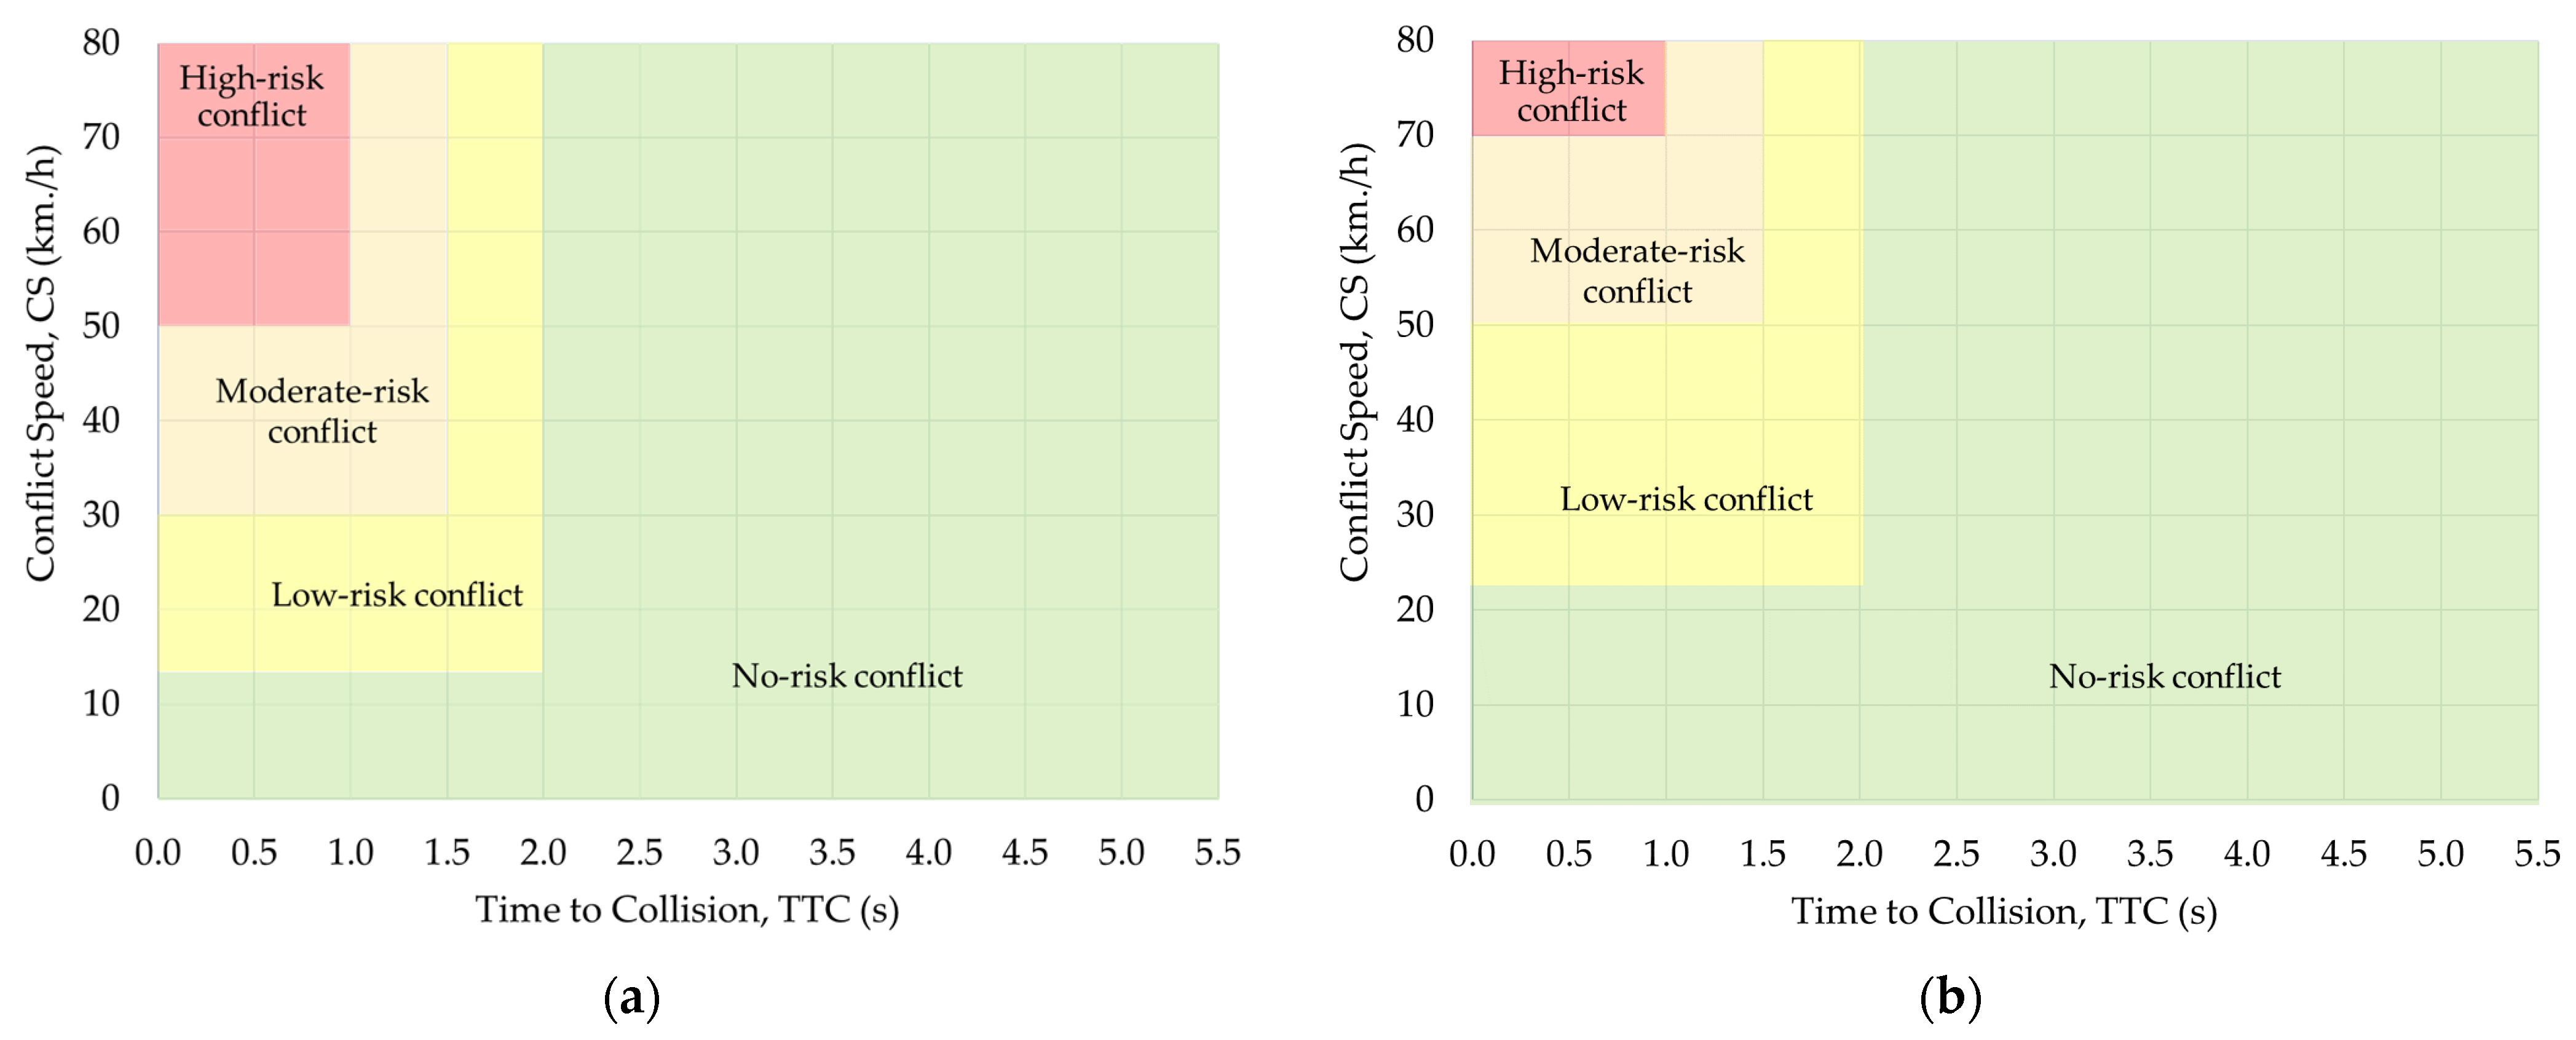
This study highlighted the need to distinguish the risk between vulnerable road users (e.g., motorcyclists) and other vehicles. Motorcyclists can tolerate a lower impact speed than drivers for any collision types. The study applied different thresholds of speed for motorcycles and cars to define conflict risk. The speeds of 15, 30, and 50 km/h for motorcycles and 25, 50, and 70 km/h for cars, which correspond to the probability of a fatality or serious injury at 0.05, 0.10, and 0.85, were defined as low-risk, moderate-risk, and high-risk conflict, respectively [
46,
49].
Table 2 shows the threshold of time-to-collision and vehicle speed used to classify the risk of conflict.
Figure 8 illustrates risk-of-conflict (ROC) diagrams for motorcycle-related collision and car-related collision at intersections. Each diagram is divided into four regions as follows: high-risk conflict (in red), moderate-risk conflict (in orange), low-risk conflict (in yellow), and no-risk conflict (in green). It shows that the conflict risk is high when TTC is low and vehicle speed is high.
To assess the safety of intersections, the risk of conflict is introduced as the conflict rate between the number of conflicts at risk and number of all interactions (of two vehicles) during the same period (see Equation (2)). In other words, it is the risk for an interaction (of two vehicles) to develop into a conflict at risk.
where ROC = risk of conflict; N
H, N
M, and N
L = number of conflicts at risk consisting of high-risk conflicts, moderate-risk conflicts, and low-risk conflicts, respectively; and N = number of all conflicts (both conflicts at risk and non-risk conflicts)
4. Results and Discussion
This study applied video-based traffic conflict analysis to investigate the conflict risk of vehicles at different intersection sites in Thailand. The results are presented in two respects: the analysis of traffic conflicts, and the analysis of the risk of intersections.
4.1. Analysis of Traffic Conflicts
Using video analytics for a traffic conflict study, thousands of vehicle conflict situations (or interactions) were detected at each intersection site. For each intersection site, the number of traffic conflicts were recorded from 7:00 a.m. to 7:00 p.m. (12 h). It is noted that video analytics were applied only in the daytime. Two main conflict types were observed: crossing conflicts between vehicles from two directions at the intersection area and rear-end conflicts between vehicles at intersection approaches. Traffic conflicts were then classified by types of vehicles involved in the conflict. The three types of vehicle conflicts were: motorcycle–motorcycle (MC-MC) conflicts, motorcycle–car (MC-Car) conflicts, and car–car conflicts.
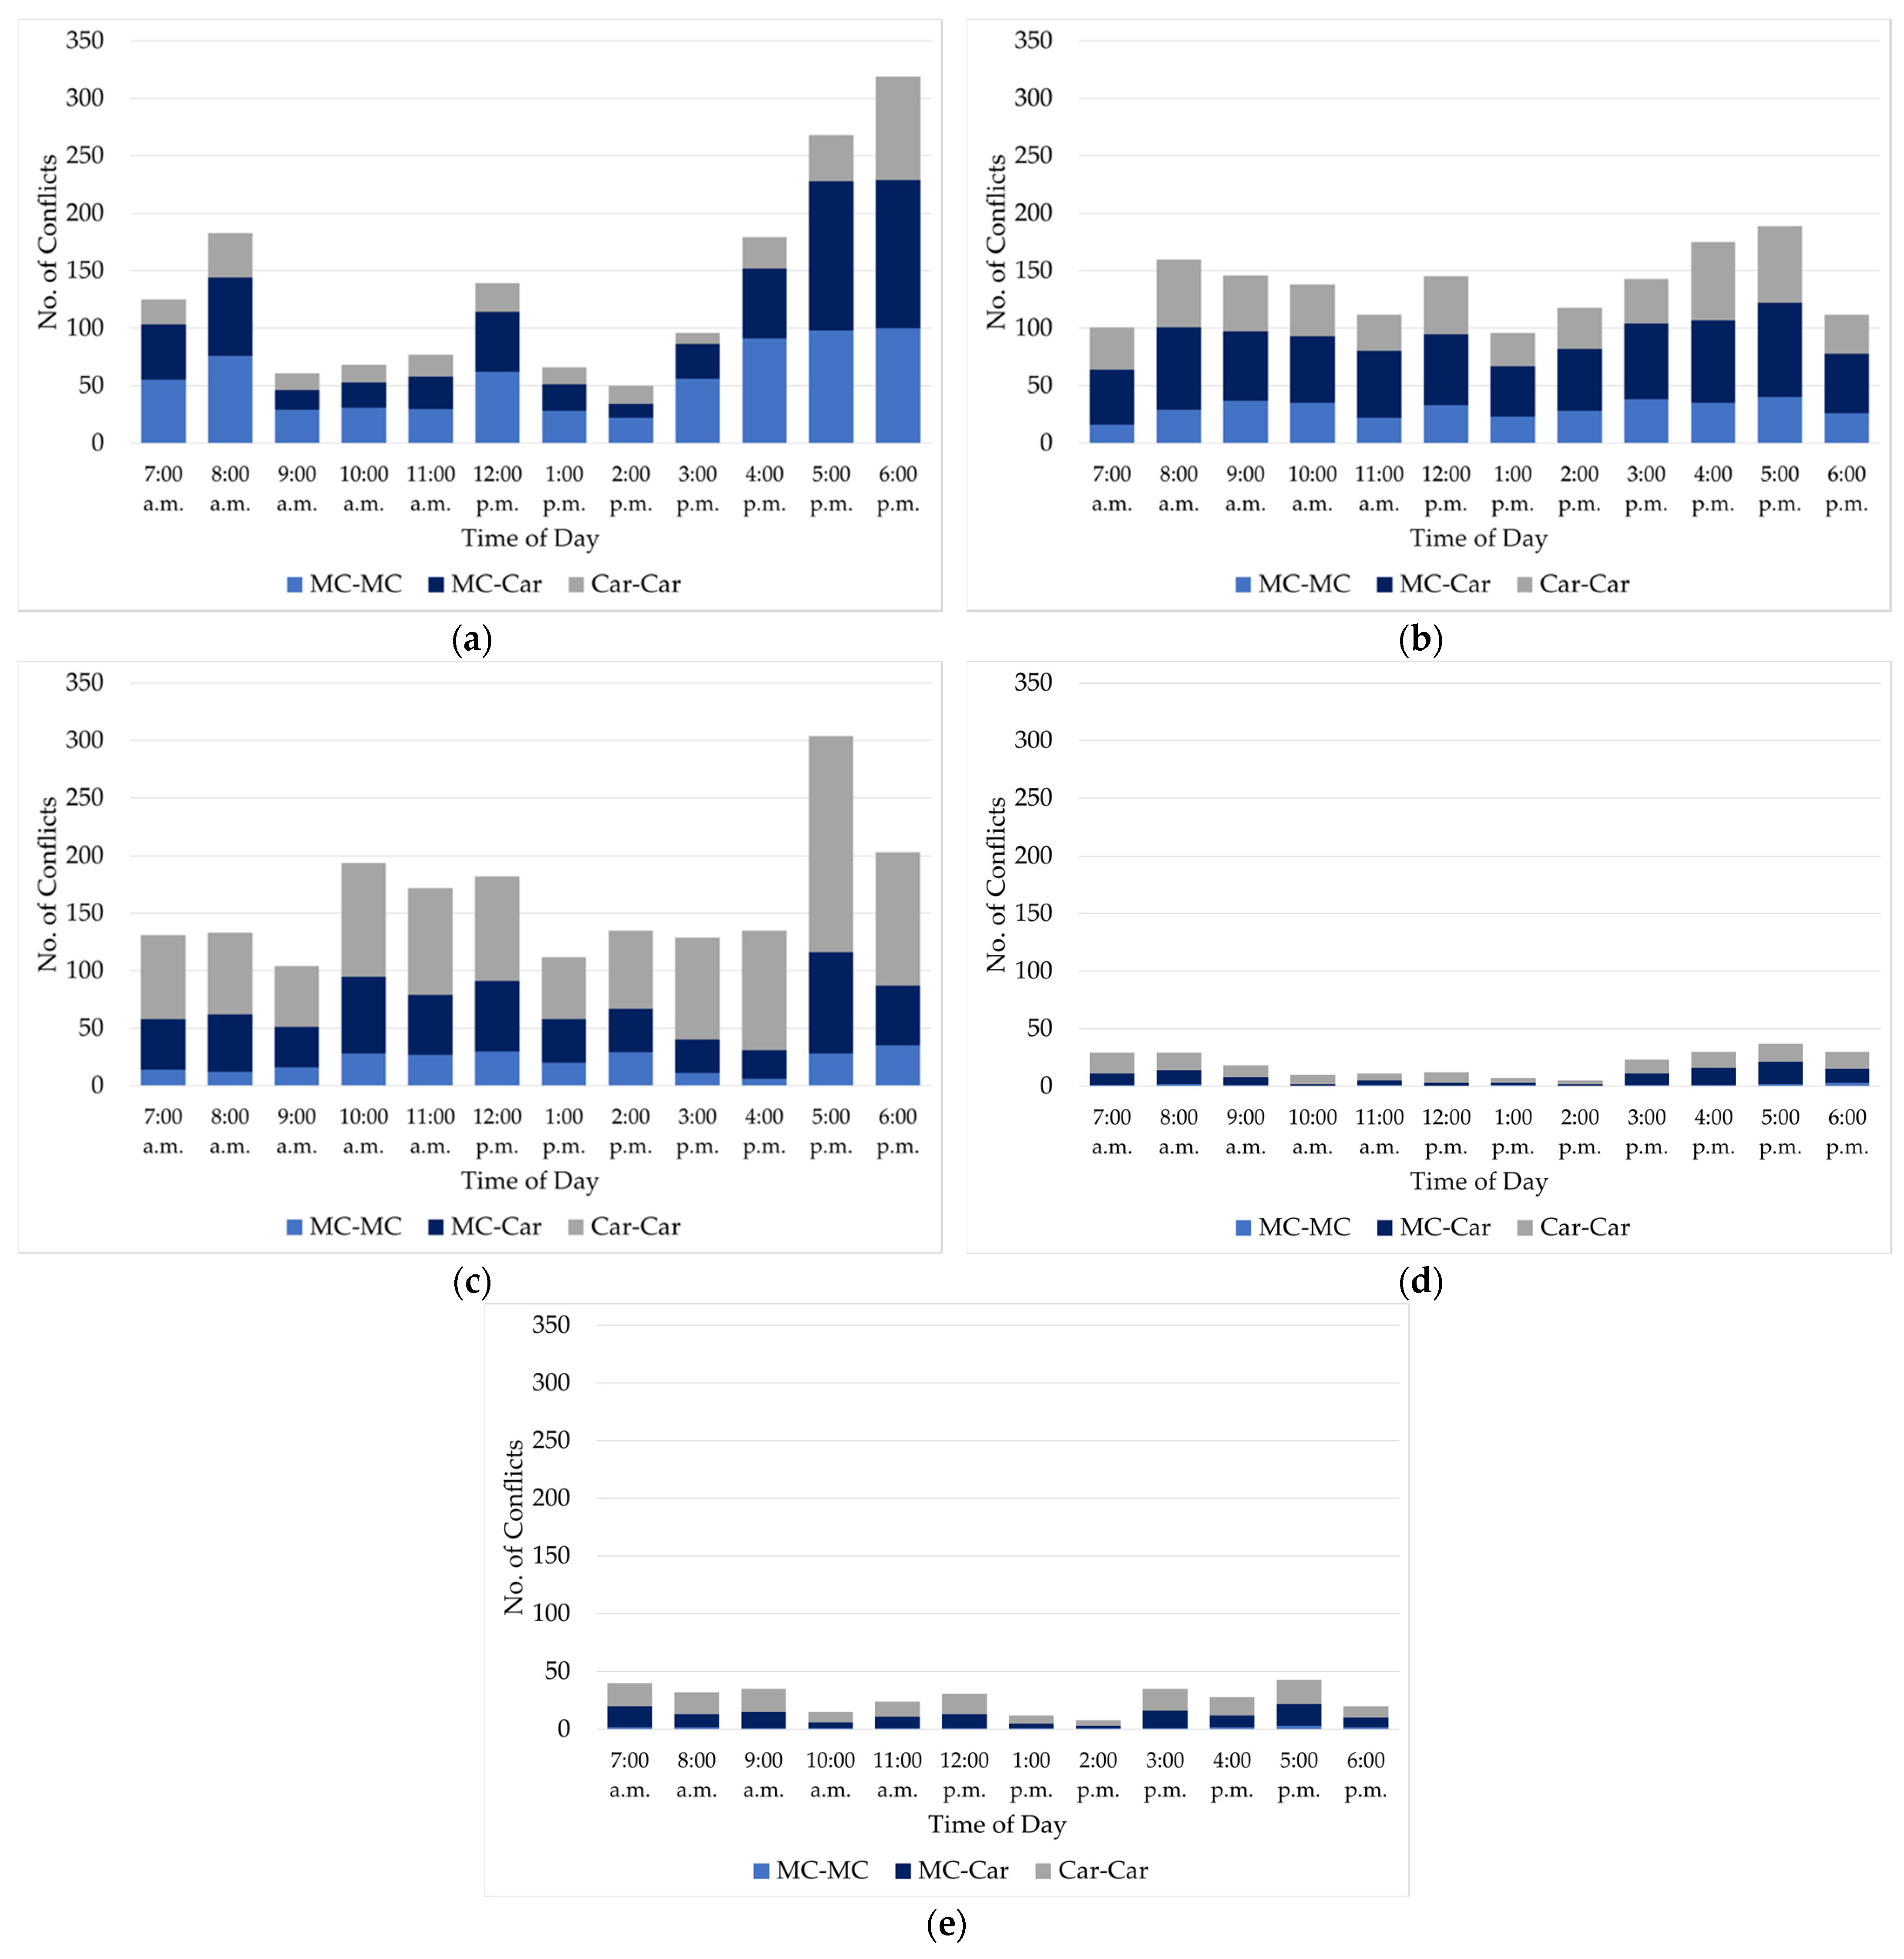
First, consider the vehicle types involved in a conflict.
Figure 9 plots the frequency distribution of traffic conflicts associated with the five classes of intersection. The figures present the number of conflicts classified by three vehicle conflicts (i.e., MC-MC, MC-Car, and Car-Car) from 7:00 a.m. to 7:00 p.m. (12 h) at one site of each intersection class. The results showed that motorcycle-related conflicts (both MC-MC and MC-Car) were high at intersections on local road networks, while car-related conflicts were high at intersections on collectors and arterials. This also showed that the conflict frequencies at signal-controlled intersections are much fewer than those at stop/no control intersections.
Next, consider the two conflict types (crossing and rear-end conflicts) at intersections.
Table 3 presents the basic statistics of traffic conflicts among the five intersection classes. The table shows the conflict frequencies and their 95% confidence interval of surrogate safety measures (time-to-collision and conflict speed) associated with crossing and rear-end conflicts.
The results revealed that conflict frequencies and surrogate indicators were varied among intersection classes. Further observations are as follows:
Local-road/local-road intersections. Traffic conflicts were frequent. The range of TTC value was small, and speed was the lowest. This might be because the right-of-way at this class of intersections was ambiguous for road users and led to inconsistent yielding behavior. Most motorists first came to stop at an intersection, but quickly departed from the intersection.
Local/collector intersections. Traffic conflicts were also frequent, but TTC value was longer, and speed was higher than intersections with two local roads. This might be because this class of intersection was clearly visible but had a lack of appropriate regulatory control devices. Motorists on both roads passed through an intersection without stopping. They could not indicate the priority at the intersection since the cross-sections of both roads might look similar yet have different road functions.
Collector/arterial intersections. Traffic conflicts were especially frequent from collectors. The priority at this class of intersection was clear. However, motorists from minor roads easily misjudged the gaps in traffic on major roads.
Collector/collector intersections. With signal-control, crossing conflicts were not applicable at this class of intersection and rear-end conflicts only were detected.
Arterial/arterial intersections. Traffic conflicts on this class of intersection were more severe than other signalized intersections due to high speed, and as a result, time-to-collision was critical.
4.2. Analysis of Conflict Risk
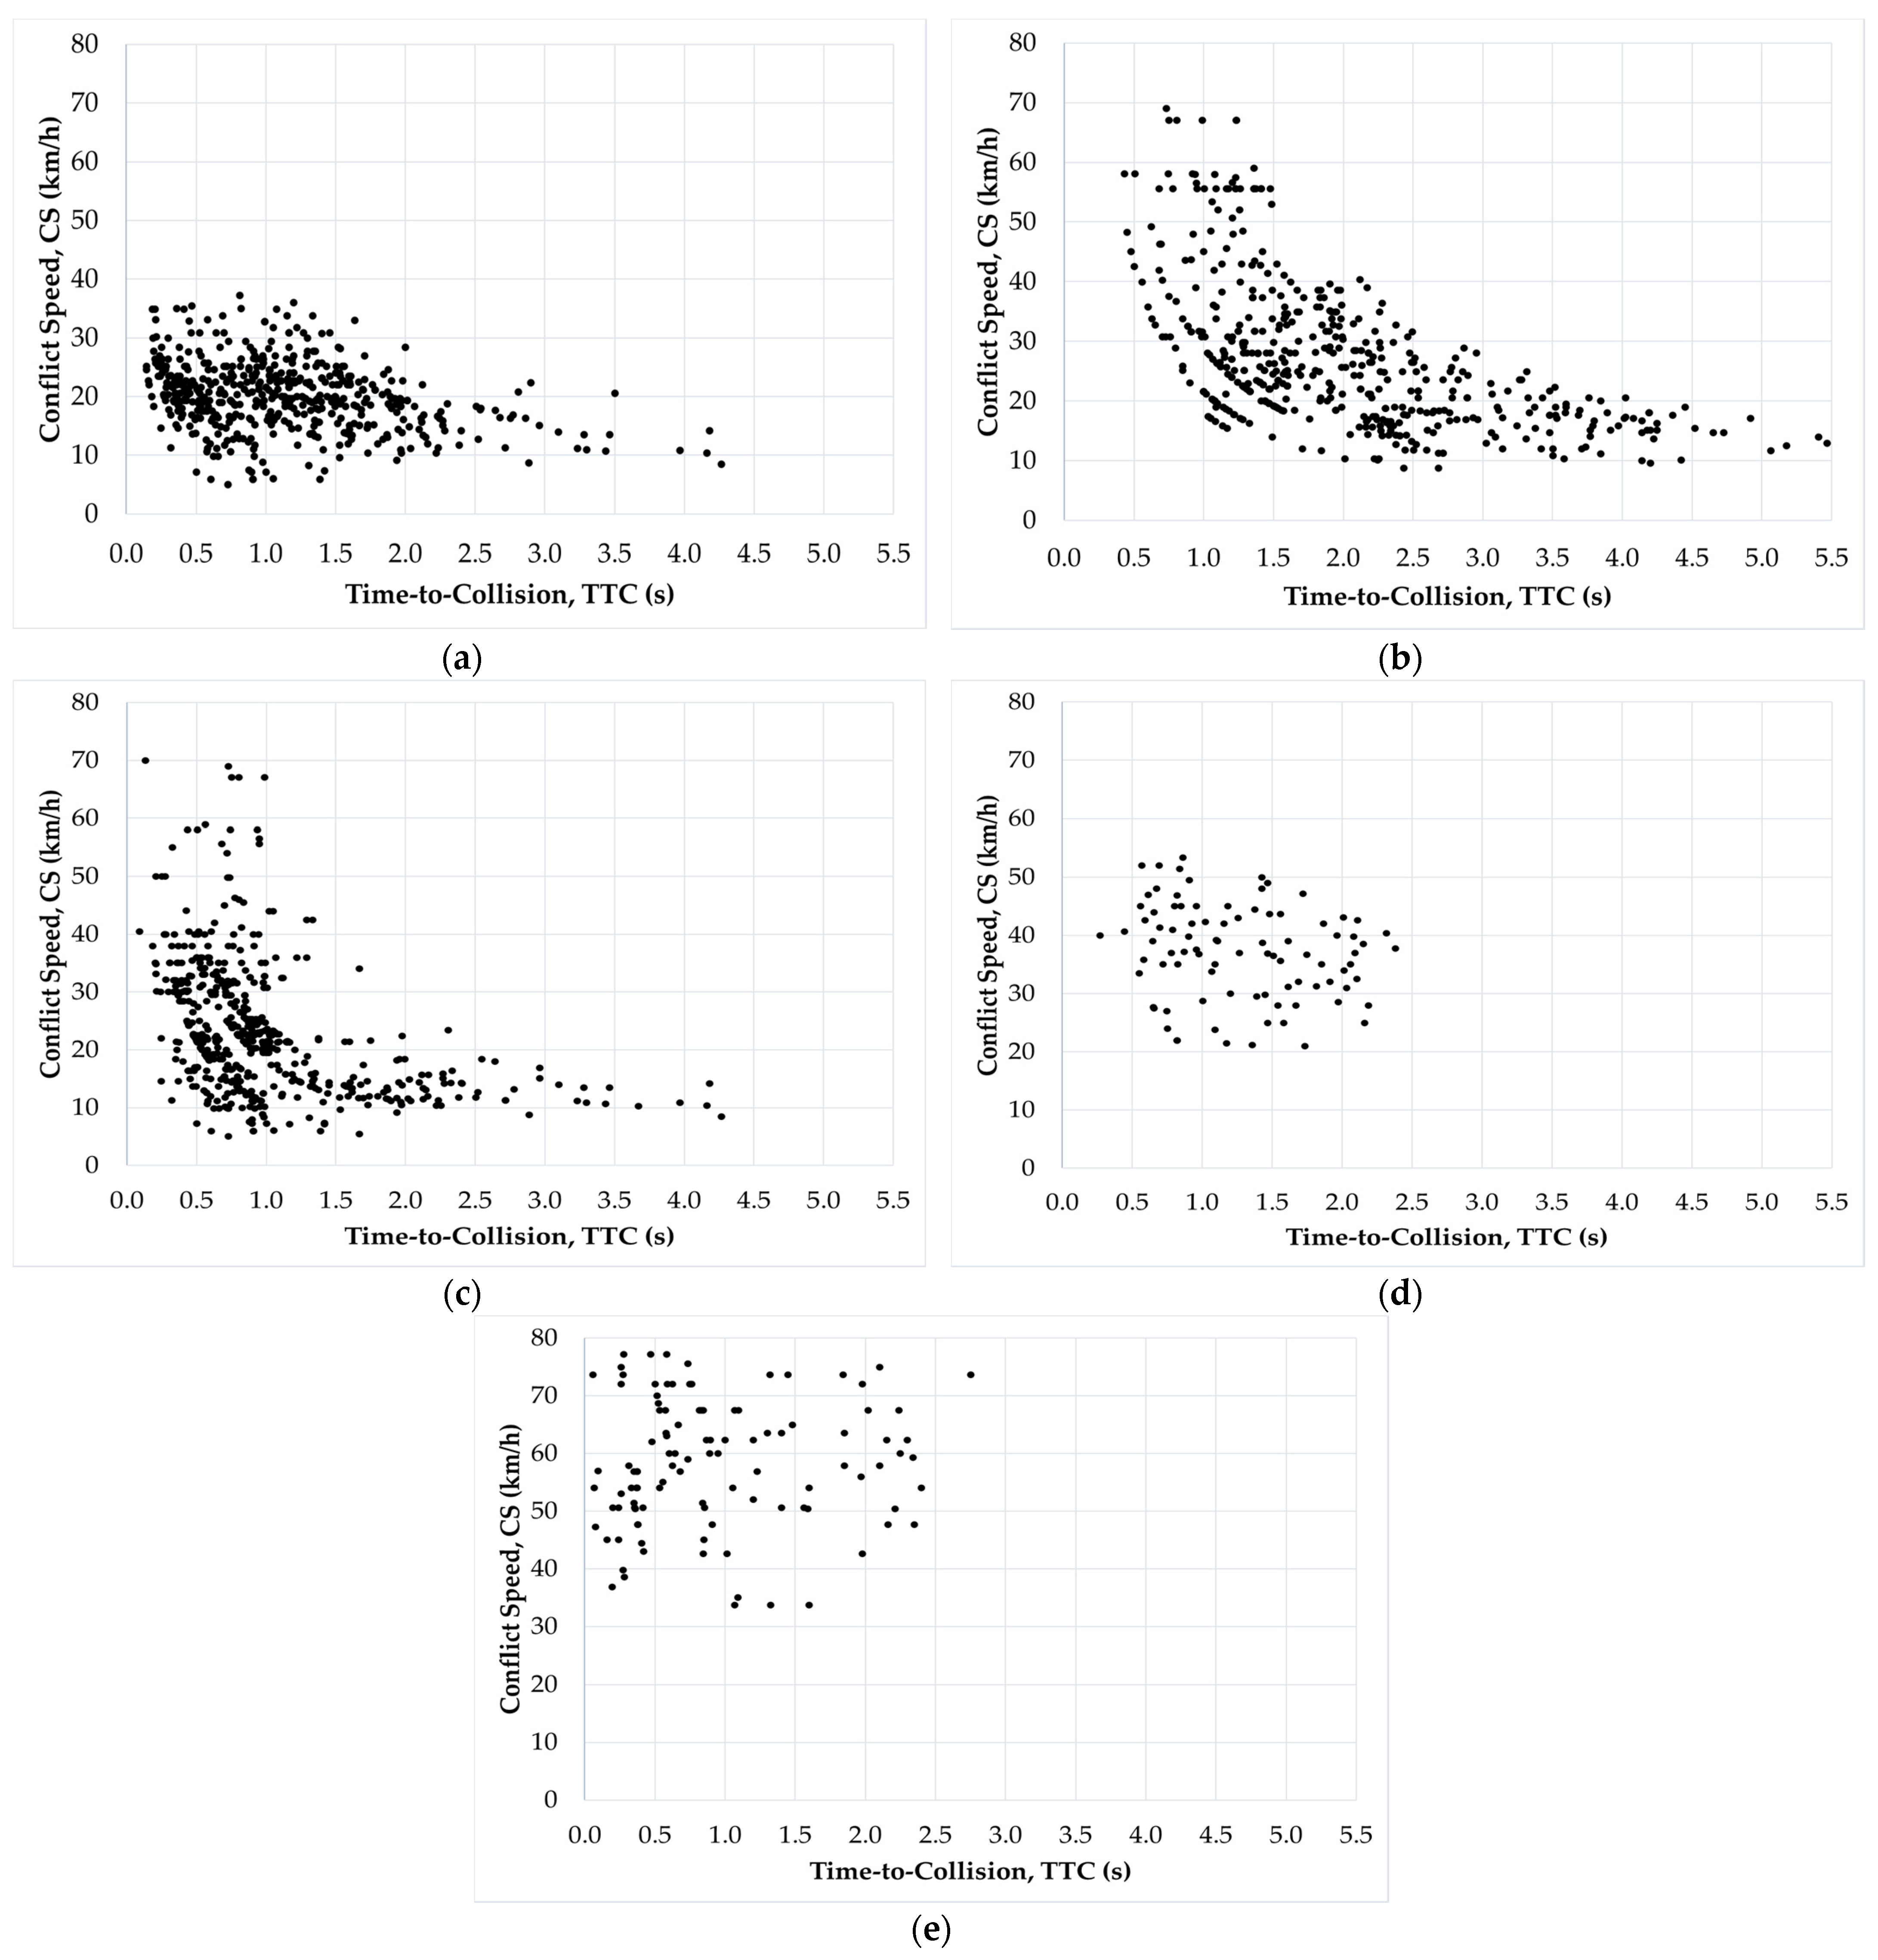
The descriptive statistics on traffic conflicts only might not fully describe the safety performance of intersections. This study introduced the risk assessment of intersections by viewing traffic conflict situations in two dimensions: the chance of collision (likelihood) and the chance of injury (severity). The study plotted the distribution of traffic conflicts with respect to time-to-collision and conflict speed and compared these among five intersection classes to visualize the risk levels, as shown in
Figure 10.
Local-road/local-road intersections. Most conflicts had short time-to-collision, but low conflict speed. Road users might take high evasive action, but such conflicts might not result in high risk of injury.
Local/collector intersections. The distribution of traffic conflicts was more dispersed with longer time-to-collision and higher conflict speed than local intersections.
Collector/arterial intersections. Traffic conflicts had short time-to-collision and higher conflict speed, which led to higher risk.
Collector/collector intersections. Traffic conflicts were few. The conflicts were at moderate risk
Arterial/arterial intersections. Traffic conflicts were very few, but all of them were at high risk due to short time-to-collision and high speed.
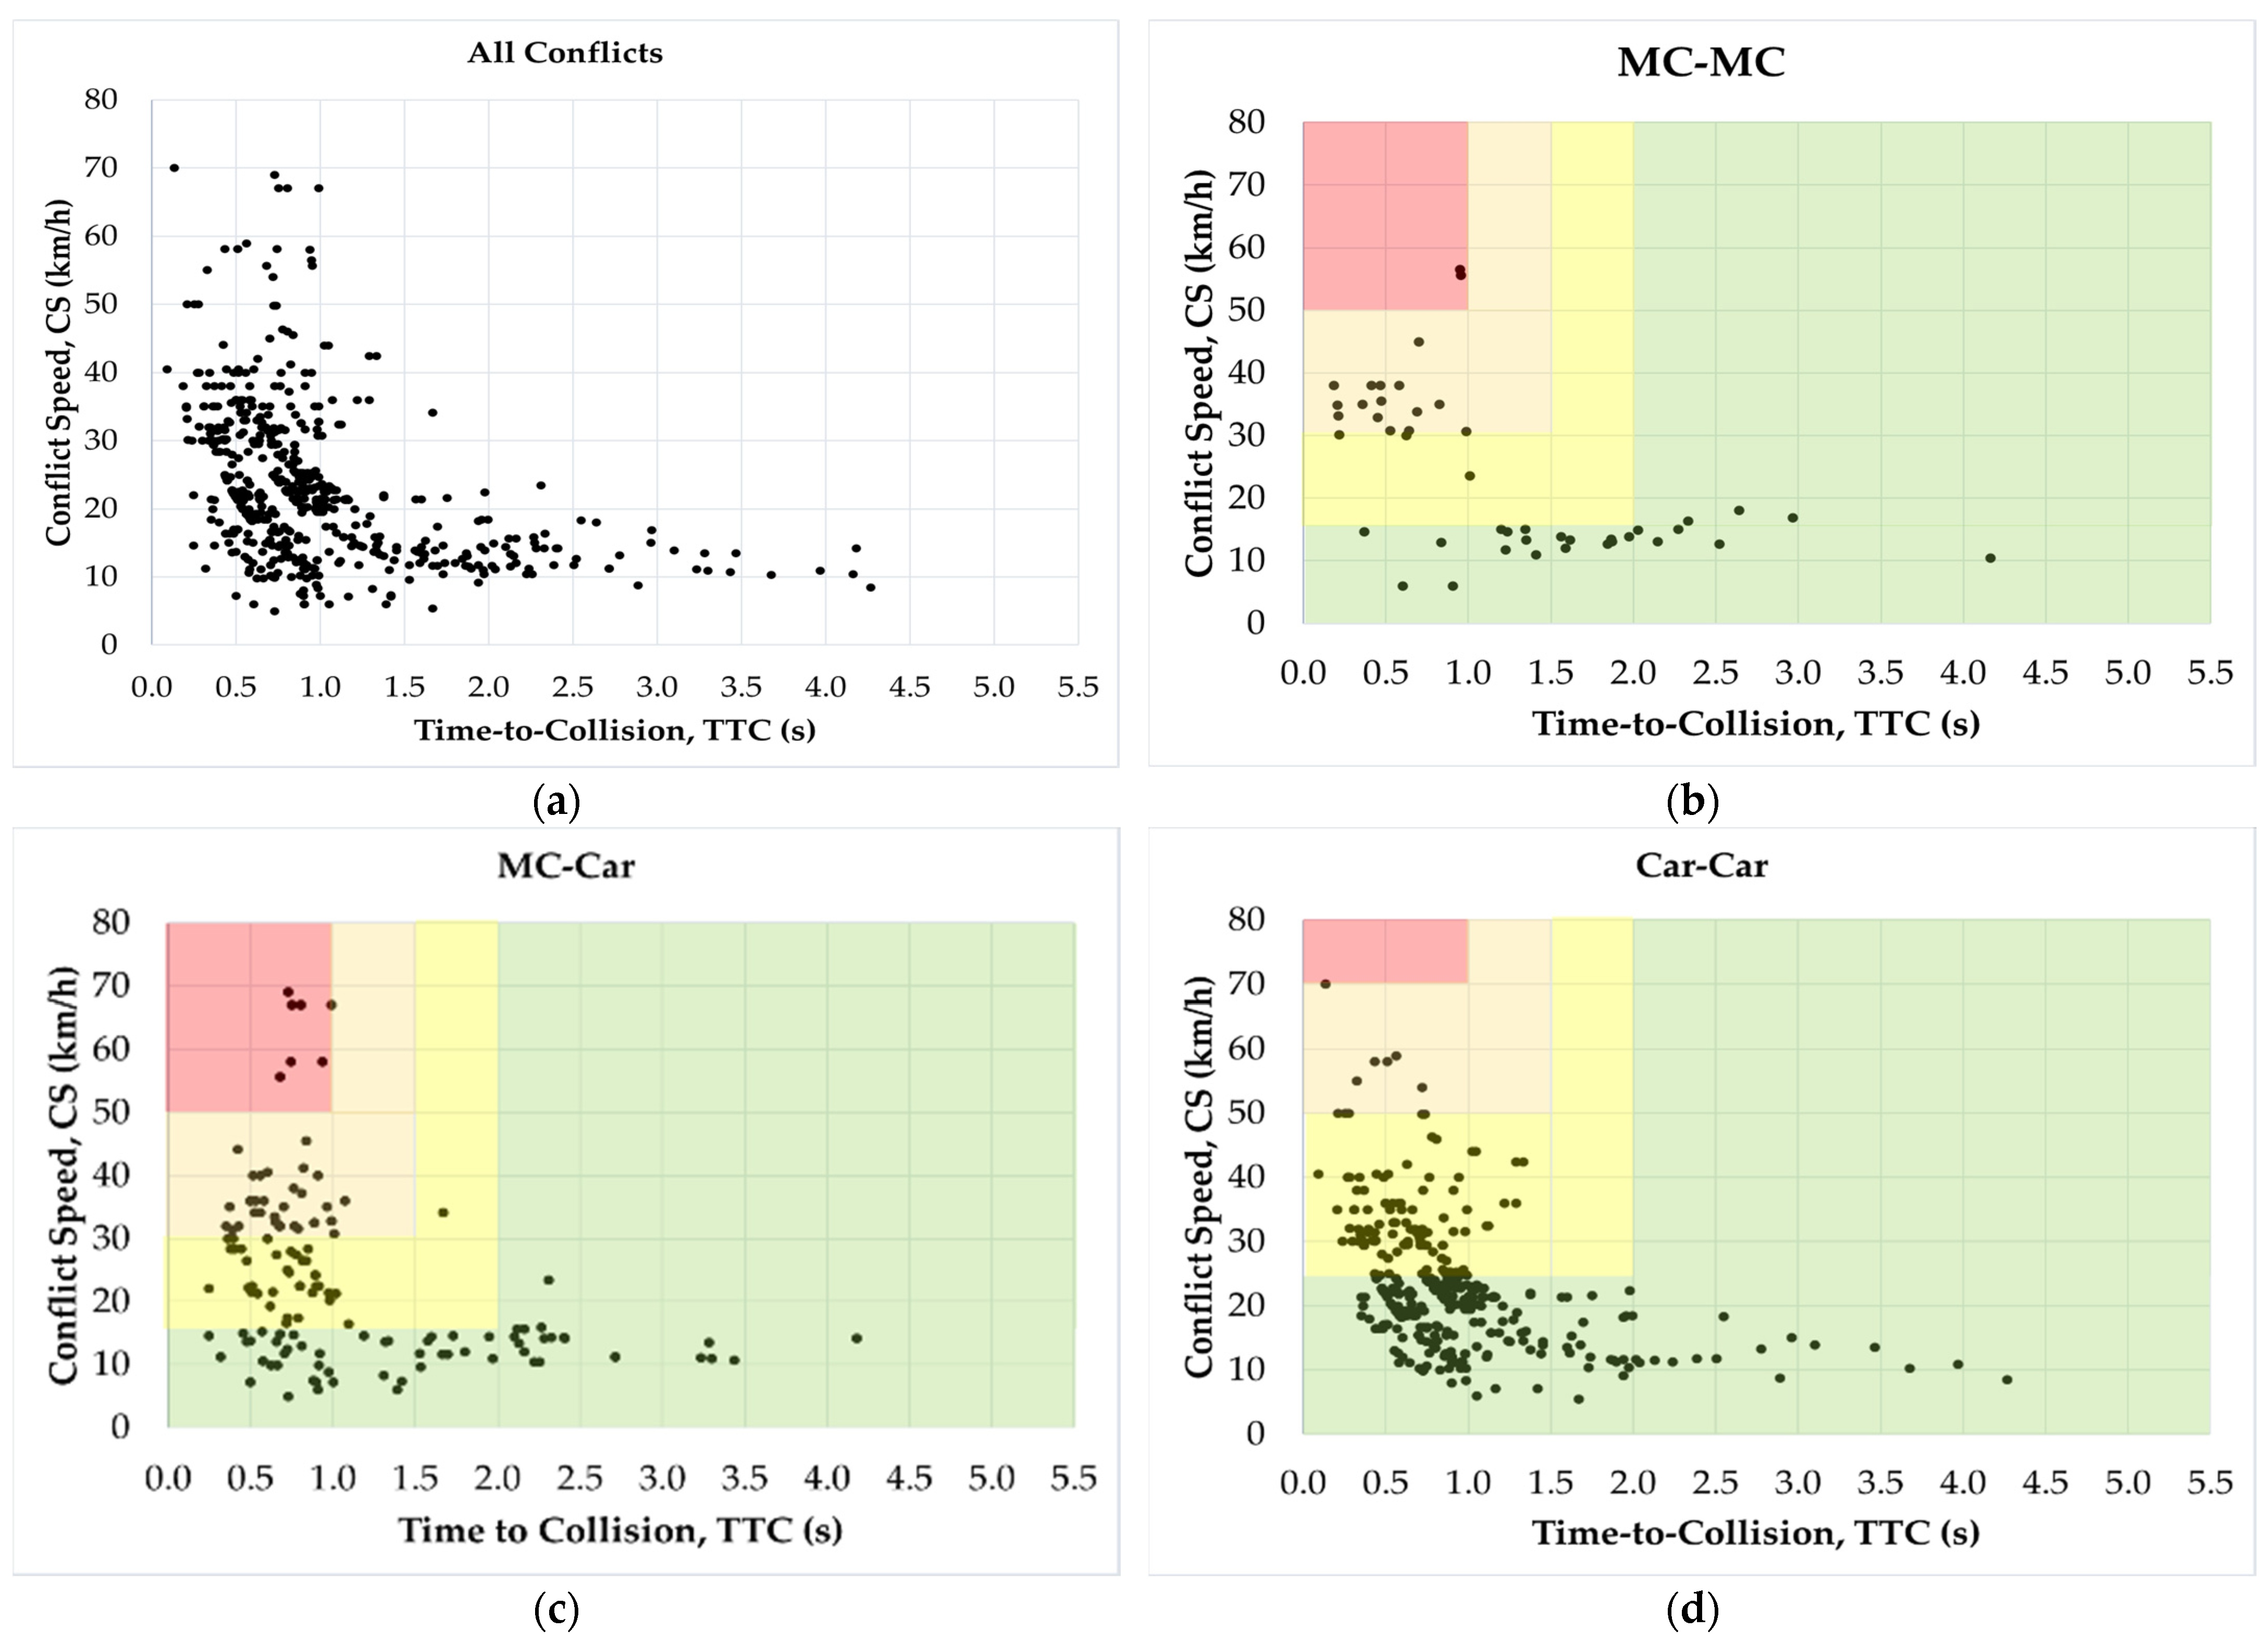
Consider the types of vehicles involved in a conflict. The conflict diagrams for each vehicle type were drawn.
Figure 11 illustrates the example of conflict diagrams associated with the Collector/Arterial intersection. The conflict diagrams are classified by vehicle types: all conflicts, MC-MC conflicts, MC-Car conflicts, and Car-Car conflicts, respectively. It is noted that the threshold of speed for Car-Car conflicts is different from motorcycle-related conflicts, as described in the previous section. This example showed that although Car-Car conflicts are the most frequent at this intersection, traffic conflicts between motorcycles and cars are the most serious. The chance of collision was high due to short TTC, and injury was possible since some conflicts involved high speed.
Further, the conflict risk was determined for different conflict vehicles.
Table 4 shows the risk of conflict categorized by conflict types and vehicle types among five classes of intersections.
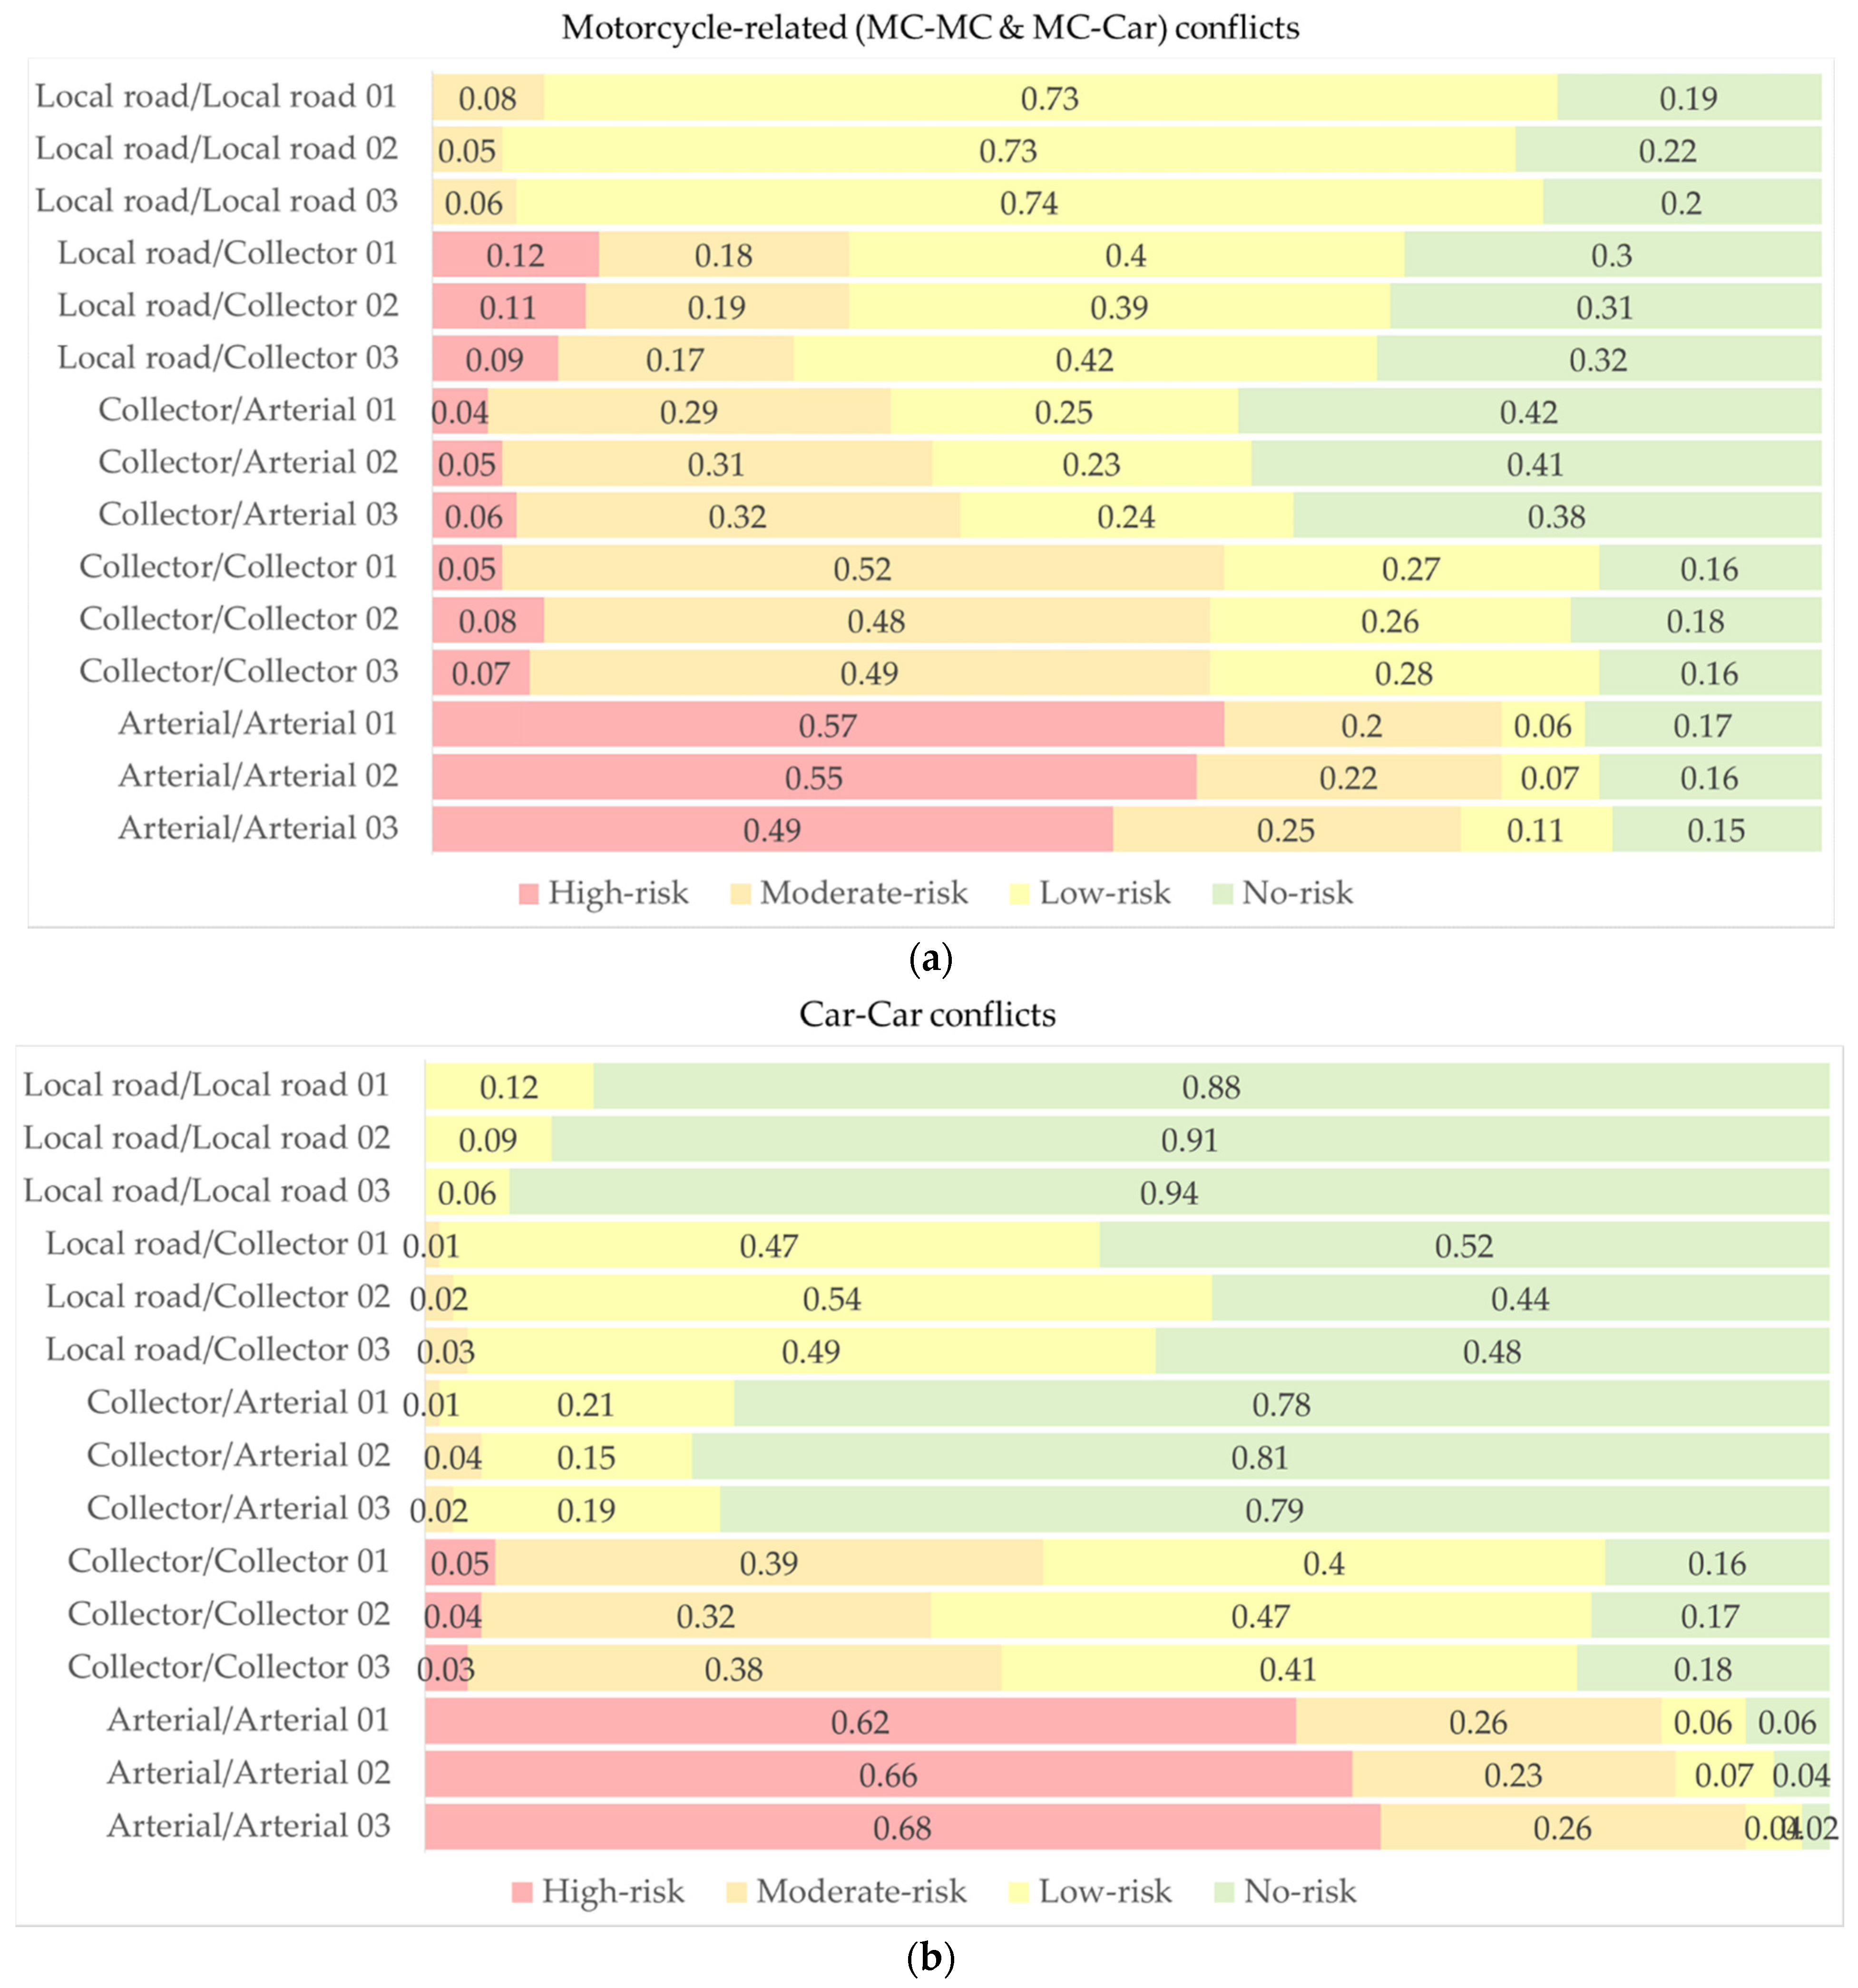
Figure 12 illustrates the percentage of conflicts in different risk levels associated with 15 intersection sites. The first figure is for motorcycle-related conflicts (i.e., MC-MC and MC-Car conflicts), and the second figure is for Car-Car conflicts.
The results indicated that for all conflict types and vehicle types, high-order intersections (e.g., arterial/arterial and collector/collector intersections) with signal control showed a higher risk of conflict than low-order intersections with stop/no control due to high conflict speed. The results clearly showed that motorcycles are exposed to higher risk than cars at all intersection sites, especially those with stop/no control.
5. Conclusions and Recommendations
This exploratory study presented a new method in road safety data collection and analysis for sustainably assessing the safety of intersections under mixed traffic conditions with a high percentage of motorcycles in Thailand. The proposed method used video-based traffic conflict analysis, which applied traffic conflict studies together with automated video image-processing techniques. The objectives of this study were to develop the video analytics for observing and recording conflicting behavior of vehicles and their associated characteristics, and to apply such traffic conflict data to make relative comparisons of the risk at various intersections.
The study developed video analytic tools that could detect the type, speed, and trajectory of vehicles under mixed traffic conditions, including motorcycles and cars, and analyze surrogate safety measures in terms of the time-to-collision and speed of individual conflicts. The conflict risk of an intersection was estimated as the ratio of the number of conflicts at risk and the total number of conflicts observed. The study presented the conflict diagrams to visualize the conflict risk in terms of the frequency and severity of conflicts at intersections. In other words, it is the risk that two vehicles approaching an intersection will develop into a conflict at risk.
Based on traffic conflict data and analysis of intersections in the study area, the results showed that intersection classes (or orders of intersecting roads) and characteristics and types of intersection control affect the risk of an intersection. The high-order intersections with signal control show high risks due to high conflicting speed. They generate few conflicts yet are at the highest risk of injury. The low-order intersections with stop control or no control show high risks due to short time-to-collision. They generate frequent conflicts at the lowest risk of injury. The intersections of lower- and higher-order roads with clear right-of-way, such as collector/arterial, generate frequent conflicts, especially crossing conflicts by vehicles from a lower-order road. The intersections of lower- and higher-order roads with unclear right-of-way generate higher risk of conflict than those with clear right-of-way.
Traffic conflict analysis is of considerable importance in identifying hazardous locations in which traffic conflicts are concentrated or severe. It can further be applied to diagnosing the possible crash patterns and to recommend road safety countermeasures to specific problems. Video-based traffic conflict analysis can be a suitable tool for systematically and comprehensively assessing road safety. Lastly, the risk of conflict based on traffic conflict data can be deemed as a supplemental indicator in addition to limited crash data to evaluate the safety of roadway infrastructure projects and prioritize among them.
Although this risk-based approach can be deemed as a supplemental indicator in addition to limited crash data to evaluate the safety of intersections, this exploratory study has limitations and future research is still needed. The study employed surrogate safety measures to assess intersection safety. However, this investigation was applied to a limited number of intersections, certain conflict types, limited vehicle types, and a specified time of analysis. It is also noted that this study developed the approach to the study area under mixed traffic conditions, including a high number of motorcycles and cars. Careful attention must be paid when applying the approach to other study areas with different combinations of vehicle types. Future research is needed to explore more practical applications, such as the consideration of other collision types and vehicle types, the selection of surrogate indicators, the accuracy of the algorithm, the calibration of conflict risk levels for other crash patterns, and the potential for other road infrastructure under different contextual circumstances.
Author Contributions
Conceptualization, N.K. and C.S.; methodology, N.K. and C.S.; formal analysis, C.S.; writing—original draft preparation, C.S.; writing—review and editing, N.K.; supervision, T.S. and P.L.; funding acquisition, N.K. All authors have read and agreed to the published version of the manuscript.
Funding
This research received no external funding.
Institutional Review Board Statement
Not applicable.
Informed Consent Statement
Not applicable.
Acknowledgments
The authors would like to acknowledge the technical support of the research project from the Green Infrastructure Transportation Technology (GITT) Research Center of the Faculty of Engineering, and the Excellence Center in Infrastructure Technology and Transportation Engineering (ExCITE) of Chiang Mai University.
Conflicts of Interest
The authors declare no conflict of interest.
References
- PIARC. Road Safety Manual, A Guide for Practitioners; World Road Association: Paris, France, 2019. [Google Scholar]
- Golembiewski, G.A.; Chandler, B. Intersection Safety: A Manual for Local Rural Road Owners; Federal Highway Administration, U.S. Department of Transportation: Springfield, VA, USA, 2011. [Google Scholar]
- Ma, Q.; Zhang, S.; Zhou, Q. Development of a conflict-free unsignalized intersection organization method for multiple connected and autonomous vehicles. PLoS ONE 2021, 16, e0249170. [Google Scholar] [CrossRef]
- Tay, R.; Rifaat, S.M. Factors contributing to the severity of intersection crashes. J. Adv. Transp. 2017, 41, 245–265. [Google Scholar] [CrossRef]
- Elvik, R. Speed and road safety: Synthesis of evidence from evaluation studies. Transp. Res. Rec. 2005, 1908, 59–69. [Google Scholar] [CrossRef]
- Lord, D.; van Schalkwyk, I.; Chrysler, S.; Staplin, L. A strategy to reduce older driver injuries at intersections using more accommodating roundabout design practices. Accid. Anal. Prev. 2007, 39, 427–432. [Google Scholar] [CrossRef] [PubMed] [Green Version]
- Tay, R. A random parameters probit model of urban and rural intersection crashes. Accid. Anal. Prev. 2015, 84, 38–40. [Google Scholar] [CrossRef] [PubMed]
- Hanna, J.T.; Flynn, T.E.; Tyler, W.L. Characteristics of Intersection Accidents in Rural Municipalities; TRB: Washington, DC, USA, 1976; pp. 79–82. [Google Scholar]
- AASHTO. A Policy on Geometric Design of Highways and Streets, 7th ed.; American Association of State Highway and Transportation Officials: Washington, DC, USA, 2018. [Google Scholar]
- Sutheeraakul, C.; Kronprasert, N. Functional and contextual classification concept for road network in Thailand: Preliminary study. In Proceedings of the First International Conference on Smart Technology & Urban Development STUD, Chiang Mai, Thailand, 13–14 December 2019; pp. 7–13. [Google Scholar]
- Brown, G. Traffic conflicts for road user safety studies. Can. J. Civ. Eng. 1994, 21, 1–15. [Google Scholar] [CrossRef]
- Baker, W.T. An evaluation of the traffic conflicts technique. Highw. Res. Rec. 1972, 384, 1–8. [Google Scholar]
- Scholl, L.; Elagaty, M.; Ledezma-Navarro, B.; Zamora, E.; Miranda-Moreno, L. A surrogate video-based safety methodology for diagnosis and evaluation of low-cost pedestrian-safety countermeasures: The case of Cochabamba, Bolivia. Sustainability 2019, 11, 4737. [Google Scholar] [CrossRef] [Green Version]
- Sayed, T.; Zein, S. Traffic conflict standards for intersections. Transp. Plan. Technol. 1999, 22, 309–323. [Google Scholar] [CrossRef]
- Parker, M.R., Jr.; Zegeer, C.V. Traffic Conflict Techniques for Safety and Operations: Observers Manual; Publication No. FHWA-IP-88-027; U.S. Department of Transportation, Federal Highway Administration: Washington, DC, USA, 1989. [Google Scholar]
- Glauz, W.D.; Migletz, D.J. Application of Traffic Conflict Analysis at Intersections; NCHRP Report 219; Transportation Research Board, National Research Council: Washington, DC, USA, 1980. [Google Scholar]
- Perkins, S.R.; Harris, J.L. Traffic conflict characteristics-accident potential at intersections. Highw. Res. Rec. 1968, 225, 35–43. [Google Scholar]
- Hyden, C. The Development of a Method of Traffic Safety Evaluations: The Swedish Traffic Conflicts Technique; Bulletin Lund Institute of Technology: Lund, Sweden, 1987; 70p. [Google Scholar]
- Arun, A.; Haque, M.M.; Bhaskar, A.; Washinton, S.; Sated, T. A systematic mapping review of surrogate safety assessment using traffic conflict techniques. Accid. Anal. Prev. 2021, 153, 10601. [Google Scholar] [CrossRef]
- Kraay, J.H.; van der Horst, A.R.A.; Oppe, S. Manual Conflict Observation Technique DOCTOR: Dutch Objective Conflict Technique for Operation and Research; Foundation Road Safety for All: Voorburg, The Netherlands, 2013. [Google Scholar]
- Zhang, L.; Ismail, K.; Meng, X. Traffic conflict techniques for road safety analysis: Open questions and some insights. Can. J. Civ. Eng. 2014, 41, 633–641. [Google Scholar] [CrossRef]
- Peterson, B.E. Proceedings: First Workshop on Traffic Conflicts; Amundsen, F.H., Hyden, C., Eds.; Institute of Transport Economics: Oslo, Norway, 1977. [Google Scholar]
- Mahmud, S.M.S.; Ferreira, L.; Hoque, M.d.S.; Tavassoli, A. Application of proximal surrogate indicators for safety evaluation: A review of recent developments and research needs. IATSS Res. 2017, 41, 153–163. [Google Scholar] [CrossRef]
- Hayward, J.C. Near Misses as a Measure of Safety at Urban Intersections. Ph.D. Thesis, Department of Civil Engineering, Pennsylvania State University, University Park, PA, USA, 1971. [Google Scholar]
- Minderhoud, M.M.; Bovy, P.H.L. Extended time-to-collision measures for road traffic safety assessment. Accid. Anal. Prev. 2001, 33, 89–97. [Google Scholar] [CrossRef]
- Huguenin, F.; Torday, A.; Dumont, A. Evaluation of traffic safety using microsimulation. In Proceedings of the 5th Swiss Transport Research Conference, Ascona, Switzerland, 9–11 March 2005. [Google Scholar]
- Gomes, S.L.; Rebouças, E.S.; Neto, E.C.; Papa, J.P.; D’Albuquerque, V.H.C.; Filho, P.P.R.; Tavares, J.M.R.S. Embedded real-time speed limit sign recognition using image processing and machine learning techniques. Neural Comput. Appl. 2017, 28, 573–584. [Google Scholar] [CrossRef]
- Neto, E.C.; Gomes, S.L.; Filho, P.P.R.; D’Albuquerque, V.H.C. Brazilian vehicle identification using a new embedded plate recognition system. Measurement 2015, 70, 36–46. [Google Scholar] [CrossRef]
- Ren, S.; He, K.; Girshick, R.; Sun, J. Faster R-CNN: Towards real-time object detection with region proposal networks. IEEE Trans. Pattern. Anal. Mach. Intell. 2017, 39, 1137–1149. [Google Scholar] [CrossRef] [PubMed] [Green Version]
- Redmon, J.; Divvala, S.; Girshick, R.; Farhadi, A. You only look once: Unified, real-time object detection. In Proceedings of the IEEE Conference on Computer Vision and Pattern Recognition (CVPR), Las Vegas, NV, USA, 27–30 June 2016; pp. 779–788. [Google Scholar]
- Liu, W.; Anguelov, D.; Erhan, D.; Szegedy, C.; Reed, S.; Fu, C.Y.; Berg, A.C. SSD: Single shot multibox detector. In Computer Vision–ECCV 2016; Springer: Cham, Switzerland, 2016; Volume 9905, pp. 21–37. [Google Scholar]
- Redmon, J.; Farhadi, A. YOLOv3: An Incremental Improvement. arXiv 2017, arXiv:1804.02767. [Google Scholar]
- Zhang, J.; Huang, M.; Jin, X.; Li, X. A real-time Chinese traffic sign detection algorithm based on modified YOLOv2. Algorithms 2017, 10, 127. [Google Scholar] [CrossRef] [Green Version]
- Samara, L.; St-Aubin, P.; Loewenherz, F.; Budnick, N.; Miranda-Moreno, L. Video-based network-wide surrogate safety analysis to support a proactive network screening using connected cameras: Case study in the City of Bellevue (WA) United States. In Proceedings of the Transportation Research Board 100th Annual Meeting, Washington, DC, USA, 9–13 January 2020. [Google Scholar]
- Chiu, Y.N.; Chen, A.Y.; Hsieh, M.H. Vision Based Traffic Conflict Analytics of Mixed Traffic Flow; Department of Civil Engineering, National Taiwan University: Taipei, Taiwan, 2020. [Google Scholar]
- Theadom, A.; de Lusignan, S.; Wilson, E.; Chan, T. Using three-channel video to evaluate the impact of the use of the computer on the patient-centredness of the general practice consultation. Inform. Prim. Care 2003, 11, 149–156. [Google Scholar] [CrossRef] [Green Version]
- Sheeler, I.; Koczan, P.; Wallage, W.; de Lusignan, S. Low-cost three-channel video for assessment of the clinical consultation. J. Innov. Health Inform. 2007, 15, 25–31. [Google Scholar]
- Laureshyn, A.; Goede, M.; Saunier, N.; Fyhri, A. Cross-comparison of three surrogate safety methods to diagnose cyclist safety problems at intersections in Norway. Accid. Anal. Prev. 2017, 105, 10–20. [Google Scholar] [CrossRef] [PubMed]
- Lee, S.M.; Baik, H.; Park, J.H. Visual Traffic Movement Count at Intersection and Origin-Destination (O-D) Trip Table Estimation. In Proceedings of the IEEE Intelligent Transportation Systems Conference, Bellevue, WA, USA, 30 September–3 October 2007; pp. 1108–1113. [Google Scholar]
- Wang, Y.; Zou, Y.; Shi, H.; Zhao, H. Video image vehicle detection system for signaled traffic intersection. In Proceedings of the 9th International Conference on Hybrid Intelligent Systems, Shenyang, China, 12–14 August 2009; pp. 222–227. [Google Scholar]
- Vuong, T.Q. Traffic conflict technique development for traffic safety evaluation under mixed traffic conditions of Developing Countries. J. Traffic Transp. Eng. 2017, 5, 228–235. [Google Scholar]
- Kloeden, C.N.; McLean, A.J.; Moore, V.M.; Ponte, G. Travelling Speed and the Rate of Crash Involvement; Federal Office of Road Safety, FORS: Canberra, ACT, Australia, 1997. [Google Scholar]
- Kloeden, C.N.; Ponte, G.; McLean, A.J. Travelling Speed and The Rate of Crash Involvement on Rural Roads; Report No. CR 204; Australian Transport Safety Bureau, ATSB: Canberra, ACT, Australia, 2001. [Google Scholar]
- Kloeden, C.N.; McLean, A.J.; Glonek, G. Reanalysis of Travelling Speed and the Rate of Crash Involvement in Adelaide South Australia; Australian Transport Safety Bureau, ATSB: Canberra, ACT, Australia, 2002. [Google Scholar]
- Kröyer, H.R.G.; Jonsson, T.; Varhelyi, A. Relative fatality risk curve to describe the effect of change in the impact speed on fatality risk of pedestrians struck by a motor vehicle. Accident Accid. Anal. 2014, 62, 143–152. [Google Scholar] [CrossRef] [PubMed]
- Jurewicz, C.; Sobhani, A.; Woolley, J.; Dutschke, J.; Corbenc, C. Exploration of vehicle impact speed-injury severity relationships for application in safer road design. Transp. Res. Proc. 2015, 14, 4247–4256. [Google Scholar] [CrossRef] [Green Version]
- Fuller, R.; Gormley, M.; Stradling, S.; Broughton, P.; Kinnear, N.; O’Dolan, C.; Hannigan, B. Impact of speed change on estimated journey time: Failure of drivers to appreciate relevance of initial speed. Accid. Anal. Prev. 2009, 41, 10–14. [Google Scholar] [CrossRef] [PubMed]
- Lerner, N.D. Brake Perception-Reaction Times of Older and Younger Drivers. In Proceedings of the Human Factors and Ergonomics Society Annual Meeting, Seattle, WA, USA, 11–15 October 1993; SAGE Publications: New York, NY, USA, 1993; Volume 37, pp. 206–210. [Google Scholar]
- Wramborg, P. A new approach to a safe and sustainable road structure and street design for urban areas. In Road Safety on Four Continents Conference; Swedish National Road and Transport Research Institute: Linkoeping, Sweden, 2005. [Google Scholar]
Figure 1.
The safety pyramid integrating crash severity into the safety hierarchy.
Figure 1.
The safety pyramid integrating crash severity into the safety hierarchy.
Figure 2.
Concept of TTC by collision types: (a) crossing collision; (b) rear-end collision.
Figure 2.
Concept of TTC by collision types: (a) crossing collision; (b) rear-end collision.
Figure 3.
The methodological scheme of this study.
Figure 3.
The methodological scheme of this study.
Figure 4.
Intersection classes by road hierarchy.
Figure 4.
Intersection classes by road hierarchy.
Figure 5.
Layouts for five intersections of functionally classified roadways: (a) Local-road/Local-road; (b) Local/Collector; (c) Collector/Arterial; (d) Collector/Collector; and (e) Arterial/Arterial. Pictures were taken from Google Street View.
Figure 5.
Layouts for five intersections of functionally classified roadways: (a) Local-road/Local-road; (b) Local/Collector; (c) Collector/Arterial; (d) Collector/Collector; and (e) Arterial/Arterial. Pictures were taken from Google Street View.
Figure 6.
Example of video settings at intersection sites: (a) locations of video setting; (b) intersection area; (c) northbound; (d) eastbound; (e) southbound; (f) westbound.
Figure 6.
Example of video settings at intersection sites: (a) locations of video setting; (b) intersection area; (c) northbound; (d) eastbound; (e) southbound; (f) westbound.
Figure 7.
Vehicle detection, classification, and tracking systems in this study.
Figure 7.
Vehicle detection, classification, and tracking systems in this study.
Figure 8.
Conflict risk diagram for different vehicle types: (a) motorcycle-related conflict; (b) car-related conflict.
Figure 8.
Conflict risk diagram for different vehicle types: (a) motorcycle-related conflict; (b) car-related conflict.
Figure 9.
Frequency distribution of traffic conflicts at different intersection classes: (a) Local-road/Local-road; (b) Local/Collector; (c) Collector/Arterial; (d) Collector/Collector; and (e) Arterial/Arterial.
Figure 9.
Frequency distribution of traffic conflicts at different intersection classes: (a) Local-road/Local-road; (b) Local/Collector; (c) Collector/Arterial; (d) Collector/Collector; and (e) Arterial/Arterial.
Figure 10.
Conflict distribution with respect to time-to-collision and conflict speed of each intersection class: (a) Local-road/Local-road; (b) Local/Collector; (c) Collector/Arterial; (d) Collector/Collector; and (e) Arterial/Arterial.
Figure 10.
Conflict distribution with respect to time-to-collision and conflict speed of each intersection class: (a) Local-road/Local-road; (b) Local/Collector; (c) Collector/Arterial; (d) Collector/Collector; and (e) Arterial/Arterial.
Figure 11.
Conflict distribution classified by types of vehicles involved in a conflict: (a) all vehicles; (b) MC-MC; (c) MC-Car; and (d) Car-Car.
Figure 11.
Conflict distribution classified by types of vehicles involved in a conflict: (a) all vehicles; (b) MC-MC; (c) MC-Car; and (d) Car-Car.
Figure 12.
Proportion of traffic conflicts at different risk levels: (a) motorcycle-related conflicts; (b) Car-Car conflict.
Figure 12.
Proportion of traffic conflicts at different risk levels: (a) motorcycle-related conflicts; (b) Car-Car conflict.
Table 1.
Basic statistics of intersection sites.
Table 1.
Basic statistics of intersection sites.
| Intersection by Class | No. of Crashes * | Peak Hour Volume (veh/h) | Proportion of Vehicle Types ** (%) | Average Speed (km/h) |
|---|
| Fatal | Injury | MC | Car | MC | Car |
|---|
| Local-road/Local-road (with stop/no control) |
| 01 Hussadhisawee Rd./Tanin Rd. | - | 5 | 820 | 76.7 | 23.4 | 25.0 | 19.9 |
| 02 Ratchapakinai Rd./Ratchadamnoen Rd. | - | 1 | 630 | 78.2 | 21.8 | 26.4 | 32.0 |
| 03 Loikroh Rd./Loikroh 4 Rd. | - | 1 | 538 | 77.9 | 22.1 | 24.2 | 28.6 |
| Local-road/Collector (with stop/no control) |
| 01 CM. 5036/Baan Rai Rd. | 1 | 3 | 1140 | 51.3 | 48.7 | 26.7 | 30.9 |
| 02 CM. 3038/Baan Pong Rd. | - | 1 | 794 | 45.6 | 54.4 | 25.6 | 33.0 |
| 03 LP.4020/HW. 1209 | - | 1 | 859 | 39.6 | 60.4 | 22.8 | 32.4 |
| Collector/Arterial (with stop/no control) |
| 01 PT.3004/Peung Suk Utid Rd. | 2 | - | 1853 | 23.8 | 76.2 | 22.6 | 26.7 |
| 02 CM.3012/HW.1367 | - | 2 | 1204 | 30.0 | 70.0 | 28.2 | 30.5 |
| 03 CM.4034/HW.1001 | | 1 | 1616 | 25.9 | 74.1 | 24.3 | 29.6 |
| Collector/Collector (with signal control) |
| 01 Suthep Rd./Nimmanahaeminda Rd. | - | 2 | 1531 | 25.6 | 74.4 | 23.8 | 39.9 |
| 02 Rattanakosin Rd./Asadathorn Rd. | - | 4 | 1148 | 36.3 | 63.7 | 28.7 | 48.3 |
| 03 Charoen Muang Rd./HW.106 | - | 2 | 1516 | 34.0 | 66.0 | 30.2 | 47.9 |
| Arterial/Arterial (with signal control) |
| 01 HW.1006/CM.3029 | - | 4 | 2359 | 36.8 | 63.2 | 55.7 | 60.3 |
| 02 HW.121/CM.3028 | - | 1 | 2601 | 34.5 | 65.5 | 58.2 | 65.0 |
| 03 HW.118/CM.3029 | 1 | 2 | 2718 | 33.7 | 66.3 | 56.6 | 63.2 |
Table 2.
Threshold values of time-to-collision and vehicle speed for each conflict risk.
Table 2.
Threshold values of time-to-collision and vehicle speed for each conflict risk.
Time to Collision,
TTC (s) | Vehicle Speed (km/h) | Conflict Risk |
|---|
| Motorcycle | Car |
|---|
| 0.0–0.9 | >50 | >70 | High risk |
| 1.0–1.5 | 30–50 | 50–70 | Moderate risk |
| 1.6–2.0 | 15–30 | 25–50 | Low risk |
| >2.0 | <15 | <25 | Interaction |
Table 3.
Data on number of conflicts and their surrogate safety measures by intersection classes.
Table 3.
Data on number of conflicts and their surrogate safety measures by intersection classes.
| Intersection Class | Number of Conflicts
(Conflicts/Hour) | Time-to-Collision,
TTC * (s) | Conflict Speed,
CS * (km/h) |
|---|
| Crossing | Rear-End | Crossing | Rear-End | Crossing | Rear-End |
|---|
| Local-road/Local-road | 27–178 | 22–141 | 1.10–1.26 | 0.98–1.15 | 20.4–21.7 | 18.3–19.7 |
| Local-road/Collector | 66–130 | 30–60 | 1.89–2.10 | 1.83–2.28 | 26.3–28.3 | 23.7–27.3 |
| Collector/Arterial | 52–154 | 51–151 | 0.88–1.04 | 0.91–1.04 | 25.0–27.8 | 18.7–20.8 |
| Collector/ Collector | n.a. | 5–37 | n.a. | 1.16–1.39 | n.a. | 35.4–38.8 |
| Arterial/Arterial | n.a. | 8–43 | n.a. | 0.82–1.08 | n.a. | 56.0–60.3 |
Table 4.
Risk of conflict (ROC) of intersection class by vehicle type and conflict type.
Table 4.
Risk of conflict (ROC) of intersection class by vehicle type and conflict type.
| Intersection Class | Risk of Conflict by Vehicle Type and Conflict Type |
|---|
| All Conflict | Crossing | Rear-End |
|---|
| All Vehicles | MC-MC | MC-Car | Car-Car | MC-MC | MC-Car | Car-Car |
|---|
| Local-road/Local-road | 0.78 | 0.91 | 0.74 | 0.12 | 0.86 | 0.67 | 0.06 |
| Local-road/Collector | 0.64 | 0.69 | 0.54 | 0.45 | 0.61 | 0.52 | 0.56 |
| Collector/Arterial | 0.59 | 0.60 | 0.68 | 0.40 | 0.13 | 0.39 | 0.20 |
| Collector/Collector | 0.86 | n.a. | n.a. | n.a. | 0.83 | 0.90 | 0.84 |
| Arterial/Arterial | 0.88 | n.a. | n.a. | n.a. | 0.80 | 0.92 | 0.96 |
| Publisher’s Note: MDPI stays neutral with regard to jurisdictional claims in published maps and institutional affiliations. |
© 2021 by the authors. Licensee MDPI, Basel, Switzerland. This article is an open access article distributed under the terms and conditions of the Creative Commons Attribution (CC BY) license (https://creativecommons.org/licenses/by/4.0/).


