
Applying Data Mining Approaches for Analyzing Hazardous Materials Transportation Accidents on Different Types of Roads

Abstract
:1. Introduction
2. Methods
2.1. Association Rule Mining
- (1)
- The frequent itemset mining method is used to find all the frequent itemsets.
- (2)
- Strong association rules are produced according to the obtained frequent itemsets.
2.1.1. Apriori Algorithm
2.1.2. Association Rule Assessment Criteria
2.2. Prediction Models
2.2.1. Ordinal Logit (OL)
2.2.2. Nearest Neighbor Classification (NNC)
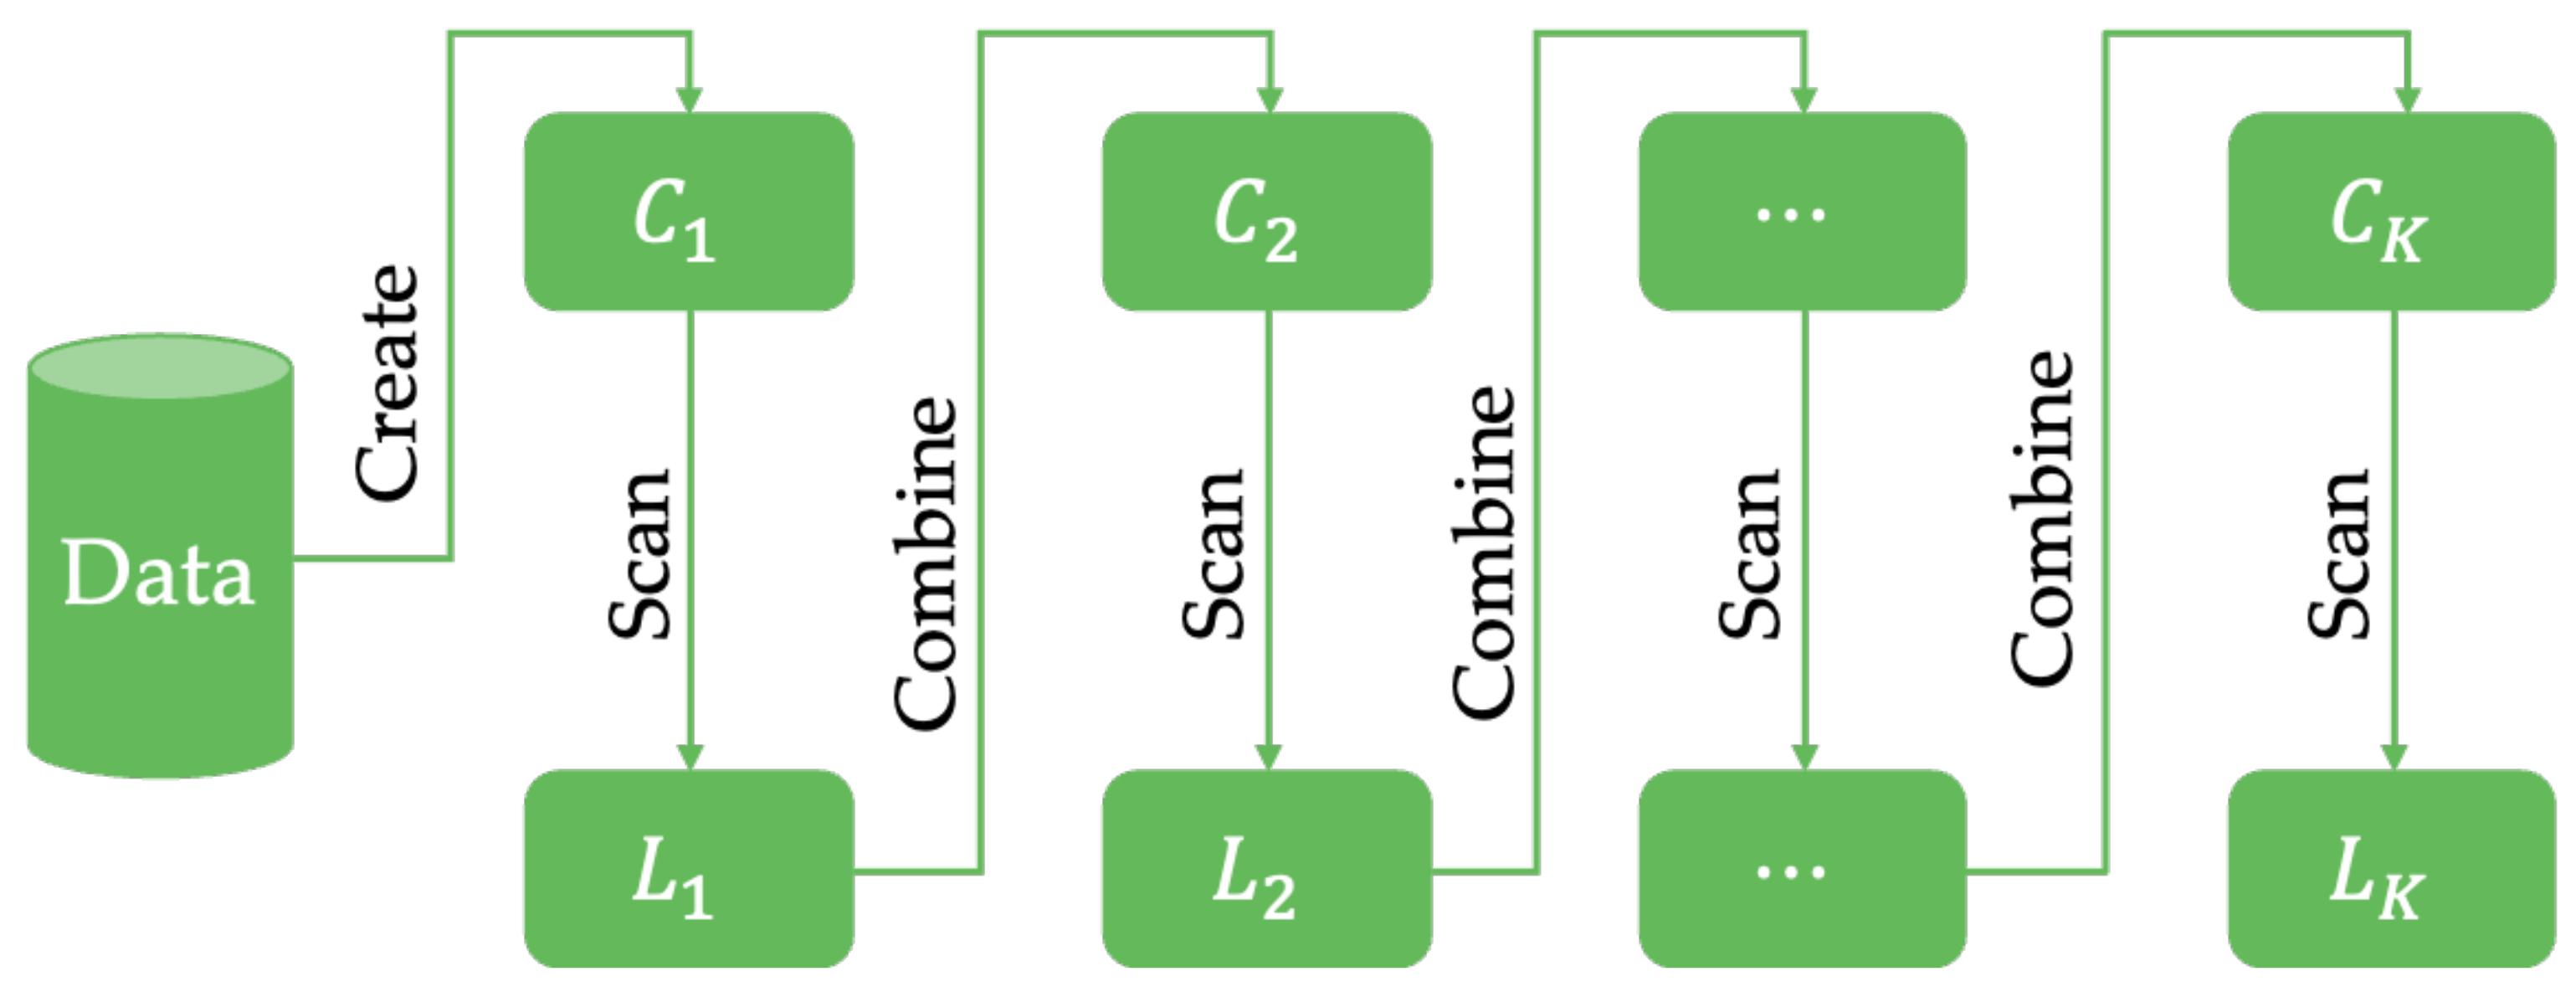
2.2.3. Random Forests (RF)
- (1)
- Sample set selection.
- (2)
- Decision tree construction.
- (3)
- Decision tree combination.
2.2.4. Extreme Gradient Boosting (XGBoost)
2.2.5. Predictive Performance Evaluation Indexes
3. Data Sources
4. Results and Discussion
4.1. Association Rule Mining
4.1.1. Urban Roads
- (1)
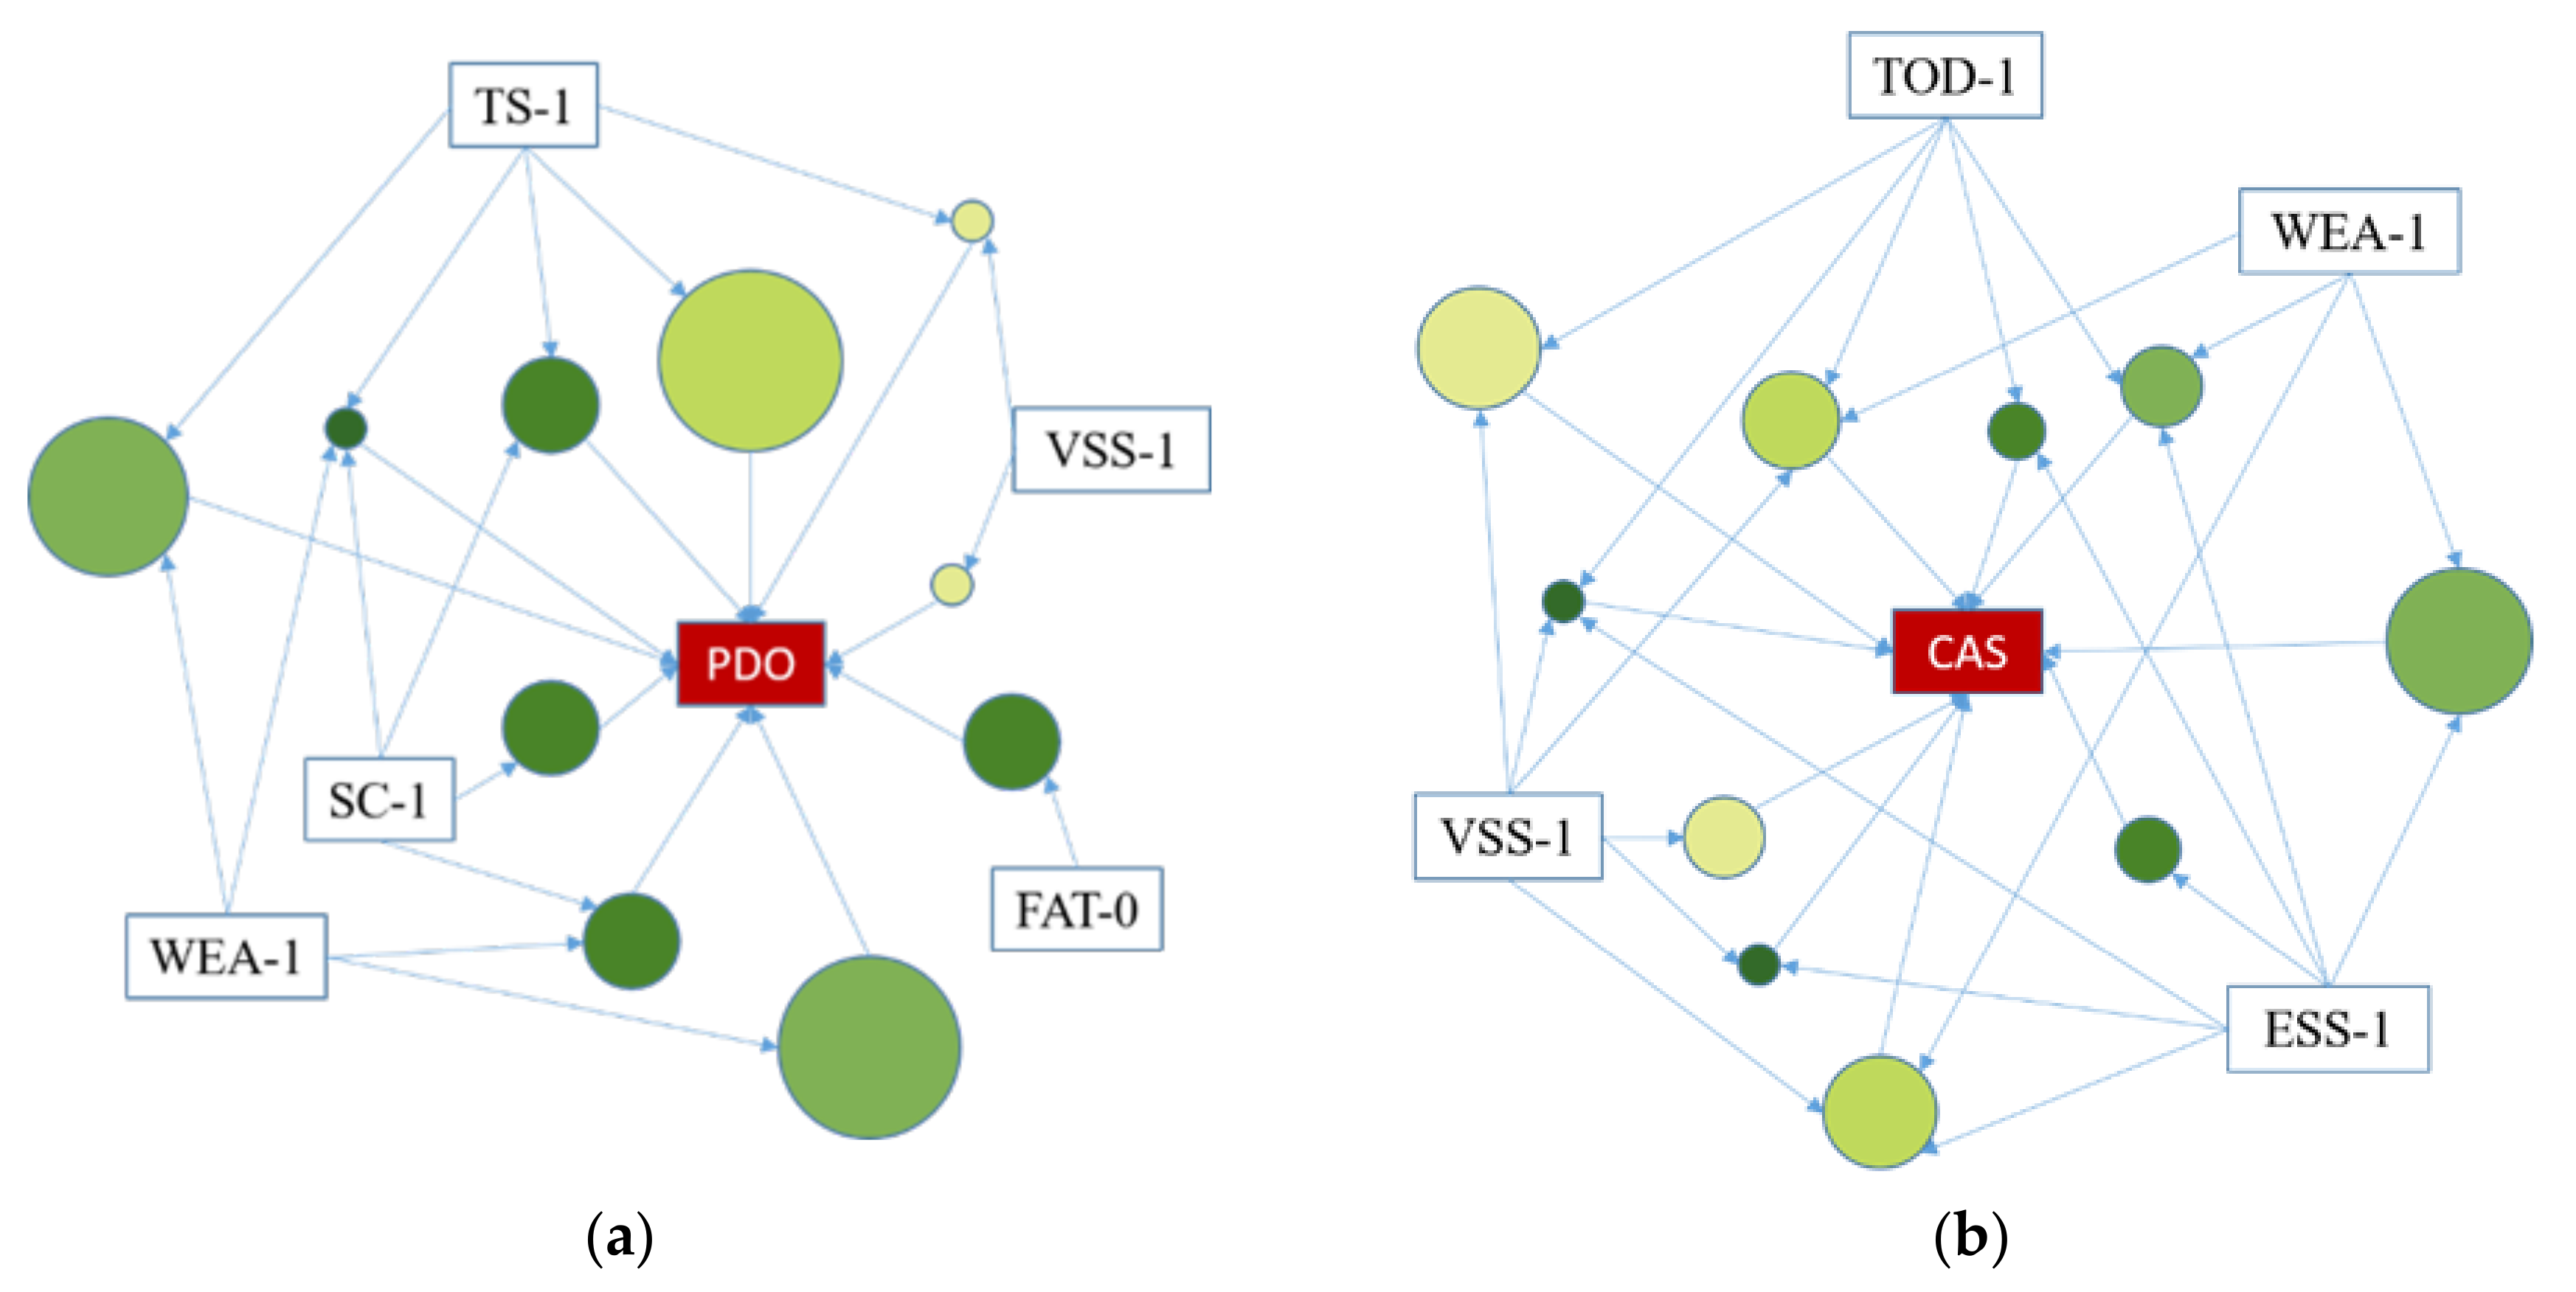
- PDO Accidents.
- (2)
- CAS Accidents.
- (3)
- Proposals to Improve Safety in Hazmat Transport on Urban Roads.
4.1.2. Rural Roads
- (1)
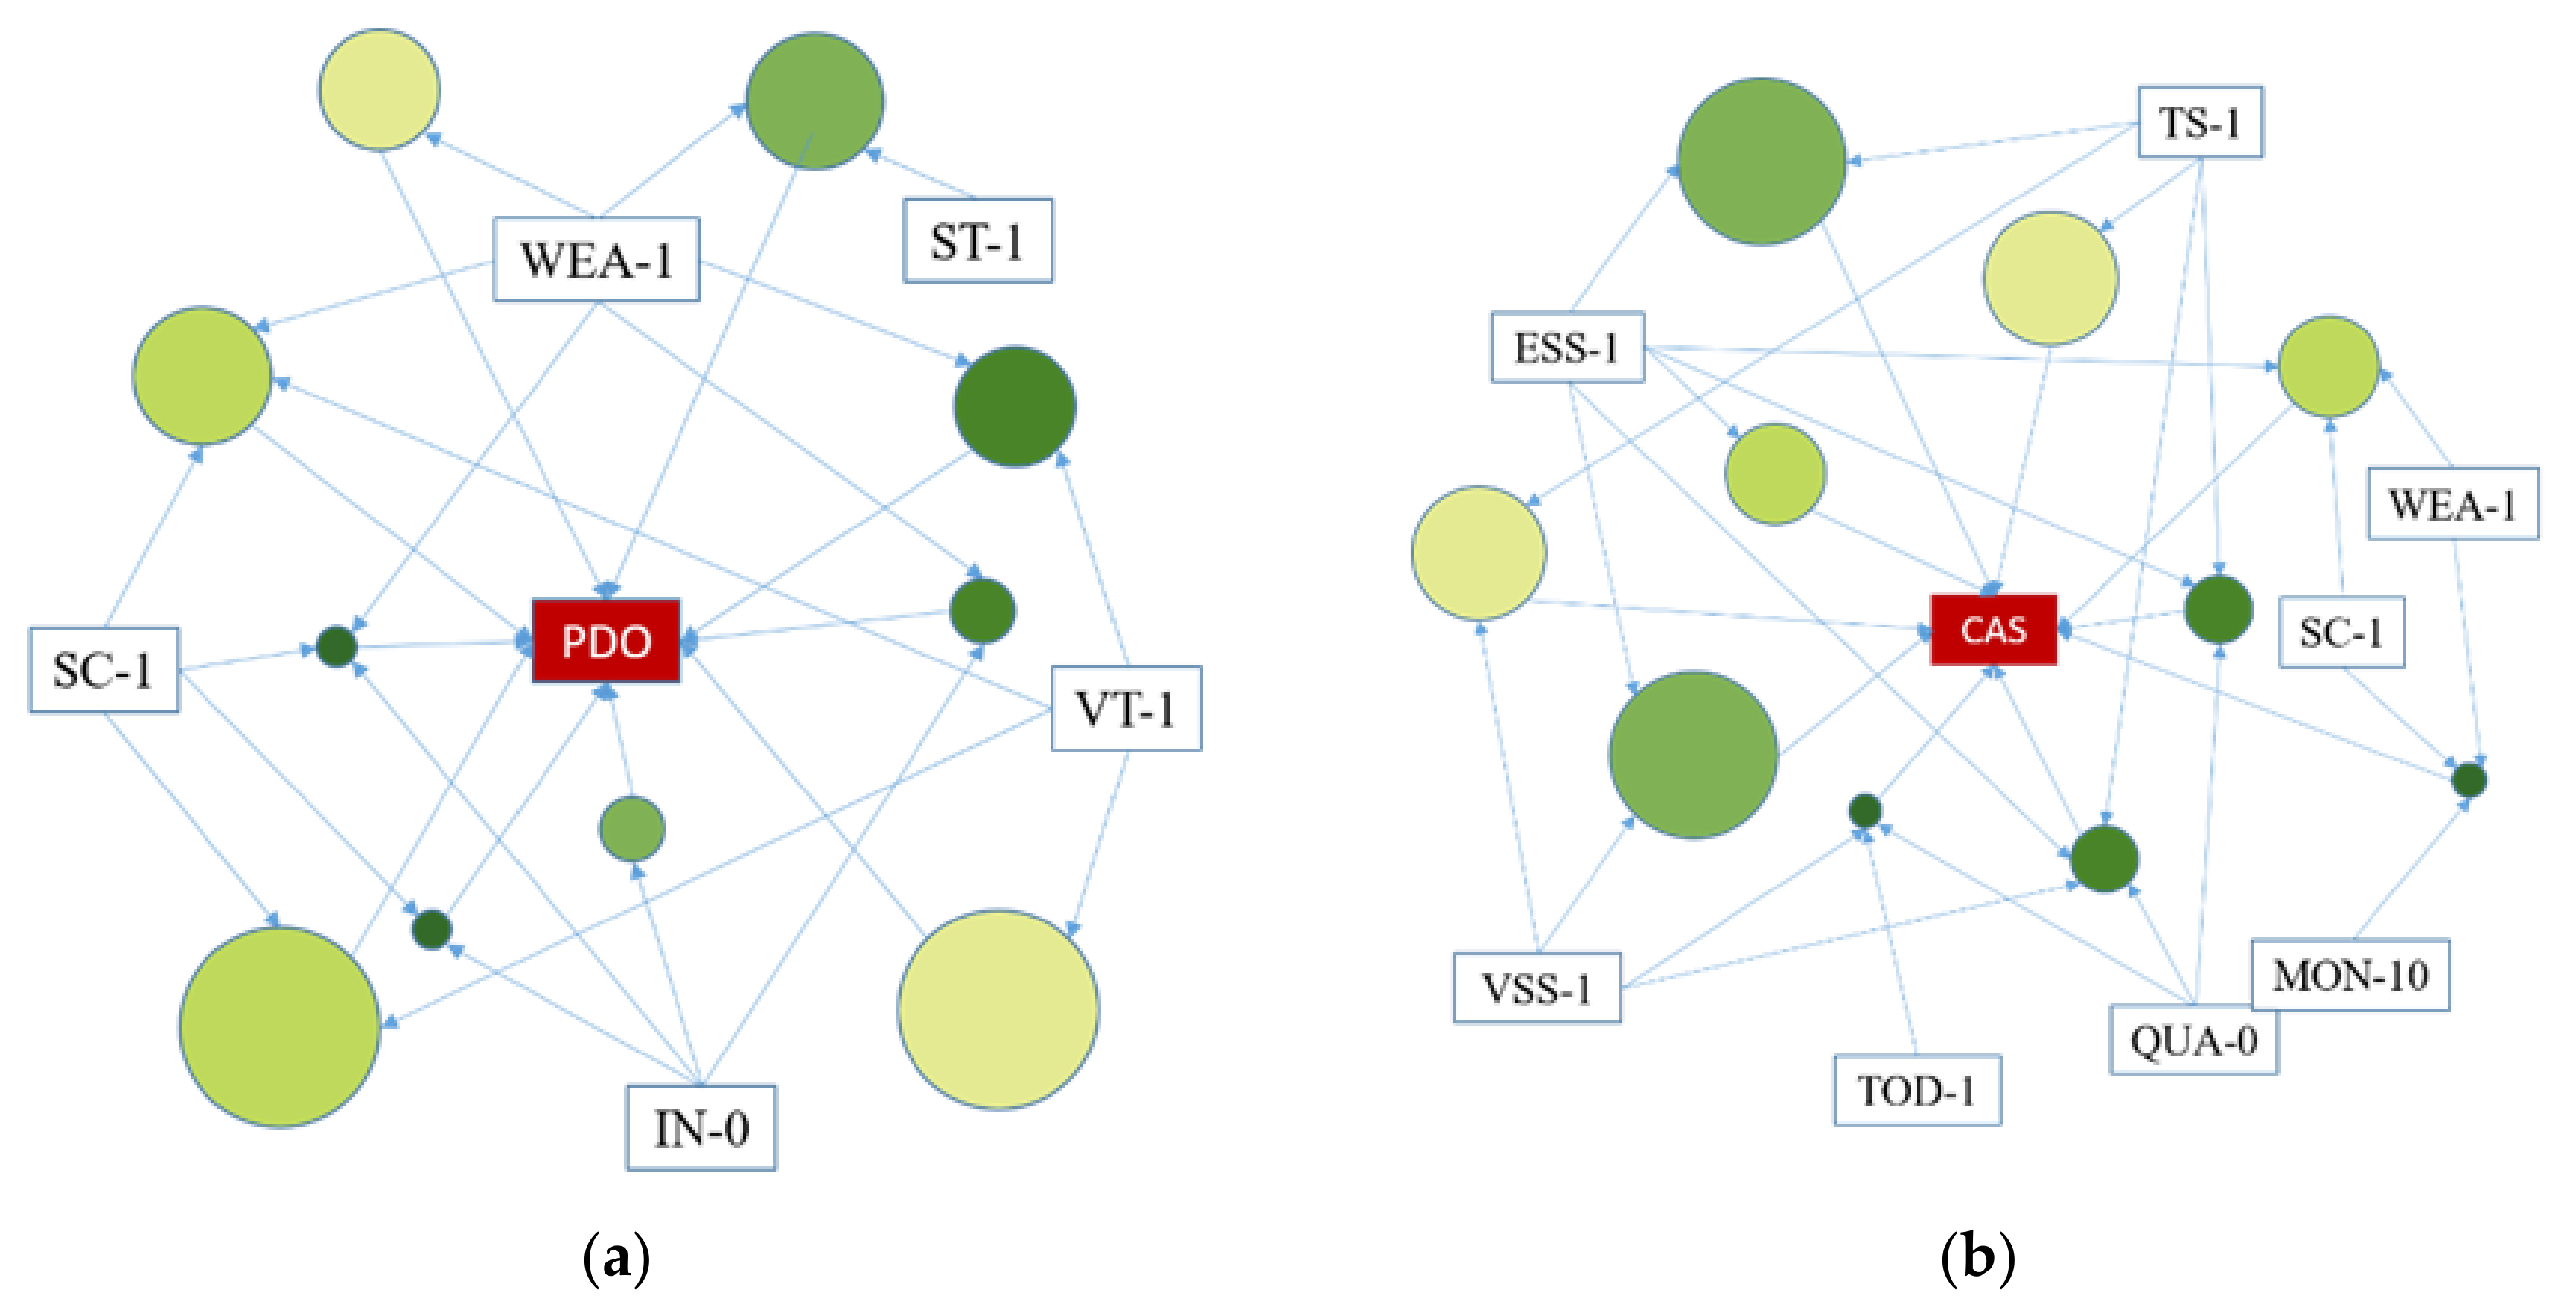
- PDO Accidents.
- (2)
- CAS Accidents.
- (3)
- Proposals to Improve Safety in Hazmat Transport on Rural Roads.
4.1.3. Highways
- (1)
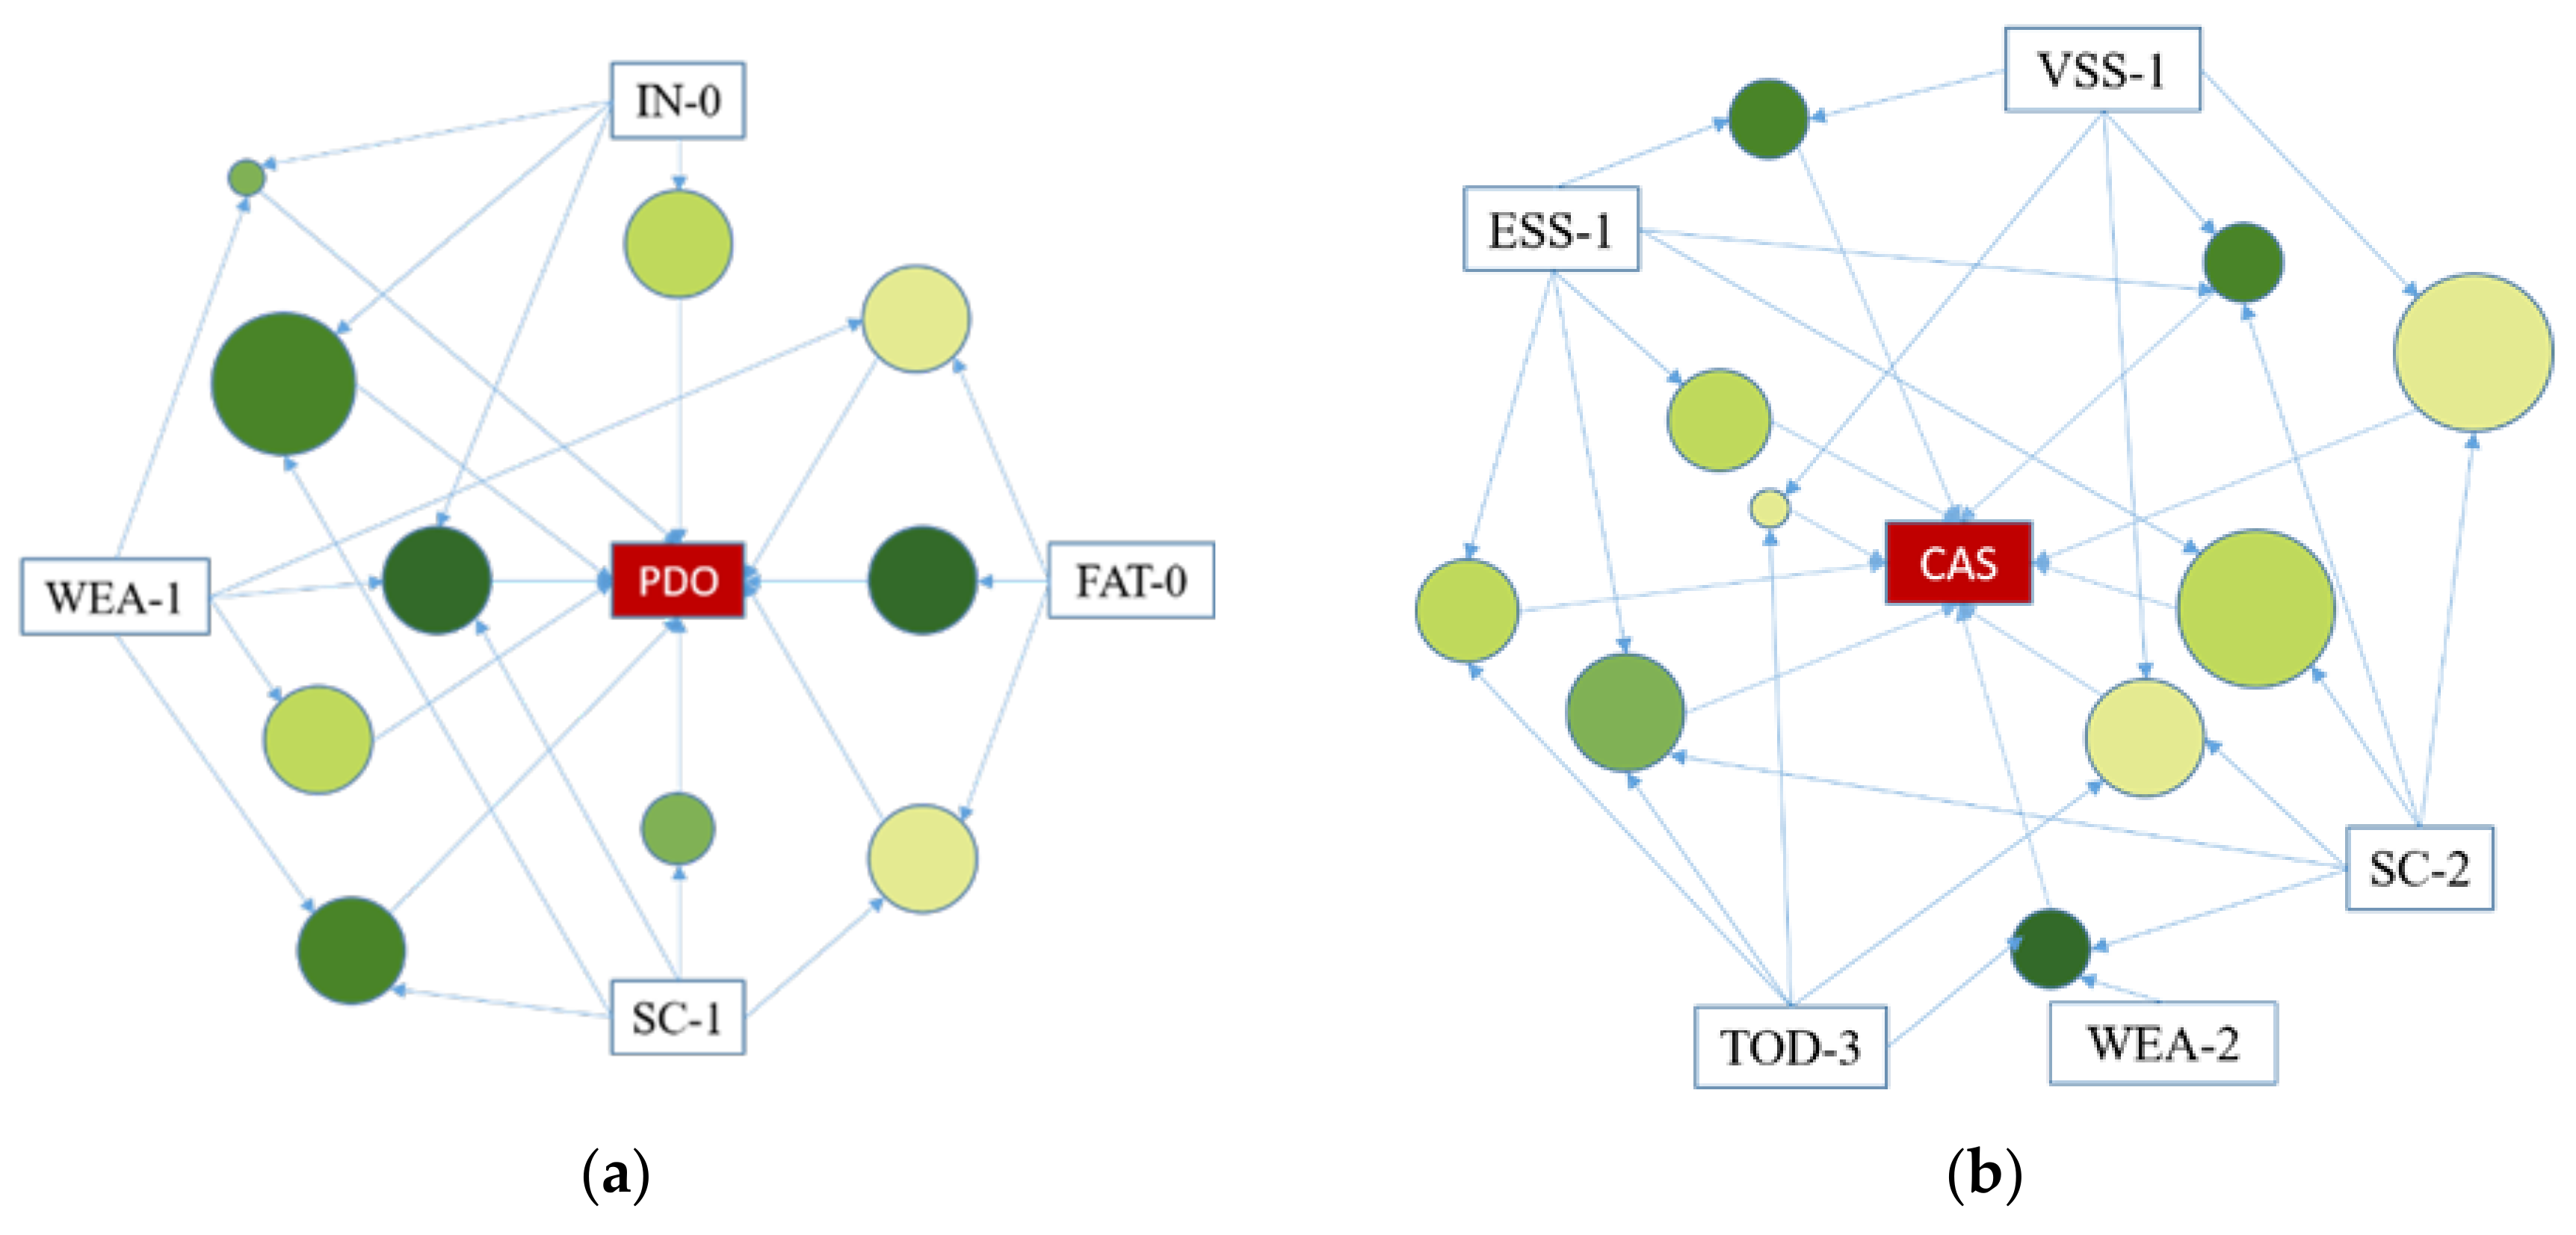
- PDO Accidents.
- (2)
- CAS Accidents.
- (3)
- Proposals to Improve Safety in Hazmat Transport on Highways.
4.2. Performance of the Prediction Models
5. Conclusions
- (1)
- The use of ARM can both compensate for the negative impact of correlation between risk factors as independent variables in accident severity analysis and fill the shortcoming in which machine learning cannot provide a reasonable explanation for the antecedents and consequences of accident occurrences. This approach also provides meaningful relationship maps for factors that are strongly associated with the occurrence of accidents of different severities under different road types.
- (a)
- The features that had a strong association with the occurrence of PDO accidents during the transportation of Hazmat on urban roads were WEA, TS, SC, FAT and VSS, and the rule with the highest lift value was {WEA-1, TS-1, SC-1} → {Severity-PDO}. The features that had a strong association with the occurrence of accidents involving human casualties were VSS, ESS, TS, WEA and QUA, and the rule with the highest lift value was {VSS-1, ESS-1, TOD-1} → {Severity-CAS}.
- (b)
- In accidents involving the transport of Hazmat occurring on rural roads, IN, SC, WEA, VT and ST were strongly associated with the occurrence of PDO accidents, and the highest lift value was found for the association rule {IN-0, SC-1, WEA-1} → {Severity-PDO}. The occurrence of CAS accidents had a strong association with QUA, ESS, TS, VSS, SC, WEA, TON and MON, and the highest lift values of the association rules were {QUA-0, TOD-1, VSS-1} → {Severity-CAS} and {MON-10, WEA-1, SC-1} → {Severity-CAS}.
- (c)
- The occurrence of PDO accidents on highways had a strong association with IN, SC, WEA, and FAT. {IN-0, SC-1, WEA-1} → {Severity-PDO} was the rule with the highest lift value. Casualties on highways were more likely to be associated with ESS, TOD, VSS, WEA, and SC, and {SC-2, WEA-2, TOD-3} → {Severity-CAS} was the rule with the most significant lift value.
- (a)
- To improve the safety of road transportation of Hazmat in urban areas, the road administration unit needs to continuously ensure good road surface conditions. The transportation management department should improve access standards and monitoring of Hazmat transport vehicles entering urban areas. Law enforcement departments need to increase the frequency of supervision, prosecution and punishment of Hazmat transport violations at night to eliminate dangerous driver behaviors. However, the main consideration is to avoid the routing of Hazmat transport vehicles through densely populated urban areas;
- (b)
- Strengthening the monitoring and punishment of the illegal transport of Hazmat; improving the basic knowledge of traffic safety, safety and risk awareness of participants in traffic travel; optimizing the traffic infrastructure; and setting up more Hazmat rescue stations and equipping them with special materials for Hazmat accident rescue can reduce the incidence and severity of Hazmat road transport accidents in rural areas;
- (c)
- The safety of highway transportation can be improved by establishing a whole-process supervision system for the transportation of Hazmat with the help of fifth-generation (5G) networks, big data, the Internet of Things, biotechnology and other technologies. The supervisory system can maintain continuous attention to driver fatigue, the state of Hazmat, the driving speed of the vehicle, and the driving environment of the highway and make appropriate interventions according to the actual situation in a timely manner.
- (2)
- Selecting multiple prediction models, the features that exhibit strong correlation rules with accident severity are used as inputs to the prediction models, allowing the best prediction model to be determined for each road type for accident severity prediction in the transportation of Hazmat. The risk features discovered by the Apriori algorithm on different road types that lead to accidents of different severity were input into different prediction models for case studies and it was found that, when predicting the severity of Hazmat road transport accidents, XGBoost should be chosen for urban roads and highways, and NNC should be chosen for rural roads.
- (3)
- Limitations and future research.
- (a)
- In this paper, when classifying the severity of Hazmat road transport accidents, only human casualty determinants are considered, and the salient features of environmental damage caused by Hazmat transport accidents are not reflected. In future research, it will be necessary to quantify the data on damage to the environment to achieve a more comprehensive analysis of the severity of accidents;
- (b)
- In this paper, when analyzing the factors influencing accident severity, objective factors such as roads, vehicles and the external environment are considered to influence accident severity, but the subjective aspects of drivers’ psychological and physiological states are not analyzed. In future research, we need to obtain more information about the subjective state of drivers through questionnaires, surveillance videos and physiological state testing instruments to analyze the influence of drivers on the occurrence of accidents.
Author Contributions
Funding
Institutional Review Board Statement
Informed Consent Statement
Data Availability Statement
Conflicts of Interest
References
- National Bureau of Statistics of the People’s Republic of China. China Statistical Yearbook; National Bureau of Statistics of China: Beijing, China, 2020.
- Ministry of Transport of the People’s Republic of China. Statistical Data. Available online: http://www.mot.gov.cn/shuju/ (accessed on 4 September 2021).
- Shen, X.; Wei, S. Severity analysis of road transport accidents of hazardous materials with machine learning. Traffic Inj. Prev. 2021, 22, 324–329. [Google Scholar] [CrossRef]
- Zhao, L.; Qian, Y.; Hu, Q.-M.; Jiang, R.; Li, M.; Wang, X. An Analysis of Hazardous Chemical Accidents in China between 2006 and 2017. Sustainability 2018, 10, 2935. [Google Scholar] [CrossRef] [Green Version]
- Wei, L.; Minghu, W.; Nan, Y. Statistical analysis of hazardous chemical accidents in a province from 2010 to 2017. Ind. Saf. Environ. Prot. 2018, 44, 54–57. [Google Scholar]
- Oggero, A.; Darbra, R.M.; Munoz, M.; Planas, E.; Casal, J. A survey of accidents occurring during the transport of hazardous substances by road and rail. J. Hazard. Mater. 2006, 133, 1–7. [Google Scholar] [CrossRef]
- Vlakveld, W.P.; Twisk, D.; Christoph, M.; Boele, M.; Sikkema, R.; Remy, R.; Schwab, A.L. Speed choice and mental workload of elderly cyclists on e-bikes in simple and complex traffic situations: A field experiment. Accid. Anal. Prev. 2015, 74, 97–106. [Google Scholar] [CrossRef] [Green Version]
- Yuan, Q.; Yang, H.; Huang, J.; Kou, S.; Li, Y.; Theofilatos, A. What factors impact injury severity of vehicle to electric bike crashes in China? Adv. Mech. Eng. 2017, 9. [Google Scholar] [CrossRef] [Green Version]
- Chen, F.; Chen, S. Injury severities of truck drivers in single- and multi-vehicle accidents on rural highways. Accid. Anal. Prev. 2011, 43, 1677–1688. [Google Scholar] [CrossRef] [PubMed]
- Zhang, H.-D.; Zheng, X.-P. Characteristics of hazardous chemical accidents in China: A statistical investigation. J. Loss Prev. Process. Ind. 2012, 25, 686–693. [Google Scholar] [CrossRef]
- Wang, B.; Wu, C.; Reniers, G.; Huang, L.; Kang, L.; Zhang, L. The future of hazardous chemical safety in China: Opportunities, problems, challenges and tasks. Sci. Total Environ. 2018, 643, 1–11. [Google Scholar] [CrossRef] [PubMed]
- Andersson, S.-E. Safe Transport of Dangerous Goods: Road, Rail or Sea? A Screening of Technical and Administrative Factors. Eur. J. Oper. Res. 1994, 75, 499–507. [Google Scholar] [CrossRef]
- Yang, J.; Li, F.; Zhou, J.; Zhang, L.; Huang, L.; Bi, J. A survey on hazardous materials accidents during road transport in China from 2000 to 2008. J. Hazard. Mater. 2010, 184, 647–653. [Google Scholar] [CrossRef] [PubMed]
- Xing, Y.; Chen, S.; Zhu, S.; Zhang, Y.; Lu, J. Exploring Risk Factors Contributing to the Severity of Hazardous Material Transportation Accidents in China. Int. J. Environ. Res. Public Health 2020, 17, 1344. [Google Scholar] [CrossRef] [Green Version]
- Azimi, G.; Rahimi, A.; Asgari, H.; Jin, X. Severity analysis for large truck rollover crashes using a random parameter ordered logit model. Accid. Anal. Prev. 2019, 135, 105355. [Google Scholar] [CrossRef]
- Ma, C.; Zhou, J.-B.; Yang, D. Causation Analysis of Hazardous Material Road Transportation Accidents Based on the Ordered Logit Regression Model. Int. J. Environ. Res. Public Health 2020, 17, 1259. [Google Scholar] [CrossRef] [Green Version]
- Iranitalab, A.; Khattak, A. Comparison of four statistical and machine learning methods for crash severity prediction. Accid. Anal. Prev. 2017, 108, 27–36. [Google Scholar] [CrossRef]
- Chen, C.; Zhang, G.; Qian, Z.; Tarefder, R.A.; Tian, Z. Investigating driver injury severity patterns in rollover crashes using support vector machine models. Accid. Anal. Prev. 2016, 90, 128–139. [Google Scholar] [CrossRef] [PubMed]
- de Oña, J.; López, G.; Abellán, J. Extracting decision rules from police accident reports through decision trees. Accid. Anal. Prev. 2013, 50, 1151–1160. [Google Scholar] [CrossRef] [Green Version]
- Abellán, J.; López, G.; de Oña, J. Analysis of traffic accident severity using Decision Rules via Decision Trees. Expert Syst. Appl. 2013, 40, 6047–6054. [Google Scholar] [CrossRef] [Green Version]
- Zeng, Q.; Huang, H. A stable and optimized neural network model for crash injury severity prediction. Accid. Anal. Prev. 2014, 73, 351–358. [Google Scholar] [CrossRef] [PubMed]
- Kashani, A.T.; Rabieyan, R.; Besharati, M.M. A data mining approach to investigate the factors influencing the crash severity of motorcycle pillion passengers. J. Saf. Res. 2014, 51, 93–98. [Google Scholar] [CrossRef]
- Liu, X. Risk Analysis of Transporting Crude Oil by Rail: Methodology and Decision Support System. Transp. Res. Rec. 2016, 2547, 57–65. [Google Scholar] [CrossRef]
- Cui, Y.; He, Q.; Khani, A. Travel Behavior Classification: An Approach with Social Network and Deep Learning. Transp. Res. Rec. 2018, 2672, 68–80. [Google Scholar] [CrossRef]
- Mafi, S.; AbdelRazig, Y.; Doczy, R. Machine Learning Methods to Analyze Injury Severity of Drivers from Different Age and Gender Groups. Transp. Res. Rec. J. Transp. Res. Board 2018, 2672, 171–183. [Google Scholar] [CrossRef]
- Trepanier, M.; Leroux, M.-H.; De Marcellis-Warin, N. Cross-analysis of hazmat road accidents using multiple databases. Accid. Anal. Prev. 2008, 41, 1192–1198. [Google Scholar] [CrossRef] [PubMed]
- Huting, J.; Reid, J.; Nwoke, U.; Bacarella, E.; Ky, K.E. Identifying Factors That Increase Bus Accident Risk by Using Random Forests and Trip-Level Data. Transp. Res. Rec. 2016, 2539, 149–158. [Google Scholar] [CrossRef]
- Yassin, S.S. Pooja Road accident prediction and model interpretation using a hybrid K-means and random forest algorithm approach. SN Appl. Sci. 2020, 2, 1–13. [Google Scholar] [CrossRef]
- Harb, R.; Yan, X.; Radwan, E.; Su, X. Exploring precrash maneuvers using classification trees and random forests. Accid. Anal. Prev. 2009, 41, 98–107. [Google Scholar] [CrossRef]
- Lv, Y.; Tang, S.; Zhao, H. Real-Time Highway Traffic Accident Prediction Based on the k-Nearest Neighbor Method. In Proceedings of the 2009 International Conference on Measuring Technology and Mechatronics Automation, ICMTMA, Zhangjiajie, China, 11–12 April 2009; Volume 3, pp. 547–550. [Google Scholar]
- Ma, J.; Ding, Y.; Cheng, J.C.P.; Tan, Y.; Gan, V.J.L.; Zhang, J. Analyzing the Leading Causes of Traffic Fatalities Using XGBoost and Grid-Based Analysis: A City Management Perspective. IEEE Access 2019, 7, 148059–148072. [Google Scholar] [CrossRef]
- Soleimani, S.; Mousa, S.R.; Codjoe, J.; Leitner, M. A Comprehensive Railroad-Highway Grade Crossing Consolidation Model: A Machine Learning Approach. Accid. Anal. Prev. 2019, 128, 65–77. [Google Scholar] [CrossRef]
- Parsa, A.B.; Movahedi, A.; Taghipour, H.; Derrible, S.; Mohammadian, A.K. Toward safer highways, application of XGBoost and SHAP for real-time accident detection and feature analysis. Accid. Anal. Prev. 2020, 136, 105405. [Google Scholar] [CrossRef]
- Tang, J.; Liang, J.; Han, C.; Li, Z.; Huang, H. Crash injury severity analysis using a two-layer Stacking framework. Accid. Anal. Prev. 2018, 122, 226–238. [Google Scholar] [CrossRef]
- Zhao, Q.; Bhowmick, S.S. Association Rule Mining: A Survey; Nanyang Technological University: Singapore, 2003; Volume 135. [Google Scholar]
- Geng, X.; Liang, Y.; Jiao, L. ARC-SL: Association rule-based classification with soft labels. Know.-Based Syst. 2021, 225, 107116. [Google Scholar] [CrossRef]
- Le, B.; Le, D.P.; Tran, M.-T. Hiding sensitive association rules using the optimal electromagnetic optimization method and a dynamic bit vector data structure. Expert Syst. Appl. 2021, 176, 114879. [Google Scholar] [CrossRef]
- Hong, J.; Tamakloe, R.; Park, D. Application of association rules mining algorithm for hazardous materials transportation crashes on expressway. Accid. Anal. Prev. 2020, 142, 105497. [Google Scholar] [CrossRef]
- Du, W.; Yang, J.; Powis, B.; Zheng, X.; Ozanne-Smith, J.; Bilston, L.; Wu, M. Understanding on-road practices of electric bike riders: An observational study in a developed city of China. Accid. Anal. Prev. 2013, 59, 319–326. [Google Scholar] [CrossRef]
- Das, S.; Dutta, A.; Jalayer, M.; Bibeka, A.; Wu, L. Factors influencing the patterns of wrong-way driving crashes on freeway exit ramps and median crossovers: Exploration using ‘Eclat’ association rules to promote safety. Int. J. Transp. Sci. Technol. 2018, 7, 114–123. [Google Scholar] [CrossRef]
- Weng, J.; Zhu, J.-Z.; Yan, X.; Liu, Z. Investigation of work zone crash casualty patterns using association rules. Accid. Anal. Prev. 2016, 92, 43–52. [Google Scholar] [CrossRef] [PubMed]
- Montella, A. Identifying crash contributory factors at urban roundabouts and using association rules to explore their relationships to different crash types. Accid. Anal. Prev. 2011, 43, 1451–1463. [Google Scholar] [CrossRef] [PubMed]
- Das, A.; Ahmed, M.M.; Ghasemzadeh, A. Using trajectory-level SHRP2 naturalistic driving data for investigating driver lane-keeping ability in fog: An association rules mining approach. Accid. Anal. Prev. 2019, 129, 250–262. [Google Scholar] [CrossRef]
- Langford, B.C.; Chen, J.; Cherry, C.R. Risky riding: Naturalistic methods comparing safety behavior from conventional bicycle riders and electric bike riders. Accid. Anal. Prev. 2015, 82, 220–226. [Google Scholar] [CrossRef]
- Xu, C.; Bao, J.; Wang, C.; Liu, P. Association rule analysis of factors contributing to extraordinarily severe traffic crashes in China. J. Saf. Res. 2018, 67, 65–75. [Google Scholar] [CrossRef] [PubMed]
- Yu, S.; Jia, Y.; Sun, D. Identifying Factors that Influence the Patterns of Road Crashes Using Association Rules: A case Study from Wisconsin, United States. Sustainability 2019, 11, 1925. [Google Scholar] [CrossRef] [Green Version]
- Cover, T.M.; Hart, P.E. Approximate Formulas for the Information Transmitted by a Discrete Communication Channel; IEEE: Manhattan, NY, USA, 1952; Volume 24. [Google Scholar]
- Grahne, G. Encyclopedia of Database Systems; Liu, L., Özsu, M., Eds.; Springer: New York, NY, USA, 2016. [Google Scholar] [CrossRef]
- Lê, S.; Josse, J.; Rennes, A.; Husson, F. FactoMineR: An R Package for Multivariate Analysis. J. Stat. Softw. 2008, 25, 1–18. [Google Scholar] [CrossRef] [Green Version]
- Scornet, E.; Biau, G.; Vert, J.-P. Consistency of random forests. Ann. Stat. 2015, 43, 1716–1741. [Google Scholar] [CrossRef]
- Chen, T.; Guestrin, C. XGBoost: A Scalable Tree Boosting System. In Proceedings of the ACM SIGKDD International Conference on Knowledge Discovery and Data Mining, San Francisco, CA, USA, 13–17 August 2016; pp. 785–794. [Google Scholar]
- Savolainen, P.T.; Mannering, F.L.; Lord, D.; Quddus, M.A. The Statistical Analysis of Highway Crash-Injury Severities: A Review and Assessment of Methodological Alternatives. Accid. Anal. Prev. 2011, 43, 1666–1676. [Google Scholar] [CrossRef] [Green Version]
- Severino, A.; Pappalardo, G.; Curto, S.; Trubia, S.; Olayode, I.O. Safety Evaluation of Flower Roundabout Considering Autonomous Vehicles Operation. Sustainability 2021, 13, 10120. [Google Scholar] [CrossRef]


| Confusion Matrix | Predicted Condition | ||
|---|---|---|---|
| Positive | Negative | ||
| True condition | Positive | True Positive (TP) | False Negative (FN) |
| Negative | False Positive (FP) | True Negative (TN) | |
| Feature | Code and Description | Count | Feature | Code and Description | Count |
|---|---|---|---|---|---|
| Hazardous Materials: HM | Gases: 2 | 191 | Road Alignment: RA | Straight: 1 | 530 |
| Flammable liquids: 3 | 487 | Ramps: 2 | 82 | ||
| Flammable solids: 4 | 11 | Curved ramp: 3 | 7 | ||
| Oxidizers and organic peroxides: 5 | 16 | Curve: 4 | 243 | ||
| Poisonous and infectious substances: 6 | 15 | Vehicle Type: VT | Tank: 1 | 745 | |
| 141 | Cargo-truck: 2 | 96 | |||
| Corrosives: 8 | 1 | Other: 3 | 21 | ||
| Season: SEA | Spring: 1 | 221 | Surface Condition: SC | Dry: 1 | 726 |
| Summer: 2 | 248 | Wet: 2 | 83 | ||
| Autumn: 3 | 208 | Ice: 3 | 28 | ||
| Winter: 4 | 185 | Waterlogged: 4 | 25 | ||
| Month: MON | January: 1 | 60 | Segment Type: ST | Ordinary segment: 1 | 671 |
| February: 2 | 41 | Tunnel: 2 | 40 | ||
| March: 3 | 78 | Bridge: 3 | 32 | ||
| April: 4 | 75 | Entrance and exit: 4 | 26 | ||
| May: 5 | 68 | Station: 5 | 74 | ||
| June: 6 | 62 | Risky segment: 6 | 19 | ||
| July: 7 | 102 | Intersection: INT | Yes: 1 | 128 | |
| August: 8 | 84 | No: 0 | 734 | ||
| September: 9 | 74 | Traffic Signal: TS | Yes: 1 | 837 | |
| October: 10 | 74 | No: 0 | 25 | ||
| November: 11 | 60 | Fatigue: FAT | Yes: 1 | 175 | |
| December: 12 | 84 | No: 0 | 687 | ||
| Time of Day: TOD | [1–3]: 1 | 162 | Moving Status: MS | Go straight: 1 | 487 |
| [4–6]: 2 | 122 | Stop: 2 | 63 | ||
| [7–9]: 3 | 150 | Turn: 3 | 252 | ||
| [10–12]: 4 | 92 | Downhill: 4 | 11 | ||
| [13–15]: 5 | 167 | Avoid: 5 | 49 | ||
| [16–18]: 6 | 31 | Weather: WEA | Sunny: 1 | 778 | |
| [19–21]: 7 | 51 | Rain: 2 | 46 | ||
| [22–24]: 8 | 87 | Snow: 3 | 22 | ||
| Equipment Safety Status: ESS | Safety: 1 | 723 | Fog: 4 | 16 | |
| Malfunction: 0 | 139 | Qualification: QUA | Yes: 1 | 808 | |
| Vehicle Safety Status: VSS | Safety: 1 | 779 | No: 0 | 54 | |
| Malfunction: 0 | 83 |
| No. | Association Rules | Support | Confidence | Lift |
|---|---|---|---|---|
| 1 | {WEA-1, TS-1, SC-1}→{Severity-PDO} | 0.255 | 0.902 | 2.059 |
| 2 | {SC-1}→{Severity-PDO} | 0.280 | 0.951 | 2.050 |
| 3 | {WEA-1, SC-1}→{Severity-PDO} | 0.280 | 0.951 | 2.050 |
| 4 | {TS-1, SC-1}→{Severity-PDO} | 0.275 | 0.941 | 2.045 |
| 5 | {FAT-0}→{Severity-PDO} | 0.275 | 0.941 | 2.045 |
| 6 | {WEA-1}→{Severity-PDO} | 0.295 | 0.980 | 2.026 |
| 7 | {WEA-1, TS-1}→{Severity-PDO} | 0.290 | 0.971 | 2.021 |
| 8 | {TS-1}→{Severity-PDO} | 0.295 | 0.990 | 1.995 |
| 9 | {VSS-1}→{Severity-PDO} | 0.255 | 0.902 | 1.954 |
| 10 | {TS-1, VSS-1}→{Severity-PDO} | 0.255 | 0.902 | 1.954 |
| 1 | {VSS-1, ESS-1, TOD-1}→{Severity-CAS} | 0.275 | 0.960 | 2.276 |
| 2 | {VSS-1, ESS-1}→{Severity-CAS} | 0.275 | 0.960 | 2.276 |
| 3 | {TOD-1, ESS-1}→{Severity-CAS} | 0.280 | 0.970 | 2.210 |
| 4 | {ESS-1}→{Severity-CAS} | 0.280 | 0.970 | 2.202 |
| 5 | {WEA-1, TOD-1, ESS-1}→{Severity-CAS} | 0.246 | 0.900 | 2.188 |
| 6 | {WEA-1, ESS-1}→{Severity-CAS} | 0.246 | 0.900 | 2.181 |
| 7 | {WEA-1, VSS-1, ESS-1}→{Severity-CAS} | 0.246 | 0.900 | 2.089 |
| 8 | {TOD-1, VSS-1, WEA-1}→{Severity-CAS} | 0.246 | 0.900 | 2.089 |
| 9 | {VSS-1}→{Severity-CAS} | 0.250 | 0.910 | 2.081 |
| 10 | {VSS-1, TOD-1}→{Severity-CAS} | 0.250 | 0.910 | 2.081 |
| No. | Association Rules | Support | Confidence | Lift |
|---|---|---|---|---|
| 1 | {IN-0, SC-1, WEA-1 }→{Severity-PDO} | 0.201 | 0.901 | 1.943 |
| 2 | {IN-0, SC-1}→{Severity-PDO} | 0.201 | 0.887 | 1.924 |
| 3 | {IN-0, WEA-1}→{Severity-PDO} | 0.204 | 0.887 | 1.883 |
| 4 | {VT-1, WEA-1}→{Severity-PDO} | 0.213 | 0.877 | 1.872 |
| 5 | {ST-1, WEA-1}→{Severity-PDO} | 0.214 | 0.875 | 1.867 |
| 6 | {IN-0}→{Severity-PDO} | 0.205 | 0.871 | 1.865 |
| 7 | {VT-1, SC-1}→{Severity-PDO} | 0.231 | 0.868 | 1.861 |
| 8 | {VT-1, SC-1, WEA-1}→{Severity-PDO} | 0.217 | 0.863 | 1.857 |
| 9 | {VT-1}→{Severity-PDO} | 0.225 | 0.851 | 1.844 |
| 10 | {WEA-1}→{Severity-PDO} | 0.213 | 0.847 | 1.742 |
| 1 | {QUA-0, TOD-1, VSS-1} →{Severity-CAS} | 0.202 | 0.906 | 2.432 |
| 2 | {MON-10, WEA-1, SC-1}→{Severity-CAS} | 0.202 | 0.906 | 2.432 |
| 3 | {QUA-1, ESS-1, TS-1}→{Severity-CAS} | 0.213 | 0.895 | 2.413 |
| 4 | {QUA-1, ESS-1, TS-1, VSS-1}→{Severity-CAS} | 0.213 | 0.895 | 2.413 |
| 5 | {ESS-1, TS-1}→{Severity-CAS} | 0.248 | 0.865 | 2.222 |
| 6 | {VSS-1, ESS-1}→{Severity-CAS} | 0.244 | 0.850 | 2.160 |
| 7 | {ESS-1}→{Severity-CAS} | 0.220 | 0.837 | 2.131 |
| 8 | {SC-1, ESS-1, WEA-1}→{Severity-CAS} | 0.221 | 0.825 | 2.117 |
| 9 | {TS-1}→{Severity-CAS} | 0.235 | 0.820 | 2.099 |
| 10 | {VSS-1, TS-1}→{Severity-CAS} | 0.239 | 0.823 | 2.096 |
| No. | Association Rules | Support | Confidence | Lift |
|---|---|---|---|---|
| 1 | {IN-0, SC-1, WEA-1}→{Severity-PDO} | 0.210 | 0.966 | 2.044 |
| 2 | {FAT-0}→{Severity-PDO} | 0.210 | 0.889 | 1.961 |
| 3 | {IN-0, SC-1}→{Severity-PDO} | 0.235 | 0.877 | 1.883 |
| 4 | {SC-1, WEA-1}→{Severity-PDO} | 0.225 | 0.862 | 1.855 |
| 5 | {SC-1}→{Severity-PDO} | 0.213 | 0.843 | 1.745 |
| 6 | {IN-0, WEA-1}→{Severity-PDO} | 0.203 | 0.825 | 1.676 |
| 7 | {WEA-1}→{Severity-PDO} | 0.223 | 0.782 | 1.664 |
| 8 | {IN-0}→{Severity-PDO} | 0.224 | 0.773 | 1.656 |
| 9 | {WEA-1, FAT-0}→{Severity-PDO} | 0.223 | 0.772 | 1.645 |
| 10 | {FAT-0, SC-1}→{Severity-PDO} | 0.220 | 0.766 | 1.631 |
| 1 | {SC-2, WEA-2, TOD-3}→{Severity-CAS} | 0.213 | 0.903 | 2.482 |
| 2 | {ESS-1, VSS-1, SC-2}→{Severity-CAS} | 0.216 | 0.902 | 2.339 |
| 3 | {ESS-1, VSS-1}→{Severity-CAS} | 0.213 | 0.895 | 2.237 |
| 4 | {ESS-1, TOD-3, SC-2}→{Severity-CAS} | 0.224 | 0.887 | 2.203 |
| 5 | {TOD-3, ESS-1}→{Severity-CAS} | 0.220 | 0.873 | 2.151 |
| 6 | {SC-2, ESS-1}→{Severity-CAS} | 0.230 | 0.879 | 2.148 |
| 7 | {ESS-1}→{Severity-CAS} | 0.220 | 0.872 | 2.146 |
| 8 | {TOD-3, VSS-1, SC-2}→{Severity-CAS} | 0.224 | 0.874 | 2.070 |
| 9 | {TOD-3, VSS-1}→{Severity-CAS} | 0.204 | 0.861 | 2.067 |
| 10 | {SC-2, VSS-1}→{Severity-CAS} | 0.230 | 0.840 | 2.064 |
| Models | Urban Roads | Rural Roads | Highways | |||||||
|---|---|---|---|---|---|---|---|---|---|---|
| Accuracy | Recall | AUC | Accuracy | Recall | AUC | Accuracy | Recall | AUC | ||
| OL | PDO | 0.516 | 0.376 | 0.503 | 0.603 | 0.389 | 0.506 0.506 | 0.612 | 0.472 | 0.517 |
| CAS | 0.435 | 0.448 | 0.457 | |||||||
| NNC | PDO | 0.801 | 0.772 | 0.870 | 0.815 | 0.828 | 0.915 0.915 | 0.794 | 0.800 | 0.860 |
| CAS | 0.876 | 0.920 | 0.774 | |||||||
| RF | PDO | 0.776 | 0.676 | 0.801 | 0.764 | 0.640 | 0.817 0.817 | 0.787 | 0.717 | 0.831 |
| CAS | 0.966 | 0.940 | 0.903 | |||||||
| XGBoost | PDO | 0.872 | 0.873 | 0.943 | 0.832 | 0.763 | 0.889 0.889 | 0.854 | 0.819 | 0.921 |
| CAS | 0.951 | 0.890 | 0.973 | |||||||
Publisher’s Note: MDPI stays neutral with regard to jurisdictional claims in published maps and institutional affiliations. |
© 2021 by the authors. Licensee MDPI, Basel, Switzerland. This article is an open access article distributed under the terms and conditions of the Creative Commons Attribution (CC BY) license (https://creativecommons.org/licenses/by/4.0/).
Share and Cite
Wei, S.; Shen, X.; Shao, M.; Sun, L. Applying Data Mining Approaches for Analyzing Hazardous Materials Transportation Accidents on Different Types of Roads. Sustainability 2021, 13, 12773. https://0-doi-org.brum.beds.ac.uk/10.3390/su132212773
Wei S, Shen X, Shao M, Sun L. Applying Data Mining Approaches for Analyzing Hazardous Materials Transportation Accidents on Different Types of Roads. Sustainability. 2021; 13(22):12773. https://0-doi-org.brum.beds.ac.uk/10.3390/su132212773
Chicago/Turabian StyleWei, Shanshan, Xiaoyan Shen, Minhua Shao, and Lijun Sun. 2021. "Applying Data Mining Approaches for Analyzing Hazardous Materials Transportation Accidents on Different Types of Roads" Sustainability 13, no. 22: 12773. https://0-doi-org.brum.beds.ac.uk/10.3390/su132212773