
Trends in United States Human Footprint Revealed by New Spatial Metrics of Urbanization and Per Capita Land Change


1
Center for Geospatial Analytics, North Carolina State University, 2800 Faucette Drive, Raleigh, NC 27695, USA
2
Department of Parks, Recreation and Tourism Management, North Carolina State University, 2820 Faucette Drive, Raleigh, NC 27695, USA
*
Author to whom correspondence should be addressed.
Sustainability 2021, 13(22), 12852; https://0-doi-org.brum.beds.ac.uk/10.3390/su132212852
Submission received: 7 October 2021
/
Revised: 9 November 2021
/
Accepted: 12 November 2021
/
Published: 20 November 2021
Abstract
:Accelerations in population growth and urban expansion are transforming landscapes worldwide and represent a major sustainability challenge. In the United States, land conversion to impervious surfaces has outpaced population increases, yet there are few spatial metrics of urbanization and per capita land change available nationwide for assessing local to regional trends in human footprint. We quantified changes (2000–2010) in housing density, imperviousness, per capita land consumption, and land-use efficiency for block groups of the contiguous U.S. and examined national patterns and variation in these metrics along the urban–rural gradient and by megaregion. Growth in housing (+13.6%) and impervious development (+10.7%) resulted in losses of rural lands, primarily due to exurbanization and suburbanization. Mean per capita consumption increased in all density classes but was over 8.5 times greater in rural lands than in exurban, suburban, and urban areas. Urban and suburban areas had significantly lower mean consumption, yet change was unsustainable in 60% of these areas. Megaregions across the sprawling Sun Belt, spanning from Arizona to North Carolina, grew most unsustainably, especially compared to regions in the Pacific Northwest and Front Range. This work establishes 21st-century benchmarks that decision-makers can use to track local and regional per capita land change and sustainable growth in the U.S.; however, these metrics of the form, extent, rate, and efficiency of urbanization can be applied anywhere concurrent built-up area and population data are available over time. Our web mapping application allows anyone to explore spatial and temporal trends in human footprint and download metrics, and it is designed to be easily updatable with future releases of validated developed land cover, protected areas, and decennial Census data.
1. Introduction
Accelerations in population growth and urban expansion are transforming regional landscapes worldwide and represent a major global sustainability challenge. The number and extent of urbanizing areas worldwide are greater than ever [1,2,3], and by 2050, 70% of the world’s population is projected to live in urban areas [3]. Land changes due to rapid urban expansion impact local and regional biodiversity [4,5,6,7], hydrology and water quality [8,9], biogeochemistry [10], and climate [11,12,13,14] through increased landscape fragmentation [15] and wholesale replacement of natural and working lands with impervious surfaces. Associated losses of agricultural lands and open space may threaten food security [16] and public health [17,18]. Historical growth in the global urban footprint and its impacts are well documented [19,20,21,22], and urbanization is increasingly recognized as a driver of environmental and socioeconomic changes beyond the urban fringe, including rural and exurban lands, through urban land teleconnections [23,24]. Wildlands and parks and protected areas in the U.S. are now experiencing environmental changes associated with nearby housing growth and impervious development [25,26,27,28]. The far-reaching impacts of urbanization have arguably existential implications for global environmental change, ecosystem health and services, and human wellbeing as urban areas worldwide are projected to grow faster than their populations this century [6,13,16,29]. New knowledge of how (i.e., form, rate) and where (i.e., extent, pattern) we develop is critical [30] to inform, plan for, and approach sustainable development in the 21st century.
Urbanization is a complex phenomenon with characteristics that are best analyzed in multiple dimensions and at multiple scales [31,32,33]. Seto et al. [2], for example, examined changes in the scale, location, rate of change, form, and function of different urbanizing areas of the world. Among their conclusions, they affirmed that urban form, scale (extent), and rate of change are fundamental characteristics of urbanization, and understanding the manner in which these factors interact to produce development patterns holds great promise for managing growth and approaching sustainability [2,6]. They also found that 21st-century urbanization is more rapid and expansive than in previous centuries [2]. For many regions worldwide, urban land expansion has outpaced population growth, resulting in sprawling development patterns that challenge urban and regional planning and landscape conservation [19,20,21,22]. A direct consequence of urban development is the permanent replacement of farmlands, forests, and other natural areas with impervious surfaces, including road infrastructure [10,34,35]. Mapping and quantifying impervious surfaces have become more accurate with advancements in Earth observation data and methods [20,22,36,37], and impervious surfaces have long been recognized as an effective environmental quality indicator [38,39,40,41]. For example, Sutton et al. [42] demonstrated a strong correlation between satellite image-based estimates of constructed area per person for over 140 countries and more complex ecological footprint indices (e.g., global hectares/person) that require disparate data on national resource consumption and production, carbon emissions, and area changes for six land uses. Moreover, international calls for more sustainable growth in the urban millennium identify per capita land consumption and land-use efficiency as key metrics of sustainable urbanization (see United Nations 2030 Sustainable Development Goals—Sustainable Cities and Communities Goal 11) [3,43].
In the United States, rapid sprawl development throughout the 20th century led to some of the largest increases in total urban extent among developed nations [17,21,44,45] and placed the U.S. among top countries worldwide for per capita impervious surface area at the turn of the century [42,46]. Yet, even with heightened global awareness of the need for more sustainable urbanization, in the U.S., there remains few consistent, nationwide metrics for tracking local and regional trends of per capita land change and sustainable development in the 21st century. Researchers have combined Census population and housing data with remotely sensed land change products to measure and predict, for example, the expansion and effects of exurban development in rural and agricultural lands [47,48,49] and in the wildland–urban interface (WUI) [50,51]. Heris [52] combined housing counts from the 2000 and 2010 Censuses with data from the National Land Cover Database (NLCD) to map urban housing density for the 50 largest U.S. metropolitan areas and compare growth patterns across cities and settlement types. More recently, Radeloff et al. [53] conducted an assessment of housing density change and wildfire risk within the WUI using Census block data between 1990 and 2010, and Vukomanovic et al. [27] assessed changes in both housing density and percent impervious cover between 1990 and 2010 for block groups surrounding all federal parks and protected areas. A few studies have examined per capita land consumption for select U.S. cities or states [54,55,56], and the EnviroAtlas [57] reports per capita impervious surface for select U.S. cities in 2010. One nationwide study assessed county-level patterns of per capita developed land consumption in 2000 [58]. To date, however, no study has examined 21st-century changes in per capita land consumption and land-use efficiency resolved to all block groups of the contiguous U.S.
To help address this gap, we describe spatial and temporal trends (2000–2010) of urbanization and per capita land change across the conterminous United States by combining three publicly available, nationwide datasets: Decennial Census population and housing data for block groups (2000, 2010), the National Land Cover Database (NLCD) imperviousness data (2001, 2011) [59,60], and the Protected Areas Database of the United States (PAD-US) [61]. We analyzed (a) changes in housing growth and impervious surfaces in low-density rural and exurban lands compared to medium- and higher-density suburban and urban settings, (b) the extent to which per capita land consumption varies by housing density level (urban, suburban, exurban, rural) and regionally, and (c) spatial patterns and variation in the relative sustainability of megaregion growth. We assessed megaregions using multiple metrics of human footprint, including housing density, percent impervious development, per capita land consumption, and the United Nations Sustainable Development Goals (UN-SDGs) land-use efficiency indicator [43].
To our knowledge, this is the first nationwide assessment of 21st-century trends of per capita land change resolved to all block groups, and the first application of the UN-SDGs efficiency indicator across all metropolitan and micropolitan statistical areas (i.e., Census urbanized areas, urban clusters, suburban areas, and peripheries) of the contiguous U.S. Our composite scores and ranking of the trajectories of megaregion growth highlight the potential for multidimensional approaches to assess variation in sustainable development across rapidly urbanizing regions and demonstrate how measuring human footprint by any single metric can lead to very different conclusions. We share our data and metrics through an interactive, online mapping application (go.ncsu.edu/us-human-footprint, (accessed on 3 August 2021)) that anyone can use to explore spatial and temporal trends in housing density, impervious development, per capita land consumption, and land-use efficiency across the urban–rural gradient of the U.S. Our application (find source code and associated files at github.com/ncsu-cga/HumanFootprint, (accessed on 3 August 2021)) is also designed to be easily updated with future releases of validated developed land cover and detailed Census population and housing data. Our analysis of over 215,000 block groups in 2000 and 2010 establishes 21st-century benchmark metrics that land-use planners, natural resource managers, and other decision-makers can use to track and compare local to regional scale trends of urbanization and per capita land change in the U.S. However, similar analyses of the form, extent, rate, and efficiency of urbanization can be undertaken in other urbanizing regions of the world and at different scales where concurrent population data and built-up area measurements are available or can be estimated over time.
2. Materials and Methods
2.1. Data Sources and Characteristics
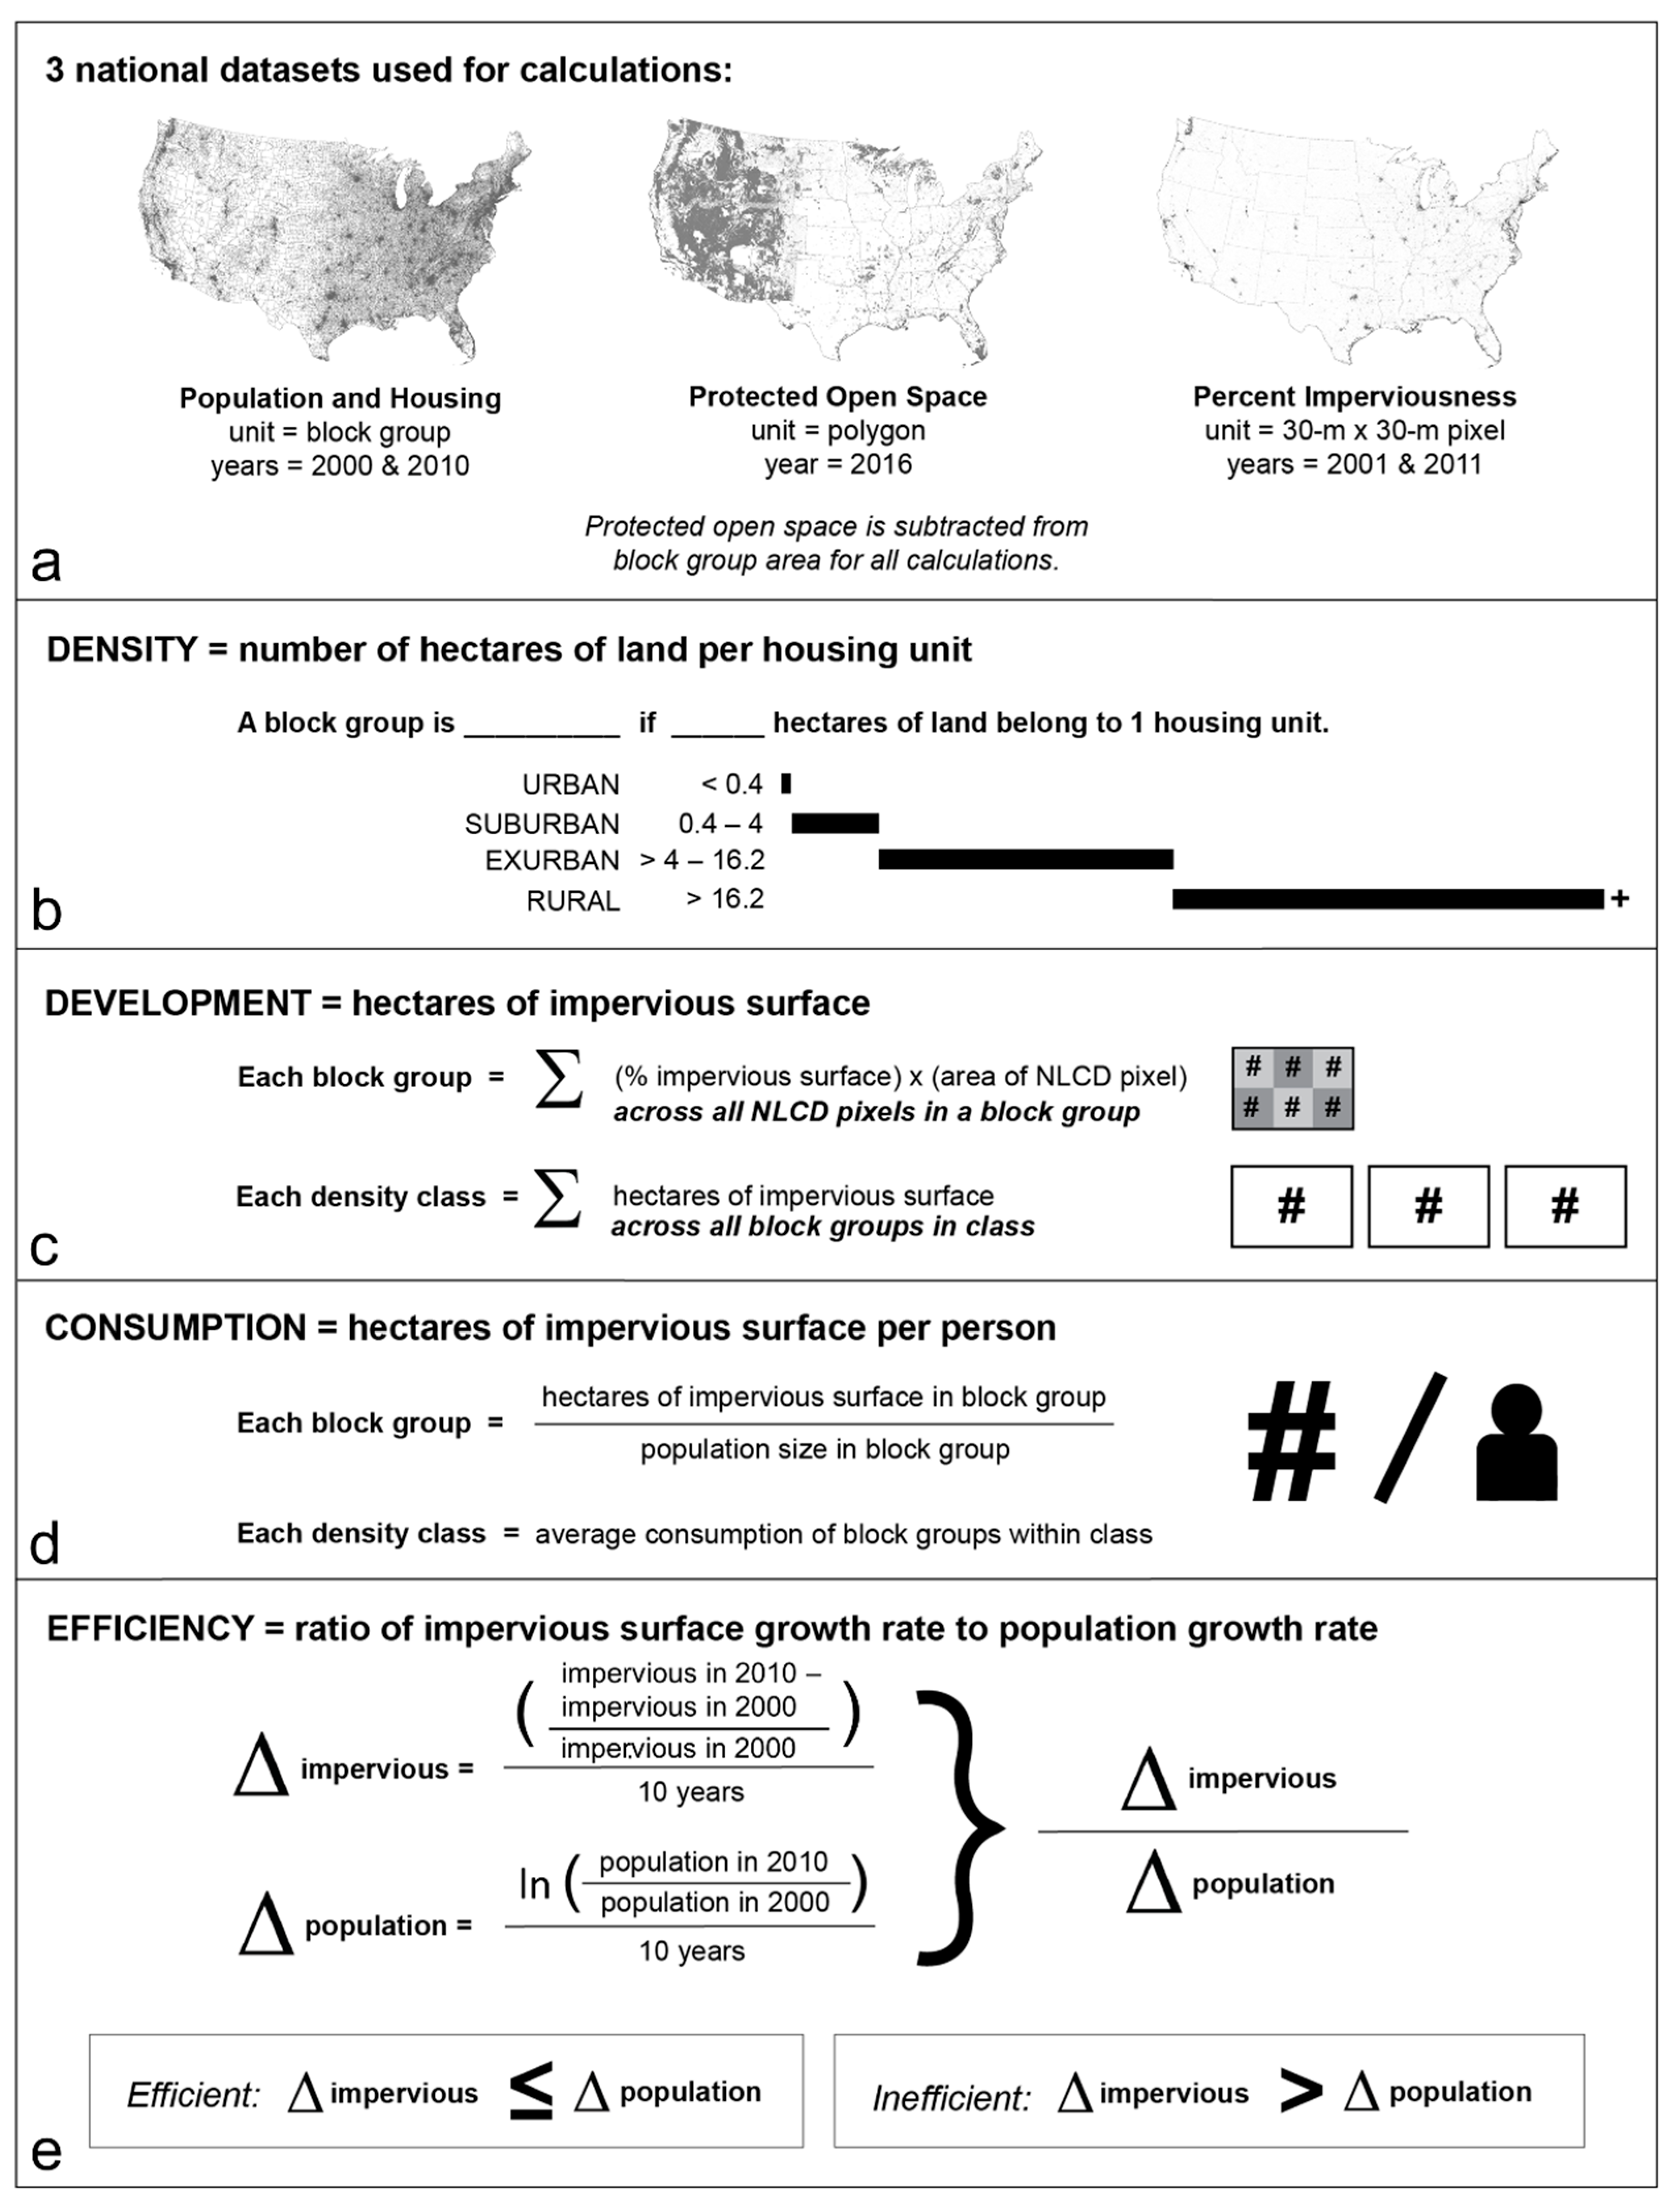
We developed fine-scale metrics of human footprint using three foundational, public datasets (Figure 1a): (1) population and housing unit counts for 215,836 block groups from two decennial Censuses (2000, 2010) [62], (2) locations of public parks and protected open spaces from the Protected Areas Database of the United States (PAD-US) [61], and (3) percent developed imperviousness data from the National Land Cover Database’s (NLCD) 2001 and 2011 products [59,60].
Census “block groups” are spatially contiguous groups of census “blocks” delineated statistically to account for minimums of approximately 600 people and 250 housing units per block group [63]. While Census “blocks” are the smallest and most numerous units (over 11 million in the 2010 Census) for which the U.S. Census collects and tabulates data, one-third of blocks contained no population in 2010, and the areas of a substantial proportion of blocks are below the minimum mapping unit for NLCD land cover data (i.e., five 30 m resolution pixels, or 0.45 ha). These characteristics make several million of the blocks essentially unusable for calculating our spatial metrics, and thus we used block groups as the basic unit of analysis for this study.
Block boundaries sometimes change between Censuses, which may also affect block group boundaries. Therefore, to reduce data aggregation bias introduced by shifting block group boundaries and to allow for direct comparisons of Census counts over time, we used 2000 and 2010 data from the National Historical Geographic Information System (NHGIS) that has been standardized to 2010 Census block group units [62]. We assumed that residential housing is prohibited or greatly restricted in public open spaces [64], and therefore removed overlapping parks and protected areas, including water bodies and all areas managed by federal, state, district, or local agencies, from calculations of Census block group areas. This step reduced the available private land area in affected block groups prior to housing density calculations. The NLCD imperviousness data products represent the proportion of each 30 m pixel composed of roads, buildings, and other constructed materials or infrastructure. Per-pixel imperviousness values range from no development (0%) to minimally developed areas where impervious surfaces account for <20% of total cover to highly developed areas where impervious surfaces account for 80–100% of total cover. Hereafter, we refer to the 2001 and 2011 NLCD impervious data using the years 2000 and 2010 for ease of discussion relative to the dates of Census data.
2.2. Calculation of Spatial Metrics by Block Group and Housing Density Class
We quantified and mapped housing density (hereafter “density”), impervious surface area (hereafter “impervious development”), impervious surface area per person (hereafter “per capita consumption”), and land-use efficiency (hereafter “efficiency”) for all Census block groups (Figure 1b–e). Following the approaches of Theobald [48,49] and Brown et al. [47], we classified the density (hectares per 1 housing unit) of each block group into one of four residential density levels: urban (<0.4 ha/unit), suburban (0.4–4 ha/unit), exurban (>4–16.2 ha/unit), and rural (>16.2 ha/unit) (Figure 1b) (note that density may alternatively be expressed as housing units per hectare). We calculated the total area (hectares and km2) of impervious development and the percent developed area for each block group and within each density class to capture the spatial footprint of impervious surfaces (Figure 1c). Next, we calculated per capita consumption for each block group and mean per capita consumption for each density class (Figure 1d). We calculated all metrics for 2000 and 2010 and quantified and mapped rates of change in the metrics over the decade. We applied the same density thresholds (Figure 1b) to the 2000 and 2010 housing density classifications to allow for consistent analysis of change over the decade and direct comparisons to prior studies. We identified locations that crossed residential density class thresholds by reclassifying block groups that changed density levels over time (e.g., rural to exurban, exurban to suburban, suburban to urban, etc.). Finally, we calculated a land-use efficiency metric (Figure 1e) for block groups using the sustainable cities indicator recommended by the United Nations 2030 Agenda for Sustainable Development (Goal 11, Sustainability Indicator 11.3.1. [43]). Efficiency is the ratio of the rate of expansion of developed land to the population growth rate for a given area and time period (Figure 1e). This versatile indicator is used to measure the form of urbanization patterns and is broadly linked to environmental, economic, and social dimensions of land change [43]. For our purposes, we further classified block groups where population growth outpaced the rate of new development between 2000 and 2010 as “efficient” (0 < efficiency ≤ 1) change, whereas “inefficient” change was characterized by block groups in which development expanded faster than population growth (efficiency > 1) (Figure 1e).
2.3. Multi-Metric Analysis of Megaregion Growth
We analyzed multiple metrics of human footprint to understand, visualize, and compare the regional variability and relative sustainability of growth trajectories of eleven U.S. megaregions defined by the America 2050 project [65]: Arizona Sun Corridor, Cascadia, Florida, Front Range, Great Lakes, Gulf Coast, Northeast, Northern California, Piedmont Atlantic, Southern California, and Texas Triangle. For each region, we calculated 2010 block group means (cumulative footprint) and average rates of change (change in footprint, 2000–2010) for density, percent development, and per capita consumption. In addition, we quantified the overall efficiency of urban and suburban density lands in each megaregion and the proportion of those areas that had “efficient” change. These metrics represent different, but interlinked, dimensions of urbanization that are fundamental to understanding and managing sustainable development [2,6,43]. We ranked megaregions from 1–11 based on their relative performance as measured by each of these seven metrics, which we considered equally important in the assessment. For example, the region with the highest cumulative mean density ranked #1 for that metric, whereas the region with the greatest rate of increase in mean per capita consumption ranked #11 (lowest position) for that metric. Moreover, the region with the highest proportion of urban and suburban areas with efficient change ranked #1 for that metric.
Twenty-one unique pairs of metric value rankings emerged from this exercise (e.g., density and percent developed, density and consumption, consumption and percent efficient lands, etc.). We used the nonparametric Spearman’s rank-order correlation to test whether any pairs of metric rankings among the regions are similar or highly associated. Pairs of rankings with a strong positive association may suggest that the underlying metrics are providing redundant information and that we could simplify our analysis using fewer metrics. Lastly, to summarize the relative performance of the megaregions across all metrics, we added each region’s individual metric rankings to derive a composite score where lower scores suggest a more sustainable development footprint. Based on the composite scores, we ranked the relative sustainability of the megaregion growth trajectories from most (1) to least (11) sustainable.
3. Results
3.1. National-Level Summary
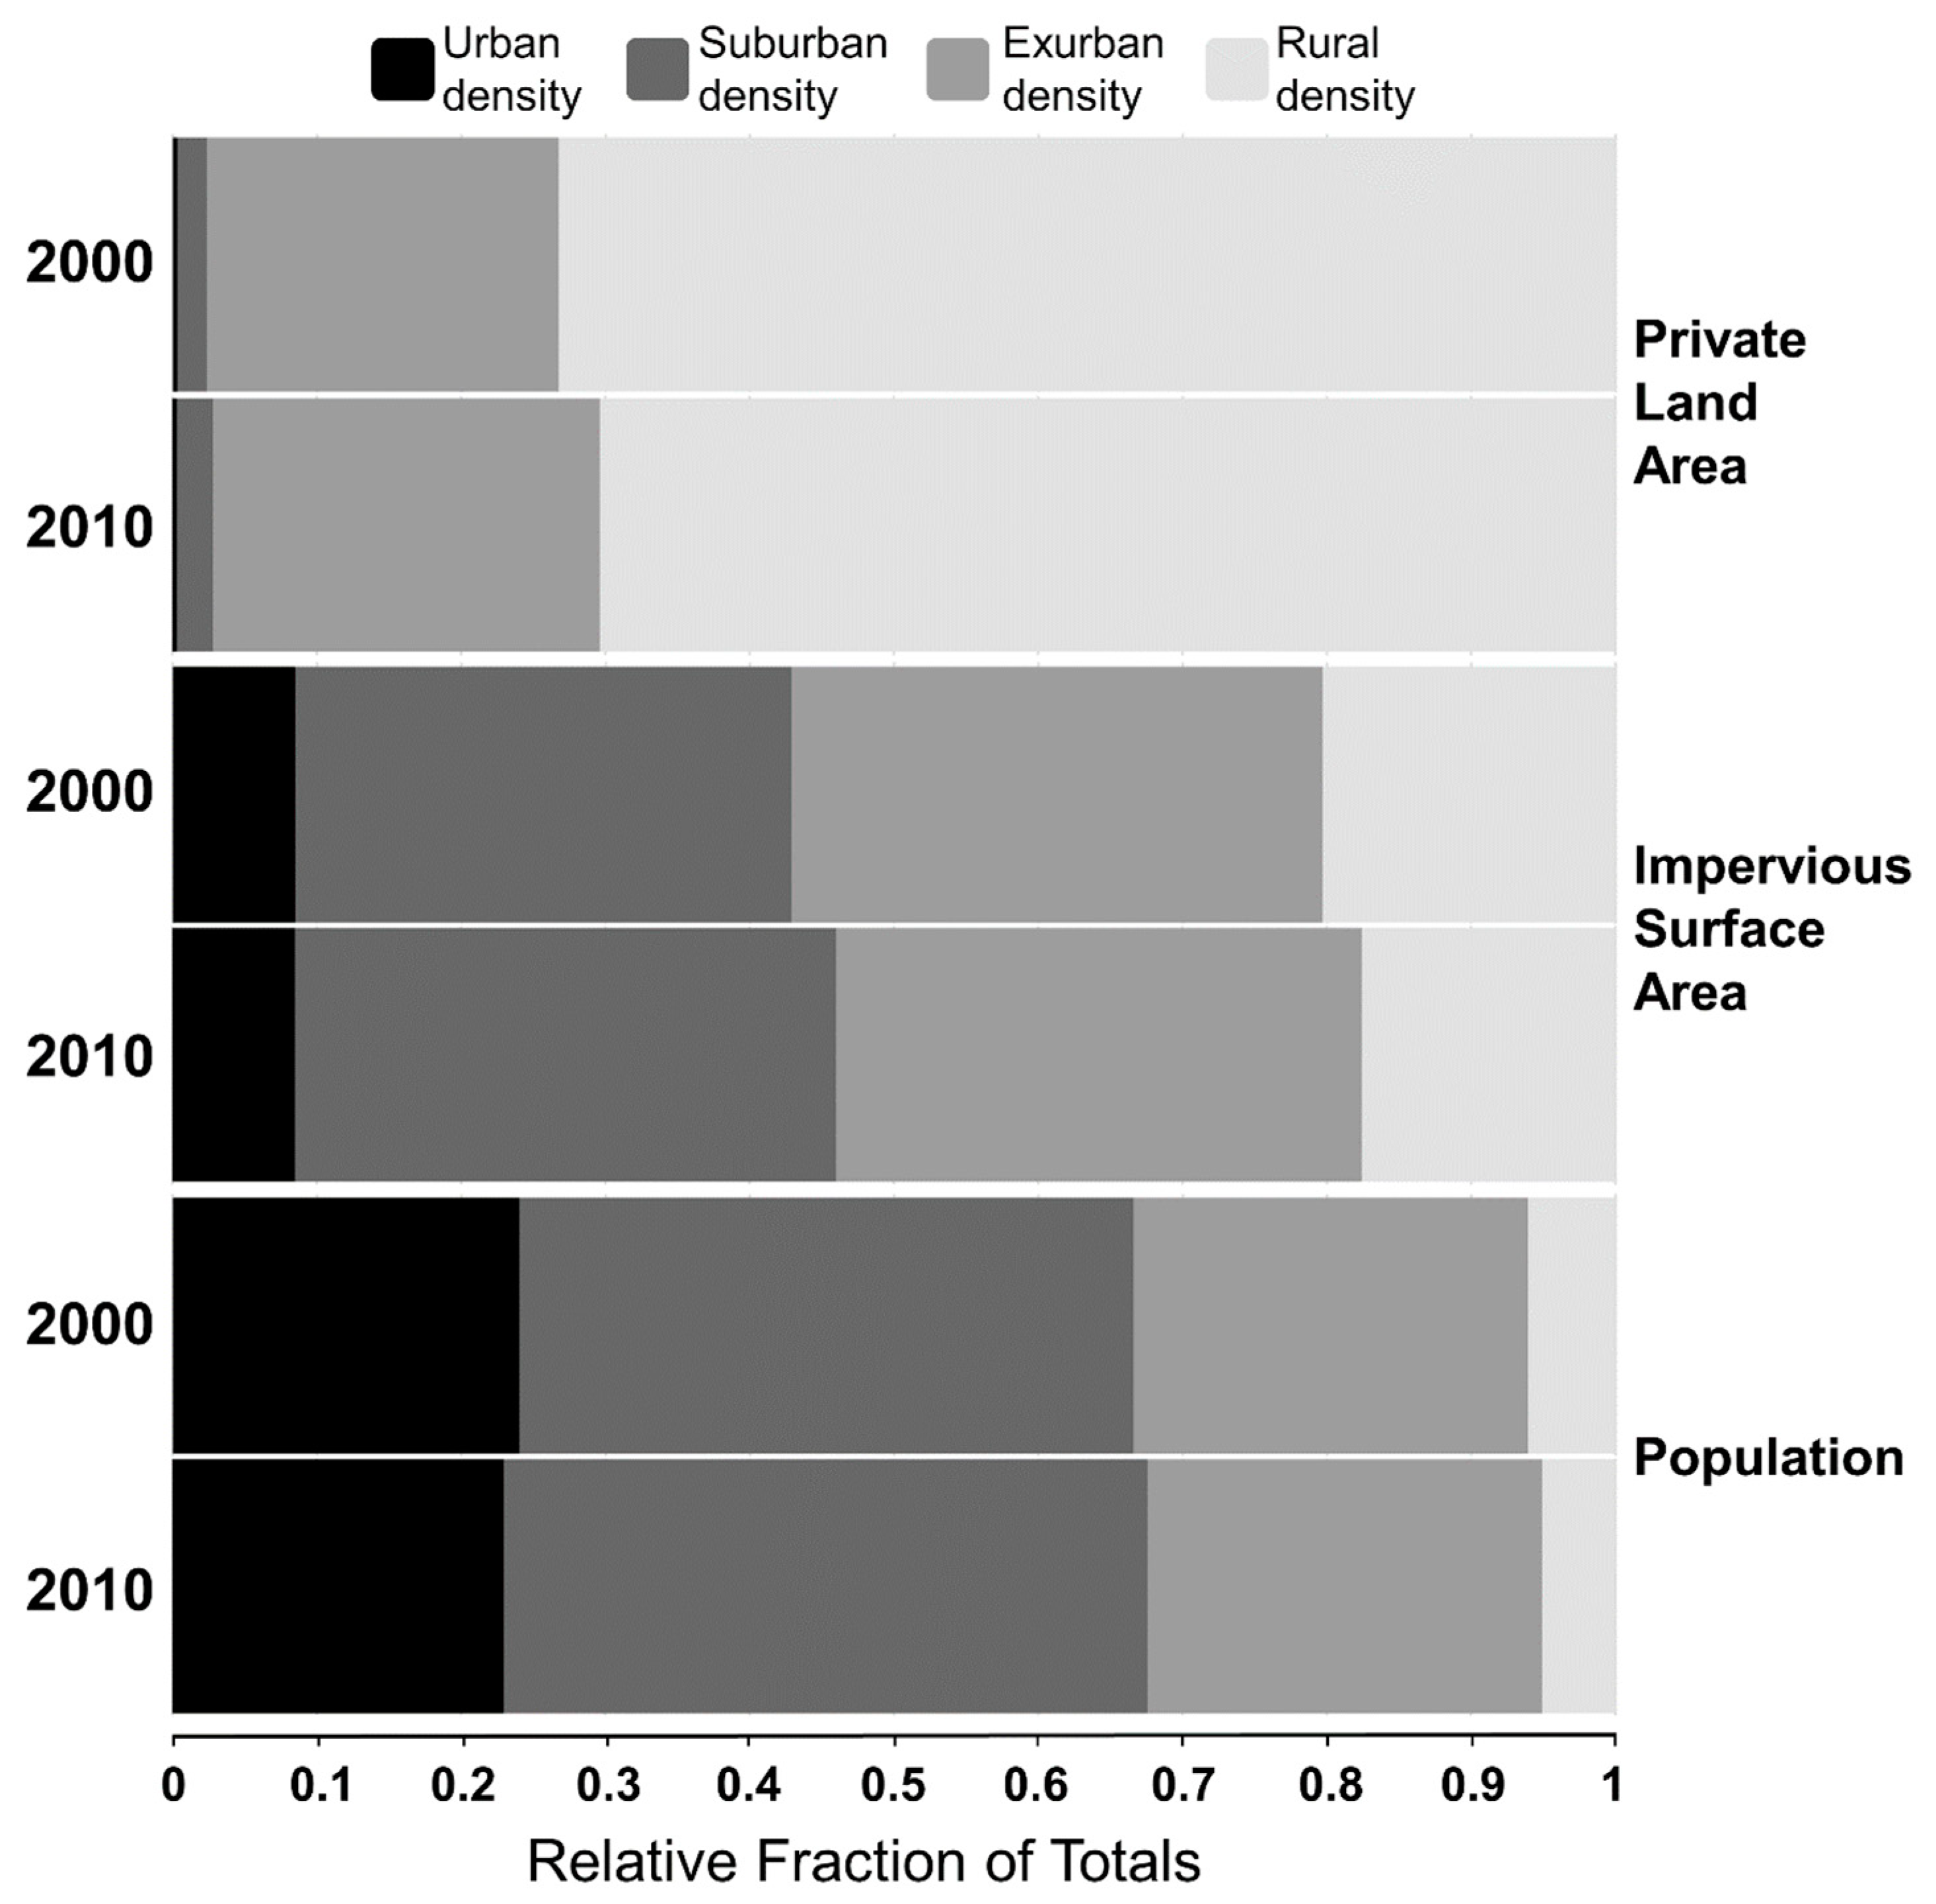
Between 2000 and 2010, population increased by 10% to 306.7 million people in the conterminous US, with an associated 13.6% increase in housing units (130.9 million units in 2010) and a 10.7% increase in impervious surfaces (110,333 km2 in 2010). We found that 52% of block groups gained population and 47.5% lost population, yet housing density increased in 68% of block groups and impervious development increased in 90%. Among the 102,388 block groups that lost population, 46.5% added new housing and 85% gained new impervious development. By comparison, 90% of the 112,678 block groups that gained population added both new housing and impervious development. Of the total developed impervious area in the U.S. in 2010, 96% (105,830 km2) was located on private lands with the remaining distributed as in-holdings, roads, and other infrastructure within public open spaces. Private lands, totaling ~5.8 million km2, were predominantly rural (70.4% of private land area) and exurban (26.8% of private land area) densities. Suburban and urban density lands comprised around 2.8% of all private lands in 2010 but contained 50% of all impervious development and two-thirds of the population (Figure 2 and Figure 3a,b).
3.2. Changes in Housing Density and Impervious Development
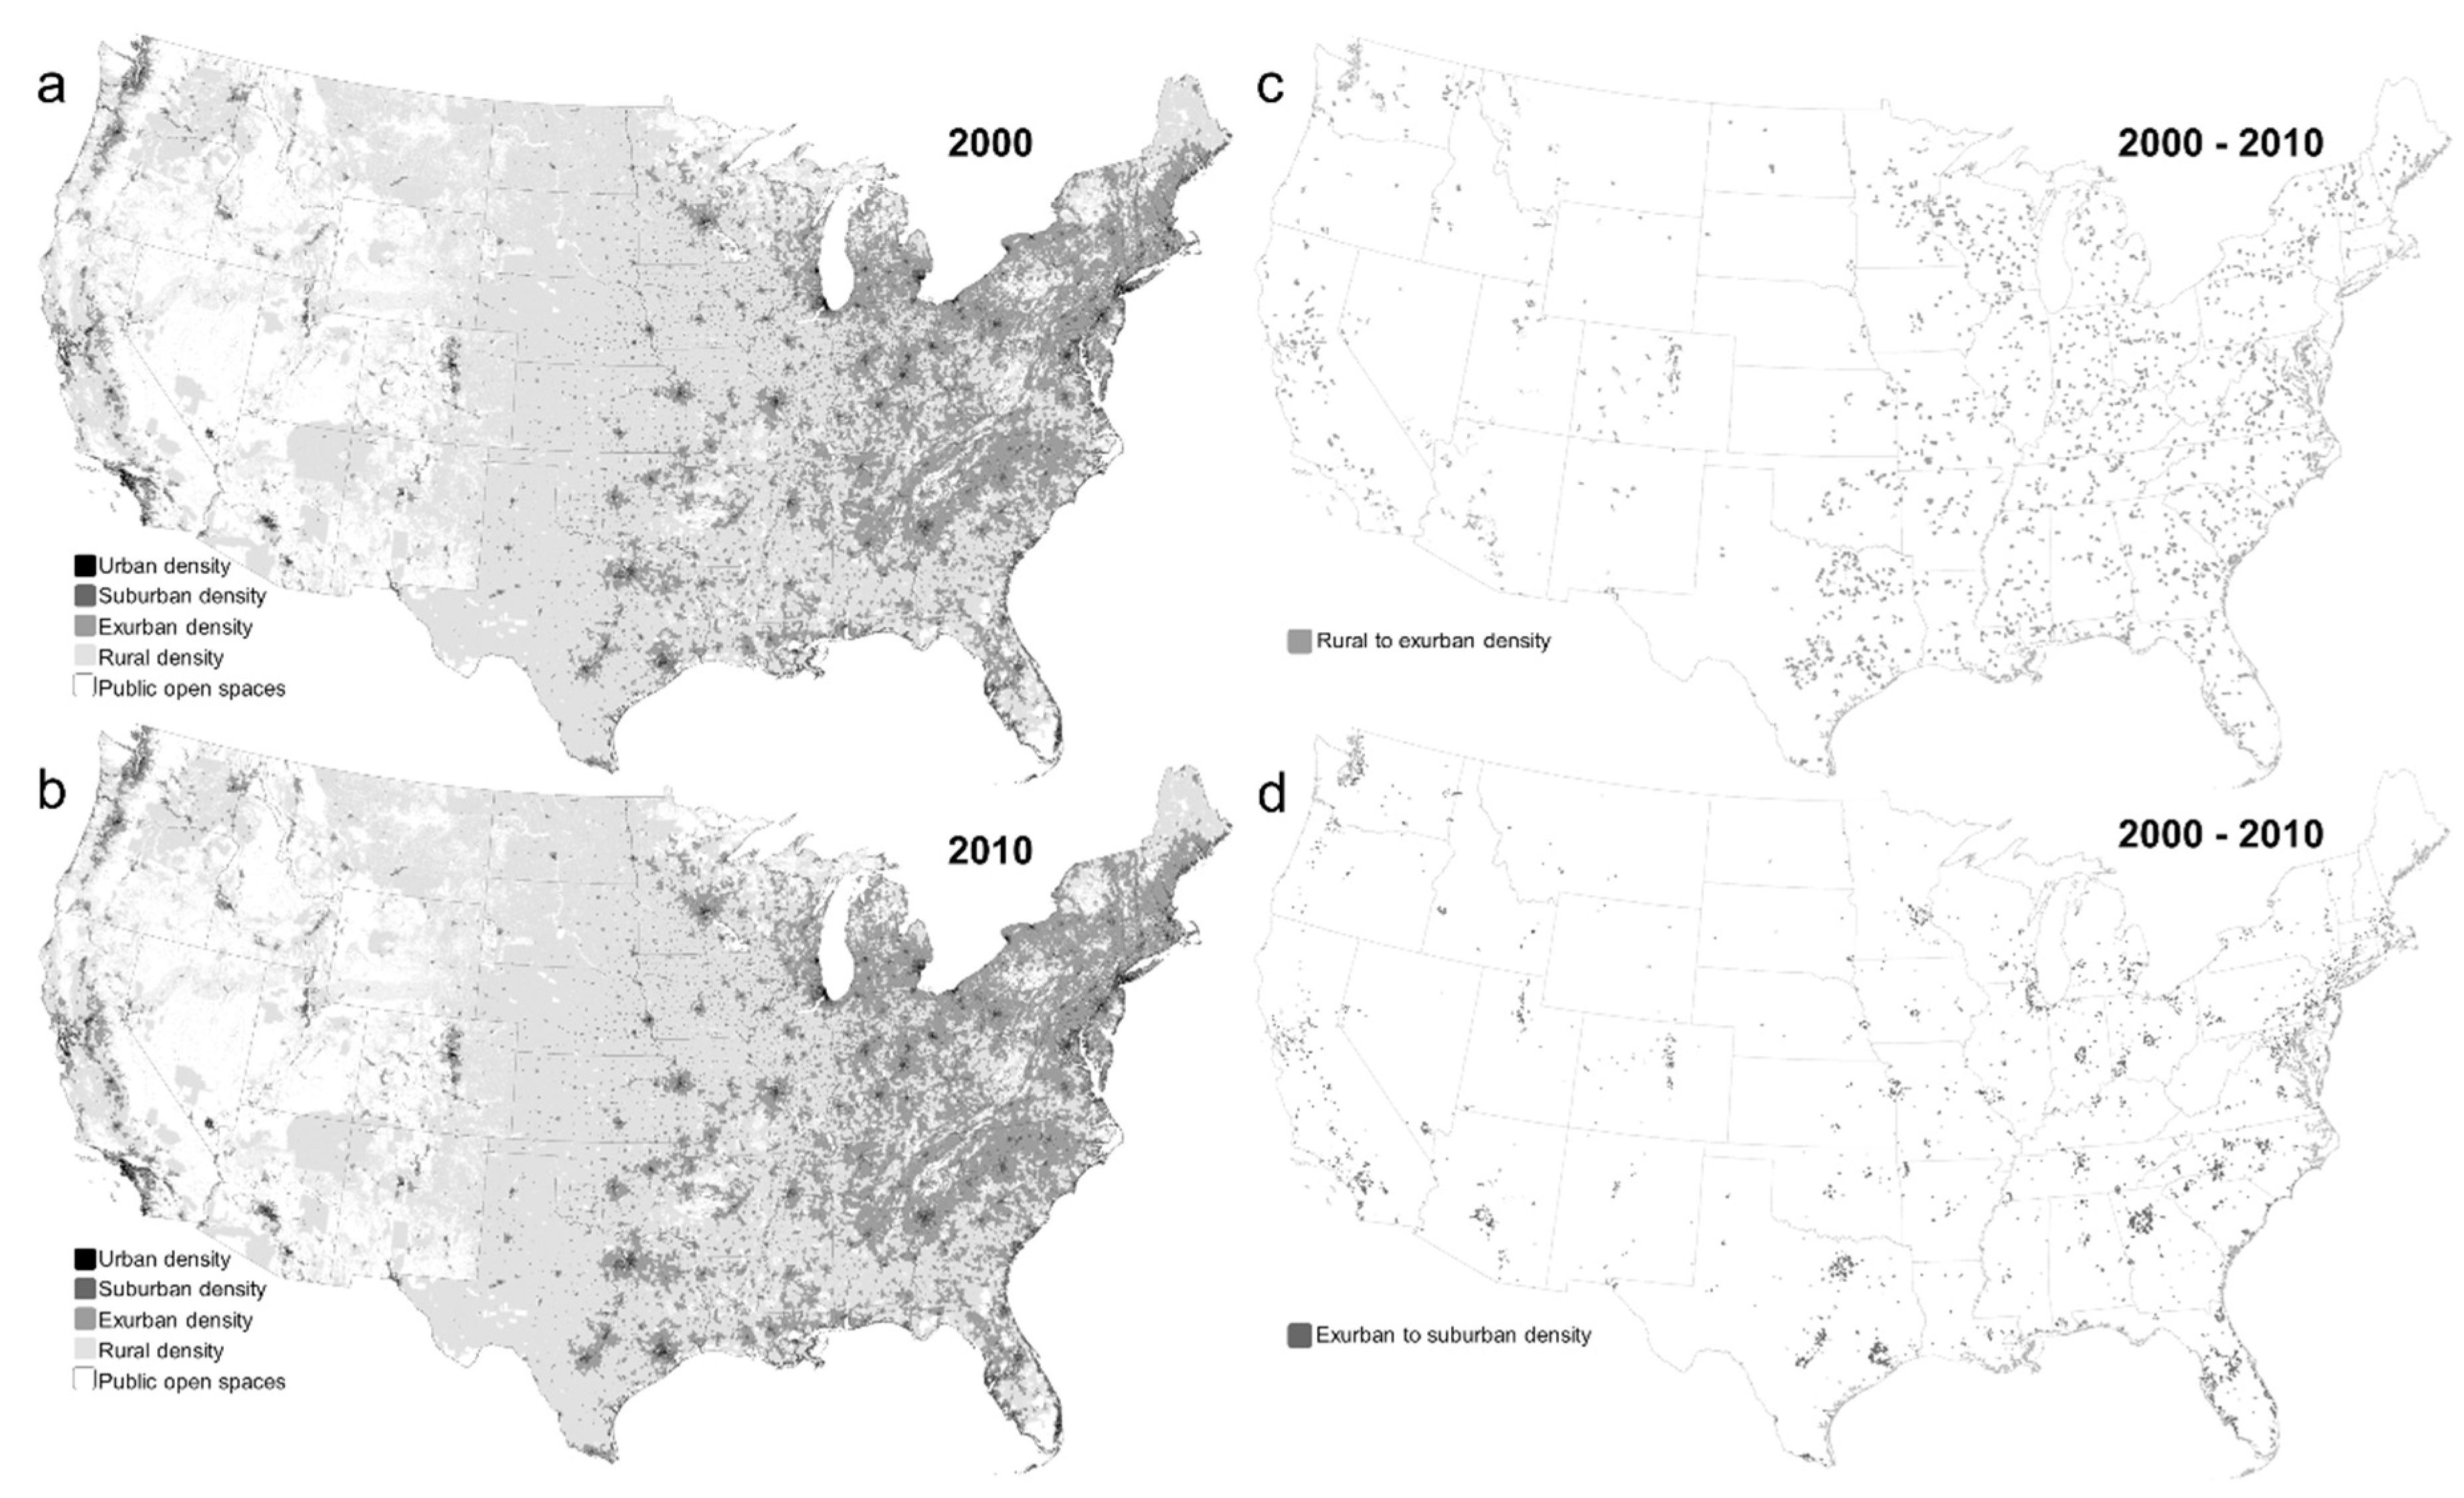
Increases in housing density (Figure 3a–d) and impervious development (Figure 4a–e) between 2000 and 2010 resulted in overall losses of rural density lands (Figure 2) with exurban and suburban density lands accounting for much of this change (Table 1). Over 170,000 km2 of private, rural density lands changed to exurban density (Figure 3c), and these same lands gained over 350 km2 of new impervious development (Table 1). Exurban growth was more dispersed nationally with increases in density found beyond urban and suburban fringes in patterns that lack obvious spatial connection to metro regions (Figure 3c). Approximately 27,500 km2 of rural and exurban density lands changed to suburban or urban density (Table 1) over the decade. Lands that transitioned from exurban to suburban density (Figure 3d) accounted for 95% of this change and gained 1543 km2 of new impervious development (Table 1). New suburban growth formed in ribbons of increasing housing density around some of the largest and fastest growing metropolitan areas, for example, Atlanta, Chicago, and Dallas (Figure 3d), as well as rings of increasing impervious development around urban cores and at suburban fringes (Figure 4d). We found that the extent (km2) of impervious development increased during the decade within three density types at rates of +9.8% (exurban), +21.1% (suburban), and +11.2% (urban); however, there was a 3.8% decrease in the total area of impervious development occurring in 2010 rural lands compared to lands settled at rural densities in 2000 (Figure 4e). Overall, private lands of the conterminous U.S. gained approximately 10,500 km2 of new impervious development, and 92% of this change occurred in suburban (61.5%) and exurban (30.5%) density lands (Figure 4). The relative proportions of total development and population increased in suburban density lands over the decade such that by 2010, 37.5% of all impervious development and 45% of all people were located in suburban areas that comprised just 2.5% of the developable land area (Figure 2). The relative proportion of all impervious development remained largely unchanged for urban and exurban lands; however, the proportions of both development and population declined for rural density areas, which comprised about 70% of private lands in the U.S. in 2010 (Figure 2).
3.3. Changes in Per Capita Consumption
Per capita consumption on all private lands increased nationwide between 2000 and 2010 from 0.034 to 0.035 hectares per person. Mean per capita consumption was significantly higher in rural density lands (0.454 hectares/person) in 2010, compared to 0.053 for exurban, 0.031 for suburban, and 0.013 for urban density classes (Figure 5). Average per capita consumption increased in all housing density classes at rates of +63.4% (rural), +3.6% (exurban), +5.2% (suburban), and +4.7% (urban); however, the only significant change in mean per capita consumption occurred in rural density lands where rates increased from 0.278 to 0.454 ha/person (Figure 5). For those rural and exurban lands that transitioned to higher-density classes over the decade (e.g., rural to exurban, exurban to suburban, etc.), mean per capita consumption declined significantly (Table 1). Geographically, interspersed patterns of increasing and decreasing consumption across the eastern U.S. contrasted with more widespread increasing consumption patterns in the Great Plains and parts of the Midwest along a transition stretching from North Dakota to southcentral Texas (Figure 5c). Consumption also increased in many U.S. metropolitan areas that experienced more rapid housing and impervious development relative to population change (e.g., Phoenix, Houston, Charlotte) or rapid out-migration (e.g., New Orleans) (Figure 4d and Figure 5d).
3.4. Efficiency of Megaregion Growth
The efficiency of the urban and suburban areas of each of the eleven megaregions ranged from 0.53 in Cascadia (most efficient change) to 11.3 in the Great Lakes (most inefficient change) (Figure 6a), where the rate of new impervious development exceeded the population growth rate. We found that two of the megaregions examined had a majority of their urban and suburban areas considered land-use efficient, where rates of new impervious development are below the population growth rates: Cascadia (63% efficient lands) and Southern California (56% efficient lands) (Figure 6a and Figure 7). The Texas Triangle and Florida megaregions had nearly equal proportions of lands with efficient versus inefficient change. Change was efficient in less than 50% of the urban and suburban areas in each of the remaining megaregions (Arizona Sun Corridor, Front Range, Great Lakes, Gulf Coast, Northeast, Northern California, Piedmont Atlantic), ranging from 45.8% (N. California) to 32.1% (Great Lakes) efficient lands (Figure 7). Nationally, change in 60% of all urban and suburban density areas was inefficient (Figure 6b).
3.5. Relative Sustainability of Megaregion Growth
We found moderate to very low correlations between the 21 unique pairs of metric ranking for the megaregions (−0.6 > rs < 0.6, p < 0.01) (Figure 7). This result suggests that each of the seven metrics we considered is contributing essential information to our assessment of the overall human footprint and relative sustainability of megaregion growth trajectories. The largest negative association (−0.6) occurred between the ranks for mean density (2010) and percent impervious development (2010), while the ranks for mean density (2010) and percent change in impervious development (2000–2010) had the highest positive association (0.6). The weakest association (−0.02) occurred between ranks for mean per capita consumption (2010) and the percent change in impervious development (2000–2010). Our composite scores and final ranking of the relative sustainability of megaregion growth trajectories, based on each region’s relative performance across multiple metrics of cumulative footprint and change in footprint, identified the least sustainable megaregions (i.e., highest composite scores)—Arizona Sun Corridor (9th), Gulf Coast (10th), and Piedmont Atlantic (11th) (Figure 6 and Figure 7)—in the Sun Belt region of the United States. We found that the three most sustainable megaregions—Cascadia (1st), Front Range (2nd), Northern California (3rd)—(Figure 6 and Figure 7) are located in the Pacific Coast and Southern Rockies regions of the western U.S. The most sustainable megaregion (Cascadia) gained 173 km2 (6.3% increase) of impervious development and grew by 985,337 people (13.3% increase) over the decade, whereas the least sustainable megaregion (Piedmont Atlantic) overall added 870 km2 (20.5% increase) of developed impervious and 2,823,646 people (19% increase).
4. Discussion
Urban areas worldwide are expanding at rates that outpace population growth and seriously challenge sustainable development. In the United States, increasing sprawl development throughout the 20th century [17,32] placed the U.S. among the top nations in the world for the amount of impervious surface area per person [42,46]. The ability to develop more sustainably requires measuring and understanding the form, scale, and rate of urbanization [2,66], and international calls for more sustainable urbanization emphasize per capita land consumption and land-use efficiency as metrics for effectively tracking sustainable growth in the 21st century [3,43]. Research in the U.S. has focused primarily on changes in housing and population densities and urban expansion at metropolitan or national scales. To date, a few studies have reported changes in per capita land consumption for select U.S. cities or aggregated to state and national levels [54,56], and only one nationwide study assessed patterns of per capita developed land consumption by county for the year 2000 [58]. Our research quantifies early 21st-century changes (2000–2010) in housing density, impervious development, per capita land consumption, and land-use efficiency, with metrics resolved to Census block groups of the conterminous U.S. We examined spatial and temporal trends in these human footprint metrics at multiple levels, including block group, residential density class, and megaregion. We identified where, and in what form, urbanization occurred across the contiguous U.S. and found that losses of rural density lands due to exurban housing growth and suburbanization happened at a faster pace than previously reported trends. We showed how the aggregate extent of new impervious development is distributed across housing density classes and identified the largest increases in suburban areas and exurban lands. We analyzed variation of per capita consumption by residential density class and found that consumption in rural lands increased significantly over the decade and was also significantly higher than consumption in other density classes. In addition, we found that per capita land change was inefficient, or unsustainable, for a majority of megaregions. However, combining multiple metrics to score and rank the overall human footprint and relative sustainability of megaregion growth revealed both regional similarities and wide-ranging variation in their trajectories of development.
4.1. Trends of Increasing Exurbanization and Suburbanization
First, our analyses of changes in housing density and impervious development show that exurbanization and suburbanization are the dominant forms of growth in the early 21st century and may be more widespread and occurring more rapidly than prior observations and projections. For example, Theobald [48] found that the area of exurban density lands in 2000 (917,090 km2) was seven times that of urban and suburban density lands combined (125,729 km2). Applying the same density classification approach as Theobald [48,49], and excluding nearly 2 million km2 of public open spaces (25.7% of the CONUS), we found that by 2010, the total area of exurban density lands (1,551,015 km2) had increased to almost ten times the area of suburban and urban lands (163,086 km2). Furthermore, we found that the percentage of developable land in 2010 that is exurban density (27%) exceeds Theobald’s [48] 2020 projection of 19.6% exurban land and Brown et al.’s [47] estimate of 25% exurban land. Brown et al. [47] aggregated suburban and exurban densities into one exurban class, which suggests that our percentage of exurban lands in 2010 is even greater than their finding. Our estimation of remaining rural density lands in 2010 (70.3%) is substantially lower than Theobald’s 2020 projection (75.2%), and the percentage of urban and suburban lands in 2010 (2.8%) is only slightly below Theobald’s 2020 projection (3.1%) [48].
Our finding that the physical footprint of new impervious development increased by 10.7% nationwide is consistent with national trends reported in prior studies [45,54]; however, we additionally found the extents and rates of change in development varied substantially by residential density class (Figure 4e). Sleeter et al. [45], for example, reported a 33% increase in developed lands nationally during the three decades ending in 2000, or approximately an 11% increase per decade. Our work confirms a continuation of this average decadal rate of increase into the early 21st century. However, our examination of change by housing density type also revealed that over 90% of gains in impervious development between 2000 and 2010 occurred in suburban and exurban density lands, and the increase in total extent of development in suburban lands (6916.7 km2) was double the amount in exurban lands (3428.6 km2) (Figure 4e). Our finding that total impervious development in rural lands decreased (−3.8%) over the decade can be largely attributed to transitions of rural lands (and associated impervious cover) to exurban, suburban, and urban density classes (Table 1). In absolute terms, we found that no block groups lost impervious surface area during the decade, but rather impervious development remained stable or increased in extent in every block group where impervious cover was detected in 2000 (99% of block groups). As further confirmation, we quantified changes in the impervious extent for only block groups that (1) were located beyond Census urbanized area boundaries, and (2) remained at rural densities through 2010. Total impervious development in these areas actually increased by 3.6%, or +625 km2, indicating new development in even the most rural lands.
Patterns of exurbanization and suburbanization in the eastern U.S. differed markedly with those of the West in terms of the locations and amounts of development, particularly for the transitional rural-to-exurban density lands (Figure 3c; Table 1) and exurban-to-suburban density lands (Figure 3d; Table 1). For example, exurban growth in the West was patchy and scattered across roughly 31,000 km2 of private lands, whereas in the eastern U.S., exurbanization was more widespread over nearly 141,000 km2. Broadly speaking, these contrasting patterns are likely driven by the interacting geographies of land availability and land suitability (e.g., topography, accessibility) as well as consumer housing and lifestyle preferences. The West is characterized by vast regions of federal protected lands where the natural beauty, cultural cachet, and recreational opportunities have, for decades, attracted amenity migrants seeking a higher quality of life [26,27,67], but also where housing and development are limited, prohibited, or not feasible due to inaccessibility. These factors have contributed to more low-density residential growth in the surrounding developable lands of the rapidly expanding wildland–urban interface [27,28,53] and into grazing and farm lands of the West [68]. Moreover, agricultural landscapes of the West can be disproportionately impacted by exurban and rural residential development in areas where available wildlands are scarcer [69,70].
By contrast, extensive exurbanization patterns in the eastern U.S. (Figure 3c) likely reflect greater availability of private, rural lands, including forests and farmlands, where people, housing, and associated infrastructure can more readily expand. For example, we found the extent of new impervious development in eastern exurban lands (4186.3 km2) was 4.6 times the amount of new development in exurban lands of the West (907.5 km2). Suburbanization, while appearing in telltale ring or ribbon patterns in and around metropolitan areas across the contiguous U.S., was, similar to exurbanization, more prevalent in the eastern U.S. where there are more mid- to large-scale cities with available, developable lands at the urban fringes. For instance, we found the extent of new impervious development in eastern U.S. suburban density lands (3087.1 km2) was 2.4 times the amount of new development added in suburban lands of the West (1310.6 km2), and 35% of this total development occurred in areas that transitioned from exurban to suburban density (Figure 3d, Table 1). Taken together, these findings suggest intensification of developed land uses beyond urban boundaries across the U.S. in the early 21st century. Our finding that the majority of this change is lower-density exurban and suburban housing growth characterized by rapid expansion of impervious surfaces into once-rural, undeveloped landscapes, has significant implications for environmental change, ecosystems and services, and public health and wellbeing [71]. More dispersed forms of residential growth beyond the urban fringe increasingly fragment rural and natural landscapes [15,47] due to larger lot sizes [48,72] and the associated impervious infrastructure (e.g., buildings, parking lots, road networks, etc.) that negatively impacts biodiversity [5,7,50], the availability and quality of water resources [8,9,41], and the health and productivity of forested and working landscapes [47,73].
4.2. Trends of Increasing Per Capita Consumption
Second, our examination of per capita land consumption allowed us to better understand patterns and rates of impervious development relative to population, nationally, and across residential density classes. Our finding that gain in impervious development (10.7%) nationwide outpaced the increase in total population (10%) is a clear indicator of increasing per capita land change in the early 21st century. While this result represents a continuation of 20th-century trends of increasing sprawl in the U.S. [17,44,45], our analyses revealed both higher absolute values and percent increases in national per capita consumption rates than previous estimates and projections. Bounoua et al. [54], for example, reported a 2.7% increase in national per capita impervious surface area between 2001 (0.0295 ha/person) and 2011 (0.0303 ha/person), while we found a 3% increase in per capita consumption, from 0.0340 ha/person in 2000 to 0.0350 ha/person in 2010. Furthermore, our rates exceed the 0.0297 ha of constructed area per person reported for 2000–01 by others [42,46] as well as Bounoua et al.’s [74] 2020 projection of 0.0322 ha/person. When we factor in over 4100 km2 of impervious surfaces located in public open spaces, our national rates increase to 0.0355 ha/person (2000) and 0.0360 ha/person (2010).
The interacting dynamics of population change (birth, deaths, migration) and land change (impervious development) led to some unexpected findings when we examined how per capita consumption varied by housing density type. For example, not only was there a significant increase in average per capita consumption in rural lands (+63.4%), but by 2010, mean consumption (0.454 ha/person) in these areas of very low-density settlement was significantly greater (>8.5 times) than consumption in exurban, suburban, and urban density lands (Figure 5e). At the same time, mean consumption in exurban lands (0.053 ha/person) was much lower than expected, more similar to mean consumption in suburban lands (0.031 ha/person), and four times greater than mean consumption in urban density areas (Figure 5e). While we anticipated that overall per capita consumption would be higher in rural lands, the magnitude of difference between rural and exurban lands was surprising, but also supported by prior research. For example, Zeng and Ramaswami [72] found that residents of low-density rural lands in the U.S. have approximately 10 times greater direct land-use impact than urban dwellers. They attributed the higher per capita land use to a combination of larger home lots (by 14 times on average) and dwelling sizes (11% larger on average) and around five times more road area per person. We independently estimated per capita road length in our density classes using U.S. Census primary and secondary road data. While the proportions of total length were roughly equal in rural (40%) and exurban (42.8%) density lands in 2010, per capita road length in rural lands (~43 m/person) was about five times greater than in exurban lands (8.5 m/person).
Our finding that per capita consumption increased significantly in rural lands is most evident geographically across a broad region of the Great Plains and portion of the Midwest. Consumption increased in nearly all block groups of this region, contrasting sharply with the more densely populated eastern U.S., resulting in a distinct east–west divide in national consumption patterns (Figure 5a–c). Late 20th-century trends of increasing development and rural population losses throughout the Great Plains could be contributing factors. For example, Sleeter et al. [45] reported that a large proportion of the nation’s development occurred in the Great Plains region during the three decades leading up to 2000. Over the same period, the region experienced substantial net population losses in nonmetropolitan counties [47]. In addition, Alig et al. [75] found that the Great Plains had the highest total developed land per capita among U.S. regions between 1982 and1997. In the context of these historical observations, our findings support a continuing trend of increasing per capita consumption across these rural landscapes, where large impervious footprints relative to population size can have more pronounced, negative ecological impacts [68,71].
4.3. Low Consumption Is Not Necessarily Efficient Land Change
Third, despite suburban and urban lands having significantly lower mean per capita consumption compared to rural and exurban lands (Figure 5e), our examination of land-use efficiency revealed that development in 60% of all urban and suburban areas of the U.S. and for seven of eleven megaregions (64%) examined was inefficient (efficiency > 1) or unsustainable (Figure 6a,b). These findings demonstrate how relatively low per capita consumption does not necessarily translate into sustainable growth, and also highlight how the efficiency metric can integrate changes in land consumption and population to identify trajectories of per capita land change at different scales. However, the metric is not without its limitations. For instance, efficiency may effectively summarize the compactness or dispersion of impervious development over time, but says nothing of the sustainability of living conditions, and interpreting the metric can be tenuous in areas that lose population or where portions of the built environment are removed (i.e., negative growth) [43]. The UN SDGs, therefore, recommend two supplemental indicators, including “built-up area per capita” and “change in built-up area” [43], which we quantified and analyzed in this study as “per capita consumption” and “percent change in development” at multiple levels (block group, density type, megaregion).
4.4. Sustainable Development Is All Relative
Fourth, our assessment of overall human footprint and relative sustainability of megaregion growth scored regions on multiple metrics (Figure 7) and revealed both wide-ranging variation and regional similarities in their trajectories of urbanization. Our finding that the three least sustainable megaregions (Arizona Sun Corridor, Gulf Coast, Piedmont Atlantic) are located across the Sun Belt region aligns with prior observations and projections that identify the southern U.S. as home to many of the nation’s fastest-growing metropolitan areas. For example, 29 of the 50 most sprawling urbanized areas in 2010 [76], including Phoenix, Houston, and Charlotte (Figure 4d and Figure 5d), are found within these three megaregions. Moreover, Alig et al. [75] identified the Southwest and South as having the second and third highest levels of developed area per person at the end of the 20th century and projected that by 2025, the South would have the most developed land area and the Southwest would experience an 86% increase in developed land. In contrast, the three most sustainable megaregions (Cascadia, Front Range, Northern California) (Figure 7) in our analysis are located in the Pacific Coast and Southern Rockies regions of the West (Figure 6a), where municipalities arguably have stronger cultures of conservation [56] and have historically adopted more reform-minded land use, zoning, and growth management policies [54,56,74,75,77]. In addition, over one-third of the 50 most compact urbanized areas are located in these same megaregions [76].
Our finding that no two pairs of metric rankings (out of 21 pairs tested) are highly associated suggests a unique trajectory of growth for each megaregion, where each metric captures a different dimension of human footprint at the regional scale. Additionally, it demonstrates how measuring human footprint by any single metric can lead to very different conclusions about sustainable growth. For example, the Great Lakes region had the lowest proportion (32.1%) of urban and suburban areas that were land-use efficient and ranked last (#11) for that metric, yet the region had the second highest mean housing density in 2010 (24.2 units/ha) and the second lowest percent increase in impervious development (8.8%), ranking #2 for those metrics (Figure 7). Moreover, if we examined only “cumulative” percent developed or mean consumption (Figure 7), then both the Arizona Sun Corridor and Gulf Coast, two of the least sustainable megaregions in our overall assessment, rank higher than Cascadia. The Front Range also ranked higher (#1) than Cascadia for these two metrics. However, Cascadia ranked first across all four “change in footprint” (2000–2010) metrics), helping place it first among the most sustainable megaregions with a lower overall score than the Front Range and other megaregions (Figure 7). Our findings suggest trends of increasing densification and innovative development strategies in Cascadia and the Front Range, and perhaps reflect a history and culture of more progressive land-use planning and policy approaches toward open space and working lands conservation and sustainable development [78,79].
4.5. Comments on Interpretation
Several comments and points of caution for interpretation merit further discussion. First, using Census boundaries that vary in size as the basis for analyses introduces the modifiable areal unit problem, or MAUP [80,81]. We have attempted to reduce its effect by using block group data standardized to 2010 Census boundaries and by refining block group areas (i.e., by excluding water bodies and overlapping protected lands) prior to calculating metrics.
Second, our finding that nearly half of the 215,000+ block groups examined lost population, yet 46.5% of these added new housing and 85% gained impervious development, demonstrates that population density or counts are not suitable proxies for the development footprint. We analyzed both housing density and impervious cover data, in addition to population count, to more fully account for the physical footprint of the residential, commercial, industrial, and infrastructural features that are critical to understanding land use change [47,48,74].
Third, areas with population losses will, by definition of per capita land consumption, result in increasing consumption per person even when very little land is “consumed” for development over the period analyzed. New Orleans is a prime example of how rapid out-migration, due largely to approximately 450,000 residents being displaced in 2005 from Hurricane Katrina, many never to return [82], resulted in an increase in per capita consumption. We found New Orleans lost 175,000 people by 2010 compared to 2000 and had one of the largest percent increases (27.8%) in per capita consumption for an urbanized area, yet there was very little new impervious development (+8.65 km2) within its boundaries (Figure 4d). Our finding contrasts with Bounoua et al. [54], who reported a modest decrease in impervious surface area per capita in New Orleans. While our studies used the same 2010 Census urbanized area boundaries for reporting change, Bounoua et al. [54] summarized change after aggregating 500 m MODIS land cover, 30 m NLCD impervious surface cover, and 2.5 arc-minute gridded population data scaled up to approximately 5 km × 5 km cells. This example demonstrates how careful interpretation of consumption patterns, including the scale, magnitude, and direction of change in underlying development and population data, is needed to better understand and distinguish locations such as New Orleans from those where new development actually outpaces population gains (e.g., Charlotte, Houston, and Phoenix (Figure 4d and Figure 5d)).
Fourth, while we used the most comprehensive 30 m NLCD fractional imperviousness data [59,60] available for estimating impervious footprints, Nowak and Greenfield [83] found that 2001 percent impervious cover was underestimated by 1.4% to 5.7% in approximately 70% of mapping zones of the conterminous U.S. More recently, comparisons of the 2011 imperviousness data to high-resolution (1 m2) reference data for the Chesapeake Bay region [84] and for 18 U.S. metropolitan regions [85] identified similar underestimation biases in the percent impervious cover. Smith et al. [86] evaluated NLCD impervious data for hydrologic applications across exurban to urban settings, and, compared to reference data, found greater underestimation bias in areas of low-density development (<20% impervious cover), mixed accuracy across medium-density development (40–70% impervious), and the highest agreement in areas of higher-density developments (>70% impervious). We also note that NLCD imperviousness data does not account for the volume of impervious materials used in taller vertical structures associated with high- and medium-density settlements. Moreover, linear infrastructure, such as one- and two-lane roads, can go largely undetected in medium-resolution satellite data; however, it comprises significant portions of the total development footprint [34]. Taken together, these studies indicate that we (and others that rely on similar data) have likely underestimated the extent of impervious footprint and the rates of per capita consumption across the U.S, and perhaps even more so in lower-density rural and exurban areas. More work is needed to further quantify and understand the magnitude of this uncertainty in our estimates, locally, regionally, and along the urban–rural gradient.
Fifth, our scores of the overall human footprint and sustainability of megaregion growth trajectories are not absolute measures, but rather relative rankings based on each region’s relative performance across multiple cumulative and change metrics. This choice was driven, in part, by persistent challenges associated with absolute quantification of sustainable urbanization, for example, subjective definitions of urban sprawl, lack of clear distinctions between dispersed versus compact development, and widely varying indices used across urbanization studies [87]. Overall, we recognize the inherent uncertainties and limitations associated with the national datasets used and the spatial and temporal scales of our analyses, however, the credibility of our findings is supported by trends identified in prior research and highlighted in this discussion.
5. Conclusions
Several key trends and forward-looking thoughts emerge from our analyses of urbanization and per capita land change. First, exurbanization and suburbanization are the most extensive and intensive forms of growth in the 21st-century U.S. The area of exurban density lands in 2010 exceeded prior estimates and some 2020 projections, and over 90% of new impervious development between 2000 and 2010 occurred in suburban and exurban lands, leading to overall losses of rural density lands. Second, per capita land consumption increased nationally to 0.035 ha/person, a rate that surpasses prior estimates and projections. Subnationally, mean consumption increased for all housing density types, but most significantly in rural density lands. Mean consumption across rural lands in 2010 (0.454 ha/person) was over 8.5 times the average rates in exurban, suburban, and urban areas, with the most extensive increases occurring throughout portions of the Great Plains and Midwest. Third, while urban and suburban areas had significantly lower per capita consumption compared to rural and exurban lands, 60% of these areas nationally were land-use inefficient, where unsustainable rates of urban expansion outpaced population growth. Fourth, there was substantial variation in trajectories of megaregion growth when assessed across multiple metrics of human footprint, but also important regional similarities. Megaregions in the rapidly urbanizing Sun Belt stretching from AZ to NC grew less sustainably, whereas the Cascadia, Front Range, and Northern California megaregions grew most sustainably, perhaps reflecting more progressive growth and conservation management approaches embedded in the histories and cultures of the American West. Early aggregate data from the 2020 Census suggests increasing population growth in both the southern and western regions of the U.S. How these population trends manifest in new urbanization and environmental changes across the urban–rural gradient are topics of future work using subsequent data releases of population and housing counts, protected areas, and land cover. This will produce new knowledge of how, when, and where we develop, facilitate new comparisons to prior and contemporary research, and can inform spatially explicit predictive models of urbanization, per capita land change, and sustainable growth in the urban millennium. Thus, this research is also a point of departure, providing benchmark metrics that planners, land managers, policymakers, and researchers can use to track trends of urbanization and per capita land change and to make better decisions about where to focus resources to support local and regional priorities for conservation and sustainable development.
Author Contributions
Conceptualization, J.B.V. and J.V.; Data curation, J.B.V.; Formal analysis, J.B.V.; Investigation, J.B.V.; Methodology, J.B.V. and J.V.; Project administration, J.B.V. and J.V.; Supervision, J.B.V. and J.V.; Validation, J.B.V. and J.V.; Visualization, J.B.V.; Writing—original draft, J.B.V.; Writing—review and editing, J.B.V. and J.V. All authors have read and agreed to the published version of the manuscript.
Funding
This research was supported, in part, by a National Science Foundation Smart and Connected Communities grant (Award# 1737563) and a U.S. Geological Survey grant (Award# 1501-2016-1593).
Institutional Review Board Statement
Not applicable.
Informed Consent Statement
Not applicable.
Data Availability Statement
The national datasets used in this analysis are publicly available and sources are cited in the manuscript. The metrics we developed that support the findings of this study are available to download and explore via our online mapping application at https://go.ncsu.edu/us-human-footprint (accessed on 19 November 2021). The source code and associated files used to develop the mapping application are available at the following GitHub public repository: https://github.com/ncsu-cga/HumanFootprint (accessed on 19 November 2021). Full resolution TIF files of the manuscript figures are available at https://go.ncsu.edu/us-human-footprint-published-figures (accessed on 19 November 2021).
Acknowledgments
The authors thank Makiko Shukunobe for the technical assistance and programming expertise needed to fully develop the companion online mapping platform for this manuscript. We are grateful to Megan Skrip for her constructive, insightful comments and suggestions that greatly improved the manuscript. The authors extend heartfelt thanks to Ross K. Meentemeyer for the support and resources necessary to complete the work, as well as his constructive comments, suggestions, and feedback during research conceptualization, design of methods, and review and editing of the manuscript. The authors also thank the reviewers for comments and suggestions that improved the manuscript.
Conflicts of Interest
The authors declare no conflict of interest.
References
- Ginkel, H.V. Urban future. Nature 2008, 456, 32–33. [Google Scholar] [CrossRef]
- Seto, K.C.; Sánchez-Rodríguez, R.; Fragkias, M. The new geography of contemporary urbanization and the environment. Annu. Rev. Environ. Resour. 2010, 35, 167–194. [Google Scholar] [CrossRef] [Green Version]
- United Nations 2019 Special Edition: Progress towards the Sustainable Development Goals-Report of the Secretary-General (United Nations, Economic and Social Council). Available online: https://undocs.org/E/2019/68 (accessed on 11 September 2019).
- Fahrig, L. Effects of habitat fragmentation on biodiversity. Annu. Rev. Ecol. Evol. Syst. 2003, 34, 487–515. [Google Scholar] [CrossRef] [Green Version]
- Guneralp, B.; Seto, K.C. Futures of global urban expansion: Uncertainties and implications for biodiversity conservation. Environ. Res. Lett. 2013, 8, 014025. [Google Scholar] [CrossRef]
- Seto, K.C.; Guneralp, B.; Hutyra, L.R. Global forecasts of urban expansion to 2030 and direct impacts on biodiversity and carbon pools. Proc. Natl. Acad. Sci. USA 2012, 109, 16083–16088. [Google Scholar] [CrossRef] [Green Version]
- McDonald, R.I.; Mansur, A.V.; Ascensão, F.; Colbert, M.; Crossman, K.; Elmqvist, T.; Gonzalez, A.; Guneralp, B.; Haase, D.; Hamann, M.; et al. Research gaps in knowledge of the impact of urban growth on biodiversity. Nat. Sustain. 2020, 3, 16–24. [Google Scholar] [CrossRef]
- McGrane, S.J. Impacts of urbanisation on hydrological and water quality dynamics, and urban water management: A review. Hydrol. Sci. J. 2016, 61, 2295–2311. [Google Scholar] [CrossRef]
- Paul, M.J.; Meyer, J.L. Streams in the urban landscape. Annu. Rev. Ecol. Syst. 2001, 32, 333–365. [Google Scholar] [CrossRef]
- Grimm, N.B.; Faeth, S.H.; Golubiewski, N.E.; Redman, C.L.; Wu, J.; Bai, X.; Briggs, J.M. Global change and the ecology of cities. Science 2008, 319, 756–760. [Google Scholar] [CrossRef] [PubMed] [Green Version]
- Bierwagen, B.G.; Theobald, D.M.; Pyke, C.R.; Choate, A.; Growth, P.; Thomas, J.V.; Morefield, P. National housing and impervious surface scenarios for integrated climate impact assessments. Proc. Natl. Acad. Sci. USA 2010, 107, 20887–20892. [Google Scholar] [CrossRef] [PubMed] [Green Version]
- Churkina, G.; Brown, D.G.; Keoleian, G. Carbon stored in human settlements: The conterminous United States. Glob. Chang. Biol. 2010, 16, 135–143. [Google Scholar] [CrossRef] [Green Version]
- Huang, K.; Li, X.; Liu, X.; Seto, K.C. Projecting global urban land expansion and heat island intensification through 2050. Environ. Res. Lett. 2019, 14, 114037. [Google Scholar] [CrossRef] [Green Version]
- Zhao, L. Urban growth and climate adaptation. Nat. Clim. Chang. 2018, 8, 1034. [Google Scholar] [CrossRef]
- Irwin, E.G.; Bockstael, N.E. The evolution of urban sprawl: Evidence of spatial heterogeneity and increasing land fragmentation. Proc. Natl. Acad. Sci. USA 2007, 104, 20672–20677. [Google Scholar] [CrossRef] [PubMed] [Green Version]
- D’Amour, C.B.; Reitsma, F.; Baiocchi, G.; Barthel, S.; Güneralp, B.; Erb, D.; Haberl, H.; Creutzig, F.; Seto, K.C. Future urban land expansion and implications for global croplands. Proc. Natl. Acad. Sci. USA 2017, 114, 8939–8944. [Google Scholar] [CrossRef] [Green Version]
- Barrington-Leigh, C.; Millard-Ball, A. A century of sprawl in the United States. Proc. Natl. Acad. Sci. USA 2015, 112, 8244–8249. [Google Scholar] [CrossRef] [Green Version]
- Moore, M.; Gould, P.; Keary, B.S. Global urbanization and impact on health. Int. J. Hyg. Environ. Health 2003, 206, 269–278. [Google Scholar] [CrossRef]
- Güneralp, B.; Reba, M.; Hales, B.U.; Wentz, E.A.; Seto, K.C. Trends in urban land expansion, density, and land transitions from 1970 to 2010: A global synthesis. Environ. Res. Lett. 2020, 15, 044015. [Google Scholar] [CrossRef]
- Liu, X.; Huang, Y.; Xu, X.; Li, X.; Li, X.; Ciasis, P.; Lin, P.; Gong, K.; Ziegler, A.D.; Chen, A.; et al. High-spatiotemporal-resolution mapping of global urban change from 1985 to 2015. Nat. Sustain. 2020, 3, 564–570. [Google Scholar] [CrossRef]
- Seto, K.C.; Fragkias, M.; Güneralp, B.; Reilly, M.K. A meta-analysis of global urban land expansion. PLoS ONE 2011, 6, e23777. [Google Scholar] [CrossRef]
- Theobald, D.M.; Kennedy, C.; Chen, B.; Oakleaf, J.; Baruch-Mordo, S.; Kiesecker, J. Earth transformed: Detailed mapping of global human modification from 1990 to 2017. Earth Syst. Sci. Data 2020, 12, 1953–1972. [Google Scholar] [CrossRef]
- Seto, K.C.; Reenberg, A.; Boone, C.G.; Fragkias, M.; Haase, D.; Langanke, T.; Marcotullio, P.; Munroe, D.K.; Olah, B.; Simon, D. Urban land teleconnections and sustainability. Proc. Natl. Acad. Sci. USA 2012, 109, 7687–7692. [Google Scholar] [CrossRef] [PubMed] [Green Version]
- Hahs, A.K. Urban megaregions and the continuum of urbanity—Embracing new frameworks or extending the old? Ecosyst. Health Sustain. 2016, 2, e01201. [Google Scholar] [CrossRef] [Green Version]
- Hamilton, C.M.; Martinuzzi, S.; Plantinga, A.J.; Radeloff, V.C.; Lewis, D.J.; Thogmartin, W.E.; Heglund, P.J.; Pidgeon, A.M. Current and future land use around a nationwide protected area network. PLoS ONE 2013, 8, e55737. [Google Scholar] [CrossRef] [PubMed] [Green Version]
- Radeloff, V.C.; Stewart, S.I.; Hawbaker, T.J.; Gimmi, U.; Pidgeon, A.M.; Flather, C.H.; Hammer, R.B.; Helmers, D.P. Housing growth in and near United States protected areas limits their conservation value. Proc. Natl. Acad. Sci. USA 2010, 107, 940–945. [Google Scholar] [CrossRef] [PubMed] [Green Version]
- Vukomanovic, J.; Singh, K.; Vogler, J.B.; Meentemeyer, R.K. Protection status and proximity to public-private boundaries influence land use intensification near U.S. parks and protected areas. Conserv. Sci. Pract. 2020, 2, e190. [Google Scholar] [CrossRef]
- Wade, A.A.; Theobald, D. Residential Development Encroachment on US protected areas. Conserv. Biol. 2009, 24, 151–161. [Google Scholar] [CrossRef]
- Gao, J.; O’Neill, B.C. Mapping global urban land for the 21st century with data-driven simulations and shared socioeconomic pathways. Nat. Commun. 2020, 11, 2302. [Google Scholar] [CrossRef] [PubMed]
- Fragkias, M.; Seto, K.C. The rise and rise of urban expansion. Glob. Chang. 2012, 78, 16–19. [Google Scholar]
- Frenkel, A.; Ashkenazi, M. Measuring urban sprawl: How can we deal with it? Environ. Plan. B Plan. Des. 2008, 35, 56–79. [Google Scholar] [CrossRef] [Green Version]
- Hamidi, S.; Ewing, R.; Preuss, I.; Dodds, A. Measuring sprawl and its impacts: An update. J. Plan. Educ. Res. 2015, 35, 35–50. [Google Scholar] [CrossRef]
- Stokes, E.C.; Seto, K.C. Characterizing and measuring urban landscapes for sustainability. Environ. Res. Lett. 2019, 14, 045002. [Google Scholar] [CrossRef]
- Raiter, K.G.; Prober, S.M.; Hobbs, R.J.; Possingham, H.P. Lines in the sand: Quantifying the cumulative development footprint in the world’s largest remaining temperate woodland. Landsc. Ecol. 2017, 32, 1969–1986. [Google Scholar] [CrossRef] [Green Version]
- Theobald, D.M. A general model to quantify ecological integrity for landscape assessments and US application. Landsc. Ecol. 2013, 28, 1859–1874. [Google Scholar] [CrossRef]
- Lu, D.; Li, G.; Kuang, W.; Moran, E. Methods to extract impervious surface areas from satellite images. Int. J. Digit. Earth 2013, 7, 93–112. [Google Scholar] [CrossRef]
- Weng, Q. Remote sensing of impervious surfaces in the urban areas: Requirements, methods, and trends. Remote Sens. Environ. 2012, 117, 34–49. [Google Scholar] [CrossRef]
- Arnold, C.L., Jr.; Gibbons, C.J. Impervious surface coverage: The emergence of a key environmental indicator. J. Am. Plan. Assoc. 1996, 62, 243–258. [Google Scholar] [CrossRef]
- Frazer, L. Paving paradise: The peril of impervious surfaces. Environ. Health Perspect. 2005, 113, A456–A462. [Google Scholar] [CrossRef] [Green Version]
- Shuster, W.D.; Bonta, J.; Thurston, H.; Warnemuende, E.; Smith, D.R. Impacts of impervious surface on watershed hydrology: A review. Urban Water J. 2005, 2, 263–275. [Google Scholar] [CrossRef]
- Theobald, D.M.; Goetz, S.J.; Norman, J.; Jantz, C.A. Watersheds at risk to increased impervious surface in the conterminous US. J. Hydrol. Eng. 2009, 14, 362–368. [Google Scholar] [CrossRef]
- Sutton, P.C.; Anderson, S.J.; Elvidge, C.D.; Tuttle, B.T.; Ghosh, T. Paving the planet: Impervious surface as a proxy measure of the human ecological footprint. Prog. Phys. Geogr. 2009, 33, 510–527. [Google Scholar] [CrossRef]
- United Nations 2021 Sustainable Development Goals Metadata Repository-SDG Indicator Metadata (Format Version 1.0). (United Nations, Department of Economic and Social Affairs, Statistics Division, New York). Available online: https://unstats.un.org/sdgs/metadata/files/Metadata-11-03-01.pdf (accessed on 5 May 2021).
- Leyk, S.; Uhl, J.H.; Connor, D.S.; Braswell, A.E.; Mietkiewicz, N.; Balch, J.K.; Gutmann, M. Two centuries of settlement and urban development in the United States. Sci. Adv. 2020, 6, eaba2937. [Google Scholar] [CrossRef] [PubMed]
- Sleeter, B.M.; Sohl, T.L.; Loveland, T.R.; Auch, R.F.; Acevedo, W.; Drummond, M.A.; Sayler, K.L.; Stehman, S.V. Land-cover change in the conterminous United States from 1973 to 2000. Glob. Environ. Chang. 2013, 23, 733–748. [Google Scholar] [CrossRef] [Green Version]
- Elvidge, C.D.; Tuttle, B.T.; Sutton, P.C.; Baugh, K.E.; Howard, A.T.; Milesi, C.; Bhaduri, B.; Nemani, R. Global distribution and density of constructed impervious surfaces. Sensors 2007, 7, 1962–1979. [Google Scholar] [CrossRef] [PubMed]
- Brown, D.G.; Johnson, K.M.; Loveland, T.R.; Theobald, D.M. Rural land-use trends in the conterminous United States, 1950–2000. Ecol. Appl. 2005, 15, 1851–1863. [Google Scholar] [CrossRef] [Green Version]
- Theobald, D.M. Landscape patterns of exurban growth in the USA from 1980 to 2020. Ecol. Soc. 2005, 10, 32. [Google Scholar] [CrossRef] [Green Version]
- Theobald, D.M. Land-use dynamics beyond the American urban fringe. Geogr. Rev. 2001, 91, 544–564. [Google Scholar]
- Hansen, A.J.; Knight, R.L.; Marzluff, J.M.; Powell, S.; Brown, K.; Gude, P.H.; Jones, K. Effects of exurban development on biodiversity: Patterns, mechanisms, and research needs. Ecol. Appl. 2005, 15, 1893–1905. [Google Scholar] [CrossRef]
- Theobald, D.M.; Romme, W.H. Expansion of the US wildland–urban interface. Landsc. Urban Plan. 2007, 83, 340–354. [Google Scholar] [CrossRef]
- Heris, M.P. Evaluating metropolitan spatial development: A method for identifying settlement types and depicting growth patterns. Reg. Stud. Reg. Sci. 2016, 4, 7–25. [Google Scholar] [CrossRef] [Green Version]
- Radeloff, V.C.; Helmers, D.P.; Kramer, H.A.; Mockrin, M.H.; Alexandre, P.M.; Bar-Massada, A.; Butsic, V.; Hawbaker, T.J.; Martinuzzi, S.; Syphard, A.D.; et al. Rapid growth of the US wildland-urban interface raises wildfire risk. Proc. Natl. Acad. Sci. USA 2018, 115, 3314–3319. [Google Scholar] [CrossRef] [PubMed] [Green Version]
- Bounoua, L.; Nigro, J.; Zhang, P.; Thome, K.; Lachird, A. Mapping urbanization in the United States from 2001 to 2011. Appl. Geogr. 2018, 90, 123–133. [Google Scholar] [CrossRef]
- Gerten, C.; Fina, S.; Rusche, K. The sprawling planet: Simplifying the measurement of global urbanization trends. Front. Environ. Sci. 2019, 7, 140. [Google Scholar] [CrossRef]
- McDonald, R.I.; Forman, R.T.T.; Kareiva, P. Open space loss and land inequality in United States’ cities, 1990–2000. PLoS ONE 2010, 5, e9509. [Google Scholar] [CrossRef] [Green Version]
- Pickard, B.R.; Daniel, J.; Mehaffey, M.; Jackson, L.E.; Neale, A. EnviroAtlas: A new geospatial tool to foster ecosystem services science and resource management. Ecosyst. Serv. 2015, 14, 45–55. [Google Scholar] [CrossRef] [Green Version]
- Grekousis, G.; Mountrakis, G. Sustainable development under population pressure: Lessons from developed land consumption in the conterminous U.S. PLoS ONE 2015, 10, e0119675. [Google Scholar] [CrossRef]
- Homer, C.G.; Dewitz, J.A.; Yang, L.; Jin, S.; Danielson, P.; Xian, G.; Coulston, J.; Herold, N.D.; Wickham, J.D.; Megown, K. Completion of the 2011 National Land Cover Database for the conterminous United States representing a decade of land cover change information. Photogramm. Eng. Remote Sens. 2015, 81, 345–354. [Google Scholar]
- Homer, C.; Dewitz, J.; Fry, J.; Coan, M.; Hossain, N.; Larson, C.; Herold, N.; McKerrow, A.; VanDriel, J.N.; Wickham, J. Completion of the 2001 National Land Cover Database for the conterminous United States. Photogramm. Eng. Remote Sens. 2007, 73, 337–341. [Google Scholar]
- US Geological Survey (USGS) Gap Analysis Program (GAP), 20160505, Protected Areas Database of the United States (PAD-US): USGS Gap Analysis Program (GAP). Available online: https://0-doi-org.brum.beds.ac.uk/10.5066/F7G73BSZ (accessed on 3 September 2021). [CrossRef]
- Manson, S.; Schroeder, J.; Van Riper, D.; Ruggles, S. IPUMS National Historical Geographic Information System, version 14.0; [Database]; IPUMS: Minneapolis, MN, USA, 2019. [Google Scholar] [CrossRef]
- U.S. Census Bureau (2021) Glossary. Available online: https://www.census.gov/programs-surveys/geography/about/glossary.html (accessed on 3 November 2021).
- Tanner, R. Inholdings within wilderness. Int. J. Wilderness 2002, 8, 9–14. [Google Scholar]
- Hagler, Y. Defining U.S. Megaregions. New York: Regional Plan Association/America 2050. 2009. Available online: https://s3.us-east-1.amazonaws.com/rpa-org/pdfs/2050-Paper-Defining-US-Megaregions.pdf (accessed on 11 September 2018).
- Seto, K.C.; Pandey, B. Urban land use: Central to building a sustainable future. One Earth 2019, 1, 168–170. [Google Scholar] [CrossRef] [Green Version]
- Hjerpe, E.; Hussain, A.; Holmes, T. Amenity migration and public lands: Rise of the protected areas. Environ. Manag. 2020, 66, 56–71. [Google Scholar] [CrossRef] [PubMed]
- Reisig, D.; Mullan, K.; Hansen, A.; Powell, S.; Theobald, D.; Ulrich, R. Natural amenities and low-density residential development: Magnitude and spatial scale of influences. Land Use Policy 2021, 102, 105285. [Google Scholar] [CrossRef]
- Ahmed, S.; Jackson-Smith, D. Impacts of spatial patterns of rural and exurban residential development on agricultural trends in the Intermountain West. SAGE Open 2019, 9, 2158244019871037. [Google Scholar] [CrossRef] [Green Version]
- Leu, M.; Hanser, S.E.; Knick, S.T. The human footprint in the West: A large-scale analysis of anthropogenic impacts. Ecol. Appl. 2008, 18, 1119–1139. [Google Scholar] [CrossRef] [PubMed]
- Pejchar, L.; Reed, S.E.; Bixler, P.; Ex, L.; Mockrin, M.H. Consequences of residential development for biodiversity and human well-being. Front. Ecol. Environ. 2015, 13, 146–153. [Google Scholar] [CrossRef] [Green Version]
- Zeng, L.; Ramaswami, A. Impact of locational choices and consumer behaviors on personal land footprints: An exploration across the urban–rural continuum in the United States. Environ. Sci. Technol. 2020, 54, 3091–3102. [Google Scholar] [CrossRef] [PubMed] [Green Version]
- Alberti, M. The effects of urban patterns on ecosystem function. Int. Reg. Sci. Rev. 2005, 28, 168–192. [Google Scholar] [CrossRef]
- Bounoua, L.; Nigro, J.; Thome, K.; Zhang, P.; Fathi, N.; Lachir, A. A method for mapping future urbanization in the United States. Urban Sci. 2018, 2, 40. [Google Scholar] [CrossRef] [Green Version]
- Alig, R.J.; Kline, J.D.; Lichtenstein, M. Urbanization on the US landscape: Looking ahead in the 21st century. Landsc. Urban Plan. 2004, 69, 219–234. [Google Scholar] [CrossRef]
- Hamidi, S.; Ewing, R. A longitudinal study of changes in urban sprawl between 2000 and 2010 in the United States. Landsc. Urban Plan. 2014, 128, 72–82. [Google Scholar] [CrossRef]
- Kline, J.; Alig, R. Does land use planning slow the conversion of forest and farm lands? Growth Chang. 1999, 30, 3–22. [Google Scholar] [CrossRef]
- Kline, J.D.; Thiers, P.; Ozawa, C.P.; Yeakley, J.A.; Gordon, S.N. How well has land-use planning worked under different governance regimes? A case study in the Portland, OR-Vancouver, WA metropolitan area, USA. Landsc. Urban Plan. 2014, 131, 51–63. [Google Scholar] [CrossRef] [Green Version]
- Mockrin, M.H.; Reed, S.E.; Pejchar, L.; Salo, J. Balancing housing growth and land conservation: Conservation development preserves private lands near protected areas. Landsc. Urban Plan. 2017, 157, 598–607. [Google Scholar] [CrossRef] [Green Version]
- Dark, S.J.; Bram, D. The modifiable areal unit problem (MAUP) in physical geography. Prog. Phys. Geogr. Earth Environ. 2007, 31, 471–479. [Google Scholar] [CrossRef] [Green Version]
- Openshaw, S. The Modifiable Areal Unit Problem. Concepts and Techniques in Modern Geography; Geo Books: Norwich, UK, 1984; No. 38. [Google Scholar]
- Sastry, N.; Gregory, J. The location of displaced New Orleans residents in the year after Hurricane Katrina. Demography 2014, 51, 753–775. [Google Scholar] [CrossRef] [PubMed] [Green Version]
- Nowak, D.J.; Greenfield, E.J. Evaluating the National Land Cover Database tree canopy and impervious cover estimates across the conterminous United States: A comparison with photo-interpreted estimates. Environ. Manag. 2010, 46, 378–390. [Google Scholar] [CrossRef] [PubMed] [Green Version]
- Wickham, J.; Herold, N.; Stehman, S.V.; Homer, C.G.; Xian, G.; Claggett, P. Accuracy assessment of NLCD 2011 impervious cover data for the Chesapeake Bay region, USA. ISPRS J. Photogramm. Remote Sens. 2018, 146, 151–160. [Google Scholar] [CrossRef] [PubMed]
- Wickham, J.; Stehman, S.V.; Neale, A.C.; Mehaffey, M. Accuracy assessment of NLCD 2011 percent impervious cover for selected USA metropolitan areas. Int. J. Appl. Earth Obs. Geoinf. 2020, 84, 101955. [Google Scholar] [CrossRef]
- Smith, M.L.; Zhou, W.; Cadenasso, M.; Grove, M.; Band, L.E. Evaluation of the National Land Cover Database for hydrologic applications in urban and suburban Baltimore, Maryland. J. Am. Water Resour. Assoc. 2010, 46, 429–442. [Google Scholar] [CrossRef]
- Bhatta, B.; Saraswati, S.; Bandyopadhyay, D. Urban sprawl measurement from remote sensing data. Appl. Geogr. 2010, 30, 731–740. [Google Scholar] [CrossRef]
Figure 1.
Data and calculations used for quantifying human footprint metrics. Data on (a) population and housing [62], protected open spaces [61], and percent imperviousness [59,60] used to quantify (b) housing density and density classes, (c) total and percent impervious development, (d) per capita land consumption, and (e) land-use efficiency.

Figure 2.
Relative proportions of private land area, impervious development, and population by housing density class in 2000 and 2010.
Figure 2.
Relative proportions of private land area, impervious development, and population by housing density class in 2000 and 2010.

Figure 3.
Housing density patterns for private lands of the conterminous U.S. Patterns shown for block groups in (a) 2000 and (b) 2010 with change dominated by (c) rural to exurban density transitions and (d) exurban to suburban density transitions.
Figure 3.
Housing density patterns for private lands of the conterminous U.S. Patterns shown for block groups in (a) 2000 and (b) 2010 with change dominated by (c) rural to exurban density transitions and (d) exurban to suburban density transitions.

Figure 4.
Distribution of developed impervious surfaces across the conterminous United States and by housing density class. Developed imperviousness patterns shown for (a) 2000, (b) 2010, and (c) locations where imperviousness increased or remained unchanged over the decade, including (d) detailed patterns of change for selected metropolitan areas of the United States. (e) Distribution of total impervious surface area by year and housing density class.

Figure 5.
Per capita developed land consumption for private lands of the conterminous United States. Block group consumption patterns shown for (a) 2000 and (b) 2010. Direction and magnitude of change in land consumption for the decade shown for (c) the contiguous U.S. and for (d) block groups of selected metropolitan areas. (e) Mean per capita land consumption by year and housing density class (standard error of the mean shown for each bar).

Figure 6.
Land-use efficiency patterns and megaregion boundaries [65] of the conterminous United States. All urban and suburban density block groups (a) mapped as efficient (blue) or inefficient (orange) change with megaregion efficiency calculations shown in parentheses, and (b) the percent of total urban and suburban density lands by type of change (efficient, inefficient).

Figure 7.
Matrix of metric values, ranked values, and final ranking of overall footprint and relative sustainability of eleven U.S. megaregions. Final rank is based on adding rank scores of 2010 cumulative footprint metrics and change in footprint (2000–2010) metrics across rows to derive a total score for each region. Grayscale cells help to visualize the order and variation of rank values in each column, with the darkest shade representing the best-performing, or highest ranked (#1), megaregion as measured by a particular metric. Values in parentheses are mean values (mean density units are housing units/ha; mean consumption units are ha of impervious surface/person) or percentages calculated from the block groups within each region, and they provide the basis for rankings.


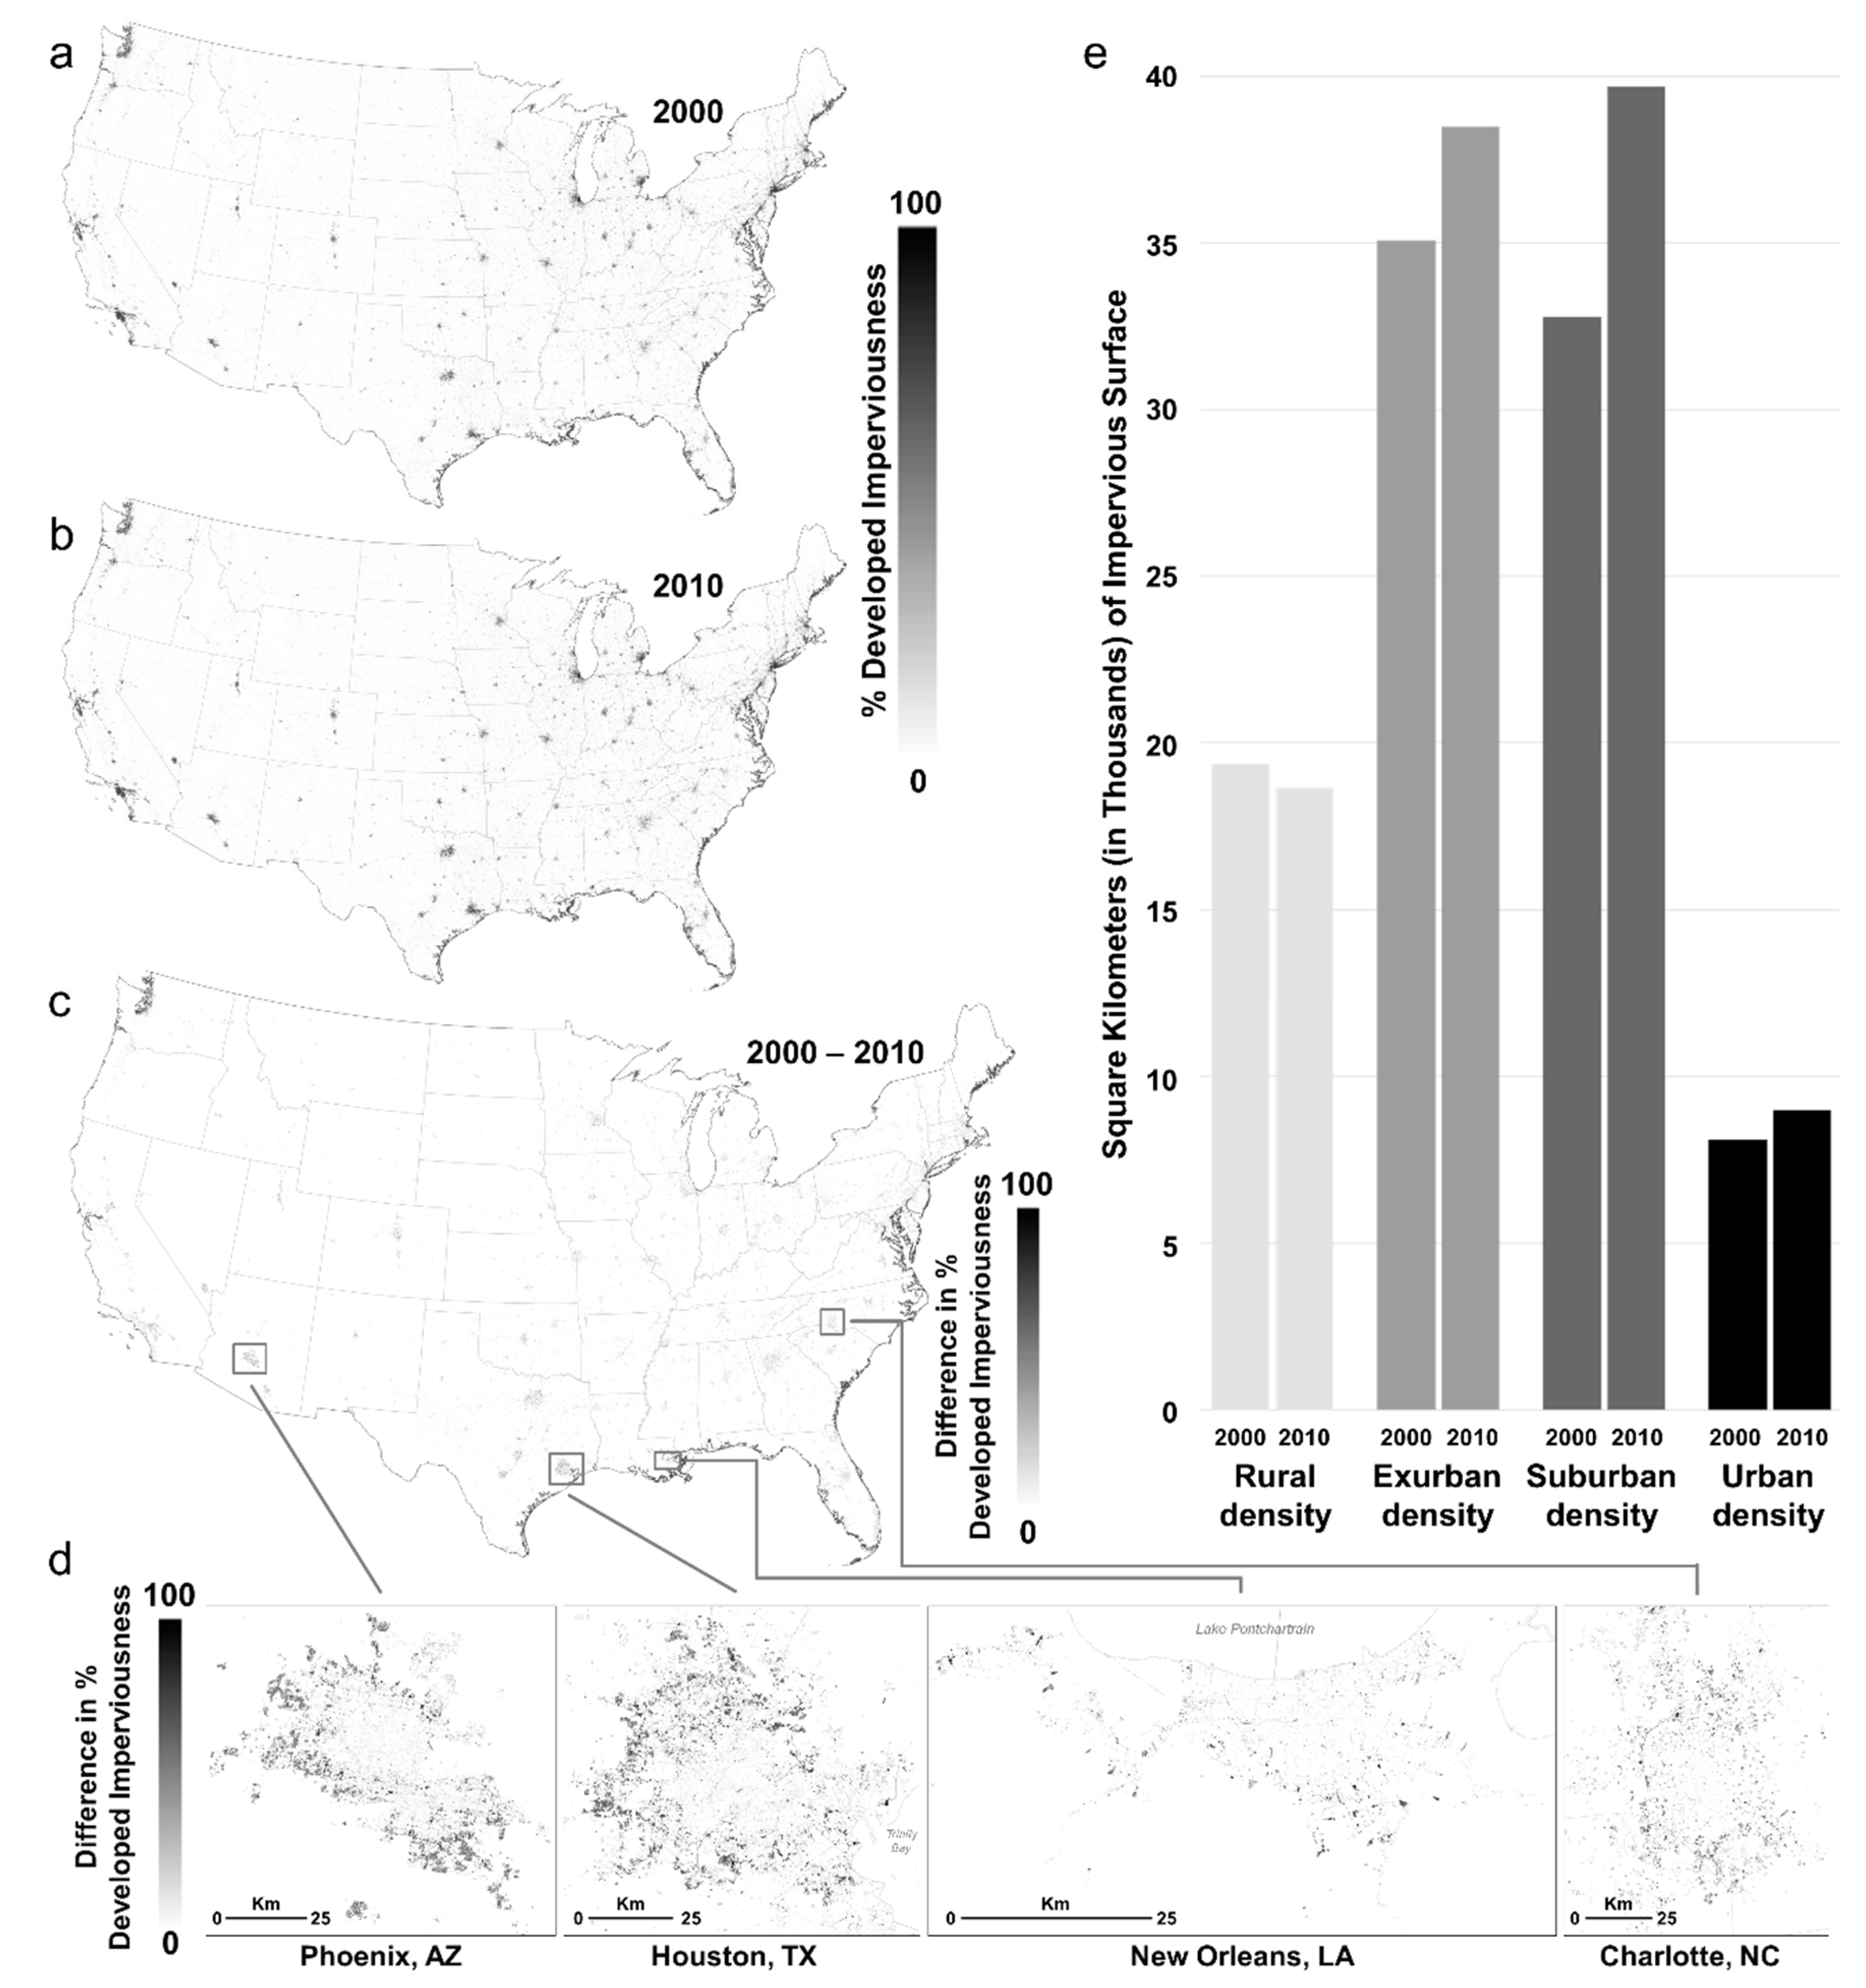
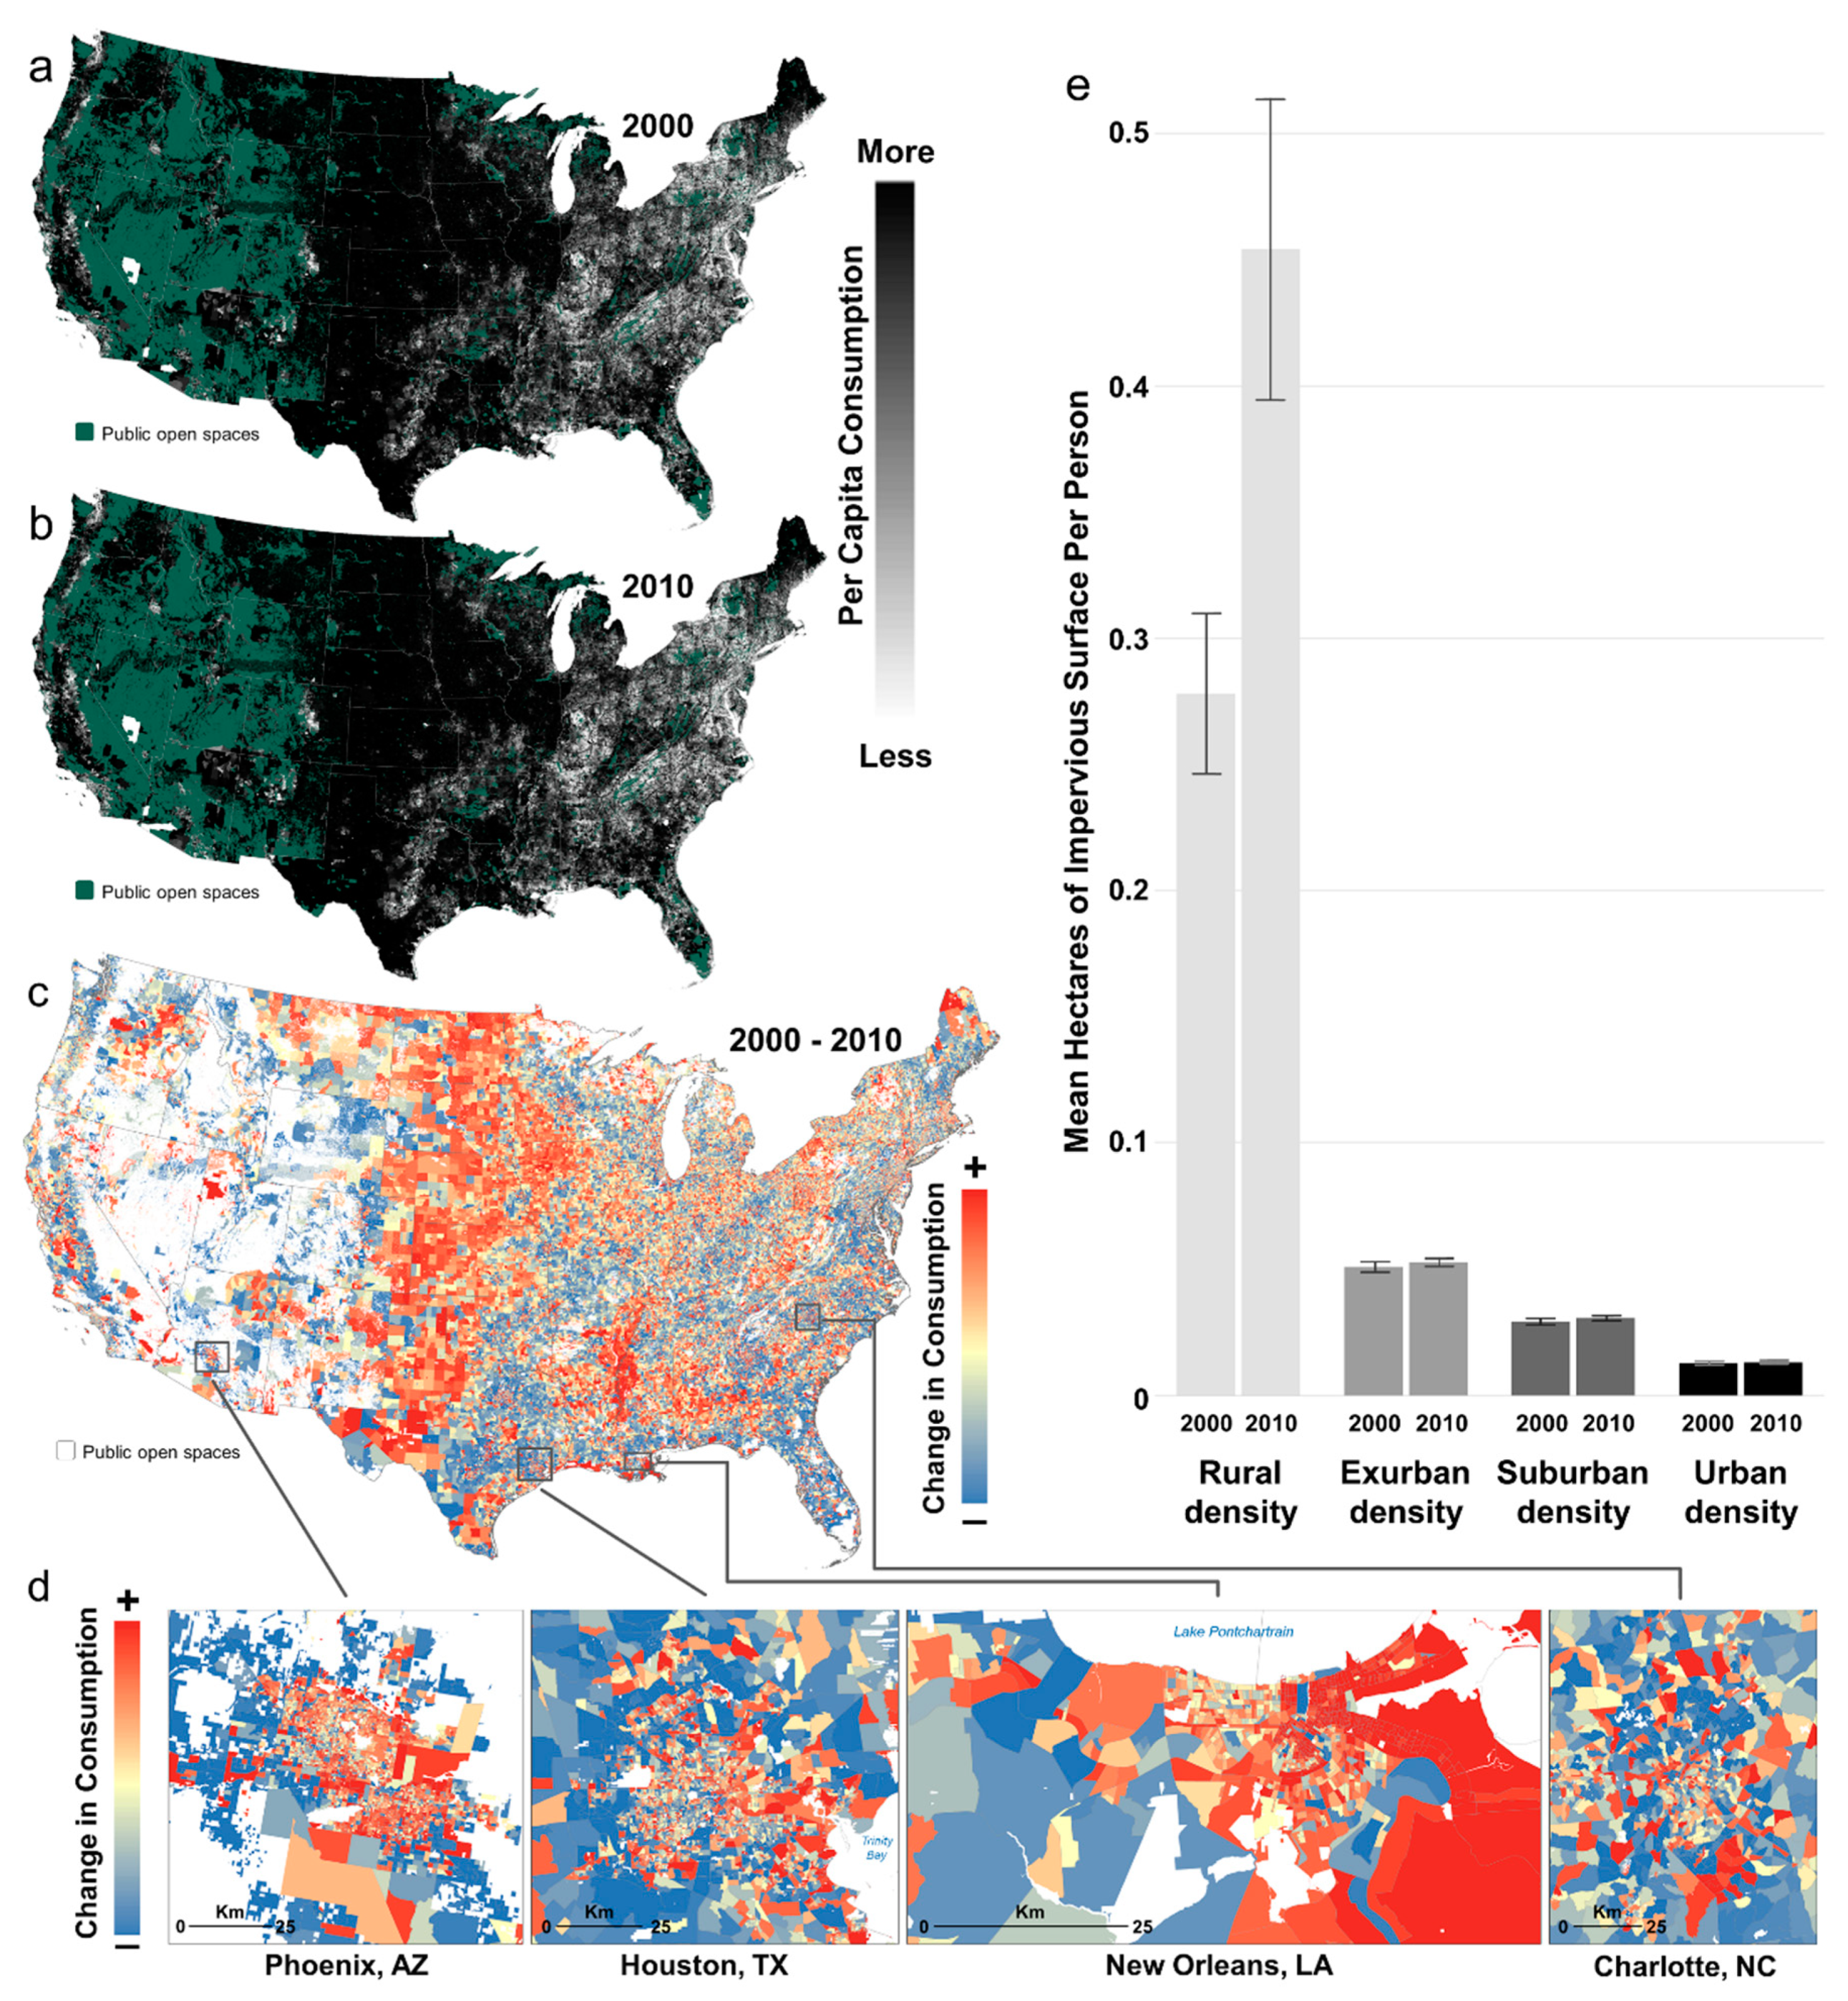
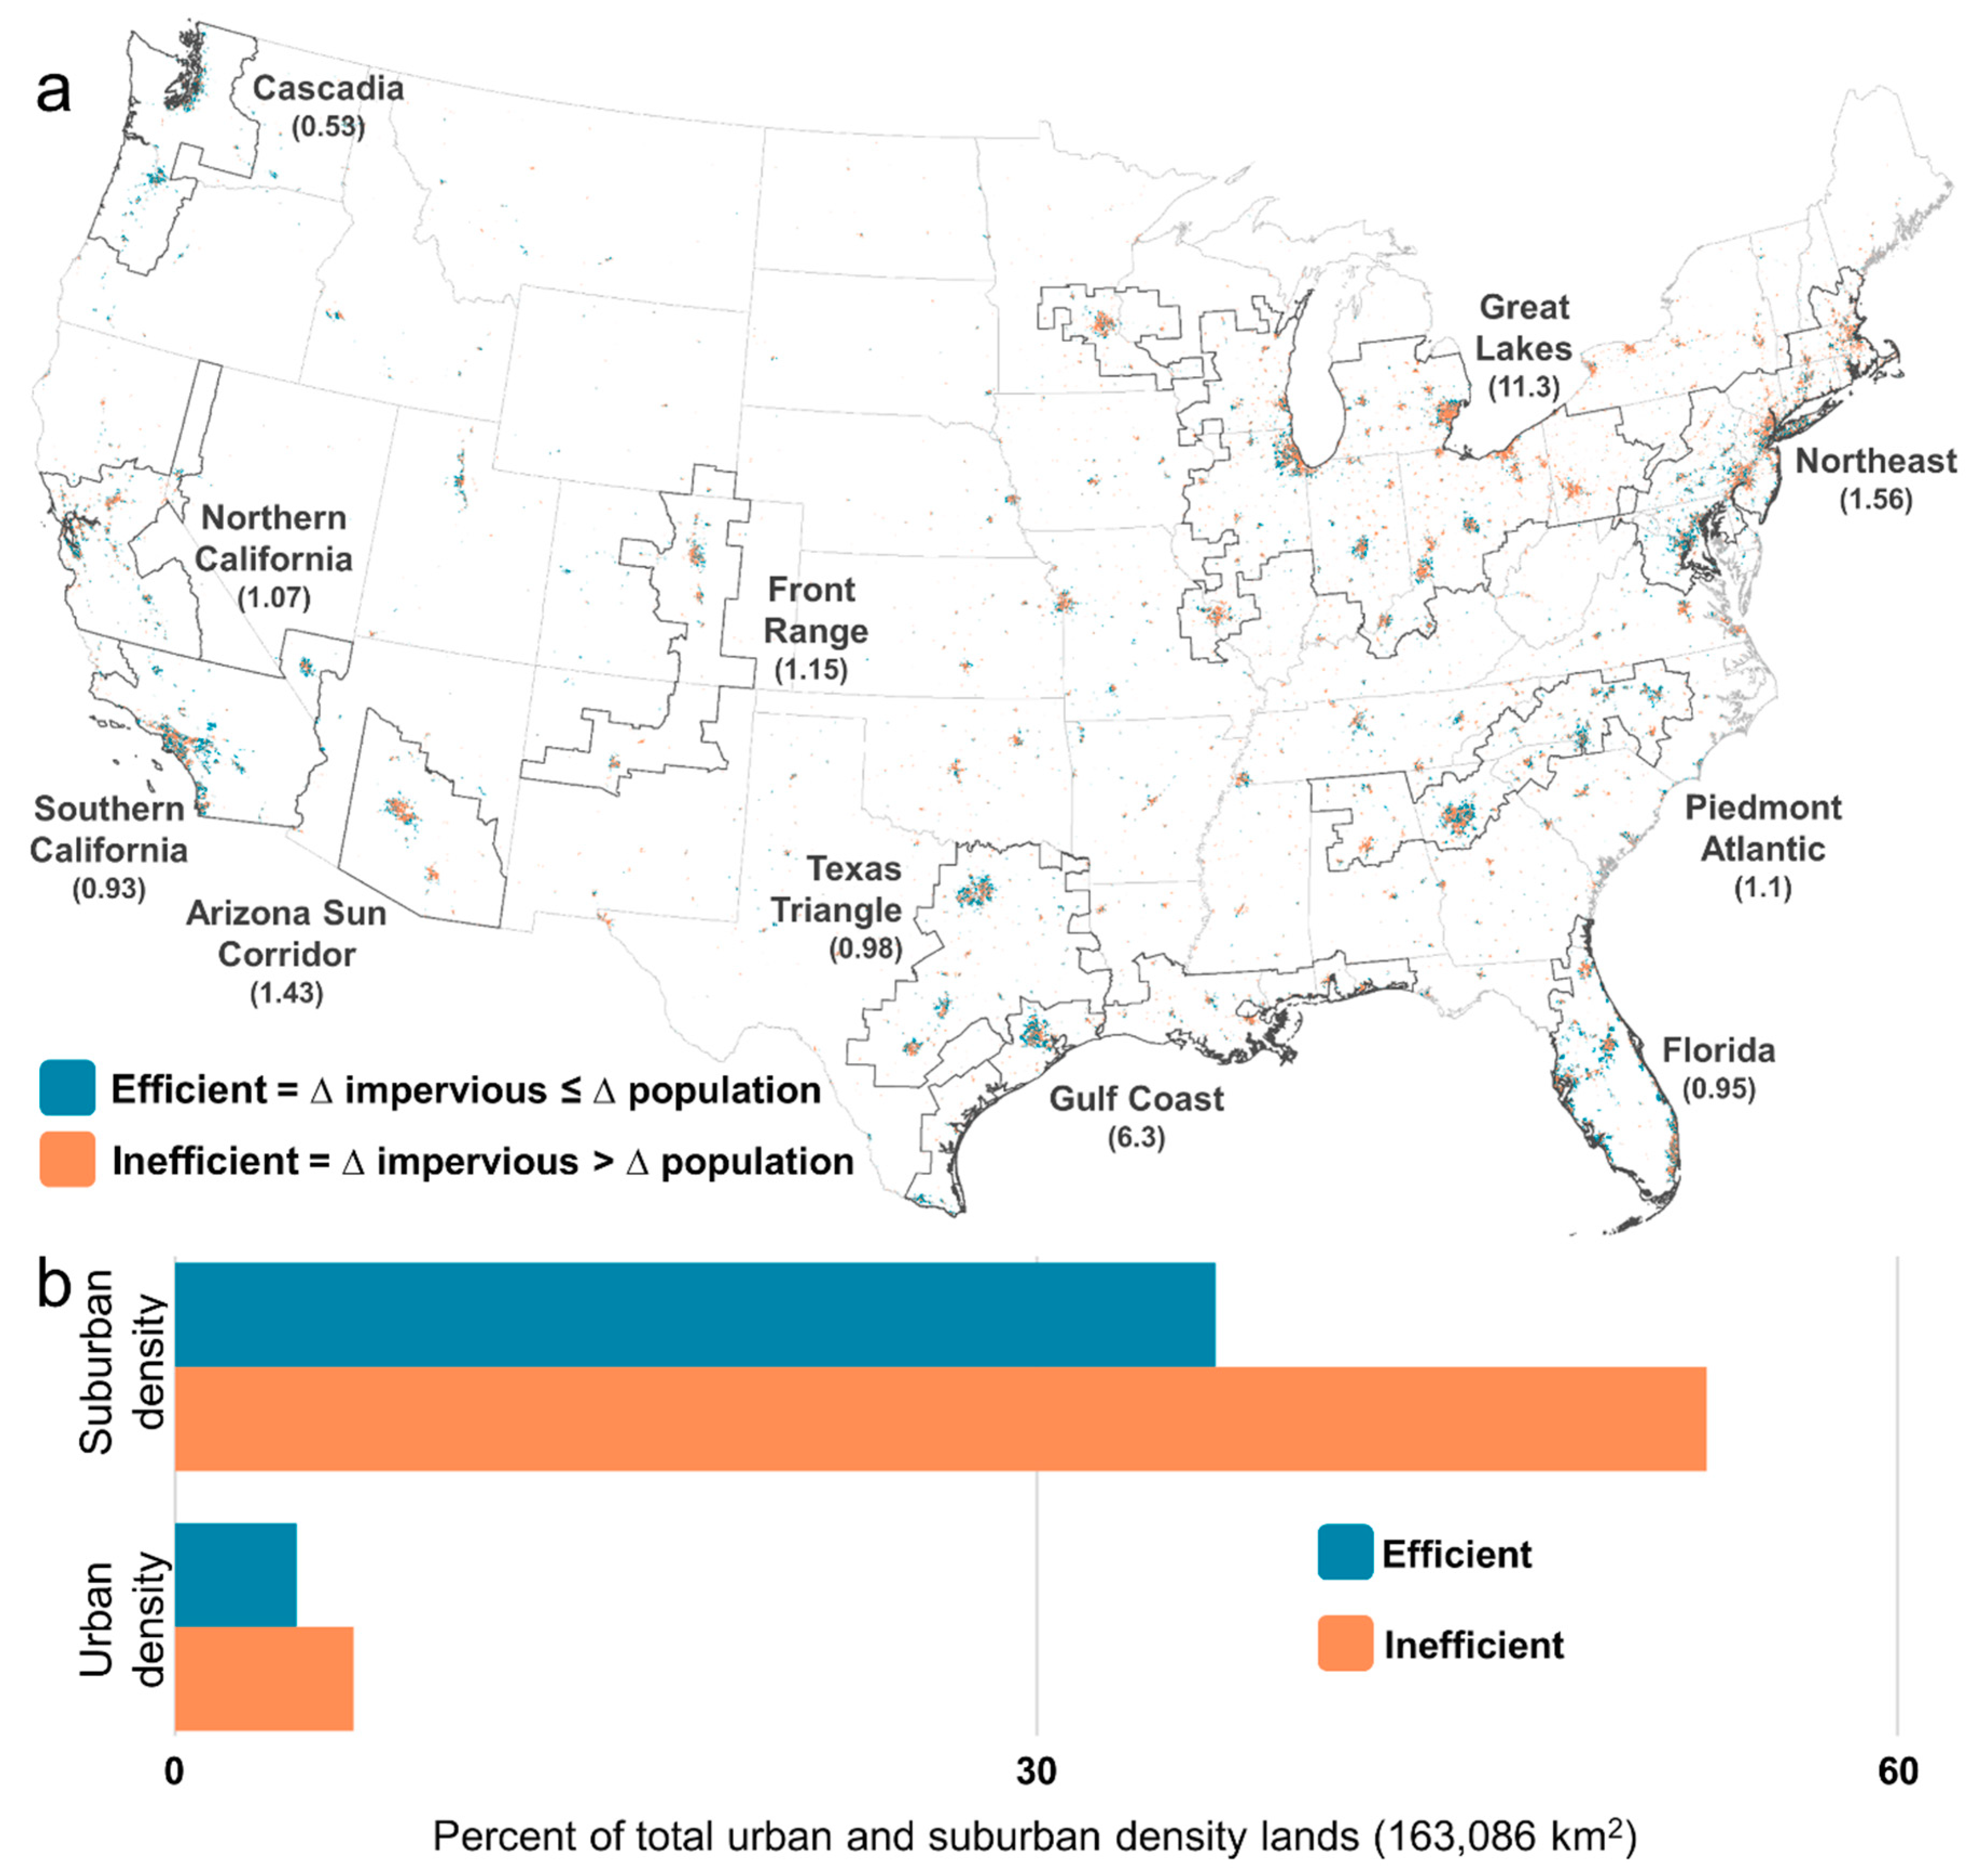
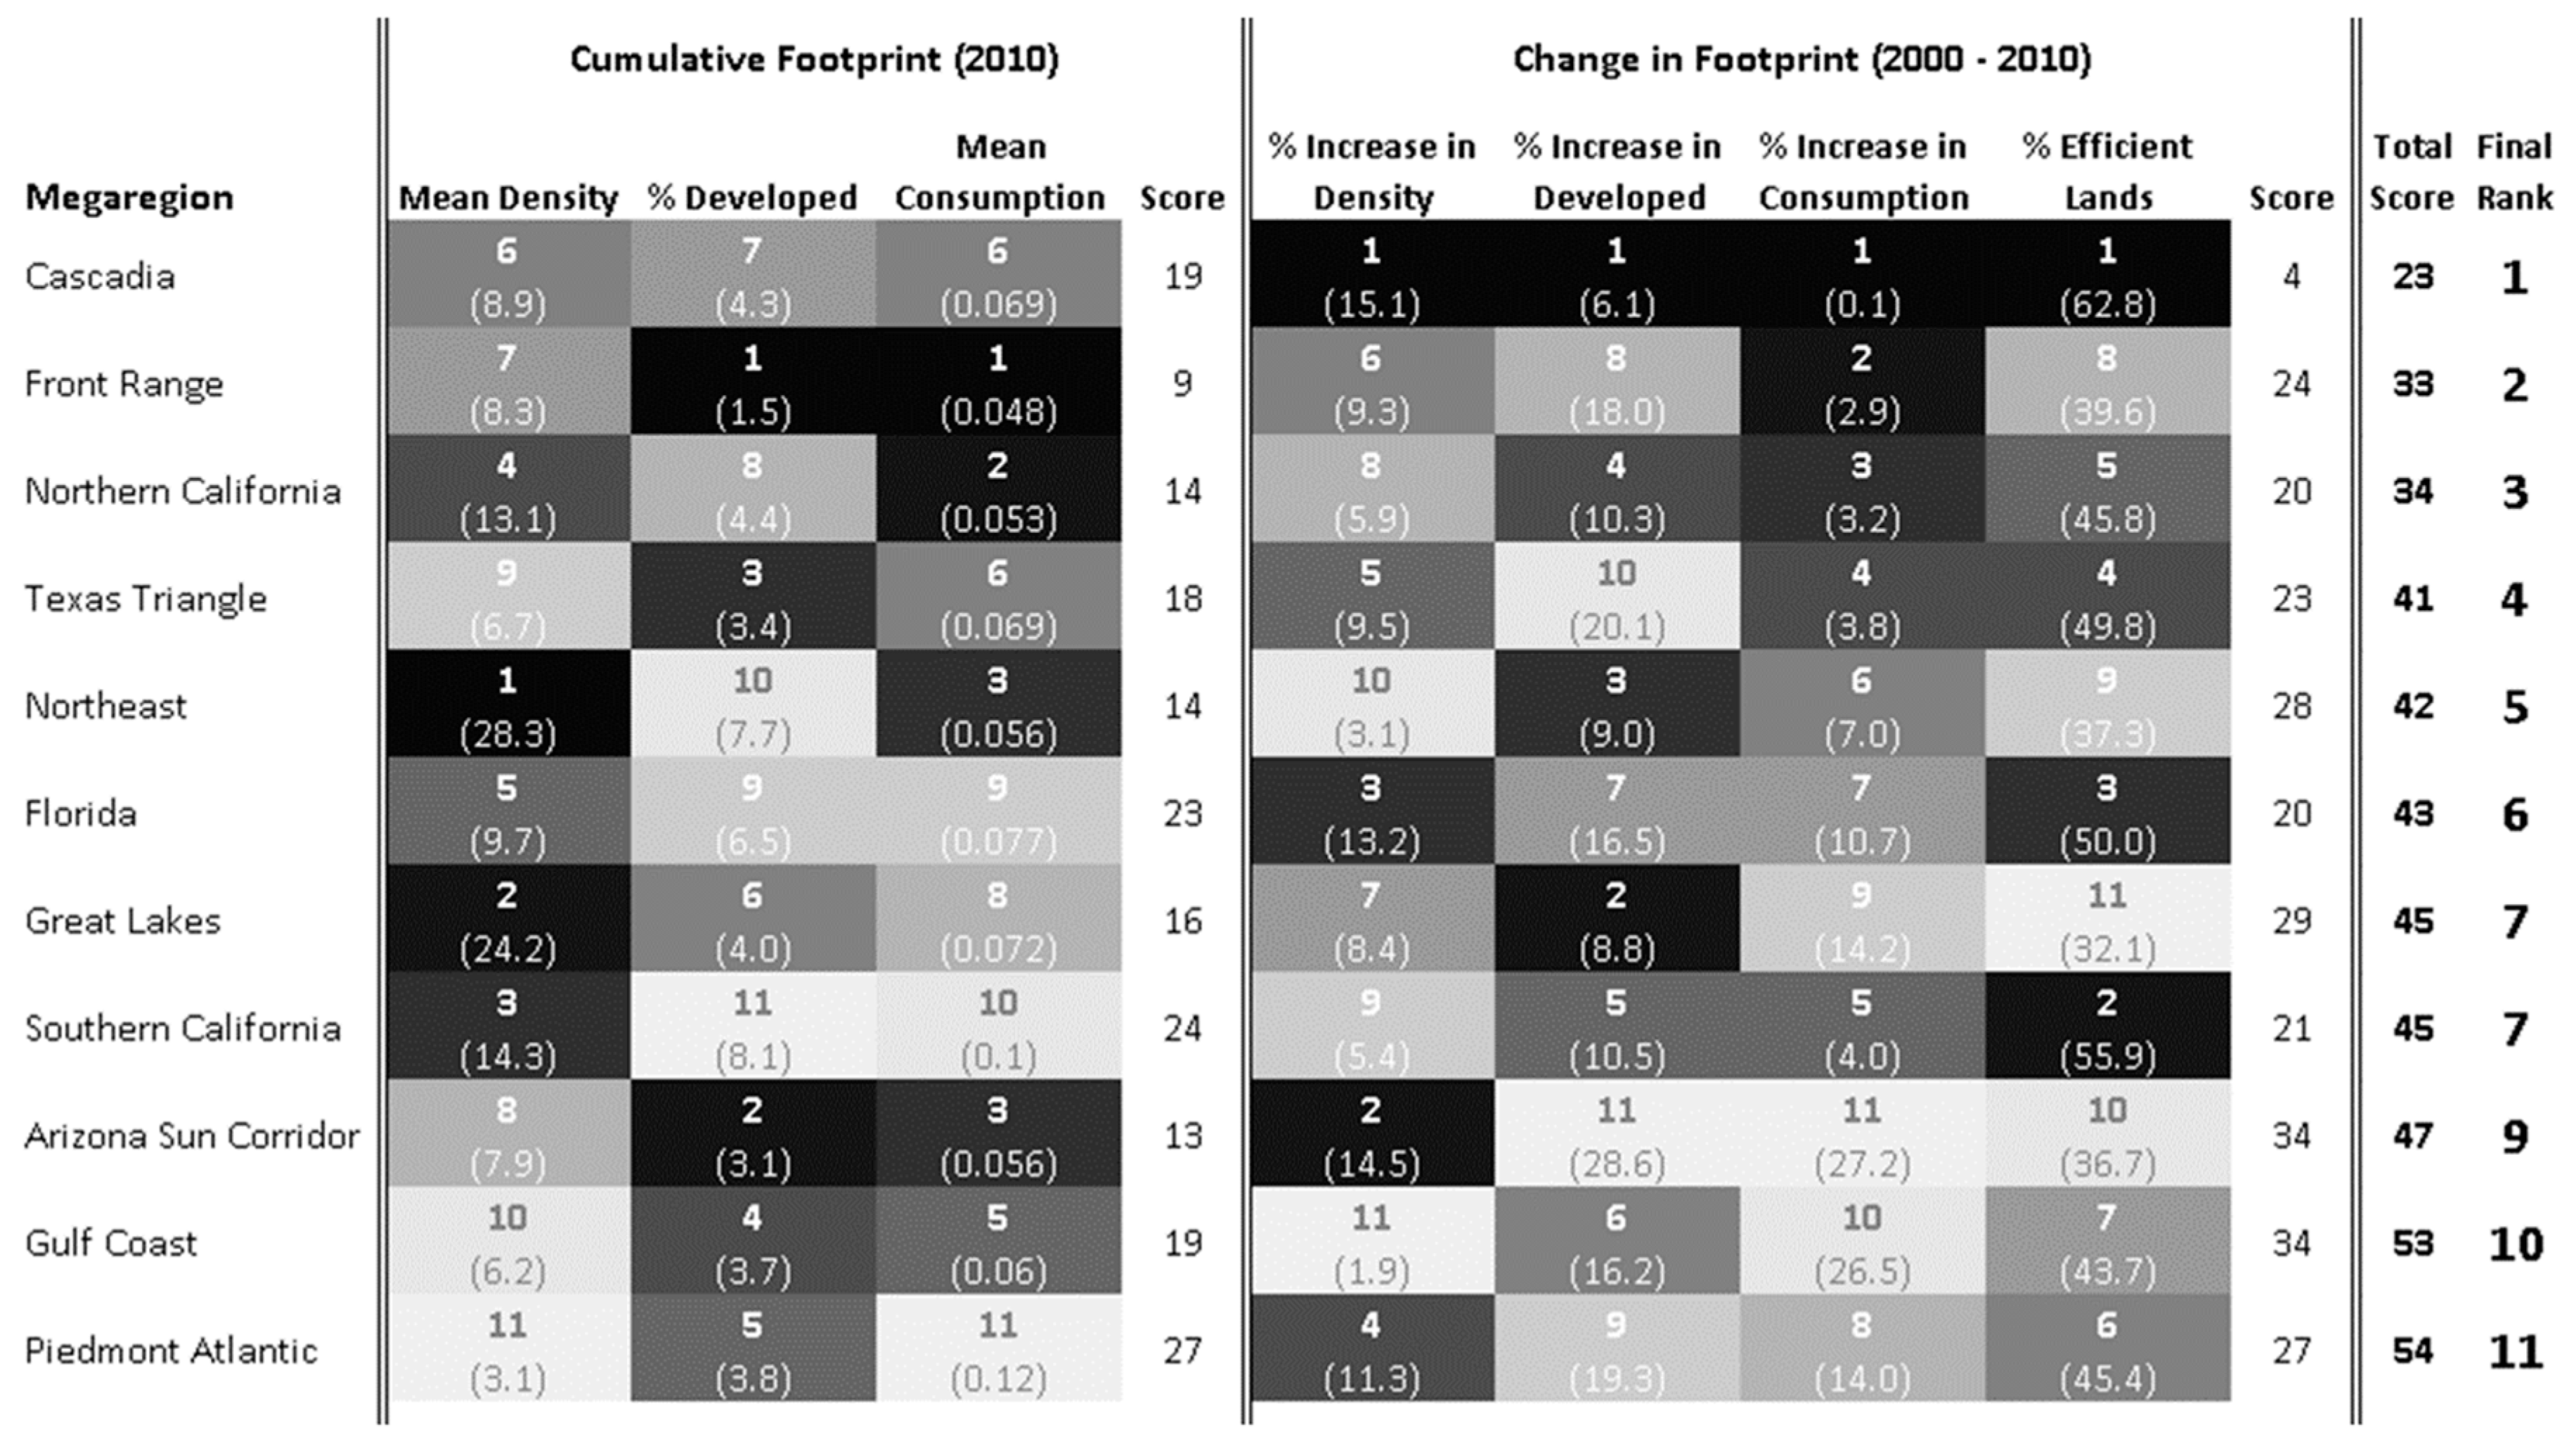
Table 1.
Change in area, impervious development, and per capita consumption for block groups that changed density class between 2000 and 2010.
Table 1.
Change in area, impervious development, and per capita consumption for block groups that changed density class between 2000 and 2010.
| Housing Density Transitions (00–10) | Land Area | New Impervious Development | Mean Per Capita Land Consumption | |||
|---|---|---|---|---|---|---|
| Area (km2) | % of Total Private Land | Area (km2) | % Change | 2000 (ha/Person) | 2010 (ha/Person) | |
| Rural to Exurban | 172,091.9 | 3.0 | 351.4 | 23.3 | 0.5 | 0.08 |
| Rural to Suburban | 1365.9 | 0.02 | 252.3 | 211.1 | 3.1 | 0.03 |
| Rural to Urban | 84.3 | 0.001 | 29.1 | 232.7 | 3.6 | 0.06 |
| Exurban to Suburban | 25,988.5 | 0.45 | 1543.1 | 47.8 | 0.12 | 0.03 |
| Exurban to Urban | 72.6 | 0.001 | 16.6 | 82.8 | 0.4 | 0.02 |
| Suburban to Urban | 1992.8 | 0.03 | 95.2 | 11.04 | 0.03 | 0.02 |
Publisher’s Note: MDPI stays neutral with regard to jurisdictional claims in published maps and institutional affiliations. |
© 2021 by the authors. Licensee MDPI, Basel, Switzerland. This article is an open access article distributed under the terms and conditions of the Creative Commons Attribution (CC BY) license (https://creativecommons.org/licenses/by/4.0/).
Share and Cite
MDPI and ACS Style
Vogler, J.B.; Vukomanovic, J. Trends in United States Human Footprint Revealed by New Spatial Metrics of Urbanization and Per Capita Land Change. Sustainability 2021, 13, 12852. https://0-doi-org.brum.beds.ac.uk/10.3390/su132212852
AMA Style
Vogler JB, Vukomanovic J. Trends in United States Human Footprint Revealed by New Spatial Metrics of Urbanization and Per Capita Land Change. Sustainability. 2021; 13(22):12852. https://0-doi-org.brum.beds.ac.uk/10.3390/su132212852
Chicago/Turabian StyleVogler, John B., and Jelena Vukomanovic. 2021. "Trends in United States Human Footprint Revealed by New Spatial Metrics of Urbanization and Per Capita Land Change" Sustainability 13, no. 22: 12852. https://0-doi-org.brum.beds.ac.uk/10.3390/su132212852
Note that from the first issue of 2016, this journal uses article numbers instead of page numbers. See further details here.