
Role of Mangrove Rehabilitation and Protection Plans on Carbon Storage in Yanbu Industrial City, Saudi Arabia: A Case Study

 , ,
, ,  ,
,  and
and 
Abstract
:1. Introduction
2. Materials and Methods
2.1. Study Site Characteristics
2.2. Sample Collection
2.3. Sample Analysis
2.4. Statistical Analysis
3. Results
4. Discussion
5. Conclusions
Author Contributions
Funding
Institutional Review Board Statement
Informed Consent Statement
Acknowledgments
Conflicts of Interest
References
- IPCC (Intergovernmental Panel on Climate Change). Climate Change 2007: Impacts, Adaptation, and Vulnerability. Contribution of Working Group II to the Fourth Assessment Report of the Intergovernmental Panel on Climate Change; Parry, M., Canziani, O., Palutikof, J., van der Linden, P., Hanson, C., Eds.; Cambridge University Press: Cambridge, UK, 2007. [Google Scholar]
- El-Sheikh, M.A.; Al-Oteiby, S.A.; Alfarhan, A.H.; Barcelo, D.; Picó, Y.; Alatar, A.A.; Javed, S.B.; Eid, E. Distribution of soil organic carbon in Wadi Al-Thulaima, Saudi Arabia: A hyper-arid habitat altered by wastewater reuse. Catena 2018, 170, 266–271. [Google Scholar] [CrossRef]
- Post, W.M.; Emanuel, W.R.; Zinke, P.J.; Stangenberger, A.G. Soil carbon pools and world life zones. Nat. Cell Biol. 1982, 298, 156–159. [Google Scholar] [CrossRef]
- Prabha, A.S.; Senthivelu, M.; Paramasivam, A. Carbon Sequestration Potential in Different Land Uses: A Review. Int. J. Environ. Res. Dev. 2019, 15, 727–736. [Google Scholar]
- Lal, R. Soil Carbon Sequestration Impacts on Global Climate Change and Food Security. Science 2004, 304, 1623–1627. [Google Scholar] [CrossRef] [Green Version]
- Atwood, T.B.; Connolly, R.M.; Almahasheer, H.; Carnell, P.E.; Duarte, C.M.; Lewis, C.J.E.; Irigoien, X.; Kelleway, J.J.; Lavery, P.S.; Macreadie, P.I.; et al. Global patterns in mangrove soil carbon stocks and losses. Nat. Clim. Chang. 2017, 7, 523–528. [Google Scholar] [CrossRef]
- Eid, E.M.; El-Bebany, A.F.; Alrumman, S.A. Distribution of soil organic carbon in the mangrove forests along the southern Saudi Arabian Red Sea coast. Rend. Lince 2016, 27, 629–637. [Google Scholar] [CrossRef]
- Sanderman, J.; Hengl, T.; Fiske, G.; Solvik, K.; Adame, M.F.; Benson, L.; Bukoski, J.J.; Carnell, P.; Cifuentes-Jara, M.; Donato, D.; et al. A global map of mangrove forest soil carbon at 30 m spatial resolution. Environ. Res. Lett. 2018, 13, 055002. [Google Scholar] [CrossRef]
- Ragavan, P.; Sivakumar, K.; Jayaraj, R.; Mohan, P.; Rana, T. Carbon storage potential of mangroves–are we missing the boat? Curr. Sci. 2019, 116, 889–891. [Google Scholar] [CrossRef]
- Chen, S.; Chen, B.; Chen, G.; Ji, J.; Yu, W.; Liao, J.; Chen, G. Higher soil organic carbon sequestration potential at a rehabilitated mangrove comprised of Aegiceras corniculatum compared to Kandelia obovata. Sci. Total. Environ. 2021, 752, 142279. [Google Scholar] [CrossRef]
- Rovai, A.S.; Coelho, C., Jr.; de Almeida, R.; Cunha-Lignon, M.; Menghini, R.P.; Twilley, R.R.; Cintrón-Molero, G.; Schaeffer-Novelli, Y. Ecosystem-level carbon stocks and sequestration rates in mangroves in the Cananéia-Iguape lagoon estuarine system, southeastern Brazil. For. Ecol. Manag. 2021, 479, 118553. [Google Scholar] [CrossRef]
- Adame, M.F.; Santini, N.S.; Torres-Talamante, O.; Rogers, K. Mangrove sinkholes (cenotes) of the Yucatan Peninsula, a global hotspot of carbon sequestration. Biol. Lett. 2021, 17, 20210037. [Google Scholar] [CrossRef]
- Arshad, M.; Alrumman, S.A.; Eid, E.M. Evaluation of carbon sequestration in the sediment of polluted and non-polluted locations of mangroves. Fundam. Appl. Limnol. 2018, 192, 53–64. [Google Scholar] [CrossRef]
- Tan, K.H. Soil Sampling, Preparation, and Analysis; CRC Press: Boca Raton, FL, USA, 2005. [Google Scholar]
- Bernal, B.; Mitsch, W.J. A comparison of soil carbon pools and profiles in wetlands in Costa Rica and Ohio. Ecol. Eng. 2008, 34, 311–323. [Google Scholar] [CrossRef]
- Kent, M. Vegetation Description and Data Analysis: A Practical Approach; John Wiley & Sons: Hoboken, NJ, USA, 2011. [Google Scholar]
- Wilke, B.-M. Determination of Chemical and Physical Soil Properties. In Monitoring and Assessing Soil Bioremediation; Margesin, R., Schinner, F., Eds.; Springer Berlin Heidelberg: Berlin/Heidelberg, Germany, 2005; pp. 47–95. [Google Scholar]
- Jones, J.B. Laboratory Guide for Conducting Soil Tests and Plant Analysis; CRC Press: Boca Raton, FL, USA, 2001. [Google Scholar]
- Ouyang, X.; Lee, S.Y. Improved estimates on global carbon stock and carbon pools in tidal wetlands. Nat. Commun. 2020, 11, 1–7. [Google Scholar] [CrossRef] [Green Version]
- Meersmans, J.; De Ridder, F.; Canters, F.; De Baets, S.; Van Molle, M. A multiple regression approach to assess the spatial distribution of Soil Organic Carbon (SOC) at the regional scale (Flanders, Belgium). Geoderma 2008, 143, 1–13. [Google Scholar] [CrossRef]
- Mokany, K.; Raison, R.J.; Prokushkin, A.S. Critical analysis of root: Shoot ratios in terrestrial biomes. Glob. Chang. Biol. 2006, 12, 84–96. [Google Scholar] [CrossRef]
- Goslee, K.; Walker, S.M.; Grais, A.; Murray, L.; Casarim, F.; Brown, S. Module C-CS: Calculations for Estimating Carbon Stocks. Leaf Technical Guidance Series for the Development of a Forest Carbon Monitoring System for REDD+; Winrock International: Little Rock, AR, USA, 2016. [Google Scholar]
- Drewry, J.J.; Cameron, K.C.; Buchan, G.D. Pasture yield and soil physical property responses to soil compaction from treading and grazing—a review. Soil Res. 2008, 46, 237–256. [Google Scholar] [CrossRef]
- Chaudhari, P.R.; Ahire, D.V.; Ahire, V.D.; Chkravarty, M.; Maity, S. Soil bulk density as related to soil texture, organic matter content and available total nutrients of Coimbatore soil. Int. J. Sci. Res. Publ. 2013, 3, 1–8. [Google Scholar]
- Arifanti, V.; Kauffman, J.B.; Hadriyanto, D.; Murdiyarso, D.; Diana, R. Carbon dynamics and land use carbon footprints in mangrove-converted aquaculture: The case of the Mahakam Delta, Indonesia. For. Ecol. Manag. 2019, 432, 17–29. [Google Scholar] [CrossRef]
- Cameron, C.; Hutley, L.; Friess, D.A.; Brown, B. Community structure dynamics and carbon stock change of rehabilitated mangrove forests in Sulawesi, Indonesia. Ecol. Appl. 2019, 29, e01810. [Google Scholar] [CrossRef] [Green Version]
- Eid, E.M.; Arshad, M.; Shaltout, K.H.; El-Sheikh, M.A.; Alfarhan, A.H.; Picó, Y.; Barcelo, D. Effect of the conversion of mangroves into shrimp farms on carbon stock in the sediment along the southern Red Sea coast, Saudi Arabia. Environ. Res. 2019, 176, 108536. [Google Scholar] [CrossRef]
- Perera, K.; Amarasinghe, M. Carbon sequestration capacity of mangrove soils in micro tidal estuaries and lagoons: A case study from Sri Lanka. Geoderma 2019, 347, 80–89. [Google Scholar] [CrossRef]
- Pérez, A.; Machado, W.; Gutierrez, D.; Stokes, D.; Sanders, L.; Smoak, J.M.; Santos, I.; Sanders, C.J. Changes in organic carbon accumulation driven by mangrove expansion and deforestation in a New Zealand estuary. Estuar. Coast. Shelf Sci. 2017, 192, 108–116. [Google Scholar] [CrossRef]
- Eid, E.; Shaltout, K. Distribution of soil organic carbon in the mangrove Avicennia marina (Forssk.) Vierh. along the Egyptian Red Sea Coast. Reg. Stud. Mar. Sci. 2016, 3, 76–82. [Google Scholar] [CrossRef]
- Bhomia, R.K.; MacKenzie, R.A.; Murdiyarso, D.; Sasmito, S.D.; Purbopuspito, J. Impacts of land use on Indian mangrove forest carbon stocks: Implications for conservation and management. Ecol. Appl. 2016, 26, 1396–1408. [Google Scholar] [CrossRef] [Green Version]
- Almahasheer, H.; Serrano, O.; Duarte, C.M.; Ortiz, A.A.; Masque, P.; Irigoien, X. Low Carbon sink capacity of Red Sea mangroves. Sci. Rep. 2017, 7, 1–10. [Google Scholar] [CrossRef] [Green Version]
- Almahasheer, H.; Duarte, C.M.; Irigoien, X. Nutrient Limitation in Central Red Sea Mangroves. Front. Mar. Sci. 2016, 3, 271. [Google Scholar] [CrossRef] [Green Version]
- Santos, D.; Estrada, G.C.; Fernandez, V.; Estevam, M.R.; Souza, B.T.; Soares, M.L. First assessment of carbon stock in the below-ground biomass of Brazilian mangroves. An. Acad. Bras. Cienc. 2017, 89, 1579–1589. [Google Scholar] [CrossRef] [Green Version]
- Kauffman, J.B.; Bernardino, A.F.; Ferreira, T.O.; Bolton, N.W.; Gomes, L.E.D.O.; Nobrega, G.N. Shrimp ponds lead to massive loss of soil carbon and greenhouse gas emissions in northeastern Brazilian mangroves. Ecol. Evol. 2018, 8, 5530–5540. [Google Scholar] [CrossRef]
- Kauffman, J.B.; Bernardino, A.; Ferreira, T.O.; Giovannoni, L.R.; Gomes, L.E.D.O.; Romero, D.J.; Jimenez, L.C.Z.; Ruiz, F. Carbon stocks of mangroves and salt marshes of the Amazon region, Brazil. Biol. Lett. 2018, 14, 20180208. [Google Scholar] [CrossRef]


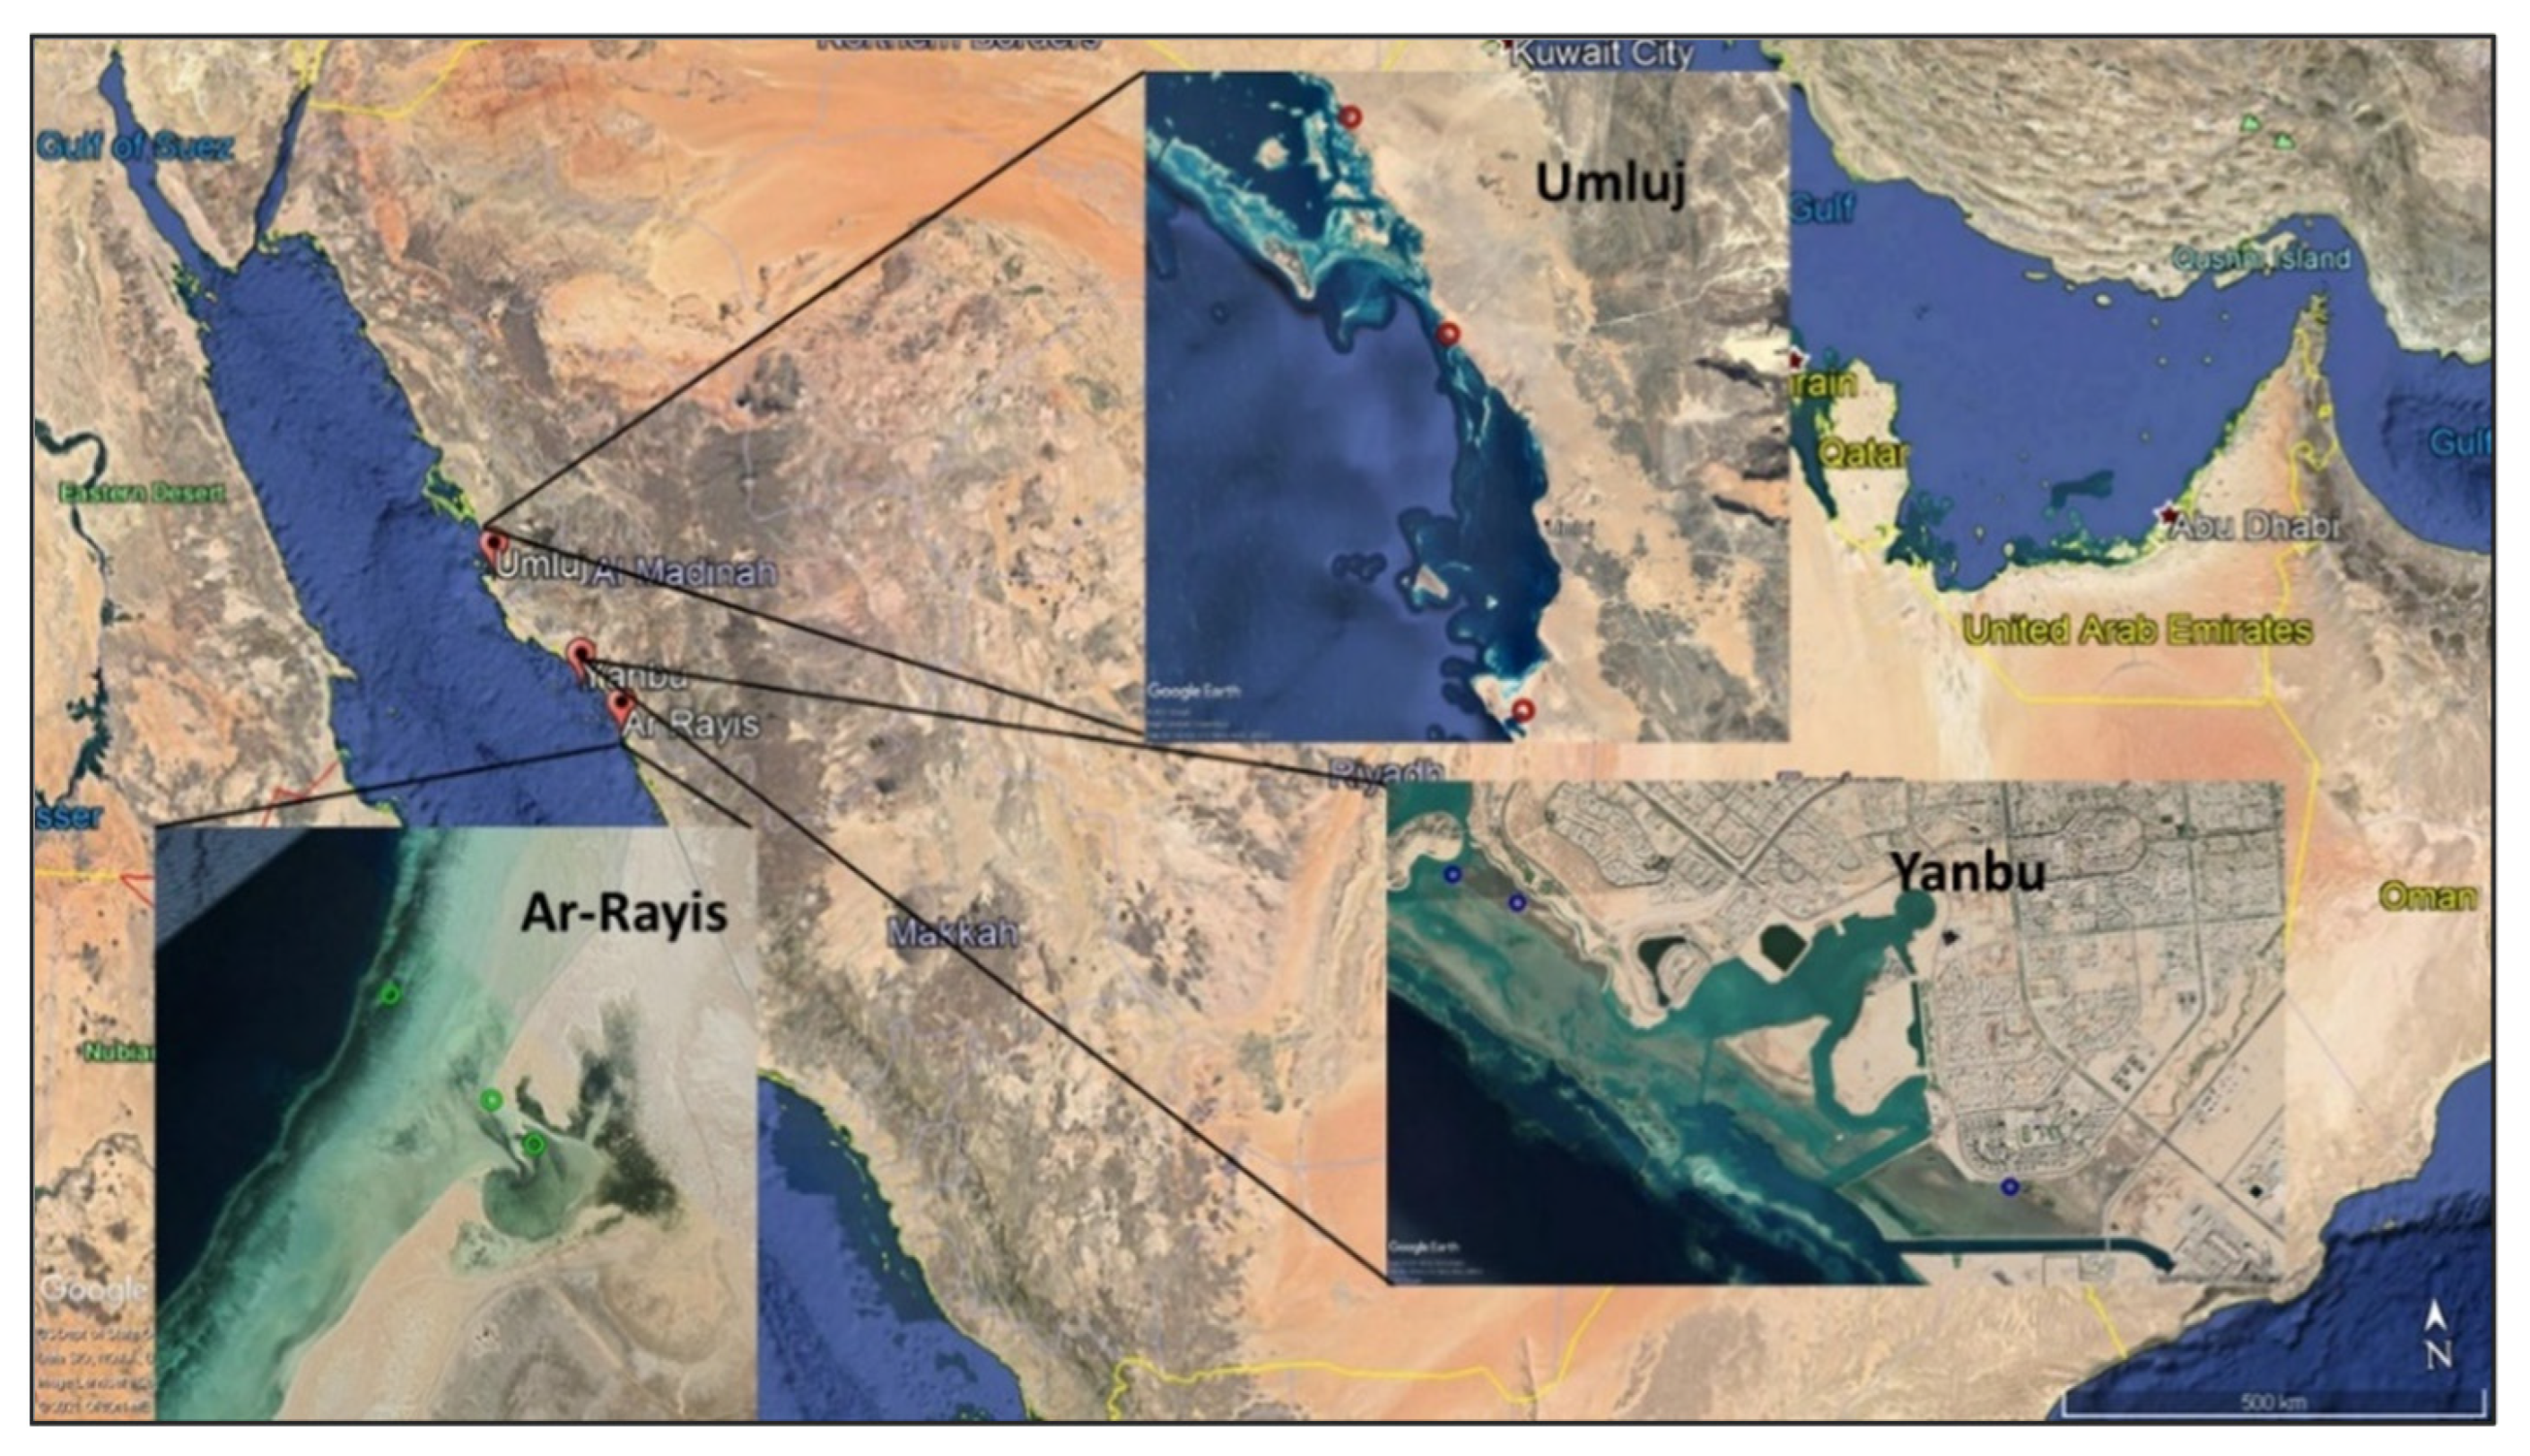
| Stand No. | Area | Latitude | Longitude |
|---|---|---|---|
| 1 | Yanbu | 24°0′7.20″ N | 38°9′18.00″ E |
| 2 | Yanbu | 24°0′0.00″ N | 38°9′36.00″ E |
| 3 | Yanbu | 23°58′48.00″ N | 38°11′52.80″ E |
| 4 | Umluj | 24°47′38.40″ N | 37°13′40.80″ E |
| 5 | Umluj | 25°18′25.20″ N | 37°6′57.60″ E |
| 6 | Umluj | 25°36′10.80″ N | 36°57′57.60″ E |
| 7 | Ar-Rayis | 23°35′52.80″ N | 38°32′20.40″ E |
| 8 | Ar-Rayis | 23°35′52.80″ N | 38°32′27.60″ E |
| 9 | Ar-Rayis | 23°35′52.80″ N | 38°32′2.40″ E |
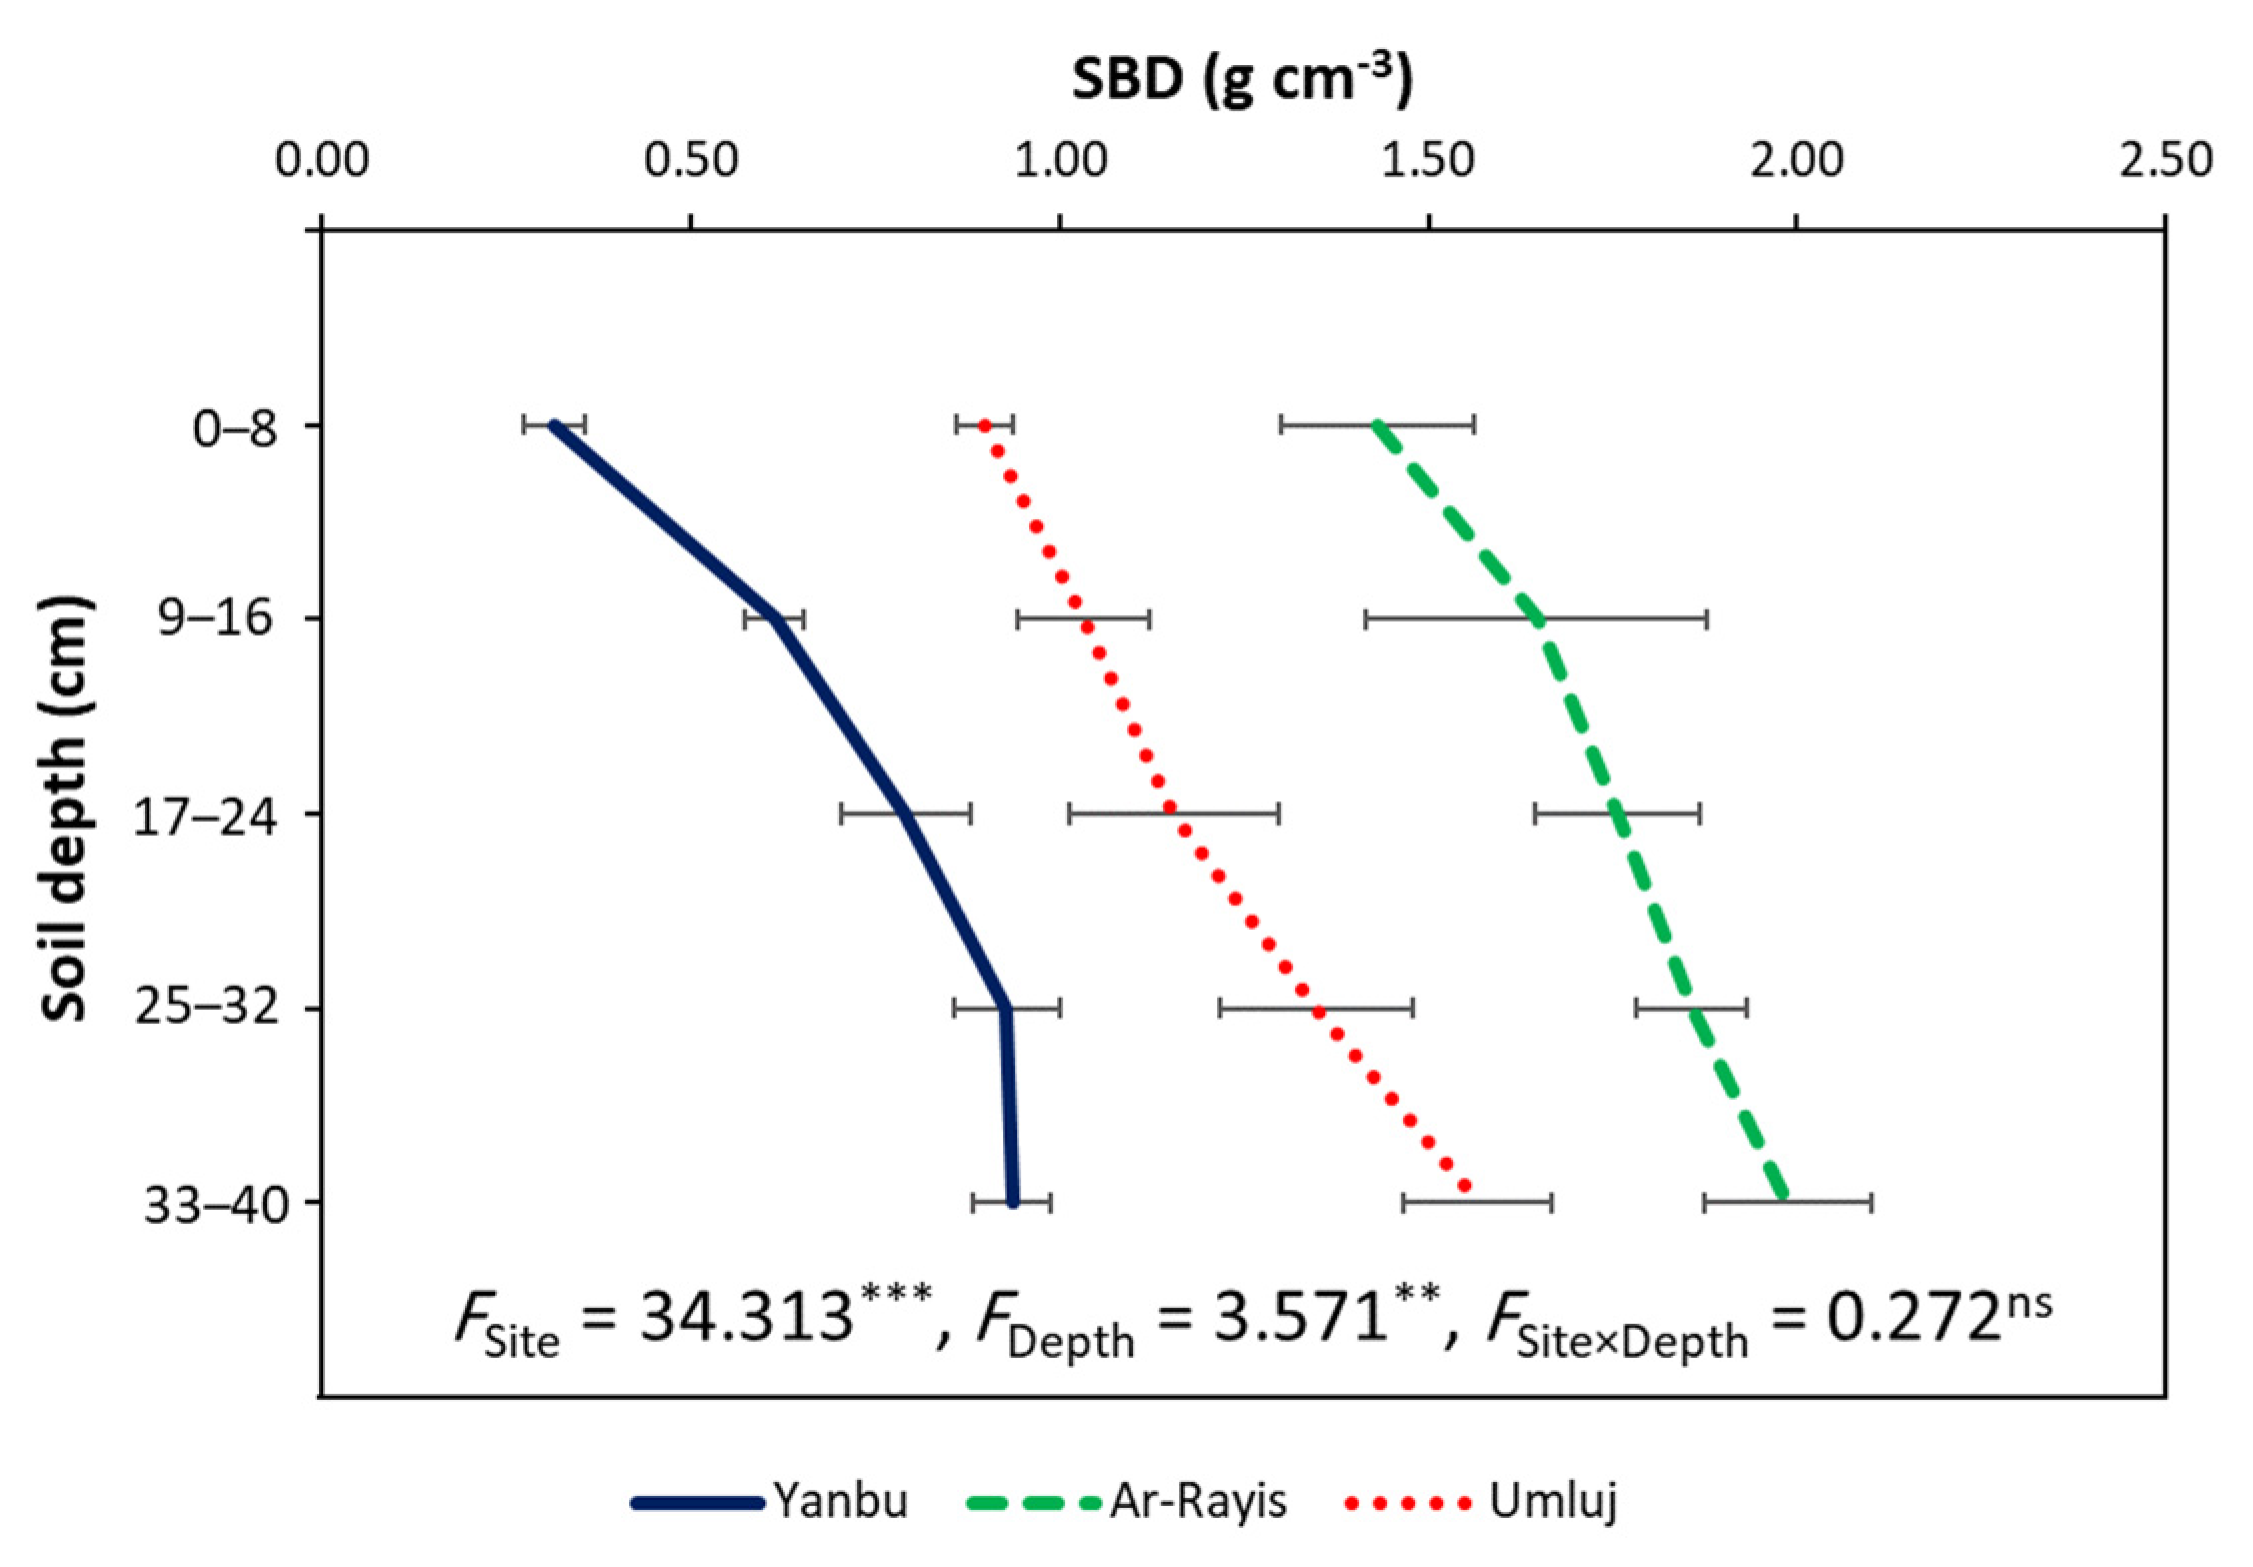
| Site | SBD (g cm−3) | SOC (g C kg−1) | SOC Stock (t C ha−1) | POC Stock (t C ha−1) |
|---|---|---|---|---|
| Yanbu | 0.72 ± 0.14 a | 165.18 ± 14.85 a | 0.39 ± 0.03 a | 13.93 ± 1.01 a |
| Ar-Rayis | 1.20 ± 0.30 b | 25.99 ± 4.86 b | 0.11 ± 0.01 b | 8.80 ± 0.71 b |
| Umluj | 1.74 ± 0.31 c | 38.90 ± 5.21 b | 0.12 ± 0.02 b | 8.06 ± 0.88 b |
| F-value 1 | 30.41 *** | 57.13 *** | 40.84 *** | 10.21 * |
Publisher’s Note: MDPI stays neutral with regard to jurisdictional claims in published maps and institutional affiliations. |
© 2021 by the authors. Licensee MDPI, Basel, Switzerland. This article is an open access article distributed under the terms and conditions of the Creative Commons Attribution (CC BY) license (https://creativecommons.org/licenses/by/4.0/).
Share and Cite
Al-Guwaiz, S.M.; Alatar, A.A.; El-Sheikh, M.A.; Al-Gehni, G.A.; Faisal, M.; Qahtan, A.A.; Abdel-Salam, E.M. Role of Mangrove Rehabilitation and Protection Plans on Carbon Storage in Yanbu Industrial City, Saudi Arabia: A Case Study. Sustainability 2021, 13, 13149. https://0-doi-org.brum.beds.ac.uk/10.3390/su132313149
Al-Guwaiz SM, Alatar AA, El-Sheikh MA, Al-Gehni GA, Faisal M, Qahtan AA, Abdel-Salam EM. Role of Mangrove Rehabilitation and Protection Plans on Carbon Storage in Yanbu Industrial City, Saudi Arabia: A Case Study. Sustainability. 2021; 13(23):13149. https://0-doi-org.brum.beds.ac.uk/10.3390/su132313149
Chicago/Turabian StyleAl-Guwaiz, Sarah M., Abdulrahman A. Alatar, Mohamed A. El-Sheikh, Ghazi A. Al-Gehni, Mohammad Faisal, Ahmed A. Qahtan, and Eslam M. Abdel-Salam. 2021. "Role of Mangrove Rehabilitation and Protection Plans on Carbon Storage in Yanbu Industrial City, Saudi Arabia: A Case Study" Sustainability 13, no. 23: 13149. https://0-doi-org.brum.beds.ac.uk/10.3390/su132313149