Article

Sustainability Assessment of the Rare-Earth-Oxide Production Process and Comparison of Environmental Performance Improvements Based on Emergy Analysis

School of Metallurgy, Liaoning Province Key Laboratory of Metallurgical Resources Recycling Science, Northeastern University, Shenyang 110819, China
*
Author to whom correspondence should be addressed.
Sustainability 2021, 13(23), 13205; https://0-doi-org.brum.beds.ac.uk/10.3390/su132313205
Submission received: 29 October 2021 / Revised: 17 November 2021 / Accepted: 22 November 2021 / Published: 29 November 2021

Abstract

:
In recent years, the rapid development of the rare earth industry has had a serious impact on the environment. Some enterprises have taken measures to improve the production process. In order to explore the sustainability of this industry and these improvements’ environmental benefits, this paper combines emergy analysis and lifecycle assessment to evaluate and compare the production process of rare-earth oxides considering the three aspects of emergy flow, pollutant emissions, and emergy-based indicators. Changes in the emergy of pollutant emissions before and after improvement of the production process are discussed. The results show that the greatest inputs in the mining and beneficiation stage and smelting separation stage are labor force and service and non-renewable resources, respectively. These two production stages are highly dependent on external input and have weak competitiveness. Both stages place great pressure on the environment, so the bastnasite production process would be unsustainable in the long term. After the improvement, the environmental impact of the production process for bastnaesite changed significantly, indicating that the improvement effect of the wastewater treatment facilities and the change of fuel from coal to natural gas is remarkable.

1. Introduction

Rare-earth elements (REEs) are considered to be “monosodium glutamate in industry” and are classified as strategic resources due to their crucial uses in the production processes of several key industries. China has the largest known rare earth reserves worldwide. The data in [1] showed that China’s rare earth resource reserves totaled 44 million t at the end of 2018, which accounted for 38% of global rare earth reserves. Light rare-earth elements (LREEs) are mainly concentrated in the north of China, and heavy rare-earth elements (HREEs) are mainly concentrated in the south of China. The three major types of rare-earth minerals are mixed bastnaesite–monazite ore in Baotou, ion-absorbed rare earth deposits in the seven southern provinces, and bastnaesite in Sichuan. The rare earth industry of China has experienced rapid development since the “13th Five-Year Plan”. However, some problems have also emerged, such as the overexploitation of rare earth resources, serious damage to the environment, the irrational layout of the rare earth industry, and the accumulation of smelting and separation wastes. To exploit these resources reasonably and reduce environmental pressures, China has tightened regulations on, and issued standards for, the rare earth industry since 2011. For example, the policies of unified planning and total quota control were released to safeguard rare earth resources and enable their effective utilization. Meanwhile, small plants with serious pollution problems were shut down due to their lack of enterprise compliance. Emissions standards for pollutants from the rare earth industry (GB 26451-2011) were issued and implemented for the purposes of strengthening the prevention and control of pollution, protecting the environment, and facilitating the sustainable and healthy development of the rare earth industry [2]. Since 2014, the National Energy Administration has prohibited the construction of coal gasification projects with annual outputs of two billion cubic meters or less. Therefore, some companies have gradually switched to using natural gas as a fuel. After implementation of the above measures, it remained unclear whether the environmental impacts of the rare earth industry had been improved, which requires further research. Hence, it is necessary for the rare earth industry to select an appropriate systematic method to conduct a complete, scientific, and objective industrial evaluation.
In recent years, some researchers have used various systematic methods to evaluate the environmental impacts of the rare earth industry. For instance, Bailey et al. [3] adopted life-cycle assessment (LCA) to investigate the environmental impacts of rare-earth-element production from bastnaesite, ionic rare earth, and monazite ores. Yu et al. [4] found the cause of pollution from a typical rare-earth mine in southern Jiangxi and proposed corresponding environmental protection measures. Geng et al. [5] conducted a static material flow analysis of neodymium, a rare-earth element, and quantitatively analyzed the structure of the industrial chain of neodymium in China. Yao et al. [6] combined a BP neural network with a GIS to assess rare earth mines’ geological environments. Huang et al. [7] used Eco-LCA to evaluate the multiple environmental impacts caused by the production processes of ionic rare-earth elements. However, most of these methods ignored the hidden contributions of natural ecosystems and socio-economic systems and did not take into account external influences, such as procurement inputs. Therefore, these studies cannot comprehensively quantify the environmental and economic impacts of the rare earth industry and, therefore, cannot reasonably assess its environmental characteristics.
Emergy analysis, first proposed by H.T. Odum [8], is an important environmental accounting method that can effectively evaluate sustainable development initiatives. This type of analysis reveals the relationship between nature and the human economy and society and provides a standard for the conversion of energy flow, material flow, and currency flow. Emergy is defined as the amount of energy used either directly or indirectly to provide a service or make product, in units of solar-equivalent joules (sej) [9]. Emergy analysis can not only calculate the true value of natural resources but also includes the calculation of various ecosystem service values [10], human labor and culture, etc. [11,12]. Initially, this method was applied to evaluate the sustainability of complex systems, such as the evaluation of the coastal ecosystem in Texas, the United States [13]; grain cultivation [14]; nature reserves [15]; etc., but there are few studies on the industrial ecosystem. Emergy analysis is still developing and improving. Moreover, traditional emergy analysis lacks the evaluation of waste discharge and ecological economic benefits [16]. For example, Wang et al. [17] applied emergy analysis to the systematic evaluation of a combined heat and power plant eco-industrial park (CHP plant EIP), but the impact of pollution emissions was not included in their research. Fadare et al. [18] performed an energy and cost analysis of organic fertilizer production in Nigeria, but the effect on the environment was not considered.
In recent years, researchers have optimized the methods to use emergy analysis to quantify pollutant emissions and the loss of ecological services. By improving the emergy evaluation index, emergy analysis has been gradually introduced into industrial and energy production processes. Zhang et al. [19] used emergy analysis to study the sustainable development of China’s steel production from 1998 to 2004, while Zhang et al. [20] believed that almost all emergy was imported externally due to the high openness of the industrial production system. The authors improved the calculation method for the environmental loading rate and applied an improved method to evaluate the ecological benefits of the copper-based mixed-waste recycling process. Pan et al. [21] applied emergy analysis to the evaluation of an industrial park in Sichuan and considered the ecological services and ecological losses caused by pollutant discharge. Huang et al. [22] calculated the emergy flow of Jiangxi mining city’s industrial system, analyzed the trends of emergy efficiency, and studied the ecological efficiency index, while Zhang et al. [23] compared the performances of cement production before and after implementing heat recovery power generation based on improved emergy evaluation indicators. At the same time, increasingly more researchers are also seeking to combine emergy analysis with other environmental analysis methods to extend the application of emergy analysis. Commonly, this type of analysis is combined with life-cycle assessment (LCA). For example, Li et al. [24] combined LCA and emergy analysis to select the most sustainable modern hydrogen production technology; Yazdani et al. [25] adopted emergy analysis and LCA to compare traditional natural gas power generation and solid waste power generation, while Babaelahi et al. [26] used a combination of two methods to evaluate three options for waste-heat utilization in solar gas turbine power plants. The research of Santagata et al. [27] showed that although LCA and emergy analysis have many similarities in inventory construction and result interpretation, they have great differences in the research perspectives. Life-cycle assessment is based on the consumer’s perspective, while emergy analysis is based on the giver’s perspective. The authors then proposed a procedure to integrate the two methods. De Souza et al. [28] argued that these similarities and differences between LCA and emergy analysis also show potential complementarities. Most notably, when implementing circular practices, these analyses can enable decision makers to effectively improve the environmental performance of their production processes.
Rare-earth minerals are valuable but non-renewable. It is thus essential to explore how the rare earth industry can develop sustainably. Currently, LCA is the main method used for evaluation of the rare earth industry, which focuses on the analysis of environmental impacts. In practice, however, it is necessary to employ a comprehensive quantitative analysis that unifies both the natural ecosystem and the socio-economic system to model industrial processes. Liu et al. [29] explored the application of emergy analysis in the production process evaluation of mixed bastnaesite–monazite ore in Bayan Obo. Huang et al. [7] adopted ecological cumulative exergy consumption analysis to evaluate the production process of ion-absorbed rare earth deposits. Ion-absorbed rare earth deposits are heavy rare-earth ores, while bastnaesite and mixed bastnaesite–monazite are light rare-earth ores. Due to differences in ore properties, the mining processes and smelting separation processes of the three ores are different. At present, comprehensive evaluation of the production process of bastnaesite is lacking in the literature. To systematically evaluate the ecological and environmental impacts from the production processes of bastnaesite, this paper combines emergy analysis and LCA to account for the emergy of the production process of bastnaesite in Sichuan, China. We analyze the composition and sources of emergy loss, discuss changes to the emergy of pollutant emissions before and after improvement of the production processes, and propose specific suggestions to provide a useful theoretical basis for the sustainable development of the rare earth industry. Simultaneously, this paper will enrich the literature on emergy analysis and promote the application of emergy analysis in industrial production systems.

2. Materials and Methods

2.1. Introduction of the Case Study

The case in this study is located in Sichuan Province, China. The study region has a subtropical monsoon climate, with an average annual wind speed of 1.5 m/s in 2018. In this research, the raw material is bastnaesite, and the annual output of rare-earth oxide products is about 5000 t. Bastnaesite mainly contains light rare earths, in which the proportion of elements such as lanthanum, cerium, praseodymium, and neodymium is more than 98%, and the grade of the raw ore is 1–3%. Compared with the mixed bastnaesite–monazite ore in Bayan Obo, which is also a light rare-earth ore, bastnaesite has a single structure and is relatively easy to smelt. However, the smelting and separation processes of bastnaesite remain complex. Bastnaesite is mined in an open pit, and then 70% grade rare-earth concentrate is obtained by the magnetic–gravity–flotation process. The acid and alkali combination digestion method is used for the rare-earth concentrate to produce rare-earth oxides. In detail, the rare-earth concentrate is roasted at a low temperature in a rotary electric roasting kiln, and the roasted material is de-ironed and immersed in hydrochloric acid to obtain the rare-earth chloride solution and primary filter residue, respectively. Then, the primary filter residue is decomposed under pressure and caustic soda, and the resulting filter residue is acid-dissolved to prepare a mixed rare-earth chloride solution. The extraction process is applied to turn the mixed rare-earth solution into a single rare-earth solution. A precipitating agent, such as oxalic acid or sodium carbonate, is then added to the single rare-earth chloride solution to produce precipitation, which is burned in a roller kiln and a rotary kiln to generate a single rare-earth oxide.
In the production process, the main raw materials include bastnaesite, diesel, sodium silicate, sodium hydroxide, hydrochloric acid, lime, fuel, extraction agent P507, and other chemical reagents. In order to reduce the environmental impacts in the process of rare-earth mining and production, this plant upgraded its pollution abatement equipment and fuels. For example, new devices such as tailing tanks and dryers were installed, and the operating range of the open water treatment station was expanded in the mining and beneficiation stage so that all the production wastewater could be treated and reused without being discharged. In the smelting and separation stage, the fuel required for production was changed from coal gasification to natural gas following the requirements of the National Energy Administration. In this system, natural gas is supplied to boiler combustion and gas roller kilns and rotary kilns, while other roasting kilns, centrifuges, and machines use electricity. The waste gas is also treated by the purification tower, absorption tower, and other treatment facilities before being discharged into the atmosphere. This paper calculates and analyzes the emergy of current production processes and compares the environmental benefits before and after the improvement.

2.2. Methods

This study aims to evaluate economic, environmental, and social sustainability based on emergy analysis and life-cycle assessment. The emergy of the product includes the emergy of input flows, such as raw materials and investments, as well as the emergy generated by the discharge of various pollutants. In order to better evaluate the environmental sustainability of the rare earth industry, emergy-based indicators were also calculated. This study included the following four steps. Firstly, the system boundary and energy flow of the bastnaesite’s industrial ecosystem were identified. Secondly, the emergy analysis table was calculated, and the relevant emergy evaluation indicators were determined. The third step was to assess the sustainability of the bastnaesite’s industrial ecosystem. Finally, some reasonable suggestions were proposed according to the evaluation results for the system’s sustainability. The functional unit in this study is 1 t rare-earth oxide.

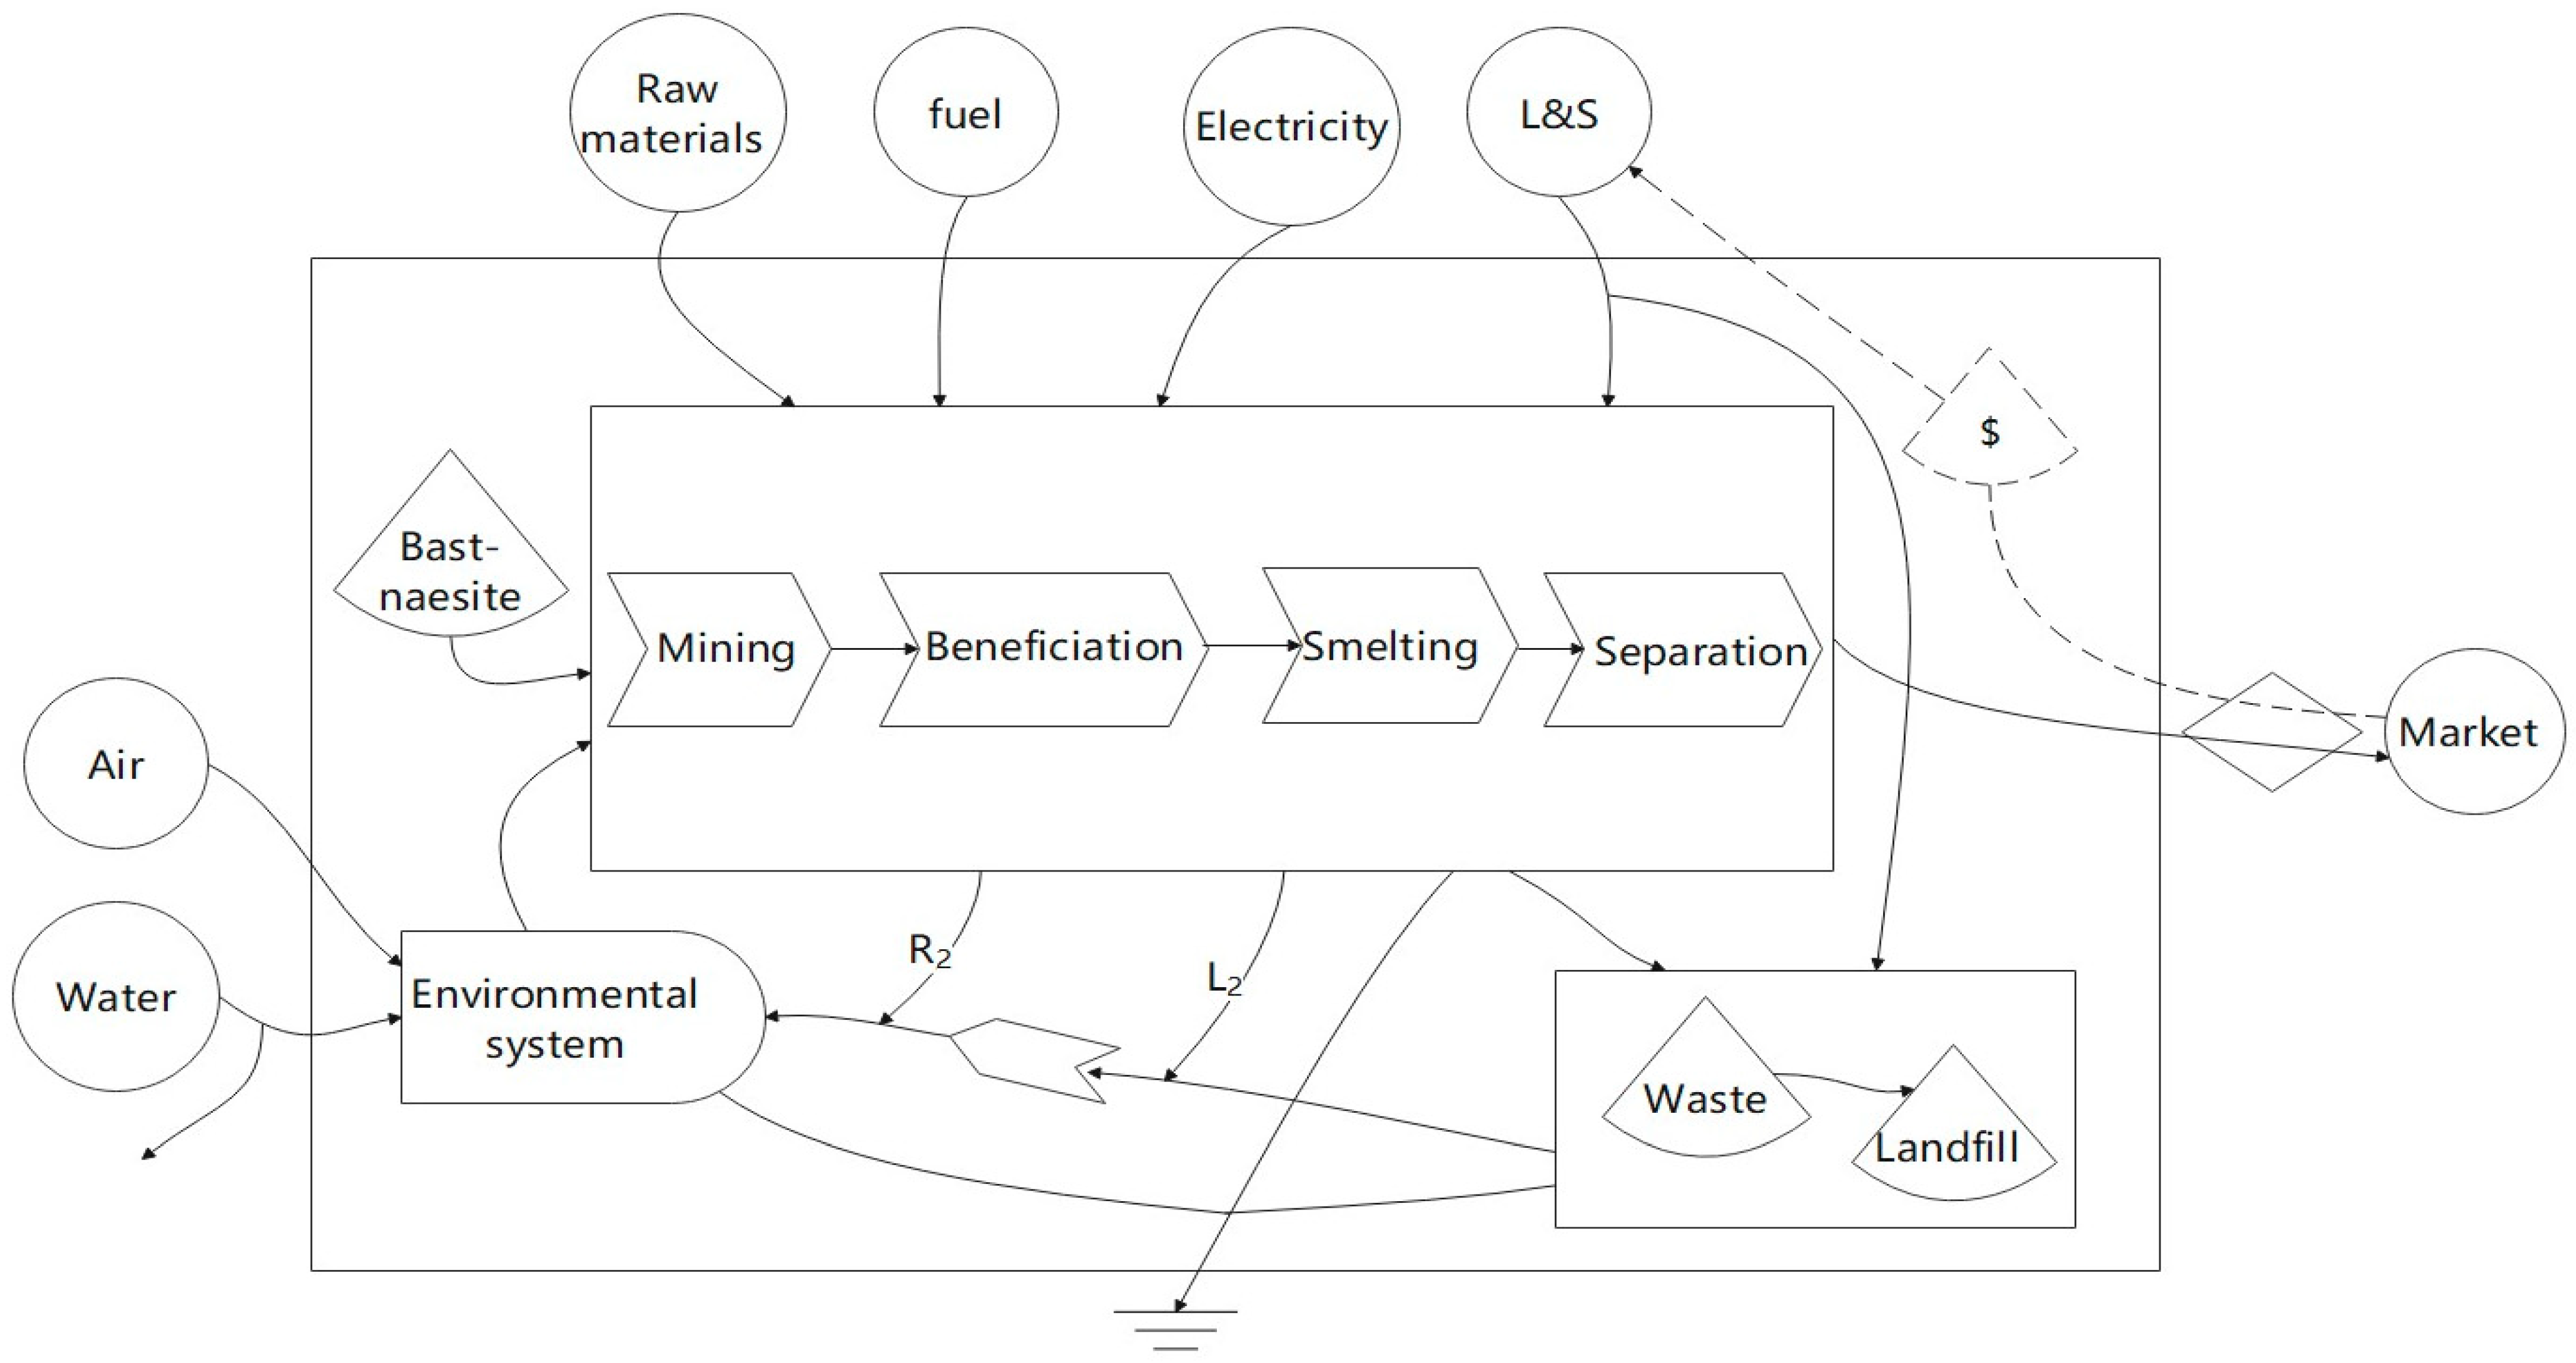
2.2.1. System Boundaries and Energy Flow

Figure 1 illustrates the emergy flow that defines the boundaries for the production process of bastnaesite in Sichuan, China. The total emergy input includes purchased renewable resources F1R (water, hydropower, nuclear power, and wind power from power grids), local non-renewable resources N1 (bastnaesite), and purchased non-renewable resources F1N (Diesel, sodium silicate, hydrochloric acid (31%), caustic soda (96%), calcium carbonate, oxalic acid, sodium carbonate, extraction agent P507, kerosene, sodium sulfide, sulfuric acid (98%), zinc powder, lime, sodium silicate, Diesel, natural gas, and thermal power). L&S is divided into labor force FL and service FS. FL includes managers, technicians, salespeople, assistants, and production staff. FS is the annual project investment. The outputs include product Y (rare-earth oxides) and waste discharge W (waste gas, wastewater, and solid waste). Quantification of the emissions’ impacts includes local extra ecological services used to dilute emission R2, damage to human health, and additional damage caused by land occupation for solid waste L2. The relevant calculation methods are introduced in Section 2.2.2 and Section 2.2.3.

2.2.2. Emergy Calculation Method of Input Flow

Emergy analysis can objectively evaluate the natural environment and economic and social impacts based on emergy, effectively link the natural ecosystem to the social ecosystem, and comprehensively quantify and analyze potential sustainable development factors [30]. The emergy value of a product or service can be calculated through its amount multiplied by the UEV (Unit Emergy Value) to convert different input flows into emergy units. The calculation formula (1) is as follows:
E i = Q i × U E V i
where i indicates the i-th input substance; E i represents the emergy value of the i-th substance (seJ); Q i is the quality of the i-th substance (kg); and U E V i is the unit emergy value of the i-th input for each of substance.
In previous studies, the emergy baseline is not unified due to the limitation of data. Most studies adopted the early standard of Odum et al. [9]. Here, we use 12 × 1024 seJ/y as the latest updated emergy baseline [31] to maintain the accuracy and rigor of the results.

2.2.3. Quantifying Emission Impacts

Quantitative emission impacts are divided into three parts: the ecological services required to dilute emissions, the emergy loss of human health damage, and the emergy loss of land occupied by solid waste landfills. In this case, the methods for quantifying emission impacts proposed by Ulgiati et al. (2002) [32] and Zhang et al. (2009b) [19] were adopted.
In the mining and beneficiation stage, the air pollutants considered included particulate matter, lead, cadmium, chromium, and arsenic, while the water pollutants considered included COD, ammonia–nitrogen, lead, chromium, cadmium, and arsenic. Due to the lack of a corresponding coefficient, the emission impacts caused by the atmospheric pollutants chromium, cadmium, and arsenic were not considered. The solid waste included mullock and tailings. After screening, the mullock is stored in a dumping site, and the tailings are stored in a tailing pond.
In the smelting and separation stage, the atmospheric pollutants considered included SO2, particulate matter, NOX, HCl, Cl2, non-methane hydrocarbon, and CO2, among which SO2, particulate matter, and NOX were calculated based on the pollutant discharge coefficient, and CO2 emissions were obtained from fuel consumption and the decomposition of ore. The water pollutants considered included COD, SS, ammonia–nitrogen, F, Cl, Pb, and oil. Due to the lack of a corresponding coefficient, the emission impacts caused by the atmospheric pollutants HCl, Cl2, and non-methane hydrocarbon, as well as the water pollutant SS, were not considered. The solid waste included acid-soluble residue, iron and thorium residue, lead residue, and wastewater from pre-treatment sedimentation residue. After treatment, the residues are placed in the tailing pond and partitioned storage.
(1)
Quantifying Ecological Services Required to Dilute Emissions
Generally, emissions that meet the relevant standards are still harmful. Few pollutants can be diluted through environmental self-purification to reach an environmentally acceptable concentration.
According to Zhang et al. (2009b) [19], the required mass of diluting air/water can be computed as follows:
M = d × W c
where M represents the required quantity of diluting air/water (kg/y); d is the density of air or water (1.293 kg/m3 or 1000 kg/m3); W refers to the annual emissions of one pollutant from the rare-earth production process (kg/y); and c is the concentration limits of the pollutants in local legislations or regulations (kg/m3).
Next, the emergy of ecological services required to dilute air emissions can be determined by Equation (3):
R 2 , a i r = E 2 , a i r × T r a i r = 1 2 × M a i r × V 2 × T r a i r
where   R 2 , a i r refers to the local extra ecological services used to dilute air emissions (sej/y); E 2 , a i r is the kinetic energy of the diluting air; V means the annual average wind speed (1.73 m/s for the study area) [33]; and T r a i r is the UEV of wind energy, which is 790 seJ/J [34] (based on the emergy baseline of 12 × 1024 seJ/a [31]);
R 2 , w a t e r = E 2 , w a t e r × T r c h e m , w a t e r = M w a t e r × G × T r c h e m , w a t e r
where R 2 , w a t e r is the local extra ecological service used to dilute water emissions (sej/y); T r c h e m , w a t e r is the UEV of the river, which is 52118.6 seJ/J [8] (based on the emergy baseline of 12 × 1024 seJ/a [31]); and G is the Gibbs free energy per unit of water relative to the reference value (seawater), which is 4.94 J/g [34];
R 2 = max ( R 2 , a i r ) + max ( R 2 , w a t e r ) .
The final value of ecological services equals the sum of the largest values of R 2 , a i r and R 2 , w a t e r , as shown in Equation (5).
(2)
Quantifying Emergy Loss Resulting from Environmental Emissions
Dilution emissions can lead to potential safety risks, such as damage to human health or land occupation. The impact of damage to human health can be seen as an additional investment. The PDF or DALY method has the advantage of using measurements or statistics to quantify an emission’s emergy loss. In this way, the DALY indicator is used to represent the damage to human health L 2 , h u m a n . L 2 , h u m a n can be computed using Equation (6):
L 2 , h u m a n = i = 1 n m i × D A L Y i × τ H
where i indicates the i-th pollutant, m i is the mass of the i-th pollutant chemicals released (kg/y), and D A L Y i is the E.I. 99 impact factor (DALY/kg of emissions), which is given on the website of the WHO [35]. τ H is defined as the ratio of the country or region’s total annual emergy compared to the population. In this case, τ H was 5.16 × 10¹⁶ seJ/person in 2018, according to the calculation method of Campbell et al. (2014) [36].
The rare-earth industrial ecosystem generates a large amount of solid waste, which inevitably causes additional emergy loss. Zhang et al. (2009) [19], Wang et al. (2006) [17], and Reza et al. (2014) [37] proposed some methods to measure the impacts of direct emissions on the ecosystem. The emergy loss caused by land occupation ( L 2 , s o i l d ) is determined as the occupied land area multiplied by the economic or environmental emergy intensity of this area. Notably, this method takes the annual output of solid waste as the research object, so it does not need to consider the time factor. Therefore, we adjusted the calculation with ecological cumulative exergy consumption. The emergy loss caused by land occupation ( L 2 , s o i l d ) can be calculated as follows:
L 2 , s o l i d = T r l a n d × M s , p O s × T i
where T r l a n d is the solar transformity of land area, which is 1.33 × 10¹⁵ seJ/ha [38] (based on the emergy baseline 12 × 1024 seJ/a [31]); M s , p is the emission quality of the p-th solid waste (kg); and O s is the quantity of solid wastes per unit area of land, which is 2.85 × 10⁴ t/ha [39]. T i stands for the landfill time required for solid waste mineralization.
The emergy loss caused by emissions is equal to the sum of L 2 , h u m a n and L 2 , solid , as shown in Equation (8):
L 2 = L 2 , h u m a n + L 2 , s o l i d

2.2.4. The Corresponding Emergy-Based Indicator System

To better evaluate the environmental sustainability of the rare earth industrial ecosystem, it is necessary to adopt some traditional emergy-based evaluation indicators. Traditional emergy analysis ignores the importance of waste in the ecosystem and usually focuses on systems with less waste. In this case, the discharge of solid waste is large, so it cannot be ignored. Moreover, some researchers have not considered labor and service factors. Therefore, traditional emergy analysis cannot accurately measure environmental impacts. According to Lou et al. [16], Cao et al. [40], and Pan et al. [41], some traditional and improved emergy-based indicators can be calculated here as follows:
(1). Emergy investment ratio (EIR) [16]. The EIR is defined as the ratio of purchased emergy to the sum of nonrenewable and renewable emergy input. EIR can reflect the economic development and environmental impacts of local resources. If the EIR is too low, then the system is heavily dependent on local resources, hindering the inflow of funds and development. When the EIR is higher, almost all the inputs are paid, which causes price increases and weakens the competitive ability of the system.
E I R = F 1 R + F 1 N + F L + F S N 1 + R 1
(2). Improved emergy yield ratio (IEYR) [42]. IEYR integrates emission loss into the traditional indicator, which can reflect the competition ability or economic benefits of a resource. Low values of IEYR denote weak competition ability and low economic benefits when a resource is developed. This modified indicator can be computed using Equation (10):
I E Y R = R 1 + F 1 R + N 1 + F 1 N + F L + F S F 2 F 1 N + F L + F S .
According to Ulgiati and Brown [32], when emergy yield ratio (IEYR) < 5, it denotes primary materials, such as cement and steel, and secondary energy resources. Primary energy resources usually have an EYR > 5, and processes with an emergy yield ratio of less than 2 do not contribute as energy sources and are associated with consumables or manufacturing processes.
(3). Improved environmental load rate (IELR) [41]. This indicator measures the environmental pressure caused by nonrenewable investments and emissions. Unlike traditional environmental load rate (ELR), the emergy loss of dilution emissions is included here. The improved indicator can be computed using Equation (11):
I E L R = N 1 + F 1 N + F L + F S + R 2 R 1 + F 1 R .
A larger indicator value means a higher environmental impact. Low values of ELR (nearly 2) indicate that this process has a large area to dilute the impact. When ELR > 10, there is a high environmental impact, and when 3 < ELR < 10, the impact is considered moderate. For extremely high values of ELR, the nonrenewable inputs or purchased inputs predominate, suggesting that local renewable input is not sufficient to supply process demands [40].
(4). Improved emergy sustainability index (IESI) [41]. The IESI reflects the economic benefits per unit of environmental impact. The traditional emergy sustainability index (ESI) is the ratio of EYR to ELR. The IESI should also be modified when considering environmental emission impacts, as shown in Equation (12):
I E S I = I E Y R I E L R .
IESI reflects the comprehensive environmental performance of the process. An EIS < 1 reflects an unsustainable process in the long term. When 1 < EIS < 5, there may offer a sustainable contribution to the economy for medium periods, and a process with EIS > 5 can be considered sustainable in the long term. However, a higher EIS does not necessarily indicate better sustainability because when EIS > 10, the system is underdeveloped [40].

3. Results and Discussion

3.1. Emergy Flows

Table 1 summarizes 1 t rare-earth oxide’s emergy flows in the mining and beneficiation stage and the smelting and separation stage are summarized. The total emergy input in the mining and beneficiation stage is 4.88 × 10¹⁵ seJ. Here, the purchased renewable resources contribute 0.12%, local non-renewable resources contribute 9.46%, and purchased non-renewable resources contribute 6.85%. The labor force and investment contribute 43.09% and 40.45%, respectively, which are the main sources of emergy input in the mining and selection stage. The input of non-renewable resources comes from the bastnaesite, chemical reagents, electricity, and fuel. Here, diesel oil constitutes the largest share of purchased non-renewable resources (90.85%).
The total emergy input in the smelting and separation stage is 4.5 × 10¹⁶ seJ, wherein non-renewable resources contribute the most (86.35% of the total). The local non-renewable resources are mainly bastnaesite rare-earth concentrates (10.84% of the total). Hydrochloric acid (54.63% of the purchased non-renewable resources) is the largest contributor to purchased non-renewable resources (75.51% of the total), followed by natural gas, sodium carbonate, thermal power generation, and oxalic acid. Labor and services contribute 9.11% and 2.64%, respectively, which is less than that of the mining and beneficiation stage.
The emergy input of the mining and beneficiation stage mainly comes from labor and investment, while the emergy input of the smelting and separation stage mainly comes from raw materials and auxiliary materials. This difference in input may be related to mining and beneficiation technology, for which fewer chemical auxiliary materials and other materials are needed. However, the construction of tailing ponds and dumping sites and environmental protection facilities for waste gas and wastewater treatment require large investments.

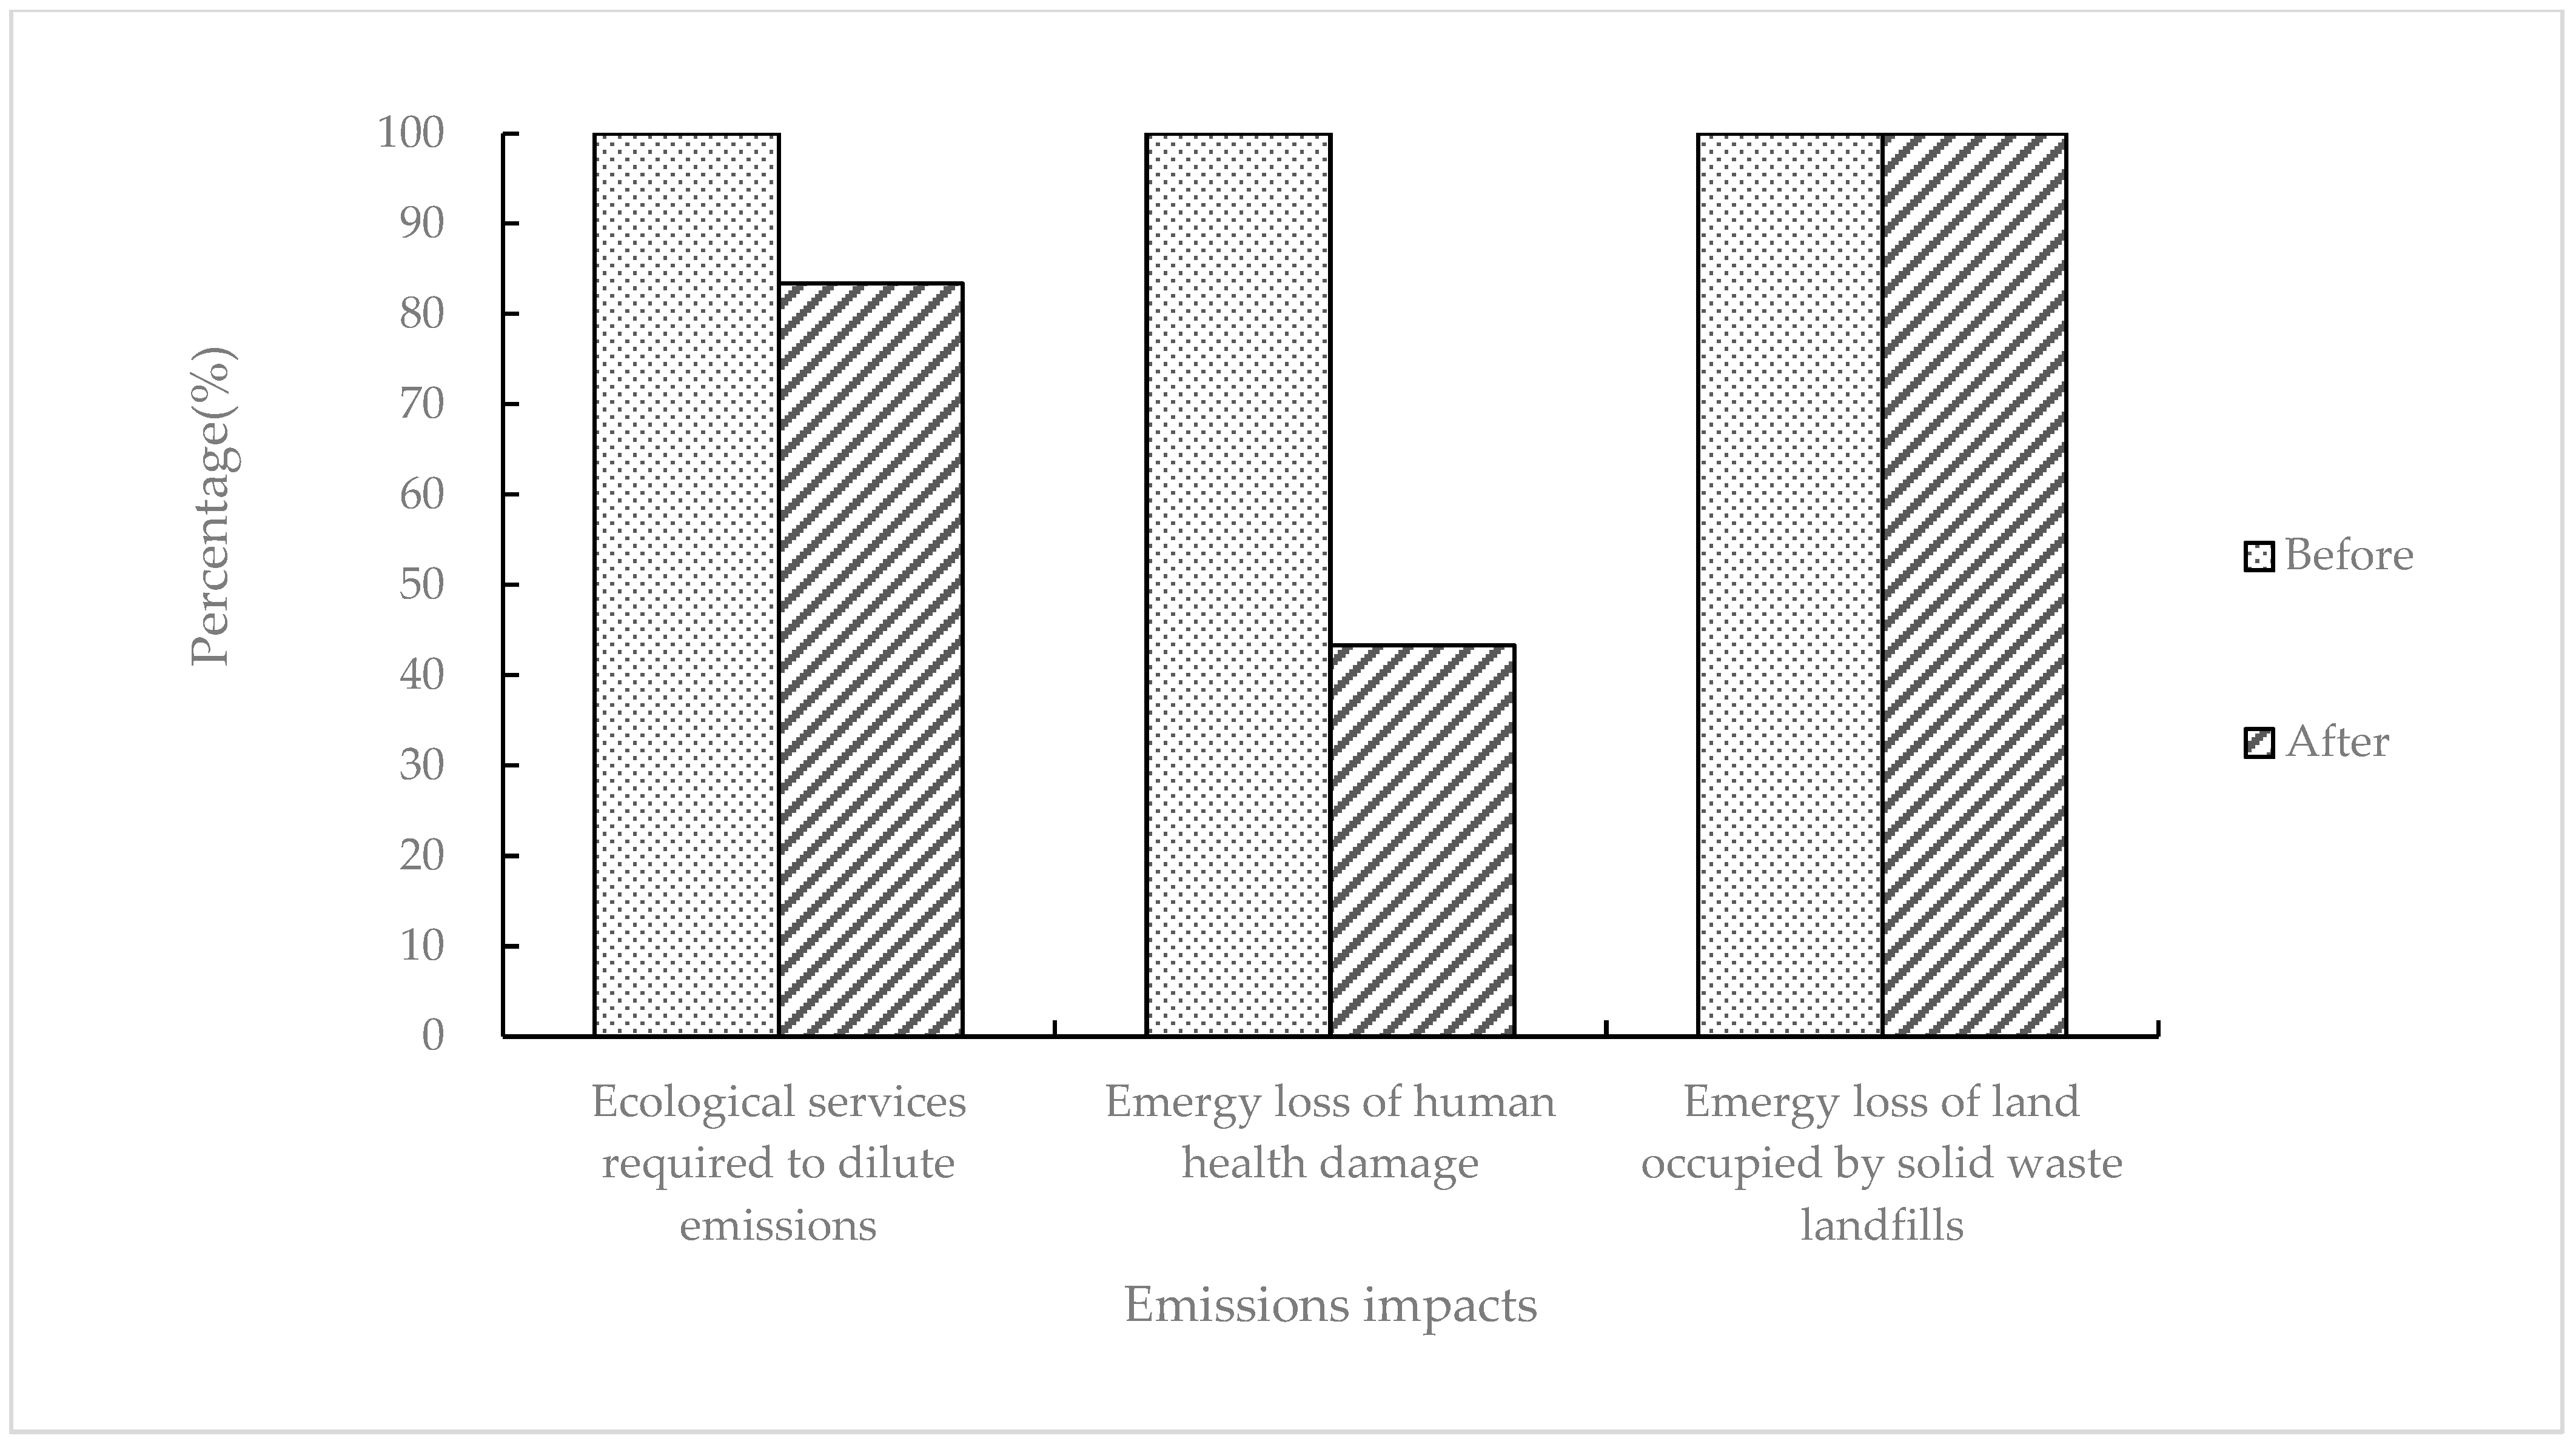
3.2. Emission Impacts

Emission impacts are calculated according to the methods shown in Section 2.2.3. The results are shown in Table 2 and Table 3. In the mining and beneficiation stage, 1 t rare-earth oxide’s emergy of emission impacts is 1.81 × 10¹² seJ, where the ecological services required to dilute emissions, the emergy loss of human health damage, and the emergy loss of land occupied by solid waste landfills are 2.49 × 10⁹ seJ, 1.68 × 10¹² seJ, and 1.34 × 10¹¹ seJ, respectively, accounting for 0.14%, 92.49%, and 7.37%. Here, the ecological services required to dilute emissions mainly come from particulate matter in exhaust gas. The emergy loss resulting from pollutant emissions mainly comes from damage to human health. The particulate matter in the exhaust gas also represent major pollutants that can cause human respiratory diseases.
In the smelting and separation stage, 1 t rare-earth oxide’s emergy of emission impacts with natural gas as fuel is 3.82 × 10¹⁴ seJ, where the ecological services required to dilute emissions and the emergy loss of human health damage are 3.06 × 10¹⁴ seJ and 7.61 × 10¹³ seJ, respectively, accounting for 80.11% and 19.89%, while the emergy loss of land occupation contributes less than 1%. The ecological services required to dilute emissions mainly come from ammonia–nitrogen in the wastewater, and the emergy loss resulting from pollutant emissions mainly comes from the impact of CO2 on climate change.

3.3. Emergy-Based Indicators

Table 4 gives the traditional and improved indicator values for the mining and beneficiation stage, smelting and separation stage, and the whole process. The EIR values of the mining and beneficiation stage and smelting and separation stage are 9.57 and 8.15, respectively, which are high and comparable. The EIR values indicate that the emergy of the additional purchased resources, except for local renewable and non-renewable resources, is relatively large, and the production system is strongly dependent on external input in these two stages. This factor may cause the price to rise, which will weaken the competitive ability of the product. The EIR value of the whole process is 8.27, which is slightly lower than that of the mining and beneficiation stage, which means that part of the high emergy input in the mining and beneficiation stage is offset by the smelting and separation stage.
The IEYR values of the two stages are 1.11 and 1.13, respectively. Normally, the IEIR value of primary raw materials and manufacturing industries is less than 2 [40]. The IEYR values indicate that both the production efficiency and the economic performance of the bastnaesite are low. This result indicates high dependence of the two stages on imported resources, rather than local resources. Londono et al. [48] calculated the EIR value of gold mining with a similar method. The result was 1.1–2.2, which is consistent with the results for bastnaesite mining. However, gold has high economic value around the world, while bastnaesite does not.
The IELR values of the two stages are 856.97 and 91.73, respectively. These values are extremely high, especially the value of the mining and beneficiation stage. However, both of the IESI values are less than 0.1, which is extremely low. Although the index values vary greatly during the two stages, they show similar problems: Both production stages exert high pressure on the environment and are unsustainable processes. The results also indicate that the production process used in this study features high-intensity emergy utilization and offers poor sustainable development performance. The emergy of labor and services is dominant in the mining and selection stage, and non-renewable resources are the main contributors of emergy in the smelting and separation stage, while renewable resources are not sufficient to satisfy the production process. In this study, bastnasite was found to be t the main source of emergy for non-renewable resources. If the IELR is extremely high for a long period of time and mineral resources are over-exploited, it will result in the depletion of natural resources, ecological environmental damage, and the aggravation of environmental pollution. These problems will lead to irreversible ecological degradation, which will contravene the circular economy and sustainable development. Therefore, it is urgent to introduce more advanced pollution control facilities and more efficient production technologies to improve the current production situation.

3.4. Improvement of Environmental Performance

This section illustrates the actual effect of the bastnasite production process by comparing the environmental performance of emissions before and after the improvement of wastewater control facilities and changes to the fuel. The results are shown in Table 5 and Figure 2.
The results show that improving wastewater treatment in the mining and beneficiation stage can effectively reduce the water pollutant emissions and the dilution effect of the environment. Before improvement, the total impact value for the emissions of 1 t rare-earth oxides during the mining and selection stage is 7.26 × 10¹³ seJ, and the most important source is the ecological services required to dilute emissions (84.02%). After the improvement, the total impact value is 1.81 × 10¹² seJ, which decreased by 97.50%, and the most important source become the emergy loss from human health damage (92.49%). Therefore, this change can significantly improve the environmental performance of bastnaesite production in the mining and beneficiation stage.
Before the improvements to the smelting and separation stage, the total impact value of the emissions with coal-to-gas as fuel is 4.75 × 10¹⁴ seJ, for which the ecological services required to dilute emissions and the emergy loss of human health damage are found to be 3.06 × 10¹⁴ seJ and 1.68 × 10¹⁴ seJ, respectively, accounting for 64.56% and 35.44%, while the emergy loss of land occupation contributes less than 1%. Ecological services mainly come from SO2 emissions in the atmosphere and ammonia–nitrogen emissions in the water, and human health damage is mainly caused by the impact of CO2 emissions on climate change. Table 6 describes the changes in air pollutants and emergy from coal-to-gas to natural gas. It can be seen from Figure 2 that, for the improved process using natural gas as a fuel, the air pollutant emissions of SO2, particulate matter, NOx, and CO2 are greatly reduced by 90.92%, 69.85%, 74.50%, and 45.34%, respectively, and the emergy is 19.43% lower than that before improvement. Therefore, changing the fuel from coal-to-gas to natural gas improved the atmospheric environment. In general, natural gas is more environmentally friendly and is one of the recommended fuels.
Figure 2 presents a comparison of the impact of pollutant emissions before and after the improvement of the whole process. The emergy of pollutant emissions before the improvement is 100%. After the improvement, the total emergy of pollution emissions is reduced by 29.79%, and the emergy of ecological services and human health damage decrease by 16.63% and 56.72%, respectively. Comparing the two production stages, we find that the emissions impacts of the smelting and separation stage are greater than those of the mining and beneficiation stage, but the emergy loss of land occupation in the smelting and separation stage is lower than that of the mining and beneficiation stage. This result is because a simpler production process and input from fewer raw materials produce fewer types and quantities of pollutants in the mining and beneficiation stage. In addition, effective disposal of air and water pollutants in the mining and beneficiation stage can reduce the emergy loss resulting from pollutant emissions. However, the tailing pond in the mining and beneficiation site occupied a significant amount of land, so the emergy loss of occupied land is greater than that in the smelting and separation stage.
In general, the dependence of the production process on external input should be reduced to further promote the sustainable development of rare-earth oxide production. In the mining and beneficiation stage, labor force and services were taken as the main emergy input, so the mechanization and informatization of the production process represent a future research direction. In the smelting and separation stage, it is necessary to improve resource utilization efficiency and adopt more advanced pollution control facilities to reduce pollutant emissions. Although the emergy resulting from the land occupied by solid waste is not the main emergy source here, the recycling of rare-earth and other valuable resources in solid waste represents a key research direction in the future. The recycling of solid waste, moreover, has twofold benefits. On the one hand, this type of recycling can increase the supply of resources; on the other hand, it can reduce the ecological and environmental impacts caused by the land occupation of solid waste.

4. Conclusions

In this study, we calculated the emergy of the production process of bastnaesite in Sichuan, China, using the method of EM-LCA, and we analyzed the composition and main sources of emergy loss in the production process and evaluated the environmental impacts and sustainability. The results show that the total emergy input of 1 t rare-earth oxide in the mining and beneficiation stage is 4.88 × 10¹⁵ seJ and that L&S are the main sources of emergy input in this stage. The total emergy input in the smelting and separation stage is 4.5 × 10¹⁶ seJ. This stage mainly relies on non-renewable resources. In the mining and beneficiation stage, the emergy of 1 t rare-earth oxides’ emission impacts is 1.81 × 10¹² seJ. The main emission impact in this stage comes from particulate matter in the exhaust gas. The emergy of 1 t rare-earth oxides’ emission impacts with natural gas as fuel is 3.82 × 10¹⁴ seJ, and the main emission impact in this stage comes from ammonia–nitrogen in wastewater and CO2 in exhaust gas, respectively. The two stages have high EIR values (9.57 and 8.15, respectively) and low IETR values (1.11 and 1.13 respectively), which indicates that the production process is highly dependent on external input, with low efficiency and weak competitiveness. The IELR values are extremely high (856.97 and 91.73 respectively), and the IESI values are extremely low (less than 0.1), in the two stages, indicating that the production process has a great impact on the environment; thus, this is clearly an unsustainable process in the long term. In the mining and beneficiation stage, no wastewater is discharged after improving the wastewater treatment facilities. In the smelting and separation stage, after changing the fuel from coal-to-gas to natural gas, the air pollutant emissions of SO2, particulate matter, NOx, and CO2 are greatly reduced (by 90.92%, 69.85%, 74.50%, and 45.34%, respectively). Accordingly, the emergy of pollutant emissions is 19.43% lower than that before the improvement. These changes show that the environmental benefits of these improvement measures are remarkable. These research results provide a useful theoretical basis for improving the production process of bastnaesite in Sichuan, China. At the same time, the calculation results in this paper enrich the emergy analysis literature, encourage a performance evaluation of the rare earth industry, and contribute to the application of emergy analysis methods in industrial production systems.

Author Contributions

Conceptualization, J.A. and H.Y.; methodology, J.A. and A.T. (Aitian Tao); validation, H.Y.; formal analysis, A.T. (Aitian Tao); investigation, A.T. (Aitian Tao) and A.T. (Ang Tian); data curation, A.T. (Ang Tian); writing—original draft preparation, A.T. (Aitian Tao); writing—review and editing, J.A.; visualization, A.T. (Aitian Tao); funding acquisition, J.A. All authors have read and agreed to the published version of the manuscript.

Funding

This work is supported by the National Key R&D Program of China (No. 2020YFC1909101).

Institutional Review Board Statement

Not applicable.

Informed Consent Statement

Not applicable.

Data Availability Statement

The data that support the findings of this study are available from the corresponding author on reasonable request.

Acknowledgments

The authors are grateful to Fenghua Li for modifying the grammar and writing of this paper.

Conflicts of Interest

The authors declare no conflict of interest.

Abbreviations

AbbreviationsMeaning
EM-LCAEmergy-life-cycle assessment
LCALife-cycle assessment
REEsRare-earth elements
LREEsLight rare-earth elements
HREEsHeavy rare-earth elements
F1RPurchased renewable resources
N1Local non-renewable resources
F1NPurchased non-renewable resources
FLLabor force
FSService
L&SLabor force and service
YProduct
WWaste discharge
R2Local extra ecological service used to dilute emission
L2Human health damage and additional damage caused by land occupation for solid waste
UEVUnit emergy value
EIREmergy investment ratio
IEYRImproved emergy yield ratio
EYREmergy yield ratio
IELRImproved environmental load rate
ELREnvironmental load rate
IESIImproved emergy sustainability index
ESIEmergy sustainability index

References

  1. U.S. Geological Survey. Mineral Commodity Summaries 2020. Available online: https://pubs.usgs.gov/periodicals/mcs2020/mcs2020.pdf (accessed on 23 October 2021).
  2. Yi, M. The Ministry of Environmental Protection officially issued the “Emission Standards for Pollutants from Rare Earth Industry”. J. Environ. Manag. 2011, 2, 55. [Google Scholar]
  3. Bailey, G.; Joyce, P.J.; Schrijvers, D.; Schulze, R.; Acker, K.V. Review and new life cycle assessment for rare earth production from bastnsite, ion adsorption clays and lateritic monazite. Resour. Conserv. Recycl. 2020, 155, 104675. [Google Scholar] [CrossRef]
  4. Yu, Y.; Wang, D.H.; Tian, Z.X.; Huang, F.; Zhao, Z.; Sun, Y.; Lin, D.X.; He, H.H.; Deng, M.C. The SMIMA Method System, Evaluation Model and Application of Environmental Investigation of Rare Earth Mining Areas—Taking the Ion Adsorption Type Rare Earth Mines in Southern Jiangxi as an Example. Acta Geosci. Sinica 2017, 38, 335–344. [Google Scholar]
  5. Geng, J.; Hao, H.; Sun, X.; Xun, D.; Liu, Z.; Zhao, F. Static material flow analysis of neodymium in China. J. Ind. Ecol. 2020, 25, 114–124. [Google Scholar] [CrossRef]
  6. Yao, D.W.; Cheng, L.; Wang, Y.; Lin, T.C. Mine geological environment assessment method based on BP neural network and GIS. Min. Technol. 2016, 16, 56–79. [Google Scholar]
  7. Huang, H.Y.; Wei, J.P.; Wang, H.N.; Zhang, Y.B. Ecological Life Cycle Assessment of Ionic Rare Earths (Eco-LCA). Chin. Rare Earths 2021, 42, 73–83. [Google Scholar]
  8. Odum, H.T. Self-Organization, Transformity, and Information. Science 1988, 242, 1132–1139. [Google Scholar] [CrossRef] [Green Version]
  9. Odum, H.T. Environmental Accounting: Emergy and Environmental Decision Making; John Wiley: New York, NY, USA, 1996; p. 370. [Google Scholar]
  10. Song, F.; Su, F.; Mi, C.; Sun, D. Analysis of driving forces on wetland ecosystem services value change: A case in Northeast China. Sci. Total Environ. 2021, 751, 141778. [Google Scholar] [CrossRef] [PubMed]
  11. Abel, T. Human transformities in a global hierarchy: Emergy and scale in the production of people and culture. Ecol. Model. 2010, 221, 2112–2117. [Google Scholar] [CrossRef]
  12. Kamp, A.; Morandi, F.; Ostergard, H. Development of concepts for human labour accounting in emergy assessment and other environmental sustainability assessment methods. Ecol. Indic. 2016, 60, 884–892. [Google Scholar] [CrossRef]
  13. Odum, H.T.; Diamond, C.; Brown, M.T. Emergy analysis and public policy in texas, Policy research project report. Ecol. Econ. 1987, 12, 54–65. [Google Scholar]
  14. Wang, X.L.; Li, Z.J.; Long, P.; Yan, L.L.; Gao, W.S.; Chen, Y.Q.; Sui, P. Sustainability evaluation of recycling in agricultural systems by emergy accounting. Resour. Conserv. Recycl. 2017, 117, 114–124. [Google Scholar] [CrossRef]
  15. Dang, X.H.; Liu, G.B. Emergy measures of carrying capacity and sustainability of a target region for an ecological restoration programme: A case study in Loess Hilly Region, China. J. Environ. Manage. 2012, 102, 55–64. [Google Scholar] [CrossRef] [PubMed]
  16. Lou, B.; Xu, Y.; Lin, Z.G. Emergy analysis of coal power production system and construction of new index system. Acta Ecol. Sin. 2011, 31, 7591–7600. [Google Scholar]
  17. Wang, L.M.; Ni, W.D.; Li, Z. Emergy evaluation of combined heat and power plant eco-industrial park (CHP plant EIP). Resour. Conserv. Recycl. 2006, 48, 56–70. [Google Scholar] [CrossRef]
  18. Fadare, D.A.; Bamiro, O.A.; Oni, A.O. Energy and cost analysis of organic fertilizer production in Nigeria. Energy 2010, 35, 332–340. [Google Scholar] [CrossRef]
  19. Zhang, X.H.; Jiang, W.J.; Deng, S.H.; Peng, K. Emergy evaluation of the sustainability of Chinese steel production during 1998–2004. J. Clean. Prod. 2009, 17, 1030–1038. [Google Scholar] [CrossRef]
  20. Zhang, W.B.; Lin, Z.H.; Dong, S.C.; Qian, P.; Ye, S.F.; Wang, C.Y. Evaluation of Ecological Benefits of Multi-metal Recycling of Copper-based Mixed Waste Based on Emergy Analysis. Environ. Dev. Sustain. 2020, 5, 53–59. [Google Scholar]
  21. Pan, H.Y. Study on the Sustainability of an Industrial Park in Sichuan Based on Emergy; Sichuan Agricultural University: Sichuan, China, 2016. [Google Scholar]
  22. Huang, X.X.; Wang, R. Research on the Dynamic Changes of Industrial Eco-efficiency of Mining Cities Based on Emergy Analysis—Taking Jiangxi as an Example. Nonferrous Met. Sci. Eng. 2020, 11, 90–98. [Google Scholar]
  23. Zhang, X.H.; Xiang, N.; Pan, H.Y.; Yang, X.D.; Wu, J.; Zhang, Y.Z.; Luo, H.B.; Xu, C.L. Performance comparison of cement production before and after implementing heat recovery power generation based on emergy analysis and economic evaluation: A case from China. J. Clean. Prod. 2021, 290, 125901. [Google Scholar] [CrossRef]
  24. Li, H.; Yao, X.L.; Tachega, M.A.; Ahmed, D.; Ismaail, M.G.A. Technology selection for hydrogen production in China by integrating emergy into life cycle sustainability assessment. J. Clean. Prod. 2021, 294, 126303. [Google Scholar] [CrossRef]
  25. Yazdani, S.; Salimipour, E.; Moghaddam, M.S. A comparison between a natural gas power plant and a municipal solid waste incineration power plant based on an emergy analysis. J. Clean. Prod. 2020, 274, 123158. [Google Scholar] [CrossRef]
  26. Babaelahi, M.; Rafat, E. Recovering waste heat of a solar hybrid power plant using a Kalina cycle and desalination unit: A sustainability (emergo-economic and emergo-environmenal) approach. Energy Convers. Manag. 2020, 224, 113394. [Google Scholar]
  27. Santagata, R.; Zucaro, A.; Fiorentino, G.; Lucagnano, E.; Ulgiati, S. Developing a procedure for the integration of Life Cycle Assessment and Emergy Accounting approaches. The Amalfi paper case study. Ecol. Indic. 2020, 117, 106676. [Google Scholar] [CrossRef]
  28. De Souza, H.R.A.; Dantas, T.E.T.; Zanghelini, G.M.; Edivan Cherubini, E.; Soares, S.R. Measuring the environmental performance of a circular system: Emergy and LCA approach on a recycle polystyrene system. Sci. Total Environ. 2020, 726, 138111. [Google Scholar] [CrossRef] [PubMed]
  29. Liu, W.J. An Emergy Analysis Based Study on Accounting Rare Earth Product’s Life Cycle Value; Institute of Applied Ecology, University of Chinese Academy of Sciences: Liaoning, China, 2016. [Google Scholar]
  30. Shen, J.M.; Zhang, X.H.; Lv, Y.F.; Yang, X.D.; Wu, J.; Lin, L.L. An improved emergy evaluation of the environmental sustainability of China’s steel production from 2005 to 2015. Ecol. Indic. 2019, 103, 55–69. [Google Scholar] [CrossRef]
  31. Brown, M.T.; Ulgiati, S. Assessing the global environmental sources driving the geobiosphere: A revised emergy baseline. Ecol. Model. 2016, 339, 126–132. [Google Scholar] [CrossRef] [Green Version]
  32. Ulgiati, S.; Brown, M.T. Quantifying the environmental support for dilution and abatement of process emissions: The case of electricity production. J. Clean. Prod. 2002, 10, 335–348. [Google Scholar] [CrossRef]
  33. Zhang, C.Y.; Cai, H.K.; Liu, J.; Pan, Z.H. Spatio-Temporal Characteristics Analysis of Wind Energy Resources in Sichuan Province. Open J. Nat. Sci. 2020, 8, 587–602. [Google Scholar] [CrossRef]
  34. Liu, G.Y.; Yang, Z.F. Emergy Analysis Theory and Practice: Ecological Economic Accounting and Urban Green Management; China Science Press: Beijing, China, 2018. [Google Scholar]
  35. World Health Organization (WHO). Metrics: Disability-Adjusted Life Year (DALY). 2015. Available online: http://www.who.int/healthinfo/global_burden_disease/metrics_daly/en/ (accessed on 23 October 2021).
  36. Campbell, D.E.; Lu, H.F.; Walker, H.A. Relationships among the Energy, Emergy, and Money Flows of the United States from 1900 to 2011. Front. Energy Res. 2014, 2, 1–31. [Google Scholar] [CrossRef] [Green Version]
  37. Reza, B.; Sadiq, R.; Hewage, K. Emergy-based life cycle assessment (Em-LCA) of multi-unit and single-family residential buildings in Canada. Int. J. Sustain. Built Environ. 2014, 3, 207–224. [Google Scholar] [CrossRef] [Green Version]
  38. Odum, H.T. Handbook of Emergy Evaluation: Folio #2 Emergy of Global Processes; University of Florida: Gainesville, FL, USA, 2000; pp. 17–18. [Google Scholar]
  39. Wang, J.N.; Yu, F.; Cao, D. Study report 2004 for green national economic accounting. China population. Resour. Environ. 2006, 16, 11–17. [Google Scholar]
  40. Cao, K.; Feng, X. Distribution of Emergy Indices and Its Application. Energy Fuels 2007, 21, 1717–1723. [Google Scholar] [CrossRef]
  41. Pan, H.Y.; Zhang, X.H.; Wang, Y.Q.; Qi, Y.; Wu, J.; Lin, L.L.; Peng, H.; Hui, Q.; Yu, X.Y.; Zhang, Y.Z. Emergy evaluation of an industrial park in Sichuan Province, China: A modified emergy approach and its application. J. Clean. Prod. 2016, 135, 105–118. [Google Scholar] [CrossRef]
  42. Zhang, X.H. An emergy evaluation of the sewage sludge treatment system with earthworm compositing technology in Chengdu, China. Ecol. Eng. 2018, 110, 8–17. [Google Scholar] [CrossRef]
  43. Lan, S.F.; Qin, P.; Lu, H.F. Emergy Analysis of Ecological Economic System; Chemical Industry Press: Beijing, China, 2002; p. 328. [Google Scholar]
  44. Yang, J.; Chen, B. Emergy-based sustainability evaluation of wind power generation systems. Appl. Energy 2016, 177, 239–246. [Google Scholar] [CrossRef]
  45. Lou, B.; Ulgiati, S. Identifying the environmental support and constraints to the Chinese economic growth—An application of the Emergy Accounting method. Energy Policy 2013, 55, 217–233. [Google Scholar] [CrossRef]
  46. Zhang, X.H.; Deng, S.H.; Zhang, Y.Z.; Yang, G.; Li, L.; Qi, H.; Xiao, H.; Wu, J.; Wang, Y.J.; Shen, F. Emergy evaluation of the impact of waste exchanges on the sustainability of industrial systems. Ecol. Eng. 2011, 37, 206–216. [Google Scholar] [CrossRef]
  47. Zhang, X.H.; Deng, S.H.; Wu, J.; Jiang, W.J. A sustainability analysis of a municipal sewage treatment ecosystem based on emergy. Ecol. Eng. 2010, 36, 685–696. [Google Scholar] [CrossRef]
  48. Londono, N.C.; Velasquez, H.I.; Mclntyre, N. Comparing the environmental sustainability of two gold production methods using integrated Emergy and Life Cycle Assessment. Ecol. Indic. 2019, 107, 105. [Google Scholar]
Figure 1. The emergy flow of rare-earth oxide production with bastnaesite.
Sustainability 13 13205 g001
Figure 2. Comparison of the impact of pollutant emissions before and after the improvement of the whole process.
Sustainability 13 13205 g002
Table 1. Emergy evaluation table of 1 t rare-earth oxide’s emergy flow in the mining and beneficiation stage and the smelting and separation stage (based on the baseline 12.0 × 1024 seJ/y).
The Mining and Beneficiation Stage
ItemAmountUnitSolar
Transformity (seJ/unit)
ReferencesSolar Emergy (seJ)Emergy Fraction
N1 9.46%
1. Bastnaesite2.38 × 107g1.94 × 107This study4.61 × 1014
F1R 5.69 × 10120.12%
1. Hydropower3.13 × 107J1.02 × 105[43]3.18 × 10¹²
2. Nuclear power generation7.48 × 106J2.92 × 105[9]2.19 × 10¹²
3. Wind power9.30 × 106J3.40 × 104[44]3.16 × 10¹¹
F1N 3.34 × 10146.85%
1. Diesel3.62 × 109J8.39 × 104[9]3.04 × 10¹⁴
2. Sodium silicate2.14 × 101g3.32 × 109[42]7.11 × 10¹⁰
3. Sodium hydroxide2.38g5.11 × 109[40]1.22 × 10¹⁰
4. Other chemical reagents2.78 × 101g4.47 × 109[45] 1.25 × 10¹¹
5. Sulfuric acid3.62 × 103g1.12 × 109[46]4.06 × 10¹²
6. Thermal power generation1.29 × 108J2.03 × 105[43]2.63 × 10¹³
FL 2.10 × 101543.09%
1. Stope labor7.83 × 10−3person5.72 × 1013[34]8.96 × 10¹⁴
2. Field selection labor1.07 × 10−2person5.72 × 1013[34]1.21 × 10¹⁵
FS 40.45%
1. investment2.47 × 103CNY7.99 × 1011This study1.97 × 1015
Y
1. Bastnaesite rare earth concentrate1.41 × 106g3.45 × 109 4.88 × 10¹⁵
The Smelting and Separation Stage
ItemAmountUnitSolar Transformity (seJ/unit)ReferencesSolar Emergy (seJ)Emergy Fraction
N1 10.84%
1. Bastnaesite rare earth concentrate1.41 × 106g3.45 × 109This study4.88 × 1015
F1R 4.85 × 10141.08%
1.Water3.18 × 107g8.44 × 105[30]2.69 × 10¹³
2. Hydropower2.52 × 109J1.02 × 105[43]2.56 × 10¹⁴
3. Nuclear power generation6.02 × 108J2.92 × 105[9]1.76 × 10¹⁴
4. Wind power7.49 × 108J3.40 × 104[44]2.55 × 10¹³
F1N 3.40 × 101675.49%
1. Hydrochloric acid (31%)5.51 × 10⁶g3.37 × 109[47]1.86 × 10¹⁶
2. Caustic soda (96%)2.12 × 10⁵g5.11 × 109[40]1.08 × 10¹⁵
3. Calcium carbonate1.06 × 106g1.27 × 109[43]1.35 × 10¹⁵
4. Oxalic acid4.51 × 105g4.47 × 109[45]2.01 × 10¹⁵
5. Sodium carbonate7.77 × 105g4.47 × 109[45]3.48 × 10¹⁵
6.P5073.89 × 103g4.47 × 109[45]1.74 × 10¹³
7. Kerosene7.95 × 103g4.47 × 109[45]3.56 × 10¹³
8. Sodium sulfide1.36 × 103g4.47 × 109[45]6.08 × 10¹²
9. Sulfuric acid (98%)1.33 × 10³g1.12 × 109[45]1.49 × 10¹²
10. Zinc8.83 × 102g4.47 × 109[45]3.95 × 10¹²
11. Lime8.83 × 104g9.75 × 108[43]8.61 × 10¹³
12. Natural gas8.56 × 1010J6.10 × 104[17]5.23 × 10¹⁵
13. Thermal power generation1.04 × 1010J2.03 × 105[43]2.12 × 10¹⁵
FL 4.10 × 10159.11%
1. Managers5.30 × 10−3person2.5 × 1013[34]3.18 × 10¹⁴
2. Technical and sales staff1.77 × 10−3person3.38 × 1013[34]1.43 × 10¹⁴
3. Production and support staff2.65 × 10−2person5.72 × 1013[34]3.64 × 10¹⁵
FS 2.64%
1. investment1.49 × 103CNY7.99 × 1011This study1.19 × 1015
Y
1. Rare earth oxides1.00 × 106g 4.50 × 10¹⁶ a
a Date Y is the sum of the Input ( N 1 + F 1 N + F 1 R + F L + F S ) and Emission impacts ( R 2 + L 2 ).
Table 2. Ecological service evaluation table of 1 t rare-earth oxide’s emergy flow in the mining and beneficiation stage and smelting and separation stage.
The Mining and Beneficiation Stage
Pollutant’s NameAmount of Emissions (kg)Acceptable Concentration (kg/m3) aR2 (seJ)
AirParticulate matter8.67 × 10−24 × 10−82.49 × 109
Lead4.10 × 10−45 × 10−10
The Smelting and Separation Stage
Pollutant’s NameAmount of Emissions (kg)Acceptable Concentration (kg/m3) aR2 (seJ)
AirSO22.41 × 10−15 × 10−83.06 × 1014
Particulate matter2.88 × 10−14 × 10−8
NOX1.525 × 10−8
WaterCOD1.761.5 × 10−2
Ammonia-nitrogen1.78 × 10−11.5 × 10⁻⁴
Fluoride1.24 × 10−21 × 10−3
Chlorine7.352.5 × 10−1
Lead2.40 × 10−31 × 10−5
Oil7.07 × 10−35 × 10−5
a Data taken from the Ambient air quality standards (GB 3095-2012) and Environmental quality standards for surface water (GB 3838-2002).
Table 3. Emergy loss of human health damage and emergy loss of land occupied by solid waste landfills of 1 t rare-earth oxide’s emergy flow in the mining and beneficiation stage and smelting and separation stage.
The Mining and Beneficiation Stage
Pollutant’s NameAmount of Emissions (kg)Damage Category of Human HealthDALYi (DALY/kg) bL2 (seJ)
AirParticulate matter8.67 × 10−2Respiratory Disorders3.75 × 10−41.81 × 10¹²
Pollutant’s NameAmount of Emissions (kg)Land Area (m2)
Solid wasteMullock1.80 × 1029.13 × 10−1
Tailings2.24 × 1019.27 × 10−2
The Smelting and Separation Stage
Pollutant’s NameAmount of Emissions (kg)Damage Category of Human HealthDALYi (DALY/kg) bL2 (seJ)
AirSO22.41 × 10−1Respiratory Disorders5.46 × 10−57.61 × 10¹³
Particulate matter2.88 × 10−1Respiratory Disorders3.75 × 10−4
NOX1.52Respiratory Disorders8.87 × 10−5
CO25.81 × 103Climate change2.10 × 10−7
WaterCOD1.76Eutrophication——
Ammonia-nitrogen1.78 × 10−1Eutrophication——
Oil7.07 × 10−3Carcinogenic effect4.16 × 10−5
Pollutant’s NameAmount of Emissions (kg)Land Area (m2)
Solid wasteTailings1.02 × 10−14.23 × 10⁻⁴
b Data taken from the website of the WHO [35].
Table 4. Emergy indicator values for bastnaesite production.
Emergy IndicatorThe Mining and Beneficiation StageThe Smelting and Separation StageThe Whole Process
EIR9.578.158.27
IEYR1.111.131.13
IELR856.9791.73100.60
IESI0.001290.012370.01125
Table 5. Comparison of the impact of pollutant emissions before and after the improvement.
Item Ecological Services Required
to Dilute Emissions (seJ)
Emergy Loss of Human Health Damage (seJ)Emergy Loss of
Land Occupied by Solid Waste Landfills (seJ)
Total Impact Value (seJ)Change
(%)
The mining and beneficiation stageBefore6.10 × 10131.15 × 10131.34 × 10117.26 × 101397.50
After2.49 × 1091.68 × 10121.34 × 10111.81 × 1012
The smelting and separation stageBefore3.06 × 10141.68 × 10145.63 × 1074.75 × 101419.43
After3.06 × 10147.61 × 10135.63 × 1073.82 × 1014
Table 6. The changes of air pollutants and emergy from coal-to-gas to natural gas.
FuelPollutant’s NameAmount of Emissions (kg)Emergy (seJ)Percentage Reduction (%)
Natural gasSO21.36 × 1036.91 × 101190.92
Particulate matter1.63 × 1035.58 × 101269.85
NOX8.58 × 1036.97 × 101274.50
CO23.29 × 1076.29 × 101345.34
CoalSO21.50 × 1047.62 × 1012——
Particulate matter5.41 × 1031.85 × 1013——
NOX3.37 × 1042.73 × 1013——
CO26.01 × 1071.15 × 1014——
Publisher’s Note: MDPI stays neutral with regard to jurisdictional claims in published maps and institutional affiliations.

